appendix n linsig output - torbay
TRANSCRIPT

Appendix N
LinSig Output

Full Input Data And ResultsFull Input Data And Results
User and Project DetailsProject: Inglewood
Title: Long Road Existing Junction
Location: Torbay
File name: Long Road Junction.lsg3x
Author: FF
Company: Key Transport Consultants
Address: 26 Berkeley Square, Bristol, BS8 1HP
Notes:
Network Layout Diagram
Long Road Junction
Arm
1-A
3022
Brix
ham
Roa
d(n
orth
)
1234
1/1
1/2
1/3
1/4
Arm2
-A3022
BrixhamR
oad(south )
1 2 3 4
2/12/22/32/4
Arm 3 - Goodrington Road
12
3/13/2
Arm 4 - Long Road
123
4/14/24/3
Arm
5-
1 25/15/2
Arm
6-
126/
16/
2
Arm 7 -
17/1Arm 8 -
12
8/18/2
A
B
C
D

Full Input Data And Results
Phase Diagram
A
B
C
D
E
F
G
H I J
K
L
M
N
O

Full Input Data And Results
Phase Input DataPhase Name Phase Type Assoc. Phase Street Min Cont Min
A Traffic 7 6
B Traffic 7 7
C Traffic 7 6
D Traffic 7 7
E Traffic 7 7
F Traffic 7 7
G Traffic 7 4
H Pedestrian 7 3
I Pedestrian 7 7
J Pedestrian 7 7
K Pedestrian 7 7
L Pedestrian 7 7
M Pedestrian 7 7
N Pedestrian 7 6
O Pedestrian 7 6

Full Input Data And Results
Phase Intergreens MatrixStarting Phase
TerminatingPhase
A B C D E F G H I J K L M N O
A - - - 6 8 - 5 - - 5 9 - - - -
B - - 5 - 7 8 7 9 - - - - 8 - -
C - 6 - - 6 - 5 - 5 - - - 9 - -
D 6 - - - 6 - 6 - - - 8 - - - -
E 8 8 7 7 - 12 7 12 - - - 6 11 - -
F - 8 - - 12 - - - - - - - - - 5
G 5 7 5 6 8 - - - - - 10 - - 5 -
H - 8 - - 8 - - - - - - - - - -
I - - 8 - - - - - - - - - - - -
J 8 - - - - - - - - - - - - - -
K 8 - - 8 - - 8 - - - - - - - -
L - - - - 9 - - - - - - - - - -
M - 10 10 - 10 - - - - - - - - - -
N - - - - - - 5 - - - - - - - -
O - - - - - 7 - - - - - - - - -
Phases in StageStage No. Phases in Stage
1 A B I L N O
2 C D F H J L N
3 F G H I J L M
4 E I J K N O
Stage DiagramA
B
C
D
E
F
G
H I J
K
LM
N
O
1 Min >= 7 A
B
C
D
E
F
G
H I J
K
LM
N
O
2 Min >= 2 A
B
C
D
E
F
G
H I J
K
LM
N
O
3 Min >= 4 A
B
C
D
E
F
G
H I J
K
LM
N
O
4 Min >= 7

Full Input Data And Results
Phase DelaysTerm. Stage Start Stage Phase Type Value Cont value
1 2 A Losing 8 8
1 2 B Losing 3 3
1 2 O Losing 4 4
1 3 A Losing 8 8
1 3 N Losing 8 8
1 3 O Losing 1 1
1 4 A Losing 1 1
1 4 B Losing 2 2
2 1 C Losing 8 8
2 1 D Losing 2 2
2 1 F Losing 6 6
2 1 H Losing 6 6
2 3 C Losing 1 1
2 3 N Losing 1 1
2 4 C Losing 6 6
2 4 D Losing 6 6
2 4 H Losing 4 4
2 4 L Losing 3 3
3 1 F Losing 8 8
3 1 G Losing 3 3
3 1 H Losing 8 8
3 1 M Losing 6 6
3 2 G Losing 5 5
3 2 I Losing 2 2
3 4 G Losing 4 4
3 4 H Losing 4 4
3 4 L Losing 3 3
3 4 M Losing 2 2
4 2 E Losing 1 1
4 2 O Losing 6 6
4 3 E Losing 1 1
4 3 N Losing 3 3
4 3 O Losing 6 6

Full Input Data And Results
Prohibited Stage ChangeTo Stage
FromStage
1 2 3 4
1 14 13 10
2 14 10 14
3 16 11 14
4 8 13 13

Full Input Data And ResultsGive-Way Lane Input DataJunction: Long Road Junction
There are no Opposed Lanes in this Junction

Full Input Data And ResultsLane Input DataJunction: Long Road Junction
Lane LaneType Phases Start
Disp.EndDisp.
PhysicalLength(PCU)
SatFlowType
Def UserSaturation
Flow(PCU/Hr)
LaneWidth
(m)Gradient Nearside
Lane TurnsTurningRadius
(m)
1/1(A3022 Brixham
Road (north))U A 2 3 60.0 Geom - 3.20 0.00 Y
Arm 6Ahead Inf
Arm 7Left 16.00
1/2(A3022 Brixham
Road (north))U A 2 3 60.0 Geom - 3.20 0.00 N Arm 6
Ahead Inf
1/3(A3022 Brixham
Road (north))U C 2 3 11.0 Geom - 3.05 0.00 Y Arm 8
Right 11.80
1/4(A3022 Brixham
Road (north))U C 2 3 11.0 Geom - 3.05 0.00 N Arm 8
Right 9.20
2/1(A3022 BrixhamRoad (south))
U B 2 3 8.0 Geom - 3.10 0.00 Y Arm 8Left 9.20
2/2(A3022 BrixhamRoad (south))
U B 2 3 60.0 Geom - 3.10 0.00 Y Arm 5Ahead Inf
2/3(A3022 BrixhamRoad (south))
U B 2 3 60.0 Geom - 3.30 0.00 N Arm 5Ahead Inf
2/4(A3022 BrixhamRoad (south))
U D 2 3 6.0 Geom - 3.50 0.00 Y Arm 7Right 10.80
3/1(Goodrington
Road)U E 2 3 2.0 Geom - 3.35 0.00 Y Arm 6
Left 7.60
3/2(Goodrington
Road)U E 2 3 60.0 Geom - 3.35 0.00 Y
Arm 5Right 25.60
Arm 8Ahead Inf
4/1(Long Road) U F 2 3 13.5 Geom - 3.00 0.00 Y Arm 5
Left 18.70
4/2(Long Road) U F 2 3 13.5 Geom - 3.00 0.00 N Arm 5
Left 23.40
4/3(Long Road) U G 2 3 60.0 Geom - 3.50 0.00 Y
Arm 6Right 20.20
Arm 7Ahead Inf
5/1 U 2 3 60.0 Inf - - - - - -
5/2 U 2 3 60.0 Inf - - - - - -
6/1 U 2 3 60.0 Inf - - - - - -
6/2 U 2 3 60.0 Inf - - - - - -
7/1 U 2 3 60.0 Inf - - - - - -
8/1 U 2 3 60.0 Inf - - - - - -
8/2 U 2 3 60.0 Inf - - - - - -

Full Input Data And Results
Traffic Flow GroupsFlow Group Start Time End Time Duration Formula
1: '2017 Base AM' 08:00 09:00 01:00
2: '2017 Base PM' 17:00 18:00 01:00
33: 'TA 2024 + Dev AM' 08:00 09:00 01:00 F31+F3
34: 'TA 2024 + Dev PM' 17:00 18:00 01:00 F32+F4
31: 'TA 2024 AM' 08:00 09:00 01:00 F1+F11
32: 'TA 2024 PM' 17:00 18:00 01:00 F2+F12
35: 'TA 2019 AM' 08:00 09:00 01:00 F1+F13
36: 'TA 2019 PM' 17:00 18:00 01:00 F2+F14
Scenario 1: '2017 Base AM' (FG1: '2017 Base AM', Plan 1: 'Network Control Plan 1')Traffic Flows, DesiredDesired Flow :
Destination
Origin
A B C D Tot.
A 0 98 464 362 924
B 225 0 4 198 427
C 707 9 0 82 798
D 149 50 16 0 215
Tot. 1081 157 484 642 2364

Full Input Data And Results
Traffic Lane Flows
Lane Scenario 1:2017 Base AM
Junction: Long Road Junction
1/1 258
1/2 304
1/3 176
1/4 186
2/1(short) 82
2/2(with short)
404(In)322(Out)
2/3(with short)
394(In)385(Out)
2/4(short) 9
3/1(short) 4
3/2(with short)
427(In)423(Out)
4/1 64
4/2 85
4/3 66
5/1 540
5/2 541
6/1 244
6/2 240
7/1 157
8/1 321
8/2 321

Full Input Data And Results
Lane Saturation FlowsJunction: Long Road Junction
LaneLaneWidth
(m)Gradient Nearside
LaneAllowedTurns
TurningRadius
(m)Turning
Prop.Sat Flow(PCU/Hr)
Flared Sat Flow(PCU/Hr)
1/1(A3022 Brixham Road (north)) 3.20 0.00 Y
Arm 6 Ahead Inf 62.0 %1868 1868
Arm 7 Left 16.00 38.0 %
1/2(A3022 Brixham Road (north)) 3.20 0.00 N Arm 6 Ahead Inf 100.0 % 2075 2075
1/3(A3022 Brixham Road (north)) 3.05 0.00 Y Arm 8 Right 11.80 100.0 % 1703 1703
1/4(A3022 Brixham Road (north)) 3.05 0.00 N Arm 8 Right 9.20 100.0 % 1771 1771
2/1(A3022 Brixham Road (south)) 3.10 0.00 Y Arm 8 Left 9.20 100.0 % 1655 1655
2/2(A3022 Brixham Road (south)) 3.10 0.00 Y Arm 5 Ahead Inf 100.0 % 1925 1925
2/3(A3022 Brixham Road (south)) 3.30 0.00 N Arm 5 Ahead Inf 100.0 % 2085 2085
2/4(A3022 Brixham Road (south)) 3.50 0.00 Y Arm 7 Right 10.80 100.0 % 1725 1725
3/1(Goodrington Road) 3.35 0.00 Y Arm 6 Left 7.60 100.0 % 1629 1629
3/2(Goodrington Road) 3.35 0.00 Y
Arm 5 Right 25.60 53.2 %1891 1891
Arm 8 Ahead Inf 46.8 %
4/1(Long Road) 3.00 0.00 Y Arm 5 Left 18.70 100.0 % 1773 1773
4/2(Long Road) 3.00 0.00 N Arm 5 Left 23.40 100.0 % 1931 1931
4/3(Long Road) 3.50 0.00 Y
Arm 6 Right 20.20 24.2 %1930 1930
Arm 7 Ahead Inf 75.8 %
5/1 Infinite Saturation Flow Inf Inf
5/2 Infinite Saturation Flow Inf Inf
6/1 Infinite Saturation Flow Inf Inf
6/2 Infinite Saturation Flow Inf Inf
7/1 Infinite Saturation Flow Inf Inf
8/1 Infinite Saturation Flow Inf Inf
8/2 Infinite Saturation Flow Inf Inf

Full Input Data And Results
Scenario 2: '2017 Base PM' (FG2: '2017 Base PM', Plan 1: 'Network Control Plan 1')Traffic Flows, DesiredDesired Flow :
Destination
Origin
A B C D Tot.
A 0 250 741 170 1161
B 118 0 14 73 205
C 594 14 0 44 652
D 345 161 70 0 576
Tot. 1057 425 825 287 2594
Traffic Lane Flows
Lane Scenario 2:2017 Base PM
Junction: Long Road Junction
1/1 458
1/2 533
1/3 82
1/4 88
2/1(short) 44
2/2(with short)
320(In)276(Out)
2/3(with short)
332(In)318(Out)
2/4(short) 14
3/1(short) 14
3/2(with short)
205(In)191(Out)
4/1 158
4/2 187
4/3 231
5/1 528
5/2 529
6/1 420
6/2 405
7/1 425
8/1 143
8/2 144

Full Input Data And Results
Lane Saturation FlowsJunction: Long Road Junction
LaneLaneWidth
(m)Gradient Nearside
LaneAllowedTurns
TurningRadius
(m)Turning
Prop.Sat Flow(PCU/Hr)
Flared Sat Flow(PCU/Hr)
1/1(A3022 Brixham Road (north)) 3.20 0.00 Y
Arm 6 Ahead Inf 45.4 %1841 1841
Arm 7 Left 16.00 54.6 %
1/2(A3022 Brixham Road (north)) 3.20 0.00 N Arm 6 Ahead Inf 100.0 % 2075 2075
1/3(A3022 Brixham Road (north)) 3.05 0.00 Y Arm 8 Right 11.80 100.0 % 1703 1703
1/4(A3022 Brixham Road (north)) 3.05 0.00 N Arm 8 Right 9.20 100.0 % 1771 1771
2/1(A3022 Brixham Road (south)) 3.10 0.00 Y Arm 8 Left 9.20 100.0 % 1655 1655
2/2(A3022 Brixham Road (south)) 3.10 0.00 Y Arm 5 Ahead Inf 100.0 % 1925 1925
2/3(A3022 Brixham Road (south)) 3.30 0.00 N Arm 5 Ahead Inf 100.0 % 2085 2085
2/4(A3022 Brixham Road (south)) 3.50 0.00 Y Arm 7 Right 10.80 100.0 % 1725 1725
3/1(Goodrington Road) 3.35 0.00 Y Arm 6 Left 7.60 100.0 % 1629 1629
3/2(Goodrington Road) 3.35 0.00 Y
Arm 5 Right 25.60 61.8 %1882 1882
Arm 8 Ahead Inf 38.2 %
4/1(Long Road) 3.00 0.00 Y Arm 5 Left 18.70 100.0 % 1773 1773
4/2(Long Road) 3.00 0.00 N Arm 5 Left 23.40 100.0 % 1931 1931
4/3(Long Road) 3.50 0.00 Y
Arm 6 Right 20.20 30.3 %1922 1922
Arm 7 Ahead Inf 69.7 %
5/1 Infinite Saturation Flow Inf Inf
5/2 Infinite Saturation Flow Inf Inf
6/1 Infinite Saturation Flow Inf Inf
6/2 Infinite Saturation Flow Inf Inf
7/1 Infinite Saturation Flow Inf Inf
8/1 Infinite Saturation Flow Inf Inf
8/2 Infinite Saturation Flow Inf Inf

Full Input Data And Results
Scenario 23: 'TA 2024 + Dev AM' (FG33: 'TA 2024 + Dev AM', Plan 1: 'Network Control Plan 1')Traffic Flows, DesiredDesired Flow :
Destination
Origin
A B C D Tot.
A 0 114 607 586 1307
B 237 0 23 261 521
C 891 31 0 84 1006
D 235 72 17 0 324
Tot. 1363 217 647 931 3158
Traffic Lane Flows
LaneScenario 23:
TA 2024 + DevAM
Junction: Long Road Junction
1/1 336
1/2 385
1/3 286
1/4 300
2/1(short) 84
2/2(with short)
498(In)414(Out)
2/3(with short)
508(In)477(Out)
2/4(short) 31
3/1(short) 23
3/2(with short)
521(In)498(Out)
4/1 106
4/2 129
4/3 89
5/1 681
5/2 682
6/1 336
6/2 311
7/1 217
8/1 465
8/2 466
Full Input Data And Results
Lane Saturation FlowsJunction: Long Road Junction
LaneLaneWidth
(m)Gradient Nearside
LaneAllowedTurns
TurningRadius
(m)Turning
Prop.Sat Flow(PCU/Hr)
Flared Sat Flow(PCU/Hr)
1/1(A3022 Brixham Road (north)) 3.20 0.00 Y
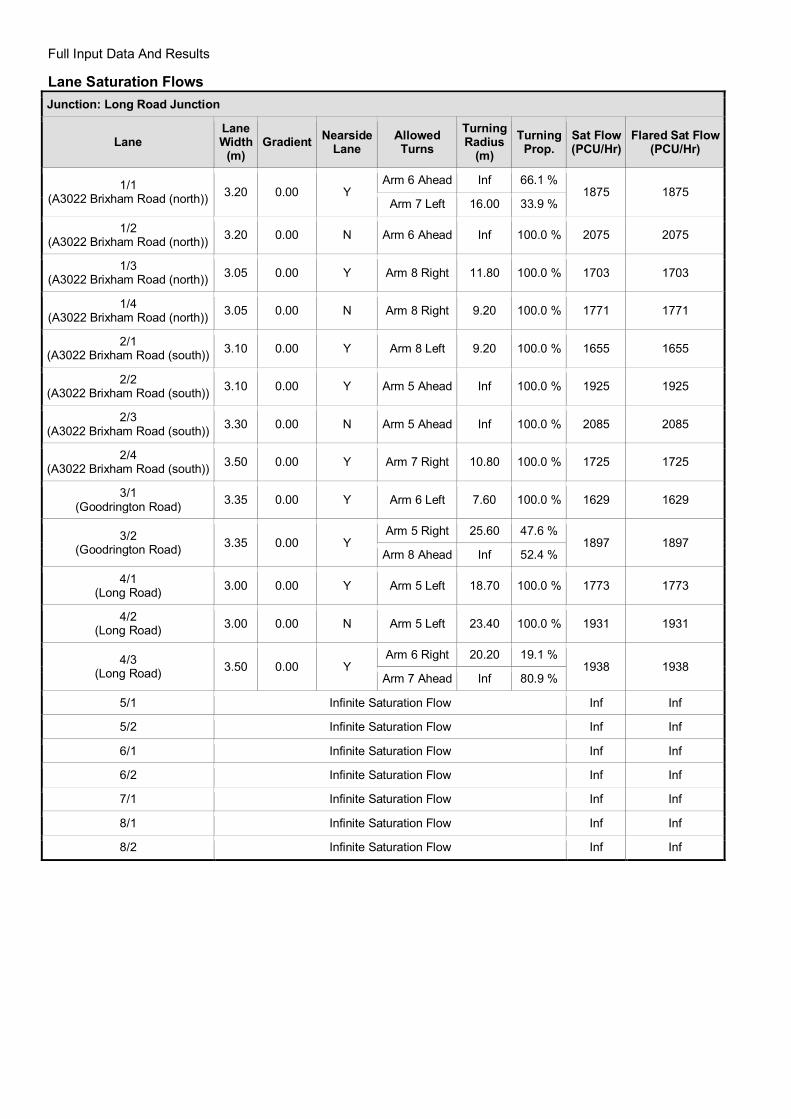
Arm 6 Ahead Inf 66.1 %1875 1875
Arm 7 Left 16.00 33.9 %
1/2(A3022 Brixham Road (north)) 3.20 0.00 N Arm 6 Ahead Inf 100.0 % 2075 2075
1/3(A3022 Brixham Road (north)) 3.05 0.00 Y Arm 8 Right 11.80 100.0 % 1703 1703
1/4(A3022 Brixham Road (north)) 3.05 0.00 N Arm 8 Right 9.20 100.0 % 1771 1771
2/1(A3022 Brixham Road (south)) 3.10 0.00 Y Arm 8 Left 9.20 100.0 % 1655 1655
2/2(A3022 Brixham Road (south)) 3.10 0.00 Y Arm 5 Ahead Inf 100.0 % 1925 1925
2/3(A3022 Brixham Road (south)) 3.30 0.00 N Arm 5 Ahead Inf 100.0 % 2085 2085
2/4(A3022 Brixham Road (south)) 3.50 0.00 Y Arm 7 Right 10.80 100.0 % 1725 1725
3/1(Goodrington Road) 3.35 0.00 Y Arm 6 Left 7.60 100.0 % 1629 1629
3/2(Goodrington Road) 3.35 0.00 Y
Arm 5 Right 25.60 47.6 %1897 1897
Arm 8 Ahead Inf 52.4 %
4/1(Long Road) 3.00 0.00 Y Arm 5 Left 18.70 100.0 % 1773 1773
4/2(Long Road) 3.00 0.00 N Arm 5 Left 23.40 100.0 % 1931 1931
4/3(Long Road) 3.50 0.00 Y
Arm 6 Right 20.20 19.1 %1938 1938
Arm 7 Ahead Inf 80.9 %
5/1 Infinite Saturation Flow Inf Inf
5/2 Infinite Saturation Flow Inf Inf
6/1 Infinite Saturation Flow Inf Inf
6/2 Infinite Saturation Flow Inf Inf
7/1 Infinite Saturation Flow Inf Inf
8/1 Infinite Saturation Flow Inf Inf
8/2 Infinite Saturation Flow Inf Inf

Full Input Data And Results
Scenario 24: 'TA 2024 + Dev PM' (FG34: 'TA 2024 + Dev PM', Plan 1: 'Network Control Plan 1')Traffic Flows, DesiredDesired Flow :
Destination
Origin
A B C D Tot.
A 0 265 943 275 1483
B 134 0 42 102 278
C 790 43 0 48 881
D 621 234 75 0 930
Tot. 1545 542 1060 425 3572
Traffic Lane Flows
LaneScenario 24:
TA 2024 + DevPM
Junction: Long Road Junction
1/1 565
1/2 643
1/3 134
1/4 141
2/1(short) 48
2/2(with short)
422(In)374(Out)
2/3(with short)
459(In)416(Out)
2/4(short) 43
3/1(short) 42
3/2(with short)
278(In)236(Out)
4/1 292
4/2 329
4/3 309
5/1 773
5/2 772
6/1 552
6/2 508
7/1 542
8/1 212
8/2 213

Full Input Data And Results
Lane Saturation FlowsJunction: Long Road Junction
LaneLaneWidth
(m)Gradient Nearside
LaneAllowedTurns
TurningRadius
(m)Turning
Prop.Sat Flow(PCU/Hr)
Flared Sat Flow(PCU/Hr)
1/1(A3022 Brixham Road (north)) 3.20 0.00 Y
Arm 6 Ahead Inf 53.1 %1853 1853
Arm 7 Left 16.00 46.9 %
1/2(A3022 Brixham Road (north)) 3.20 0.00 N Arm 6 Ahead Inf 100.0 % 2075 2075
1/3(A3022 Brixham Road (north)) 3.05 0.00 Y Arm 8 Right 11.80 100.0 % 1703 1703
1/4(A3022 Brixham Road (north)) 3.05 0.00 N Arm 8 Right 9.20 100.0 % 1771 1771
2/1(A3022 Brixham Road (south)) 3.10 0.00 Y Arm 8 Left 9.20 100.0 % 1655 1655
2/2(A3022 Brixham Road (south)) 3.10 0.00 Y Arm 5 Ahead Inf 100.0 % 1925 1925
2/3(A3022 Brixham Road (south)) 3.30 0.00 N Arm 5 Ahead Inf 100.0 % 2085 2085
2/4(A3022 Brixham Road (south)) 3.50 0.00 Y Arm 7 Right 10.80 100.0 % 1725 1725
3/1(Goodrington Road) 3.35 0.00 Y Arm 6 Left 7.60 100.0 % 1629 1629
3/2(Goodrington Road) 3.35 0.00 Y
Arm 5 Right 25.60 56.8 %1887 1887
Arm 8 Ahead Inf 43.2 %
4/1(Long Road) 3.00 0.00 Y Arm 5 Left 18.70 100.0 % 1773 1773
4/2(Long Road) 3.00 0.00 N Arm 5 Left 23.40 100.0 % 1931 1931
4/3(Long Road) 3.50 0.00 Y
Arm 6 Right 20.20 24.3 %1930 1930
Arm 7 Ahead Inf 75.7 %
5/1 Infinite Saturation Flow Inf Inf
5/2 Infinite Saturation Flow Inf Inf
6/1 Infinite Saturation Flow Inf Inf
6/2 Infinite Saturation Flow Inf Inf
7/1 Infinite Saturation Flow Inf Inf
8/1 Infinite Saturation Flow Inf Inf
8/2 Infinite Saturation Flow Inf Inf

Full Input Data And Results
Scenario 25: 'TA 2024 AM' (FG31: 'TA 2024 AM', Plan 1: 'Network Control Plan 1')Traffic Flows, DesiredDesired Flow :
Destination
Origin
A B C D Tot.
A 0 114 560 586 1260
B 237 0 21 261 519
C 803 26 0 84 913
D 235 72 17 0 324
Tot. 1275 212 598 931 3016
Traffic Lane Flows
Lane Scenario 25:TA 2024 AM
Junction: Long Road Junction
1/1 312
1/2 362
1/3 286
1/4 300
2/1(short) 84
2/2(with short)
456(In)372(Out)
2/3(with short)
457(In)431(Out)
2/4(short) 26
3/1(short) 21
3/2(with short)
519(In)498(Out)
4/1 106
4/2 129
4/3 89
5/1 638
5/2 637
6/1 310
6/2 288
7/1 212
8/1 465
8/2 466

Full Input Data And Results
Lane Saturation FlowsJunction: Long Road Junction
LaneLaneWidth
(m)Gradient Nearside
LaneAllowedTurns
TurningRadius
(m)Turning
Prop.Sat Flow(PCU/Hr)
Flared Sat Flow(PCU/Hr)
1/1(A3022 Brixham Road (north)) 3.20 0.00 Y
Arm 6 Ahead Inf 63.5 %1871 1871
Arm 7 Left 16.00 36.5 %
1/2(A3022 Brixham Road (north)) 3.20 0.00 N Arm 6 Ahead Inf 100.0 % 2075 2075
1/3(A3022 Brixham Road (north)) 3.05 0.00 Y Arm 8 Right 11.80 100.0 % 1703 1703
1/4(A3022 Brixham Road (north)) 3.05 0.00 N Arm 8 Right 9.20 100.0 % 1771 1771
2/1(A3022 Brixham Road (south)) 3.10 0.00 Y Arm 8 Left 9.20 100.0 % 1655 1655
2/2(A3022 Brixham Road (south)) 3.10 0.00 Y Arm 5 Ahead Inf 100.0 % 1925 1925
2/3(A3022 Brixham Road (south)) 3.30 0.00 N Arm 5 Ahead Inf 100.0 % 2085 2085
2/4(A3022 Brixham Road (south)) 3.50 0.00 Y Arm 7 Right 10.80 100.0 % 1725 1725
3/1(Goodrington Road) 3.35 0.00 Y Arm 6 Left 7.60 100.0 % 1629 1629
3/2(Goodrington Road) 3.35 0.00 Y
Arm 5 Right 25.60 47.6 %1897 1897
Arm 8 Ahead Inf 52.4 %
4/1(Long Road) 3.00 0.00 Y Arm 5 Left 18.70 100.0 % 1773 1773
4/2(Long Road) 3.00 0.00 N Arm 5 Left 23.40 100.0 % 1931 1931
4/3(Long Road) 3.50 0.00 Y
Arm 6 Right 20.20 19.1 %1938 1938
Arm 7 Ahead Inf 80.9 %
5/1 Infinite Saturation Flow Inf Inf
5/2 Infinite Saturation Flow Inf Inf
6/1 Infinite Saturation Flow Inf Inf
6/2 Infinite Saturation Flow Inf Inf
7/1 Infinite Saturation Flow Inf Inf
8/1 Infinite Saturation Flow Inf Inf
8/2 Infinite Saturation Flow Inf Inf

Full Input Data And Results
Scenario 26: 'TA 2024 PM' (FG32: 'TA 2024 PM', Plan 1: 'Network Control Plan 1')Traffic Flows, DesiredDesired Flow :
Destination
Origin
A B C D Tot.
A 0 265 843 275 1383
B 134 0 35 102 271
C 731 39 0 48 818
D 621 234 75 0 930
Tot. 1486 538 953 425 3402
Traffic Lane Flows
Lane Scenario 26:TA 2024 PM
Junction: Long Road Junction
1/1 515
1/2 593
1/3 134
1/4 141
2/1(short) 48
2/2(with short)
394(In)346(Out)
2/3(with short)
424(In)385(Out)
2/4(short) 39
3/1(short) 35
3/2(with short)
271(In)236(Out)
4/1 292
4/2 329
4/3 309
5/1 744
5/2 742
6/1 494
6/2 459
7/1 538
8/1 212
8/2 213

Full Input Data And Results
Lane Saturation FlowsJunction: Long Road Junction
LaneLaneWidth
(m)Gradient Nearside
LaneAllowedTurns
TurningRadius
(m)Turning
Prop.Sat Flow(PCU/Hr)
Flared Sat Flow(PCU/Hr)
1/1(A3022 Brixham Road (north)) 3.20 0.00 Y
Arm 6 Ahead Inf 48.5 %1846 1846
Arm 7 Left 16.00 51.5 %
1/2(A3022 Brixham Road (north)) 3.20 0.00 N Arm 6 Ahead Inf 100.0 % 2075 2075
1/3(A3022 Brixham Road (north)) 3.05 0.00 Y Arm 8 Right 11.80 100.0 % 1703 1703
1/4(A3022 Brixham Road (north)) 3.05 0.00 N Arm 8 Right 9.20 100.0 % 1771 1771
2/1(A3022 Brixham Road (south)) 3.10 0.00 Y Arm 8 Left 9.20 100.0 % 1655 1655
2/2(A3022 Brixham Road (south)) 3.10 0.00 Y Arm 5 Ahead Inf 100.0 % 1925 1925
2/3(A3022 Brixham Road (south)) 3.30 0.00 N Arm 5 Ahead Inf 100.0 % 2085 2085
2/4(A3022 Brixham Road (south)) 3.50 0.00 Y Arm 7 Right 10.80 100.0 % 1725 1725
3/1(Goodrington Road) 3.35 0.00 Y Arm 6 Left 7.60 100.0 % 1629 1629
3/2(Goodrington Road) 3.35 0.00 Y
Arm 5 Right 25.60 56.8 %1887 1887
Arm 8 Ahead Inf 43.2 %
4/1(Long Road) 3.00 0.00 Y Arm 5 Left 18.70 100.0 % 1773 1773
4/2(Long Road) 3.00 0.00 N Arm 5 Left 23.40 100.0 % 1931 1931
4/3(Long Road) 3.50 0.00 Y
Arm 6 Right 20.20 24.3 %1930 1930
Arm 7 Ahead Inf 75.7 %
5/1 Infinite Saturation Flow Inf Inf
5/2 Infinite Saturation Flow Inf Inf
6/1 Infinite Saturation Flow Inf Inf
6/2 Infinite Saturation Flow Inf Inf
7/1 Infinite Saturation Flow Inf Inf
8/1 Infinite Saturation Flow Inf Inf
8/2 Infinite Saturation Flow Inf Inf

Full Input Data And Results
Scenario 27: 'TA 2019 AM' (FG35: 'TA 2019 AM', Plan 1: 'Network Control Plan 1')Traffic Flows, DesiredDesired Flow :
Destination
Origin
A B C D Tot.
A 0 100 531 547 1178
B 229 0 21 251 501
C 780 26 0 82 888
D 216 68 16 0 300
Tot. 1225 194 568 880 2867
Traffic Lane Flows
Lane Scenario 27:TA 2019 AM
Junction: Long Road Junction
1/1 292
1/2 339
1/3 268
1/4 279
2/1(short) 82
2/2(with short)
444(In)362(Out)
2/3(with short)
444(In)418(Out)
2/4(short) 26
3/1(short) 21
3/2(with short)
501(In)480(Out)
4/1 98
4/2 118
4/3 84
5/1 613
5/2 612
6/1 294
6/2 274
7/1 194
8/1 439
8/2 441

Full Input Data And Results
Lane Saturation FlowsJunction: Long Road Junction
LaneLaneWidth
(m)Gradient Nearside
LaneAllowedTurns
TurningRadius
(m)Turning
Prop.Sat Flow(PCU/Hr)
Flared Sat Flow(PCU/Hr)
1/1(A3022 Brixham Road (north)) 3.20 0.00 Y
Arm 6 Ahead Inf 65.8 %1875 1875
Arm 7 Left 16.00 34.2 %
1/2(A3022 Brixham Road (north)) 3.20 0.00 N Arm 6 Ahead Inf 100.0 % 2075 2075
1/3(A3022 Brixham Road (north)) 3.05 0.00 Y Arm 8 Right 11.80 100.0 % 1703 1703
1/4(A3022 Brixham Road (north)) 3.05 0.00 N Arm 8 Right 9.20 100.0 % 1771 1771
2/1(A3022 Brixham Road (south)) 3.10 0.00 Y Arm 8 Left 9.20 100.0 % 1655 1655
2/2(A3022 Brixham Road (south)) 3.10 0.00 Y Arm 5 Ahead Inf 100.0 % 1925 1925
2/3(A3022 Brixham Road (south)) 3.30 0.00 N Arm 5 Ahead Inf 100.0 % 2085 2085
2/4(A3022 Brixham Road (south)) 3.50 0.00 Y Arm 7 Right 10.80 100.0 % 1725 1725
3/1(Goodrington Road) 3.35 0.00 Y Arm 6 Left 7.60 100.0 % 1629 1629
3/2(Goodrington Road) 3.35 0.00 Y
Arm 5 Right 25.60 47.7 %1897 1897
Arm 8 Ahead Inf 52.3 %
4/1(Long Road) 3.00 0.00 Y Arm 5 Left 18.70 100.0 % 1773 1773
4/2(Long Road) 3.00 0.00 N Arm 5 Left 23.40 100.0 % 1931 1931
4/3(Long Road) 3.50 0.00 Y
Arm 6 Right 20.20 19.0 %1938 1938
Arm 7 Ahead Inf 81.0 %
5/1 Infinite Saturation Flow Inf Inf
5/2 Infinite Saturation Flow Inf Inf
6/1 Infinite Saturation Flow Inf Inf
6/2 Infinite Saturation Flow Inf Inf
7/1 Infinite Saturation Flow Inf Inf
8/1 Infinite Saturation Flow Inf Inf
8/2 Infinite Saturation Flow Inf Inf

Full Input Data And Results
Scenario 28: 'TA 2019 PM' (FG36: 'TA 2019 PM', Plan 1: 'Network Control Plan 1')Traffic Flows, DesiredDesired Flow :
Destination
Origin
A B C D Tot.
A 0 254 822 239 1315
B 121 0 35 93 249
C 696 39 0 44 779
D 558 219 70 0 847
Tot. 1375 512 927 376 3190
Traffic Lane Flows
Lane Scenario 28:TA 2019 PM
Junction: Long Road Junction
1/1 500
1/2 576
1/3 116
1/4 123
2/1(short) 44
2/2(with short)
374(In)330(Out)
2/3(with short)
405(In)366(Out)
2/4(short) 39
3/1(short) 35
3/2(with short)
249(In)214(Out)
4/1 260
4/2 298
4/3 289
5/1 688
5/2 687
6/1 481
6/2 446
7/1 512
8/1 187
8/2 189

Full Input Data And Results
Lane Saturation FlowsJunction: Long Road Junction
LaneLaneWidth
(m)Gradient Nearside
LaneAllowedTurns
TurningRadius
(m)Turning
Prop.Sat Flow(PCU/Hr)
Flared Sat Flow(PCU/Hr)
1/1(A3022 Brixham Road (north)) 3.20 0.00 Y
Arm 6 Ahead Inf 49.2 %1847 1847
Arm 7 Left 16.00 50.8 %
1/2(A3022 Brixham Road (north)) 3.20 0.00 N Arm 6 Ahead Inf 100.0 % 2075 2075
1/3(A3022 Brixham Road (north)) 3.05 0.00 Y Arm 8 Right 11.80 100.0 % 1703 1703
1/4(A3022 Brixham Road (north)) 3.05 0.00 N Arm 8 Right 9.20 100.0 % 1771 1771
2/1(A3022 Brixham Road (south)) 3.10 0.00 Y Arm 8 Left 9.20 100.0 % 1655 1655
2/2(A3022 Brixham Road (south)) 3.10 0.00 Y Arm 5 Ahead Inf 100.0 % 1925 1925
2/3(A3022 Brixham Road (south)) 3.30 0.00 N Arm 5 Ahead Inf 100.0 % 2085 2085
2/4(A3022 Brixham Road (south)) 3.50 0.00 Y Arm 7 Right 10.80 100.0 % 1725 1725
3/1(Goodrington Road) 3.35 0.00 Y Arm 6 Left 7.60 100.0 % 1629 1629
3/2(Goodrington Road) 3.35 0.00 Y
Arm 5 Right 25.60 56.5 %1887 1887
Arm 8 Ahead Inf 43.5 %
4/1(Long Road) 3.00 0.00 Y Arm 5 Left 18.70 100.0 % 1773 1773
4/2(Long Road) 3.00 0.00 N Arm 5 Left 23.40 100.0 % 1931 1931
4/3(Long Road) 3.50 0.00 Y
Arm 6 Right 20.20 24.2 %1930 1930
Arm 7 Ahead Inf 75.8 %
5/1 Infinite Saturation Flow Inf Inf
5/2 Infinite Saturation Flow Inf Inf
6/1 Infinite Saturation Flow Inf Inf
6/2 Infinite Saturation Flow Inf Inf
7/1 Infinite Saturation Flow Inf Inf
8/1 Infinite Saturation Flow Inf Inf
8/2 Infinite Saturation Flow Inf Inf
Scenario 1: '2017 Base AM' (FG1: '2017 Base AM', Plan 1: 'Network Control Plan 1')Stage Sequence Diagram
A
B
I
L
N
O
1 Min: 7
8 26s
C
D
F H J
L
N
2 Min: 7
14 9s
F
G
H I J
LM
3 Min: 7
10 7s
E
I J
KN
O
4 Min: 7
14 32s

Full Input Data And Results
Stage TimingsStage 1 2 3 4
Duration 26 9 7 32
Change Point 0 34 57 74
Signal Timings Diagram
0
0
10
10
20
20
30
30
40
40
50
50
60
60
70
70
80
80
90
90
100
100
110
110
120
120
Time in cycle (sec)
Phas
es
1 8 : 260
2 14 : 934
3 10 : 757
4 14 : 3274
O ON NM ML LK KJ JI I
H HG GF FE ED DC CB BA A

Full Input Data And ResultsNetwork Layout Diagram

Full Input Data And Results
Long Road JunctionPRC: 15.6 %Total Traffic Delay: 35.0 pcuHr
C1
0
1
34
2
57
374
4
120
Arm
1-A
3022
Brix
ham
Roa
d(n
orth
)
1234
AACC
Arm
2-A
3022B
rixhamR
oad(south)
1 2 3 4
B B B DArm 3 - Goodrington Road
12
EE
Arm 4 - Long Road
123
FFG
Arm
5-
1 2A
rm6
-
Arm 7 -
1Arm 8 -
12
A
B
D

Full Input Data And Results

Full Input Data And Results
Network Results
Item LaneDescription
LaneType
ControllerStream
Position InFiltered Route Full Phase Arrow
PhaseNumGreens
Total Green(s)
ArrowGreen (s)
DemandFlow (pcu)
Sat Flow(pcu/Hr)
Capacity(pcu)
Deg Sat(%)
Network: LongRoad ExistingJunction
- - N/A - - - - - - - - 77.9%
Long RoadJunction - - N/A - - - - - - - - 77.9%
1/1A3022 Brixham
Road (north)Ahead Left
U N/A N/A A 1 34 - 258 1868 545 47.4%
1/2A3022 Brixham
Road (north)Ahead
U N/A N/A A 1 34 - 304 2075 605 50.2%
1/3A3022 Brixham
Road (north)Right
U N/A N/A C 1 16 - 176 1703 241 73.0%
1/4A3022 Brixham
Road (north)Right
U N/A N/A C 1 16 - 186 1771 251 74.1%
2/2+2/1A3022 BrixhamRoad (south)Ahead Left
U N/A N/A B 1 29 - 404 1925:1655 426+108 75.7 :75.7%
2/3+2/4A3022 BrixhamRoad (south)Ahead Right
U N/A N/A B D 1 29:9 - 394 2085:1725 518+12 74.3 :74.3%
3/2+3/1Goodrington
Road Right LeftAhead
U N/A N/A E 1 34 - 427 1891:1629 543+5 77.9 :77.9%
4/1 Long Road Left U N/A N/A F 1 29 - 64 1773 443 14.4%
4/2 Long Road Left U N/A N/A F 1 29 - 85 1931 483 17.6%
4/3 Long Road RightAhead U N/A N/A G 1 15 - 66 1930 257 25.6%
5/1 U N/A N/A - - - - 540 Inf Inf 0.0%
5/2 U N/A N/A - - - - 541 Inf Inf 0.0%
6/1 U N/A N/A - - - - 244 Inf Inf 0.0%
6/2 U N/A N/A - - - - 240 Inf Inf 0.0%
7/1 U N/A N/A - - - - 157 Inf Inf 0.0%

Full Input Data And Results8/1 U N/A N/A - - - - 321 Inf Inf 0.0%
8/2 U N/A N/A - - - - 321 Inf Inf 0.0%
Item Arriving (pcu) Leaving(pcu)
Turners InGaps (pcu)
Turners WhenUnopposed(pcu)
Turners InIntergreen(pcu)
UniformDelay(pcuHr)
Rand +OversatDelay(pcuHr)
Storage AreaUniformDelay(pcuHr)
TotalDelay(pcuHr)
Av. DelayPer PCU(s/pcu)
Max. Back ofUniformQueue (pcu)
Rand +OversatQueue (pcu)
MeanMaxQueue(pcu)
Network: LongRoad ExistingJunction
- - 0 0 0 26.4 8.6 0.0 35.0 - - - -
Long RoadJunction - - 0 0 0 26.4 8.6 0.0 35.0 - - - -
1/1 258 258 - - - 2.5 0.4 - 3.0 41.2 7.0 0.4 7.5
1/2 304 304 - - - 3.0 0.5 - 3.5 41.2 8.4 0.5 8.9
1/3 176 176 - - - 2.4 1.3 - 3.7 75.8 5.6 1.3 6.9
1/4 186 186 - - - 2.6 1.4 - 3.9 76.0 5.9 1.4 7.3
2/2+2/1 404 404 - - - 4.5 1.5 - 6.0 53.4 10.2 1.5 11.7
2/3+2/4 394 394 - - - 4.6 1.4 - 6.0 54.6 11.9 1.4 13.3
3/2+3/1 427 427 - - - 4.6 1.7 - 6.3 53.4 13.0 1.7 14.7
4/1 64 64 - - - 0.6 0.1 - 0.7 39.8 1.7 0.1 1.7
4/2 85 85 - - - 0.8 0.1 - 0.9 39.8 2.2 0.1 2.3
4/3 66 66 - - - 0.9 0.2 - 1.0 56.1 2.0 0.2 2.1
5/1 540 540 - - - 0.0 0.0 - 0.0 0.0 0.0 0.0 0.0
5/2 541 541 - - - 0.0 0.0 - 0.0 0.0 0.0 0.0 0.0
6/1 244 244 - - - 0.0 0.0 - 0.0 0.0 0.0 0.0 0.0
6/2 240 240 - - - 0.0 0.0 - 0.0 0.0 0.0 0.0 0.0
7/1 157 157 - - - 0.0 0.0 - 0.0 0.0 0.0 0.0 0.0
8/1 321 321 - - - 0.0 0.0 - 0.0 0.0 0.0 0.0 0.0
8/2 321 321 - - - 0.0 0.0 - 0.0 0.0 0.0 0.0 0.0
C1 PRC for Signalled Lanes (%): 15.6 Total Delay for Signalled Lanes (pcuHr): 35.04 Cycle Time (s): 120 PRC Over All Lanes (%): 15.6 Total Delay Over All Lanes(pcuHr): 35.04

Full Input Data And ResultsScenario 2: '2017 Base PM' (FG2: '2017 Base PM', Plan 1: 'Network Control Plan 1')Stage Sequence Diagram
A
B
I
L
N
O
1 Min: 7
8 37s
C
D
F H J
L
N
2 Min: 7
14 7s
F
G
H I J
LM
3 Min: 7
10 13s
E
I J
KN
O
4 Min: 7
14 17s
Stage TimingsStage 1 2 3 4
Duration 37 7 13 17
Change Point 0 45 66 89
Signal Timings Diagram
0
0
10
10
20
20
30
30
40
40
50
50
60
60
70
70
80
80
90
90
100
100
110
110
120
120
Time in cycle (sec)
Phas
es
1 8 : 370
2 14 : 745
3 10 : 1366
4 14 : 1789
O ON NM ML LK KJ JI I
H HG GF FE ED DC CB BA A

Full Input Data And ResultsNetwork Layout Diagram

Full Input Data And Results
Long Road JunctionPRC: 34.3 %Total Traffic Delay: 30.9 pcuHr
C1
0
1
452
66
389
4
120
Arm
1-A
3022
Brix
ham
Roa
d(n
orth
)
1234
AACC
Arm
2-A
3022B
rixhamR
oad(south)
1 2 3 4
B B B DArm 3 - Goodrington Road
12
EE
Arm 4 - Long Road
123
FFG
Arm
5-
1 2A
rm6
-
Arm 7 -
1Arm 8 -
12
A
B
D

Full Input Data And Results

Full Input Data And Results
Network Results
Item LaneDescription
LaneType
ControllerStream
Position InFiltered Route Full Phase Arrow
PhaseNumGreens
Total Green(s)
ArrowGreen (s)
DemandFlow (pcu)
Sat Flow(pcu/Hr)
Capacity(pcu)
Deg Sat(%)
Network: LongRoad ExistingJunction
- - N/A - - - - - - - - 67.0%
Long RoadJunction - - N/A - - - - - - - - 67.0%
1/1A3022 Brixham
Road (north)Ahead Left
U N/A N/A A 1 45 - 458 1841 706 64.9%
1/2A3022 Brixham
Road (north)Ahead
U N/A N/A A 1 45 - 533 2075 795 67.0%
1/3A3022 Brixham
Road (north)Right
U N/A N/A C 1 14 - 82 1703 213 38.5%
1/4A3022 Brixham
Road (north)Right
U N/A N/A C 1 14 - 88 1771 221 39.8%
2/2+2/1A3022 BrixhamRoad (south)Ahead Left
U N/A N/A B 1 40 - 320 1925:1655 592+94 46.6 :46.6%
2/3+2/4A3022 BrixhamRoad (south)Ahead Right
U N/A N/A B D 1 40:7 - 332 2085:1725 691+30 46.0 :46.0%
3/2+3/1Goodrington
Road Right LeftAhead
U N/A N/A E 1 19 - 205 1882:1629 291+21 65.6 :65.6%
4/1 Long Road Left U N/A N/A F 1 33 - 158 1773 502 31.5%
4/2 Long Road Left U N/A N/A F 1 33 - 187 1931 547 34.2%
4/3 Long Road RightAhead U N/A N/A G 1 21 - 231 1922 352 65.6%
5/1 U N/A N/A - - - - 528 Inf Inf 0.0%
5/2 U N/A N/A - - - - 529 Inf Inf 0.0%
6/1 U N/A N/A - - - - 420 Inf Inf 0.0%
6/2 U N/A N/A - - - - 405 Inf Inf 0.0%
7/1 U N/A N/A - - - - 425 Inf Inf 0.0%
Full Input Data And Results8/1 U N/A N/A - - - - 143 Inf Inf 0.0%
8/2 U N/A N/A - - - - 144 Inf Inf 0.0%
Item Arriving (pcu) Leaving(pcu)
Turners InGaps (pcu)
Turners WhenUnopposed(pcu)
Turners InIntergreen(pcu)
UniformDelay(pcuHr)
Rand +OversatDelay(pcuHr)
Storage AreaUniformDelay(pcuHr)
TotalDelay(pcuHr)
Av. DelayPer PCU(s/pcu)
Max. Back ofUniformQueue (pcu)
Rand +OversatQueue (pcu)
MeanMaxQueue(pcu)
Network: LongRoad ExistingJunction
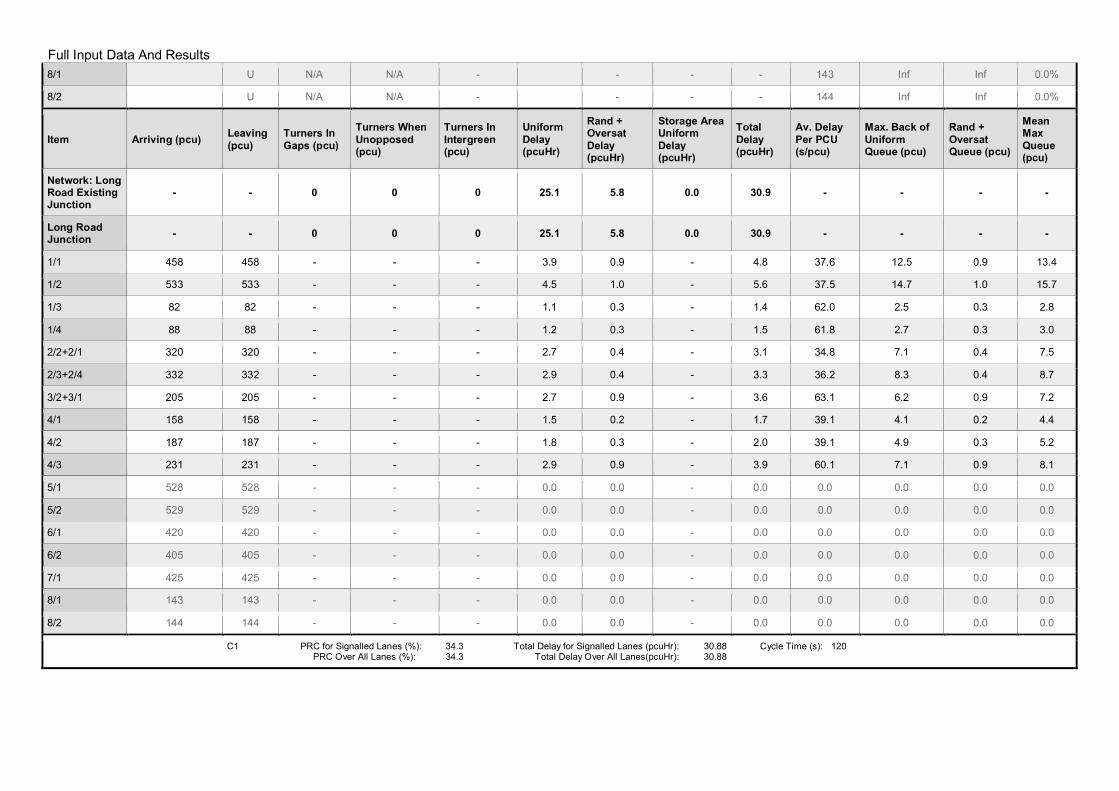
- - 0 0 0 25.1 5.8 0.0 30.9 - - - -
Long RoadJunction - - 0 0 0 25.1 5.8 0.0 30.9 - - - -
1/1 458 458 - - - 3.9 0.9 - 4.8 37.6 12.5 0.9 13.4
1/2 533 533 - - - 4.5 1.0 - 5.6 37.5 14.7 1.0 15.7
1/3 82 82 - - - 1.1 0.3 - 1.4 62.0 2.5 0.3 2.8
1/4 88 88 - - - 1.2 0.3 - 1.5 61.8 2.7 0.3 3.0
2/2+2/1 320 320 - - - 2.7 0.4 - 3.1 34.8 7.1 0.4 7.5
2/3+2/4 332 332 - - - 2.9 0.4 - 3.3 36.2 8.3 0.4 8.7
3/2+3/1 205 205 - - - 2.7 0.9 - 3.6 63.1 6.2 0.9 7.2
4/1 158 158 - - - 1.5 0.2 - 1.7 39.1 4.1 0.2 4.4
4/2 187 187 - - - 1.8 0.3 - 2.0 39.1 4.9 0.3 5.2
4/3 231 231 - - - 2.9 0.9 - 3.9 60.1 7.1 0.9 8.1
5/1 528 528 - - - 0.0 0.0 - 0.0 0.0 0.0 0.0 0.0
5/2 529 529 - - - 0.0 0.0 - 0.0 0.0 0.0 0.0 0.0
6/1 420 420 - - - 0.0 0.0 - 0.0 0.0 0.0 0.0 0.0
6/2 405 405 - - - 0.0 0.0 - 0.0 0.0 0.0 0.0 0.0
7/1 425 425 - - - 0.0 0.0 - 0.0 0.0 0.0 0.0 0.0
8/1 143 143 - - - 0.0 0.0 - 0.0 0.0 0.0 0.0 0.0
8/2 144 144 - - - 0.0 0.0 - 0.0 0.0 0.0 0.0 0.0
C1 PRC for Signalled Lanes (%): 34.3 Total Delay for Signalled Lanes (pcuHr): 30.88 Cycle Time (s): 120 PRC Over All Lanes (%): 34.3 Total Delay Over All Lanes(pcuHr): 30.88

Full Input Data And ResultsScenario 23: 'TA 2024 + Dev AM' (FG33: 'TA 2024 + Dev AM', Plan 1: 'Network Control Plan 1')Stage Sequence Diagram
A
B
I
L
N
O
1 Min: 7
8 24s
C
D
F H J
L
N
2 Min: 7
14 13s
F
G
H I J
LM
3 Min: 7
10 7s
E
I J
KN
O
4 Min: 7
14 30s
Stage TimingsStage 1 2 3 4
Duration 24 13 7 30
Change Point 0 32 59 76
Signal Timings Diagram
0
0
10
10
20
20
30
30
40
40
50
50
60
60
70
70
80
80
90
90
100
100
110
110
120
120
Time in cycle (sec)
Phas
es
1 8 : 240
2 14 : 1332
3 10 : 759
4 14 : 3076
O ON NM ML LK KJ JI I
H HG GF FE ED DC CB BA A

Full Input Data And ResultsNetwork Layout Diagram

Full Input Data And Results
Long Road JunctionPRC: -12.8 %Total Traffic Delay: 92.5 pcuHr
C1
0
1
32
2
59
376
4
120
Arm
1-A
3022
Brix
ham
Roa
d(n
orth
)
1234
AACC
Arm
2-A
3022B
rixhamR
oad(south)
1 2 3 4
B B B DArm 3 - Goodrington Road
12
EE
Arm 4 - Long Road
123
FFG
Arm
5-
1 2A
rm6
-
Arm 7 -
1Arm 8 -
12
A
B
D

Full Input Data And Results

Full Input Data And Results
Network Results
Item LaneDescription
LaneType
ControllerStream
Position InFiltered Route Full Phase Arrow
PhaseNumGreens
Total Green(s)
ArrowGreen (s)
DemandFlow (pcu)
Sat Flow(pcu/Hr)
Capacity(pcu)
Deg Sat(%)
Network:Long RoadExistingJunction
- - N/A - - - - - - - - 101.5%
Long RoadJunction - - N/A - - - - - - - - 101.5%
1/1A3022 Brixham
Road (north)Ahead Left
U N/A N/A A 1 32 - 336 1875 516 65.2%
1/2A3022 Brixham
Road (north)Ahead
U N/A N/A A 1 32 - 385 2075 571 67.5%
1/3A3022 Brixham
Road (north)Right
U N/A N/A C 1 20 - 286 1703 298 96.0%
1/4A3022 Brixham
Road (north)Right
U N/A N/A C 1 20 - 300 1771 310 96.8%
2/2+2/1A3022 BrixhamRoad (south)Ahead Left
U N/A N/A B 1 27 - 498 1925:1655 409+83 101.3 :101.3%
2/3+2/4A3022 BrixhamRoad (south)Ahead Right
U N/A N/A B D 1 27:13 - 508 2085:1725 470+31 101.5 :101.5%
3/2+3/1Goodrington
Road Right LeftAhead
U N/A N/A E 1 32 - 521 1897:1629 495+23 100.6 :100.6%
4/1 Long Road Left U N/A N/A F 1 33 - 106 1773 502 21.1%
4/2 Long Road Left U N/A N/A F 1 33 - 129 1931 547 23.6%
4/3 Long Road RightAhead U N/A N/A G 1 15 - 89 1938 258 34.4%
5/1 U N/A N/A - - - - 681 Inf Inf 0.0%
5/2 U N/A N/A - - - - 682 Inf Inf 0.0%
6/1 U N/A N/A - - - - 336 Inf Inf 0.0%
6/2 U N/A N/A - - - - 311 Inf Inf 0.0%

Full Input Data And Results7/1 U N/A N/A - - - - 217 Inf Inf 0.0%
8/1 U N/A N/A - - - - 465 Inf Inf 0.0%
8/2 U N/A N/A - - - - 466 Inf Inf 0.0%
Item Arriving (pcu) Leaving(pcu)
Turners InGaps (pcu)
Turners WhenUnopposed(pcu)
Turners InIntergreen(pcu)
UniformDelay(pcuHr)
Rand +OversatDelay(pcuHr)
Storage AreaUniformDelay(pcuHr)
TotalDelay(pcuHr)
Av. DelayPer PCU(s/pcu)
Max. Back ofUniformQueue (pcu)
Rand +OversatQueue (pcu)
Mean MaxQueue(pcu)
Network:Long RoadExistingJunction
- - 0 0 0 39.1 53.4 0.0 92.5 - - - -
Long RoadJunction - - 0 0 0 39.1 53.4 0.0 92.5 - - - -
1/1 336 336 - - - 3.6 0.9 - 4.5 48.3 9.8 0.9 10.7
1/2 385 385 - - - 4.1 1.0 - 5.2 48.3 11.3 1.0 12.4
1/3 286 286 - - - 3.9 6.0 - 9.9 124.2 9.4 6.0 15.3
1/4 300 300 - - - 4.1 6.5 - 10.6 127.5 9.9 6.5 16.4
2/2+2/1 498 492 - - - 6.7 12.9 - 19.5 141.2 15.3 12.9 28.2
2/3+2/4 508 501 - - - 6.9 13.3 - 20.2 143.1 16.9 13.3 30.2
3/2+3/1 521 518 - - - 6.5 12.2 - 18.7 129.4 17.4 12.2 29.6
4/1 106 106 - - - 1.0 0.1 - 1.1 37.3 2.7 0.1 2.8
4/2 129 129 - - - 1.2 0.2 - 1.3 37.3 3.3 0.2 3.5
4/3 89 89 - - - 1.2 0.3 - 1.4 57.8 2.7 0.3 3.0
5/1 674 674 - - - 0.0 0.0 - 0.0 0.0 0.0 0.0 0.0
5/2 675 675 - - - 0.0 0.0 - 0.0 0.0 0.0 0.0 0.0
6/1 336 336 - - - 0.0 0.0 - 0.0 0.0 0.0 0.0 0.0
6/2 311 311 - - - 0.0 0.0 - 0.0 0.0 0.0 0.0 0.0
7/1 217 217 - - - 0.0 0.0 - 0.0 0.0 0.0 0.0 0.0
8/1 464 464 - - - 0.0 0.0 - 0.0 0.0 0.0 0.0 0.0
8/2 465 465 - - - 0.0 0.0 - 0.0 0.0 0.0 0.0 0.0
C1 PRC for Signalled Lanes (%): -12.8 Total Delay for Signalled Lanes (pcuHr): 92.49 Cycle Time (s): 120 PRC Over All Lanes (%): -12.8 Total Delay Over All Lanes(pcuHr): 92.49

Full Input Data And ResultsScenario 24: 'TA 2024 + Dev PM' (FG34: 'TA 2024 + Dev PM', Plan 1: 'Network Control Plan 1')Stage Sequence Diagram
A
B
I
L
N
O
1 Min: 7
8 35s
C
D
F H J
L
N
2 Min: 7
14 7s
F
G
H I J
LM
3 Min: 7
10 14s
E
I J
KN
O
4 Min: 7
14 18s
Stage TimingsStage 1 2 3 4
Duration 35 7 14 18
Change Point 0 43 64 88
Signal Timings Diagram
0
0
10
10
20
20
30
30
40
40
50
50
60
60
70
70
80
80
90
90
100
100
110
110
120
120
Time in cycle (sec)
Phas
es
1 8 : 350
2 14 : 743
3 10 : 1464
4 14 : 1888
O ON NM ML LK KJ JI I
H HG GF FE ED DC CB BA A

Full Input Data And ResultsNetwork Layout Diagram

Full Input Data And Results
Long Road JunctionPRC: 6.5 %Total Traffic Delay: 52.6 pcuHr
C1
0
1
432
64
388
4
120
Arm
1-A
3022
Brix
ham
Roa
d(n
orth
)
1234
AACC
Arm
2-A
3022B
rixhamR
oad(south)
1 2 3 4
B B B DArm 3 - Goodrington Road
12
EE
Arm 4 - Long Road
123
FFG
Arm
5-
1 2A
rm6
-
Arm 7 -
1Arm 8 -
12
A
B
D

Full Input Data And Results

Full Input Data And Results
Network Results
Item LaneDescription
LaneType
ControllerStream
Position InFiltered Route Full Phase Arrow
PhaseNumGreens
Total Green(s)
ArrowGreen (s)
DemandFlow (pcu)
Sat Flow(pcu/Hr)
Capacity(pcu)
Deg Sat(%)
Network: LongRoad ExistingJunction
- - N/A - - - - - - - - 84.5%
Long RoadJunction - - N/A - - - - - - - - 84.5%
1/1A3022 Brixham
Road (north)Ahead Left
U N/A N/A A 1 43 - 565 1853 679 83.2%
1/2A3022 Brixham
Road (north)Ahead
U N/A N/A A 1 43 - 643 2075 761 84.5%
1/3A3022 Brixham
Road (north)Right
U N/A N/A C 1 14 - 134 1703 213 62.9%
1/4A3022 Brixham
Road (north)Right
U N/A N/A C 1 14 - 141 1771 221 63.7%
2/2+2/1A3022 BrixhamRoad (south)Ahead Left
U N/A N/A B 1 38 - 422 1925:1655 575+74 65.0 :65.0%
2/3+2/4A3022 BrixhamRoad (south)Ahead Right
U N/A N/A B D 1 38:7 - 459 2085:1725 628+65 66.3 :66.3%
3/2+3/1Goodrington
Road Right LeftAhead
U N/A N/A E 1 20 - 278 1887:1629 282+50 83.8 :83.8%
4/1 Long Road Left U N/A N/A F 1 34 - 292 1773 517 56.5%
4/2 Long Road Left U N/A N/A F 1 34 - 329 1931 563 58.4%
4/3 Long Road RightAhead U N/A N/A G 1 22 - 309 1930 370 83.5%
5/1 U N/A N/A - - - - 773 Inf Inf 0.0%
5/2 U N/A N/A - - - - 772 Inf Inf 0.0%
6/1 U N/A N/A - - - - 552 Inf Inf 0.0%
6/2 U N/A N/A - - - - 508 Inf Inf 0.0%
7/1 U N/A N/A - - - - 542 Inf Inf 0.0%

Full Input Data And Results8/1 U N/A N/A - - - - 212 Inf Inf 0.0%
8/2 U N/A N/A - - - - 213 Inf Inf 0.0%
Item Arriving (pcu) Leaving(pcu)
Turners InGaps (pcu)
Turners WhenUnopposed(pcu)
Turners InIntergreen(pcu)
UniformDelay(pcuHr)
Rand +OversatDelay(pcuHr)
Storage AreaUniformDelay(pcuHr)
TotalDelay(pcuHr)
Av. DelayPer PCU(s/pcu)
Max. Back ofUniformQueue (pcu)
Rand +OversatQueue (pcu)
MeanMaxQueue(pcu)
Network: LongRoad ExistingJunction
- - 0 0 0 37.9 14.6 0.0 52.6 - - - -
Long RoadJunction - - 0 0 0 37.9 14.6 0.0 52.6 - - - -
1/1 565 565 - - - 5.4 2.4 - 7.8 49.7 17.1 2.4 19.5
1/2 643 643 - - - 6.2 2.6 - 8.8 49.5 19.6 2.6 22.3
1/3 134 134 - - - 1.9 0.8 - 2.7 72.2 4.2 0.8 5.0
1/4 141 141 - - - 2.0 0.9 - 2.8 71.8 4.5 0.9 5.3
2/2+2/1 422 422 - - - 3.9 0.9 - 4.9 41.4 10.8 0.9 11.7
2/3+2/4 459 459 - - - 4.6 1.0 - 5.6 43.7 12.4 1.0 13.4
3/2+3/1 278 278 - - - 3.7 2.4 - 6.0 78.3 8.5 2.4 10.9
4/1 292 292 - - - 2.9 0.6 - 3.6 44.0 8.2 0.6 8.8
4/2 329 329 - - - 3.3 0.7 - 4.0 43.9 9.3 0.7 10.0
4/3 309 309 - - - 4.0 2.4 - 6.4 74.1 9.9 2.4 12.2
5/1 773 773 - - - 0.0 0.0 - 0.0 0.0 0.0 0.0 0.0
5/2 772 772 - - - 0.0 0.0 - 0.0 0.0 0.0 0.0 0.0
6/1 552 552 - - - 0.0 0.0 - 0.0 0.0 0.0 0.0 0.0
6/2 508 508 - - - 0.0 0.0 - 0.0 0.0 0.0 0.0 0.0
7/1 542 542 - - - 0.0 0.0 - 0.0 0.0 0.0 0.0 0.0
8/1 212 212 - - - 0.0 0.0 - 0.0 0.0 0.0 0.0 0.0
8/2 213 213 - - - 0.0 0.0 - 0.0 0.0 0.0 0.0 0.0
C1 PRC for Signalled Lanes (%): 6.5 Total Delay for Signalled Lanes (pcuHr): 52.57 Cycle Time (s): 120 PRC Over All Lanes (%): 6.5 Total Delay Over All Lanes(pcuHr): 52.57

Full Input Data And ResultsScenario 25: 'TA 2024 AM' (FG31: 'TA 2024 AM', Plan 1: 'Network Control Plan 1')Stage Sequence Diagram
A
B
I
L
N
O
1 Min: 7
8 23s
C
D
F H J
L
N
2 Min: 7
14 13s
F
G
H I J
LM
3 Min: 7
10 7s
E
I J
KN
O
4 Min: 7
14 31s
Stage TimingsStage 1 2 3 4
Duration 23 13 7 31
Change Point 0 31 58 75
Signal Timings Diagram
0
0
10
10
20
20
30
30
40
40
50
50
60
60
70
70
80
80
90
90
100
100
110
110
120
120
Time in cycle (sec)
Phas
es
1 8 : 230
2 14 : 1331
3 10 : 758
4 14 : 3175
O ON NM ML LK KJ JI I
H HG GF FE ED DC CB BA A

Full Input Data And ResultsNetwork Layout Diagram

Full Input Data And Results
Long Road JunctionPRC: -8.1 %Total Traffic Delay: 71.4 pcuHr
C1
0
1
31
2
58
375
4
120
Arm
1-A
3022
Brix
ham
Roa
d(n
orth
)
1234
AACC
Arm
2-A
3022B
rixhamR
oad(south)
1 2 3 4
B B B DArm 3 - Goodrington Road
12
EE
Arm 4 - Long Road
123
FFG
Arm
5-
1 2A
rm6
-
Arm 7 -
1Arm 8 -
12
A
B
D

Full Input Data And Results

Full Input Data And Results
Network Results
Item LaneDescription
LaneType
ControllerStream
Position InFiltered Route Full Phase Arrow
PhaseNumGreens
Total Green(s)
ArrowGreen (s)
DemandFlow (pcu)
Sat Flow(pcu/Hr)
Capacity(pcu)
Deg Sat(%)
Network: LongRoad ExistingJunction
- - N/A - - - - - - - - 97.3%
Long RoadJunction - - N/A - - - - - - - - 97.3%
1/1A3022 Brixham
Road (north)Ahead Left
U N/A N/A A 1 31 - 312 1871 499 62.5%
1/2A3022 Brixham
Road (north)Ahead
U N/A N/A A 1 31 - 362 2075 553 65.4%
1/3A3022 Brixham
Road (north)Right
U N/A N/A C 1 20 - 286 1703 298 96.0%
1/4A3022 Brixham
Road (north)Right
U N/A N/A C 1 20 - 300 1771 310 96.8%
2/2+2/1A3022 BrixhamRoad (south)Ahead Left
U N/A N/A B 1 26 - 456 1925:1655 392+89 94.8 :94.8%
2/3+2/4A3022 BrixhamRoad (south)Ahead Right
U N/A N/A B D 1 26:13 - 457 2085:1725 455+27 94.7 :94.7%
3/2+3/1Goodrington
Road Right LeftAhead
U N/A N/A E 1 33 - 519 1897:1629 512+22 97.3 :97.3%
4/1 Long Road Left U N/A N/A F 1 33 - 106 1773 502 21.1%
4/2 Long Road Left U N/A N/A F 1 33 - 129 1931 547 23.6%
4/3 Long Road RightAhead U N/A N/A G 1 15 - 89 1938 258 34.4%
5/1 U N/A N/A - - - - 638 Inf Inf 0.0%
5/2 U N/A N/A - - - - 637 Inf Inf 0.0%
6/1 U N/A N/A - - - - 310 Inf Inf 0.0%
6/2 U N/A N/A - - - - 288 Inf Inf 0.0%
7/1 U N/A N/A - - - - 212 Inf Inf 0.0%

Full Input Data And Results8/1 U N/A N/A - - - - 465 Inf Inf 0.0%
8/2 U N/A N/A - - - - 466 Inf Inf 0.0%
Item Arriving (pcu) Leaving(pcu)
Turners InGaps (pcu)
Turners WhenUnopposed(pcu)
Turners InIntergreen(pcu)
UniformDelay(pcuHr)
Rand +OversatDelay(pcuHr)
Storage AreaUniformDelay(pcuHr)
TotalDelay(pcuHr)
Av. DelayPer PCU(s/pcu)
Max. Back ofUniformQueue (pcu)
Rand +OversatQueue (pcu)
MeanMaxQueue(pcu)
Network: LongRoad ExistingJunction
- - 0 0 0 36.2 35.3 0.0 71.4 - - - -
Long RoadJunction - - 0 0 0 36.2 35.3 0.0 71.4 - - - -
1/1 312 312 - - - 3.4 0.8 - 4.2 48.3 9.1 0.8 9.9
1/2 362 362 - - - 3.9 0.9 - 4.9 48.4 10.7 0.9 11.6
1/3 286 286 - - - 3.9 6.0 - 9.9 124.2 9.4 6.0 15.3
1/4 300 300 - - - 4.1 6.5 - 10.6 127.5 9.9 6.5 16.4
2/2+2/1 456 456 - - - 5.6 6.1 - 11.7 92.7 13.0 6.1 19.1
2/3+2/4 457 457 - - - 5.8 6.0 - 11.8 93.2 14.6 6.0 20.7
3/2+3/1 519 519 - - - 6.1 8.3 - 14.4 100.1 16.9 8.3 25.2
4/1 106 106 - - - 1.0 0.1 - 1.1 37.3 2.7 0.1 2.8
4/2 129 129 - - - 1.2 0.2 - 1.3 37.3 3.3 0.2 3.5
4/3 89 89 - - - 1.2 0.3 - 1.4 57.8 2.7 0.3 3.0
5/1 638 638 - - - 0.0 0.0 - 0.0 0.0 0.0 0.0 0.0
5/2 637 637 - - - 0.0 0.0 - 0.0 0.0 0.0 0.0 0.0
6/1 310 310 - - - 0.0 0.0 - 0.0 0.0 0.0 0.0 0.0
6/2 288 288 - - - 0.0 0.0 - 0.0 0.0 0.0 0.0 0.0
7/1 212 212 - - - 0.0 0.0 - 0.0 0.0 0.0 0.0 0.0
8/1 465 465 - - - 0.0 0.0 - 0.0 0.0 0.0 0.0 0.0
8/2 466 466 - - - 0.0 0.0 - 0.0 0.0 0.0 0.0 0.0
C1 PRC for Signalled Lanes (%): -8.1 Total Delay for Signalled Lanes (pcuHr): 71.42 Cycle Time (s): 120 PRC Over All Lanes (%): -8.1 Total Delay Over All Lanes(pcuHr): 71.42

Full Input Data And ResultsScenario 26: 'TA 2024 PM' (FG32: 'TA 2024 PM', Plan 1: 'Network Control Plan 1')Stage Sequence Diagram
A
B
I
L
N
O
1 Min: 7
8 33s
C
D
F H J
L
N
2 Min: 7
14 7s
F
G
H I J
LM
3 Min: 7
10 15s
E
I J
KN
O
4 Min: 7
14 19s
Stage TimingsStage 1 2 3 4
Duration 33 7 15 19
Change Point 0 41 62 87
Signal Timings Diagram
0
0
10
10
20
20
30
30
40
40
50
50
60
60
70
70
80
80
90
90
100
100
110
110
120
120
Time in cycle (sec)
Phas
es
1 8 : 330
2 14 : 741
3 10 : 1562
4 14 : 1987
O ON NM ML LK KJ JI I
H HG GF FE ED DC CB BA A

Full Input Data And ResultsNetwork Layout Diagram

Full Input Data And Results
Long Road JunctionPRC: 10.2 %Total Traffic Delay: 48.7 pcuHr
C1
0
1
412
62
387
4
120
Arm
1-A
3022
Brix
ham
Roa
d(n
orth
)
1234
AACC
Arm
2-A
3022B
rixhamR
oad(south)
1 2 3 4
B B B DArm 3 - Goodrington Road
12
EE
Arm 4 - Long Road
123
FFG
Arm
5-
1 2A
rm6
-
Arm 7 -
1Arm 8 -
12
A
B
D

Full Input Data And Results

Full Input Data And Results
Network Results
Item LaneDescription
LaneType
ControllerStream
Position InFiltered Route Full Phase Arrow
PhaseNumGreens
Total Green(s)
ArrowGreen (s)
DemandFlow (pcu)
Sat Flow(pcu/Hr)
Capacity(pcu)
Deg Sat(%)
Network: LongRoad ExistingJunction
- - N/A - - - - - - - - 81.7%
Long RoadJunction - - N/A - - - - - - - - 81.7%
1/1A3022 Brixham
Road (north)Ahead Left
U N/A N/A A 1 41 - 515 1846 646 79.7%
1/2A3022 Brixham
Road (north)Ahead
U N/A N/A A 1 41 - 593 2075 726 81.7%
1/3A3022 Brixham
Road (north)Right
U N/A N/A C 1 14 - 134 1703 213 62.9%
1/4A3022 Brixham
Road (north)Right
U N/A N/A C 1 14 - 141 1771 221 63.7%
2/2+2/1A3022 BrixhamRoad (south)Ahead Left
U N/A N/A B 1 36 - 394 1925:1655 544+75 63.6 :63.6%
2/3+2/4A3022 BrixhamRoad (south)Ahead Right
U N/A N/A B D 1 36:7 - 424 2085:1725 598+61 64.4 :64.4%
3/2+3/1Goodrington
Road Right LeftAhead
U N/A N/A E 1 21 - 271 1887:1629 302+45 78.3 :78.3%
4/1 Long Road Left U N/A N/A F 1 35 - 292 1773 532 54.9%
4/2 Long Road Left U N/A N/A F 1 35 - 329 1931 579 56.8%
4/3 Long Road RightAhead U N/A N/A G 1 23 - 309 1930 386 80.1%
5/1 U N/A N/A - - - - 744 Inf Inf 0.0%
5/2 U N/A N/A - - - - 742 Inf Inf 0.0%
6/1 U N/A N/A - - - - 494 Inf Inf 0.0%
6/2 U N/A N/A - - - - 459 Inf Inf 0.0%
7/1 U N/A N/A - - - - 538 Inf Inf 0.0%

Full Input Data And Results8/1 U N/A N/A - - - - 212 Inf Inf 0.0%
8/2 U N/A N/A - - - - 213 Inf Inf 0.0%
Item Arriving (pcu) Leaving(pcu)
Turners InGaps (pcu)
Turners WhenUnopposed(pcu)
Turners InIntergreen(pcu)
UniformDelay(pcuHr)
Rand +OversatDelay(pcuHr)
Storage AreaUniformDelay(pcuHr)
TotalDelay(pcuHr)
Av. DelayPer PCU(s/pcu)
Max. Back ofUniformQueue (pcu)
Rand +OversatQueue (pcu)
MeanMaxQueue(pcu)
Network: LongRoad ExistingJunction
- - 0 0 0 36.3 12.4 0.0 48.7 - - - -
Long RoadJunction - - 0 0 0 36.3 12.4 0.0 48.7 - - - -
1/1 515 515 - - - 5.0 1.9 - 6.9 48.5 15.5 1.9 17.4
1/2 593 593 - - - 5.8 2.2 - 8.0 48.6 18.0 2.2 20.1
1/3 134 134 - - - 1.9 0.8 - 2.7 72.2 4.2 0.8 5.0
1/4 141 141 - - - 2.0 0.9 - 2.8 71.8 4.5 0.9 5.3
2/2+2/1 394 394 - - - 3.8 0.9 - 4.6 42.4 9.9 0.9 10.8
2/3+2/4 424 424 - - - 4.4 0.9 - 5.3 44.6 11.4 0.9 12.3
3/2+3/1 271 271 - - - 3.5 1.7 - 5.2 69.3 8.3 1.7 10.0
4/1 292 292 - - - 2.9 0.6 - 3.5 42.7 8.1 0.6 8.7
4/2 329 329 - - - 3.2 0.7 - 3.9 42.6 9.2 0.7 9.9
4/3 309 309 - - - 3.9 1.9 - 5.8 68.0 9.8 1.9 11.7
5/1 744 744 - - - 0.0 0.0 - 0.0 0.0 0.0 0.0 0.0
5/2 742 742 - - - 0.0 0.0 - 0.0 0.0 0.0 0.0 0.0
6/1 494 494 - - - 0.0 0.0 - 0.0 0.0 0.0 0.0 0.0
6/2 459 459 - - - 0.0 0.0 - 0.0 0.0 0.0 0.0 0.0
7/1 538 538 - - - 0.0 0.0 - 0.0 0.0 0.0 0.0 0.0
8/1 212 212 - - - 0.0 0.0 - 0.0 0.0 0.0 0.0 0.0
8/2 213 213 - - - 0.0 0.0 - 0.0 0.0 0.0 0.0 0.0
C1 PRC for Signalled Lanes (%): 10.2 Total Delay for Signalled Lanes (pcuHr): 48.75 Cycle Time (s): 120 PRC Over All Lanes (%): 10.2 Total Delay Over All Lanes(pcuHr): 48.75

Full Input Data And ResultsScenario 27: 'TA 2019 AM' (FG35: 'TA 2019 AM', Plan 1: 'Network Control Plan 1')Stage Sequence Diagram
A
B
I
L
N
O
1 Min: 7
8 23s
C
D
F H J
L
N
2 Min: 7
14 13s
F
G
H I J
LM
3 Min: 7
10 7s
E
I J
KN
O
4 Min: 7
14 31s
Stage TimingsStage 1 2 3 4
Duration 23 13 7 31
Change Point 0 31 58 75
Signal Timings Diagram
0
0
10
10
20
20
30
30
40
40
50
50
60
60
70
70
80
80
90
90
100
100
110
110
120
120
Time in cycle (sec)
Phas
es
1 8 : 230
2 14 : 1331
3 10 : 758
4 14 : 3175
O ON NM ML LK KJ JI I
H HG GF FE ED DC CB BA A

Full Input Data And ResultsNetwork Layout Diagram

Full Input Data And Results
Long Road JunctionPRC: -4.3 %Total Traffic Delay: 58.3 pcuHr
C1
0
1
31
2
58
375
4
120
Arm
1-A
3022
Brix
ham
Roa
d(n
orth
)
1234
AACC
Arm
2-A
3022B
rixhamR
oad(south)
1 2 3 4
B B B DArm 3 - Goodrington Road
12
EE
Arm 4 - Long Road
123
FFG
Arm
5-
1 2A
rm6
-
Arm 7 -
1Arm 8 -
12
A
B
D

Full Input Data And Results

Full Input Data And Results
Network Results
Item LaneDescription
LaneType
ControllerStream
Position InFiltered Route Full Phase Arrow
PhaseNumGreens
Total Green(s)
ArrowGreen (s)
DemandFlow (pcu)
Sat Flow(pcu/Hr)
Capacity(pcu)
Deg Sat(%)
Network: LongRoad ExistingJunction
- - N/A - - - - - - - - 93.9%
Long RoadJunction - - N/A - - - - - - - - 93.9%
1/1A3022 Brixham
Road (north)Ahead Left
U N/A N/A A 1 31 - 292 1875 500 58.4%
1/2A3022 Brixham
Road (north)Ahead
U N/A N/A A 1 31 - 339 2075 553 61.3%
1/3A3022 Brixham
Road (north)Right
U N/A N/A C 1 20 - 268 1703 298 89.9%
1/4A3022 Brixham
Road (north)Right
U N/A N/A C 1 20 - 279 1771 310 90.0%
2/2+2/1A3022 BrixhamRoad (south)Ahead Left
U N/A N/A B 1 26 - 444 1925:1655 392+89 92.3 :92.3%
2/3+2/4A3022 BrixhamRoad (south)Ahead Right
U N/A N/A B D 1 26:13 - 444 2085:1725 455+28 91.9 :91.9%
3/2+3/1Goodrington
Road Right LeftAhead
U N/A N/A E 1 33 - 501 1897:1629 511+22 93.9 :93.9%
4/1 Long Road Left U N/A N/A F 1 33 - 98 1773 502 19.5%
4/2 Long Road Left U N/A N/A F 1 33 - 118 1931 547 21.6%
4/3 Long Road RightAhead U N/A N/A G 1 15 - 84 1938 258 32.5%
5/1 U N/A N/A - - - - 613 Inf Inf 0.0%
5/2 U N/A N/A - - - - 612 Inf Inf 0.0%
6/1 U N/A N/A - - - - 294 Inf Inf 0.0%
6/2 U N/A N/A - - - - 274 Inf Inf 0.0%
7/1 U N/A N/A - - - - 194 Inf Inf 0.0%

Full Input Data And Results8/1 U N/A N/A - - - - 439 Inf Inf 0.0%
8/2 U N/A N/A - - - - 441 Inf Inf 0.0%
Item Arriving (pcu) Leaving(pcu)
Turners InGaps (pcu)
Turners WhenUnopposed(pcu)
Turners InIntergreen(pcu)
UniformDelay(pcuHr)
Rand +OversatDelay(pcuHr)
Storage AreaUniformDelay(pcuHr)
TotalDelay(pcuHr)
Av. DelayPer PCU(s/pcu)
Max. Back ofUniformQueue (pcu)
Rand +OversatQueue (pcu)
MeanMaxQueue(pcu)
Network: LongRoad ExistingJunction
- - 0 0 0 34.0 24.3 0.0 58.3 - - - -
Long RoadJunction - - 0 0 0 34.0 24.3 0.0 58.3 - - - -
1/1 292 292 - - - 3.1 0.7 - 3.8 46.8 8.4 0.7 9.1
1/2 339 339 - - - 3.6 0.8 - 4.4 46.9 9.9 0.8 10.7
1/3 268 268 - - - 3.6 3.6 - 7.2 96.8 8.7 3.6 12.3
1/4 279 279 - - - 3.8 3.6 - 7.4 95.6 9.1 3.6 12.7
2/2+2/1 444 444 - - - 5.4 4.8 - 10.2 82.6 12.5 4.8 17.2
2/3+2/4 444 444 - - - 5.6 4.6 - 10.2 82.7 14.1 4.6 18.7
3/2+3/1 501 501 - - - 5.8 5.7 - 11.5 82.9 16.2 5.7 21.9
4/1 98 98 - - - 0.9 0.1 - 1.0 37.1 2.5 0.1 2.6
4/2 118 118 - - - 1.1 0.1 - 1.2 37.0 3.0 0.1 3.1
4/3 84 84 - - - 1.1 0.2 - 1.3 57.4 2.5 0.2 2.8
5/1 613 613 - - - 0.0 0.0 - 0.0 0.0 0.0 0.0 0.0
5/2 612 612 - - - 0.0 0.0 - 0.0 0.0 0.0 0.0 0.0
6/1 294 294 - - - 0.0 0.0 - 0.0 0.0 0.0 0.0 0.0
6/2 274 274 - - - 0.0 0.0 - 0.0 0.0 0.0 0.0 0.0
7/1 194 194 - - - 0.0 0.0 - 0.0 0.0 0.0 0.0 0.0
8/1 439 439 - - - 0.0 0.0 - 0.0 0.0 0.0 0.0 0.0
8/2 441 441 - - - 0.0 0.0 - 0.0 0.0 0.0 0.0 0.0
C1 PRC for Signalled Lanes (%): -4.3 Total Delay for Signalled Lanes (pcuHr): 58.30 Cycle Time (s): 120 PRC Over All Lanes (%): -4.3 Total Delay Over All Lanes(pcuHr): 58.30

Full Input Data And ResultsScenario 28: 'TA 2019 PM' (FG36: 'TA 2019 PM', Plan 1: 'Network Control Plan 1')Stage Sequence Diagram
A
B
I
L
N
O
1 Min: 7
8 34s
C
D
F H J
L
N
2 Min: 7
14 7s
F
G
H I J
LM
3 Min: 7
10 15s
E
I J
KN
O
4 Min: 7
14 18s
Stage TimingsStage 1 2 3 4
Duration 34 7 15 18
Change Point 0 42 63 88
Signal Timings Diagram
0
0
10
10
20
20
30
30
40
40
50
50
60
60
70
70
80
80
90
90
100
100
110
110
120
120
Time in cycle (sec)
Phas
es
1 8 : 340
2 14 : 742
3 10 : 1563
4 14 : 1888
O ON NM ML LK KJ JI I
H HG GF FE ED DC CB BA A

Full Input Data And ResultsNetwork Layout Diagram

Full Input Data And Results
Long Road JunctionPRC: 16.2 %Total Traffic Delay: 43.0 pcuHr
C1
0
1
422
63
388
4
120
Arm
1-A
3022
Brix
ham
Roa
d(n
orth
)
1234
AACC
Arm
2-A
3022B
rixhamR
oad(south)
1 2 3 4
B B B DArm 3 - Goodrington Road
12
EE
Arm 4 - Long Road
123
FFG
Arm
5-
1 2A
rm6
-
Arm 7 -
1Arm 8 -
12
A
B
D

Full Input Data And Results

Full Input Data And Results
Network Results
Item LaneDescription
LaneType
ControllerStream
Position InFiltered Route Full Phase Arrow
PhaseNumGreens
Total Green(s)
ArrowGreen (s)
DemandFlow (pcu)
Sat Flow(pcu/Hr)
Capacity(pcu)
Deg Sat(%)
Network: LongRoad ExistingJunction
- - N/A - - - - - - - - 77.5%
Long RoadJunction - - N/A - - - - - - - - 77.5%
1/1A3022 Brixham
Road (north)Ahead Left
U N/A N/A A 1 42 - 500 1847 662 75.5%
1/2A3022 Brixham
Road (north)Ahead
U N/A N/A A 1 42 - 576 2075 744 77.5%
1/3A3022 Brixham
Road (north)Right
U N/A N/A C 1 14 - 116 1703 213 54.5%
1/4A3022 Brixham
Road (north)Right
U N/A N/A C 1 14 - 123 1771 221 55.6%
2/2+2/1A3022 BrixhamRoad (south)Ahead Left
U N/A N/A B 1 37 - 374 1925:1655 559+75 59.0 :59.0%
2/3+2/4A3022 BrixhamRoad (south)Ahead Right
U N/A N/A B D 1 37:7 - 405 2085:1725 611+65 59.9 :59.9%
3/2+3/1Goodrington
Road Right LeftAhead
U N/A N/A E 1 20 - 249 1887:1629 285+47 75.2 :75.2%
4/1 Long Road Left U N/A N/A F 1 35 - 260 1773 532 48.9%
4/2 Long Road Left U N/A N/A F 1 35 - 298 1931 579 51.4%
4/3 Long Road RightAhead U N/A N/A G 1 23 - 289 1930 386 74.9%
5/1 U N/A N/A - - - - 688 Inf Inf 0.0%
5/2 U N/A N/A - - - - 687 Inf Inf 0.0%
6/1 U N/A N/A - - - - 481 Inf Inf 0.0%
6/2 U N/A N/A - - - - 446 Inf Inf 0.0%
7/1 U N/A N/A - - - - 512 Inf Inf 0.0%

Full Input Data And Results8/1 U N/A N/A - - - - 187 Inf Inf 0.0%
8/2 U N/A N/A - - - - 189 Inf Inf 0.0%
Item Arriving (pcu) Leaving(pcu)
Turners InGaps (pcu)
Turners WhenUnopposed(pcu)
Turners InIntergreen(pcu)
UniformDelay(pcuHr)
Rand +OversatDelay(pcuHr)
Storage AreaUniformDelay(pcuHr)
TotalDelay(pcuHr)
Av. DelayPer PCU(s/pcu)
Max. Back ofUniformQueue (pcu)
Rand +OversatQueue (pcu)
MeanMaxQueue(pcu)
Network: LongRoad ExistingJunction
- - 0 0 0 33.2 9.8 0.0 43.0 - - - -
Long RoadJunction - - 0 0 0 33.2 9.8 0.0 43.0 - - - -
1/1 500 500 - - - 4.7 1.5 - 6.2 44.8 14.6 1.5 16.1
1/2 576 576 - - - 5.5 1.7 - 7.2 44.7 17.0 1.7 18.6
1/3 116 116 - - - 1.6 0.6 - 2.2 67.7 3.6 0.6 4.2
1/4 123 123 - - - 1.7 0.6 - 2.3 67.4 3.8 0.6 4.4
2/2+2/1 374 374 - - - 3.5 0.7 - 4.2 40.2 9.2 0.7 9.9
2/3+2/4 405 405 - - - 4.0 0.7 - 4.8 42.5 10.6 0.7 11.4
3/2+3/1 249 249 - - - 3.2 1.5 - 4.7 67.8 7.5 1.5 8.9
4/1 260 260 - - - 2.5 0.5 - 3.0 41.1 7.1 0.5 7.6
4/2 298 298 - - - 2.9 0.5 - 3.4 41.1 8.2 0.5 8.7
4/3 289 289 - - - 3.6 1.4 - 5.1 63.2 9.0 1.4 10.4
5/1 688 688 - - - 0.0 0.0 - 0.0 0.0 0.0 0.0 0.0
5/2 687 687 - - - 0.0 0.0 - 0.0 0.0 0.0 0.0 0.0
6/1 481 481 - - - 0.0 0.0 - 0.0 0.0 0.0 0.0 0.0
6/2 446 446 - - - 0.0 0.0 - 0.0 0.0 0.0 0.0 0.0
7/1 512 512 - - - 0.0 0.0 - 0.0 0.0 0.0 0.0 0.0
8/1 187 187 - - - 0.0 0.0 - 0.0 0.0 0.0 0.0 0.0
8/2 189 189 - - - 0.0 0.0 - 0.0 0.0 0.0 0.0 0.0
C1 PRC for Signalled Lanes (%): 16.2 Total Delay for Signalled Lanes (pcuHr): 42.96 Cycle Time (s): 120 PRC Over All Lanes (%): 16.2 Total Delay Over All Lanes(pcuHr): 42.96

Full Input Data And ResultsFull Input Data And Results
User and Project DetailsProject: Inglewood
Title: Long Road Junction - KTC proposed highway works
Location: Torbay
File name: Long Road Junction (Possible amendments with additional land0734-040RevB).lsg3x
Author: FF
Company: Key Transport Consultants
Address: 26 Berkeley Square, Bristol, BS8 1HP
Notes:
Network Layout Diagram
Long Road Junction
Arm
1-A
3022
Brix
ham
Roa
d(n
orth
)
1234
1/1
1/2
1/3
1/4
Arm2
-A3022
BrixhamR
oad(south )
1 2 3 4
2/12/22/32/4
Arm 3 - Goodrington Road
12
3/13/2
Arm 4 - Long Road
123
4/14/24/3
Arm
5-
1 25/15/2
Arm
6-
126/
16/
2
Arm 7 -
17/1Arm 8 -
12
8/18/2
A
B
C
D

Full Input Data And Results
Phase Diagram
A
B
C
D
E
F
G
H I J
K
L
M
N
O

Full Input Data And Results
Phase Input DataPhase Name Phase Type Assoc. Phase Street Min Cont Min
A Traffic 7 5
B Traffic 7 7
C Traffic 7 6
D Traffic 7 7
E Traffic 7 7
F Traffic 7 7
G Traffic 7 4
H Pedestrian 7 3
I Pedestrian 7 7
J Pedestrian 7 7
K Pedestrian 7 7
L Pedestrian 7 7
M Pedestrian 7 7
N Pedestrian 7 6
O Pedestrian 7 6

Full Input Data And Results
Phase Intergreens MatrixStarting Phase
TerminatingPhase
A B C D E F G H I J K L M N O
A - - - 6 8 - 5 - - 5 9 - - - -
B - - 5 - 7 8 7 9 - - - - 8 - -
C - 6 - - 6 - 5 - 5 - - - 9 - -
D 6 - - - 6 - 6 - - - 8 - - - -
E 8 8 7 7 - 12 7 12 - - - 6 11 - -
F - 8 - - 12 - - - - - - - - - 5
G 5 7 5 6 8 - - - - - 10 - - 5 -
H - 8 - - 8 - - - - - - - - - -
I - - 8 - - - - - - - - - - - -
J 8 - - - - - - - - - - - - - -
K 8 - - 8 - - 8 - - - - - - - -
L - - - - 10 - - - - - - - - - -
M - 10 10 - 10 - - - - - - - - - -
N - - - - - - 5 - - - - - - - -
O - - - - - 7 - - - - - - - - -
Phases in StageStage No. Phases in Stage
1 A B I L N O
2 C D F H J L N
3 F G H I J L M
4 E I J K N O
Stage DiagramA
B
C
D
E
F
G
H I J
K
LM
N
O
1 Min >= 7 A
B
C
D
E
F
G
H I J
K
LM
N
O
2 Min >= 2 A
B
C
D
E
F
G
H I J
K
LM
N
O
3 Min >= 4 A
B
C
D
E
F
G
H I J
K
LM
N
O
4 Min >= 7

Full Input Data And Results
Phase DelaysTerm. Stage Start Stage Phase Type Value Cont value
1 2 A Losing 8 8
1 2 B Losing 3 3
1 2 O Losing 4 4
1 3 A Losing 8 8
1 3 N Losing 8 8
1 3 O Losing 1 1
1 4 A Losing 2 2
1 4 B Losing 3 3
2 1 C Losing 8 8
2 1 D Losing 2 2
2 1 F Losing 6 6
2 1 H Losing 6 6
2 3 C Losing 1 1
2 3 N Losing 1 1
2 4 C Losing 6 6
2 4 D Losing 6 6
2 4 H Losing 4 4
2 4 L Losing 2 2
3 1 F Losing 8 8
3 1 G Losing 3 3
3 1 H Losing 8 8
3 1 M Losing 6 6
3 2 G Losing 5 5
3 2 I Losing 2 2
3 4 G Losing 4 4
3 4 H Losing 4 4
3 4 L Losing 2 2
3 4 M Losing 2 2
4 2 E Losing 1 1
4 2 O Losing 6 6
4 3 E Losing 1 1
4 3 N Losing 3 3
4 3 O Losing 6 6

Full Input Data And Results
Prohibited Stage ChangeTo Stage
FromStage
1 2 3 4
1 14 13 11
2 14 10 14
3 16 11 14
4 8 13 13

Full Input Data And ResultsGive-Way Lane Input DataJunction: Long Road Junction
There are no Opposed Lanes in this Junction

Full Input Data And ResultsLane Input DataJunction: Long Road Junction
Lane LaneType Phases Start
Disp.EndDisp.
PhysicalLength(PCU)
SatFlowType
Def UserSaturation
Flow(PCU/Hr)
LaneWidth
(m)Gradient Nearside
Lane TurnsTurningRadius
(m)
1/1(A3022 Brixham
Road (north))U A 2 3 60.0 Geom - 3.20 0.00 Y
Arm 6Ahead Inf
Arm 7Left 16.00
1/2(A3022 Brixham
Road (north))U A 2 3 60.0 Geom - 3.20 0.00 N Arm 6
Ahead Inf
1/3(A3022 Brixham
Road (north))U C 2 3 11.0 Geom - 3.05 0.00 Y Arm 8
Right 11.80
1/4(A3022 Brixham
Road (north))U C 2 3 11.0 Geom - 3.05 0.00 N Arm 8
Right 9.20
2/1(A3022 BrixhamRoad (south))
U B 2 3 12.0 Geom - 3.00 0.00 Y Arm 8Left 5.20
2/2(A3022 BrixhamRoad (south))
U B 2 3 60.0 Geom - 3.75 0.00 Y Arm 5Ahead Inf
2/3(A3022 BrixhamRoad (south))
U B 2 3 60.0 Geom - 3.70 0.00 N Arm 5Ahead Inf
2/4(A3022 BrixhamRoad (south))
U D 2 3 13.0 Geom - 3.70 0.00 Y Arm 7Right 10.80
3/1(Goodrington
Road)U E 2 3 10.0 Geom - 3.35 0.00 Y Arm 6
Left 7.60
3/2(Goodrington
Road)U E 2 3 60.0 Geom - 3.35 0.00 Y
Arm 5Right 25.60
Arm 8Ahead Inf
4/1(Long Road) U F 2 3 13.5 Geom - 3.00 0.00 Y Arm 5
Left 18.70
4/2(Long Road) U F 2 3 13.5 Geom - 3.00 0.00 N Arm 5
Left 23.40
4/3(Long Road) U G 2 3 60.0 Geom - 3.50 0.00 Y
Arm 6Right 20.20
Arm 7Ahead Inf
5/1 U 2 3 60.0 Inf - - - - - -
5/2 U 2 3 60.0 Inf - - - - - -
6/1 U 2 3 60.0 Inf - - - - - -
6/2 U 2 3 60.0 Inf - - - - - -
7/1 U 2 3 60.0 Inf - - - - - -
8/1 U 2 3 60.0 Inf - - - - - -
8/2 U 2 3 60.0 Inf - - - - - -

Full Input Data And Results
Traffic Flow GroupsFlow Group Start Time End Time Duration Formula
33: 'TA 2024 + Dev AM' 08:00 09:00 01:00 F31+F3
34: 'TA 2024 + Dev PM' 17:00 18:00 01:00 F32+F4
Scenario 23: 'TA 2024 + Dev AM' (FG33: 'TA 2024 + Dev AM', Plan 1: 'Network Control Plan 1')Traffic Flows, DesiredDesired Flow :
Destination
Origin
A B C D Tot.
A 0 114 607 586 1307
B 237 0 23 261 521
C 891 32 0 84 1007
D 235 72 17 0 324
Tot. 1363 218 647 931 3159
Traffic Lane Flows
LaneScenario 23:
TA 2024 + DevAM
Junction: Long Road Junction
1/1 336
1/2 385
1/3 286
1/4 300
2/1 84
2/2 432
2/3(with short)
491(In)459(Out)
2/4(short) 32
3/1(short) 23
3/2(with short)
521(In)498(Out)
4/1 106
4/2 129
4/3 89
5/1 681
5/2 682
6/1 335
6/2 312
7/1 218
8/1 465
8/2 466

Full Input Data And Results
Lane Saturation FlowsJunction: Long Road Junction
LaneLaneWidth
(m)Gradient Nearside
LaneAllowedTurns
TurningRadius
(m)Turning
Prop.Sat Flow(PCU/Hr)
Flared Sat Flow(PCU/Hr)
1/1(A3022 Brixham Road (north)) 3.20 0.00 Y
Arm 6 Ahead Inf 66.1 %1875 1875
Arm 7 Left 16.00 33.9 %
1/2(A3022 Brixham Road (north)) 3.20 0.00 N Arm 6 Ahead Inf 100.0 % 2075 2075
1/3(A3022 Brixham Road (north)) 3.05 0.00 Y Arm 8 Right 11.80 100.0 % 1703 1703
1/4(A3022 Brixham Road (north)) 3.05 0.00 N Arm 8 Right 9.20 100.0 % 1771 1771
2/1(A3022 Brixham Road (south)) 3.00 0.00 Y Arm 8 Left 5.20 100.0 % 1486 1486
2/2(A3022 Brixham Road (south)) 3.75 0.00 Y Arm 5 Ahead Inf 100.0 % 1990 1990
2/3(A3022 Brixham Road (south)) 3.70 0.00 N Arm 5 Ahead Inf 100.0 % 2125 2125
2/4(A3022 Brixham Road (south)) 3.70 0.00 Y Arm 7 Right 10.80 100.0 % 1743 1743
3/1(Goodrington Road) 3.35 0.00 Y Arm 6 Left 7.60 100.0 % 1629 1629
3/2(Goodrington Road) 3.35 0.00 Y
Arm 5 Right 25.60 47.6 %1897 1897
Arm 8 Ahead Inf 52.4 %
4/1(Long Road) 3.00 0.00 Y Arm 5 Left 18.70 100.0 % 1773 1773
4/2(Long Road) 3.00 0.00 N Arm 5 Left 23.40 100.0 % 1931 1931
4/3(Long Road) 3.50 0.00 Y
Arm 6 Right 20.20 19.1 %1938 1938
Arm 7 Ahead Inf 80.9 %
5/1 Infinite Saturation Flow Inf Inf
5/2 Infinite Saturation Flow Inf Inf
6/1 Infinite Saturation Flow Inf Inf
6/2 Infinite Saturation Flow Inf Inf
7/1 Infinite Saturation Flow Inf Inf
8/1 Infinite Saturation Flow Inf Inf
8/2 Infinite Saturation Flow Inf Inf

Full Input Data And Results
Scenario 24: 'TA 2024 + Dev PM' (FG34: 'TA 2024 + Dev PM', Plan 1: 'Network Control Plan 1')Traffic Flows, DesiredDesired Flow :
Destination
Origin
A B C D Tot.
A 0 265 930 275 1470
B 134 0 41 102 277
C 784 43 0 48 875
D 621 234 75 0 930
Tot. 1539 542 1046 425 3552
Traffic Lane Flows
LaneScenario 24:
TA 2024 + DevPM
Junction: Long Road Junction
1/1 557
1/2 638
1/3 134
1/4 141
2/1 48
2/2 376
2/3(with short)
451(In)408(Out)
2/4(short) 43
3/1(short) 41
3/2(with short)
277(In)236(Out)
4/1 292
4/2 329
4/3 309
5/1 770
5/2 769
6/1 544
6/2 502
7/1 542
8/1 212
8/2 213

Full Input Data And Results
Lane Saturation FlowsJunction: Long Road Junction
LaneLaneWidth
(m)Gradient Nearside
LaneAllowedTurns
TurningRadius
(m)Turning
Prop.Sat Flow(PCU/Hr)
Flared Sat Flow(PCU/Hr)
1/1(A3022 Brixham Road (north)) 3.20 0.00 Y
Arm 6 Ahead Inf 52.4 %1852 1852
Arm 7 Left 16.00 47.6 %
1/2(A3022 Brixham Road (north)) 3.20 0.00 N Arm 6 Ahead Inf 100.0 % 2075 2075
1/3(A3022 Brixham Road (north)) 3.05 0.00 Y Arm 8 Right 11.80 100.0 % 1703 1703
1/4(A3022 Brixham Road (north)) 3.05 0.00 N Arm 8 Right 9.20 100.0 % 1771 1771
2/1(A3022 Brixham Road (south)) 3.00 0.00 Y Arm 8 Left 5.20 100.0 % 1486 1486
2/2(A3022 Brixham Road (south)) 3.75 0.00 Y Arm 5 Ahead Inf 100.0 % 1990 1990
2/3(A3022 Brixham Road (south)) 3.70 0.00 N Arm 5 Ahead Inf 100.0 % 2125 2125
2/4(A3022 Brixham Road (south)) 3.70 0.00 Y Arm 7 Right 10.80 100.0 % 1743 1743
3/1(Goodrington Road) 3.35 0.00 Y Arm 6 Left 7.60 100.0 % 1629 1629
3/2(Goodrington Road) 3.35 0.00 Y
Arm 5 Right 25.60 56.8 %1887 1887
Arm 8 Ahead Inf 43.2 %
4/1(Long Road) 3.00 0.00 Y Arm 5 Left 18.70 100.0 % 1773 1773
4/2(Long Road) 3.00 0.00 N Arm 5 Left 23.40 100.0 % 1931 1931
4/3(Long Road) 3.50 0.00 Y
Arm 6 Right 20.20 24.3 %1930 1930
Arm 7 Ahead Inf 75.7 %
5/1 Infinite Saturation Flow Inf Inf
5/2 Infinite Saturation Flow Inf Inf
6/1 Infinite Saturation Flow Inf Inf
6/2 Infinite Saturation Flow Inf Inf
7/1 Infinite Saturation Flow Inf Inf
8/1 Infinite Saturation Flow Inf Inf
8/2 Infinite Saturation Flow Inf Inf
Scenario 23: 'TA 2024 + Dev AM' (FG33: 'TA 2024 + Dev AM', Plan 1: 'Network Control Plan 1')Stage Sequence Diagram
A
B
I
L
N
O
1 Min: 7
8 23s
C
D
F H J
L
N
2 Min: 7
14 13s
F
G
H I J
LM
3 Min: 7
10 7s
E
I J
KN
O
4 Min: 7
14 31s

Full Input Data And Results
Stage TimingsStage 1 2 3 4
Duration 23 13 7 31
Change Point 0 31 58 75
Signal Timings Diagram
0
0
10
10
20
20
30
30
40
40
50
50
60
60
70
70
80
80
90
90
100
100
110
110
120
120
Time in cycle (sec)
Phas
es
1 8 : 230
2 14 : 1331
3 10 : 758
4 14 : 3175
O ON NM ML LK KJ JI I
H HG GF FE ED DC CB BA A

Full Input Data And ResultsNetwork Layout Diagram

Full Input Data And Results
Long Road JunctionPRC: -8.1 %Total Traffic Delay: 75.1 pcuHr
C1
0
1
31
2
58
375
4
120
Arm
1-A
3022
Brix
ham
Roa
d(n
orth
)
1234
AACC
Arm
2-A
3022B
rixhamR
oad(south)
1 2 3 4
B B B DArm 3 - Goodrington Road
12
EE
Arm 4 - Long Road
123
FFG
Arm
5-
1 2A
rm6
-
Arm 7 -
1Arm 8 -
12
A
B
D

Full Input Data And Results
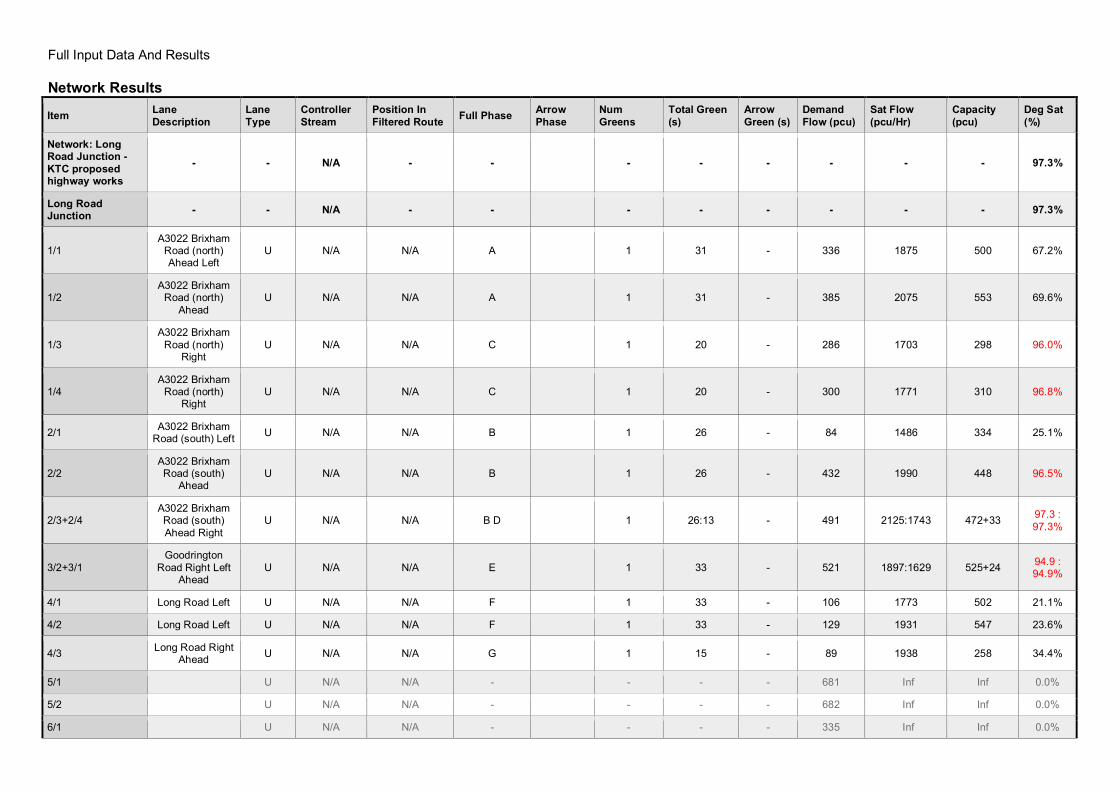
Full Input Data And Results
Network Results
Item LaneDescription
LaneType
ControllerStream
Position InFiltered Route Full Phase Arrow
PhaseNumGreens
Total Green(s)
ArrowGreen (s)
DemandFlow (pcu)
Sat Flow(pcu/Hr)
Capacity(pcu)
Deg Sat(%)
Network: LongRoad Junction -KTC proposedhighway works
- - N/A - - - - - - - - 97.3%
Long RoadJunction - - N/A - - - - - - - - 97.3%
1/1A3022 Brixham
Road (north)Ahead Left
U N/A N/A A 1 31 - 336 1875 500 67.2%
1/2A3022 Brixham
Road (north)Ahead
U N/A N/A A 1 31 - 385 2075 553 69.6%
1/3A3022 Brixham
Road (north)Right
U N/A N/A C 1 20 - 286 1703 298 96.0%
1/4A3022 Brixham
Road (north)Right
U N/A N/A C 1 20 - 300 1771 310 96.8%
2/1 A3022 BrixhamRoad (south) Left U N/A N/A B 1 26 - 84 1486 334 25.1%
2/2A3022 BrixhamRoad (south)
AheadU N/A N/A B 1 26 - 432 1990 448 96.5%
2/3+2/4A3022 BrixhamRoad (south)Ahead Right
U N/A N/A B D 1 26:13 - 491 2125:1743 472+33 97.3 :97.3%
3/2+3/1Goodrington
Road Right LeftAhead
U N/A N/A E 1 33 - 521 1897:1629 525+24 94.9 :94.9%
4/1 Long Road Left U N/A N/A F 1 33 - 106 1773 502 21.1%
4/2 Long Road Left U N/A N/A F 1 33 - 129 1931 547 23.6%
4/3 Long Road RightAhead U N/A N/A G 1 15 - 89 1938 258 34.4%
5/1 U N/A N/A - - - - 681 Inf Inf 0.0%
5/2 U N/A N/A - - - - 682 Inf Inf 0.0%
6/1 U N/A N/A - - - - 335 Inf Inf 0.0%

Full Input Data And Results6/2 U N/A N/A - - - - 312 Inf Inf 0.0%
7/1 U N/A N/A - - - - 218 Inf Inf 0.0%
8/1 U N/A N/A - - - - 465 Inf Inf 0.0%
8/2 U N/A N/A - - - - 466 Inf Inf 0.0%
Item Arriving (pcu) Leaving(pcu)
Turners InGaps (pcu)
Turners WhenUnopposed(pcu)
Turners InIntergreen(pcu)
UniformDelay(pcuHr)
Rand +OversatDelay(pcuHr)
StorageAreaUniformDelay(pcuHr)
TotalDelay(pcuHr)
Av. DelayPer PCU(s/pcu)
Max. Back ofUniformQueue (pcu)
Rand +OversatQueue(pcu)
MeanMaxQueue(pcu)
Network: LongRoad Junction -KTC proposedhighway works
- - 0 0 0 38.0 37.1 0.0 75.1 - - - -
Long RoadJunction - - 0 0 0 38.0 37.1 0.0 75.1 - - - -
1/1 336 336 - - - 3.7 1.0 - 4.7 50.2 10.0 1.0 11.0
1/2 385 385 - - - 4.2 1.1 - 5.4 50.2 11.5 1.1 12.7
1/3 286 286 - - - 3.9 6.0 - 9.9 124.2 9.4 6.0 15.3
1/4 300 300 - - - 4.1 6.5 - 10.6 127.5 9.9 6.5 16.4
2/1 84 84 - - - 0.9 0.2 - 1.1 45.4 2.3 0.2 2.5
2/2 432 432 - - - 5.5 7.2 - 12.7 105.8 14.2 7.2 21.3
2/3+2/4 491 491 - - - 6.3 8.2 - 14.5 106.3 15.2 8.2 23.4
3/2+3/1 521 521 - - - 6.0 6.4 - 12.4 85.7 16.5 6.4 22.8
4/1 106 106 - - - 1.0 0.1 - 1.1 37.3 2.7 0.1 2.8
4/2 129 129 - - - 1.2 0.2 - 1.3 37.3 3.3 0.2 3.5
4/3 89 89 - - - 1.2 0.3 - 1.4 57.8 2.7 0.3 3.0
5/1 681 681 - - - 0.0 0.0 - 0.0 0.0 0.0 0.0 0.0
5/2 682 682 - - - 0.0 0.0 - 0.0 0.0 0.0 0.0 0.0
6/1 335 335 - - - 0.0 0.0 - 0.0 0.0 0.0 0.0 0.0
6/2 312 312 - - - 0.0 0.0 - 0.0 0.0 0.0 0.0 0.0
7/1 218 218 - - - 0.0 0.0 - 0.0 0.0 0.0 0.0 0.0
8/1 465 465 - - - 0.0 0.0 - 0.0 0.0 0.0 0.0 0.0
8/2 466 466 - - - 0.0 0.0 - 0.0 0.0 0.0 0.0 0.0
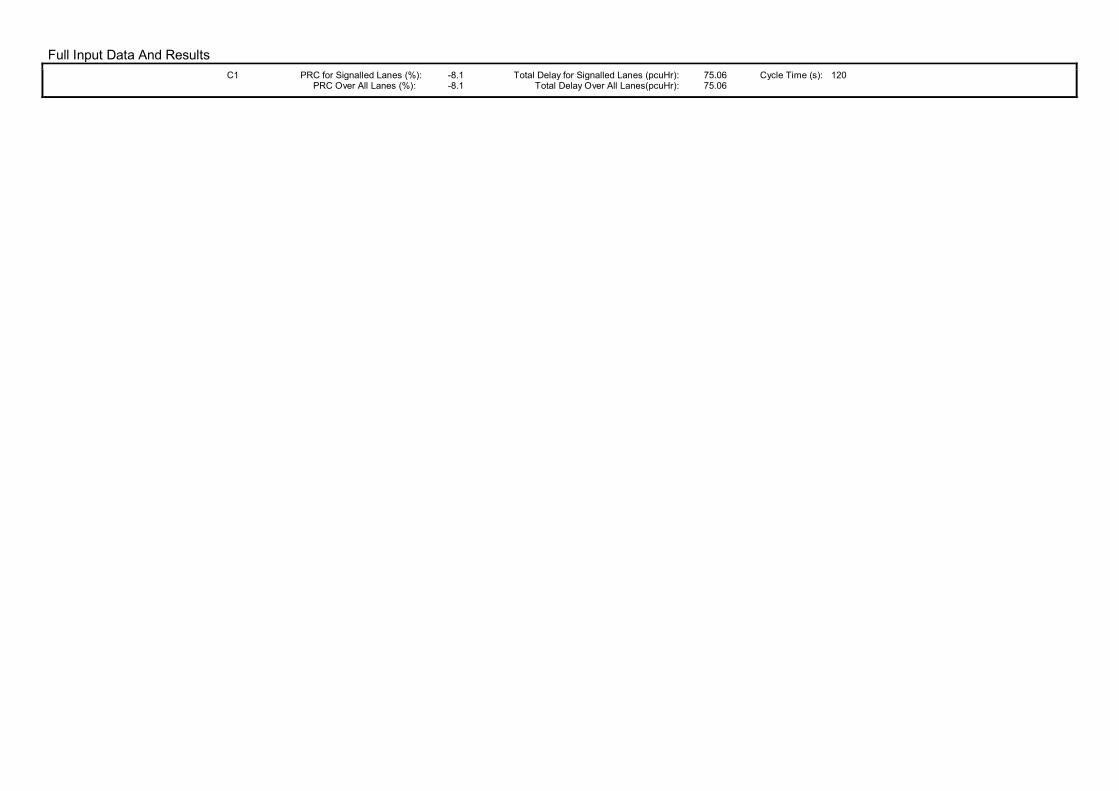
Full Input Data And ResultsC1 PRC for Signalled Lanes (%): -8.1 Total Delay for Signalled Lanes (pcuHr): 75.06 Cycle Time (s): 120
PRC Over All Lanes (%): -8.1 Total Delay Over All Lanes(pcuHr): 75.06

Full Input Data And ResultsScenario 24: 'TA 2024 + Dev PM' (FG34: 'TA 2024 + Dev PM', Plan 1: 'Network Control Plan 1')Stage Sequence Diagram
A
B
I
L
N
O
1 Min: 7
8 36s
C
D
F H J
L
N
2 Min: 7
14 7s
F
G
H I J
LM
3 Min: 7
10 15s
E
I J
KN
O
4 Min: 7
14 16s
Stage TimingsStage 1 2 3 4
Duration 36 7 15 16
Change Point 0 44 65 90
Signal Timings Diagram
0
0
10
10
20
20
30
30
40
40
50
50
60
60
70
70
80
80
90
90
100
100
110
110
120
120
Time in cycle (sec)
Phas
es
1 8 : 360
2 14 : 744
3 10 : 1565
4 14 : 1690
O ON NM ML LK KJ JI I
H HG GF FE ED DC CB BA A

Full Input Data And ResultsNetwork Layout Diagram

Full Input Data And Results
Long Road JunctionPRC: 9.8 %Total Traffic Delay: 49.2 pcuHr
C1
0
1
442
65
390
4
120
Arm
1-A
3022
Brix
ham
Roa
d(n
orth
)
1234
AACC
Arm
2-A
3022B
rixhamR
oad(south)
1 2 3 4
B B B DArm 3 - Goodrington Road
12
EE
Arm 4 - Long Road
123
FFG
Arm
5-
1 2A
rm6
-
Arm 7 -
1Arm 8 -
12
A
B
D

Full Input Data And Results

Full Input Data And Results
Network Results
Item LaneDescription
LaneType
ControllerStream
Position InFiltered Route Full Phase Arrow
PhaseNumGreens
Total Green(s)
ArrowGreen (s)
DemandFlow (pcu)
Sat Flow(pcu/Hr)
Capacity(pcu)
Deg Sat(%)
Network: LongRoad Junction -KTC proposedhighway works
- - N/A - - - - - - - - 82.0%
Long RoadJunction - - N/A - - - - - - - - 82.0%
1/1A3022 Brixham
Road (north)Ahead Left
U N/A N/A A 1 44 - 557 1852 694 80.2%
1/2A3022 Brixham
Road (north)Ahead
U N/A N/A A 1 44 - 638 2075 778 82.0%
1/3A3022 Brixham
Road (north)Right
U N/A N/A C 1 14 - 134 1703 213 62.9%
1/4A3022 Brixham
Road (north)Right
U N/A N/A C 1 14 - 141 1771 221 63.7%
2/1 A3022 BrixhamRoad (south) Left U N/A N/A B 1 39 - 48 1486 495 9.7%
2/2A3022 BrixhamRoad (south)
AheadU N/A N/A B 1 39 - 376 1990 663 56.7%
2/3+2/4A3022 BrixhamRoad (south)Ahead Right
U N/A N/A B D 1 39:7 - 451 2125:1743 672+71 60.7 :60.7%
3/2+3/1Goodrington
Road Right LeftAhead
U N/A N/A E 1 18 - 277 1887:1629 299+52 79.0 :79.0%
4/1 Long Road Left U N/A N/A F 1 35 - 292 1773 532 54.9%
4/2 Long Road Left U N/A N/A F 1 35 - 329 1931 579 56.8%
4/3 Long Road RightAhead U N/A N/A G 1 23 - 309 1930 386 80.1%
5/1 U N/A N/A - - - - 770 Inf Inf 0.0%
5/2 U N/A N/A - - - - 769 Inf Inf 0.0%
6/1 U N/A N/A - - - - 544 Inf Inf 0.0%

Full Input Data And Results6/2 U N/A N/A - - - - 502 Inf Inf 0.0%
7/1 U N/A N/A - - - - 542 Inf Inf 0.0%
8/1 U N/A N/A - - - - 212 Inf Inf 0.0%
8/2 U N/A N/A - - - - 213 Inf Inf 0.0%
Item Arriving (pcu) Leaving(pcu)
Turners InGaps (pcu)
Turners WhenUnopposed(pcu)
Turners InIntergreen(pcu)
UniformDelay(pcuHr)
Rand +OversatDelay(pcuHr)
StorageAreaUniformDelay(pcuHr)
TotalDelay(pcuHr)
Av. DelayPer PCU(s/pcu)
Max. Back ofUniformQueue (pcu)
Rand +OversatQueue(pcu)
MeanMaxQueue(pcu)
Network: LongRoad Junction -KTC proposedhighway works
- - 0 0 0 36.9 12.3 0.0 49.2 - - - -
Long RoadJunction - - 0 0 0 36.9 12.3 0.0 49.2 - - - -
1/1 557 557 - - - 5.2 2.0 - 7.2 46.2 16.6 2.0 18.5
1/2 638 638 - - - 6.0 2.2 - 8.2 46.3 19.1 2.2 21.3
1/3 134 134 - - - 1.9 0.8 - 2.7 72.2 4.2 0.8 5.0
1/4 141 141 - - - 2.0 0.9 - 2.8 71.8 4.5 0.9 5.3
2/1 48 48 - - - 0.4 0.1 - 0.4 31.6 1.1 0.1 1.1
2/2 376 376 - - - 3.4 0.7 - 4.1 39.1 10.2 0.7 10.9
2/3+2/4 451 451 - - - 4.4 0.8 - 5.1 41.1 11.2 0.8 12.0
3/2+3/1 277 277 - - - 3.7 1.8 - 5.5 71.2 7.5 1.8 9.3
4/1 292 292 - - - 2.9 0.6 - 3.5 42.7 8.1 0.6 8.7
4/2 329 329 - - - 3.2 0.7 - 3.9 42.6 9.2 0.7 9.9
4/3 309 309 - - - 3.9 1.9 - 5.8 68.0 9.8 1.9 11.7
5/1 770 770 - - - 0.0 0.0 - 0.0 0.0 0.0 0.0 0.0
5/2 769 769 - - - 0.0 0.0 - 0.0 0.0 0.0 0.0 0.0
6/1 544 544 - - - 0.0 0.0 - 0.0 0.0 0.0 0.0 0.0
6/2 502 502 - - - 0.0 0.0 - 0.0 0.0 0.0 0.0 0.0
7/1 542 542 - - - 0.0 0.0 - 0.0 0.0 0.0 0.0 0.0
8/1 212 212 - - - 0.0 0.0 - 0.0 0.0 0.0 0.0 0.0
8/2 213 213 - - - 0.0 0.0 - 0.0 0.0 0.0 0.0 0.0

Full Input Data And ResultsC1 PRC for Signalled Lanes (%): 9.8 Total Delay for Signalled Lanes (pcuHr): 49.18 Cycle Time (s): 120
PRC Over All Lanes (%): 9.8 Total Delay Over All Lanes(pcuHr): 49.18

Full Input Data And ResultsFull Input Data And Results
User and Project DetailsProject: Inglewood
Title: White Rock Junction
Location: Torbay
File name: White Rock Junction.lsg3x
Author: FF
Company: Key Transport Consultants
Address: 26 Berkeley Square, Bristol, BS8 1HP
Notes:
Network Layout Diagram
White Rock Junction
Arm
1-A
3022
Brix
h am
Roa
d(n
orth
)
123
1/1
1/2
1/3
Arm2
-A3022
Brixham
Road
(south)
1 2 3
2/12/22/3
Arm 3 - Kingsway Avenue
1 3/1
Arm 4 - White Rock
12
4/14/2
Arm5
-
1 25/15/2
Arm
6-
126/
16/
2
Arm 7 -
17/1Arm 8 -
1 8/1
A
B
C
D

Full Input Data And Results
Phase Diagram
A
B
C
D
E
F
G H I
J
K
LMN
O
Phase Input DataPhase Name Phase Type Assoc. Phase Street Min Cont Min
A Traffic 7 7
B Traffic 7 7
C Traffic 7 5
D Traffic 7 6
E Traffic 7 7
F Traffic 7 6
G Pedestrian 7 7
H Pedestrian 7 7
I Pedestrian 7 7
J Pedestrian 7 7
K Pedestrian 7 7
L Pedestrian 7 7
M Pedestrian 7 7
N Pedestrian 7 7
O Pedestrian 7 7

Full Input Data And Results
Phase Intergreens MatrixStarting Phase
TerminatingPhase
A B C D E F G H I J K L M N O
A - - - 5 6 5 - - 5 8 12 - - - -
B - - 6 - 5 7 12 - - - - - 5 9 -
C - 6 - - 5 5 - 5 - - - - - 11 -
D 6 - - - 7 5 - - - 10 - 5 - - -
E 5 5 5 6 - 7 11 - - 5 10 - - 11 -
F 5 7 5 5 6 - 10 - - 10 12 - - - 5
G - 8 - - 8 8 - - - - - - - - -
H - - 5 - - - - - - - - - - - -
I 8 - - - - - - - - - - - - - -
J 10 - - 10 10 10 - - - - - - - - -
K 8 - - - 8 8 - - - - - - - - -
L - - - 5 - - - - - - - - - - -
M - 8 - - - - - - - - - - - - -
N - 7 7 - 7 - - - - - - - - - -
O - - - - - 8 - - - - - - - - -
Phases in StageStage No. Phases in Stage
1 A B H L O
2 C D G I K M O
3 E H I L M O
4 F H I L M N
Stage DiagramA
B
C
D
E
FG H I
J
K
LMN
O
1 Min >= 7 A
B
C
D
E
FG H I
J
K
LMN
O
2 Min >= 7 A
B
C
D
E
FG H I
J
K
LMN
O
3 Min >= 7 A
B
C
D
E
FG H I
J
K
LMN
O
4 Min >= 7

Full Input Data And Results
Phase DelaysTerm. Stage Start Stage Phase Type Value Cont value
1 2 H Losing 1 1
1 3 B Losing 1 1
1 4 A Losing 3 3
1 4 B Losing 1 1
2 1 C Losing 2 2
2 1 D Losing 2 2
2 3 C Losing 3 3
2 3 D Losing 1 1
2 4 C Losing 3 3
2 4 D Losing 3 3
3 1 E Losing 3 3
3 2 L Losing 1 1
3 4 E Losing 1 1
4 1 F Losing 3 3
4 1 M Losing 2 2
4 1 N Losing 3 3
4 2 F Losing 2 2
4 2 H Losing 2 2
4 2 L Losing 2 2
4 3 F Losing 1 1
Prohibited Stage ChangeTo Stage
FromStage
1 2 3 4
1 12 6 10
2 8 8 14
3 8 11 12
4 10 14 7

Full Input Data And ResultsGive-Way Lane Input DataJunction: White Rock Junction
There are no Opposed Lanes in this Junction

Full Input Data And ResultsLane Input DataJunction: White Rock Junction
Lane LaneType Phases Start
Disp.EndDisp.
PhysicalLength(PCU)
SatFlowType
Def UserSaturation
Flow(PCU/Hr)
LaneWidth
(m)Gradient Nearside
Lane TurnsTurningRadius
(m)
1/1(A3022
Brixham Road(north))
U A 2 3 60.0 Geom - 3.58 0.00 Y
Arm 6Ahead Inf
Arm 7Left 10.50
1/2(A3022
Brixham Road(north))
U A 2 3 60.0 Geom - 3.43 0.00 N Arm 6Ahead Inf
1/3(A3022
Brixham Road(north))
U C 2 3 9.0 Geom - 2.95 0.00 Y Arm 8Right 13.50
2/1(A3022
Brixham Road(south))
U B 2 3 60.0 Geom - 3.50 0.00 Y
Arm 5Ahead Inf
Arm 8Left 15.60
2/2(A3022
Brixham Road(south))
U B 2 3 8.0 Geom - 3.42 0.00 N Arm 5Ahead Inf
2/3(A3022
Brixham Road(south))
U D 2 3 5.0 Geom - 3.17 0.00 Y Arm 7Right 14.30
3/1(KingswayAvenue)
U E 2 3 60.0 Geom - 3.02 0.00 Y
Arm 5Right 23.00
Arm 6Left 10.20
Arm 8Ahead Inf
4/1(White Rock) U F 2 3 60.0 Geom - 2.93 0.00 Y
Arm 5Left 11.80
Arm 7Ahead Inf
4/2(White Rock) U F 2 3 3.0 Geom - 3.20 0.00 Y Arm 6
Right 22.80
5/1 U 2 3 60.0 Inf - - - - - -
5/2 U 2 3 60.0 Inf - - - - - -
6/1 U 2 3 60.0 Inf - - - - - -
6/2 U 2 3 60.0 Inf - - - - - -
7/1 U 2 3 60.0 Inf - - - - - -
8/1 U 2 3 60.0 Inf - - - - - -

Full Input Data And Results
Traffic Flow GroupsFlow Group Start Time End Time Duration Formula
1: '2017 Base AM' 08:00 09:00 01:00
2: '2017 Base PM' 17:00 18:00 01:00
31: 'TA 2019 AM' 08:00 09:00 01:00 F1+F11
32: 'TA 2019 PM' 17:00 18:00 01:00 F2+F12
33: 'TA 2024 AM' 08:00 09:00 01:00 F1+F13
34: 'TA 2024 PM' 17:00 18:00 01:00 F2+F14
35: 'TA 2024 + Dev AM' 08:00 09:00 01:00 F33+F3
36: 'TA 2024 + Dev PM' 17:00 18:00 01:00 F34+F4
Scenario 1: '2017 Base AM' (FG1: '2017 Base AM', Plan 1: 'Network Control Plan 1')Traffic Flows, DesiredDesired Flow :
Destination
Origin
A B C D Tot.
A 0 22 455 6 483
B 32 0 13 8 53
C 747 10 0 34 791
D 18 8 14 0 40
Tot. 797 40 482 48 1367

Full Input Data And Results
Traffic Lane Flows
Lane Scenario 1:2017 Base AM
Junction: White Rock Junction
1/1 222
1/2 255
1/3 6
2/1 376
2/2(with short)
415(In)405(Out)
2/3(short) 10
3/1 53
4/1 26
4/2 14
5/1 398
5/2 399
6/1 247
6/2 235
7/1 40
8/1 48

Full Input Data And Results
Lane Saturation FlowsJunction: White Rock Junction
LaneLaneWidth
(m)Gradient Nearside
LaneAllowedTurns
TurningRadius
(m)Turning
Prop.Sat Flow(PCU/Hr)
Flared Sat Flow(PCU/Hr)
1/1(A3022 Brixham Road (north)) 3.58 0.00 Y
Arm 6 Ahead Inf 90.1 %1945 1945
Arm 7 Left 10.50 9.9 %
1/2(A3022 Brixham Road (north)) 3.43 0.00 N Arm 6 Ahead Inf 100.0 % 2098 2098
1/3(A3022 Brixham Road (north)) 2.95 0.00 Y Arm 8 Right 13.50 100.0 % 1719 1719
2/1(A3022 Brixham Road (south)) 3.50 0.00 Y
Arm 5 Ahead Inf 91.0 %1948 1948
Arm 8 Left 15.60 9.0 %
2/2(A3022 Brixham Road (south)) 3.42 0.00 N Arm 5 Ahead Inf 100.0 % 2097 2097
2/3(A3022 Brixham Road (south)) 3.17 0.00 Y Arm 7 Right 14.30 100.0 % 1749 1749
3/1(Kingsway Avenue) 3.02 0.00 Y
Arm 5 Right 23.00 60.4 %
1783 1783Arm 6 Left 10.20 24.5 %
Arm 8 Ahead Inf 15.1 %
4/1(White Rock) 2.93 0.00 Y
Arm 5 Left 11.80 69.2 %1754 1754
Arm 7 Ahead Inf 30.8 %
4/2(White Rock) 3.20 0.00 Y Arm 6 Right 22.80 100.0 % 1816 1816
5/1 Infinite Saturation Flow Inf Inf
5/2 Infinite Saturation Flow Inf Inf
6/1 Infinite Saturation Flow Inf Inf
6/2 Infinite Saturation Flow Inf Inf
7/1 Infinite Saturation Flow Inf Inf
8/1 Infinite Saturation Flow Inf Inf
Scenario 2: '2017 Base PM' (FG2: '2017 Base PM', Plan 1: 'Network Control Plan 1')Traffic Flows, DesiredDesired Flow :
Destination
Origin
A B C D Tot.
A 0 39 763 17 819
B 22 0 4 8 34
C 610 6 0 13 629
D 23 7 17 0 47
Tot. 655 52 784 38 1529

Full Input Data And Results
Traffic Lane Flows
Lane Scenario 2:2017 Base PM
Junction: White Rock Junction
1/1 379
1/2 423
1/3 17
2/1 299
2/2(with short)
330(In)324(Out)
2/3(short) 6
3/1 34
4/1 30
4/2 17
5/1 328
5/2 327
6/1 395
6/2 389
7/1 52
8/1 38

Full Input Data And Results
Lane Saturation FlowsJunction: White Rock Junction
LaneLaneWidth
(m)Gradient Nearside
LaneAllowedTurns
TurningRadius
(m)Turning
Prop.Sat Flow(PCU/Hr)
Flared Sat Flow(PCU/Hr)
1/1(A3022 Brixham Road (north)) 3.58 0.00 Y
Arm 6 Ahead Inf 89.7 %1944 1944
Arm 7 Left 10.50 10.3 %
1/2(A3022 Brixham Road (north)) 3.43 0.00 N Arm 6 Ahead Inf 100.0 % 2098 2098
1/3(A3022 Brixham Road (north)) 2.95 0.00 Y Arm 8 Right 13.50 100.0 % 1719 1719
2/1(A3022 Brixham Road (south)) 3.50 0.00 Y
Arm 5 Ahead Inf 95.7 %1957 1957
Arm 8 Left 15.60 4.3 %
2/2(A3022 Brixham Road (south)) 3.42 0.00 N Arm 5 Ahead Inf 100.0 % 2097 2097
2/3(A3022 Brixham Road (south)) 3.17 0.00 Y Arm 7 Right 14.30 100.0 % 1749 1749
3/1(Kingsway Avenue) 3.02 0.00 Y
Arm 5 Right 23.00 64.7 %
1809 1809Arm 6 Left 10.20 11.8 %
Arm 8 Ahead Inf 23.5 %
4/1(White Rock) 2.93 0.00 Y
Arm 5 Left 11.80 76.7 %1739 1739
Arm 7 Ahead Inf 23.3 %
4/2(White Rock) 3.20 0.00 Y Arm 6 Right 22.80 100.0 % 1816 1816
5/1 Infinite Saturation Flow Inf Inf
5/2 Infinite Saturation Flow Inf Inf
6/1 Infinite Saturation Flow Inf Inf
6/2 Infinite Saturation Flow Inf Inf
7/1 Infinite Saturation Flow Inf Inf
8/1 Infinite Saturation Flow Inf Inf
Scenario 23: 'TA 2019 AM' (FG31: 'TA 2019 AM', Plan 1: 'Network Control Plan 1')Traffic Flows, DesiredDesired Flow :
Destination
Origin
A B C D Tot.
A 0 23 466 80 569
B 33 0 13 8 54
C 759 10 0 197 966
D 97 8 62 0 167
Tot. 889 41 541 285 1756

Full Input Data And Results
Traffic Lane Flows
Lane Scenario 23:TA 2019 AM
Junction: White Rock Junction
1/1 229
1/2 260
1/3 80
2/1 451
2/2(with short)
515(In)505(Out)
2/3(short) 10
3/1 54
4/1 105
4/2 62
5/1 445
5/2 444
6/1 277
6/2 264
7/1 41
8/1 285

Full Input Data And Results
Lane Saturation FlowsJunction: White Rock Junction
LaneLaneWidth
(m)Gradient Nearside
LaneAllowedTurns
TurningRadius
(m)Turning
Prop.Sat Flow(PCU/Hr)
Flared Sat Flow(PCU/Hr)
1/1(A3022 Brixham Road (north)) 3.58 0.00 Y
Arm 6 Ahead Inf 90.0 %1945 1945
Arm 7 Left 10.50 10.0 %
1/2(A3022 Brixham Road (north)) 3.43 0.00 N Arm 6 Ahead Inf 100.0 % 2098 2098
1/3(A3022 Brixham Road (north)) 2.95 0.00 Y Arm 8 Right 13.50 100.0 % 1719 1719
2/1(A3022 Brixham Road (south)) 3.50 0.00 Y
Arm 5 Ahead Inf 56.3 %1886 1886
Arm 8 Left 15.60 43.7 %
2/2(A3022 Brixham Road (south)) 3.42 0.00 N Arm 5 Ahead Inf 100.0 % 2097 2097
2/3(A3022 Brixham Road (south)) 3.17 0.00 Y Arm 7 Right 14.30 100.0 % 1749 1749
3/1(Kingsway Avenue) 3.02 0.00 Y
Arm 5 Right 23.00 61.1 %
1783 1783Arm 6 Left 10.20 24.1 %
Arm 8 Ahead Inf 14.8 %
4/1(White Rock) 2.93 0.00 Y
Arm 5 Left 11.80 92.4 %1707 1707
Arm 7 Ahead Inf 7.6 %
4/2(White Rock) 3.20 0.00 Y Arm 6 Right 22.80 100.0 % 1816 1816
5/1 Infinite Saturation Flow Inf Inf
5/2 Infinite Saturation Flow Inf Inf
6/1 Infinite Saturation Flow Inf Inf
6/2 Infinite Saturation Flow Inf Inf
7/1 Infinite Saturation Flow Inf Inf
8/1 Infinite Saturation Flow Inf Inf
Scenario 24: 'TA 2019 PM' (FG32: 'TA 2019 PM', Plan 1: 'Network Control Plan 1')Traffic Flows, DesiredDesired Flow :
Destination
Origin
A B C D Tot.
A 0 40 782 108 930
B 23 0 4 8 35
C 637 6 0 109 752
D 136 7 130 0 273
Tot. 796 53 916 225 1990

Full Input Data And Results
Traffic Lane Flows
Lane Scenario 24:TA 2019 PM
Junction: White Rock Junction
1/1 388
1/2 434
1/3 108
2/1 353
2/2(with short)
399(In)393(Out)
2/3(short) 6
3/1 35
4/1 143
4/2 130
5/1 398
5/2 398
6/1 460
6/2 456
7/1 53
8/1 225

Full Input Data And Results
Lane Saturation FlowsJunction: White Rock Junction
LaneLaneWidth
(m)Gradient Nearside
LaneAllowedTurns
TurningRadius
(m)Turning
Prop.Sat Flow(PCU/Hr)
Flared Sat Flow(PCU/Hr)
1/1(A3022 Brixham Road (north)) 3.58 0.00 Y
Arm 6 Ahead Inf 89.7 %1944 1944
Arm 7 Left 10.50 10.3 %
1/2(A3022 Brixham Road (north)) 3.43 0.00 N Arm 6 Ahead Inf 100.0 % 2098 2098
1/3(A3022 Brixham Road (north)) 2.95 0.00 Y Arm 8 Right 13.50 100.0 % 1719 1719
2/1(A3022 Brixham Road (south)) 3.50 0.00 Y
Arm 5 Ahead Inf 69.1 %1908 1908
Arm 8 Left 15.60 30.9 %
2/2(A3022 Brixham Road (south)) 3.42 0.00 N Arm 5 Ahead Inf 100.0 % 2097 2097
2/3(A3022 Brixham Road (south)) 3.17 0.00 Y Arm 7 Right 14.30 100.0 % 1749 1749
3/1(Kingsway Avenue) 3.02 0.00 Y
Arm 5 Right 23.00 65.7 %
1809 1809Arm 6 Left 10.20 11.4 %
Arm 8 Ahead Inf 22.9 %
4/1(White Rock) 2.93 0.00 Y
Arm 5 Left 11.80 95.1 %1702 1702
Arm 7 Ahead Inf 4.9 %
4/2(White Rock) 3.20 0.00 Y Arm 6 Right 22.80 100.0 % 1816 1816
5/1 Infinite Saturation Flow Inf Inf
5/2 Infinite Saturation Flow Inf Inf
6/1 Infinite Saturation Flow Inf Inf
6/2 Infinite Saturation Flow Inf Inf
7/1 Infinite Saturation Flow Inf Inf
8/1 Infinite Saturation Flow Inf Inf
Scenario 25: 'TA 2024 AM' (FG33: 'TA 2024 AM', Plan 1: 'Network Control Plan 1')Traffic Flows, DesiredDesired Flow :
Destination
Origin
A B C D Tot.
A 0 23 490 80 593
B 33 0 13 8 54
C 780 10 0 216 1006
D 97 8 68 0 173
Tot. 910 41 571 304 1826

Full Input Data And Results
Traffic Lane Flows
Lane Scenario 25:TA 2024 AM
Junction: White Rock Junction
1/1 239
1/2 274
1/3 80
2/1 470
2/2(with short)
536(In)526(Out)
2/3(short) 10
3/1 54
4/1 105
4/2 68
5/1 456
5/2 454
6/1 292
6/2 279
7/1 41
8/1 304

Full Input Data And Results
Lane Saturation FlowsJunction: White Rock Junction
LaneLaneWidth
(m)Gradient Nearside
LaneAllowedTurns
TurningRadius
(m)Turning
Prop.Sat Flow(PCU/Hr)
Flared Sat Flow(PCU/Hr)
1/1(A3022 Brixham Road (north)) 3.58 0.00 Y
Arm 6 Ahead Inf 90.4 %1946 1946
Arm 7 Left 10.50 9.6 %
1/2(A3022 Brixham Road (north)) 3.43 0.00 N Arm 6 Ahead Inf 100.0 % 2098 2098
1/3(A3022 Brixham Road (north)) 2.95 0.00 Y Arm 8 Right 13.50 100.0 % 1719 1719
2/1(A3022 Brixham Road (south)) 3.50 0.00 Y
Arm 5 Ahead Inf 54.0 %1882 1882
Arm 8 Left 15.60 46.0 %
2/2(A3022 Brixham Road (south)) 3.42 0.00 N Arm 5 Ahead Inf 100.0 % 2097 2097
2/3(A3022 Brixham Road (south)) 3.17 0.00 Y Arm 7 Right 14.30 100.0 % 1749 1749
3/1(Kingsway Avenue) 3.02 0.00 Y
Arm 5 Right 23.00 61.1 %
1783 1783Arm 6 Left 10.20 24.1 %
Arm 8 Ahead Inf 14.8 %
4/1(White Rock) 2.93 0.00 Y
Arm 5 Left 11.80 92.4 %1707 1707
Arm 7 Ahead Inf 7.6 %
4/2(White Rock) 3.20 0.00 Y Arm 6 Right 22.80 100.0 % 1816 1816
5/1 Infinite Saturation Flow Inf Inf
5/2 Infinite Saturation Flow Inf Inf
6/1 Infinite Saturation Flow Inf Inf
6/2 Infinite Saturation Flow Inf Inf
7/1 Infinite Saturation Flow Inf Inf
8/1 Infinite Saturation Flow Inf Inf
Scenario 26: 'TA 2024 PM' (FG34: 'TA 2024 PM', Plan 1: 'Network Control Plan 1')Traffic Flows, DesiredDesired Flow :
Destination
Origin
A B C D Tot.
A 0 41 805 108 954
B 23 0 5 8 36
C 675 6 0 129 810
D 136 7 148 0 291
Tot. 834 54 958 245 2091

Full Input Data And Results
Traffic Lane Flows
Lane Scenario 26:TA 2024 PM
Junction: White Rock Junction
1/1 401
1/2 445
1/3 108
2/1 381
2/2(with short)
429(In)423(Out)
2/3(short) 6
3/1 36
4/1 143
4/2 148
5/1 418
5/2 416
6/1 482
6/2 476
7/1 54
8/1 245

Full Input Data And Results
Lane Saturation FlowsJunction: White Rock Junction
LaneLaneWidth
(m)Gradient Nearside
LaneAllowedTurns
TurningRadius
(m)Turning
Prop.Sat Flow(PCU/Hr)
Flared Sat Flow(PCU/Hr)
1/1(A3022 Brixham Road (north)) 3.58 0.00 Y
Arm 6 Ahead Inf 89.8 %1945 1945
Arm 7 Left 10.50 10.2 %
1/2(A3022 Brixham Road (north)) 3.43 0.00 N Arm 6 Ahead Inf 100.0 % 2098 2098
1/3(A3022 Brixham Road (north)) 2.95 0.00 Y Arm 8 Right 13.50 100.0 % 1719 1719
2/1(A3022 Brixham Road (south)) 3.50 0.00 Y
Arm 5 Ahead Inf 66.1 %1903 1903
Arm 8 Left 15.60 33.9 %
2/2(A3022 Brixham Road (south)) 3.42 0.00 N Arm 5 Ahead Inf 100.0 % 2097 2097
2/3(A3022 Brixham Road (south)) 3.17 0.00 Y Arm 7 Right 14.30 100.0 % 1749 1749
3/1(Kingsway Avenue) 3.02 0.00 Y
Arm 5 Right 23.00 63.9 %
1805 1805Arm 6 Left 10.20 13.9 %
Arm 8 Ahead Inf 22.2 %
4/1(White Rock) 2.93 0.00 Y
Arm 5 Left 11.80 95.1 %1702 1702
Arm 7 Ahead Inf 4.9 %
4/2(White Rock) 3.20 0.00 Y Arm 6 Right 22.80 100.0 % 1816 1816
5/1 Infinite Saturation Flow Inf Inf
5/2 Infinite Saturation Flow Inf Inf
6/1 Infinite Saturation Flow Inf Inf
6/2 Infinite Saturation Flow Inf Inf
7/1 Infinite Saturation Flow Inf Inf
8/1 Infinite Saturation Flow Inf Inf
Scenario 27: 'TA 2024 + Dev AM' (FG35: 'TA 2024 + Dev AM', Plan 1: 'Network Control Plan 1')Traffic Flows, DesiredDesired Flow :
Destination
Origin
A B C D Tot.
A 0 23 539 80 642
B 33 0 13 8 54
C 873 10 0 226 1109
D 97 8 82 0 187
Tot. 1003 41 634 314 1992

Full Input Data And Results
Traffic Lane Flows
LaneScenario 27:
TA 2024 + DevAM
Junction: White Rock Junction
1/1 263
1/2 299
1/3 80
2/1 520
2/2(with short)
589(In)579(Out)
2/3(short) 10
3/1 54
4/1 105
4/2 82
5/1 503
5/2 500
6/1 323
6/2 311
7/1 41
8/1 314

Full Input Data And Results
Lane Saturation FlowsJunction: White Rock Junction
LaneLaneWidth
(m)Gradient Nearside
LaneAllowedTurns
TurningRadius
(m)Turning
Prop.Sat Flow(PCU/Hr)
Flared Sat Flow(PCU/Hr)
1/1(A3022 Brixham Road (north)) 3.58 0.00 Y
Arm 6 Ahead Inf 91.3 %1949 1949
Arm 7 Left 10.50 8.7 %
1/2(A3022 Brixham Road (north)) 3.43 0.00 N Arm 6 Ahead Inf 100.0 % 2098 2098
1/3(A3022 Brixham Road (north)) 2.95 0.00 Y Arm 8 Right 13.50 100.0 % 1719 1719
2/1(A3022 Brixham Road (south)) 3.50 0.00 Y
Arm 5 Ahead Inf 56.5 %1886 1886
Arm 8 Left 15.60 43.5 %
2/2(A3022 Brixham Road (south)) 3.42 0.00 N Arm 5 Ahead Inf 100.0 % 2097 2097
2/3(A3022 Brixham Road (south)) 3.17 0.00 Y Arm 7 Right 14.30 100.0 % 1749 1749
3/1(Kingsway Avenue) 3.02 0.00 Y
Arm 5 Right 23.00 61.1 %
1783 1783Arm 6 Left 10.20 24.1 %
Arm 8 Ahead Inf 14.8 %
4/1(White Rock) 2.93 0.00 Y
Arm 5 Left 11.80 92.4 %1707 1707
Arm 7 Ahead Inf 7.6 %
4/2(White Rock) 3.20 0.00 Y Arm 6 Right 22.80 100.0 % 1816 1816
5/1 Infinite Saturation Flow Inf Inf
5/2 Infinite Saturation Flow Inf Inf
6/1 Infinite Saturation Flow Inf Inf
6/2 Infinite Saturation Flow Inf Inf
7/1 Infinite Saturation Flow Inf Inf
8/1 Infinite Saturation Flow Inf Inf
Scenario 28: 'TA 2024 + Dev PM' (FG36: 'TA 2024 + Dev PM', Plan 1: 'Network Control Plan 1')Traffic Flows, DesiredDesired Flow :
Destination
Origin
A B C D Tot.
A 0 41 912 108 1061
B 23 0 5 8 36
C 745 6 0 139 890
D 136 7 149 0 292
Tot. 904 54 1066 255 2279

Full Input Data And Results
Traffic Lane Flows
LaneScenario 28:
TA 2024 + DevPM
Junction: White Rock Junction
1/1 453
1/2 500
1/3 108
2/1 419
2/2(with short)
471(In)465(Out)
2/3(short) 6
3/1 36
4/1 143
4/2 149
5/1 452
5/2 452
6/1 536
6/2 530
7/1 54
8/1 255

Full Input Data And Results
Lane Saturation FlowsJunction: White Rock Junction
LaneLaneWidth
(m)Gradient Nearside
LaneAllowedTurns
TurningRadius
(m)Turning
Prop.Sat Flow(PCU/Hr)
Flared Sat Flow(PCU/Hr)
1/1(A3022 Brixham Road (north)) 3.58 0.00 Y
Arm 6 Ahead Inf 90.9 %1948 1948
Arm 7 Left 10.50 9.1 %
1/2(A3022 Brixham Road (north)) 3.43 0.00 N Arm 6 Ahead Inf 100.0 % 2098 2098
1/3(A3022 Brixham Road (north)) 2.95 0.00 Y Arm 8 Right 13.50 100.0 % 1719 1719
2/1(A3022 Brixham Road (south)) 3.50 0.00 Y
Arm 5 Ahead Inf 66.8 %1904 1904
Arm 8 Left 15.60 33.2 %
2/2(A3022 Brixham Road (south)) 3.42 0.00 N Arm 5 Ahead Inf 100.0 % 2097 2097
2/3(A3022 Brixham Road (south)) 3.17 0.00 Y Arm 7 Right 14.30 100.0 % 1749 1749
3/1(Kingsway Avenue) 3.02 0.00 Y
Arm 5 Right 23.00 63.9 %
1805 1805Arm 6 Left 10.20 13.9 %
Arm 8 Ahead Inf 22.2 %
4/1(White Rock) 2.93 0.00 Y
Arm 5 Left 11.80 95.1 %1702 1702
Arm 7 Ahead Inf 4.9 %
4/2(White Rock) 3.20 0.00 Y Arm 6 Right 22.80 100.0 % 1816 1816
5/1 Infinite Saturation Flow Inf Inf
5/2 Infinite Saturation Flow Inf Inf
6/1 Infinite Saturation Flow Inf Inf
6/2 Infinite Saturation Flow Inf Inf
7/1 Infinite Saturation Flow Inf Inf
8/1 Infinite Saturation Flow Inf Inf
Scenario 1: '2017 Base AM' (FG1: '2017 Base AM', Plan 1: 'Network Control Plan 1')Stage Sequence Diagram
A
B
H
L
O
1 Min: 7
10 57s
C
D
G I
K
M
O
2 Min: 7
12 7s
E
H I
LM
O
3 Min: 7
8 7s
FH I
LMN
4 Min: 7
12 7s
Stage TimingsStage 1 2 3 4
Duration 57 7 7 7
Change Point 0 67 86 101

Full Input Data And Results
Signal Timings Diagram
0
0
10
10
20
20
30
30
40
40
50
50
60
60
70
70
80
80
90
90
100
100
110
110
120
120
Time in cycle (sec)
Phas
es
1 10 : 570
2 12 : 767
3 8 : 786
4 12 : 7101
O ON NM ML LK KJ JI I
H HG GF FE ED DC CB BA A

Full Input Data And ResultsNetwork Layout Diagram

Full Input Data And Results
White Rock JunctionPRC: 118.1 %Total Traffic Delay: 9.5 pcuHr
Arm
1-A
3022
Brix
ham
Roa
d(n
o rth
)
123
AAC
Arm2
-A3022
Brix ham
Road
(south)
1 2 3Arm 3 - Kingsway Avenue
1 E
Arm 4 - White Rock
12
FF
Arm5
-
1 2Ar
m6
-
Arm 7 -
1Arm 8 -
1
A
B
D

Full Input Data And Results
Network Results
Item Lane Description LaneType
ControllerStream
Position InFiltered Route Full Phase Arrow
PhaseNumGreens
Total Green(s)
ArrowGreen (s)
DemandFlow (pcu)
Sat Flow(pcu/Hr)
Capacity(pcu)
Deg Sat(%)
Network:White RockJunction
- - N/A - - - - - - - - 41.3%
White RockJunction - - N/A - - - - - - - - 41.3%
1/1A3022 Brixham
Road (north)Ahead Left
U N/A N/A A 1 59 - 222 1945 973 22.8%
1/2A3022 Brixham
Road (north)Ahead
U N/A N/A A 1 59 - 255 2098 1049 24.3%
1/3A3022 Brixham
Road (north)Right
U N/A N/A C 1 16 - 6 1719 244 2.5%
2/1A3022 BrixhamRoad (south)Ahead Left
U N/A N/A B 1 57 - 376 1948 942 39.9%
2/2+2/3A3022 BrixhamRoad (south)Ahead Right
U N/A N/A B D 1 57:15 - 415 2097:1749 982+24 41.3 :41.3%
3/1 Kingsway AvenueRight Left Ahead U N/A N/A E 1 8 - 53 1783 134 39.6%
4/1 White Rock LeftAhead U N/A N/A F 1 14 - 26 1754 219 11.9%
4/2 White Rock Right U N/A N/A F 1 14 - 14 1816 227 6.2%
5/1 U N/A N/A - - - - 398 Inf Inf 0.0%
5/2 U N/A N/A - - - - 399 Inf Inf 0.0%
6/1 U N/A N/A - - - - 247 Inf Inf 0.0%
6/2 U N/A N/A - - - - 235 Inf Inf 0.0%
7/1 U N/A N/A - - - - 40 Inf Inf 0.0%
8/1 U N/A N/A - - - - 48 Inf Inf 0.0%

Full Input Data And Results
Item Arriving (pcu) Leaving(pcu)
Turners InGaps (pcu)
Turners WhenUnopposed(pcu)
Turners InIntergreen(pcu)
UniformDelay(pcuHr)
Rand +OversatDelay(pcuHr)
Storage AreaUniformDelay(pcuHr)
TotalDelay(pcuHr)
Av. DelayPer PCU(s/pcu)
Max. Back ofUniformQueue (pcu)
Rand +OversatQueue (pcu)
MeanMaxQueue(pcu)
Network:White RockJunction
- - 0 0 0 8.1 1.4 0.0 9.5 - - - -
White RockJunction - - 0 0 0 8.1 1.4 0.0 9.5 - - - -
1/1 222 222 - - - 1.0 0.1 - 1.2 19.3 4.1 0.1 4.3
1/2 255 255 - - - 1.2 0.2 - 1.4 19.3 4.8 0.2 5.0
1/3 6 6 - - - 0.1 0.0 - 0.1 52.2 0.2 0.0 0.2
2/1 376 376 - - - 2.1 0.3 - 2.4 23.0 7.9 0.3 8.3
2/2+2/3 415 415 - - - 2.4 0.4 - 2.7 23.7 8.8 0.4 9.1
3/1 53 53 - - - 0.8 0.3 - 1.1 75.1 1.7 0.3 2.0
4/1 26 26 - - - 0.3 0.1 - 0.4 56.0 0.8 0.1 0.8
4/2 14 14 - - - 0.2 0.0 - 0.2 54.8 0.4 0.0 0.4
5/1 398 398 - - - 0.0 0.0 - 0.0 0.0 0.0 0.0 0.0
5/2 399 399 - - - 0.0 0.0 - 0.0 0.0 0.0 0.0 0.0
6/1 247 247 - - - 0.0 0.0 - 0.0 0.0 0.0 0.0 0.0
6/2 235 235 - - - 0.0 0.0 - 0.0 0.0 0.0 0.0 0.0
7/1 40 40 - - - 0.0 0.0 - 0.0 0.0 0.0 0.0 0.0
8/1 48 48 - - - 0.0 0.0 - 0.0 0.0 0.0 0.0 0.0
C1 PRC for Signalled Lanes (%): 118.1 Total Delay for Signalled Lanes (pcuHr): 9.50 Cycle Time (s): 120 PRC Over All Lanes (%): 118.1 Total Delay Over All Lanes(pcuHr): 9.50

Full Input Data And ResultsScenario 2: '2017 Base PM' (FG2: '2017 Base PM', Plan 1: 'Network Control Plan 1')Stage Sequence Diagram
A
B
H
L
O
1 Min: 7
10 57s
C
D
G I
K
M
O
2 Min: 7
12 7s
E
H I
LM
O
3 Min: 7
8 7s
FH I
LMN
4 Min: 7
12 7s
Stage TimingsStage 1 2 3 4
Duration 57 7 7 7
Change Point 0 67 86 101
Signal Timings Diagram
0
0
10
10
20
20
30
30
40
40
50
50
60
60
70
70
80
80
90
90
100
100
110
110
120
120
Time in cycle (sec)
Phas
es
1 10 : 570
2 12 : 767
3 8 : 786
4 12 : 7101
O ON NM ML LK KJ JI I
H HG GF FE ED DC CB BA A

Full Input Data And ResultsNetwork Layout Diagram

Full Input Data And Results
White Rock JunctionPRC: 123.2 %Total Traffic Delay: 10.3 pcuHr
Arm
1-A
3022
Brix
ham
Roa
d(n
o rth
)
123
AAC
Arm2
-A3022
Brix ham
Road
(south)
1 2 3Arm 3 - Kingsway Avenue
1 E
Arm 4 - White Rock
12
FF
Arm5
-
1 2Ar
m6
-
Arm 7 -
1Arm 8 -
1
A
B
D

Full Input Data And Results
Network Results
Item Lane Description LaneType
ControllerStream
Position InFiltered Route Full Phase Arrow
PhaseNumGreens
Total Green(s)
ArrowGreen (s)
DemandFlow (pcu)
Sat Flow(pcu/Hr)
Capacity(pcu)
Deg Sat(%)
Network:White RockJunction
- - N/A - - - - - - - - 40.3%
White RockJunction - - N/A - - - - - - - - 40.3%
1/1A3022 Brixham
Road (north)Ahead Left
U N/A N/A A 1 59 - 379 1944 972 39.0%
1/2A3022 Brixham
Road (north)Ahead
U N/A N/A A 1 59 - 423 2098 1049 40.3%
1/3A3022 Brixham
Road (north)Right
U N/A N/A C 1 16 - 17 1719 244 7.0%
2/1A3022 BrixhamRoad (south)Ahead Left
U N/A N/A B 1 57 - 299 1957 946 31.6%
2/2+2/3A3022 BrixhamRoad (south)Ahead Right
U N/A N/A B D 1 57:15 - 330 2097:1749 988+18 32.8 :32.8%
3/1 Kingsway AvenueRight Left Ahead U N/A N/A E 1 8 - 34 1809 136 25.1%
4/1 White Rock LeftAhead U N/A N/A F 1 14 - 30 1739 217 13.8%
4/2 White Rock Right U N/A N/A F 1 14 - 17 1816 227 7.5%
5/1 U N/A N/A - - - - 328 Inf Inf 0.0%
5/2 U N/A N/A - - - - 327 Inf Inf 0.0%
6/1 U N/A N/A - - - - 395 Inf Inf 0.0%
6/2 U N/A N/A - - - - 389 Inf Inf 0.0%
7/1 U N/A N/A - - - - 52 Inf Inf 0.0%
8/1 U N/A N/A - - - - 38 Inf Inf 0.0%

Full Input Data And Results
Item Arriving (pcu) Leaving(pcu)
Turners InGaps (pcu)
Turners WhenUnopposed(pcu)
Turners InIntergreen(pcu)
UniformDelay(pcuHr)
Rand +OversatDelay(pcuHr)
Storage AreaUniformDelay(pcuHr)
TotalDelay(pcuHr)
Av. DelayPer PCU(s/pcu)
Max. Back ofUniformQueue (pcu)
Rand +OversatQueue (pcu)
MeanMaxQueue(pcu)
Network:White RockJunction
- - 0 0 0 8.8 1.5 0.0 10.3 - - - -
White RockJunction - - 0 0 0 8.8 1.5 0.0 10.3 - - - -
1/1 379 379 - - - 2.0 0.3 - 2.3 21.7 7.8 0.3 8.1
1/2 423 423 - - - 2.2 0.3 - 2.5 21.7 8.8 0.3 9.1
1/3 17 17 - - - 0.2 0.0 - 0.2 52.6 0.5 0.0 0.5
2/1 299 299 - - - 1.6 0.2 - 1.8 21.7 6.1 0.2 6.3
2/2+2/3 330 330 - - - 1.8 0.2 - 2.0 22.2 6.6 0.2 6.8
3/1 34 34 - - - 0.5 0.2 - 0.7 70.0 1.1 0.2 1.2
4/1 30 30 - - - 0.4 0.1 - 0.5 56.4 0.9 0.1 1.0
4/2 17 17 - - - 0.2 0.0 - 0.3 54.9 0.5 0.0 0.5
5/1 328 328 - - - 0.0 0.0 - 0.0 0.0 0.0 0.0 0.0
5/2 327 327 - - - 0.0 0.0 - 0.0 0.0 0.0 0.0 0.0
6/1 395 395 - - - 0.0 0.0 - 0.0 0.0 0.0 0.0 0.0
6/2 389 389 - - - 0.0 0.0 - 0.0 0.0 0.0 0.0 0.0
7/1 52 52 - - - 0.0 0.0 - 0.0 0.0 0.0 0.0 0.0
8/1 38 38 - - - 0.0 0.0 - 0.0 0.0 0.0 0.0 0.0
C1 PRC for Signalled Lanes (%): 123.2 Total Delay for Signalled Lanes (pcuHr): 10.30 Cycle Time (s): 120 PRC Over All Lanes (%): 123.2 Total Delay Over All Lanes(pcuHr): 10.30

Full Input Data And ResultsScenario 23: 'TA 2019 AM' (FG31: 'TA 2019 AM', Plan 1: 'Network Control Plan 1')Stage Sequence Diagram
A
B
H
L
O
1 Min: 7
10 57s
C
D
G I
K
M
O
2 Min: 7
12 7s
E
H I
LM
O
3 Min: 7
8 7s
FH I
LMN
4 Min: 7
12 7s
Stage TimingsStage 1 2 3 4
Duration 57 7 7 7
Change Point 0 67 86 101
Signal Timings Diagram
0
0
10
10
20
20
30
30
40
40
50
50
60
60
70
70
80
80
90
90
100
100
110
110
120
120
Time in cycle (sec)
Phas
es
1 10 : 570
2 12 : 767
3 8 : 786
4 12 : 7101
O ON NM ML LK KJ JI I
H HG GF FE ED DC CB BA A

Full Input Data And ResultsNetwork Layout Diagram

Full Input Data And Results
White Rock JunctionPRC: 75.8 %Total Traffic Delay: 14.7 pcuHr
Arm
1-A
3022
Brix
ham
Roa
d(n
o rth
)
123
AAC
Arm2
-A3022
Brix ham
Road
(south)
1 2 3Arm 3 - Kingsway Avenue
1 E
Arm 4 - White Rock
12
FF
Arm5
-
1 2Ar
m6
-
Arm 7 -
1Arm 8 -
1
A
B
D

Full Input Data And Results
Network Results
Item Lane Description LaneType
ControllerStream
Position InFiltered Route Full Phase Arrow
PhaseNumGreens
Total Green(s)
ArrowGreen (s)
DemandFlow (pcu)
Sat Flow(pcu/Hr)
Capacity(pcu)
Deg Sat(%)
Network:White RockJunction
- - N/A - - - - - - - - 51.2%
White RockJunction - - N/A - - - - - - - - 51.2%
1/1A3022 Brixham
Road (north)Ahead Left
U N/A N/A A 1 59 - 229 1945 973 23.5%
1/2A3022 Brixham
Road (north)Ahead
U N/A N/A A 1 59 - 260 2098 1049 24.8%
1/3A3022 Brixham
Road (north)Right
U N/A N/A C 1 16 - 80 1719 244 32.9%
2/1A3022 BrixhamRoad (south)Ahead Left
U N/A N/A B 1 57 - 451 1886 912 49.5%
2/2+2/3A3022 BrixhamRoad (south)Ahead Right
U N/A N/A B D 1 57:15 - 515 2097:1749 986+20 51.2 :51.2%
3/1 Kingsway AvenueRight Left Ahead U N/A N/A E 1 8 - 54 1783 134 40.4%
4/1 White Rock LeftAhead U N/A N/A F 1 14 - 105 1707 213 49.2%
4/2 White Rock Right U N/A N/A F 1 14 - 62 1816 227 27.3%
5/1 U N/A N/A - - - - 445 Inf Inf 0.0%
5/2 U N/A N/A - - - - 444 Inf Inf 0.0%
6/1 U N/A N/A - - - - 277 Inf Inf 0.0%
6/2 U N/A N/A - - - - 264 Inf Inf 0.0%
7/1 U N/A N/A - - - - 41 Inf Inf 0.0%
8/1 U N/A N/A - - - - 285 Inf Inf 0.0%

Full Input Data And Results
Item Arriving (pcu) Leaving(pcu)
Turners InGaps (pcu)
Turners WhenUnopposed(pcu)
Turners InIntergreen(pcu)
UniformDelay(pcuHr)
Rand +OversatDelay(pcuHr)
Storage AreaUniformDelay(pcuHr)
TotalDelay(pcuHr)
Av. DelayPer PCU(s/pcu)
Max. Back ofUniformQueue (pcu)
Rand +OversatQueue (pcu)
MeanMaxQueue(pcu)
Network:White RockJunction
- - 0 0 0 12.1 2.6 0.0 14.7 - - - -
White RockJunction - - 0 0 0 12.1 2.6 0.0 14.7 - - - -
1/1 229 229 - - - 1.1 0.2 - 1.2 19.4 4.3 0.2 4.5
1/2 260 260 - - - 1.2 0.2 - 1.4 19.4 4.9 0.2 5.1
1/3 80 80 - - - 1.0 0.2 - 1.3 57.3 2.4 0.2 2.6
2/1 451 451 - - - 2.6 0.5 - 3.1 25.0 10.1 0.5 10.6
2/2+2/3 515 515 - - - 3.1 0.5 - 3.6 25.4 11.6 0.5 12.2
3/1 54 54 - - - 0.8 0.3 - 1.1 75.4 1.7 0.3 2.0
4/1 105 105 - - - 1.4 0.5 - 1.9 65.4 3.2 0.5 3.7
4/2 62 62 - - - 0.8 0.2 - 1.0 58.5 1.9 0.2 2.0
5/1 445 445 - - - 0.0 0.0 - 0.0 0.0 0.0 0.0 0.0
5/2 444 444 - - - 0.0 0.0 - 0.0 0.0 0.0 0.0 0.0
6/1 277 277 - - - 0.0 0.0 - 0.0 0.0 0.0 0.0 0.0
6/2 264 264 - - - 0.0 0.0 - 0.0 0.0 0.0 0.0 0.0
7/1 41 41 - - - 0.0 0.0 - 0.0 0.0 0.0 0.0 0.0
8/1 285 285 - - - 0.0 0.0 - 0.0 0.0 0.0 0.0 0.0
C1 PRC for Signalled Lanes (%): 75.8 Total Delay for Signalled Lanes (pcuHr): 14.72 Cycle Time (s): 120 PRC Over All Lanes (%): 75.8 Total Delay Over All Lanes(pcuHr): 14.72

Full Input Data And ResultsScenario 24: 'TA 2019 PM' (FG32: 'TA 2019 PM', Plan 1: 'Network Control Plan 1')Stage Sequence Diagram
A
B
H
L
O
1 Min: 7
10 50s
C
D
G I
K
M
O
2 Min: 7
12 7s
E
H I
LM
O
3 Min: 7
8 7s
FH I
LMN
4 Min: 7
12 14s
Stage TimingsStage 1 2 3 4
Duration 50 7 7 14
Change Point 0 60 79 94
Signal Timings Diagram
0
0
10
10
20
20
30
30
40
40
50
50
60
60
70
70
80
80
90
90
100
100
110
110
120
120
Time in cycle (sec)
Phas
es
1 10 : 500
2 12 : 760
3 8 : 779
4 12 : 1494
O ON NM ML LK KJ JI I
H HG GF FE ED DC CB BA A

Full Input Data And ResultsNetwork Layout Diagram

Full Input Data And Results
White Rock JunctionPRC: 92.2 %Total Traffic Delay: 18.7 pcuHr
Arm
1-A
3022
Brix
ham
Roa
d(n
o rth
)
123
AAC
Arm2
-A3022
Brix ham
Road
(south)
1 2 3Arm 3 - Kingsway Avenue
1 E
Arm 4 - White Rock
12
FF
Arm5
-
1 2Ar
m6
-
Arm 7 -
1Arm 8 -
1
A
B
D

Full Input Data And Results
Network Results
Item Lane Description LaneType
ControllerStream
Position InFiltered Route Full Phase Arrow
PhaseNumGreens
Total Green(s)
ArrowGreen (s)
DemandFlow (pcu)
Sat Flow(pcu/Hr)
Capacity(pcu)
Deg Sat(%)
Network:White RockJunction
- - N/A - - - - - - - - 46.8%
White RockJunction - - N/A - - - - - - - - 46.8%
1/1A3022 Brixham
Road (north)Ahead Left
U N/A N/A A 1 52 - 388 1944 859 45.2%
1/2A3022 Brixham
Road (north)Ahead
U N/A N/A A 1 52 - 434 2098 927 46.8%
1/3A3022 Brixham
Road (north)Right
U N/A N/A C 1 16 - 108 1719 244 44.3%
2/1A3022 BrixhamRoad (south)Ahead Left
U N/A N/A B 1 50 - 353 1908 811 43.5%
2/2+2/3A3022 BrixhamRoad (south)Ahead Right
U N/A N/A B D 1 50:15 - 399 2097:1749 871+13 45.1 :45.1%
3/1 Kingsway AvenueRight Left Ahead U N/A N/A E 1 8 - 35 1809 136 25.8%
4/1 White Rock LeftAhead U N/A N/A F 1 21 - 143 1702 312 45.8%
4/2 White Rock Right U N/A N/A F 1 21 - 130 1816 333 39.0%
5/1 U N/A N/A - - - - 398 Inf Inf 0.0%
5/2 U N/A N/A - - - - 398 Inf Inf 0.0%
6/1 U N/A N/A - - - - 460 Inf Inf 0.0%
6/2 U N/A N/A - - - - 456 Inf Inf 0.0%
7/1 U N/A N/A - - - - 53 Inf Inf 0.0%
8/1 U N/A N/A - - - - 225 Inf Inf 0.0%

Full Input Data And Results
Item Arriving (pcu) Leaving(pcu)
Turners InGaps (pcu)
Turners WhenUnopposed(pcu)
Turners InIntergreen(pcu)
UniformDelay(pcuHr)
Rand +OversatDelay(pcuHr)
Storage AreaUniformDelay(pcuHr)
TotalDelay(pcuHr)
Av. DelayPer PCU(s/pcu)
Max. Back ofUniformQueue (pcu)
Rand +OversatQueue (pcu)
MeanMaxQueue(pcu)
Network:White RockJunction
- - 0 0 0 15.7 3.0 0.0 18.7 - - - -
White RockJunction - - 0 0 0 15.7 3.0 0.0 18.7 - - - -
1/1 388 388 - - - 2.5 0.4 - 2.9 27.2 8.9 0.4 9.4
1/2 434 434 - - - 2.8 0.4 - 3.3 27.2 10.1 0.4 10.6
1/3 108 108 - - - 1.4 0.4 - 1.8 60.4 3.3 0.4 3.7
2/1 353 353 - - - 2.4 0.4 - 2.8 28.3 8.2 0.4 8.6
2/2+2/3 399 399 - - - 2.8 0.4 - 3.2 28.6 9.3 0.4 9.8
3/1 35 35 - - - 0.5 0.2 - 0.7 70.2 1.1 0.2 1.3
4/1 143 143 - - - 1.7 0.4 - 2.2 54.3 4.2 0.4 4.6
4/2 130 130 - - - 1.6 0.3 - 1.9 52.0 3.8 0.3 4.1
5/1 398 398 - - - 0.0 0.0 - 0.0 0.0 0.0 0.0 0.0
5/2 398 398 - - - 0.0 0.0 - 0.0 0.0 0.0 0.0 0.0
6/1 460 460 - - - 0.0 0.0 - 0.0 0.0 0.0 0.0 0.0
6/2 456 456 - - - 0.0 0.0 - 0.0 0.0 0.0 0.0 0.0
7/1 53 53 - - - 0.0 0.0 - 0.0 0.0 0.0 0.0 0.0
8/1 225 225 - - - 0.0 0.0 - 0.0 0.0 0.0 0.0 0.0
C1 PRC for Signalled Lanes (%): 92.2 Total Delay for Signalled Lanes (pcuHr): 18.68 Cycle Time (s): 120 PRC Over All Lanes (%): 92.2 Total Delay Over All Lanes(pcuHr): 18.68

Full Input Data And ResultsScenario 25: 'TA 2024 AM' (FG33: 'TA 2024 AM', Plan 1: 'Network Control Plan 1')Stage Sequence Diagram
A
B
H
L
O
1 Min: 7
10 57s
C
D
G I
K
M
O
2 Min: 7
12 7s
E
H I
LM
O
3 Min: 7
8 7s
FH I
LMN
4 Min: 7
12 7s
Stage TimingsStage 1 2 3 4
Duration 57 7 7 7
Change Point 0 67 86 101
Signal Timings Diagram
0
0
10
10
20
20
30
30
40
40
50
50
60
60
70
70
80
80
90
90
100
100
110
110
120
120
Time in cycle (sec)
Phas
es
1 10 : 570
2 12 : 767
3 8 : 786
4 12 : 7101
O ON NM ML LK KJ JI I
H HG GF FE ED DC CB BA A

Full Input Data And ResultsNetwork Layout Diagram

Full Input Data And Results
White Rock JunctionPRC: 68.9 %Total Traffic Delay: 15.4 pcuHr
Arm
1-A
3022
Brix
ham
Roa
d(n
o rth
)
123
AAC
Arm2
-A3022
Brix ham
Road
(south)
1 2 3Arm 3 - Kingsway Avenue
1 E
Arm 4 - White Rock
12
FF
Arm5
-
1 2Ar
m6
-
Arm 7 -
1Arm 8 -
1
A
B
D

Full Input Data And Results
Network Results
Item Lane Description LaneType
ControllerStream
Position InFiltered Route Full Phase Arrow
PhaseNumGreens
Total Green(s)
ArrowGreen (s)
DemandFlow (pcu)
Sat Flow(pcu/Hr)
Capacity(pcu)
Deg Sat(%)
Network:White RockJunction
- - N/A - - - - - - - - 53.3%
White RockJunction - - N/A - - - - - - - - 53.3%
1/1A3022 Brixham
Road (north)Ahead Left
U N/A N/A A 1 59 - 239 1946 973 24.6%
1/2A3022 Brixham
Road (north)Ahead
U N/A N/A A 1 59 - 274 2098 1049 26.1%
1/3A3022 Brixham
Road (north)Right
U N/A N/A C 1 16 - 80 1719 244 32.9%
2/1A3022 BrixhamRoad (south)Ahead Left
U N/A N/A B 1 57 - 470 1882 910 51.7%
2/2+2/3A3022 BrixhamRoad (south)Ahead Right
U N/A N/A B D 1 57:15 - 536 2097:1749 987+19 53.3 :53.3%
3/1 Kingsway AvenueRight Left Ahead U N/A N/A E 1 8 - 54 1783 134 40.4%
4/1 White Rock LeftAhead U N/A N/A F 1 14 - 105 1707 213 49.2%
4/2 White Rock Right U N/A N/A F 1 14 - 68 1816 227 30.0%
5/1 U N/A N/A - - - - 456 Inf Inf 0.0%
5/2 U N/A N/A - - - - 454 Inf Inf 0.0%
6/1 U N/A N/A - - - - 292 Inf Inf 0.0%
6/2 U N/A N/A - - - - 279 Inf Inf 0.0%
7/1 U N/A N/A - - - - 41 Inf Inf 0.0%
8/1 U N/A N/A - - - - 304 Inf Inf 0.0%

Full Input Data And Results
Item Arriving (pcu) Leaving(pcu)
Turners InGaps (pcu)
Turners WhenUnopposed(pcu)
Turners InIntergreen(pcu)
UniformDelay(pcuHr)
Rand +OversatDelay(pcuHr)
Storage AreaUniformDelay(pcuHr)
TotalDelay(pcuHr)
Av. DelayPer PCU(s/pcu)
Max. Back ofUniformQueue (pcu)
Rand +OversatQueue (pcu)
MeanMaxQueue(pcu)
Network:White RockJunction
- - 0 0 0 12.7 2.7 0.0 15.4 - - - -
White RockJunction - - 0 0 0 12.7 2.7 0.0 15.4 - - - -
1/1 239 239 - - - 1.1 0.2 - 1.3 19.6 4.5 0.2 4.7
1/2 274 274 - - - 1.3 0.2 - 1.5 19.6 5.3 0.2 5.4
1/3 80 80 - - - 1.0 0.2 - 1.3 57.3 2.4 0.2 2.6
2/1 470 470 - - - 2.8 0.5 - 3.3 25.4 10.7 0.5 11.2
2/2+2/3 536 536 - - - 3.3 0.6 - 3.9 25.9 12.3 0.6 12.8
3/1 54 54 - - - 0.8 0.3 - 1.1 75.4 1.7 0.3 2.0
4/1 105 105 - - - 1.4 0.5 - 1.9 65.4 3.2 0.5 3.7
4/2 68 68 - - - 0.9 0.2 - 1.1 59.0 2.1 0.2 2.3
5/1 456 456 - - - 0.0 0.0 - 0.0 0.0 0.0 0.0 0.0
5/2 454 454 - - - 0.0 0.0 - 0.0 0.0 0.0 0.0 0.0
6/1 292 292 - - - 0.0 0.0 - 0.0 0.0 0.0 0.0 0.0
6/2 279 279 - - - 0.0 0.0 - 0.0 0.0 0.0 0.0 0.0
7/1 41 41 - - - 0.0 0.0 - 0.0 0.0 0.0 0.0 0.0
8/1 304 304 - - - 0.0 0.0 - 0.0 0.0 0.0 0.0 0.0
C1 PRC for Signalled Lanes (%): 68.9 Total Delay for Signalled Lanes (pcuHr): 15.39 Cycle Time (s): 120 PRC Over All Lanes (%): 68.9 Total Delay Over All Lanes(pcuHr): 15.39

Full Input Data And ResultsScenario 26: 'TA 2024 PM' (FG34: 'TA 2024 PM', Plan 1: 'Network Control Plan 1')Stage Sequence Diagram
A
B
H
L
O
1 Min: 7
10 51s
C
D
G I
K
M
O
2 Min: 7
12 7s
E
H I
LM
O
3 Min: 7
8 7s
FH I
LMN
4 Min: 7
12 13s
Stage TimingsStage 1 2 3 4
Duration 51 7 7 13
Change Point 0 61 80 95
Signal Timings Diagram
0
0
10
10
20
20
30
30
40
40
50
50
60
60
70
70
80
80
90
90
100
100
110
110
120
120
Time in cycle (sec)
Phas
es
1 10 : 510
2 12 : 761
3 8 : 780
4 12 : 1395
O ON NM ML LK KJ JI I
H HG GF FE ED DC CB BA A

Full Input Data And ResultsNetwork Layout Diagram

Full Input Data And Results
White Rock JunctionPRC: 87.5 %Total Traffic Delay: 19.6 pcuHr
Arm
1-A
3022
Brix
ham
Roa
d(n
o rth
)
123
AAC
Arm2
-A3022
Brix ham
Road
(south)
1 2 3Arm 3 - Kingsway Avenue
1 E
Arm 4 - White Rock
12
FF
Arm5
-
1 2Ar
m6
-
Arm 7 -
1Arm 8 -
1
A
B
D

Full Input Data And Results
Network Results
Item Lane Description LaneType
ControllerStream
Position InFiltered Route Full Phase Arrow
PhaseNumGreens
Total Green(s)
ArrowGreen (s)
DemandFlow (pcu)
Sat Flow(pcu/Hr)
Capacity(pcu)
Deg Sat(%)
Network:White RockJunction
- - N/A - - - - - - - - 48.0%
White RockJunction - - N/A - - - - - - - - 48.0%
1/1A3022 Brixham
Road (north)Ahead Left
U N/A N/A A 1 53 - 401 1945 875 45.8%
1/2A3022 Brixham
Road (north)Ahead
U N/A N/A A 1 53 - 445 2098 944 47.1%
1/3A3022 Brixham
Road (north)Right
U N/A N/A C 1 16 - 108 1719 244 44.3%
2/1A3022 BrixhamRoad (south)Ahead Left
U N/A N/A B 1 51 - 381 1903 825 46.2%
2/2+2/3A3022 BrixhamRoad (south)Ahead Right
U N/A N/A B D 1 51:15 - 429 2097:1749 889+13 47.6 :47.6%
3/1 Kingsway AvenueRight Left Ahead U N/A N/A E 1 8 - 36 1805 135 26.6%
4/1 White Rock LeftAhead U N/A N/A F 1 20 - 143 1702 298 48.0%
4/2 White Rock Right U N/A N/A F 1 20 - 148 1816 318 46.6%
5/1 U N/A N/A - - - - 418 Inf Inf 0.0%
5/2 U N/A N/A - - - - 416 Inf Inf 0.0%
6/1 U N/A N/A - - - - 482 Inf Inf 0.0%
6/2 U N/A N/A - - - - 476 Inf Inf 0.0%
7/1 U N/A N/A - - - - 54 Inf Inf 0.0%
8/1 U N/A N/A - - - - 245 Inf Inf 0.0%

Full Input Data And Results
Item Arriving (pcu) Leaving(pcu)
Turners InGaps (pcu)
Turners WhenUnopposed(pcu)
Turners InIntergreen(pcu)
UniformDelay(pcuHr)
Rand +OversatDelay(pcuHr)
Storage AreaUniformDelay(pcuHr)
TotalDelay(pcuHr)
Av. DelayPer PCU(s/pcu)
Max. Back ofUniformQueue (pcu)
Rand +OversatQueue (pcu)
MeanMaxQueue(pcu)
Network:White RockJunction
- - 0 0 0 16.4 3.2 0.0 19.6 - - - -
White RockJunction - - 0 0 0 16.4 3.2 0.0 19.6 - - - -
1/1 401 401 - - - 2.5 0.4 - 3.0 26.7 9.2 0.4 9.7
1/2 445 445 - - - 2.8 0.4 - 3.3 26.6 10.3 0.4 10.7
1/3 108 108 - - - 1.4 0.4 - 1.8 60.4 3.3 0.4 3.7
2/1 381 381 - - - 2.5 0.4 - 3.0 28.1 9.0 0.4 9.4
2/2+2/3 429 429 - - - 2.9 0.5 - 3.4 28.4 10.1 0.5 10.5
3/1 36 36 - - - 0.5 0.2 - 0.7 70.5 1.1 0.2 1.3
4/1 143 143 - - - 1.8 0.5 - 2.2 56.1 4.3 0.5 4.7
4/2 148 148 - - - 1.8 0.4 - 2.3 55.0 4.4 0.4 4.8
5/1 418 418 - - - 0.0 0.0 - 0.0 0.0 0.0 0.0 0.0
5/2 416 416 - - - 0.0 0.0 - 0.0 0.0 0.0 0.0 0.0
6/1 482 482 - - - 0.0 0.0 - 0.0 0.0 0.0 0.0 0.0
6/2 476 476 - - - 0.0 0.0 - 0.0 0.0 0.0 0.0 0.0
7/1 54 54 - - - 0.0 0.0 - 0.0 0.0 0.0 0.0 0.0
8/1 245 245 - - - 0.0 0.0 - 0.0 0.0 0.0 0.0 0.0
C1 PRC for Signalled Lanes (%): 87.5 Total Delay for Signalled Lanes (pcuHr): 19.63 Cycle Time (s): 120 PRC Over All Lanes (%): 87.5 Total Delay Over All Lanes(pcuHr): 19.63

Full Input Data And ResultsScenario 27: 'TA 2024 + Dev AM' (FG35: 'TA 2024 + Dev AM', Plan 1: 'Network Control Plan 1')Stage Sequence Diagram
A
B
H
L
O
1 Min: 7
10 57s
C
D
G I
K
M
O
2 Min: 7
12 7s
E
H I
LM
O
3 Min: 7
8 7s
FH I
LMN
4 Min: 7
12 7s
Stage TimingsStage 1 2 3 4
Duration 57 7 7 7
Change Point 0 67 86 101
Signal Timings Diagram
0
0
10
10
20
20
30
30
40
40
50
50
60
60
70
70
80
80
90
90
100
100
110
110
120
120
Time in cycle (sec)
Phas
es
1 10 : 570
2 12 : 767
3 8 : 786
4 12 : 7101
O ON NM ML LK KJ JI I
H HG GF FE ED DC CB BA A

Full Input Data And ResultsNetwork Layout Diagram

Full Input Data And Results
White Rock JunctionPRC: 53.7 %Total Traffic Delay: 17.1 pcuHr
Arm
1-A
3022
Brix
ham
Roa
d(n
o rth
)
123
AAC
Arm2
-A3022
Brix ham
Road
(south)
1 2 3Arm 3 - Kingsway Avenue
1 E
Arm 4 - White Rock
12
FF
Arm5
-
1 2Ar
m6
-
Arm 7 -
1Arm 8 -
1
A
B
D

Full Input Data And Results
Network Results
Item Lane Description LaneType
ControllerStream
Position InFiltered Route Full Phase Arrow
PhaseNumGreens
Total Green(s)
ArrowGreen (s)
DemandFlow (pcu)
Sat Flow(pcu/Hr)
Capacity(pcu)
Deg Sat(%)
Network:White RockJunction
- - N/A - - - - - - - - 58.5%
White RockJunction - - N/A - - - - - - - - 58.5%
1/1A3022 Brixham
Road (north)Ahead Left
U N/A N/A A 1 59 - 263 1949 975 27.0%
1/2A3022 Brixham
Road (north)Ahead
U N/A N/A A 1 59 - 299 2098 1049 28.5%
1/3A3022 Brixham
Road (north)Right
U N/A N/A C 1 16 - 80 1719 244 32.9%
2/1A3022 BrixhamRoad (south)Ahead Left
U N/A N/A B 1 57 - 520 1886 912 57.0%
2/2+2/3A3022 BrixhamRoad (south)Ahead Right
U N/A N/A B D 1 57:15 - 589 2097:1749 989+17 58.5 :58.5%
3/1 Kingsway AvenueRight Left Ahead U N/A N/A E 1 8 - 54 1783 134 40.4%
4/1 White Rock LeftAhead U N/A N/A F 1 14 - 105 1707 213 49.2%
4/2 White Rock Right U N/A N/A F 1 14 - 82 1816 227 36.1%
5/1 U N/A N/A - - - - 503 Inf Inf 0.0%
5/2 U N/A N/A - - - - 500 Inf Inf 0.0%
6/1 U N/A N/A - - - - 323 Inf Inf 0.0%
6/2 U N/A N/A - - - - 311 Inf Inf 0.0%
7/1 U N/A N/A - - - - 41 Inf Inf 0.0%
8/1 U N/A N/A - - - - 314 Inf Inf 0.0%

Full Input Data And Results
Item Arriving (pcu) Leaving(pcu)
Turners InGaps (pcu)
Turners WhenUnopposed(pcu)
Turners InIntergreen(pcu)
UniformDelay(pcuHr)
Rand +OversatDelay(pcuHr)
Storage AreaUniformDelay(pcuHr)
TotalDelay(pcuHr)
Av. DelayPer PCU(s/pcu)
Max. Back ofUniformQueue (pcu)
Rand +OversatQueue (pcu)
MeanMaxQueue(pcu)
Network:White RockJunction
- - 0 0 0 14.0 3.1 0.0 17.1 - - - -
White RockJunction - - 0 0 0 14.0 3.1 0.0 17.1 - - - -
1/1 263 263 - - - 1.3 0.2 - 1.5 19.9 5.0 0.2 5.2
1/2 299 299 - - - 1.5 0.2 - 1.7 19.9 5.7 0.2 5.9
1/3 80 80 - - - 1.0 0.2 - 1.3 57.3 2.4 0.2 2.6
2/1 520 520 - - - 3.2 0.7 - 3.9 26.7 12.3 0.7 12.9
2/2+2/3 589 589 - - - 3.7 0.7 - 4.4 27.1 14.0 0.7 14.7
3/1 54 54 - - - 0.8 0.3 - 1.1 75.4 1.7 0.3 2.0
4/1 105 105 - - - 1.4 0.5 - 1.9 65.4 3.2 0.5 3.7
4/2 82 82 - - - 1.1 0.3 - 1.4 60.5 2.5 0.3 2.8
5/1 503 503 - - - 0.0 0.0 - 0.0 0.0 0.0 0.0 0.0
5/2 500 500 - - - 0.0 0.0 - 0.0 0.0 0.0 0.0 0.0
6/1 323 323 - - - 0.0 0.0 - 0.0 0.0 0.0 0.0 0.0
6/2 311 311 - - - 0.0 0.0 - 0.0 0.0 0.0 0.0 0.0
7/1 41 41 - - - 0.0 0.0 - 0.0 0.0 0.0 0.0 0.0
8/1 314 314 - - - 0.0 0.0 - 0.0 0.0 0.0 0.0 0.0
C1 PRC for Signalled Lanes (%): 53.7 Total Delay for Signalled Lanes (pcuHr): 17.08 Cycle Time (s): 120 PRC Over All Lanes (%): 53.7 Total Delay Over All Lanes(pcuHr): 17.08

Full Input Data And ResultsScenario 28: 'TA 2024 + Dev PM' (FG36: 'TA 2024 + Dev PM', Plan 1: 'Network Control Plan 1')Stage Sequence Diagram
A
B
H
L
O
1 Min: 7
10 52s
C
D
G I
K
M
O
2 Min: 7
12 7s
E
H I
LM
O
3 Min: 7
8 7s
FH I
LMN
4 Min: 7
12 12s
Stage TimingsStage 1 2 3 4
Duration 52 7 7 12
Change Point 0 62 81 96
Signal Timings Diagram
0
0
10
10
20
20
30
30
40
40
50
50
60
60
70
70
80
80
90
90
100
100
110
110
120
120
Time in cycle (sec)
Phas
es
1 10 : 520
2 12 : 762
3 8 : 781
4 12 : 1296
O ON NM ML LK KJ JI I
H HG GF FE ED DC CB BA A

Full Input Data And ResultsNetwork Layout Diagram

Full Input Data And Results
White Rock JunctionPRC: 73.1 %Total Traffic Delay: 21.4 pcuHr
Arm
1-A
3022
Brix
ham
Roa
d(n
o rth
)
123
AAC
Arm2
-A3022
Brix ham
Road
(south)
1 2 3Arm 3 - Kingsway Avenue
1 E
Arm 4 - White Rock
12
FF
Arm5
-
1 2Ar
m6
-
Arm 7 -
1Arm 8 -
1
A
B
D

Full Input Data And Results
Network Results
Item Lane Description LaneType
ControllerStream
Position InFiltered Route Full Phase Arrow
PhaseNumGreens
Total Green(s)
ArrowGreen (s)
DemandFlow (pcu)
Sat Flow(pcu/Hr)
Capacity(pcu)
Deg Sat(%)
Network:White RockJunction
- - N/A - - - - - - - - 52.0%
White RockJunction - - N/A - - - - - - - - 52.0%
1/1A3022 Brixham
Road (north)Ahead Left
U N/A N/A A 1 54 - 453 1948 893 50.7%
1/2A3022 Brixham
Road (north)Ahead
U N/A N/A A 1 54 - 500 2098 962 52.0%
1/3A3022 Brixham
Road (north)Right
U N/A N/A C 1 16 - 108 1719 244 44.3%
2/1A3022 BrixhamRoad (south)Ahead Left
U N/A N/A B 1 52 - 419 1904 841 49.8%
2/2+2/3A3022 BrixhamRoad (south)Ahead Right
U N/A N/A B D 1 52:15 - 471 2097:1749 907+12 51.3 :51.3%
3/1 Kingsway AvenueRight Left Ahead U N/A N/A E 1 8 - 36 1805 135 26.6%
4/1 White Rock LeftAhead U N/A N/A F 1 19 - 143 1702 284 50.4%
4/2 White Rock Right U N/A N/A F 1 19 - 149 1816 303 49.2%
5/1 U N/A N/A - - - - 452 Inf Inf 0.0%
5/2 U N/A N/A - - - - 452 Inf Inf 0.0%
6/1 U N/A N/A - - - - 536 Inf Inf 0.0%
6/2 U N/A N/A - - - - 530 Inf Inf 0.0%
7/1 U N/A N/A - - - - 54 Inf Inf 0.0%
8/1 U N/A N/A - - - - 255 Inf Inf 0.0%
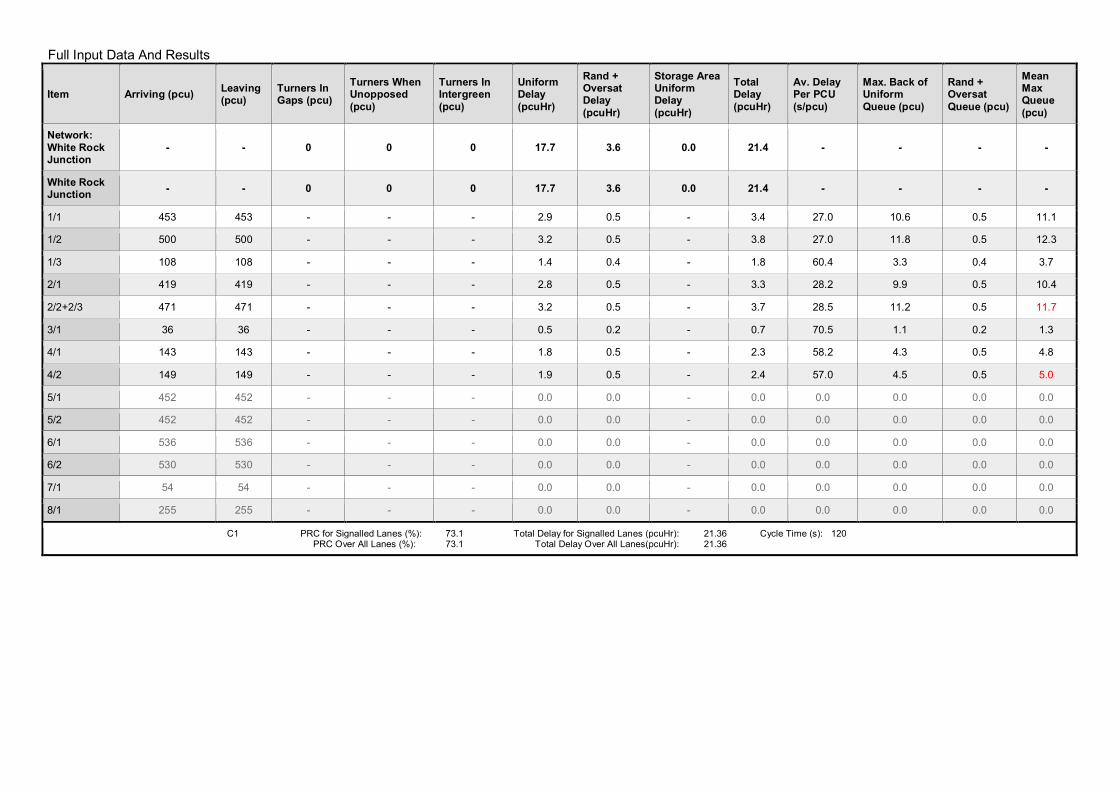
Full Input Data And Results
Item Arriving (pcu) Leaving(pcu)
Turners InGaps (pcu)
Turners WhenUnopposed(pcu)
Turners InIntergreen(pcu)
UniformDelay(pcuHr)
Rand +OversatDelay(pcuHr)
Storage AreaUniformDelay(pcuHr)
TotalDelay(pcuHr)
Av. DelayPer PCU(s/pcu)
Max. Back ofUniformQueue (pcu)
Rand +OversatQueue (pcu)
MeanMaxQueue(pcu)
Network:White RockJunction
- - 0 0 0 17.7 3.6 0.0 21.4 - - - -
White RockJunction - - 0 0 0 17.7 3.6 0.0 21.4 - - - -
1/1 453 453 - - - 2.9 0.5 - 3.4 27.0 10.6 0.5 11.1
1/2 500 500 - - - 3.2 0.5 - 3.8 27.0 11.8 0.5 12.3
1/3 108 108 - - - 1.4 0.4 - 1.8 60.4 3.3 0.4 3.7
2/1 419 419 - - - 2.8 0.5 - 3.3 28.2 9.9 0.5 10.4
2/2+2/3 471 471 - - - 3.2 0.5 - 3.7 28.5 11.2 0.5 11.7
3/1 36 36 - - - 0.5 0.2 - 0.7 70.5 1.1 0.2 1.3
4/1 143 143 - - - 1.8 0.5 - 2.3 58.2 4.3 0.5 4.8
4/2 149 149 - - - 1.9 0.5 - 2.4 57.0 4.5 0.5 5.0
5/1 452 452 - - - 0.0 0.0 - 0.0 0.0 0.0 0.0 0.0
5/2 452 452 - - - 0.0 0.0 - 0.0 0.0 0.0 0.0 0.0
6/1 536 536 - - - 0.0 0.0 - 0.0 0.0 0.0 0.0 0.0
6/2 530 530 - - - 0.0 0.0 - 0.0 0.0 0.0 0.0 0.0
7/1 54 54 - - - 0.0 0.0 - 0.0 0.0 0.0 0.0 0.0
8/1 255 255 - - - 0.0 0.0 - 0.0 0.0 0.0 0.0 0.0
C1 PRC for Signalled Lanes (%): 73.1 Total Delay for Signalled Lanes (pcuHr): 21.36 Cycle Time (s): 120 PRC Over All Lanes (%): 73.1 Total Delay Over All Lanes(pcuHr): 21.36

Full Input Data And ResultsFull Input Data And Results
User and Project DetailsProject: Inglewood
Title: Windy Corner Existing Junction
Location:
File name: Windy Corner Existing Copy (modelled as existing give way).lsg3x
Author: FF
Company: Key Transport Consultants
Address: 26 Berkeley Square, Bristol, BS8 1HP
Notes:

Full Input Data And Results
Network Layout Diagram
Windy Corner Junction
Arm
1-A
379
Dar
tmou
thR
oad
(nor
th)
12
1/1
1/2
Arm2
- A379
Darm
outhR
oad(south)
1 22/1
2/2
Arm 3 - A3022 Brixham Road 13/1
Arm
4-
14/1
Arm
5-
15/1
Arm 6 -
16/1
A
B
C

Full Input Data And Results
Phase Diagram
A
B
C D

Full Input Data And Results
Phase Input DataPhase Name Phase Type Assoc. Phase Street Min Cont Min
A Traffic 7 7
B Traffic 7 7
C Traffic 7 7
D Ind. Arrow A 4 4
Phase Intergreens MatrixStarting Phase
TerminatingPhase
A B C D
A - - 5 -
B - - 6 3
C 5 7 - 5
D - 6 5 -
Phases in StageStage No. Phases in Stage
1 A B
2 A D
3 C
Stage DiagramA
B
C D1 Min >= 7
A
B
C D2 Min >= 4
A
B
C D3 Min >= 7
Phase DelaysTerm. Stage Start Stage Phase Type Value Cont value
1 3 A Losing 1 1
Prohibited Stage ChangeTo Stage
FromStage
1 2 3
1 3 6
2 6 5
3 7 5

Full Input Data And ResultsGive-Way Lane Input DataJunction: Windy Corner Junction
Lane MovementMax Flow
whenGiving Way
(PCU/Hr)
Min Flowwhen
Giving Way(PCU/Hr)
OpposingLane
Opp. LaneCoeff.
Opp.Mvmnts.
Right TurnStorage (PCU)
Non-BlockingStorage(PCU)
RTF Right TurnMove up (s)
Max Turnsin Intergreen
(PCU)
1/2(A379 Dartmouth Road (north)) 6/1 (Right) 1439 0
2/1 1.09 All3.00 - 0.50 3 2.00
2/2 1.09 All
2/1(A379 Darmouth Road (south)) 6/1 (Left) 1940 0 1/2 1.09 All - - - - -

Full Input Data And ResultsLane Input DataJunction: Windy Corner Junction
Lane LaneType Phases Start
Disp.EndDisp.
PhysicalLength(PCU)
SatFlowType
Def UserSaturation
Flow(PCU/Hr)
LaneWidth
(m)Gradient Nearside
Lane TurnsTurningRadius
(m)
1/1(A379
DartmouthRoad (north))
U A 2 3 10.0 Geom - 3.10 0.00 Y Arm 5Ahead Inf
1/2(A379
DartmouthRoad (north))
O A D 2 3 10.4 Geom - 3.00 0.00 Y Arm 6Right 9.30
2/1(A379
DarmouthRoad (south))
O 2 3 10.4 Geom - 4.20 0.00 Y Arm 6Left 48.20
2/2(A379
DarmouthRoad (south))
U B 2 3 60.0 Geom - 3.50 0.00 Y Arm 4Ahead Inf
3/1(A3022
Brixham Road)U C 2 3 60.0 Geom - 3.60 0.00 Y
Arm 4Left 8.90
Arm 5Right 22.10
4/1 U 2 3 60.0 Inf - - - - - -
5/1 U 2 3 60.0 Inf - - - - - -
6/1 U 2 3 60.0 Inf - - - - - -
Traffic Flow GroupsFlow Group Start Time End Time Duration Formula
1: '2017 Base AM' 08:00 09:00 01:00
2: '2017 Base PM' 17:00 18:00 01:00
17: 'TA 2019 AM' 08:00 09:00 01:00 F1+F13
18: 'TA 2019 PM' 17:00 18:00 01:00 F2+F14
21: 'TA 2024 AM' 08:00 09:00 01:00 F1+F15
22: 'TA 2024 PM' 17:00 18:00 01:00 F2+F16
Scenario 1: '2017 Base AM' (FG1: '2017 Base AM', Plan 1: 'Network Control Plan 1')Traffic Flows, DesiredDesired Flow :
Destination
Origin
A B C Tot.
A 0 756 604 1360
B 505 0 27 532
C 646 56 0 702
Tot. 1151 812 631 2594

Full Input Data And Results
Traffic Lane Flows
Lane Scenario 1:2017 Base AM
Junction: Windy Corner Junction
1/1 646
1/2 56
2/1(short) 756
2/2(with short)
1360(In)604(Out)
3/1 532
4/1 631
5/1 1151
6/1 812
Lane Saturation FlowsJunction: Windy Corner Junction
LaneLaneWidth
(m)Gradient Nearside
LaneAllowedTurns
TurningRadius
(m)Turning
Prop.Sat Flow(PCU/Hr)
Flared Sat Flow(PCU/Hr)
1/1(A379 Dartmouth Road (north)) 3.10 0.00 Y Arm 5 Ahead Inf 100.0 % 1925 1925
1/2(A379 Dartmouth Road (north)) 3.00 0.00 Y Arm 6 Right 9.30 100.0 % 1649 1649
2/1(A379 Darmouth Road (south)) 4.20 0.00 Y Arm 6 Left 48.20 100.0 % 1974 1974
2/2(A379 Darmouth Road (south)) 3.50 0.00 Y Arm 4 Ahead Inf 100.0 % 1965 1965
3/1(A3022 Brixham Road) 3.60 0.00 Y
Arm 4 Left 8.90 5.1 %1841 1841
Arm 5 Right 22.10 94.9 %
4/1 Infinite Saturation Flow Inf Inf
5/1 Infinite Saturation Flow Inf Inf
6/1 Infinite Saturation Flow Inf Inf
Scenario 2: '2017 Base PM' (FG2: '2017 Base PM', Plan 1: 'Network Control Plan 1')Traffic Flows, DesiredDesired Flow :
Destination
Origin
A B C Tot.
A 0 590 496 1086
B 709 0 44 753
C 565 43 0 608
Tot. 1274 633 540 2447

Full Input Data And Results
Traffic Lane Flows
Lane Scenario 2:2017 Base PM
Junction: Windy Corner Junction
1/1 565
1/2 43
2/1(short) 590
2/2(with short)
1086(In)496(Out)
3/1 753
4/1 540
5/1 1274
6/1 633
Lane Saturation FlowsJunction: Windy Corner Junction
LaneLaneWidth
(m)Gradient Nearside
LaneAllowedTurns
TurningRadius
(m)Turning
Prop.Sat Flow(PCU/Hr)
Flared Sat Flow(PCU/Hr)
1/1(A379 Dartmouth Road (north)) 3.10 0.00 Y Arm 5 Ahead Inf 100.0 % 1925 1925
1/2(A379 Dartmouth Road (north)) 3.00 0.00 Y Arm 6 Right 9.30 100.0 % 1649 1649
2/1(A379 Darmouth Road (south)) 4.20 0.00 Y Arm 6 Left 48.20 100.0 % 1974 1974
2/2(A379 Darmouth Road (south)) 3.50 0.00 Y Arm 4 Ahead Inf 100.0 % 1965 1965
3/1(A3022 Brixham Road) 3.60 0.00 Y
Arm 4 Left 8.90 5.8 %1839 1839
Arm 5 Right 22.10 94.2 %
4/1 Infinite Saturation Flow Inf Inf
5/1 Infinite Saturation Flow Inf Inf
6/1 Infinite Saturation Flow Inf Inf
Scenario 11: 'TA 2019 AM' (FG17: 'TA 2019 AM', Plan 1: 'Network Control Plan 1')Traffic Flows, DesiredDesired Flow :
Destination
Origin
A B C Tot.
A 0 929 604 1533
B 562 0 28 590
C 646 56 0 702
Tot. 1208 985 632 2825

Full Input Data And Results
Traffic Lane Flows
Lane Scenario 11:TA 2019 AM
Junction: Windy Corner Junction
1/1 646
1/2 56
2/1(short) 929
2/2(with short)
1533(In)604(Out)
3/1 590
4/1 632
5/1 1208
6/1 985
Lane Saturation FlowsJunction: Windy Corner Junction
LaneLaneWidth
(m)Gradient Nearside
LaneAllowedTurns
TurningRadius
(m)Turning
Prop.Sat Flow(PCU/Hr)
Flared Sat Flow(PCU/Hr)
1/1(A379 Dartmouth Road (north)) 3.10 0.00 Y Arm 5 Ahead Inf 100.0 % 1925 1925
1/2(A379 Dartmouth Road (north)) 3.00 0.00 Y Arm 6 Right 9.30 100.0 % 1649 1649
2/1(A379 Darmouth Road (south)) 4.20 0.00 Y Arm 6 Left 48.20 100.0 % 1974 1974
2/2(A379 Darmouth Road (south)) 3.50 0.00 Y Arm 4 Ahead Inf 100.0 % 1965 1965
3/1(A3022 Brixham Road) 3.60 0.00 Y
Arm 4 Left 8.90 4.7 %1841 1841
Arm 5 Right 22.10 95.3 %
4/1 Infinite Saturation Flow Inf Inf
5/1 Infinite Saturation Flow Inf Inf
6/1 Infinite Saturation Flow Inf Inf
Scenario 12: 'TA 2019 PM' (FG18: 'TA 2019 PM', Plan 1: 'Network Control Plan 1')Traffic Flows, DesiredDesired Flow :
Destination
Origin
A B C Tot.
A 0 707 496 1203
B 840 0 46 886
C 565 45 0 610
Tot. 1405 752 542 2699

Full Input Data And Results
Traffic Lane Flows
Lane Scenario 12:TA 2019 PM
Junction: Windy Corner Junction
1/1 565
1/2 45
2/1(short) 707
2/2(with short)
1203(In)496(Out)
3/1 886
4/1 542
5/1 1405
6/1 752
Lane Saturation FlowsJunction: Windy Corner Junction
LaneLaneWidth
(m)Gradient Nearside
LaneAllowedTurns
TurningRadius
(m)Turning
Prop.Sat Flow(PCU/Hr)
Flared Sat Flow(PCU/Hr)
1/1(A379 Dartmouth Road (north)) 3.10 0.00 Y Arm 5 Ahead Inf 100.0 % 1925 1925
1/2(A379 Dartmouth Road (north)) 3.00 0.00 Y Arm 6 Right 9.30 100.0 % 1649 1649
2/1(A379 Darmouth Road (south)) 4.20 0.00 Y Arm 6 Left 48.20 100.0 % 1974 1974
2/2(A379 Darmouth Road (south)) 3.50 0.00 Y Arm 4 Ahead Inf 100.0 % 1965 1965
3/1(A3022 Brixham Road) 3.60 0.00 Y
Arm 4 Left 8.90 5.2 %1840 1840
Arm 5 Right 22.10 94.8 %
4/1 Infinite Saturation Flow Inf Inf
5/1 Infinite Saturation Flow Inf Inf
6/1 Infinite Saturation Flow Inf Inf
Scenario 15: 'TA 2024 AM' (FG21: 'TA 2024 AM', Plan 1: 'Network Control Plan 1')Traffic Flows, DesiredDesired Flow :
Destination
Origin
A B C Tot.
A 0 968 604 1572
B 592 0 28 620
C 646 57 0 703
Tot. 1238 1025 632 2895

Full Input Data And Results
Traffic Lane Flows
Lane Scenario 15:TA 2024 AM
Junction: Windy Corner Junction
1/1 646
1/2 57
2/1(short) 968
2/2(with short)
1572(In)604(Out)
3/1 620
4/1 632
5/1 1238
6/1 1025
Lane Saturation FlowsJunction: Windy Corner Junction
LaneLaneWidth
(m)Gradient Nearside
LaneAllowedTurns
TurningRadius
(m)Turning
Prop.Sat Flow(PCU/Hr)
Flared Sat Flow(PCU/Hr)
1/1(A379 Dartmouth Road (north)) 3.10 0.00 Y Arm 5 Ahead Inf 100.0 % 1925 1925
1/2(A379 Dartmouth Road (north)) 3.00 0.00 Y Arm 6 Right 9.30 100.0 % 1649 1649
2/1(A379 Darmouth Road (south)) 4.20 0.00 Y Arm 6 Left 48.20 100.0 % 1974 1974
2/2(A379 Darmouth Road (south)) 3.50 0.00 Y Arm 4 Ahead Inf 100.0 % 1965 1965
3/1(A3022 Brixham Road) 3.60 0.00 Y
Arm 4 Left 8.90 4.5 %1842 1842
Arm 5 Right 22.10 95.5 %
4/1 Infinite Saturation Flow Inf Inf
5/1 Infinite Saturation Flow Inf Inf
6/1 Infinite Saturation Flow Inf Inf
Scenario 16: 'TA 2024 PM' (FG22: 'TA 2024 PM', Plan 1: 'Network Control Plan 1')Traffic Flows, DesiredDesired Flow :
Destination
Origin
A B C Tot.
A 0 764 496 1260
B 880 0 46 926
C 565 45 0 610
Tot. 1445 809 542 2796

Full Input Data And Results
Traffic Lane Flows
Lane Scenario 16:TA 2024 PM
Junction: Windy Corner Junction
1/1 565
1/2 45
2/1(short) 764
2/2(with short)
1260(In)496(Out)
3/1 926
4/1 542
5/1 1445
6/1 809
Lane Saturation FlowsJunction: Windy Corner Junction
LaneLaneWidth
(m)Gradient Nearside
LaneAllowedTurns
TurningRadius
(m)Turning
Prop.Sat Flow(PCU/Hr)
Flared Sat Flow(PCU/Hr)
1/1(A379 Dartmouth Road (north)) 3.10 0.00 Y Arm 5 Ahead Inf 100.0 % 1925 1925
1/2(A379 Dartmouth Road (north)) 3.00 0.00 Y Arm 6 Right 9.30 100.0 % 1649 1649
2/1(A379 Darmouth Road (south)) 4.20 0.00 Y Arm 6 Left 48.20 100.0 % 1974 1974
2/2(A379 Darmouth Road (south)) 3.50 0.00 Y Arm 4 Ahead Inf 100.0 % 1965 1965
3/1(A3022 Brixham Road) 3.60 0.00 Y
Arm 4 Left 8.90 5.0 %1841 1841
Arm 5 Right 22.10 95.0 %
4/1 Infinite Saturation Flow Inf Inf
5/1 Infinite Saturation Flow Inf Inf
6/1 Infinite Saturation Flow Inf Inf
Scenario 1: '2017 Base AM' (FG1: '2017 Base AM', Plan 1: 'Network Control Plan 1')Stage Sequence Diagram
A
B
1 Min: 7
7 43s
AD2 Min: 4
3 4s
C3 Min: 7
5 28s

Full Input Data And Results
Stage TimingsStage 1 2 3
Duration 43 4 28
Change Point 0 50 57
Signal Timings Diagram
0
0
10
10
20
20
30
30
40
40
50
50
60
60
70
70
80
80
90
90
Time in cycle (sec)
Pha
ses
1 7 : 430
23 : 450
3 5 : 2857
D DC CB BA A

Full Input Data And ResultsNetwork Layout Diagram

Full Input Data And Results
Windy Corner JunctionPRC: -0.7 %Total Traffic Delay: 19.1 pcuHr
C1
0
1
50
257
3
90
Arm
1- A
379
Dar
tmou
thR
oad
(nor
th)
12
AAD
Arm2
- A379D
armouth
Road
(south)
1 2
B
Arm 3 - A3022 Brixham Road 1
C
Arm4
-
1
Arm5
-
Arm 6 -
1
B
C

Full Input Data And Results
Network Results
Item LaneDescription
LaneType
ControllerStream
Position InFiltered Route Full Phase Arrow
PhaseNumGreens
Total Green(s)
ArrowGreen (s)
DemandFlow (pcu)
Sat Flow(pcu/Hr)
Capacity(pcu)
Deg Sat(%)
Network:Windy CornerExistingJunction
- - N/A - - - - - - - - 90.6%
Windy CornerJunction - - N/A - - - - - - - - 90.6%
1/1A379 Dartmouth
Road (north)Ahead
U N/A N/A A 1 52 - 646 1925 1134 57.0%
1/2A379 Dartmouth
Road (north)Right
O N/A N/A A D 1 52 4 56 1649 161 34.8%
2/2+2/1A379 Darmouth
Road (south)Ahead Left
U+O N/A N/A B - 1 43 - 1360 1965:1974 667+834 90.6 :90.6%
3/1 A3022 BrixhamRoad Left Right U N/A N/A C 1 28 - 532 1841 593 89.7%
4/1 U N/A N/A - - - - 631 Inf Inf 0.0%
5/1 U N/A N/A - - - - 1151 Inf Inf 0.0%
6/1 U N/A N/A - - - - 812 Inf Inf 0.0%

Full Input Data And Results
Item Arriving (pcu) Leaving(pcu)
Turners InGaps (pcu)
Turners WhenUnopposed(pcu)
Turners InIntergreen(pcu)
UniformDelay(pcuHr)
Rand +OversatDelay(pcuHr)
Storage AreaUniformDelay(pcuHr)
TotalDelay(pcuHr)
Av. DelayPer PCU(s/pcu)
Max. Back ofUniformQueue (pcu)
Rand +OversatQueue (pcu)
MeanMaxQueue(pcu)
Network:Windy CornerExistingJunction
- - 501 311 0 9.3 9.3 0.4 19.1 - - - -
Windy CornerJunction - - 501 311 0 9.3 9.3 0.4 19.1 - - - -
1/1 646 646 - - - 2.1 0.7 - 2.7 15.1 9.9 0.7 10.5
1/2 56 56 56 0 0 0.1 0.3 0.4 0.8 51.8 0.6 0.3 0.9
2/2+2/1 1360 1360 445 311 0 2.9 4.5 - 7.4 19.6 13.4 4.5 18.0
3/1 532 532 - - - 4.3 3.9 - 8.2 55.2 12.6 3.9 16.4
4/1 631 631 - - - 0.0 0.0 - 0.0 0.0 0.0 0.0 0.0
5/1 1151 1151 - - - 0.0 0.0 - 0.0 0.0 0.0 0.0 0.0
6/1 812 812 - - - 0.0 0.0 - 0.0 0.0 0.0 0.0 0.0
C1 PRC for Signalled Lanes (%): -0.7 Total Delay for Signalled Lanes (pcuHr): 19.09 Cycle Time (s): 90 PRC Over All Lanes (%): -0.7 Total Delay Over All Lanes(pcuHr): 19.09

Full Input Data And ResultsScenario 2: '2017 Base PM' (FG2: '2017 Base PM', Plan 1: 'Network Control Plan 1')Stage Sequence Diagram
A
B
1 Min: 7
7 31s
AD2 Min: 4
3 4s
C3 Min: 7
5 40s
Stage TimingsStage 1 2 3
Duration 31 4 40
Change Point 0 38 45
Signal Timings Diagram
0
0
10
10
20
20
30
30
40
40
50
50
60
60
70
70
80
80
90
90
Time in cycle (sec)
Pha
ses
1 7 : 310
23 : 438
3 5 : 4045
D DC CB BA A

Full Input Data And ResultsNetwork Layout Diagram

Full Input Data And Results
Windy Corner JunctionPRC: 0.1 %Total Traffic Delay: 20.6 pcuHr
C1
0
1
38
2
45
390
Arm
1- A
379
Dar
tmou
thR
oad
(nor
th)
12
AAD
Arm2
- A379D
armouth
Road
(south)
1 2
B
Arm 3 - A3022 Brixham Road 1
C
Arm4
-
1
Arm5
-
Arm 6 -
1
B
C

Full Input Data And Results
Network Results
Item LaneDescription
LaneType
ControllerStream
Position InFiltered Route Full Phase Arrow
PhaseNumGreens
Total Green(s)
ArrowGreen (s)
DemandFlow (pcu)
Sat Flow(pcu/Hr)
Capacity(pcu)
Deg Sat(%)
Network:Windy CornerExistingJunction
- - N/A - - - - - - - - 89.9%
Windy CornerJunction - - N/A - - - - - - - - 89.9%
1/1A379 Dartmouth
Road (north)Ahead
U N/A N/A A 1 40 - 565 1925 877 64.4%
1/2A379 Dartmouth
Road (north)Right
O N/A N/A A D 1 40 4 43 1649 207 20.8%
2/2+2/1A379 Darmouth
Road (south)Ahead Left
U+O N/A N/A B - 1 31 - 1086 1965:1974 554+659 89.6 :89.6%
3/1 A3022 BrixhamRoad Left Right U N/A N/A C 1 40 - 753 1839 838 89.9%
4/1 U N/A N/A - - - - 540 Inf Inf 0.0%
5/1 U N/A N/A - - - - 1274 Inf Inf 0.0%
6/1 U N/A N/A - - - - 633 Inf Inf 0.0%

Full Input Data And Results
Item Arriving (pcu) Leaving(pcu)
Turners InGaps (pcu)
Turners WhenUnopposed(pcu)
Turners InIntergreen(pcu)
UniformDelay(pcuHr)
Rand +OversatDelay(pcuHr)
Storage AreaUniformDelay(pcuHr)
TotalDelay(pcuHr)
Av. DelayPer PCU(s/pcu)
Max. Back ofUniformQueue (pcu)
Rand +OversatQueue (pcu)
MeanMaxQueue(pcu)
Network:Windy CornerExistingJunction
- - 312 321 0 11.3 9.1 0.1 20.6 - - - -
Windy CornerJunction - - 312 321 0 11.3 9.1 0.1 20.6 - - - -
1/1 565 565 - - - 3.0 0.9 - 3.9 24.6 10.8 0.9 11.7
1/2 43 43 43 0 0 0.2 0.1 0.1 0.4 37.0 0.6 0.1 0.7
2/2+2/1 1086 1086 269 321 0 3.4 4.0 - 7.5 24.8 11.0 4.0 15.0
3/1 753 753 - - - 4.7 4.1 - 8.8 42.0 17.2 4.1 21.2
4/1 540 540 - - - 0.0 0.0 - 0.0 0.0 0.0 0.0 0.0
5/1 1274 1274 - - - 0.0 0.0 - 0.0 0.0 0.0 0.0 0.0
6/1 633 633 - - - 0.0 0.0 - 0.0 0.0 0.0 0.0 0.0
C1 PRC for Signalled Lanes (%): 0.1 Total Delay for Signalled Lanes (pcuHr): 20.58 Cycle Time (s): 90 PRC Over All Lanes (%): 0.1 Total Delay Over All Lanes(pcuHr): 20.58

Full Input Data And ResultsScenario 11: 'TA 2019 AM' (FG17: 'TA 2019 AM', Plan 1: 'Network Control Plan 1')Stage Sequence Diagram
A
B
1 Min: 7
7 42s
AD2 Min: 4
3 4s
C3 Min: 7
5 29s
Stage TimingsStage 1 2 3
Duration 42 4 29
Change Point 0 49 56
Signal Timings Diagram
0
0
10
10
20
20
30
30
40
40
50
50
60
60
70
70
80
80
90
90
Time in cycle (sec)
Pha
ses
1 7 : 420
23 : 449
3 5 : 2956
D DC CB BA A

Full Input Data And ResultsNetwork Layout Diagram

Full Input Data And Results
Windy Corner JunctionPRC: -6.8 %Total Traffic Delay: 28.4 pcuHr
C1
0
1
49
256
3
90
Arm
1- A
379
Dar
tmou
thR
oad
(nor
th)
12
AAD
Arm2
- A379D
armouth
Road
(south)
1 2
B
Arm 3 - A3022 Brixham Road 1
C
Arm4
-
1
Arm5
-
Arm 6 -
1
B
C

Full Input Data And Results
Network Results
Item LaneDescription
LaneType
ControllerStream
Position InFiltered Route Full Phase Arrow
PhaseNumGreens
Total Green(s)
ArrowGreen (s)
DemandFlow (pcu)
Sat Flow(pcu/Hr)
Capacity(pcu)
Deg Sat(%)
Network:Windy CornerExistingJunction
- - N/A - - - - - - - - 96.1%
Windy CornerJunction - - N/A - - - - - - - - 96.1%
1/1A379 Dartmouth
Road (north)Ahead
U N/A N/A A 1 51 - 646 1925 1112 58.1%
1/2A379 Dartmouth
Road (north)Right
O N/A N/A A D 1 51 4 56 1649 148 37.7%
2/2+2/1A379 Darmouth
Road (south)Ahead Left
U+O N/A N/A B - 1 42 - 1533 1965:1974 630+969 95.9 :95.9%
3/1 A3022 BrixhamRoad Left Right U N/A N/A C 1 29 - 590 1841 614 96.1%
4/1 U N/A N/A - - - - 632 Inf Inf 0.0%
5/1 U N/A N/A - - - - 1208 Inf Inf 0.0%
6/1 U N/A N/A - - - - 985 Inf Inf 0.0%

Full Input Data And Results
Item Arriving (pcu) Leaving(pcu)
Turners InGaps (pcu)
Turners WhenUnopposed(pcu)
Turners InIntergreen(pcu)
UniformDelay(pcuHr)
Rand +OversatDelay(pcuHr)
Storage AreaUniformDelay(pcuHr)
TotalDelay(pcuHr)
Av. DelayPer PCU(s/pcu)
Max. Back ofUniformQueue (pcu)
Rand +OversatQueue (pcu)
MeanMaxQueue(pcu)
Network:Windy CornerExistingJunction
- - 593 392 0 10.2 17.7 0.5 28.4 - - - -
Windy CornerJunction - - 593 392 0 10.2 17.7 0.5 28.4 - - - -
1/1 646 646 - - - 2.2 0.7 - 2.9 15.9 10.2 0.7 10.9
1/2 56 56 56 0 0 0.1 0.3 0.5 0.9 57.6 0.6 0.3 0.9
2/2+2/1 1533 1533 537 392 0 3.1 9.1 - 12.2 28.7 16.8 9.1 25.9
3/1 590 590 - - - 4.8 7.6 - 12.4 75.8 14.4 7.6 22.0
4/1 632 632 - - - 0.0 0.0 - 0.0 0.0 0.0 0.0 0.0
5/1 1208 1208 - - - 0.0 0.0 - 0.0 0.0 0.0 0.0 0.0
6/1 985 985 - - - 0.0 0.0 - 0.0 0.0 0.0 0.0 0.0
C1 PRC for Signalled Lanes (%): -6.8 Total Delay for Signalled Lanes (pcuHr): 28.37 Cycle Time (s): 90 PRC Over All Lanes (%): -6.8 Total Delay Over All Lanes(pcuHr): 28.37

Full Input Data And ResultsScenario 12: 'TA 2019 PM' (FG18: 'TA 2019 PM', Plan 1: 'Network Control Plan 1')Stage Sequence Diagram
A
B
1 Min: 7
7 27s
AD2 Min: 4
3 4s
C3 Min: 7
5 44s
Stage TimingsStage 1 2 3
Duration 27 4 44
Change Point 0 34 41
Signal Timings Diagram
0
0
10
10
20
20
30
30
40
40
50
50
60
60
70
70
80
80
90
90
Time in cycle (sec)
Pha
ses
1 7 : 270
23 : 434
3 5 : 4441
D DC CB BA A

Full Input Data And ResultsNetwork Layout Diagram

Full Input Data And Results
Windy Corner JunctionPRC: -9.3 %Total Traffic Delay: 36.3 pcuHr
C1
0
1
342
41
3 90
Arm
1- A
379
Dar
tmou
thR
oad
(nor
th)
12
AAD
Arm2
- A379D
armouth
Road
(south)
1 2
B
Arm 3 - A3022 Brixham Road 1
C
Arm4
-
1
Arm5
-
Arm 6 -
1
B
C

Full Input Data And Results
Network Results
Item LaneDescription
LaneType
ControllerStream
Position InFiltered Route Full Phase Arrow
PhaseNumGreens
Total Green(s)
ArrowGreen (s)
DemandFlow (pcu)
Sat Flow(pcu/Hr)
Capacity(pcu)
Deg Sat(%)
Network:Windy CornerExistingJunction
- - N/A - - - - - - - - 98.4%
Windy CornerJunction - - N/A - - - - - - - - 98.4%
1/1A379 Dartmouth
Road (north)Ahead
U N/A N/A A 1 36 - 565 1925 791 71.4%
1/2A379 Dartmouth
Road (north)Right
O N/A N/A A D 1 36 4 45 1649 167 26.9%
2/2+2/1A379 Darmouth
Road (south)Ahead Left
U+O N/A N/A B - 1 27 - 1203 1965:1974 504+719 98.4 :98.4%
3/1 A3022 BrixhamRoad Left Right U N/A N/A C 1 44 - 886 1840 920 96.3%
4/1 U N/A N/A - - - - 542 Inf Inf 0.0%
5/1 U N/A N/A - - - - 1405 Inf Inf 0.0%
6/1 U N/A N/A - - - - 752 Inf Inf 0.0%

Full Input Data And Results
Item Arriving (pcu) Leaving(pcu)
Turners InGaps (pcu)
Turners WhenUnopposed(pcu)
Turners InIntergreen(pcu)
UniformDelay(pcuHr)
Rand +OversatDelay(pcuHr)
Storage AreaUniformDelay(pcuHr)
TotalDelay(pcuHr)
Av. DelayPer PCU(s/pcu)
Max. Back ofUniformQueue (pcu)
Rand +OversatQueue (pcu)
MeanMaxQueue(pcu)
Network:Windy CornerExistingJunction
- - 336 416 0 13.0 23.1 0.2 36.3 - - - -
Windy CornerJunction - - 336 416 0 13.0 23.1 0.2 36.3 - - - -
1/1 565 565 - - - 3.5 1.2 - 4.7 30.0 11.8 1.2 13.0
1/2 45 45 45 0 0 0.2 0.2 0.2 0.6 48.8 0.7 0.2 0.9
2/2+2/1 1203 1203 291 416 0 4.0 13.0 - 17.0 51.0 14.7 13.0 27.8
3/1 886 886 - - - 5.3 8.6 - 14.0 56.8 21.2 8.6 29.8
4/1 542 542 - - - 0.0 0.0 - 0.0 0.0 0.0 0.0 0.0
5/1 1405 1405 - - - 0.0 0.0 - 0.0 0.0 0.0 0.0 0.0
6/1 752 752 - - - 0.0 0.0 - 0.0 0.0 0.0 0.0 0.0
C1 PRC for Signalled Lanes (%): -9.3 Total Delay for Signalled Lanes (pcuHr): 36.32 Cycle Time (s): 90 PRC Over All Lanes (%): -9.3 Total Delay Over All Lanes(pcuHr): 36.32

Full Input Data And ResultsScenario 15: 'TA 2024 AM' (FG21: 'TA 2024 AM', Plan 1: 'Network Control Plan 1')Stage Sequence Diagram
A
B
1 Min: 7
7 41s
AD2 Min: 4
3 4s
C3 Min: 7
5 30s
Stage TimingsStage 1 2 3
Duration 41 4 30
Change Point 0 48 55
Signal Timings Diagram
0
0
10
10
20
20
30
30
40
40
50
50
60
60
70
70
80
80
90
90
Time in cycle (sec)
Pha
ses
1 7 : 410
23 : 448
3 5 : 3055
D DC CB BA A

Full Input Data And ResultsNetwork Layout Diagram

Full Input Data And Results
Windy Corner JunctionPRC: -8.9 %Total Traffic Delay: 35.0 pcuHr
C1
0
1
48
255
3
90
Arm
1- A
379
Dar
tmou
thR
oad
(nor
th)
12
AAD
Arm2
- A379D
armouth
Road
(south)
1 2
B
Arm 3 - A3022 Brixham Road 1
C
Arm4
-
1
Arm5
-
Arm 6 -
1
B
C

Full Input Data And Results
Network Results
Item LaneDescription
LaneType
ControllerStream
Position InFiltered Route Full Phase Arrow
PhaseNumGreens
Total Green(s)
ArrowGreen (s)
DemandFlow (pcu)
Sat Flow(pcu/Hr)
Capacity(pcu)
Deg Sat(%)
Network:Windy CornerExistingJunction
- - N/A - - - - - - - - 98.0%
Windy CornerJunction - - N/A - - - - - - - - 98.0%
1/1A379 Dartmouth
Road (north)Ahead
U N/A N/A A 1 50 - 646 1925 1091 59.2%
1/2A379 Dartmouth
Road (north)Right
O N/A N/A A D 1 50 4 57 1649 146 39.2%
2/2+2/1A379 Darmouth
Road (south)Ahead Left
U+O N/A N/A B - 1 41 - 1572 1965:1974 616+988 98.0 :98.0%
3/1 A3022 BrixhamRoad Left Right U N/A N/A C 1 30 - 620 1842 634 97.7%
4/1 U N/A N/A - - - - 632 Inf Inf 0.0%
5/1 U N/A N/A - - - - 1238 Inf Inf 0.0%
6/1 U N/A N/A - - - - 1025 Inf Inf 0.0%

Full Input Data And Results
Item Arriving (pcu) Leaving(pcu)
Turners InGaps (pcu)
Turners WhenUnopposed(pcu)
Turners InIntergreen(pcu)
UniformDelay(pcuHr)
Rand +OversatDelay(pcuHr)
Storage AreaUniformDelay(pcuHr)
TotalDelay(pcuHr)
Av. DelayPer PCU(s/pcu)
Max. Back ofUniformQueue (pcu)
Rand +OversatQueue (pcu)
MeanMaxQueue(pcu)
Network:Windy CornerExistingJunction
- - 606 419 0 10.7 23.8 0.5 35.0 - - - -
Windy CornerJunction - - 606 419 0 10.7 23.8 0.5 35.0 - - - -
1/1 646 646 - - - 2.3 0.7 - 3.0 16.8 10.4 0.7 11.1
1/2 57 57 57 0 0 0.1 0.3 0.5 0.9 59.7 0.6 0.3 1.0
2/2+2/1 1572 1572 549 419 0 3.3 13.4 - 16.7 38.3 19.6 13.4 33.0
3/1 620 620 - - - 5.0 9.3 - 14.4 83.4 15.2 9.3 24.5
4/1 632 632 - - - 0.0 0.0 - 0.0 0.0 0.0 0.0 0.0
5/1 1238 1238 - - - 0.0 0.0 - 0.0 0.0 0.0 0.0 0.0
6/1 1025 1025 - - - 0.0 0.0 - 0.0 0.0 0.0 0.0 0.0
C1 PRC for Signalled Lanes (%): -8.9 Total Delay for Signalled Lanes (pcuHr): 35.03 Cycle Time (s): 90 PRC Over All Lanes (%): -8.9 Total Delay Over All Lanes(pcuHr): 35.03

Full Input Data And ResultsScenario 16: 'TA 2024 PM' (FG22: 'TA 2024 PM', Plan 1: 'Network Control Plan 1')Stage Sequence Diagram
A
B
1 Min: 7
7 27s
AD2 Min: 4
3 4s
C3 Min: 7
5 44s
Stage TimingsStage 1 2 3
Duration 27 4 44
Change Point 0 34 41
Signal Timings Diagram
0
0
10
10
20
20
30
30
40
40
50
50
60
60
70
70
80
80
90
90
Time in cycle (sec)
Pha
ses
1 7 : 270
23 : 434
3 5 : 4441
D DC CB BA A

Full Input Data And ResultsNetwork Layout Diagram

Full Input Data And Results
Windy Corner JunctionPRC: -11.8 %Total Traffic Delay: 47.3 pcuHr
C1
0
1
342
41
3 90
Arm
1- A
379
Dar
tmou
thR
oad
(nor
th)
12
AAD
Arm2
- A379D
armouth
Road
(south)
1 2
B
Arm 3 - A3022 Brixham Road 1
C
Arm4
-
1
Arm5
-
Arm 6 -
1
B
C

Full Input Data And Results
Network Results
Item LaneDescription
LaneType
ControllerStream
Position InFiltered Route Full Phase Arrow
PhaseNumGreens
Total Green(s)
ArrowGreen (s)
DemandFlow (pcu)
Sat Flow(pcu/Hr)
Capacity(pcu)
Deg Sat(%)
Network:Windy CornerExistingJunction
- - N/A - - - - - - - - 100.6%
Windy CornerJunction - - N/A - - - - - - - - 100.6%
1/1A379 Dartmouth
Road (north)Ahead
U N/A N/A A 1 36 - 565 1925 791 71.4%
1/2A379 Dartmouth
Road (north)Right
O N/A N/A A D 1 36 4 45 1649 161 27.9%
2/2+2/1A379 Darmouth
Road (south)Ahead Left
U+O N/A N/A B - 1 27 - 1260 1965:1974 500+771 99.1 :99.1%
3/1 A3022 BrixhamRoad Left Right U N/A N/A C 1 44 - 926 1841 921 100.6%
4/1 U N/A N/A - - - - 542 Inf Inf 0.0%
5/1 U N/A N/A - - - - 1445 Inf Inf 0.0%
6/1 U N/A N/A - - - - 809 Inf Inf 0.0%

Full Input Data And Results
Item Arriving (pcu) Leaving(pcu)
Turners InGaps (pcu)
Turners WhenUnopposed(pcu)
Turners InIntergreen(pcu)
UniformDelay(pcuHr)
Rand +OversatDelay(pcuHr)
Storage AreaUniformDelay(pcuHr)
TotalDelay(pcuHr)
Av. DelayPer PCU(s/pcu)
Max. Back ofUniformQueue (pcu)
Rand +OversatQueue (pcu)
Mean MaxQueue(pcu)
Network:Windy CornerExistingJunction
- - 359 450 0 13.8 33.3 0.2 47.3 - - - -
Windy CornerJunction - - 359 450 0 13.8 33.3 0.2 47.3 - - - -
1/1 565 565 - - - 3.5 1.2 - 4.7 30.0 11.8 1.2 13.0
1/2 45 45 45 0 0 0.2 0.2 0.2 0.6 50.5 0.7 0.2 0.9
2/2+2/1 1260 1260 314 450 0 4.0 15.2 - 19.2 54.9 15.3 15.2 30.5
3/1 926 921 - - - 6.1 16.7 - 22.7 88.4 23.3 16.7 39.9
4/1 542 542 - - - 0.0 0.0 - 0.0 0.0 0.0 0.0 0.0
5/1 1440 1440 - - - 0.0 0.0 - 0.0 0.0 0.0 0.0 0.0
6/1 809 809 - - - 0.0 0.0 - 0.0 0.0 0.0 0.0 0.0
C1 PRC for Signalled Lanes (%): -11.8 Total Delay for Signalled Lanes (pcuHr): 47.28 Cycle Time (s): 90 PRC Over All Lanes (%): -11.8 Total Delay Over All Lanes(pcuHr): 47.28

Full Input Data And ResultsFull Input Data And Results
User and Project DetailsProject: Inglewood
Title: Windy Corner Junction - with Torbay Council Proposed Highway Works
Location:
File name: Windy Corner Existing Copy (modelled with Torbay proposed highway works0734-033A).lsg3x
Author: FF
Company: Key Transport Consultants
Address: 26 Berkeley Square, Bristol, BS8 1HP
Notes:

Full Input Data And Results
Network Layout Diagram
Windy Corner Junction
Arm
1-A
379
Dar
tmou
thR
oad
(nor
th)
12
1/1
1/2
Arm2
- A379
Darm
outhR
oad(south)
1 22/1
2/2
Arm 3 - A3022 Brixham Road 13/1
Arm
4-
14/1
Arm
5-
15/1
Arm 6 -
16/1
A
B
C

Full Input Data And Results
Phase Diagram
A
B
C D

Full Input Data And Results
Phase Input DataPhase Name Phase Type Assoc. Phase Street Min Cont Min
A Traffic 7 7
B Traffic 7 7
C Traffic 7 7
D Ind. Arrow A 4 4
Phase Intergreens MatrixStarting Phase
TerminatingPhase
A B C D
A - - 5 -
B - - 6 3
C 5 7 - 5
D - 6 5 -
Phases in StageStage No. Phases in Stage
1 A B
2 A D
3 C
Stage DiagramA
B
C D1 Min >= 7
A
B
C D2 Min >= 4
A
B
C D3 Min >= 7
Phase DelaysTerm. Stage Start Stage Phase Type Value Cont value
1 3 A Losing 1 1
Prohibited Stage ChangeTo Stage
FromStage
1 2 3
1 3 6
2 6 5
3 7 5

Full Input Data And ResultsGive-Way Lane Input DataJunction: Windy Corner Junction
Lane MovementMax Flow
whenGiving Way
(PCU/Hr)
Min Flowwhen
Giving Way(PCU/Hr)
OpposingLane
Opp. LaneCoeff.
Opp.Mvmnts.
Right TurnStorage (PCU)
Non-BlockingStorage(PCU)
RTF Right TurnMove up (s)
Max Turnsin Intergreen
(PCU)
1/2(A379 Dartmouth Road (north)) 6/1 (Right) 1439 0
2/1 1.09 All3.00 - 0.50 3 2.00
2/2 1.09 All
2/1(A379 Darmouth Road (south)) 6/1 (Left) 1940 0 1/2 1.09 All - - - - -

Full Input Data And ResultsLane Input DataJunction: Windy Corner Junction
Lane LaneType Phases Start
Disp.EndDisp.
PhysicalLength(PCU)
SatFlowType
Def UserSaturation
Flow(PCU/Hr)
LaneWidth
(m)Gradient Nearside
Lane TurnsTurningRadius
(m)
1/1(A379
DartmouthRoad (north))
U A 2 3 60.0 Geom - 3.10 0.00 Y Arm 5Ahead Inf
1/2(A379
DartmouthRoad (north))
O A D 2 3 10.4 Geom - 3.00 0.00 Y Arm 6Right 9.30
2/1(A379
DarmouthRoad (south))
O 2 3 37.0 Geom - 4.20 0.00 Y Arm 6Left 48.20
2/2(A379
DarmouthRoad (south))
U B 2 3 60.0 Geom - 3.58 0.00 Y Arm 4Ahead Inf
3/1(A3022
Brixham Road)U C 2 3 60.0 Geom - 3.60 0.00 Y
Arm 4Left 8.90
Arm 5Right 22.10
4/1 U 2 3 60.0 Inf - - - - - -
5/1 U 2 3 11.8 Inf - - - - - -
6/1 U 2 3 60.0 Inf - - - - - -
Traffic Flow GroupsFlow Group Start Time End Time Duration Formula
1: '2017 Base AM' 08:00 09:00 01:00
2: '2017 Base PM' 17:00 18:00 01:00
17: 'TA 2019 AM' 08:00 09:00 01:00 F1+F13
18: 'TA 2019 PM' 17:00 18:00 01:00 F2+F14
21: 'TA 2024 AM' 08:00 09:00 01:00 F1+F15
22: 'TA 2024 PM' 17:00 18:00 01:00 F2+F16
23: 'TA 2024 + Dev AM' 08:00 09:00 01:00 F21+F3
24: 'TA 2024 + Dev PM' 17:00 18:00 01:00 F22+F4

Full Input Data And Results
Scenario 1: '2017 Base AM' (FG1: '2017 Base AM', Plan 1: 'Network Control Plan 1')Traffic Flows, DesiredDesired Flow :
Destination
Origin
A B C Tot.
A 0 756 604 1360
B 505 0 27 532
C 646 56 0 702
Tot. 1151 812 631 2594
Traffic Lane Flows
Lane Scenario 1:2017 Base AM
Junction: Windy Corner Junction
1/1 646
1/2 56
2/1(short) 756
2/2(with short)
1360(In)604(Out)
3/1 532
4/1 631
5/1 1151
6/1 812
Lane Saturation FlowsJunction: Windy Corner Junction
LaneLaneWidth
(m)Gradient Nearside
LaneAllowedTurns
TurningRadius
(m)Turning
Prop.Sat Flow(PCU/Hr)
Flared Sat Flow(PCU/Hr)
1/1(A379 Dartmouth Road (north)) 3.10 0.00 Y Arm 5 Ahead Inf 100.0 % 1925 1925
1/2(A379 Dartmouth Road (north)) 3.00 0.00 Y Arm 6 Right 9.30 100.0 % 1649 1649
2/1(A379 Darmouth Road (south)) 4.20 0.00 Y Arm 6 Left 48.20 100.0 % 1974 1974
2/2(A379 Darmouth Road (south)) 3.58 0.00 Y Arm 4 Ahead Inf 100.0 % 1973 1973
3/1(A3022 Brixham Road) 3.60 0.00 Y
Arm 4 Left 8.90 5.1 %1841 1841
Arm 5 Right 22.10 94.9 %
4/1 Infinite Saturation Flow Inf Inf
5/1 Infinite Saturation Flow Inf Inf
6/1 Infinite Saturation Flow Inf Inf

Full Input Data And Results
Scenario 2: '2017 Base PM' (FG2: '2017 Base PM', Plan 1: 'Network Control Plan 1')Traffic Flows, DesiredDesired Flow :
Destination
Origin
A B C Tot.
A 0 590 496 1086
B 709 0 44 753
C 565 43 0 608
Tot. 1274 633 540 2447
Traffic Lane Flows
Lane Scenario 2:2017 Base PM
Junction: Windy Corner Junction
1/1 565
1/2 43
2/1(short) 590
2/2(with short)
1086(In)496(Out)
3/1 753
4/1 540
5/1 1274
6/1 633
Lane Saturation FlowsJunction: Windy Corner Junction
LaneLaneWidth
(m)Gradient Nearside
LaneAllowedTurns
TurningRadius
(m)Turning
Prop.Sat Flow(PCU/Hr)
Flared Sat Flow(PCU/Hr)
1/1(A379 Dartmouth Road (north)) 3.10 0.00 Y Arm 5 Ahead Inf 100.0 % 1925 1925
1/2(A379 Dartmouth Road (north)) 3.00 0.00 Y Arm 6 Right 9.30 100.0 % 1649 1649
2/1(A379 Darmouth Road (south)) 4.20 0.00 Y Arm 6 Left 48.20 100.0 % 1974 1974
2/2(A379 Darmouth Road (south)) 3.58 0.00 Y Arm 4 Ahead Inf 100.0 % 1973 1973
3/1(A3022 Brixham Road) 3.60 0.00 Y
Arm 4 Left 8.90 5.8 %1839 1839
Arm 5 Right 22.10 94.2 %
4/1 Infinite Saturation Flow Inf Inf
5/1 Infinite Saturation Flow Inf Inf
6/1 Infinite Saturation Flow Inf Inf

Full Input Data And Results
Scenario 11: 'TA 2019 AM' (FG17: 'TA 2019 AM', Plan 1: 'Network Control Plan 1')Traffic Flows, DesiredDesired Flow :
Destination
Origin
A B C Tot.
A 0 929 604 1533
B 562 0 28 590
C 646 56 0 702
Tot. 1208 985 632 2825
Traffic Lane Flows
Lane Scenario 11:TA 2019 AM
Junction: Windy Corner Junction
1/1 646
1/2 56
2/1(short) 929
2/2(with short)
1533(In)604(Out)
3/1 590
4/1 632
5/1 1208
6/1 985
Lane Saturation FlowsJunction: Windy Corner Junction
LaneLaneWidth
(m)Gradient Nearside
LaneAllowedTurns
TurningRadius
(m)Turning
Prop.Sat Flow(PCU/Hr)
Flared Sat Flow(PCU/Hr)
1/1(A379 Dartmouth Road (north)) 3.10 0.00 Y Arm 5 Ahead Inf 100.0 % 1925 1925
1/2(A379 Dartmouth Road (north)) 3.00 0.00 Y Arm 6 Right 9.30 100.0 % 1649 1649
2/1(A379 Darmouth Road (south)) 4.20 0.00 Y Arm 6 Left 48.20 100.0 % 1974 1974
2/2(A379 Darmouth Road (south)) 3.58 0.00 Y Arm 4 Ahead Inf 100.0 % 1973 1973
3/1(A3022 Brixham Road) 3.60 0.00 Y
Arm 4 Left 8.90 4.7 %1841 1841
Arm 5 Right 22.10 95.3 %
4/1 Infinite Saturation Flow Inf Inf
5/1 Infinite Saturation Flow Inf Inf
6/1 Infinite Saturation Flow Inf Inf

Full Input Data And Results
Scenario 12: 'TA 2019 PM' (FG18: 'TA 2019 PM', Plan 1: 'Network Control Plan 1')Traffic Flows, DesiredDesired Flow :
Destination
Origin
A B C Tot.
A 0 707 496 1203
B 840 0 46 886
C 565 45 0 610
Tot. 1405 752 542 2699
Traffic Lane Flows
Lane Scenario 12:TA 2019 PM
Junction: Windy Corner Junction
1/1 565
1/2 45
2/1(short) 707
2/2(with short)
1203(In)496(Out)
3/1 886
4/1 542
5/1 1405
6/1 752
Lane Saturation FlowsJunction: Windy Corner Junction
LaneLaneWidth
(m)Gradient Nearside
LaneAllowedTurns
TurningRadius
(m)Turning
Prop.Sat Flow(PCU/Hr)
Flared Sat Flow(PCU/Hr)
1/1(A379 Dartmouth Road (north)) 3.10 0.00 Y Arm 5 Ahead Inf 100.0 % 1925 1925
1/2(A379 Dartmouth Road (north)) 3.00 0.00 Y Arm 6 Right 9.30 100.0 % 1649 1649
2/1(A379 Darmouth Road (south)) 4.20 0.00 Y Arm 6 Left 48.20 100.0 % 1974 1974
2/2(A379 Darmouth Road (south)) 3.58 0.00 Y Arm 4 Ahead Inf 100.0 % 1973 1973
3/1(A3022 Brixham Road) 3.60 0.00 Y
Arm 4 Left 8.90 5.2 %1840 1840
Arm 5 Right 22.10 94.8 %
4/1 Infinite Saturation Flow Inf Inf
5/1 Infinite Saturation Flow Inf Inf
6/1 Infinite Saturation Flow Inf Inf

Full Input Data And Results
Scenario 15: 'TA 2024 AM' (FG21: 'TA 2024 AM', Plan 1: 'Network Control Plan 1')Traffic Flows, DesiredDesired Flow :
Destination
Origin
A B C Tot.
A 0 968 604 1572
B 592 0 28 620
C 646 57 0 703
Tot. 1238 1025 632 2895
Traffic Lane Flows
Lane Scenario 15:TA 2024 AM
Junction: Windy Corner Junction
1/1 646
1/2 57
2/1(short) 968
2/2(with short)
1572(In)604(Out)
3/1 620
4/1 632
5/1 1238
6/1 1025
Lane Saturation FlowsJunction: Windy Corner Junction
LaneLaneWidth
(m)Gradient Nearside
LaneAllowedTurns
TurningRadius
(m)Turning
Prop.Sat Flow(PCU/Hr)
Flared Sat Flow(PCU/Hr)
1/1(A379 Dartmouth Road (north)) 3.10 0.00 Y Arm 5 Ahead Inf 100.0 % 1925 1925
1/2(A379 Dartmouth Road (north)) 3.00 0.00 Y Arm 6 Right 9.30 100.0 % 1649 1649
2/1(A379 Darmouth Road (south)) 4.20 0.00 Y Arm 6 Left 48.20 100.0 % 1974 1974
2/2(A379 Darmouth Road (south)) 3.58 0.00 Y Arm 4 Ahead Inf 100.0 % 1973 1973
3/1(A3022 Brixham Road) 3.60 0.00 Y
Arm 4 Left 8.90 4.5 %1842 1842
Arm 5 Right 22.10 95.5 %
4/1 Infinite Saturation Flow Inf Inf
5/1 Infinite Saturation Flow Inf Inf
6/1 Infinite Saturation Flow Inf Inf

Full Input Data And Results
Scenario 16: 'TA 2024 PM' (FG22: 'TA 2024 PM', Plan 1: 'Network Control Plan 1')Traffic Flows, DesiredDesired Flow :
Destination
Origin
A B C Tot.
A 0 764 496 1260
B 880 0 46 926
C 565 45 0 610
Tot. 1445 809 542 2796
Traffic Lane Flows
Lane Scenario 16:TA 2024 PM
Junction: Windy Corner Junction
1/1 565
1/2 45
2/1(short) 764
2/2(with short)
1260(In)496(Out)
3/1 926
4/1 542
5/1 1445
6/1 809
Lane Saturation FlowsJunction: Windy Corner Junction
LaneLaneWidth
(m)Gradient Nearside
LaneAllowedTurns
TurningRadius
(m)Turning
Prop.Sat Flow(PCU/Hr)
Flared Sat Flow(PCU/Hr)
1/1(A379 Dartmouth Road (north)) 3.10 0.00 Y Arm 5 Ahead Inf 100.0 % 1925 1925
1/2(A379 Dartmouth Road (north)) 3.00 0.00 Y Arm 6 Right 9.30 100.0 % 1649 1649
2/1(A379 Darmouth Road (south)) 4.20 0.00 Y Arm 6 Left 48.20 100.0 % 1974 1974
2/2(A379 Darmouth Road (south)) 3.58 0.00 Y Arm 4 Ahead Inf 100.0 % 1973 1973
3/1(A3022 Brixham Road) 3.60 0.00 Y
Arm 4 Left 8.90 5.0 %1841 1841
Arm 5 Right 22.10 95.0 %
4/1 Infinite Saturation Flow Inf Inf
5/1 Infinite Saturation Flow Inf Inf
6/1 Infinite Saturation Flow Inf Inf

Full Input Data And Results
Scenario 17: 'TA 2024 + Dev AM' (FG23: 'TA 2024 + Dev AM', Plan 1: 'Network Control Plan 1')Traffic Flows, DesiredDesired Flow :
Destination
Origin
A B C Tot.
A 0 990 604 1594
B 623 0 33 656
C 646 61 0 707
Tot. 1269 1051 637 2957
Traffic Lane Flows
LaneScenario 17:
TA 2024 + DevAM
Junction: Windy Corner Junction
1/1 646
1/2 61
2/1(short) 990
2/2(with short)
1594(In)604(Out)
3/1 656
4/1 637
5/1 1269
6/1 1051
Lane Saturation FlowsJunction: Windy Corner Junction
LaneLaneWidth
(m)Gradient Nearside
LaneAllowedTurns
TurningRadius
(m)Turning
Prop.Sat Flow(PCU/Hr)
Flared Sat Flow(PCU/Hr)
1/1(A379 Dartmouth Road (north)) 3.10 0.00 Y Arm 5 Ahead Inf 100.0 % 1925 1925
1/2(A379 Dartmouth Road (north)) 3.00 0.00 Y Arm 6 Right 9.30 100.0 % 1649 1649
2/1(A379 Darmouth Road (south)) 4.20 0.00 Y Arm 6 Left 48.20 100.0 % 1974 1974
2/2(A379 Darmouth Road (south)) 3.58 0.00 Y Arm 4 Ahead Inf 100.0 % 1973 1973
3/1(A3022 Brixham Road) 3.60 0.00 Y
Arm 4 Left 8.90 5.0 %1841 1841
Arm 5 Right 22.10 95.0 %
4/1 Infinite Saturation Flow Inf Inf
5/1 Infinite Saturation Flow Inf Inf
6/1 Infinite Saturation Flow Inf Inf

Full Input Data And Results
Scenario 18: 'TA 2024 + Dev PM' (FG24: 'TA 2024 + Dev PM', Plan 1: 'Network Control Plan 1')Traffic Flows, DesiredDesired Flow :
Destination
Origin
A B C Tot.
A 0 792 496 1288
B 898 0 49 947
C 565 50 0 615
Tot. 1463 842 545 2850
Traffic Lane Flows
LaneScenario 18:
TA 2024 + DevPM
Junction: Windy Corner Junction
1/1 565
1/2 50
2/1(short) 792
2/2(with short)
1288(In)496(Out)
3/1 947
4/1 545
5/1 1463
6/1 842
Lane Saturation FlowsJunction: Windy Corner Junction
LaneLaneWidth
(m)Gradient Nearside
LaneAllowedTurns
TurningRadius
(m)Turning
Prop.Sat Flow(PCU/Hr)
Flared Sat Flow(PCU/Hr)
1/1(A379 Dartmouth Road (north)) 3.10 0.00 Y Arm 5 Ahead Inf 100.0 % 1925 1925
1/2(A379 Dartmouth Road (north)) 3.00 0.00 Y Arm 6 Right 9.30 100.0 % 1649 1649
2/1(A379 Darmouth Road (south)) 4.20 0.00 Y Arm 6 Left 48.20 100.0 % 1974 1974
2/2(A379 Darmouth Road (south)) 3.58 0.00 Y Arm 4 Ahead Inf 100.0 % 1973 1973
3/1(A3022 Brixham Road) 3.60 0.00 Y
Arm 4 Left 8.90 5.2 %1840 1840
Arm 5 Right 22.10 94.8 %
4/1 Infinite Saturation Flow Inf Inf
5/1 Infinite Saturation Flow Inf Inf
6/1 Infinite Saturation Flow Inf Inf

Full Input Data And Results
Scenario 1: '2017 Base AM' (FG1: '2017 Base AM', Plan 1: 'Network Control Plan 1')Stage Sequence Diagram
A
B
1 Min: 7
7 37s
AD2 Min: 4
3 4s
C3 Min: 7
5 34s
Stage TimingsStage 1 2 3
Duration 37 4 34
Change Point 0 44 51
Signal Timings Diagram
0
0
10
10
20
20
30
30
40
40
50
50
60
60
70
70
80
80
90
90
Time in cycle (sec)
Pha
ses
1 7 : 370
23 : 444
3 5 : 3451
D DC CB BA A

Full Input Data And ResultsNetwork Layout Diagram

Full Input Data And Results
Windy Corner JunctionPRC: 21.1 %Total Traffic Delay: 14.2 pcuHr
C1
0
1
44
2
51
390
Arm
1- A
379
Dar
tmou
thR
oad
(nor
th)
12
AAD
Arm2
- A379D
armouth
Road
(south)
1 2
B
Arm 3 - A3022 Brixham Road 1
C
Arm4
-
1
Arm5
-
Arm 6 -
1
B
C

Full Input Data And Results
Network Results
Item LaneDescription
LaneType
ControllerStream
Position InFiltered Route Full Phase Arrow
PhaseNumGreens
Total Green(s)
ArrowGreen (s)
DemandFlow (pcu)
Sat Flow(pcu/Hr)
Capacity(pcu)
Deg Sat(%)
Network: WindyCorner Junction -with Torbay CouncilProposed HighwayWorks
- - N/A - - - - - - - - 74.3%
Windy CornerJunction - - N/A - - - - - - - - 74.3%
1/1A379 Dartmouth
Road (north)Ahead
U N/A N/A A 1 46 - 646 1925 1005 64.3%
1/2A379 Dartmouth
Road (north)Right
O N/A N/A A D 1 46 4 56 1649 161 34.8%
2/2+2/1A379 Darmouth
Road (south)Ahead Left
U+O N/A N/A B - 1 37 - 1360 1973:1974 833+1097 72.5 :68.9%
3/1 A3022 BrixhamRoad Left Right U N/A N/A C 1 34 - 532 1841 716 74.3%
4/1 U N/A N/A - - - - 631 Inf Inf 0.0%
5/1 U N/A N/A - - - - 1151 Inf Inf 0.0%
6/1 U N/A N/A - - - - 812 Inf Inf 0.0%

Full Input Data And Results
Item Arriving (pcu) Leaving(pcu)
Turners InGaps (pcu)
Turners WhenUnopposed(pcu)
Turners InIntergreen(pcu)
UniformDelay(pcuHr)
Rand +OversatDelay(pcuHr)
StorageAreaUniformDelay(pcuHr)
TotalDelay(pcuHr)
Av. DelayPer PCU(s/pcu)
Max. Back ofUniformQueue (pcu)
Rand +OversatQueue (pcu)
MeanMaxQueue(pcu)
Network: WindyCorner Junction -with Torbay CouncilProposed HighwayWorks
- - 451 361 0 10.1 3.8 0.4 14.2 - - - -
Windy CornerJunction - - 451 361 0 10.1 3.8 0.4 14.2 - - - -
1/1 646 646 - - - 2.8 0.9 - 3.7 20.4 11.5 0.9 12.4
1/2 56 56 56 0 0 0.2 0.3 0.4 0.8 52.5 0.7 0.3 0.9
2/2+2/1 1360 1360 395 361 0 3.6 1.2 - 4.8 12.8 12.4 1.2 13.6
3/1 532 532 - - - 3.5 1.4 - 4.9 33.3 11.4 1.4 12.8
4/1 631 631 - - - 0.0 0.0 - 0.0 0.0 0.0 0.0 0.0
5/1 1151 1151 - - - 0.0 0.0 - 0.0 0.0 0.0 0.0 0.0
6/1 812 812 - - - 0.0 0.0 - 0.0 0.0 0.0 0.0 0.0
C1 PRC for Signalled Lanes (%): 21.1 Total Delay for Signalled Lanes (pcuHr): 14.22 Cycle Time (s): 90 PRC Over All Lanes (%): 21.1 Total Delay Over All Lanes(pcuHr): 14.22

Full Input Data And ResultsScenario 2: '2017 Base PM' (FG2: '2017 Base PM', Plan 1: 'Network Control Plan 1')Stage Sequence Diagram
A
B
1 Min: 7
7 27s
AD2 Min: 4
3 4s
C3 Min: 7
5 44s
Stage TimingsStage 1 2 3
Duration 27 4 44
Change Point 0 34 41
Signal Timings Diagram
0
0
10
10
20
20
30
30
40
40
50
50
60
60
70
70
80
80
90
90
Time in cycle (sec)
Pha
ses
1 7 : 270
23 : 434
3 5 : 4441
D DC CB BA A

Full Input Data And ResultsNetwork Layout Diagram

Full Input Data And Results
Windy Corner JunctionPRC: 9.9 %Total Traffic Delay: 16.3 pcuHr
C1
0
1
342
41
3 90
Arm
1- A
379
Dar
tmou
thR
oad
(nor
th)
12
AAD
Arm2
- A379D
armouth
Road
(south)
1 2
B
Arm 3 - A3022 Brixham Road 1
C
Arm4
-
1
Arm5
-
Arm 6 -
1
B
C

Full Input Data And Results
Network Results
Item LaneDescription
LaneType
ControllerStream
Position InFiltered Route Full Phase Arrow
PhaseNumGreens
Total Green(s)
ArrowGreen (s)
DemandFlow (pcu)
Sat Flow(pcu/Hr)
Capacity(pcu)
Deg Sat(%)
Network: WindyCorner Junction -with Torbay CouncilProposed HighwayWorks
- - N/A - - - - - - - - 81.9%
Windy CornerJunction - - N/A - - - - - - - - 81.9%
1/1A379 Dartmouth
Road (north)Ahead
U N/A N/A A 1 36 - 565 1925 791 71.4%
1/2A379 Dartmouth
Road (north)Right
O N/A N/A A D 1 36 4 43 1649 193 22.3%
2/2+2/1A379 Darmouth
Road (south)Ahead Left
U+O N/A N/A B - 1 27 - 1086 1973:1974 614+1049 80.8 :56.2%
3/1 A3022 BrixhamRoad Left Right U N/A N/A C 1 44 - 753 1839 919 81.9%
4/1 U N/A N/A - - - - 540 Inf Inf 0.0%
5/1 U N/A N/A - - - - 1274 Inf Inf 0.0%
6/1 U N/A N/A - - - - 633 Inf Inf 0.0%

Full Input Data And Results
Item Arriving (pcu) Leaving(pcu)
Turners InGaps (pcu)
Turners WhenUnopposed(pcu)
Turners InIntergreen(pcu)
UniformDelay(pcuHr)
Rand +OversatDelay(pcuHr)
StorageAreaUniformDelay(pcuHr)
TotalDelay(pcuHr)
Av. DelayPer PCU(s/pcu)
Max. Back ofUniformQueue (pcu)
Rand +OversatQueue (pcu)
MeanMaxQueue(pcu)
Network: WindyCorner Junction -with Torbay CouncilProposed HighwayWorks
- - 286 347 0 11.6 4.5 0.2 16.3 - - - -
Windy CornerJunction - - 286 347 0 11.6 4.5 0.2 16.3 - - - -
1/1 565 565 - - - 3.5 1.2 - 4.7 30.0 11.8 1.2 13.0
1/2 43 43 43 0 0 0.2 0.1 0.2 0.5 42.0 0.6 0.1 0.8
2/2+2/1 1086 1086 243 347 0 3.9 0.9 - 4.9 16.1 11.3 0.9 12.2
3/1 753 753 - - - 4.0 2.2 - 6.2 29.6 15.9 2.2 18.1
4/1 540 540 - - - 0.0 0.0 - 0.0 0.0 0.0 0.0 0.0
5/1 1274 1274 - - - 0.0 0.0 - 0.0 0.0 0.0 0.0 0.0
6/1 633 633 - - - 0.0 0.0 - 0.0 0.0 0.0 0.0 0.0
C1 PRC for Signalled Lanes (%): 9.9 Total Delay for Signalled Lanes (pcuHr): 16.26 Cycle Time (s): 90 PRC Over All Lanes (%): 9.9 Total Delay Over All Lanes(pcuHr): 16.26

Full Input Data And ResultsScenario 11: 'TA 2019 AM' (FG17: 'TA 2019 AM', Plan 1: 'Network Control Plan 1')Stage Sequence Diagram
A
B
1 Min: 7
7 35s
AD2 Min: 4
3 4s
C3 Min: 7
5 36s
Stage TimingsStage 1 2 3
Duration 35 4 36
Change Point 0 42 49
Signal Timings Diagram
0
0
10
10
20
20
30
30
40
40
50
50
60
60
70
70
80
80
90
90
Time in cycle (sec)
Pha
ses
1 7 : 350
23 : 442
3 5 : 3649
D DC CB BA A

Full Input Data And ResultsNetwork Layout Diagram

Full Input Data And Results
Windy Corner JunctionPRC: 15.5 %Total Traffic Delay: 16.1 pcuHr
C1
0
1
42
2
49
390
Arm
1- A
379
Dar
tmou
thR
oad
(nor
th)
12
AAD
Arm2
- A379D
armouth
Road
(south)
1 2
B
Arm 3 - A3022 Brixham Road 1
C
Arm4
-
1
Arm5
-
Arm 6 -
1
B
C

Full Input Data And Results
Network Results
Item LaneDescription
LaneType
ControllerStream
Position InFiltered Route Full Phase Arrow
PhaseNumGreens
Total Green(s)
ArrowGreen (s)
DemandFlow (pcu)
Sat Flow(pcu/Hr)
Capacity(pcu)
Deg Sat(%)
Network: WindyCorner Junction -with Torbay CouncilProposed HighwayWorks
- - N/A - - - - - - - - 78.0%
Windy CornerJunction - - N/A - - - - - - - - 78.0%
1/1A379 Dartmouth
Road (north)Ahead
U N/A N/A A 1 44 - 646 1925 962 67.1%
1/2A379 Dartmouth
Road (north)Right
O N/A N/A A D 1 44 4 56 1649 148 37.7%
2/2+2/1A379 Darmouth
Road (south)Ahead Left
U+O N/A N/A B - 1 35 - 1533 1973:1974 778+1196 77.7 :77.7%
3/1 A3022 BrixhamRoad Left Right U N/A N/A C 1 36 - 590 1841 757 78.0%
4/1 U N/A N/A - - - - 632 Inf Inf 0.0%
5/1 U N/A N/A - - - - 1208 Inf Inf 0.0%
6/1 U N/A N/A - - - - 985 Inf Inf 0.0%

Full Input Data And Results
Item Arriving (pcu) Leaving(pcu)
Turners InGaps (pcu)
Turners WhenUnopposed(pcu)
Turners InIntergreen(pcu)
UniformDelay(pcuHr)
Rand +OversatDelay(pcuHr)
StorageAreaUniformDelay(pcuHr)
TotalDelay(pcuHr)
Av. DelayPer PCU(s/pcu)
Max. Back ofUniformQueue (pcu)
Rand +OversatQueue (pcu)
MeanMaxQueue(pcu)
Network: WindyCorner Junction -with Torbay CouncilProposed HighwayWorks
- - 521 465 0 10.9 4.8 0.4 16.1 - - - -
Windy CornerJunction - - 521 465 0 10.9 4.8 0.4 16.1 - - - -
1/1 646 646 - - - 3.0 1.0 - 4.1 22.6 12.0 1.0 13.0
1/2 56 56 56 0 0 0.2 0.3 0.4 0.9 58.2 0.7 0.3 1.0
2/2+2/1 1533 1533 465 465 0 3.9 1.7 - 5.6 13.3 12.9 1.7 14.6
3/1 590 590 - - - 3.8 1.7 - 5.5 33.5 12.6 1.7 14.4
4/1 632 632 - - - 0.0 0.0 - 0.0 0.0 0.0 0.0 0.0
5/1 1208 1208 - - - 0.0 0.0 - 0.0 0.0 0.0 0.0 0.0
6/1 985 985 - - - 0.0 0.0 - 0.0 0.0 0.0 0.0 0.0
C1 PRC for Signalled Lanes (%): 15.5 Total Delay for Signalled Lanes (pcuHr): 16.10 Cycle Time (s): 90 PRC Over All Lanes (%): 15.5 Total Delay Over All Lanes(pcuHr): 16.10

Full Input Data And ResultsScenario 12: 'TA 2019 PM' (FG18: 'TA 2019 PM', Plan 1: 'Network Control Plan 1')Stage Sequence Diagram
A
B
1 Min: 7
7 24s
AD2 Min: 4
3 4s
C3 Min: 7
5 47s
Stage TimingsStage 1 2 3
Duration 24 4 47
Change Point 0 31 38
Signal Timings Diagram
0
0
10
10
20
20
30
30
40
40
50
50
60
60
70
70
80
80
90
90
Time in cycle (sec)
Pha
ses
1 7 : 240
23 : 431
3 5 : 4738
D DC CB BA A

Full Input Data And ResultsNetwork Layout Diagram

Full Input Data And Results
Windy Corner JunctionPRC: -0.6 %Total Traffic Delay: 20.6 pcuHr
C1
0
1
312
38
3 90
Arm
1- A
379
Dar
tmou
thR
oad
(nor
th)
12
AAD
Arm2
- A379D
armouth
Road
(south)
1 2
B
Arm 3 - A3022 Brixham Road 1
C
Arm4
-
1
Arm5
-
Arm 6 -
1
B
C

Full Input Data And Results
Network Results
Item LaneDescription
LaneType
ControllerStream
Position InFiltered Route Full Phase Arrow
PhaseNumGreens
Total Green(s)
ArrowGreen (s)
DemandFlow (pcu)
Sat Flow(pcu/Hr)
Capacity(pcu)
Deg Sat(%)
Network: WindyCorner Junction -with Torbay CouncilProposed HighwayWorks
- - N/A - - - - - - - - 90.5%
Windy CornerJunction - - N/A - - - - - - - - 90.5%
1/1A379 Dartmouth
Road (north)Ahead
U N/A N/A A 1 33 - 565 1925 727 77.7%
1/2A379 Dartmouth
Road (north)Right
O N/A N/A A D 1 33 4 45 1649 169 26.7%
2/2+2/1A379 Darmouth
Road (south)Ahead Left
U+O N/A N/A B - 1 24 - 1203 1973:1974 548+1160 90.5 :61.0%
3/1 A3022 BrixhamRoad Left Right U N/A N/A C 1 47 - 886 1840 981 90.3%
4/1 U N/A N/A - - - - 542 Inf Inf 0.0%
5/1 U N/A N/A - - - - 1405 Inf Inf 0.0%
6/1 U N/A N/A - - - - 752 Inf Inf 0.0%

Full Input Data And Results
Item Arriving (pcu) Leaving(pcu)
Turners InGaps (pcu)
Turners WhenUnopposed(pcu)
Turners InIntergreen(pcu)
UniformDelay(pcuHr)
Rand +OversatDelay(pcuHr)
StorageAreaUniformDelay(pcuHr)
TotalDelay(pcuHr)
Av. DelayPer PCU(s/pcu)
Max. Back ofUniformQueue (pcu)
Rand +OversatQueue (pcu)
MeanMaxQueue(pcu)
Network: WindyCorner Junction -with Torbay CouncilProposed HighwayWorks
- - 312 440 0 13.1 7.3 0.2 20.6 - - - -
Windy CornerJunction - - 312 440 0 13.1 7.3 0.2 20.6 - - - -
1/1 565 565 - - - 3.9 1.7 - 5.6 35.5 12.4 1.7 14.1
1/2 45 45 45 0 0 0.2 0.2 0.2 0.6 48.9 0.7 0.2 0.9
2/2+2/1 1203 1203 267 440 0 4.3 1.2 - 5.5 16.5 11.8 1.2 13.0
3/1 886 886 - - - 4.7 4.3 - 8.9 36.2 19.9 4.3 24.2
4/1 542 542 - - - 0.0 0.0 - 0.0 0.0 0.0 0.0 0.0
5/1 1405 1405 - - - 0.0 0.0 - 0.0 0.0 0.0 0.0 0.0
6/1 752 752 - - - 0.0 0.0 - 0.0 0.0 0.0 0.0 0.0
C1 PRC for Signalled Lanes (%): -0.6 Total Delay for Signalled Lanes (pcuHr): 20.61 Cycle Time (s): 90 PRC Over All Lanes (%): -0.6 Total Delay Over All Lanes(pcuHr): 20.61

Full Input Data And ResultsScenario 15: 'TA 2024 AM' (FG21: 'TA 2024 AM', Plan 1: 'Network Control Plan 1')Stage Sequence Diagram
A
B
1 Min: 7
7 34s
AD2 Min: 4
3 4s
C3 Min: 7
5 37s
Stage TimingsStage 1 2 3
Duration 34 4 37
Change Point 0 41 48
Signal Timings Diagram
0
0
10
10
20
20
30
30
40
40
50
50
60
60
70
70
80
80
90
90
Time in cycle (sec)
Pha
ses
1 7 : 340
23 : 441
3 5 : 3748
D DC CB BA A

Full Input Data And ResultsNetwork Layout Diagram

Full Input Data And Results
Windy Corner JunctionPRC: 12.9 %Total Traffic Delay: 17.0 pcuHr
C1
0
1
41
2
48
390
Arm
1- A
379
Dar
tmou
thR
oad
(nor
th)
12
AAD
Arm2
- A379D
armouth
Road
(south)
1 2
B
Arm 3 - A3022 Brixham Road 1
C
Arm4
-
1
Arm5
-
Arm 6 -
1
B
C

Full Input Data And Results
Network Results
Item LaneDescription
LaneType
ControllerStream
Position InFiltered Route Full Phase Arrow
PhaseNumGreens
Total Green(s)
ArrowGreen (s)
DemandFlow (pcu)
Sat Flow(pcu/Hr)
Capacity(pcu)
Deg Sat(%)
Network: WindyCorner Junction -with Torbay CouncilProposed HighwayWorks
- - N/A - - - - - - - - 79.7%
Windy CornerJunction - - N/A - - - - - - - - 79.7%
1/1A379 Dartmouth
Road (north)Ahead
U N/A N/A A 1 43 - 646 1925 941 68.6%
1/2A379 Dartmouth
Road (north)Right
O N/A N/A A D 1 43 4 57 1649 146 39.2%
2/2+2/1A379 Darmouth
Road (south)Ahead Left
U+O N/A N/A B - 1 34 - 1572 1973:1974 758+1215 79.7 :79.7%
3/1 A3022 BrixhamRoad Left Right U N/A N/A C 1 37 - 620 1842 778 79.7%
4/1 U N/A N/A - - - - 632 Inf Inf 0.0%
5/1 U N/A N/A - - - - 1238 Inf Inf 0.0%
6/1 U N/A N/A - - - - 1025 Inf Inf 0.0%

Full Input Data And Results
Item Arriving (pcu) Leaving(pcu)
Turners InGaps (pcu)
Turners WhenUnopposed(pcu)
Turners InIntergreen(pcu)
UniformDelay(pcuHr)
Rand +OversatDelay(pcuHr)
StorageAreaUniformDelay(pcuHr)
TotalDelay(pcuHr)
Av. DelayPer PCU(s/pcu)
Max. Back ofUniformQueue (pcu)
Rand +OversatQueue (pcu)
MeanMaxQueue(pcu)
Network: WindyCorner Junction -with Torbay CouncilProposed HighwayWorks
- - 530 495 0 11.3 5.3 0.4 17.0 - - - -
Windy CornerJunction - - 530 495 0 11.3 5.3 0.4 17.0 - - - -
1/1 646 646 - - - 3.2 1.1 - 4.3 23.7 12.4 1.1 13.5
1/2 57 57 57 0 0 0.2 0.3 0.4 1.0 60.2 0.7 0.3 1.1
2/2+2/1 1572 1572 473 495 0 4.1 1.9 - 6.0 13.7 13.3 1.9 15.2
3/1 620 620 - - - 3.9 1.9 - 5.8 33.8 13.4 1.9 15.4
4/1 632 632 - - - 0.0 0.0 - 0.0 0.0 0.0 0.0 0.0
5/1 1238 1238 - - - 0.0 0.0 - 0.0 0.0 0.0 0.0 0.0
6/1 1025 1025 - - - 0.0 0.0 - 0.0 0.0 0.0 0.0 0.0
C1 PRC for Signalled Lanes (%): 12.9 Total Delay for Signalled Lanes (pcuHr): 17.04 Cycle Time (s): 90 PRC Over All Lanes (%): 12.9 Total Delay Over All Lanes(pcuHr): 17.04

Full Input Data And ResultsScenario 16: 'TA 2024 PM' (FG22: 'TA 2024 PM', Plan 1: 'Network Control Plan 1')Stage Sequence Diagram
A
B
1 Min: 7
7 23s
AD2 Min: 4
3 4s
C3 Min: 7
5 48s
Stage TimingsStage 1 2 3
Duration 23 4 48
Change Point 0 30 37
Signal Timings Diagram
0
0
10
10
20
20
30
30
40
40
50
50
60
60
70
70
80
80
90
90
Time in cycle (sec)
Pha
ses
1 7 : 230
23 : 430
3 5 : 4837
D DC CB BA A

Full Input Data And ResultsNetwork Layout Diagram

Full Input Data And Results
Windy Corner JunctionPRC: -4.7 %Total Traffic Delay: 22.6 pcuHr
C1
0
1
302
37
3 90
Arm
1- A
379
Dar
tmou
thR
oad
(nor
th)
12
AAD
Arm2
- A379D
armouth
Road
(south)
1 2
B
Arm 3 - A3022 Brixham Road 1
C
Arm4
-
1
Arm5
-
Arm 6 -
1
B
C

Full Input Data And Results
Network Results
Item LaneDescription
LaneType
ControllerStream
Position InFiltered Route Full Phase Arrow
PhaseNumGreens
Total Green(s)
ArrowGreen (s)
DemandFlow (pcu)
Sat Flow(pcu/Hr)
Capacity(pcu)
Deg Sat(%)
Network: WindyCorner Junction -with Torbay CouncilProposed HighwayWorks
- - N/A - - - - - - - - 94.3%
Windy CornerJunction - - N/A - - - - - - - - 94.3%
1/1A379 Dartmouth
Road (north)Ahead
U N/A N/A A 1 32 - 565 1925 706 80.0%
1/2A379 Dartmouth
Road (north)Right
O N/A N/A A D 1 32 4 45 1649 161 27.9%
2/2+2/1A379 Darmouth
Road (south)Ahead Left
U+O N/A N/A B - 1 23 - 1260 1973:1974 526+1197 94.3 :63.8%
3/1 A3022 BrixhamRoad Left Right U N/A N/A C 1 48 - 926 1841 1002 92.4%
4/1 U N/A N/A - - - - 542 Inf Inf 0.0%
5/1 U N/A N/A - - - - 1445 Inf Inf 0.0%
6/1 U N/A N/A - - - - 809 Inf Inf 0.0%

Full Input Data And Results
Item Arriving (pcu) Leaving(pcu)
Turners InGaps (pcu)
Turners WhenUnopposed(pcu)
Turners InIntergreen(pcu)
UniformDelay(pcuHr)
Rand +OversatDelay(pcuHr)
StorageAreaUniformDelay(pcuHr)
TotalDelay(pcuHr)
Av. DelayPer PCU(s/pcu)
Max. Back ofUniformQueue (pcu)
Rand +OversatQueue (pcu)
MeanMaxQueue(pcu)
Network: WindyCorner Junction -with Torbay CouncilProposed HighwayWorks
- - 325 484 0 13.5 8.8 0.2 22.6 - - - -
Windy CornerJunction - - 325 484 0 13.5 8.8 0.2 22.6 - - - -
1/1 565 565 - - - 4.0 2.0 - 6.0 38.0 12.6 2.0 14.5
1/2 45 45 45 0 0 0.2 0.2 0.2 0.6 51.1 0.7 0.2 0.9
2/2+2/1 1260 1260 280 484 0 4.5 1.4 - 5.8 16.6 12.1 1.4 13.5
3/1 926 926 - - - 4.8 5.3 - 10.2 39.5 21.1 5.3 26.4
4/1 542 542 - - - 0.0 0.0 - 0.0 0.0 0.0 0.0 0.0
5/1 1445 1445 - - - 0.0 0.0 - 0.0 0.0 0.0 0.0 0.0
6/1 809 809 - - - 0.0 0.0 - 0.0 0.0 0.0 0.0 0.0
C1 PRC for Signalled Lanes (%): -4.7 Total Delay for Signalled Lanes (pcuHr): 22.57 Cycle Time (s): 90 PRC Over All Lanes (%): -4.7 Total Delay Over All Lanes(pcuHr): 22.57

Full Input Data And ResultsScenario 17: 'TA 2024 + Dev AM' (FG23: 'TA 2024 + Dev AM', Plan 1: 'Network Control Plan 1')Stage Sequence Diagram
A
B
1 Min: 7
7 33s
AD2 Min: 4
3 4s
C3 Min: 7
5 38s
Stage TimingsStage 1 2 3
Duration 33 4 38
Change Point 0 40 47
Signal Timings Diagram
0
0
10
10
20
20
30
30
40
40
50
50
60
60
70
70
80
80
90
90
Time in cycle (sec)
Pha
ses
1 7 : 330
23 : 440
3 5 : 3847
D DC CB BA A

Full Input Data And ResultsNetwork Layout Diagram

Full Input Data And Results
Windy Corner JunctionPRC: 9.4 %Total Traffic Delay: 18.2 pcuHr
C1
0
1
40
2
47
390
Arm
1- A
379
Dar
tmou
thR
oad
(nor
th)
12
AAD
Arm2
- A379D
armouth
Road
(south)
1 2
B
Arm 3 - A3022 Brixham Road 1
C
Arm4
-
1
Arm5
-
Arm 6 -
1
B
C

Full Input Data And Results
Network Results
Item LaneDescription
LaneType
ControllerStream
Position InFiltered Route Full Phase Arrow
PhaseNumGreens
Total Green(s)
ArrowGreen (s)
DemandFlow (pcu)
Sat Flow(pcu/Hr)
Capacity(pcu)
Deg Sat(%)
Network: WindyCorner Junction -with Torbay CouncilProposed HighwayWorks
- - N/A - - - - - - - - 82.2%
Windy CornerJunction - - N/A - - - - - - - - 82.2%
1/1A379 Dartmouth
Road (north)Ahead
U N/A N/A A 1 42 - 646 1925 920 70.2%
1/2A379 Dartmouth
Road (north)Right
O N/A N/A A D 1 42 4 61 1649 144 42.4%
2/2+2/1A379 Darmouth
Road (south)Ahead Left
U+O N/A N/A B - 1 33 - 1594 1973:1974 745+1226 81.0 :80.8%
3/1 A3022 BrixhamRoad Left Right U N/A N/A C 1 38 - 656 1841 798 82.2%
4/1 U N/A N/A - - - - 637 Inf Inf 0.0%
5/1 U N/A N/A - - - - 1269 Inf Inf 0.0%
6/1 U N/A N/A - - - - 1051 Inf Inf 0.0%

Full Input Data And Results
Item Arriving (pcu) Leaving(pcu)
Turners InGaps (pcu)
Turners WhenUnopposed(pcu)
Turners InIntergreen(pcu)
UniformDelay(pcuHr)
Rand +OversatDelay(pcuHr)
StorageAreaUniformDelay(pcuHr)
TotalDelay(pcuHr)
Av. DelayPer PCU(s/pcu)
Max. Back ofUniformQueue (pcu)
Rand +OversatQueue (pcu)
MeanMaxQueue(pcu)
Network: WindyCorner Junction -with Torbay CouncilProposed HighwayWorks
- - 534 517 0 11.8 5.9 0.5 18.2 - - - -
Windy CornerJunction - - 534 517 0 11.8 5.9 0.5 18.2 - - - -
1/1 646 646 - - - 3.3 1.2 - 4.5 25.0 12.6 1.2 13.7
1/2 61 61 61 0 0 0.2 0.4 0.5 1.1 62.9 0.8 0.4 1.2
2/2+2/1 1594 1594 473 517 0 4.2 2.1 - 6.3 14.2 13.4 2.1 15.5
3/1 656 656 - - - 4.1 2.2 - 6.3 34.8 14.4 2.2 16.6
4/1 637 637 - - - 0.0 0.0 - 0.0 0.0 0.0 0.0 0.0
5/1 1269 1269 - - - 0.0 0.0 - 0.0 0.0 0.0 0.0 0.0
6/1 1051 1051 - - - 0.0 0.0 - 0.0 0.0 0.0 0.0 0.0
C1 PRC for Signalled Lanes (%): 9.4 Total Delay for Signalled Lanes (pcuHr): 18.19 Cycle Time (s): 90 PRC Over All Lanes (%): 9.4 Total Delay Over All Lanes(pcuHr): 18.19

Full Input Data And ResultsScenario 18: 'TA 2024 + Dev PM' (FG24: 'TA 2024 + Dev PM', Plan 1: 'Network Control Plan 1')Stage Sequence Diagram
A
B
1 Min: 7
7 23s
AD2 Min: 4
3 4s
C3 Min: 7
5 48s
Stage TimingsStage 1 2 3
Duration 23 4 48
Change Point 0 30 37
Signal Timings Diagram
0
0
10
10
20
20
30
30
40
40
50
50
60
60
70
70
80
80
90
90
Time in cycle (sec)
Pha
ses
1 7 : 230
23 : 430
3 5 : 4837
D DC CB BA A

Full Input Data And ResultsNetwork Layout Diagram

Full Input Data And Results
Windy Corner JunctionPRC: -5.0 %Total Traffic Delay: 24.5 pcuHr
C1
0
1
302
37
3 90
Arm
1- A
379
Dar
tmou
thR
oad
(nor
th)
12
AAD
Arm2
- A379D
armouth
Road
(south)
1 2
B
Arm 3 - A3022 Brixham Road 1
C
Arm4
-
1
Arm5
-
Arm 6 -
1
B
C

Full Input Data And Results
Network Results
Item LaneDescription
LaneType
ControllerStream
Position InFiltered Route Full Phase Arrow
PhaseNumGreens
Total Green(s)
ArrowGreen (s)
DemandFlow (pcu)
Sat Flow(pcu/Hr)
Capacity(pcu)
Deg Sat(%)
Network: WindyCorner Junction -with Torbay CouncilProposed HighwayWorks
- - N/A - - - - - - - - 94.5%
Windy CornerJunction - - N/A - - - - - - - - 94.5%
1/1A379 Dartmouth
Road (north)Ahead
U N/A N/A A 1 32 - 565 1925 706 80.0%
1/2A379 Dartmouth
Road (north)Right
O N/A N/A A D 1 32 4 50 1649 159 31.5%
2/2+2/1A379 Darmouth
Road (south)Ahead Left
U+O N/A N/A B - 1 23 - 1288 1973:1974 526+1214 94.3 :65.3%
3/1 A3022 BrixhamRoad Left Right U N/A N/A C 1 48 - 947 1840 1002 94.5%
4/1 U N/A N/A - - - - 545 Inf Inf 0.0%
5/1 U N/A N/A - - - - 1463 Inf Inf 0.0%
6/1 U N/A N/A - - - - 842 Inf Inf 0.0%

Full Input Data And Results
Item Arriving (pcu) Leaving(pcu)
Turners InGaps (pcu)
Turners WhenUnopposed(pcu)
Turners InIntergreen(pcu)
UniformDelay(pcuHr)
Rand +OversatDelay(pcuHr)
StorageAreaUniformDelay(pcuHr)
TotalDelay(pcuHr)
Av. DelayPer PCU(s/pcu)
Max. Back ofUniformQueue (pcu)
Rand +OversatQueue (pcu)
MeanMaxQueue(pcu)
Network: WindyCorner Junction -with Torbay CouncilProposed HighwayWorks
- - 340 502 0 13.8 10.5 0.3 24.5 - - - -
Windy CornerJunction - - 340 502 0 13.8 10.5 0.3 24.5 - - - -
1/1 565 565 - - - 4.0 2.0 - 6.0 38.0 12.6 2.0 14.5
1/2 50 50 50 0 0 0.3 0.2 0.3 0.7 53.3 0.8 0.2 1.0
2/2+2/1 1288 1288 290 502 0 4.5 1.4 - 5.9 16.4 12.1 1.4 13.5
3/1 947 947 - - - 5.1 6.9 - 12.0 45.5 22.1 6.9 29.0
4/1 545 545 - - - 0.0 0.0 - 0.0 0.0 0.0 0.0 0.0
5/1 1463 1463 - - - 0.0 0.0 - 0.0 0.0 0.0 0.0 0.0
6/1 842 842 - - - 0.0 0.0 - 0.0 0.0 0.0 0.0 0.0
C1 PRC for Signalled Lanes (%): -5.0 Total Delay for Signalled Lanes (pcuHr): 24.54 Cycle Time (s): 90 PRC Over All Lanes (%): -5.0 Total Delay Over All Lanes(pcuHr): 24.54

Full Input Data And ResultsFull Input Data And Results
User and Project DetailsProject: Inglewood
Title: Windy Corner Junction - KTC proposed highway works
Location:
File name: Windy Corner Existing Copy (modelled with KTC proposed highway works0734-044).lsg3x
Author: FF
Company: Key Transport Consultants
Address: 26 Berkeley Square, Bristol, BS8 1HP
Notes:

Full Input Data And Results
Network Layout Diagram
Windy Corner Junction
Arm
1-A
379
Dar
tmou
thR
oad
(nor
th)
12
1/1
1/2
Arm2
- A379D
armouth
Road
(south)
1 22/1
2/2
Arm 3 - A3022 Brixham Road1
2
3/13/2
Arm4
-
14/1
Arm5
-
125/15/2
Arm 6 -
16/1
A
B
C

Full Input Data And Results
Phase Diagram
A
B
C D

Full Input Data And Results
Phase Input DataPhase Name Phase Type Assoc. Phase Street Min Cont Min
A Traffic 7 7
B Traffic 7 7
C Traffic 7 7
D Ind. Arrow A 4 4
Phase Intergreens MatrixStarting Phase
TerminatingPhase
A B C D
A - - 5 -
B - - 6 3
C 5 7 - 5
D - 6 5 -
Phases in StageStage No. Phases in Stage
1 A B
2 A D
3 C
Stage DiagramA
B
C D1 Min >= 7
A
B
C D2 Min >= 4
A
B
C D3 Min >= 7
Phase DelaysTerm. Stage Start Stage Phase Type Value Cont value
1 3 A Losing 1 1
Prohibited Stage ChangeTo Stage
FromStage
1 2 3
1 3 6
2 6 5
3 7 5

Full Input Data And ResultsGive-Way Lane Input DataJunction: Windy Corner Junction
Lane MovementMax Flow
whenGiving Way
(PCU/Hr)
Min Flowwhen
Giving Way(PCU/Hr)
OpposingLane
Opp. LaneCoeff.
Opp.Mvmnts.
Right TurnStorage (PCU)
Non-BlockingStorage(PCU)
RTF Right TurnMove up (s)
Max Turnsin Intergreen
(PCU)
1/2(A379 Dartmouth Road (north)) 6/1 (Right) 1439 0
2/1 1.09 All3.00 3.00 0.50 3 2.00
2/2 1.09 All
2/1(A379 Darmouth Road (south)) 6/1 (Left) 1940 0 1/2 1.09 All - - - - -

Full Input Data And ResultsLane Input DataJunction: Windy Corner Junction
Lane LaneType Phases Start
Disp.EndDisp.
PhysicalLength(PCU)
SatFlowType
Def UserSaturation
Flow(PCU/Hr)
LaneWidth
(m)Gradient Nearside
Lane TurnsTurningRadius
(m)
1/1(A379
DartmouthRoad (north))
U A 2 3 10.0 Geom - 2.85 0.00 Y Arm 5Ahead Inf
1/2(A379
DartmouthRoad (north))
O A D 2 3 10.4 Geom - 3.36 0.00 Y
Arm 5Ahead Inf
Arm 6Right 9.30
2/1(A379
DarmouthRoad (south))
O 2 3 37.0 Geom - 4.10 0.00 Y Arm 6Left 48.20
2/2(A379
DarmouthRoad (south))
U B 2 3 60.0 Geom - 4.00 0.00 Y Arm 4Ahead Inf
3/1(A3022
Brixham Road)U 2 3 2.0 Geom - 3.05 0.00 Y
Arm 4Left 9.00
Arm 5Right 17.90
3/2(A3022
Brixham Road)U C 2 3 60.0 Geom - 3.60 0.00 N Arm 5
Right 16.80
4/1 U 2 3 60.0 Inf - - - - - -
5/1 U 2 3 60.0 Inf - - - - - -
5/2 U 2 3 7.0 Inf - - - - - -
6/1 U 2 3 60.0 Inf - - - - - -
Traffic Flow GroupsFlow Group Start Time End Time Duration Formula
23: 'TA 2024 + Dev AM' 08:00 09:00 01:00 F21+F3
24: 'TA 2024 + Dev PM' 17:00 18:00 01:00 F22+F4
Scenario 17: 'TA 2024 + Dev AM' (FG23: 'TA 2024 + Dev AM', Plan 1: 'Network Control Plan 1')Traffic Flows, DesiredDesired Flow :
Destination
Origin
A B C Tot.
A 0 990 604 1594
B 623 0 33 656
C 646 61 0 707
Tot. 1269 1051 637 2957

Full Input Data And Results
Traffic Lane Flows
LaneScenario 17:
TA 2024 + DevAM
Junction: Windy Corner Junction
1/1 646
1/2 61
2/1(short) 990
2/2(with short)
1594(In)604(Out)
3/1 33
3/2 623
4/1 637
5/1 0
5/2 1269
6/1 1051
Lane Saturation FlowsJunction: Windy Corner Junction
LaneLaneWidth
(m)Gradient Nearside
LaneAllowedTurns
TurningRadius
(m)Turning
Prop.Sat Flow(PCU/Hr)
Flared Sat Flow(PCU/Hr)
1/1(A379 Dartmouth Road (north)) 2.85 0.00 Y Arm 5 Ahead Inf 100.0 % 1900 1900
1/2(A379 Dartmouth Road (north)) 3.36 0.00 Y
Arm 5 Ahead Inf 0.0 %1680 1680
Arm 6 Right 9.30 100.0 %
2/1(A379 Darmouth Road (south)) 4.10 0.00 Y Arm 6 Left 48.20 100.0 % 1964 1964
2/2(A379 Darmouth Road (south)) 4.00 0.00 Y Arm 4 Ahead Inf 100.0 % 2015 2015
3/1(A3022 Brixham Road) 3.05 0.00 Y
Arm 4 Left 9.00 100.0 %1646 1646
Arm 5 Right 17.90 0.0 %
3/2(A3022 Brixham Road) 3.60 0.00 N Arm 5 Right 16.80 100.0 % 1942 1942
4/1 Infinite Saturation Flow Inf Inf
5/1 Infinite Saturation Flow Inf Inf
5/2 Infinite Saturation Flow Inf Inf
6/1 Infinite Saturation Flow Inf Inf

Full Input Data And Results
Scenario 18: 'TA 2024 + Dev PM' (FG24: 'TA 2024 + Dev PM', Plan 1: 'Network Control Plan 1')Traffic Flows, DesiredDesired Flow :
Destination
Origin
A B C Tot.
A 0 792 496 1288
B 898 0 49 947
C 565 50 0 615
Tot. 1463 842 545 2850
Traffic Lane Flows
LaneScenario 18:
TA 2024 + DevPM
Junction: Windy Corner Junction
1/1 543
1/2 72
2/1(short) 792
2/2(with short)
1288(In)496(Out)
3/1 49
3/2 898
4/1 545
5/1 11
5/2 1452
6/1 842

Full Input Data And Results
Lane Saturation FlowsJunction: Windy Corner Junction
LaneLaneWidth
(m)Gradient Nearside
LaneAllowedTurns
TurningRadius
(m)Turning
Prop.Sat Flow(PCU/Hr)
Flared Sat Flow(PCU/Hr)
1/1(A379 Dartmouth Road (north)) 2.85 0.00 Y Arm 5 Ahead Inf 100.0 % 1900 1900
1/2(A379 Dartmouth Road (north)) 3.36 0.00 Y
Arm 5 Ahead Inf 30.6 %1754 1754
Arm 6 Right 9.30 69.4 %
2/1(A379 Darmouth Road (south)) 4.10 0.00 Y Arm 6 Left 48.20 100.0 % 1964 1964
2/2(A379 Darmouth Road (south)) 4.00 0.00 Y Arm 4 Ahead Inf 100.0 % 2015 2015
3/1(A3022 Brixham Road) 3.05 0.00 Y
Arm 4 Left 9.00 100.0 %1646 1646
Arm 5 Right 17.90 0.0 %
3/2(A3022 Brixham Road) 3.60 0.00 N Arm 5 Right 16.80 100.0 % 1942 1942
4/1 Infinite Saturation Flow Inf Inf
5/1 Infinite Saturation Flow Inf Inf
5/2 Infinite Saturation Flow Inf Inf
6/1 Infinite Saturation Flow Inf Inf
Scenario 17: 'TA 2024 + Dev AM' (FG23: 'TA 2024 + Dev AM', Plan 1: 'Network Control Plan 1')Stage Sequence Diagram
A
B
1 Min: 7
7 35s
AD2 Min: 4
3 4s
C3 Min: 7
5 36s
Stage TimingsStage 1 2 3
Duration 35 4 36
Change Point 0 42 49

Full Input Data And Results
Signal Timings Diagram
0
0
10
10
20
20
30
30
40
40
50
50
60
60
70
70
80
80
90
90
Time in cycle (sec)
Pha
ses
1 7 : 350
23 : 442
3 5 : 3649
D DC CB BA A

Full Input Data And ResultsNetwork Layout Diagram

Full Input Data And Results
Windy Corner JunctionPRC: 12.0 %Total Traffic Delay: 16.8 pcuHr
C1
0
1
42
2
49
390
Arm
1- A
379
Dar
tmou
thR
oad
(nor
th)
12
AAD
Arm2
- A379D
armouth
Road
(south)
1 2
B
Arm 3 - A3022 Brixham Road1
2
C
Arm4
-
1
Arm5
-
Arm 6 -
1
B
C

Full Input Data And Results
Network Results
Item LaneDescription
LaneType
ControllerStream
Position InFiltered Route Full Phase Arrow
PhaseNumGreens
Total Green(s)
ArrowGreen (s)
DemandFlow (pcu)
Sat Flow(pcu/Hr)
Capacity(pcu)
Deg Sat(%)
Network: WindyCorner Junction -KTC proposedhighway works
- - N/A - - - - - - - - 80.4%
Windy CornerJunction - - N/A - - - - - - - - 80.4%
1/1A379 Dartmouth
Road (north)Ahead
U N/A N/A A 1 44 - 646 1900 950 68.0%
1/2A379 Dartmouth
Road (north)Ahead Right
O N/A N/A A D 1 44 4 61 1680 144 42.4%
2/2+2/1A379 Darmouth
Road (south)Ahead Left
U+O N/A N/A B - 1 35 - 1594 2015:1964 751+1232 80.4 :80.4%
3/1 A3022 BrixhamRoad Left Right U N/A N/A - - - - 33 1646 1646 2.0%
3/2 A3022 BrixhamRoad Right U N/A N/A C 1 36 - 623 1942 798 78.0%
4/1 U N/A N/A - - - - 637 Inf Inf 0.0%
5/1 U N/A N/A - - - - 0 Inf Inf 0.0%
5/2 U N/A N/A - - - - 1269 Inf Inf 0.0%
6/1 U N/A N/A - - - - 1051 Inf Inf 0.0%

Full Input Data And Results
Item Arriving (pcu) Leaving(pcu)
Turners InGaps (pcu)
Turners WhenUnopposed(pcu)
Turners InIntergreen(pcu)
UniformDelay(pcuHr)
Rand +OversatDelay(pcuHr)
StorageAreaUniformDelay(pcuHr)
TotalDelay(pcuHr)
Av. DelayPer PCU(s/pcu)
Max. Back ofUniformQueue (pcu)
Rand +OversatQueue (pcu)
MeanMaxQueue(pcu)
Network: WindyCorner Junction -KTC proposedhighway works
- - 556 495 0 11.1 5.2 0.5 16.8 - - - -
Windy CornerJunction - - 556 495 0 11.1 5.2 0.5 16.8 - - - -
1/1 646 646 - - - 3.1 1.1 - 4.1 22.9 12.2 1.1 13.3
1/2 61 61 61 0 0 0.2 0.4 0.5 1.1 62.8 0.8 0.4 1.1
2/2+2/1 1594 1594 495 495 0 3.9 2.0 - 5.9 13.3 12.9 2.0 14.9
3/1 33 33 - - - 0.0 0.0 - 0.0 1.1 0.0 0.0 0.0
3/2 623 623 - - - 4.0 1.7 - 5.7 33.0 13.5 1.7 15.2
4/1 637 637 - - - 0.0 0.0 - 0.0 0.0 0.0 0.0 0.0
5/1 0 0 - - - 0.0 0.0 - 0.0 0.0 0.0 0.0 0.0
5/2 1269 1269 - - - 0.0 0.0 - 0.0 0.0 0.0 0.0 0.0
6/1 1051 1051 - - - 0.0 0.0 - 0.0 0.0 0.0 0.0 0.0
C1 PRC for Signalled Lanes (%): 12.0 Total Delay for Signalled Lanes (pcuHr): 16.81 Cycle Time (s): 90 PRC Over All Lanes (%): 12.0 Total Delay Over All Lanes(pcuHr): 16.82

Full Input Data And ResultsScenario 18: 'TA 2024 + Dev PM' (FG24: 'TA 2024 + Dev PM', Plan 1: 'Network Control Plan 1')Stage Sequence Diagram
A
B
1 Min: 7
7 25s
AD2 Min: 4
3 4s
C3 Min: 7
5 46s
Stage TimingsStage 1 2 3
Duration 25 4 46
Change Point 0 32 39
Signal Timings Diagram
0
0
10
10
20
20
30
30
40
40
50
50
60
60
70
70
80
80
90
90
Time in cycle (sec)
Pha
ses
1 7 : 250
23 : 432
3 5 : 4639
D DC CB BA A

Full Input Data And ResultsNetwork Layout Diagram

Full Input Data And Results
Windy Corner JunctionPRC: 1.6 %Total Traffic Delay: 19.6 pcuHr
C1
0
1
322
39
3 90
Arm
1- A
379
Dar
tmou
thR
oad
(nor
th)
12
AAD
Arm2
- A379D
armouth
Road
(south)
1 2
B
Arm 3 - A3022 Brixham Road1
2
C
Arm4
-
1
Arm5
-
Arm 6 -
1
B
C

Full Input Data And Results
Network Results
Item LaneDescription
LaneType
ControllerStream
Position InFiltered Route Full Phase Arrow
PhaseNumGreens
Total Green(s)
ArrowGreen (s)
DemandFlow (pcu)
Sat Flow(pcu/Hr)
Capacity(pcu)
Deg Sat(%)
Network: WindyCorner Junction -KTC proposedhighway works
- - N/A - - - - - - - - 88.5%
Windy CornerJunction - - N/A - - - - - - - - 88.5%
1/1A379 Dartmouth
Road (north)Ahead
U N/A N/A A 1 34 - 543 1900 739 73.5%
1/2A379 Dartmouth
Road (north)Ahead Right
O N/A N/A A D 1 34 4 72 1754 229 31.4%
2/2+2/1A379 Darmouth
Road (south)Ahead Left
U+O N/A N/A B - 1 25 - 1288 2015:1964 582+1220 85.2 :64.9%
3/1 A3022 BrixhamRoad Left Right U N/A N/A - - - - 49 1646 1646 3.0%
3/2 A3022 BrixhamRoad Right U N/A N/A C 1 46 - 898 1942 1014 88.5%
4/1 U N/A N/A - - - - 545 Inf Inf 0.0%
5/1 U N/A N/A - - - - 11 Inf Inf 0.0%
5/2 U N/A N/A - - - - 1452 Inf Inf 0.0%
6/1 U N/A N/A - - - - 842 Inf Inf 0.0%

Full Input Data And Results
Item Arriving (pcu) Leaving(pcu)
Turners InGaps (pcu)
Turners WhenUnopposed(pcu)
Turners InIntergreen(pcu)
UniformDelay(pcuHr)
Rand +OversatDelay(pcuHr)
StorageAreaUniformDelay(pcuHr)
TotalDelay(pcuHr)
Av. DelayPer PCU(s/pcu)
Max. Back ofUniformQueue (pcu)
Rand +OversatQueue (pcu)
MeanMaxQueue(pcu)
Network: WindyCorner Junction -KTC proposedhighway works
- - 358 484 0 12.8 6.5 0.3 19.6 - - - -
Windy CornerJunction - - 358 484 0 12.8 6.5 0.3 19.6 - - - -
1/1 543 543 - - - 3.5 1.4 - 4.9 32.6 11.6 1.4 13.0
1/2 72 72 50 0 0 0.4 0.2 0.3 0.8 41.9 1.1 0.2 1.4
2/2+2/1 1288 1288 308 484 0 4.2 1.2 - 5.4 15.1 11.6 1.2 12.8
3/1 49 49 - - - 0.0 0.0 - 0.0 1.1 0.0 0.0 0.0
3/2 898 898 - - - 4.8 3.6 - 8.4 33.7 19.7 3.6 23.3
4/1 545 545 - - - 0.0 0.0 - 0.0 0.0 0.0 0.0 0.0
5/1 11 11 - - - 0.0 0.0 - 0.0 0.0 0.0 0.0 0.0
5/2 1452 1452 - - - 0.0 0.0 - 0.0 0.0 0.0 0.0 0.0
6/1 842 842 - - - 0.0 0.0 - 0.0 0.0 0.0 0.0 0.0
C1 PRC for Signalled Lanes (%): 1.6 Total Delay for Signalled Lanes (pcuHr): 19.57 Cycle Time (s): 90 PRC Over All Lanes (%): 1.6 Total Delay Over All Lanes(pcuHr): 19.58

Appendix O
ARCADY Output

Filename: Proposed Site Access 0734-032 - updated development flows.arc8 Path: F:\DATA\Jobs\0734 White Rock 2, Paignton\Technical\ARCADY Report generation date: 21/09/2017 16:32:20
» (Default Analysis Set) - 2017 Base, AM » (Default Analysis Set) - 2017 Base, PM » (Default Analysis Set) - 2019 Base, AM » (Default Analysis Set) - 2019 Base, PM » (Default Analysis Set) - 2024 Base, AM » (Default Analysis Set) - 2024 Base, PM » (Default Analysis Set) - 2024 Base + Dev, AM » (Default Analysis Set) - 2024 Base + Dev, PM
Junctions 8ARCADY 8 - Roundabout Module
Version: 8.0.4.487 [15039,24/03/2014]
© Copyright TRL Limited, 2017
For sales and distribution information, program advice and maintenance, contact TRL:
Tel: +44 (0)1344 770758 email: [email protected] Web: http://www.trlsoftware.co.uk
The users of this computer program for the solution of an engineering problem are in no way relieved of their responsibility for the correctness of the solution
Generated on 21/09/2017 16:33:34 using Junctions 8 (8.0.4.487)
1

Summary of junction performance
Values shown are the maximum values over all time segments. Delay is the maximum value of average delay per arriving vehicle.
"D9 - 2017 Base, AM " model duration: 07:45 - 09:15
"D10 - 2017 Base, PM" model duration: 16:45 - 18:15
"D11 - 2019 Base, AM" model duration: 07:45 - 09:15
"D12 - 2019 Base, PM" model duration: 16:45 - 18:15
"D15 - 2024 Base, AM" model duration: 07:45 - 09:15
"D16 - 2024 Base, PM" model duration: 16:45 - 18:15
"D17 - 2024 Base + Dev, AM" model duration: 07:45 - 09:15
"D18 - 2024 Base + Dev, PM" model duration: 16:45 - 18:15
Run using Junctions 8.0.4.487 at 21/09/2017 16:32:17
File summary
AM PM
Queue (PCU) Delay (s) RFC LOS Queue (PCU) Delay (s) RFC LOS
A1 - 2017 Base
Arm 1 0.55 3.77 0.34 A 1.15 5.11 0.52 A
Arm 2 1.30 5.25 0.56 A 0.74 3.98 0.42 A
Arm 3 0.00 0.00 0.00 A 0.00 0.00 0.00 A
Arm 4 0.00 0.00 0.00 A 0.00 0.00 0.00 A
A1 - 2019 Base
Arm 1 0.65 4.00 0.38 A 1.66 6.32 0.62 A
Arm 2 2.13 7.11 0.67 A 1.03 4.61 0.50 A
Arm 3 0.00 0.00 0.00 A 0.00 0.00 0.00 A
Arm 4 0.00 0.00 0.00 A 0.00 0.00 0.00 A
A1 - 2024 Base
Arm 1 0.71 4.12 0.40 A 1.89 6.85 0.65 A
Arm 2 2.41 7.73 0.70 A 1.20 4.99 0.54 A
Arm 3 0.00 0.00 0.00 A 0.00 0.00 0.00 A
Arm 4 0.00 0.00 0.00 A 0.00 0.00 0.00 A
A1 - 2024 Base + Dev
Arm 1 0.89 4.65 0.46 A 2.80 9.14 0.73 A
Arm 2 3.20 9.81 0.76 A 1.50 5.93 0.59 A
Arm 3 0.56 15.50 0.36 C 0.20 9.22 0.16 A
Arm 4 0.14 9.78 0.12 A 0.05 6.70 0.05 A
Title White Rock 2
Location Paignton
Site Number 0734
Date 07/06/2016
Version
Status (new file)
Identifier
Client
Jobnumber 0734
Enumerator fflanagan
Description
Generated on 21/09/2017 16:33:34 using Junctions 8 (8.0.4.487)
2

Analysis Options
Units
(Default Analysis Set) - 2017 Base, AM
Data Errors and Warnings No errors or warnings
Traffic Flows
Demand Set Data Options
Entry Flows
General Flows Data
Turning Proportions
Turning Counts / Proportions (PCU/hr) - Junction 1 (for whole period)
Vehicle Length (m)
Do Queue Variations
Calculate Residual Capacity
Residual Capacity Criteria Type
RFC Threshold
Average Delay Threshold (s)
Queue Threshold (PCU)
5.75 N/A 0.85 36.00 20.00
Distance Units Speed Units Traffic Units Input Traffic Units Results Flow Units Average Delay Units Total Delay Units Rate Of Delay Units
m kph PCU PCU perHour s -Min perMin
Default Vehicle
Mix
Vehicle Mix Varies Over Time
Vehicle Mix Varies Over Turn
Vehicle Mix Varies Over Entry
Vehicle Mix Source
PCU Factor
for a HV (PCU)
Default Turning
Proportions
Estimate from
entry/exit counts
Turning Proportions
Vary Over Time
Turning Proportions
Vary Over Turn
Turning Proportions
Vary Over Entry
ü üHV
Percentages2.00 ü ü
Arm Profile Type Use Turning Counts Average Demand Flow (PCU/hr) Flow Scaling Factor (%)
1 ONE HOUR ü 475.00 100.000
2 ONE HOUR ü 818.00 100.000
3 ONE HOUR ü 0.00 100.000
4 ONE HOUR ü 0.00 100.000
To
From
1 2 3 4
1 0.000 475.000 0.000 0.000
2 818.000 0.000 0.000 0.000
3 0.000 0.000 0.000 0.000
4 0.000 0.000 0.000 0.000
Generated on 21/09/2017 16:33:34 using Junctions 8 (8.0.4.487)
3

Turning Proportions (PCU) - Junction 1 (for whole period)
Vehicle Mix
Average PCU Per Vehicle - Junction 1 (for whole period)
Heavy Vehicle Percentages - Junction 1 (for whole period)
Results
Results Summary for whole modelled period
To
From
1 2 3 4
1 0.00 1.00 0.00 0.00
2 1.00 0.00 0.00 0.00
3 0.25 0.25 0.25 0.25
4 0.25 0.25 0.25 0.25
To
From
1 2 3 4
1 1.000 1.075 1.000 1.000
2 1.049 1.000 1.000 1.000
3 1.000 1.000 1.000 1.000
4 1.000 1.000 1.000 1.000
To
From
1 2 3 4
1 0.0 7.5 0.0 0.0
2 4.9 0.0 0.0 0.0
3 0.0 0.0 0.0 0.0
4 0.0 0.0 0.0 0.0
ArmMax RFC
Max Delay
(s)
Max Queue (PCU)
Max LOS
Average Demand (PCU/hr)
Total Junction
Arrivals (PCU)
Total Queueing Delay (PCU-
min)
Average Queueing Delay (s)
Rate Of Queueing Delay (PCU-min/min)
Inclusive Total Queueing Delay
(PCU-min)
Inclusive Average
Queueing Delay (s)
1 0.34 3.77 0.55 A 435.87 653.80 38.19 3.50 0.42 38.19 3.51
2 0.56 5.25 1.30 A 750.61 1125.92 83.81 4.47 0.93 83.82 4.47
3 0.00 0.00 0.00 A 0.00 0.00 0.00 0.00 0.00 0.00 0.00
4 0.00 0.00 0.00 A 0.00 0.00 0.00 0.00 0.00 0.00 0.00
Generated on 21/09/2017 16:33:34 using Junctions 8 (8.0.4.487)
4

Main Results for each time segment
Main results: (07:45-08:00)
Main results: (08:00-08:15)
Main results: (08:15-08:30)
Main results: (08:30-08:45)
Main results: (08:45-09:00)
Main results: (09:00-09:15)
ArmTotal
Demand (PCU/hr)
Junction Arrivals (PCU)
Entry Flow (PCU/hr)
Exit Flow (PCU/hr)
Circulating Flow (PCU/hr)
Pedestrian Demand (Ped/hr)
Capacity (PCU/hr)
Saturation Capacity (PCU/hr)
RFCStart
Queue (PCU)
End Queue (PCU)
Delay (s)
LOS
1 357.60 89.40 356.32 613.28 0.00 0.00 1547.82 1388.89 0.231 0.00 0.32 3.245 A
2 615.83 153.96 613.28 356.32 0.00 0.00 1620.40 1520.98 0.380 0.00 0.64 3.740 A
3 0.00 0.00 0.00 0.00 613.28 0.00 600.22 179.02 0.000 0.00 0.00 0.000 A
4 0.00 0.00 0.00 0.00 613.28 0.00 720.08 240.73 0.000 0.00 0.00 0.000 A
ArmTotal
Demand (PCU/hr)
Junction Arrivals (PCU)
Entry Flow (PCU/hr)
Exit Flow (PCU/hr)
Circulating Flow (PCU/hr)
Pedestrian Demand (Ped/hr)
Capacity (PCU/hr)
Saturation Capacity (PCU/hr)
RFCStart
Queue (PCU)
End Queue (PCU)
Delay (s)
LOS
1 427.02 106.75 426.67 734.46 0.00 0.00 1547.82 1388.90 0.276 0.32 0.41 3.452 A
2 735.37 183.84 734.46 426.67 0.00 0.00 1620.40 1520.98 0.454 0.64 0.86 4.258 A
3 0.00 0.00 0.00 0.00 734.46 0.00 547.48 179.02 0.000 0.00 0.00 0.000 A
4 0.00 0.00 0.00 0.00 734.46 0.00 664.33 240.73 0.000 0.00 0.00 0.000 A
ArmTotal
Demand (PCU/hr)
Junction Arrivals (PCU)
Entry Flow (PCU/hr)
Exit Flow (PCU/hr)
Circulating Flow (PCU/hr)
Pedestrian Demand (Ped/hr)
Capacity (PCU/hr)
Saturation Capacity (PCU/hr)
RFCStart
Queue (PCU)
End Queue (PCU)
Delay (s)
LOS
1 522.98 130.75 522.43 898.91 0.00 0.00 1547.82 1388.90 0.338 0.41 0.55 3.772 A
2 900.63 225.16 898.91 522.43 0.00 0.00 1620.40 1520.98 0.556 0.86 1.30 5.221 A
3 0.00 0.00 0.00 0.00 898.91 0.00 475.92 179.02 0.000 0.00 0.00 0.000 A
4 0.00 0.00 0.00 0.00 898.91 0.00 588.68 240.73 0.000 0.00 0.00 0.000 A
ArmTotal
Demand (PCU/hr)
Junction Arrivals (PCU)
Entry Flow (PCU/hr)
Exit Flow (PCU/hr)
Circulating Flow (PCU/hr)
Pedestrian Demand (Ped/hr)
Capacity (PCU/hr)
Saturation Capacity (PCU/hr)
RFCStart
Queue (PCU)
End Queue (PCU)
Delay (s)
LOS
1 522.98 130.75 522.98 900.60 0.00 0.00 1547.82 1388.90 0.338 0.55 0.55 3.775 A
2 900.63 225.16 900.60 522.98 0.00 0.00 1620.40 1520.98 0.556 1.30 1.30 5.246 A
3 0.00 0.00 0.00 0.00 900.60 0.00 475.18 179.02 0.000 0.00 0.00 0.000 A
4 0.00 0.00 0.00 0.00 900.60 0.00 587.90 240.73 0.000 0.00 0.00 0.000 A
ArmTotal
Demand (PCU/hr)
Junction Arrivals (PCU)
Entry Flow (PCU/hr)
Exit Flow (PCU/hr)
Circulating Flow (PCU/hr)
Pedestrian Demand (Ped/hr)
Capacity (PCU/hr)
Saturation Capacity (PCU/hr)
RFCStart
Queue (PCU)
End Queue (PCU)
Delay (s)
LOS
1 427.02 106.75 427.56 737.07 0.00 0.00 1547.82 1388.90 0.276 0.55 0.41 3.458 A
2 735.37 183.84 737.07 427.56 0.00 0.00 1620.40 1520.98 0.454 1.30 0.88 4.283 A
3 0.00 0.00 0.00 0.00 737.07 0.00 546.35 179.02 0.000 0.00 0.00 0.000 A
4 0.00 0.00 0.00 0.00 737.07 0.00 663.13 240.73 0.000 0.00 0.00 0.000 A
ArmTotal
Demand (PCU/hr)
Junction Arrivals (PCU)
Entry Flow (PCU/hr)
Exit Flow (PCU/hr)
Circulating Flow (PCU/hr)
Pedestrian Demand (Ped/hr)
Capacity (PCU/hr)
Saturation Capacity (PCU/hr)
RFCStart
Queue (PCU)
End Queue (PCU)
Delay (s)
LOS
1 357.60 89.40 357.95 616.76 0.00 0.00 1547.82 1388.89 0.231 0.41 0.32 3.255 A
2 615.83 153.96 616.76 357.95 0.00 0.00 1620.40 1520.98 0.380 0.88 0.65 3.765 A
3 0.00 0.00 0.00 0.00 616.76 0.00 598.70 179.02 0.000 0.00 0.00 0.000 A
4 0.00 0.00 0.00 0.00 616.76 0.00 718.48 240.73 0.000 0.00 0.00 0.000 A
Generated on 21/09/2017 16:33:34 using Junctions 8 (8.0.4.487)
5

Queueing Delay Results for each time segment
Queueing Delay results: (07:45-08:00)
Queueing Delay results: (08:00-08:15)
Queueing Delay results: (08:15-08:30)
Queueing Delay results: (08:30-08:45)
Queueing Delay results: (08:45-09:00)
Queueing Delay results: (09:00-09:15)
ArmQueueing Total Delay (PCU-
min)Queueing Rate Of Delay (PCU-
min/min)Average Delay Per Arriving
Vehicle (s)Unsignalised Level Of
ServiceSignalised Level Of
Service
1 4.73 0.32 3.245 A A
2 9.33 0.62 3.740 A A
3 0.00 0.00 0.000 A A
4 0.00 0.00 0.000 A A
ArmQueueing Total Delay (PCU-
min)Queueing Rate Of Delay (PCU-
min/min)Average Delay Per Arriving
Vehicle (s)Unsignalised Level Of
ServiceSignalised Level Of
Service
1 6.02 0.40 3.452 A A
2 12.68 0.85 4.258 A A
3 0.00 0.00 0.000 A A
4 0.00 0.00 0.000 A A
ArmQueueing Total Delay (PCU-
min)Queueing Rate Of Delay (PCU-
min/min)Average Delay Per Arriving
Vehicle (s)Unsignalised Level Of
ServiceSignalised Level Of
Service
1 8.03 0.54 3.772 A A
2 18.84 1.26 5.221 A A
3 0.00 0.00 0.000 A A
4 0.00 0.00 0.000 A A
ArmQueueing Total Delay (PCU-
min)Queueing Rate Of Delay (PCU-
min/min)Average Delay Per Arriving
Vehicle (s)Unsignalised Level Of
ServiceSignalised Level Of
Service
1 8.19 0.55 3.775 A A
2 19.51 1.30 5.246 A A
3 0.00 0.00 0.000 A A
4 0.00 0.00 0.000 A A
ArmQueueing Total Delay (PCU-
min)Queueing Rate Of Delay (PCU-
min/min)Average Delay Per Arriving
Vehicle (s)Unsignalised Level Of
ServiceSignalised Level Of
Service
1 6.28 0.42 3.458 A A
2 13.53 0.90 4.283 A A
3 0.00 0.00 0.000 A A
4 0.00 0.00 0.000 A A
ArmQueueing Total Delay (PCU-
min)Queueing Rate Of Delay (PCU-
min/min)Average Delay Per Arriving
Vehicle (s)Unsignalised Level Of
ServiceSignalised Level Of
Service
1 4.94 0.33 3.255 A A
2 9.91 0.66 3.765 A A
3 0.00 0.00 0.000 A A
4 0.00 0.00 0.000 A A
Generated on 21/09/2017 16:33:34 using Junctions 8 (8.0.4.487)
6

(Default Analysis Set) - 2017 Base, PM
Data Errors and Warnings No errors or warnings
Traffic Flows
Demand Set Data Options
Entry Flows
General Flows Data
Turning Proportions
Turning Counts / Proportions (PCU/hr) - Junction 1 (for whole period)
Turning Proportions (PCU) - Junction 1 (for whole period)
Default Vehicle
Mix
Vehicle Mix Varies Over Time
Vehicle Mix Varies Over Turn
Vehicle Mix Varies Over Entry
Vehicle Mix Source
PCU Factor
for a HV (PCU)
Default Turning
Proportions
Estimate from
entry/exit counts
Turning Proportions
Vary Over Time
Turning Proportions
Vary Over Turn
Turning Proportions
Vary Over Entry
ü üHV
Percentages2.00 ü ü
Arm Profile Type Use Turning Counts Average Demand Flow (PCU/hr) Flow Scaling Factor (%)
1 ONE HOUR ü 738.00 100.000
2 ONE HOUR ü 612.00 100.000
3 ONE HOUR ü 0.00 100.000
4 ONE HOUR ü 0.00 100.000
To
From
1 2 3 4
1 0.000 738.000 0.000 0.000
2 612.000 0.000 0.000 0.000
3 0.000 0.000 0.000 0.000
4 0.000 0.000 0.000 0.000
To
From
1 2 3 4
1 0.00 1.00 0.00 0.00
2 1.00 0.00 0.00 0.00
3 0.25 0.25 0.25 0.25
4 0.25 0.25 0.25 0.25
Generated on 21/09/2017 16:33:34 using Junctions 8 (8.0.4.487)
7

Vehicle Mix
Average PCU Per Vehicle - Junction 1 (for whole period)
Heavy Vehicle Percentages - Junction 1 (for whole period)
Results
Results Summary for whole modelled period
Main Results for each time segment
Main results: (16:45-17:00)
To
From
1 2 3 4
1 1.000 1.044 1.000 1.000
2 1.048 1.000 1.000 1.000
3 1.000 1.000 1.000 1.000
4 1.000 1.000 1.000 1.000
To
From
1 2 3 4
1 0.0 4.4 0.0 0.0
2 4.8 0.0 0.0 0.0
3 0.0 0.0 0.0 0.0
4 0.0 0.0 0.0 0.0
ArmMax RFC
Max Delay
(s)
Max Queue (PCU)
Max LOS
Average Demand (PCU/hr)
Total Junction
Arrivals (PCU)
Total Queueing Delay (PCU-
min)
Average Queueing Delay (s)
Rate Of Queueing Delay (PCU-min/min)
Inclusive Total Queueing Delay
(PCU-min)
Inclusive Average
Queueing Delay (s)
1 0.52 5.11 1.15 A 677.20 1015.80 74.82 4.42 0.83 74.83 4.42
2 0.42 3.98 0.74 A 561.58 842.37 50.66 3.61 0.56 50.66 3.61
3 0.00 0.00 0.00 A 0.00 0.00 0.00 0.00 0.00 0.00 0.00
4 0.00 0.00 0.00 A 0.00 0.00 0.00 0.00 0.00 0.00 0.00
ArmTotal
Demand (PCU/hr)
Junction Arrivals (PCU)
Entry Flow (PCU/hr)
Exit Flow (PCU/hr)
Circulating Flow (PCU/hr)
Pedestrian Demand (Ped/hr)
Capacity (PCU/hr)
Saturation Capacity (PCU/hr)
RFCStart
Queue (PCU)
End Queue (PCU)
Delay (s)
LOS
1 555.61 138.90 553.28 459.09 0.00 0.00 1547.82 1388.90 0.359 0.00 0.58 3.772 A
2 460.75 115.19 459.09 553.28 0.00 0.00 1620.40 1520.98 0.284 0.00 0.41 3.244 A
3 0.00 0.00 0.00 0.00 459.09 0.00 667.31 179.02 0.000 0.00 0.00 0.000 A
4 0.00 0.00 0.00 0.00 459.09 0.00 791.02 240.73 0.000 0.00 0.00 0.000 A
Generated on 21/09/2017 16:33:34 using Junctions 8 (8.0.4.487)
8

Main results: (17:00-17:15)
Main results: (17:15-17:30)
Main results: (17:30-17:45)
Main results: (17:45-18:00)
Main results: (18:00-18:15)
Queueing Delay Results for each time segment
Queueing Delay results: (16:45-17:00)
ArmTotal
Demand (PCU/hr)
Junction Arrivals (PCU)
Entry Flow (PCU/hr)
Exit Flow (PCU/hr)
Circulating Flow (PCU/hr)
Pedestrian Demand (Ped/hr)
Capacity (PCU/hr)
Saturation Capacity (PCU/hr)
RFCStart
Queue (PCU)
End Queue (PCU)
Delay (s)
LOS
1 663.45 165.86 662.66 549.69 0.00 0.00 1547.82 1388.90 0.429 0.58 0.78 4.242 A
2 550.18 137.54 549.69 662.66 0.00 0.00 1620.40 1520.98 0.340 0.41 0.54 3.521 A
3 0.00 0.00 0.00 0.00 549.69 0.00 627.89 179.02 0.000 0.00 0.00 0.000 A
4 0.00 0.00 0.00 0.00 549.69 0.00 749.34 240.73 0.000 0.00 0.00 0.000 A
ArmTotal
Demand (PCU/hr)
Junction Arrivals (PCU)
Entry Flow (PCU/hr)
Exit Flow (PCU/hr)
Circulating Flow (PCU/hr)
Pedestrian Demand (Ped/hr)
Capacity (PCU/hr)
Saturation Capacity (PCU/hr)
RFCStart
Queue (PCU)
End Queue (PCU)
Delay (s)
LOS
1 812.55 203.14 811.10 673.01 0.00 0.00 1547.82 1388.90 0.525 0.78 1.14 5.091 A
2 673.82 168.46 673.01 811.10 0.00 0.00 1620.40 1520.98 0.416 0.54 0.74 3.979 A
3 0.00 0.00 0.00 0.00 673.01 0.00 574.22 179.02 0.000 0.00 0.00 0.000 A
4 0.00 0.00 0.00 0.00 673.01 0.00 692.60 240.73 0.000 0.00 0.00 0.000 A
ArmTotal
Demand (PCU/hr)
Junction Arrivals (PCU)
Entry Flow (PCU/hr)
Exit Flow (PCU/hr)
Circulating Flow (PCU/hr)
Pedestrian Demand (Ped/hr)
Capacity (PCU/hr)
Saturation Capacity (PCU/hr)
RFCStart
Queue (PCU)
End Queue (PCU)
Delay (s)
LOS
1 812.55 203.14 812.53 673.81 0.00 0.00 1547.82 1388.90 0.525 1.14 1.15 5.111 A
2 673.82 168.46 673.81 812.53 0.00 0.00 1620.40 1520.98 0.416 0.74 0.74 3.985 A
3 0.00 0.00 0.00 0.00 673.81 0.00 573.87 179.02 0.000 0.00 0.00 0.000 A
4 0.00 0.00 0.00 0.00 673.81 0.00 692.23 240.73 0.000 0.00 0.00 0.000 A
ArmTotal
Demand (PCU/hr)
Junction Arrivals (PCU)
Entry Flow (PCU/hr)
Exit Flow (PCU/hr)
Circulating Flow (PCU/hr)
Pedestrian Demand (Ped/hr)
Capacity (PCU/hr)
Saturation Capacity (PCU/hr)
RFCStart
Queue (PCU)
End Queue (PCU)
Delay (s)
LOS
1 663.45 165.86 664.88 550.98 0.00 0.00 1547.82 1388.90 0.429 1.15 0.79 4.264 A
2 550.18 137.54 550.98 664.88 0.00 0.00 1620.40 1520.98 0.340 0.74 0.54 3.532 A
3 0.00 0.00 0.00 0.00 550.98 0.00 627.33 179.02 0.000 0.00 0.00 0.000 A
4 0.00 0.00 0.00 0.00 550.98 0.00 748.74 240.73 0.000 0.00 0.00 0.000 A
ArmTotal
Demand (PCU/hr)
Junction Arrivals (PCU)
Entry Flow (PCU/hr)
Exit Flow (PCU/hr)
Circulating Flow (PCU/hr)
Pedestrian Demand (Ped/hr)
Capacity (PCU/hr)
Saturation Capacity (PCU/hr)
RFCStart
Queue (PCU)
End Queue (PCU)
Delay (s)
LOS
1 555.61 138.90 556.41 461.24 0.00 0.00 1547.82 1388.90 0.359 0.79 0.59 3.796 A
2 460.75 115.19 461.24 556.41 0.00 0.00 1620.40 1520.98 0.284 0.54 0.42 3.255 A
3 0.00 0.00 0.00 0.00 461.24 0.00 666.38 179.02 0.000 0.00 0.00 0.000 A
4 0.00 0.00 0.00 0.00 461.24 0.00 790.03 240.73 0.000 0.00 0.00 0.000 A
ArmQueueing Total Delay (PCU-
min)Queueing Rate Of Delay (PCU-
min/min)Average Delay Per Arriving
Vehicle (s)Unsignalised Level Of
ServiceSignalised Level Of
Service
1 8.49 0.57 3.772 A A
2 6.08 0.41 3.244 A A
3 0.00 0.00 0.000 A A
4 0.00 0.00 0.000 A A
Generated on 21/09/2017 16:33:34 using Junctions 8 (8.0.4.487)
9

Queueing Delay results: (17:00-17:15)
Queueing Delay results: (17:15-17:30)
Queueing Delay results: (17:30-17:45)
Queueing Delay results: (17:45-18:00)
Queueing Delay results: (18:00-18:15)
ArmQueueing Total Delay (PCU-
min)Queueing Rate Of Delay (PCU-
min/min)Average Delay Per Arriving
Vehicle (s)Unsignalised Level Of
ServiceSignalised Level Of
Service
1 11.41 0.76 4.242 A A
2 7.90 0.53 3.521 A A
3 0.00 0.00 0.000 A A
4 0.00 0.00 0.000 A A
ArmQueueing Total Delay (PCU-
min)Queueing Rate Of Delay (PCU-
min/min)Average Delay Per Arriving
Vehicle (s)Unsignalised Level Of
ServiceSignalised Level Of
Service
1 16.62 1.11 5.091 A A
2 10.88 0.73 3.979 A A
3 0.00 0.00 0.000 A A
4 0.00 0.00 0.000 A A
ArmQueueing Total Delay (PCU-
min)Queueing Rate Of Delay (PCU-
min/min)Average Delay Per Arriving
Vehicle (s)Unsignalised Level Of
ServiceSignalised Level Of
Service
1 17.17 1.14 5.111 A A
2 11.13 0.74 3.985 A A
3 0.00 0.00 0.000 A A
4 0.00 0.00 0.000 A A
ArmQueueing Total Delay (PCU-
min)Queueing Rate Of Delay (PCU-
min/min)Average Delay Per Arriving
Vehicle (s)Unsignalised Level Of
ServiceSignalised Level Of
Service
1 12.14 0.81 4.264 A A
2 8.28 0.55 3.532 A A
3 0.00 0.00 0.000 A A
4 0.00 0.00 0.000 A A
ArmQueueing Total Delay (PCU-
min)Queueing Rate Of Delay (PCU-
min/min)Average Delay Per Arriving
Vehicle (s)Unsignalised Level Of
ServiceSignalised Level Of
Service
1 9.00 0.60 3.796 A A
2 6.37 0.42 3.255 A A
3 0.00 0.00 0.000 A A
4 0.00 0.00 0.000 A A
Generated on 21/09/2017 16:33:34 using Junctions 8 (8.0.4.487)
10

(Default Analysis Set) - 2019 Base, AM
Data Errors and Warnings No errors or warnings
Traffic Flows
Demand Set Data Options
Entry Flows
General Flows Data
Turning Proportions
Turning Counts / Proportions (PCU/hr) - Junction 1 (for whole period)
Turning Proportions (PCU) - Junction 1 (for whole period)
Default Vehicle
Mix
Vehicle Mix Varies Over Time
Vehicle Mix Varies Over Turn
Vehicle Mix Varies Over Entry
Vehicle Mix Source
PCU Factor
for a HV (PCU)
Default Turning
Proportions
Estimate from
entry/exit counts
Turning Proportions
Vary Over Time
Turning Proportions
Vary Over Turn
Turning Proportions
Vary Over Entry
ü üHV
Percentages2.00 ü ü
Arm Profile Type Use Turning Counts Average Demand Flow (PCU/hr) Flow Scaling Factor (%)
1 ONE HOUR ü 534.00 100.000
2 ONE HOUR ü 993.00 100.000
3 ONE HOUR ü 0.00 100.000
4 ONE HOUR ü 0.00 100.000
To
From
1 2 3 4
1 0.000 534.000 0.000 0.000
2 993.000 0.000 0.000 0.000
3 0.000 0.000 0.000 0.000
4 0.000 0.000 0.000 0.000
To
From
1 2 3 4
1 0.00 1.00 0.00 0.00
2 1.00 0.00 0.00 0.00
3 0.25 0.25 0.25 0.25
4 0.25 0.25 0.25 0.25
Generated on 21/09/2017 16:33:34 using Junctions 8 (8.0.4.487)
11

Vehicle Mix
Average PCU Per Vehicle - Junction 1 (for whole period)
Heavy Vehicle Percentages - Junction 1 (for whole period)
Results
Results Summary for whole modelled period
Main Results for each time segment
Main results: (07:45-08:00)
To
From
1 2 3 4
1 1.000 1.066 1.000 1.000
2 1.041 1.000 1.000 1.000
3 1.000 1.000 1.000 1.000
4 1.000 1.000 1.000 1.000
To
From
1 2 3 4
1 0.0 6.6 0.0 0.0
2 4.1 0.0 0.0 0.0
3 0.0 0.0 0.0 0.0
4 0.0 0.0 0.0 0.0
ArmMax RFC
Max Delay
(s)
Max Queue (PCU)
Max LOS
Average Demand (PCU/hr)
Total Junction
Arrivals (PCU)
Total Queueing Delay (PCU-
min)
Average Queueing Delay (s)
Rate Of Queueing Delay (PCU-min/min)
Inclusive Total Queueing Delay
(PCU-min)
Inclusive Average
Queueing Delay (s)
1 0.38 4.00 0.65 A 490.01 735.01 44.87 3.66 0.50 44.87 3.66
2 0.67 7.11 2.13 A 911.19 1366.79 127.17 5.58 1.41 127.18 5.58
3 0.00 0.00 0.00 A 0.00 0.00 0.00 0.00 0.00 0.00 0.00
4 0.00 0.00 0.00 A 0.00 0.00 0.00 0.00 0.00 0.00 0.00
ArmTotal
Demand (PCU/hr)
Junction Arrivals (PCU)
Entry Flow (PCU/hr)
Exit Flow (PCU/hr)
Circulating Flow (PCU/hr)
Pedestrian Demand (Ped/hr)
Capacity (PCU/hr)
Saturation Capacity (PCU/hr)
RFCStart
Queue (PCU)
End Queue (PCU)
Delay (s)
LOS
1 402.02 100.51 400.53 744.05 0.00 0.00 1547.82 1388.90 0.260 0.00 0.37 3.340 A
2 747.58 186.90 744.05 400.53 0.00 0.00 1620.40 1520.98 0.461 0.00 0.88 4.259 A
3 0.00 0.00 0.00 0.00 744.05 0.00 543.31 179.02 0.000 0.00 0.00 0.000 A
4 0.00 0.00 0.00 0.00 744.05 0.00 659.92 240.73 0.000 0.00 0.00 0.000 A
Generated on 21/09/2017 16:33:34 using Junctions 8 (8.0.4.487)
12

Main results: (08:00-08:15)
Main results: (08:15-08:30)
Main results: (08:30-08:45)
Main results: (08:45-09:00)
Main results: (09:00-09:15)
Queueing Delay Results for each time segment
Queueing Delay results: (07:45-08:00)
ArmTotal
Demand (PCU/hr)
Junction Arrivals (PCU)
Entry Flow (PCU/hr)
Exit Flow (PCU/hr)
Circulating Flow (PCU/hr)
Pedestrian Demand (Ped/hr)
Capacity (PCU/hr)
Saturation Capacity (PCU/hr)
RFCStart
Queue (PCU)
End Queue (PCU)
Delay (s)
LOS
1 480.06 120.01 479.64 891.18 0.00 0.00 1547.82 1388.90 0.310 0.37 0.48 3.590 A
2 892.69 223.17 891.18 479.64 0.00 0.00 1620.40 1520.98 0.551 0.88 1.26 5.129 A
3 0.00 0.00 0.00 0.00 891.18 0.00 479.28 179.02 0.000 0.00 0.00 0.000 A
4 0.00 0.00 0.00 0.00 891.18 0.00 592.23 240.73 0.000 0.00 0.00 0.000 A
ArmTotal
Demand (PCU/hr)
Junction Arrivals (PCU)
Entry Flow (PCU/hr)
Exit Flow (PCU/hr)
Circulating Flow (PCU/hr)
Pedestrian Demand (Ped/hr)
Capacity (PCU/hr)
Saturation Capacity (PCU/hr)
RFCStart
Queue (PCU)
End Queue (PCU)
Delay (s)
LOS
1 587.94 146.99 587.26 1089.92 0.00 0.00 1547.82 1388.90 0.380 0.48 0.65 3.993 A
2 1093.31 273.33 1089.92 587.26 0.00 0.00 1620.40 1520.98 0.675 1.26 2.11 7.020 A
3 0.00 0.00 0.00 0.00 1089.92 0.00 392.80 179.02 0.000 0.00 0.00 0.000 A
4 0.00 0.00 0.00 0.00 1089.92 0.00 500.80 240.73 0.000 0.00 0.00 0.000 A
ArmTotal
Demand (PCU/hr)
Junction Arrivals (PCU)
Entry Flow (PCU/hr)
Exit Flow (PCU/hr)
Circulating Flow (PCU/hr)
Pedestrian Demand (Ped/hr)
Capacity (PCU/hr)
Saturation Capacity (PCU/hr)
RFCStart
Queue (PCU)
End Queue (PCU)
Delay (s)
LOS
1 587.94 146.99 587.94 1093.22 0.00 0.00 1547.82 1388.90 0.380 0.65 0.65 3.997 A
2 1093.31 273.33 1093.22 587.94 0.00 0.00 1620.40 1520.98 0.675 2.11 2.13 7.106 A
3 0.00 0.00 0.00 0.00 1093.22 0.00 391.36 179.02 0.000 0.00 0.00 0.000 A
4 0.00 0.00 0.00 0.00 1093.22 0.00 499.29 240.73 0.000 0.00 0.00 0.000 A
ArmTotal
Demand (PCU/hr)
Junction Arrivals (PCU)
Entry Flow (PCU/hr)
Exit Flow (PCU/hr)
Circulating Flow (PCU/hr)
Pedestrian Demand (Ped/hr)
Capacity (PCU/hr)
Saturation Capacity (PCU/hr)
RFCStart
Queue (PCU)
End Queue (PCU)
Delay (s)
LOS
1 480.06 120.01 480.73 896.05 0.00 0.00 1547.82 1388.90 0.310 0.65 0.48 3.597 A
2 892.69 223.17 896.05 480.73 0.00 0.00 1620.40 1520.98 0.551 2.13 1.29 5.197 A
3 0.00 0.00 0.00 0.00 896.05 0.00 477.16 179.02 0.000 0.00 0.00 0.000 A
4 0.00 0.00 0.00 0.00 896.05 0.00 589.99 240.73 0.000 0.00 0.00 0.000 A
ArmTotal
Demand (PCU/hr)
Junction Arrivals (PCU)
Entry Flow (PCU/hr)
Exit Flow (PCU/hr)
Circulating Flow (PCU/hr)
Pedestrian Demand (Ped/hr)
Capacity (PCU/hr)
Saturation Capacity (PCU/hr)
RFCStart
Queue (PCU)
End Queue (PCU)
Delay (s)
LOS
1 402.02 100.51 402.45 749.16 0.00 0.00 1547.82 1388.90 0.260 0.48 0.38 3.350 A
2 747.58 186.90 749.16 402.45 0.00 0.00 1620.40 1520.98 0.461 1.29 0.90 4.310 A
3 0.00 0.00 0.00 0.00 749.16 0.00 541.09 179.02 0.000 0.00 0.00 0.000 A
4 0.00 0.00 0.00 0.00 749.16 0.00 657.57 240.73 0.000 0.00 0.00 0.000 A
ArmQueueing Total Delay (PCU-
min)Queueing Rate Of Delay (PCU-
min/min)Average Delay Per Arriving
Vehicle (s)Unsignalised Level Of
ServiceSignalised Level Of
Service
1 5.46 0.36 3.340 A A
2 12.84 0.86 4.259 A A
3 0.00 0.00 0.000 A A
4 0.00 0.00 0.000 A A
Generated on 21/09/2017 16:33:34 using Junctions 8 (8.0.4.487)
13

Queueing Delay results: (08:00-08:15)
Queueing Delay results: (08:15-08:30)
Queueing Delay results: (08:30-08:45)
Queueing Delay results: (08:45-09:00)
Queueing Delay results: (09:00-09:15)
ArmQueueing Total Delay (PCU-
min)Queueing Rate Of Delay (PCU-
min/min)Average Delay Per Arriving
Vehicle (s)Unsignalised Level Of
ServiceSignalised Level Of
Service
1 7.04 0.47 3.590 A A
2 18.37 1.22 5.129 A A
3 0.00 0.00 0.000 A A
4 0.00 0.00 0.000 A A
ArmQueueing Total Delay (PCU-
min)Queueing Rate Of Delay (PCU-
min/min)Average Delay Per Arriving
Vehicle (s)Unsignalised Level Of
ServiceSignalised Level Of
Service
1 9.54 0.64 3.993 A A
2 30.15 2.01 7.020 A A
3 0.00 0.00 0.000 A A
4 0.00 0.00 0.000 A A
ArmQueueing Total Delay (PCU-
min)Queueing Rate Of Delay (PCU-
min/min)Average Delay Per Arriving
Vehicle (s)Unsignalised Level Of
ServiceSignalised Level Of
Service
1 9.75 0.65 3.997 A A
2 31.87 2.12 7.106 A A
3 0.00 0.00 0.000 A A
4 0.00 0.00 0.000 A A
ArmQueueing Total Delay (PCU-
min)Queueing Rate Of Delay (PCU-
min/min)Average Delay Per Arriving
Vehicle (s)Unsignalised Level Of
ServiceSignalised Level Of
Service
1 7.36 0.49 3.597 A A
2 20.10 1.34 5.197 A A
3 0.00 0.00 0.000 A A
4 0.00 0.00 0.000 A A
ArmQueueing Total Delay (PCU-
min)Queueing Rate Of Delay (PCU-
min/min)Average Delay Per Arriving
Vehicle (s)Unsignalised Level Of
ServiceSignalised Level Of
Service
1 5.72 0.38 3.350 A A
2 13.84 0.92 4.310 A A
3 0.00 0.00 0.000 A A
4 0.00 0.00 0.000 A A
Generated on 21/09/2017 16:33:34 using Junctions 8 (8.0.4.487)
14

(Default Analysis Set) - 2019 Base, PM
Data Errors and Warnings No errors or warnings
Traffic Flows
Demand Set Data Options
Entry Flows
General Flows Data
Turning Proportions
Turning Counts / Proportions (PCU/hr) - Junction 1 (for whole period)
Turning Proportions (PCU) - Junction 1 (for whole period)
Default Vehicle
Mix
Vehicle Mix Varies Over Time
Vehicle Mix Varies Over Turn
Vehicle Mix Varies Over Entry
Vehicle Mix Source
PCU Factor
for a HV (PCU)
Default Turning
Proportions
Estimate from
entry/exit counts
Turning Proportions
Vary Over Time
Turning Proportions
Vary Over Turn
Turning Proportions
Vary Over Entry
ü üHV
Percentages2.00 ü ü
Arm Profile Type Use Turning Counts Average Demand Flow (PCU/hr) Flow Scaling Factor (%)
1 ONE HOUR ü 869.00 100.000
2 ONE HOUR ü 735.00 100.000
3 ONE HOUR ü 0.00 100.000
4 ONE HOUR ü 0.00 100.000
To
From
1 2 3 4
1 0.000 869.000 0.000 0.000
2 735.000 0.000 0.000 0.000
3 0.000 0.000 0.000 0.000
4 0.000 0.000 0.000 0.000
To
From
1 2 3 4
1 0.00 1.00 0.00 0.00
2 1.00 0.00 0.00 0.00
3 0.25 0.25 0.25 0.25
4 0.25 0.25 0.25 0.25
Generated on 21/09/2017 16:33:34 using Junctions 8 (8.0.4.487)
15

Vehicle Mix
Average PCU Per Vehicle - Junction 1 (for whole period)
Heavy Vehicle Percentages - Junction 1 (for whole period)
Results
Results Summary for whole modelled period
Main Results for each time segment
Main results: (16:45-17:00)
To
From
1 2 3 4
1 1.000 1.037 1.000 1.000
2 1.040 1.000 1.000 1.000
3 1.000 1.000 1.000 1.000
4 1.000 1.000 1.000 1.000
To
From
1 2 3 4
1 0.0 3.7 0.0 0.0
2 4.0 0.0 0.0 0.0
3 0.0 0.0 0.0 0.0
4 0.0 0.0 0.0 0.0
ArmMax RFC
Max Delay
(s)
Max Queue (PCU)
Max LOS
Average Demand (PCU/hr)
Total Junction
Arrivals (PCU)
Total Queueing Delay (PCU-
min)
Average Queueing Delay (s)
Rate Of Queueing Delay (PCU-min/min)
Inclusive Total Queueing Delay
(PCU-min)
Inclusive Average
Queueing Delay (s)
1 0.62 6.32 1.66 A 797.41 1196.11 103.17 5.18 1.15 103.18 5.18
2 0.50 4.61 1.03 A 674.45 1011.67 68.13 4.04 0.76 68.14 4.04
3 0.00 0.00 0.00 A 0.00 0.00 0.00 0.00 0.00 0.00 0.00
4 0.00 0.00 0.00 A 0.00 0.00 0.00 0.00 0.00 0.00 0.00
ArmTotal
Demand (PCU/hr)
Junction Arrivals (PCU)
Entry Flow (PCU/hr)
Exit Flow (PCU/hr)
Circulating Flow (PCU/hr)
Pedestrian Demand (Ped/hr)
Capacity (PCU/hr)
Saturation Capacity (PCU/hr)
RFCStart
Queue (PCU)
End Queue (PCU)
Delay (s)
LOS
1 654.23 163.56 651.22 551.20 0.00 0.00 1547.82 1388.90 0.423 0.00 0.75 4.149 A
2 553.35 138.34 551.20 651.22 0.00 0.00 1620.40 1520.98 0.341 0.00 0.54 3.494 A
3 0.00 0.00 0.00 0.00 551.20 0.00 627.23 179.02 0.000 0.00 0.00 0.000 A
4 0.00 0.00 0.00 0.00 551.20 0.00 748.64 240.73 0.000 0.00 0.00 0.000 A
Generated on 21/09/2017 16:33:34 using Junctions 8 (8.0.4.487)
16

Main results: (17:00-17:15)
Main results: (17:15-17:30)
Main results: (17:30-17:45)
Main results: (17:45-18:00)
Main results: (18:00-18:15)
Queueing Delay Results for each time segment
Queueing Delay results: (16:45-17:00)
ArmTotal
Demand (PCU/hr)
Junction Arrivals (PCU)
Entry Flow (PCU/hr)
Exit Flow (PCU/hr)
Circulating Flow (PCU/hr)
Pedestrian Demand (Ped/hr)
Capacity (PCU/hr)
Saturation Capacity (PCU/hr)
RFCStart
Queue (PCU)
End Queue (PCU)
Delay (s)
LOS
1 781.21 195.30 780.04 660.05 0.00 0.00 1547.82 1388.90 0.505 0.75 1.05 4.856 A
2 660.75 165.19 660.05 780.04 0.00 0.00 1620.40 1520.98 0.408 0.54 0.71 3.896 A
3 0.00 0.00 0.00 0.00 660.05 0.00 579.86 179.02 0.000 0.00 0.00 0.000 A
4 0.00 0.00 0.00 0.00 660.05 0.00 698.56 240.73 0.000 0.00 0.00 0.000 A
ArmTotal
Demand (PCU/hr)
Junction Arrivals (PCU)
Entry Flow (PCU/hr)
Exit Flow (PCU/hr)
Circulating Flow (PCU/hr)
Pedestrian Demand (Ped/hr)
Capacity (PCU/hr)
Saturation Capacity (PCU/hr)
RFCStart
Queue (PCU)
End Queue (PCU)
Delay (s)
LOS
1 956.79 239.20 954.37 807.98 0.00 0.00 1547.82 1388.89 0.618 1.05 1.65 6.266 A
2 809.25 202.31 807.98 954.37 0.00 0.00 1620.40 1520.98 0.499 0.71 1.03 4.600 A
3 0.00 0.00 0.00 0.00 807.98 0.00 515.48 179.02 0.000 0.00 0.00 0.000 A
4 0.00 0.00 0.00 0.00 807.98 0.00 630.51 240.73 0.000 0.00 0.00 0.000 A
ArmTotal
Demand (PCU/hr)
Junction Arrivals (PCU)
Entry Flow (PCU/hr)
Exit Flow (PCU/hr)
Circulating Flow (PCU/hr)
Pedestrian Demand (Ped/hr)
Capacity (PCU/hr)
Saturation Capacity (PCU/hr)
RFCStart
Queue (PCU)
End Queue (PCU)
Delay (s)
LOS
1 956.79 239.20 956.73 809.23 0.00 0.00 1547.82 1388.89 0.618 1.65 1.66 6.315 A
2 809.25 202.31 809.23 956.73 0.00 0.00 1620.40 1520.98 0.499 1.03 1.03 4.615 A
3 0.00 0.00 0.00 0.00 809.23 0.00 514.94 179.02 0.000 0.00 0.00 0.000 A
4 0.00 0.00 0.00 0.00 809.23 0.00 629.93 240.73 0.000 0.00 0.00 0.000 A
ArmTotal
Demand (PCU/hr)
Junction Arrivals (PCU)
Entry Flow (PCU/hr)
Exit Flow (PCU/hr)
Circulating Flow (PCU/hr)
Pedestrian Demand (Ped/hr)
Capacity (PCU/hr)
Saturation Capacity (PCU/hr)
RFCStart
Queue (PCU)
End Queue (PCU)
Delay (s)
LOS
1 781.21 195.30 783.60 661.99 0.00 0.00 1547.82 1388.90 0.505 1.66 1.07 4.901 A
2 660.75 165.19 661.99 783.60 0.00 0.00 1620.40 1520.98 0.408 1.03 0.72 3.912 A
3 0.00 0.00 0.00 0.00 661.99 0.00 579.02 179.02 0.000 0.00 0.00 0.000 A
4 0.00 0.00 0.00 0.00 661.99 0.00 697.67 240.73 0.000 0.00 0.00 0.000 A
ArmTotal
Demand (PCU/hr)
Junction Arrivals (PCU)
Entry Flow (PCU/hr)
Exit Flow (PCU/hr)
Circulating Flow (PCU/hr)
Pedestrian Demand (Ped/hr)
Capacity (PCU/hr)
Saturation Capacity (PCU/hr)
RFCStart
Queue (PCU)
End Queue (PCU)
Delay (s)
LOS
1 654.23 163.56 655.44 554.06 0.00 0.00 1547.82 1388.90 0.423 1.07 0.77 4.190 A
2 553.35 138.34 554.06 655.44 0.00 0.00 1620.40 1520.98 0.341 0.72 0.54 3.515 A
3 0.00 0.00 0.00 0.00 554.06 0.00 625.98 179.02 0.000 0.00 0.00 0.000 A
4 0.00 0.00 0.00 0.00 554.06 0.00 747.32 240.73 0.000 0.00 0.00 0.000 A
ArmQueueing Total Delay (PCU-
min)Queueing Rate Of Delay (PCU-
min/min)Average Delay Per Arriving
Vehicle (s)Unsignalised Level Of
ServiceSignalised Level Of
Service
1 10.97 0.73 4.149 A A
2 7.85 0.52 3.494 A A
3 0.00 0.00 0.000 A A
4 0.00 0.00 0.000 A A
Generated on 21/09/2017 16:33:34 using Junctions 8 (8.0.4.487)
17

Queueing Delay results: (17:00-17:15)
Queueing Delay results: (17:15-17:30)
Queueing Delay results: (17:30-17:45)
Queueing Delay results: (17:45-18:00)
Queueing Delay results: (18:00-18:15)
ArmQueueing Total Delay (PCU-
min)Queueing Rate Of Delay (PCU-
min/min)Average Delay Per Arriving
Vehicle (s)Unsignalised Level Of
ServiceSignalised Level Of
Service
1 15.28 1.02 4.856 A A
2 10.46 0.70 3.896 A A
3 0.00 0.00 0.000 A A
4 0.00 0.00 0.000 A A
ArmQueueing Total Delay (PCU-
min)Queueing Rate Of Delay (PCU-
min/min)Average Delay Per Arriving
Vehicle (s)Unsignalised Level Of
ServiceSignalised Level Of
Service
1 23.78 1.59 6.266 A A
2 15.02 1.00 4.600 A A
3 0.00 0.00 0.000 A A
4 0.00 0.00 0.000 A A
ArmQueueing Total Delay (PCU-
min)Queueing Rate Of Delay (PCU-
min/min)Average Delay Per Arriving
Vehicle (s)Unsignalised Level Of
ServiceSignalised Level Of
Service
1 24.87 1.66 6.315 A A
2 15.46 1.03 4.615 A A
3 0.00 0.00 0.000 A A
4 0.00 0.00 0.000 A A
ArmQueueing Total Delay (PCU-
min)Queueing Rate Of Delay (PCU-
min/min)Average Delay Per Arriving
Vehicle (s)Unsignalised Level Of
ServiceSignalised Level Of
Service
1 16.53 1.10 4.901 A A
2 11.06 0.74 3.912 A A
3 0.00 0.00 0.000 A A
4 0.00 0.00 0.000 A A
ArmQueueing Total Delay (PCU-
min)Queueing Rate Of Delay (PCU-
min/min)Average Delay Per Arriving
Vehicle (s)Unsignalised Level Of
ServiceSignalised Level Of
Service
1 11.75 0.78 4.190 A A
2 8.28 0.55 3.515 A A
3 0.00 0.00 0.000 A A
4 0.00 0.00 0.000 A A
Generated on 21/09/2017 16:33:34 using Junctions 8 (8.0.4.487)
18

(Default Analysis Set) - 2024 Base, AM
Data Errors and Warnings No errors or warnings
Traffic Flows
Demand Set Data Options
Entry Flows
General Flows Data
Turning Proportions
Turning Counts / Proportions (PCU/hr) - Junction 1 (for whole period)
Turning Proportions (PCU) - Junction 1 (for whole period)
Default Vehicle
Mix
Vehicle Mix Varies Over Time
Vehicle Mix Varies Over Turn
Vehicle Mix Varies Over Entry
Vehicle Mix Source
PCU Factor
for a HV (PCU)
Default Turning
Proportions
Estimate from
entry/exit counts
Turning Proportions
Vary Over Time
Turning Proportions
Vary Over Turn
Turning Proportions
Vary Over Entry
ü üHV
Percentages2.00 ü ü
Arm Profile Type Use Turning Counts Average Demand Flow (PCU/hr) Flow Scaling Factor (%)
1 ONE HOUR ü 564.00 100.000
2 ONE HOUR ü 1033.00 100.000
3 ONE HOUR ü 0.00 100.000
4 ONE HOUR ü 0.00 100.000
To
From
1 2 3 4
1 0.000 564.000 0.000 0.000
2 1033.000 0.000 0.000 0.000
3 0.000 0.000 0.000 0.000
4 0.000 0.000 0.000 0.000
To
From
1 2 3 4
1 0.00 1.00 0.00 0.00
2 1.00 0.00 0.00 0.00
3 0.25 0.25 0.25 0.25
4 0.25 0.25 0.25 0.25
Generated on 21/09/2017 16:33:34 using Junctions 8 (8.0.4.487)
19

Vehicle Mix
Average PCU Per Vehicle - Junction 1 (for whole period)
Heavy Vehicle Percentages - Junction 1 (for whole period)
Results
Results Summary for whole modelled period
Main Results for each time segment
Main results: (07:45-08:00)
To
From
1 2 3 4
1 1.000 1.062 1.000 1.000
2 1.039 1.000 1.000 1.000
3 1.000 1.000 1.000 1.000
4 1.000 1.000 1.000 1.000
To
From
1 2 3 4
1 0.0 6.2 0.0 0.0
2 3.9 0.0 0.0 0.0
3 0.0 0.0 0.0 0.0
4 0.0 0.0 0.0 0.0
ArmMax RFC
Max Delay
(s)
Max Queue (PCU)
Max LOS
Average Demand (PCU/hr)
Total Junction
Arrivals (PCU)
Total Queueing Delay (PCU-
min)
Average Queueing Delay (s)
Rate Of Queueing Delay (PCU-min/min)
Inclusive Total Queueing Delay
(PCU-min)
Inclusive Average
Queueing Delay (s)
1 0.40 4.12 0.71 A 517.54 776.30 48.55 3.75 0.54 48.55 3.75
2 0.70 7.73 2.41 A 947.90 1421.85 140.54 5.93 1.56 140.56 5.93
3 0.00 0.00 0.00 A 0.00 0.00 0.00 0.00 0.00 0.00 0.00
4 0.00 0.00 0.00 A 0.00 0.00 0.00 0.00 0.00 0.00 0.00
ArmTotal
Demand (PCU/hr)
Junction Arrivals (PCU)
Entry Flow (PCU/hr)
Exit Flow (PCU/hr)
Circulating Flow (PCU/hr)
Pedestrian Demand (Ped/hr)
Capacity (PCU/hr)
Saturation Capacity (PCU/hr)
RFCStart
Queue (PCU)
End Queue (PCU)
Delay (s)
LOS
1 424.61 106.15 423.01 773.90 0.00 0.00 1547.82 1388.90 0.274 0.00 0.40 3.395 A
2 777.70 194.42 773.90 423.01 0.00 0.00 1620.40 1520.98 0.480 0.00 0.95 4.400 A
3 0.00 0.00 0.00 0.00 773.90 0.00 530.32 179.02 0.000 0.00 0.00 0.000 A
4 0.00 0.00 0.00 0.00 773.90 0.00 646.19 240.73 0.000 0.00 0.00 0.000 A
Generated on 21/09/2017 16:33:34 using Junctions 8 (8.0.4.487)
20

Main results: (08:00-08:15)
Main results: (08:15-08:30)
Main results: (08:30-08:45)
Main results: (08:45-09:00)
Main results: (09:00-09:15)
Queueing Delay Results for each time segment
Queueing Delay results: (07:45-08:00)
ArmTotal
Demand (PCU/hr)
Junction Arrivals (PCU)
Entry Flow (PCU/hr)
Exit Flow (PCU/hr)
Circulating Flow (PCU/hr)
Pedestrian Demand (Ped/hr)
Capacity (PCU/hr)
Saturation Capacity (PCU/hr)
RFCStart
Queue (PCU)
End Queue (PCU)
Delay (s)
LOS
1 507.02 126.76 506.56 926.94 0.00 0.00 1547.82 1388.90 0.328 0.40 0.51 3.669 A
2 928.65 232.16 926.94 506.56 0.00 0.00 1620.40 1520.98 0.573 0.95 1.38 5.381 A
3 0.00 0.00 0.00 0.00 926.94 0.00 463.72 179.02 0.000 0.00 0.00 0.000 A
4 0.00 0.00 0.00 0.00 926.94 0.00 575.78 240.73 0.000 0.00 0.00 0.000 A
ArmTotal
Demand (PCU/hr)
Junction Arrivals (PCU)
Entry Flow (PCU/hr)
Exit Flow (PCU/hr)
Circulating Flow (PCU/hr)
Pedestrian Demand (Ped/hr)
Capacity (PCU/hr)
Saturation Capacity (PCU/hr)
RFCStart
Queue (PCU)
End Queue (PCU)
Delay (s)
LOS
1 620.98 155.24 620.21 1133.34 0.00 0.00 1547.82 1388.90 0.401 0.51 0.71 4.118 A
2 1137.35 284.34 1133.34 620.21 0.00 0.00 1620.40 1520.98 0.702 1.38 2.38 7.616 A
3 0.00 0.00 0.00 0.00 1133.34 0.00 373.90 179.02 0.000 0.00 0.00 0.000 A
4 0.00 0.00 0.00 0.00 1133.34 0.00 480.83 240.73 0.000 0.00 0.00 0.000 A
ArmTotal
Demand (PCU/hr)
Junction Arrivals (PCU)
Entry Flow (PCU/hr)
Exit Flow (PCU/hr)
Circulating Flow (PCU/hr)
Pedestrian Demand (Ped/hr)
Capacity (PCU/hr)
Saturation Capacity (PCU/hr)
RFCStart
Queue (PCU)
End Queue (PCU)
Delay (s)
LOS
1 620.98 155.24 620.97 1137.23 0.00 0.00 1547.82 1388.90 0.401 0.71 0.71 4.124 A
2 1137.35 284.34 1137.23 620.97 0.00 0.00 1620.40 1520.98 0.702 2.38 2.41 7.735 A
3 0.00 0.00 0.00 0.00 1137.23 0.00 372.21 179.02 0.000 0.00 0.00 0.000 A
4 0.00 0.00 0.00 0.00 1137.23 0.00 479.04 240.73 0.000 0.00 0.00 0.000 A
ArmTotal
Demand (PCU/hr)
Junction Arrivals (PCU)
Entry Flow (PCU/hr)
Exit Flow (PCU/hr)
Circulating Flow (PCU/hr)
Pedestrian Demand (Ped/hr)
Capacity (PCU/hr)
Saturation Capacity (PCU/hr)
RFCStart
Queue (PCU)
End Queue (PCU)
Delay (s)
LOS
1 507.02 126.76 507.78 932.64 0.00 0.00 1547.82 1388.90 0.328 0.71 0.52 3.677 A
2 928.65 232.16 932.64 507.78 0.00 0.00 1620.40 1520.98 0.573 2.41 1.41 5.469 A
3 0.00 0.00 0.00 0.00 932.64 0.00 461.24 179.02 0.000 0.00 0.00 0.000 A
4 0.00 0.00 0.00 0.00 932.64 0.00 573.16 240.73 0.000 0.00 0.00 0.000 A
ArmTotal
Demand (PCU/hr)
Junction Arrivals (PCU)
Entry Flow (PCU/hr)
Exit Flow (PCU/hr)
Circulating Flow (PCU/hr)
Pedestrian Demand (Ped/hr)
Capacity (PCU/hr)
Saturation Capacity (PCU/hr)
RFCStart
Queue (PCU)
End Queue (PCU)
Delay (s)
LOS
1 424.61 106.15 425.08 779.48 0.00 0.00 1547.82 1388.90 0.274 0.52 0.40 3.408 A
2 777.70 194.42 779.48 425.08 0.00 0.00 1620.40 1520.98 0.480 1.41 0.97 4.458 A
3 0.00 0.00 0.00 0.00 779.48 0.00 527.89 179.02 0.000 0.00 0.00 0.000 A
4 0.00 0.00 0.00 0.00 779.48 0.00 643.62 240.73 0.000 0.00 0.00 0.000 A
ArmQueueing Total Delay (PCU-
min)Queueing Rate Of Delay (PCU-
min/min)Average Delay Per Arriving
Vehicle (s)Unsignalised Level Of
ServiceSignalised Level Of
Service
1 5.86 0.39 3.395 A A
2 13.78 0.92 4.400 A A
3 0.00 0.00 0.000 A A
4 0.00 0.00 0.000 A A
Generated on 21/09/2017 16:33:34 using Junctions 8 (8.0.4.487)
21

Queueing Delay results: (08:00-08:15)
Queueing Delay results: (08:15-08:30)
Queueing Delay results: (08:30-08:45)
Queueing Delay results: (08:45-09:00)
Queueing Delay results: (09:00-09:15)
ArmQueueing Total Delay (PCU-
min)Queueing Rate Of Delay (PCU-
min/min)Average Delay Per Arriving
Vehicle (s)Unsignalised Level Of
ServiceSignalised Level Of
Service
1 7.59 0.51 3.669 A A
2 20.00 1.33 5.381 A A
3 0.00 0.00 0.000 A A
4 0.00 0.00 0.000 A A
ArmQueueing Total Delay (PCU-
min)Queueing Rate Of Delay (PCU-
min/min)Average Delay Per Arriving
Vehicle (s)Unsignalised Level Of
ServiceSignalised Level Of
Service
1 10.38 0.69 4.118 A A
2 33.81 2.25 7.616 A A
3 0.00 0.00 0.000 A A
4 0.00 0.00 0.000 A A
ArmQueueing Total Delay (PCU-
min)Queueing Rate Of Delay (PCU-
min/min)Average Delay Per Arriving
Vehicle (s)Unsignalised Level Of
ServiceSignalised Level Of
Service
1 10.62 0.71 4.124 A A
2 36.00 2.40 7.735 A A
3 0.00 0.00 0.000 A A
4 0.00 0.00 0.000 A A
ArmQueueing Total Delay (PCU-
min)Queueing Rate Of Delay (PCU-
min/min)Average Delay Per Arriving
Vehicle (s)Unsignalised Level Of
ServiceSignalised Level Of
Service
1 7.95 0.53 3.677 A A
2 22.05 1.47 5.469 A A
3 0.00 0.00 0.000 A A
4 0.00 0.00 0.000 A A
ArmQueueing Total Delay (PCU-
min)Queueing Rate Of Delay (PCU-
min/min)Average Delay Per Arriving
Vehicle (s)Unsignalised Level Of
ServiceSignalised Level Of
Service
1 6.15 0.41 3.408 A A
2 14.91 0.99 4.458 A A
3 0.00 0.00 0.000 A A
4 0.00 0.00 0.000 A A
Generated on 21/09/2017 16:33:34 using Junctions 8 (8.0.4.487)
22

(Default Analysis Set) - 2024 Base, PM
Data Errors and Warnings No errors or warnings
Traffic Flows
Demand Set Data Options
Entry Flows
General Flows Data
Turning Proportions
Turning Counts / Proportions (PCU/hr) - Junction 1 (for whole period)
Turning Proportions (PCU) - Junction 1 (for whole period)
Default Vehicle
Mix
Vehicle Mix Varies Over Time
Vehicle Mix Varies Over Turn
Vehicle Mix Varies Over Entry
Vehicle Mix Source
PCU Factor
for a HV (PCU)
Default Turning
Proportions
Estimate from
entry/exit counts
Turning Proportions
Vary Over Time
Turning Proportions
Vary Over Turn
Turning Proportions
Vary Over Entry
ü üHV
Percentages2.00 ü ü
Arm Profile Type Use Turning Counts Average Demand Flow (PCU/hr) Flow Scaling Factor (%)
1 ONE HOUR ü 912.00 100.000
2 ONE HOUR ü 793.00 100.000
3 ONE HOUR ü 0.00 100.000
4 ONE HOUR ü 0.00 100.000
To
From
1 2 3 4
1 0.000 912.000 0.000 0.000
2 793.000 0.000 0.000 0.000
3 0.000 0.000 0.000 0.000
4 0.000 0.000 0.000 0.000
To
From
1 2 3 4
1 0.00 1.00 0.00 0.00
2 1.00 0.00 0.00 0.00
3 0.25 0.25 0.25 0.25
4 0.25 0.25 0.25 0.25
Generated on 21/09/2017 16:33:34 using Junctions 8 (8.0.4.487)
23

Vehicle Mix
Average PCU Per Vehicle - Junction 1 (for whole period)
Heavy Vehicle Percentages - Junction 1 (for whole period)
Results
Results Summary for whole modelled period
Main Results for each time segment
Main results: (16:45-17:00)
To
From
1 2 3 4
1 1.000 1.035 1.000 1.000
2 1.037 1.000 1.000 1.000
3 1.000 1.000 1.000 1.000
4 1.000 1.000 1.000 1.000
To
From
1 2 3 4
1 0.0 3.5 0.0 0.0
2 3.7 0.0 0.0 0.0
3 0.0 0.0 0.0 0.0
4 0.0 0.0 0.0 0.0
ArmMax RFC
Max Delay
(s)
Max Queue (PCU)
Max LOS
Average Demand (PCU/hr)
Total Junction
Arrivals (PCU)
Total Queueing Delay (PCU-
min)
Average Queueing Delay (s)
Rate Of Queueing Delay (PCU-min/min)
Inclusive Total Queueing Delay
(PCU-min)
Inclusive Average
Queueing Delay (s)
1 0.65 6.85 1.89 A 836.87 1255.30 114.91 5.49 1.28 114.92 5.49
2 0.54 4.99 1.20 A 727.67 1091.51 78.06 4.29 0.87 78.07 4.29
3 0.00 0.00 0.00 A 0.00 0.00 0.00 0.00 0.00 0.00 0.00
4 0.00 0.00 0.00 A 0.00 0.00 0.00 0.00 0.00 0.00 0.00
ArmTotal
Demand (PCU/hr)
Junction Arrivals (PCU)
Entry Flow (PCU/hr)
Exit Flow (PCU/hr)
Circulating Flow (PCU/hr)
Pedestrian Demand (Ped/hr)
Capacity (PCU/hr)
Saturation Capacity (PCU/hr)
RFCStart
Queue (PCU)
End Queue (PCU)
Delay (s)
LOS
1 686.60 171.65 683.33 594.61 0.00 0.00 1547.82 1388.89 0.444 0.00 0.82 4.293 A
2 597.01 149.25 594.61 683.33 0.00 0.00 1620.40 1520.98 0.368 0.00 0.60 3.632 A
3 0.00 0.00 0.00 0.00 594.61 0.00 608.34 179.02 0.000 0.00 0.00 0.000 A
4 0.00 0.00 0.00 0.00 594.61 0.00 728.67 240.73 0.000 0.00 0.00 0.000 A
Generated on 21/09/2017 16:33:34 using Junctions 8 (8.0.4.487)
24

Main results: (17:00-17:15)
Main results: (17:15-17:30)
Main results: (17:30-17:45)
Main results: (17:45-18:00)
Main results: (18:00-18:15)
Queueing Delay Results for each time segment
Queueing Delay results: (16:45-17:00)
ArmTotal
Demand (PCU/hr)
Junction Arrivals (PCU)
Entry Flow (PCU/hr)
Exit Flow (PCU/hr)
Circulating Flow (PCU/hr)
Pedestrian Demand (Ped/hr)
Capacity (PCU/hr)
Saturation Capacity (PCU/hr)
RFCStart
Queue (PCU)
End Queue (PCU)
Delay (s)
LOS
1 819.87 204.97 818.53 712.06 0.00 0.00 1547.82 1388.90 0.530 0.82 1.15 5.099 A
2 712.89 178.22 712.06 818.53 0.00 0.00 1620.40 1520.98 0.440 0.60 0.81 4.106 A
3 0.00 0.00 0.00 0.00 712.06 0.00 557.23 179.02 0.000 0.00 0.00 0.000 A
4 0.00 0.00 0.00 0.00 712.06 0.00 674.64 240.73 0.000 0.00 0.00 0.000 A
ArmTotal
Demand (PCU/hr)
Junction Arrivals (PCU)
Entry Flow (PCU/hr)
Exit Flow (PCU/hr)
Circulating Flow (PCU/hr)
Pedestrian Demand (Ped/hr)
Capacity (PCU/hr)
Saturation Capacity (PCU/hr)
RFCStart
Queue (PCU)
End Queue (PCU)
Delay (s)
LOS
1 1004.13 251.03 1001.25 871.55 0.00 0.00 1547.82 1388.90 0.649 1.15 1.87 6.780 A
2 873.11 218.28 871.55 1001.25 0.00 0.00 1620.40 1520.98 0.539 0.81 1.20 4.975 A
3 0.00 0.00 0.00 0.00 871.55 0.00 487.82 179.02 0.000 0.00 0.00 0.000 A
4 0.00 0.00 0.00 0.00 871.55 0.00 601.26 240.73 0.000 0.00 0.00 0.000 A
ArmTotal
Demand (PCU/hr)
Junction Arrivals (PCU)
Entry Flow (PCU/hr)
Exit Flow (PCU/hr)
Circulating Flow (PCU/hr)
Pedestrian Demand (Ped/hr)
Capacity (PCU/hr)
Saturation Capacity (PCU/hr)
RFCStart
Queue (PCU)
End Queue (PCU)
Delay (s)
LOS
1 1004.13 251.03 1004.05 873.08 0.00 0.00 1547.82 1388.90 0.649 1.87 1.89 6.849 A
2 873.11 218.28 873.08 1004.05 0.00 0.00 1620.40 1520.98 0.539 1.20 1.20 4.995 A
3 0.00 0.00 0.00 0.00 873.08 0.00 487.16 179.02 0.000 0.00 0.00 0.000 A
4 0.00 0.00 0.00 0.00 873.08 0.00 600.56 240.73 0.000 0.00 0.00 0.000 A
ArmTotal
Demand (PCU/hr)
Junction Arrivals (PCU)
Entry Flow (PCU/hr)
Exit Flow (PCU/hr)
Circulating Flow (PCU/hr)
Pedestrian Demand (Ped/hr)
Capacity (PCU/hr)
Saturation Capacity (PCU/hr)
RFCStart
Queue (PCU)
End Queue (PCU)
Delay (s)
LOS
1 819.87 204.97 822.72 714.42 0.00 0.00 1547.82 1388.90 0.530 1.89 1.18 5.158 A
2 712.89 178.22 714.42 822.72 0.00 0.00 1620.40 1520.98 0.440 1.20 0.82 4.127 A
3 0.00 0.00 0.00 0.00 714.42 0.00 556.20 179.02 0.000 0.00 0.00 0.000 A
4 0.00 0.00 0.00 0.00 714.42 0.00 673.55 240.73 0.000 0.00 0.00 0.000 A
ArmTotal
Demand (PCU/hr)
Junction Arrivals (PCU)
Entry Flow (PCU/hr)
Exit Flow (PCU/hr)
Circulating Flow (PCU/hr)
Pedestrian Demand (Ped/hr)
Capacity (PCU/hr)
Saturation Capacity (PCU/hr)
RFCStart
Queue (PCU)
End Queue (PCU)
Delay (s)
LOS
1 686.60 171.65 687.99 597.86 0.00 0.00 1547.82 1388.89 0.444 1.18 0.83 4.341 A
2 597.01 149.25 597.86 687.99 0.00 0.00 1620.40 1520.98 0.368 0.82 0.61 3.653 A
3 0.00 0.00 0.00 0.00 597.86 0.00 606.92 179.02 0.000 0.00 0.00 0.000 A
4 0.00 0.00 0.00 0.00 597.86 0.00 727.17 240.73 0.000 0.00 0.00 0.000 A
ArmQueueing Total Delay (PCU-
min)Queueing Rate Of Delay (PCU-
min/min)Average Delay Per Arriving
Vehicle (s)Unsignalised Level Of
ServiceSignalised Level Of
Service
1 11.89 0.79 4.293 A A
2 8.79 0.59 3.632 A A
3 0.00 0.00 0.000 A A
4 0.00 0.00 0.000 A A
Generated on 21/09/2017 16:33:34 using Junctions 8 (8.0.4.487)
25

Queueing Delay results: (17:00-17:15)
Queueing Delay results: (17:15-17:30)
Queueing Delay results: (17:30-17:45)
Queueing Delay results: (17:45-18:00)
Queueing Delay results: (18:00-18:15)
ArmQueueing Total Delay (PCU-
min)Queueing Rate Of Delay (PCU-
min/min)Average Delay Per Arriving
Vehicle (s)Unsignalised Level Of
ServiceSignalised Level Of
Service
1 16.80 1.12 5.099 A A
2 11.87 0.79 4.106 A A
3 0.00 0.00 0.000 A A
4 0.00 0.00 0.000 A A
ArmQueueing Total Delay (PCU-
min)Queueing Rate Of Delay (PCU-
min/min)Average Delay Per Arriving
Vehicle (s)Unsignalised Level Of
ServiceSignalised Level Of
Service
1 26.86 1.79 6.780 A A
2 17.45 1.16 4.975 A A
3 0.00 0.00 0.000 A A
4 0.00 0.00 0.000 A A
ArmQueueing Total Delay (PCU-
min)Queueing Rate Of Delay (PCU-
min/min)Average Delay Per Arriving
Vehicle (s)Unsignalised Level Of
ServiceSignalised Level Of
Service
1 28.26 1.88 6.849 A A
2 18.03 1.20 4.995 A A
3 0.00 0.00 0.000 A A
4 0.00 0.00 0.000 A A
ArmQueueing Total Delay (PCU-
min)Queueing Rate Of Delay (PCU-
min/min)Average Delay Per Arriving
Vehicle (s)Unsignalised Level Of
ServiceSignalised Level Of
Service
1 18.30 1.22 5.158 A A
2 12.62 0.84 4.127 A A
3 0.00 0.00 0.000 A A
4 0.00 0.00 0.000 A A
ArmQueueing Total Delay (PCU-
min)Queueing Rate Of Delay (PCU-
min/min)Average Delay Per Arriving
Vehicle (s)Unsignalised Level Of
ServiceSignalised Level Of
Service
1 12.79 0.85 4.341 A A
2 9.31 0.62 3.653 A A
3 0.00 0.00 0.000 A A
4 0.00 0.00 0.000 A A
Generated on 21/09/2017 16:33:34 using Junctions 8 (8.0.4.487)
26

(Default Analysis Set) - 2024 Base + Dev, AM
Data Errors and Warnings No errors or warnings
Traffic Flows
Demand Set Data Options
Entry Flows
General Flows Data
Turning Proportions
Turning Counts / Proportions (PCU/hr) - Junction 1 (for whole period)
Turning Proportions (PCU) - Junction 1 (for whole period)
Default Vehicle
Mix
Vehicle Mix Varies Over Time
Vehicle Mix Varies Over Turn
Vehicle Mix Varies Over Entry
Vehicle Mix Source
PCU Factor
for a HV (PCU)
Default Turning
Proportions
Estimate from
entry/exit counts
Turning Proportions
Vary Over Time
Turning Proportions
Vary Over Turn
Turning Proportions
Vary Over Entry
ü üHV
Percentages2.00 ü ü
Arm Profile Type Use Turning Counts Average Demand Flow (PCU/hr) Flow Scaling Factor (%)
1 ONE HOUR ü 627.00 100.000
2 ONE HOUR ü 1089.00 100.000
3 ONE HOUR ü 119.00 100.000
4 ONE HOUR ü 46.00 100.000
To
From
1 2 3 4
1 0.000 564.000 49.000 14.000
2 1033.000 0.000 51.000 5.000
3 70.000 49.000 0.000 0.000
4 33.000 13.000 0.000 0.000
To
From
1 2 3 4
1 0.00 0.90 0.08 0.02
2 0.95 0.00 0.05 0.00
3 0.59 0.41 0.00 0.00
4 0.72 0.28 0.00 0.00
Generated on 21/09/2017 16:33:34 using Junctions 8 (8.0.4.487)
27

Vehicle Mix
Average PCU Per Vehicle - Junction 1 (for whole period)
Heavy Vehicle Percentages - Junction 1 (for whole period)
Results
Results Summary for whole modelled period
Main Results for each time segment
Main results: (07:45-08:00)
To
From
1 2 3 4
1 1.000 1.062 1.000 1.000
2 1.039 1.000 1.000 1.000
3 1.000 1.000 1.000 1.000
4 1.000 1.000 1.000 1.000
To
From
1 2 3 4
1 0.0 6.2 0.0 0.0
2 3.9 0.0 0.0 0.0
3 0.0 0.0 0.0 0.0
4 0.0 0.0 0.0 0.0
ArmMax RFC
Max Delay
(s)
Max Queue (PCU)
Max LOS
Average Demand (PCU/hr)
Total Junction
Arrivals (PCU)
Total Queueing Delay (PCU-
min)
Average Queueing Delay (s)
Rate Of Queueing Delay (PCU-min/min)
Inclusive Total Queueing Delay
(PCU-min)
Inclusive Average
Queueing Delay (s)
1 0.46 4.65 0.89 A 575.35 863.02 59.22 4.12 0.66 59.22 4.12
2 0.76 9.81 3.20 A 999.29 1498.93 174.87 7.00 1.94 174.89 7.00
3 0.36 15.50 0.56 C 109.20 163.79 31.49 11.53 0.35 31.49 11.54
4 0.12 9.78 0.14 A 42.21 63.32 8.39 7.95 0.09 8.39 7.95
ArmTotal
Demand (PCU/hr)
Junction Arrivals (PCU)
Entry Flow (PCU/hr)
Exit Flow (PCU/hr)
Circulating Flow (PCU/hr)
Pedestrian Demand (Ped/hr)
Capacity (PCU/hr)
Saturation Capacity (PCU/hr)
RFCStart
Queue (PCU)
End Queue (PCU)
Delay (s)
LOS
1 472.04 118.01 470.15 850.46 46.27 0.00 1520.59 1456.31 0.310 0.00 0.47 3.611 A
2 819.86 204.96 815.50 469.18 47.24 0.00 1591.96 1532.29 0.515 0.00 1.09 4.781 A
3 89.59 22.40 88.77 74.93 787.81 0.00 524.27 217.37 0.171 0.00 0.20 8.252 A
4 34.63 8.66 34.39 14.24 862.34 0.00 605.50 233.54 0.057 0.00 0.06 6.300 A
Generated on 21/09/2017 16:33:34 using Junctions 8 (8.0.4.487)
28

Main results: (08:00-08:15)
Main results: (08:15-08:30)
Main results: (08:30-08:45)
Main results: (08:45-09:00)
Main results: (09:00-09:15)
Queueing Delay Results for each time segment
Queueing Delay results: (07:45-08:00)
ArmTotal
Demand (PCU/hr)
Junction Arrivals (PCU)
Entry Flow (PCU/hr)
Exit Flow (PCU/hr)
Circulating Flow (PCU/hr)
Pedestrian Demand (Ped/hr)
Capacity (PCU/hr)
Saturation Capacity (PCU/hr)
RFCStart
Queue (PCU)
End Queue (PCU)
Delay (s)
LOS
1 563.66 140.92 563.07 1018.84 55.55 0.00 1515.13 1456.31 0.372 0.47 0.62 3.988 A
2 978.99 244.75 976.77 562.04 56.58 0.00 1586.34 1532.29 0.617 1.09 1.64 6.102 A
3 106.98 26.74 106.59 89.75 943.60 0.00 456.47 217.37 0.234 0.20 0.30 10.278 B
4 41.35 10.34 41.26 17.06 1033.13 0.00 526.93 233.54 0.078 0.06 0.08 7.410 A
ArmTotal
Demand (PCU/hr)
Junction Arrivals (PCU)
Entry Flow (PCU/hr)
Exit Flow (PCU/hr)
Circulating Flow (PCU/hr)
Pedestrian Demand (Ped/hr)
Capacity (PCU/hr)
Saturation Capacity (PCU/hr)
RFCStart
Queue (PCU)
End Queue (PCU)
Delay (s)
LOS
1 690.34 172.58 689.29 1244.36 67.81 0.00 1507.92 1456.31 0.458 0.62 0.88 4.636 A
2 1199.01 299.75 1193.02 687.84 69.26 0.00 1578.70 1532.29 0.759 1.64 3.14 9.531 A
3 131.02 32.76 130.05 109.74 1152.54 0.00 365.54 217.37 0.358 0.30 0.54 15.223 C
4 50.65 12.66 50.45 20.87 1261.72 0.00 421.76 233.54 0.120 0.08 0.13 9.690 A
ArmTotal
Demand (PCU/hr)
Junction Arrivals (PCU)
Entry Flow (PCU/hr)
Exit Flow (PCU/hr)
Circulating Flow (PCU/hr)
Pedestrian Demand (Ped/hr)
Capacity (PCU/hr)
Saturation Capacity (PCU/hr)
RFCStart
Queue (PCU)
End Queue (PCU)
Delay (s)
LOS
1 690.34 172.58 690.32 1250.48 68.24 0.00 1507.66 1456.31 0.458 0.88 0.89 4.648 A
2 1199.01 299.75 1198.75 689.20 69.36 0.00 1578.64 1532.29 0.760 3.14 3.20 9.807 A
3 131.02 32.76 130.98 110.09 1158.03 0.00 363.16 217.37 0.361 0.54 0.56 15.498 C
4 50.65 12.66 50.64 20.92 1268.09 0.00 418.84 233.54 0.121 0.13 0.14 9.777 A
ArmTotal
Demand (PCU/hr)
Junction Arrivals (PCU)
Entry Flow (PCU/hr)
Exit Flow (PCU/hr)
Circulating Flow (PCU/hr)
Pedestrian Demand (Ped/hr)
Capacity (PCU/hr)
Saturation Capacity (PCU/hr)
RFCStart
Queue (PCU)
End Queue (PCU)
Delay (s)
LOS
1 563.66 140.92 564.69 1027.66 56.19 0.00 1514.75 1456.31 0.372 0.89 0.63 4.004 A
2 978.99 244.75 985.00 564.14 56.74 0.00 1586.24 1532.29 0.617 3.20 1.70 6.271 A
3 106.98 26.74 107.95 90.26 951.48 0.00 453.04 217.37 0.236 0.56 0.31 10.462 B
4 41.35 10.34 41.55 17.13 1042.30 0.00 522.71 233.54 0.079 0.14 0.09 7.484 A
ArmTotal
Demand (PCU/hr)
Junction Arrivals (PCU)
Entry Flow (PCU/hr)
Exit Flow (PCU/hr)
Circulating Flow (PCU/hr)
Pedestrian Demand (Ped/hr)
Capacity (PCU/hr)
Saturation Capacity (PCU/hr)
RFCStart
Queue (PCU)
End Queue (PCU)
Delay (s)
LOS
1 472.04 118.01 472.65 857.79 46.88 0.00 1520.23 1456.31 0.311 0.63 0.48 3.628 A
2 819.86 204.96 822.21 472.03 47.49 0.00 1591.81 1532.29 0.515 1.70 1.11 4.864 A
3 89.59 22.40 90.01 75.44 794.25 0.00 521.46 217.37 0.172 0.31 0.21 8.351 A
4 34.63 8.66 34.73 14.33 869.93 0.00 602.01 233.54 0.058 0.09 0.06 6.348 A
ArmQueueing Total Delay (PCU-
min)Queueing Rate Of Delay (PCU-
min/min)Average Delay Per Arriving
Vehicle (s)Unsignalised Level Of
ServiceSignalised Level Of
Service
1 6.92 0.46 3.611 A A
2 15.74 1.05 4.781 A A
3 2.94 0.20 8.252 A A
4 0.88 0.06 6.300 A A
Generated on 21/09/2017 16:33:34 using Junctions 8 (8.0.4.487)
29

Queueing Delay results: (08:00-08:15)
Queueing Delay results: (08:15-08:30)
Queueing Delay results: (08:30-08:45)
Queueing Delay results: (08:45-09:00)
Queueing Delay results: (09:00-09:15)
ArmQueueing Total Delay (PCU-
min)Queueing Rate Of Delay (PCU-
min/min)Average Delay Per Arriving
Vehicle (s)Unsignalised Level Of
ServiceSignalised Level Of
Service
1 9.14 0.61 3.988 A A
2 23.73 1.58 6.102 A A
3 4.38 0.29 10.278 B B
4 1.24 0.08 7.410 A A
ArmQueueing Total Delay (PCU-
min)Queueing Rate Of Delay (PCU-
min/min)Average Delay Per Arriving
Vehicle (s)Unsignalised Level Of
ServiceSignalised Level Of
Service
1 12.93 0.86 4.636 A A
2 43.76 2.92 9.531 A A
3 7.74 0.52 15.223 C B
4 1.96 0.13 9.690 A A
ArmQueueing Total Delay (PCU-
min)Queueing Rate Of Delay (PCU-
min/min)Average Delay Per Arriving
Vehicle (s)Unsignalised Level Of
ServiceSignalised Level Of
Service
1 13.28 0.89 4.648 A A
2 47.69 3.18 9.807 A A
3 8.28 0.55 15.498 C B
4 2.04 0.14 9.777 A A
ArmQueueing Total Delay (PCU-
min)Queueing Rate Of Delay (PCU-
min/min)Average Delay Per Arriving
Vehicle (s)Unsignalised Level Of
ServiceSignalised Level Of
Service
1 9.65 0.64 4.004 A A
2 26.73 1.78 6.271 A A
3 4.91 0.33 10.462 B B
4 1.34 0.09 7.484 A A
ArmQueueing Total Delay (PCU-
min)Queueing Rate Of Delay (PCU-
min/min)Average Delay Per Arriving
Vehicle (s)Unsignalised Level Of
ServiceSignalised Level Of
Service
1 7.30 0.49 3.628 A A
2 17.22 1.15 4.864 A A
3 3.24 0.22 8.351 A A
4 0.94 0.06 6.348 A A
Generated on 21/09/2017 16:33:34 using Junctions 8 (8.0.4.487)
30

(Default Analysis Set) - 2024 Base + Dev, PM
Data Errors and Warnings No errors or warnings
Traffic Flows
Demand Set Data Options
Entry Flows
General Flows Data
Turning Proportions
Turning Counts / Proportions (PCU/hr) - Junction 1 (for whole period)
Turning Proportions (PCU) - Junction 1 (for whole period)
Default Vehicle
Mix
Vehicle Mix Varies Over Time
Vehicle Mix Varies Over Turn
Vehicle Mix Varies Over Entry
Vehicle Mix Source
PCU Factor
for a HV (PCU)
Default Turning
Proportions
Estimate from
entry/exit counts
Turning Proportions
Vary Over Time
Turning Proportions
Vary Over Turn
Turning Proportions
Vary Over Entry
ü üHV
Percentages2.00 ü ü
Arm Profile Type Use Turning Counts Average Demand Flow (PCU/hr) Flow Scaling Factor (%)
1 ONE HOUR ü 1020.00 100.000
2 ONE HOUR ü 836.00 100.000
3 ONE HOUR ü 70.00 100.000
4 ONE HOUR ü 25.00 100.000
To
From
1 2 3 4
1 0.000 912.000 78.000 30.000
2 793.000 0.000 32.000 11.000
3 47.000 23.000 0.000 0.000
4 18.000 7.000 0.000 0.000
To
From
1 2 3 4
1 0.00 0.89 0.08 0.03
2 0.95 0.00 0.04 0.01
3 0.67 0.33 0.00 0.00
4 0.72 0.28 0.00 0.00
Generated on 21/09/2017 16:33:34 using Junctions 8 (8.0.4.487)
31

Vehicle Mix
Average PCU Per Vehicle - Junction 1 (for whole period)
Heavy Vehicle Percentages - Junction 1 (for whole period)
Results
Results Summary for whole modelled period
Main Results for each time segment
Main results: (16:45-17:00)
Main results: (17:00-17:15)
To
From
1 2 3 4
1 1.000 1.035 1.000 1.000
2 1.037 1.000 1.000 1.000
3 1.000 1.000 1.000 1.000
4 1.000 1.000 1.000 1.000
To
From
1 2 3 4
1 0.0 3.5 0.0 0.0
2 3.7 0.0 0.0 0.0
3 0.0 0.0 0.0 0.0
4 0.0 0.0 0.0 0.0
ArmMax RFC
Max Delay
(s)
Max Queue (PCU)
Max LOS
Average Demand (PCU/hr)
Total Junction
Arrivals (PCU)
Total Queueing Delay (PCU-
min)
Average Queueing Delay (s)
Rate Of Queueing Delay (PCU-min/min)
Inclusive Total Queueing Delay
(PCU-min)
Inclusive Average
Queueing Delay (s)
1 0.73 9.14 2.80 A 935.97 1403.95 157.80 6.74 1.75 157.83 6.74
2 0.59 5.93 1.50 A 767.13 1150.69 93.64 4.88 1.04 93.65 4.88
3 0.16 9.22 0.20 A 64.23 96.35 12.64 7.87 0.14 12.64 7.87
4 0.05 6.70 0.05 A 22.94 34.41 3.41 5.95 0.04 3.41 5.95
ArmTotal
Demand (PCU/hr)
Junction Arrivals (PCU)
Entry Flow (PCU/hr)
Exit Flow (PCU/hr)
Circulating Flow (PCU/hr)
Pedestrian Demand (Ped/hr)
Capacity (PCU/hr)
Saturation Capacity (PCU/hr)
RFCStart
Queue (PCU)
End Queue (PCU)
Delay (s)
LOS
1 767.91 191.98 763.82 643.01 22.43 0.00 1534.62 1467.86 0.500 0.00 1.02 4.792 A
2 629.38 157.35 626.64 705.38 80.88 0.00 1571.71 1526.82 0.400 0.00 0.69 3.932 A
3 52.70 13.17 52.31 82.40 625.12 0.00 595.06 209.32 0.089 0.00 0.10 6.629 A
4 18.82 4.71 18.71 30.71 646.72 0.00 704.70 239.64 0.027 0.00 0.03 5.248 A
Generated on 21/09/2017 16:33:34 using Junctions 8 (8.0.4.487)
32

Main results: (17:00-17:15)
Main results: (17:15-17:30)
Main results: (17:30-17:45)
Main results: (17:45-18:00)
Main results: (18:00-18:15)
Queueing Delay Results for each time segment
Queueing Delay results: (16:45-17:00)
ArmTotal
Demand (PCU/hr)
Junction Arrivals (PCU)
Entry Flow (PCU/hr)
Exit Flow (PCU/hr)
Circulating Flow (PCU/hr)
Pedestrian Demand (Ped/hr)
Capacity (PCU/hr)
Saturation Capacity (PCU/hr)
RFCStart
Queue (PCU)
End Queue (PCU)
Delay (s)
LOS
1 916.96 229.24 914.99 770.21 26.92 0.00 1531.98 1467.86 0.599 1.02 1.51 5.997 A
2 751.55 187.89 750.49 845.03 96.88 0.00 1562.07 1526.82 0.481 0.69 0.95 4.586 A
3 62.93 15.73 62.79 98.70 748.67 0.00 541.30 209.32 0.116 0.10 0.13 7.521 A
4 22.47 5.62 22.44 36.79 774.68 0.00 645.83 239.64 0.035 0.03 0.04 5.774 A
ArmTotal
Demand (PCU/hr)
Junction Arrivals (PCU)
Entry Flow (PCU/hr)
Exit Flow (PCU/hr)
Circulating Flow (PCU/hr)
Pedestrian Demand (Ped/hr)
Capacity (PCU/hr)
Saturation Capacity (PCU/hr)
RFCStart
Queue (PCU)
End Queue (PCU)
Delay (s)
LOS
1 1123.04 280.76 1118.07 942.41 32.93 0.00 1528.44 1467.86 0.735 1.51 2.76 8.936 A
2 920.45 230.11 918.29 1032.61 118.38 0.00 1549.12 1526.82 0.594 0.95 1.49 5.886 A
3 77.07 19.27 76.81 120.65 916.02 0.00 468.47 209.32 0.165 0.13 0.19 9.186 A
4 27.53 6.88 27.47 44.97 947.87 0.00 566.15 239.64 0.049 0.04 0.05 6.682 A
ArmTotal
Demand (PCU/hr)
Junction Arrivals (PCU)
Entry Flow (PCU/hr)
Exit Flow (PCU/hr)
Circulating Flow (PCU/hr)
Pedestrian Demand (Ped/hr)
Capacity (PCU/hr)
Saturation Capacity (PCU/hr)
RFCStart
Queue (PCU)
End Queue (PCU)
Delay (s)
LOS
1 1123.04 280.76 1122.85 944.63 33.03 0.00 1528.38 1467.86 0.735 2.76 2.80 9.141 A
2 920.45 230.11 920.41 1036.99 118.89 0.00 1548.82 1526.82 0.594 1.49 1.50 5.929 A
3 77.07 19.27 77.07 121.10 918.20 0.00 467.52 209.32 0.165 0.19 0.20 9.219 A
4 27.53 6.88 27.52 45.14 950.13 0.00 565.11 239.64 0.049 0.05 0.05 6.695 A
ArmTotal
Demand (PCU/hr)
Junction Arrivals (PCU)
Entry Flow (PCU/hr)
Exit Flow (PCU/hr)
Circulating Flow (PCU/hr)
Pedestrian Demand (Ped/hr)
Capacity (PCU/hr)
Saturation Capacity (PCU/hr)
RFCStart
Queue (PCU)
End Queue (PCU)
Delay (s)
LOS
1 916.96 229.24 921.93 773.56 27.07 0.00 1531.89 1467.86 0.599 2.80 1.56 6.136 A
2 751.55 187.89 753.68 851.38 97.62 0.00 1561.63 1526.82 0.481 1.50 0.97 4.623 A
3 62.93 15.73 63.18 99.35 751.95 0.00 539.87 209.32 0.117 0.20 0.13 7.555 A
4 22.47 5.62 22.53 37.03 778.10 0.00 644.26 239.64 0.035 0.05 0.04 5.792 A
ArmTotal
Demand (PCU/hr)
Junction Arrivals (PCU)
Entry Flow (PCU/hr)
Exit Flow (PCU/hr)
Circulating Flow (PCU/hr)
Pedestrian Demand (Ped/hr)
Capacity (PCU/hr)
Saturation Capacity (PCU/hr)
RFCStart
Queue (PCU)
End Queue (PCU)
Delay (s)
LOS
1 767.91 191.98 769.98 647.10 22.64 0.00 1534.50 1467.86 0.500 1.56 1.04 4.868 A
2 629.38 157.35 630.48 711.10 81.53 0.00 1571.31 1526.82 0.401 0.97 0.70 3.966 A
3 52.70 13.17 52.84 83.01 628.99 0.00 593.38 209.32 0.089 0.13 0.10 6.660 A
4 18.82 4.71 18.86 30.94 650.89 0.00 702.78 239.64 0.027 0.04 0.03 5.265 A
ArmQueueing Total Delay (PCU-
min)Queueing Rate Of Delay (PCU-
min/min)Average Delay Per Arriving
Vehicle (s)Unsignalised Level Of
ServiceSignalised Level Of
Service
1 14.78 0.99 4.792 A A
2 10.01 0.67 3.932 A A
3 1.40 0.09 6.629 A A
4 0.40 0.03 5.248 A A
Generated on 21/09/2017 16:33:34 using Junctions 8 (8.0.4.487)
33

Queueing Delay results: (17:00-17:15)
Queueing Delay results: (17:15-17:30)
Queueing Delay results: (17:30-17:45)
Queueing Delay results: (17:45-18:00)
Queueing Delay results: (18:00-18:15)
ArmQueueing Total Delay (PCU-
min)Queueing Rate Of Delay (PCU-
min/min)Average Delay Per Arriving
Vehicle (s)Unsignalised Level Of
ServiceSignalised Level Of
Service
1 21.90 1.46 5.997 A A
2 13.92 0.93 4.586 A A
3 1.91 0.13 7.521 A A
4 0.53 0.04 5.774 A A
ArmQueueing Total Delay (PCU-
min)Queueing Rate Of Delay (PCU-
min/min)Average Delay Per Arriving
Vehicle (s)Unsignalised Level Of
ServiceSignalised Level Of
Service
1 38.71 2.58 8.936 A A
2 21.57 1.44 5.886 A A
3 2.83 0.19 9.186 A A
4 0.74 0.05 6.682 A A
ArmQueueing Total Delay (PCU-
min)Queueing Rate Of Delay (PCU-
min/min)Average Delay Per Arriving
Vehicle (s)Unsignalised Level Of
ServiceSignalised Level Of
Service
1 41.78 2.79 9.141 A A
2 22.49 1.50 5.929 A A
3 2.93 0.20 9.219 A A
4 0.76 0.05 6.695 A A
ArmQueueing Total Delay (PCU-
min)Queueing Rate Of Delay (PCU-
min/min)Average Delay Per Arriving
Vehicle (s)Unsignalised Level Of
ServiceSignalised Level Of
Service
1 24.50 1.63 6.136 A A
2 14.97 1.00 4.623 A A
3 2.05 0.14 7.555 A A
4 0.56 0.04 5.792 A A
ArmQueueing Total Delay (PCU-
min)Queueing Rate Of Delay (PCU-
min/min)Average Delay Per Arriving
Vehicle (s)Unsignalised Level Of
ServiceSignalised Level Of
Service
1 16.13 1.08 4.868 A A
2 10.68 0.71 3.966 A A
3 1.51 0.10 6.660 A A
4 0.42 0.03 5.265 A A
Generated on 21/09/2017 16:33:34 using Junctions 8 (8.0.4.487)
34