appendix: list of indicators - springer978-3-642-78552-8/1.pdf · appendix: list of indicators ......
TRANSCRIPT
Appendix: List of indicators
This List of indicators is a common working tool for all EFfA countries participating in the joint EC-EFfA research project,
Impact of "1992" on the Services Sectors of EC and EFfA Countries.
It constitutes a formalization of the list prepared by a joint EC and EFfA working party in February 1992 (Appendix to Annex Ito EFfAIEc/w 2/92).
A data base covering the years 1980 to 1992 has been prepared by all participating EFfA countries. In the case of Switzerland, coverage unfortunately is only partial in several of the eight service industries analyzed.
For access to the Swiss data base, please contact
Dr. Christian Etter Head of International Services Section Federal Office for Foreign Economic Affairs CH-3003 Berne.
For access to the data bases of other EFfA countries, please contact
Mr. Ivar Pettersen Senior Economic Officer EFfA Secretariat 9-11, rue de Varembe CH-1211 Geneva 20.

260 Appendix: List of indicators
Alphabetic key to variable labels
Number Variable Explanation, formula
in the list label of indica-
tors
A
a ... Growth factor, 1992 compared to 1980; e.g. aFA = E4 (1992) 1 E4 (1980)
ADC Capital assets of Swiss companies in the EC 25
ADR Capital assets of Swiss companies in foreign countries, without the EC 25
aE4 E4 (1992)1 E4 (1980) 14
aE5 E5 (1992)1 E5 (1980) 13
aE8 E8 (1992)1 E8 (1980) 14
aEC EC (1992)1 EC (1980) 12
aED ED (1992)/ED(1980) 12
aEFC% EFC% (1992)1 EFC% (1980) 15
aEFR% EFR% (1992)1 EFR% (1980) 15
aER N (1992)1 N (1980) 12
aES% N (1992)1 N (1980) 23
aET N (1992)1 N (1980) 12
AF%C Assets of EC-based firms 1 Assets of domestic firms 29
AF%R Assets of non-EC-based firms 1 Assets of domestic firms 29
aHD HD (1992)/ HD (1980) 18
aHE4 HE4 (1992)1 HE4 (1980) 14
aHE8 HE8 (1992)1 HE8 (1980) 14
aHS4 HS4 (1992)/HS4 (1980) 14
aHS8 HS8 (1992)1 HS8 (1980) 14
AJ Institutional factor endowment (legal and institutional framework) 35
aN N (1992)1 N (1980) 12
aRI RI (1992)1 RI (1980) 22
AS Institutional factor endowment (infrastructure) 35
aS4 S4 (1992)1 S4 (1980) 14
aS5 S5 (1992)1 S5 (1980) 13
aS8 S8 (1992)1 S8 (1980) 14
aSC SC (1992)1 SC (1980) 12
aSD SD (1992)1 SD (1980) 12
aSF% SF% (1992)1 SF% (1980) 15
aSFC% SFC% (1992)1 SFC% (1980) 15
aSFR% SFR% (1992)1 SFR% (1980) 15
aSR SR (1992)1 SR (1980) 12

Appendix: List of indicators 261
Alphabetic key to variable labels (continued)
Number Variable Explanation, formula
in the list label of indica-
tors
aSS% SS% (1992)1 SS% (1980) 23 aST ST (1992)1 ST (1980) 12
AVIIC Added Value over input costs 40/41 aX%C X%C (1992)1 X%C (1980) 24 aX%R X%R (1992)1 X%R (1980) 24
C
CD% Imports from the EC over total imports 27 cm Changes in the types of discriminating government intervention 20 CIN Changes in the types of non-discriminating government intervention 20 CR Capital ratio 47 CT Changes in technology 19
D d .... Growth factor, 1990 compared to 1980, e.g. dE4=E4 (1990) 1 E4 (1980) dE4 E4 (1990) 1 E4 (1980) 14 dE5 E5 (1990) 1 E5 (1980) 13 dE8 E8 (1990) 1 E8 (1980) 14 dEC EC (1990) 1 EC (1980) 12 dED ED (1990) 1 ED (1980) 12
dEF% EF% (1990) 1 EF% (1980) 15 dEFC% EFC% (1990) I EFC% (1980) 15 dEFR% EFR% (1990) 1 EFR% (1980) 15
dER ER (1990) 1 ER (1980) 12 dES% ES% (1990) 1 ES% (1980) 23 dET ET (1990) 1 ET (1980) 12 dHD HD (1990) 1 HD (1980) 18 dHE4 HE4 (1990) 1 HE4 (1980) 14 dHE8 HE8 (1990) 1 HE8 (1980) 14 dHS4 HS4 (1990) 1 HS4 (1980) 14 dHS8 HS8 (1990) 1 HS8 (1980) 14
DN Number of Merger & Aquisitions (M&A), only Swiss firms involved 16 dN N (1990) 1 N (1980) 12 dRI RI(1990)1 RI(1980) 22 dS4 S4 (1990) 1 S4 (1980) 14 d S5 S5 (1990) 1 S5 (1980) 13
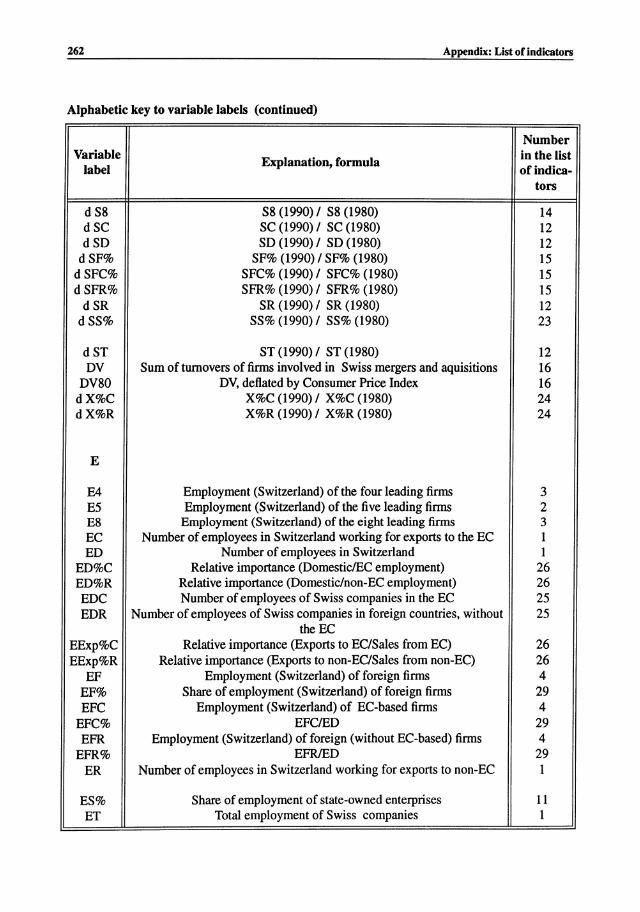
262 Appendix: List of indicators
Alphabetic key to variable labels (continued)
Number
Variable Explanation, formula in the list
label of indica-tors
dS8 S8 (1990) / S8 (1980) 14
dSC SC (1990) / SC (1980) 12
dSD SD (1990) / SD (1980) 12
dSF% SF% (1990) / SF% (1980) 15
dSFC% SFC% (1990) / SFC% (1980) 15
dSFR% SFR% (1990) / SFR% (1980) 15
dSR SR (1990) / SR (1980) 12
dSS% SS% (1990) / SS% (1980) 23
dST ST (1990) / ST (1980) 12
DV Sum of tum overs of firms involved in Swiss mergers and aquisitions 16
DV80 DV, deflated by Consumer Price Index 16
dX%C X%C (1990) / X%C (1980) 24
dX%R X%R (1990) / X%R (1980) 24
E
E4 Employment (Switzerland) of the four leading firms 3
E5 Employment (Switzerland) of the five leading firms 2
E8 Employment (Switzerland) of the eight leading firms 3
EC Number of employees in Switzerland working for exports to the EC 1
ED Number of employees in Switzerland 1
ED%C Relative importance (DomesticlEC employment) 26
ED%R Relative importance (Domestic/non-EC employment) 26
EDC Number of employees of Swiss companies in the EC 25
EDR Number of employees of Swiss companies in foreign countries, without 25 theEC
EExp%C Relative importance (Exports to EC/Sales from EC) 26
EExp%R Relative importance (Exports to non-EC/Sales from non-EC) 26
EF Employment (Switzerland) of foreign firms 4
EF% Share of employment (Switzerland) of foreign firms 29
EFC Employment (Switzerland) of EC-based firms 4
EFC% EFCIED 29
EFR Employment (Switzerland) of foreign (without EC-based) firms 4
EFR% EFRIED 29
ER Number of employees in Switzerland working for exports to non-EC I
ES% Share of employment of state-owned enterprises 11
ET Total employment of Swiss companies 1

Appendix: List of indicators 263
Alphabetic key to variable labels (continued)
Number Variable Explanation, formula in the list
label of indica-tors
G
GDP Domestic sales less imports 28
H
HD Theil's entropy index (business activities) 5 HE4 Theil's entropy index (employment) for the four leading firms 3 HE8 Theil's entropy index (employment) for the eight leading firms 3 HO Factor intensity and abundance indicator 33 HP Theil's entropy index (product differentiation) 7
HS4 Theil's entropy index (turnover) for the four leading firms 3 HS8 Theil's entropy index (turnover) for the eight leading firms 3
I
ID Index for discriminating government interventions 9 1M Interest margin 43 IN Index for non-discriminating government interventions 9
M
M% Imports! SD 28 M%C Imports from the EC ! SD 28 M%R Imports from foreign countries without the EC ! SD 28
N
N Number of companies 1 NUSP Number of products with unique selling property 34
p
PDC International price differentials (DomesticlEC 31 PI Product innovation 20 PR Proximity requirement 8

264 Appendix: List ar indicators
Alphabetic key to variable labels (continued)
Number
Variable Explanation, formula in the list
label of indica-tors
R
R Returns to scale 6
RD% Imports from foreign countries (without the EC) over total imports 27
RI Degree of government intervention, relevance weighted 10 ROA Return on assets 36
ROE Return on equity 38
S
S4 Sales (Switzerland) of the four leading firms 3
S5 Sales (Switzerland) of the five leading firms 2
S8 Sales (Switzerland) of the eight leading firms 3
SC Sales from exports to the EC I
SCP Economies of scope 6
SD Sales generated in Switzerland I
SD%C Relative importance (SD/SDC) 26
SD%R Relative importance (SD/SDR) 26
SDC Sales of Swiss companies generated in the EC 25
SDR Sales of Swiss companies generated in foreign countries, excluding the 25 EC
SExp%C Relative importance (ExportS/Sales originating in the EC) 26
SExp%R Relative importance (Exports/Sales originating in the EC) 26
SF Market share of foreign firms SF/SD 4
SFC SFC/SD 4
SFR SFRISD 4
SFO% Relative importance (Imports / Sales of foreign firms) 30
SFO%C Relative importance (Imp C / Sales of foreign firms) 30
SFO%R Relative importance (Imp R / Sales of foreign firms) 30
SR Exports from Switzerland to non-EC countries I
SS% Market share (gross premiums) of state-owned enterprises 11
ST Total sales I
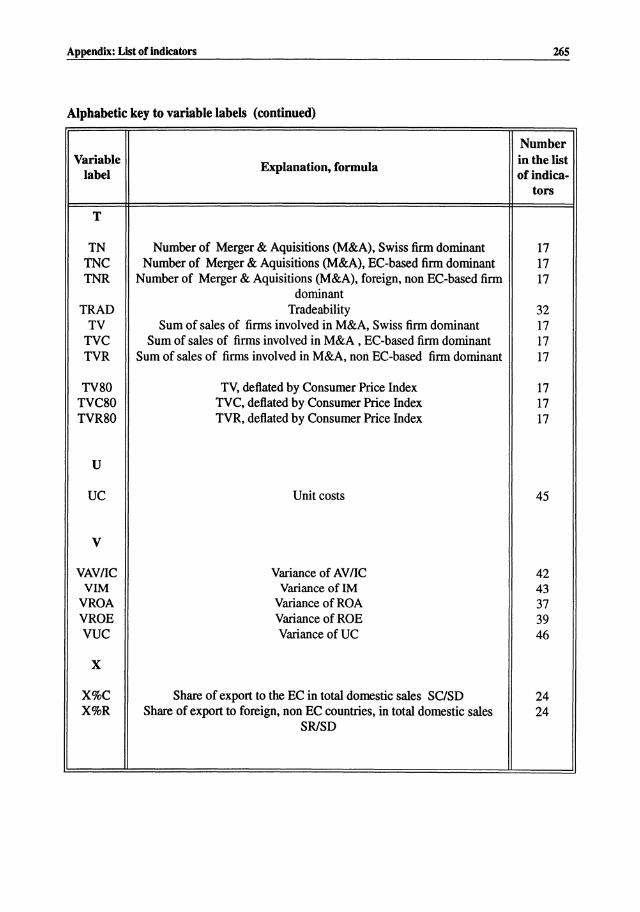
Appendix: List of indicators 265
Alphabetic key to variable labels (continued)
Number Variable Explanation, formula
in the list label of indica-
tors
T
TN Number of Merger & Aquisitions (M&A), Swiss firm dominant 17 TNC Number of Merger & Aquisitions (M&A), EC-based firm dominant 17 TNR Number of Merger & Aquisitions (M&A), foreign, non EC-based firm 17
dominant TRAD Tradeability 32
TV Sum of sales of firms involved in M&A, Swiss firm dominant 17 TVC Sum of sales of firms involved in M&A , EC-based firm dominant 17 TVR Sum of sales of firms involved in M&A, non EC-based firm dominant 17
TV80 TV, deflated by Consumer Price Index 17 TVC80 TVC, deflated by Consumer Price Index 17 TVR80 TVR, deflated by Consumer Price Index 17
U
UC Unit costs 45
V
VAV/IC Variance of AV/IC 42 VIM Variance of 1M 43
VROA Variance of ROA 37 VROE Variance of ROE 39 VUC Variance of UC 46
X
X%C Share of export to the EC in total domestic sales SC/SD 24 X%R Share of export to foreign, non EC countries, in total domestic sales 24
SRiSD
Ap
pen
dix
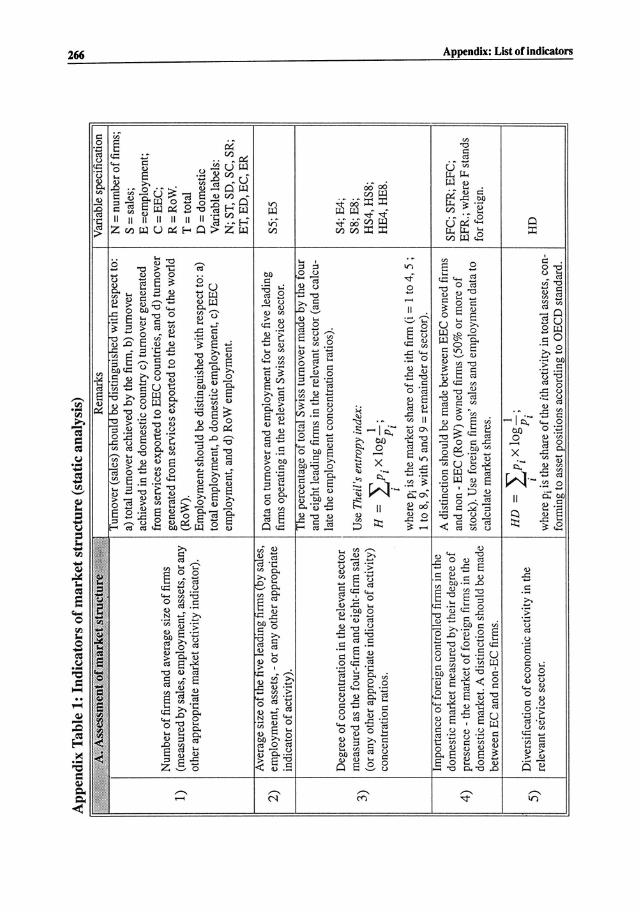
Tab
le 1
: In
dica
tors
of m
ark
et s
tru
ctu
re (
stat
ic a
naly
sis)
j;Xf
Ii;t
4%;;A.
:;A:ssessilieDt!otma',rketstructtire4~
!l~
Rem
arks
-'.
'-"
.'~
. ~
v ..
~
'.~"
;;
~ ~.
,..f
"y
,'",
.{ ~.
. -
1 .
..
. ,
Tur
nove
r (s
ales
) sh
ould
be
dlst
lOgu
lshe
d w
ith
resp
ect t
o:
a) t
otal
tur
nove
r ac
hiev
ed b
y th
e fi
rm,
b) t
urno
ver
achi
eved
in
the
dom
esti
c co
untr
y c)
tur
nove
r ge
nera
ted
Num
ber
of
firm
s an
d av
erag
e si
ze o
f fi
rms
from
ser
vice
s ex
port
ed to
EE
C c
ount
ries
, and
d)
turn
over
ge
nera
ted
from
ser
vice
s ex
port
ed to
the
res
t o
f th
e w
orld
1)
(m
easu
red
by s
ales
, em
ploy
men
t, a
sset
s, o
r any
(R
oW).
ot
her
appr
opri
ate
mar
ket
acti
vity
ind
icat
or).
Employmen~ s
houl
d be
dis
ting
uish
ed w
ith
resp
ect t
o: a
) to
tal e
mpl
oym
ent,
b d
omes
tic
empl
oym
ent,
c)
EE
C
empl
oym
ent,
and
d)
RoW
em
ploy
men
t.
Ave
rage
siz
e ot
the
hve
lead
mg
hn
ns
(by
sale
s,
Dat
a on
tur
nove
r an
d em
ploy
men
t fo
r th
e fi
ve l
eadi
ng
2)
empl
oym
ent,
ass
ets,
-or
any
oth
er a
ppro
pria
te
firm
s op
erat
ing
in t
he r
elev
ant
Sw
iss
serv
ice
sect
or.
indi
cato
r o
f act
ivit
y).
The
per
cent
age
ot t
otal
SW
ISS
turn
over
mad
e by
the
tou
r an
d ei
ght
lead
ing
finn
s in
the
rel
evan
t se
ctor
(an
d ca
lcu-
late
the
empl
oym
ent c
once
ntra
tion
rat
ios)
. D
egre
e o
f co
ncen
trat
ion
in t
he r
elev
ant
sect
or
3)
mea
sure
d as
the
fou
r-fi
rm a
nd e
ight
-fin
n sa
les
Use
The
il's
ent
ropy
inde
x:
(or
any
othe
r ap
prop
riat
e in
dica
tor
of a
ctiv
ity)
H =
2>
·Xlog~;
conc
entr
atio
n ra
tios
. .
I P
j I
whe
re P
i is
the
mar
ket
shar
e o
f the
ith
firm
(i =
1 to
4,
5 ;
1 to
S, 9
, w
ith
5 an
d 9
= re
mai
nder
of s
ecto
r).
Impo
rtan
ce o
t to
relg
n co
ntro
lled
hrm
s In
the
A d
isti
ncti
on s
houl
d be
mad
e be
twee
n E
EC
ow
ned
firm
s do
mes
tic
mar
ket
mea
sure
d by
the
ir d
egre
e o
f an
d no
n -E
EC
(R
oW)
owne
d fi
rms
(50%
or
mor
e o
f 4)
pr
esen
ce -
the
mar
ket
of
fore
ign
firm
s in
the
st
ock)
. U
se f
orei
gn f
irm
s' s
ales
and
em
plo
ymen
t dat
a to
do
mes
tic
mar
ket.
A d
isti
ncti
on s
houl
d be
mad
e be
twee
n E
C a
nd n
on-E
C f
irm
s.
calc
ulat
e m
arke
t sh
ares
.
Div
ersi
fica
tion
of e
cono
mic
act
ivit
y in
the
H
D =
2>·
Xlog~;
5)
. I
Pi
rele
vant
ser
vice
sec
tor.
I
whe
re P
i is
the
shar
e o
f th
e ith
act
ivit
y in
tot
al a
sset
s, c
on-
form
ing
to a
sset
pos
ition
s ac
cord
ing
to O
EC
D s
tand
ard
.
Var
iabl
e sp
ecif
icat
ion
N =
num
ber
of
firm
s;
S =
sal
es;
E =
empl
oym
ent;
C
=E
EC
; R
=R
oW
. T
= t
otal
D
= d
omes
tic
Var
iabl
e la
bels
: N
; S
T, S
D, S
C, S
R;
ET
, E
D, E
C,
ER
S5;
E5
S4
;E4
; SS
; E
S;
HS
4, H
SS;
HE
4,H
ES
.
SF
C;
SF
R;
EF
C;
EF
R.;
whe
re F
sta
nds
for
fore
ign
.
HD
~ >
"CI 1 E' ~ - ~ i- S'
;;!

App
endi
x T
able
1:
Indi
cato
rs o
f mar
ket
str
uctu
re (
stat
ic a
naly
sis,
con
tinu
ed)
6)
7)
8)
9)
Deg
ree
of s
cale
eco
nom
ies
(qua
lita
tive
judg
emen
t on
a l
ow
med
ium
-hig
h sc
ale)
.
Deg
ree
of
scop
e ec
onom
ies
(qua
lita
tive
judg
emen
t on
a lo
w
med
ium
-hig
h sc
ale)
.
Deg
ree
of p
rodu
ct d
iffe
rent
iati
on
(qua
lita
tive
judg
emen
t on
a lo
w
med
ium
-hig
h sc
ale)
.
Typ
es o
f go
vern
men
t in
terv
enti
on p
reva
ilin
g in
the
m
arke
t: d
iscr
imin
atin
g o
r no
n -
disc
rim
inat
ing
.a)
retu
rns
to s
cale
par
amet
er,
r ,
to th
e pr
oduc
tion
fun
ctio
n at
the
out
put l
evel
0:
YoA
r =
(A
Lo'
AK
o) ;
whe
re r
= 1
impl
ies
cons
tant
ret
urns
to
scal
e, r
> 1
impl
ies
retu
rns
to s
cale
. sc
ope
pro-
duci
ng Y
I an
d Y
2 to
geth
er to
pro
duci
ng t
hem
sep
a-ra
tely
: C
(Y
, +
Y 2
) sc
=
; C
(Y,)
+C
(Y2
)
whe
re C
is
tota
l co
sts.
Use
com
bini
ng b
anki
ng a
nd i
nsur
ance
se
rvic
es a
s th
e re
fere
nce
case
. I
HP
= L
P;x
log-
-:;
; P
,
whe
re P
i is
the
cont
ribu
tion
of t
he i
th a
ctiv
ity
to to
tal
asse
ts.
(Coi
ncid
es w
ith i
tem
5 a
bove
)
I =
low, 2
= me
dium
, 3 =
high.
= g
over
nmen
t ex
ist,
0 =
doe
s no
t exi
st)
for
gove
rnm
ent
inte
rven
tion
and
de
term
ine
whe
ther
it is
GN
(no
n-di
scri
min
atin
g) o
r G
D (
dis
<:r
imin
atin
g):
1) M
arke
t ac
cess
, 2)
Acc
ess
to f
acto
r m
arke
t, 3
) P
rodu
ct in
tro
du
ctio
n an
d in
nova
tion
, 4)
Pri
ce s
etti
ng,
5)'T
axes
, an
d 6)
Use
o
f pr
ofits
. 6
6
IN=
I
GN
,,;
ID =
I
GD
k k
.1
k.
l
Var
iabl
e sp
ecif
icat
ion
R
SC
P
HP
PR
IN,I
D.
a) D
iscr
imin
atin
g im
plie
s th
atlh
e ru
les
of th
e go
vern
men
t app
ly o
nly
to a
segm
ent o
f the
sel
lers
. fo
r exa
m!>
le, f
orei
gn s
elle
rs, w
hile
non
-dis
crim
inat
ing
rule
s ap
ply
stri
ctly
to a
ll se
llers
in
the
mar
ket.
>
~ is. Ff ~ g, [ ~ ;;!
~ ~

App
endi
x T
able
l:I
nd
icat
ors
of m
ark
et s
truc
ture
(st
atic
ana
lysi
s, c
onti
nued
)
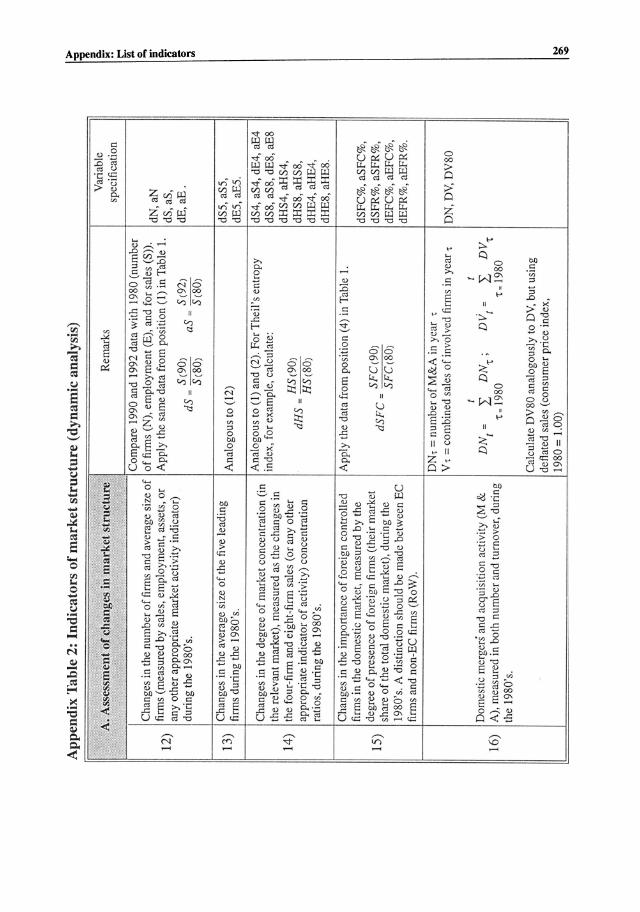
10)
11)
Deg
ree
of
gove
rnm
ent
inte
rven
tion
mea
sure
d b
y th
e de
gree
of r
egul
ator
y in
tens
ity
prev
aili
ng in
the
dom
esti
c m
arke
t (q
uali
tati
ve ju
dgem
ent
on a
low
-med
ium
-hig
h sc
ale)
.
Mar
ket
shar
e o
f sta
te-o
wne
d en
terp
rise
s.
Rem
arks
Cre
ate
from
the
pro
pert
ies
1 to
6 f
rom
po
siti
on (
9) a
n in
dex
wit
h w
eigh
ts (
ak, ~)
as f
ollo
ws:
ak =
1 (lo
w),
ak=
2 (
med
ium
), a
k =
3 (h
igh)
; w
here
ak
refe
rs t
o no
n-di
scri
min
ato
ry g
over
nmen
t po
lici
es.
b k =
1 (l
ow),
bk
= 2
(m
ediu
m),
bk
= 3
(hig
h);
whe
re ~ r
efer
s to
dis
crim
inat
ory
gove
rnm
ent p
olic
ies.
Cal
cula
te i
ndex
RI:
6
Rl
= L
(akG
Nk+
bkG
Dk)
k
= 1
Var
iabl
e S
peci
fica
tion
RI
Cal
cula
te th
e pe
rcen
tage
sha
re o
f to
tal
I SS
%, E
S%
whe
re S
= go
v-tu
rnov
er f
or t
he g
over
nmen
t-ow
ned
ente
r-er
nmen
t.
pris
es (
mor
e th
an 5
0% o
f sto
ck)
~ >
"CI 1 a. Fr ~ o ... ;- a. f
App
endi
x T
able
2:
Indi
cato
rs o
f m
ark
et s
tru
ctu
re (
dyna
mic
ana
lysi
s)
","
,,'
A. A
sses
Smen
t of c
hang
es in
mar
ket s
truc
ture
" ~.:
.:;;.
-..j-
11 R
emar
ks
Com
pare
199
0 an
d 19
92 d
ata
wit
h 19
80 (
num
ber
Cha
nges
in t
he n
umbe
r of
firm
s an
d av
erag
e si
ze o
f o
f fi
rms
(N),
em
ploy
men
t (E
), a
nd f
or s
ales
(S
».
12)
firm
s (m
easu
red
by s
ales
, em
ploy
men
t, a
sset
s, o
r A
pply
the
sam
e da
ta f
rom
pos
itio
n (I
) in
Tab
le 1
. an
y ot
her
appr
opri
ate
mar
ket
acti
vity
ind
icat
or)
dS =
5(9
0)
as=
S(9
2)
duri
ng t
he 1
980'
s.
5(80
) S
(80
)
13)
Cha
nges
in
the
aver
age
size
of t
he f
ive
lead
ing
Ana
logo
us to
(12
) fi
rms
duri
ng t
he 1
980'
s,
Cha
nges
in t
he d
egre
e o
f m
arke
t con
cent
rati
on (
in
Ana
logo
us to
(1)
and
(2)
. F
or T
heil
's e
ntro
py
inde
x, f
or e
xam
ple,
cal
cula
te:
the
rele
vant
mar
ket)
, m
easu
red
as t
he c
hang
es in
14
) th
e fo
ur-f
irm
and
eig
ht.f
irm
sal
es (
or a
ny o
ther
dR
S =
HS
(90
) ap
prop
riat
e in
dica
tor
of
acti
vity
) co
ncen
trat
ion
RS
(80
) ra
tios
, du
ring
the
198
0's.
Cha
nges
in
the
impo
rtan
ce o
f fo
reig
n co
ntro
lled
A
pply
the
dat
a fr
om p
osit
ion
(4)
in T
able
1.
firm
s in
the
dom
esti
c m
arke
t, m
easu
red
by t
he
15)
degr
ee o
f pr
esen
ce o
f fo
reig
n fi
rms
(the
ir m
arke
t d
SF
C =
SF
C(9
0)
shar
e o
f th
e to
tal
dom
esti
c m
arke
t), d
urin
g th
e S
FC
(80
) 19
80's
. A
dis
tinc
tion
sho
uld
be m
ade
betw
een
EC
fi
rms
and
non-
EC
fir
ms
(RoW
).
DN
t =
num
ber
of M
&A
in y
ear
t Y
t =
com
bine
d sa
les
of
invo
l ved
fir
ms
in y
ear
t
t t
Dom
esti
c m
erge
rs a
nd a
cqui
siti
on a
ctiv
ity
(M &
D
Nt
=
I D
N,;
D
V
=
I D
V,
t 16
) A
), m
easu
red
in b
oth
num
ber
and
turn
over
, dur
ing
,.
1980
,
.]9
80
the
1980
's.
Cal
cula
te D
V80
ana
logo
usly
to
DV
, but
usi
ng
defl
ated
sal
es (
cons
umer
pri
ce i
ndex
, 19
80 =
1.0
0)
Var
iabl
e sp
ecif
icat
ion
dN
,aN
dS
, as
, d
E,a
E.
dSS,
aSS
, dE
S, a
ES
.
dS
4,a
S4
,dE
4,a
E4
dS
8, a
S8,
dE
8, a
E8
dHS
4, a
HS
4,
dHS
8, a
HS
8,
dHE
4, a
HE
4,
dHE
8, a
HE
8.
dSF
C%
, aS
FC
%,
dSF
R %
, aS
FR
%,
dEF
C%
, aE
FC
%,
dEF
R%
, aE
FR
%.
DN
, DY
, D
Y80
>
"CI ~ =
Co R· ~ So s· C
o S· S"
;;! ~ ""
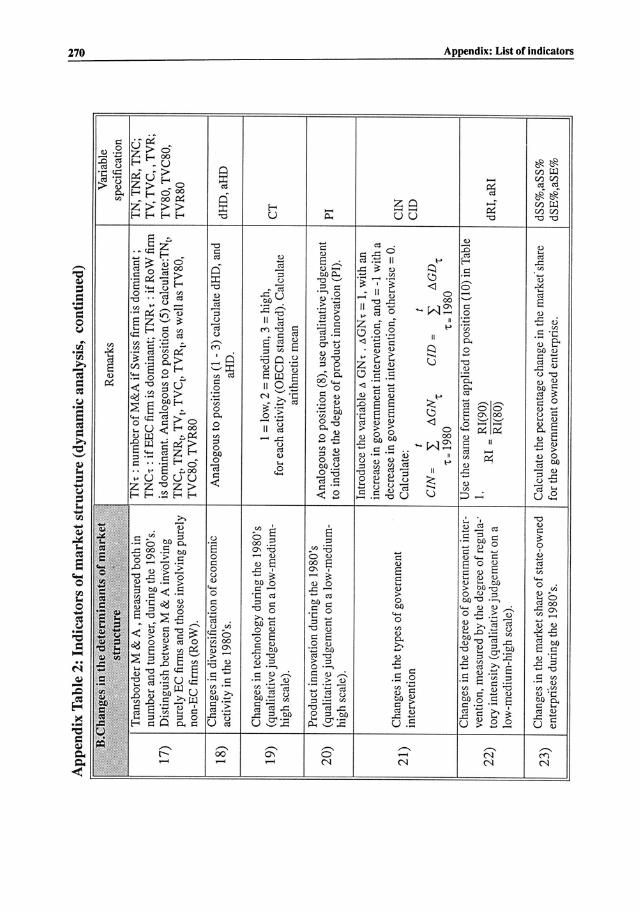
App
endi
x T
able
2:
Indi
cato
rs o
f mar
ket
str
uctu
re (
dyna
mic
ana
lysi
s, c
onti
nued
)
~B,C
J1anges,
ip t
he
:det
enn
inim
ts o
f m
ark
et
Rem
arks
t1
~-.~
[t
; "
.,,-
'" >"-
;, "
j3J
y,
'slr
uctu
re <
:<t
'"
'0
.)!
'.~,'
.",
"~-
Tra
nsbo
rder
M &
A ,
mea
sure
d bo
th in
T
N t
: num
ber
of
M&
A i
f Sw
iss
firm
is
dom
inan
t;
num
ber
and
turn
over
, du
ring
the
198
0's.
T
NC
t : i
fEE
C fi
rm i
s do
min
ant;
TN
Rt
: if R
oW f
irm
17)
Dis
ting
uish
bet
wee
n M
& A
invo
lvin
g is
dom
inan
t. A
nalo
gous
to
posi
tion
(5)
cal
cula
te:T
Nt,
pure
ly E
C f
irm
s an
d th
ose
inv
olvi
ng p
urel
y T
NC
!, T
NR
t, T
Vt,
TV
C!,
TV
Rt,
as
wel
l as
TV
80,
non-
EC
fir
ms
(RoW
).
TV
C80
, TV
R80
18)
Cha
nges
in d
iver
sifi
cati
on o
f eco
nom
ic
Ana
logo
us to
pos
itio
ns (1
-3)
cal
cula
te d
HD
, and
ac
tivi
ty i
n th
e 19
80's
. aH
D.
Cha
nges
in
tech
nolo
gy d
urin
g th
e 19
80's
1 =
low, 2
= me
dium
, 3 =
high,
19
) (q
uali
tati
ve ju
dgem
ent
on a
low
-med
ium
-hi
gh s
cale
).
for
each
act
ivit
y (O
EC
D s
tand
ard)
. Cal
cula
te
arit
hmet
ic m
ean
Pro
duct
inn
ovat
ion
duri
ng t
he 1
980'
s A
nalo
gou
s to
pos
itio
n (8
), u
se q
uali
tati
ve ju
dgem
ent
20)
(qua
lita
tive
judg
emen
t on
a lo
w-m
ediu
m-
high
sca
le).
to
ind
icat
e th
e de
gree
of
prod
uct
inno
vati
on (
PI).
Intr
oduc
e th
e va
riab
le 6
GN
t . 6
GN
t =
I, w
ith
an
incr
ease
in g
over
nmen
t in
terv
enti
on,
and
= -1
with
a
Cha
nges
in t
he t
ypes
of
gove
rnm
ent
decr
ease
in g
over
nmen
t in
terv
enti
on, o
ther
wis
e =
O.
21)
inte
rven
tion
C
alcu
late
: t t
CIN
=
I 6.
GN
't
CID
=
I 6.
GD
't 't
.19
80
't .
1980
Cha
nges
in t
he d
egre
e o
f gov
ernm
ent i
nter
-U
se t
he s
ame
form
at a
ppli
ed t
o po
siti
on (
10)
in T
able
ve
ntio
n, m
easu
red
by t
he d
egre
e o
f reg
ula-
' 1.
R
I =
RI(
90)
22)
tory
int
ensi
ty (
qual
itat
ive
judg
emen
t on
a
RI(
80)
low
-med
ium
-hig
h sc
ale)
.
23)
Cha
nges
in t
he m
arke
t sha
re o
f sta
te-o
wne
d C
alcu
late
the
perc
enta
ge c
hang
e in
the
mar
ket's
hare
en
terp
rise
s du
ring
the
198
0's.
for
the
gove
rnm
ent o
wne
d en
terp
rise
.
Var
iabl
e sp
ecif
icat
ion
TN
, TN
R, T
NC
; T
V, T
VC
, , T
VR
; T
V80
, TV
C80
, T
VR
80
dH
D,a
HD
CT
PI
CIN
C
ID
dRI,
aR
I
dSS
%,a
SS
%
dSE
%,a
SE
%
~ >
"CI 1 Q, ~r
t'"
/ii' .. o ... S'
Q, ri" 0'
;;!
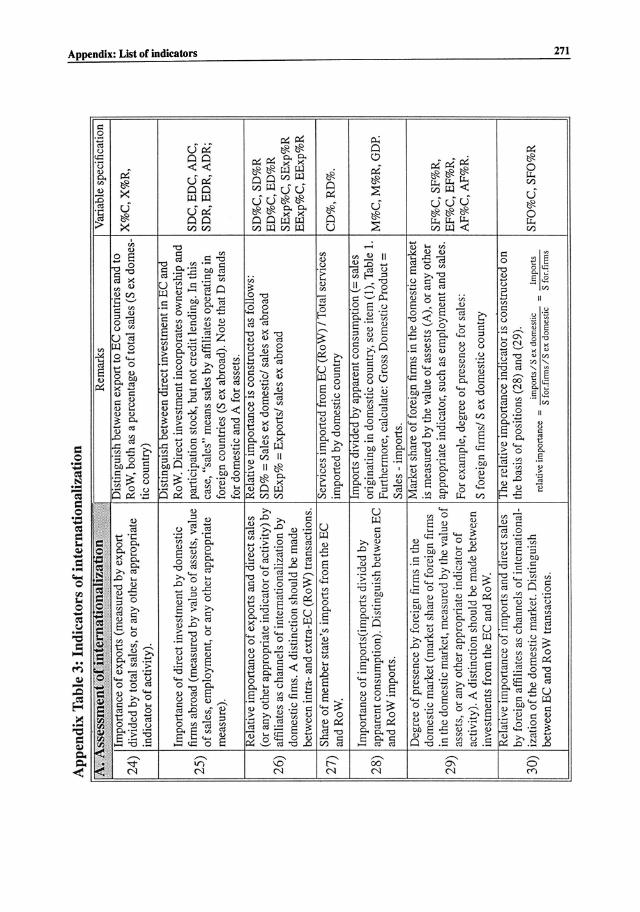
Ap
pen
dix
Tab
le 3
: In
dica
tors
of i
nter
nati
onal
izat
ion
i\! A$s.~sSmen\PV~nternatlOpalizatiOn',
!,/"
';
Rem
arks
Impo
rtan
ce o
f ex
port
s (m
easu
red
by
exp
ort
Dis
ting
Uis
h be
twee
n ex
port
to
EC
cou
ntne
s an
d to
24)
divi
ded
by t
otal
sal
es,
or
any
othe
r ap
prop
riat
e R
oW,
both
as
a pe
rcen
tage
of t
otal
sal
es (
S e
x do
mes
-
indi
cato
r o
f ac
tivi
ty).
ti
c co
untr
y)
, 1Jl
stln
guls
h be
twee
n eh
rect
Inv
estm
ent
In h
e a
nd
Impo
rtan
ce o
f di
rect
inv
estm
ent b
y d
omes
tic
RoW
. D
irec
t in
vest
men
t in
corp
orat
es o
wne
rshi
p an
d
25)
firm
s ab
road
(m
easu
red
by v
alue
of
asse
ts,
valu
e pa
rtic
ipat
ion
stoc
k. b
ut n
ot c
redi
t le
ndin
g. I
n th
is
of
sale
s, e
mpl
oym
ent.
or
any
othe
r ap
prop
riat
e ca
se,
"sal
es"
mea
ns s
ales
by
aff
ilia
tes
oper
atin
g in
m
easu
re).
fo
reig
n co
unt
ries
(S
ex a
broa
d).
Not
e th
at D
sta
nds
for
dom
esti
c an
d A
for
ass
ets.
R
elat
ive
Impo
rtan
ce o
t ex
port
s an
d d
Irec
t sa
les
Rel
atIv
e Im
port
ance
IS c
onst
ruct
ed a
s fo
llow
s:
(or
any
othe
r ap
prop
riat
e in
dica
tor
of a
ctiv
ity)
by
SD
% =
Sal
es e
x do
mes
tic!
sal
es e
x ab
road
26
) af
fili
ates
as
chan
nels
of
inte
rnat
iona
liza
tion
by
SE
xp%
= E
xpor
ts!
sale
s ex
abr
oad
dom
esti
c fi
ms.
A d
isti
ncti
on s
houl
d be
mad
e be
twee
n in
tra-
and
extr
a-E
C (
RoW
) tr
ansa
ctio
ns.
27)
Sha
re o
f m
embe
r st
ate'
s im
port
s fr
om t
he E
C
~erv
lces
Im
porte
c1 t
rom
hC
(R
oW)
/ T
otal
ser
vice
s
and
RoW
. im
port
ed b
y do
mes
tic
coun
try
Impo
rtan
ce o
f im
port
s(im
port
s di
vide
d by
Im
port
s di
vide
d by
app
aren
t co
nsum
ptIO
n (=
sal
es
28)
appa
rent
con
sum
ptio
n).
Dis
ting
uis
h be
twee
n E
C
orig
inat
ing
in d
omes
tic c
ount
ry, s
ee it
em (
I), T
able
1.
Fu
rthe
rmor
e, c
alcu
late
: Gro
ss D
omes
tic
Pro
duct
=
and
Ro
W i
mpo
rts.
S
ales
-im
port
s.
Deg
ree
of
pres
ence
by
fore
ign
firm
s in
the
M
arke
t sh
are
of
fore
ign
firm
s In
the
dom
esti
c m
arke
t
dom
esti
c m
arke
t (m
arke
t sh
are
of
fore
ign
firm
s is
mea
sure
d by
the
val
ue o
f as
sest
s (A
), o
r an
y ot
her
29)
in t
he
dom
esti
c m
arke
t, m
easu
red
by th
e va
lue
of
appr
opri
ate
indi
cato
r, su
ch a
s em
ploy
men
t an
d sa
les.
asse
ts,
or a
ny o
ther
app
ropr
iate
ind
icat
or o
f F
or e
xam
ple,
deg
ree
of p
rese
nce
for
sale
s:
acti
vity
). A
dis
tinc
tion
sho
uld
be m
ade
betw
een
inve
stm
ents
fro
m t
he E
C a
nd R
oW.
S fo
reig
n fi
rms!
S e
x do
mes
tic
coun
try
Rel
ativ
e Im
port
ance
of
Impo
rts
and
dire
ct s
ales
I he
rel
ativ
e Im
port
ance
ind
icat
or IS
con
stru
cted
on
by f
orei
gn a
ffil
iate
s as
cha
nnel
s o
f in
tern
atio
nal-
the
basi
s o
f po
siti
ons
(28)
and
(29
).
; 30)
iz
atio
n o
f th
e do
mes
tic
mar
ket.
Dis
ting
uish
re
lati
ve i
m
onan
ce =
im
port
s IS
ex
dom
estic
. =
Im
port
s be
twee
n E
C a
nd R
oW t
rans
acti
ons.
P
S fo
r. fi
nns
IS e
x do
mes
uc
S fo
r. fi
rms
Var
iabl
e sp
ecif
icat
ion
X%
C,X
%R
,
SD
C,
ED
C, A
DC
, S
DR
, E
DR
, A
DR
;
SD
%C
, S
D%
R
ED
%C
,ED
%R
S
Exp
%C
, S
Exp
%R
E
Exp
%C
, EE
xp%
R
CD
%,R
D%
.
M%
C, M
%R
. G
DP.
SF
%C
. S
F%
R,
EF
%C
,EF
%R
, A
F%
C,
AF
%R
.
SF
O%
C,
SF
O%
R
>
"0
~ is. ~. i e .... [ i !j ....

App
endi
x T
able
3:
Indi
cato
rs o
f int
erna
tion
aliz
atio
n (c
onti
nued
)
~··;!:B.
, D'e
t~rm
inaq
ts C
)f '"
'~Jnte~
pl!tiQnaUzati~n
Rem
arks
Inte
rnat
iona
l pr
ice
Cal
cula
te:
p,
31)
,-' ,
for e
very
pro
duct
j di
ffer
enti
als
EC
'
P j
1) R
ecip
ient
of s
ervi
ces
is n
ot a
per
son?
(Yes
= 1)
, ,2)
AIe
tran
sact
ions
D
egre
e o
f tr
adab
ilit
y in
Eng
lish
pos
sibl
e? (
Yes
::: 1
), 3)
Mos
t im
port
ant
expo
rt c
ount
ry,
32)
(qua
lita
tive
ne
ighb
orin
g co
untr
y? (
Yes
::: 1
).4)
Mos
t im
port
ant r
ecip
ient
, no
t the
ju
dgem
ent o
n a
scal
e G
over
nmen
t nor
Soc
ial S
ecur
ity?
(Yes
= 1),
5)
Sup
ply
of s
ervi
ces
lega
l, fr
om 0
to 5
).
wit
hout
phy
sica
l pr
esen
ce in
the
dom
esti
c m
arke
t? (Y
es =
1). C
alcu
late
T
RA
D a
s th
e su
m o
f dum
mie
s (m
ax =
5).
Est
abli
sh f
our
fact
or i
nten
sity
ind
icat
ors
(RD
: R
&D
, S
L :
skil
led
Deg
ree
of R
&D
, la
bor,
UL
: un
skil
led
labo
r, C
: ca
pita
l, I:
inte
nsiv
e) w
ith
valu
es a
s fo
l-
labo
r (s
kill
ed o
r lo
ws:
1 =
low, 2
= me
dium
, 3
= hig
h.
unsk
ille
d) a
nd c
apit
al
1) I
RD
; 2)
ISL
; 3)
IU
L;
4) I
e.
33)
inte
nsit
y(fo
r ea
ch
Fur
ther
mor
e, e
stab
lish
fou
r fa
ctor
abu
ndan
ce i
ndic
ator
s w
ith
valu
es a
s
fact
or,
a qu
alit
ativ
e fo
llow
s: 1
= sc
arce
, 2
= av
erag
e, 3
= ab
unda
nt.
judg
emen
t of
a lo
w-
l) A
RD
; 2)
AS
L;
3) A
UL
; 4)
Ae.
m
ediu
m-h
igh
scal
e).
Cal
cula
te:
HO
:::
(IR
D x
AR
D +
ISL
x A
SL
+ IU
L x
AU
L +
IC x
AC
) 13
6
Num
ber
of p
rodu
cts
Cre
ate
a du
mm
y va
riab
le U
j-(U
j =
1, if
the
jth
serv
ice
has
a qu
alit
y
34)
wit
h un
ique
sel
ling
ch
arac
teri
stic
whi
ch is
uni
que
to t
he f
irm)
prop
erty
(U
SP
).
Cal
cula
te:
NU
SP
=
L, U
j j
Est
abli
sh tw
o in
dica
tors
( A
S, A
J) w
ith
valu
es r
angi
ng f
rom
1 to
3 (
1 =
In
stit
utio
nal
fact
or
low
, 2 =
medi
um,
3 =
high)
for
: 35
) en
dow
men
t 1)
Exi
stin
g in
fras
truc
ture
in
the
spec
ific
ser
vice
sec
tor (
AS
).
2) L
egal
and
ins
titu
tion
al f
ram
ewor
k co
nduc
ive
to a
fav
orab
le b
usin
ess
envi
ronm
ent
(AJ)
.
Var
iabl
e sp
ecif
icat
ion
PD
C
TR
AD
HO
NU
SP
AS
,AJ
~ >
'0 1 ~ ~. t:
\!l.
o .... :r
~ ~ :l

Ap
pen
dix
Tab
le 4
: In
dic
ator
s o
f pe
rfor
man
ce (
for
Ban
kin
g an
d In
sura
nce)
U"Y1ir0~' "
",y
,~z;·i
M"
I~f:~~~~
¥:~.~
'$"
'.
Rem
arks
·~$:{M';'t .'"
36)
Ret
urn
on a
sset
s R
OA
= P
rofi
ts b
efor
e ta
x /
Ban
ance
she
et to
tal
37)
vari
ance
of r
etur
n on
as
sets
38)
Ret
urn
on e
qui
ty
RO
E =
Pro
fits
bef
ore
tax
/ E
quit
y E
quit
y =
Cap
ital
+ R
eser
ves
39)
vari
ance
of
retu
rn o
n eq
uity
AV
/IC
= A
dded
val
ue /
Inpu
t co
sts
40)
Add
ed v
alue
ove
r A
dded
val
ue =
Prof
its
befo
re t
ax -
cost
s o
f cap
ital
in
put c
osts
In
put c
osts
= S
taff
exp
ense
s +
cos
ts o
f cap
ital
C
osts
of
capi
tal =
Equ
ity
* (i
/10
0);
i =
Gov
ernm
ent b
ond
yiel
d
AV
/lC
= A
dded
val
ue /
Inpu
t cos
ts
Add
ed v
alue
= P
rofi
ts b
efor
e ta
x an
d ba
d de
bts,
aft
er m
inor
ity
inte
rest
s an
d ex
trao
rdin
ary
item
s +
/-R
eser
ves
chan
ges
-co
sts
of e
quit
y in
clud
-
Add
ed v
alue
ove
r in
g pr
emiu
m
41)
inpu
t cos
ts
Inpu
t cos
ts =
All
ope
rati
ng c
osts
+ c
osts
of e
quit
y in
clud
ing
prem
ium
C
osts
of
Equ
ity
= E
quit
y * (
i +
r)/
100
r
= R
isk
prem
ium
of
10 %
i =
Gove
rnm
ent b
ond
yiel
d E
quit
y =
Capi
tal
+ R
eser
ves
42)
vari
ance
of a
dded
va
lue
over
inp
ut c
ost
Var
iabl
e sp
ecif
icat
ion
RO
A,
VR
OA
RO
E,
V R
OE
AV
/IC
a
AV
/IC
b
VA
V/IC
a,
b
>
~ 5. RO
t"' ~
g,
5°
Q.
~o
S ;;! 1;1
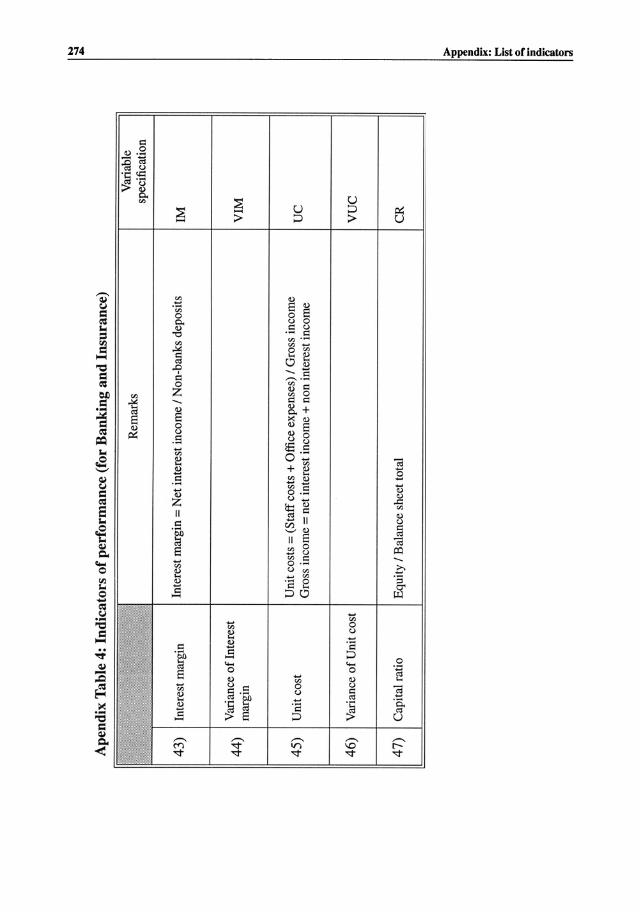
Ape
ndix
Tab
le 4
: In
dica
tors
of p
erfo
rman
ce (
for
Ban
king
and
Ins
uran
ce)
43)
I Int
eres
t m
argi
n
44)
Var
ianc
e o
f In
tere
st
mar
gin
45)
I Uni
t cos
t
46)
I Var
ianc
e o
f U
nit c
ost
47)
I Cap
ital
rat
io
Rem
arks
Inte
rest
mar
gin
= N
et i
nter
est
inco
me
/ N
on-b
anks
dep
osit
s
Uni
t cos
ts =
(S
taff
cos
ts +
Off
ice
expe
nses
) /
Gro
ss i
ncom
e G
ross
inc
ome
= n
et i
nter
est i
ncom
e +
non
int
eres
t in
com
e
Equ
ity
/ B
alan
ce s
heet
tota
l
IM
Var
iabl
e sp
ecif
icat
ion
VIM
UC
VU
C
CR
~ f Q. R·
~ - s. s· Q. ~ ;;!

List of contributors
Blankart, Charles Beat, Professor of Economics, Institute for Public Policy in Economics and Finance, Humboldt University, Spandauerstr. 1,0-1020 Berlin
Blattner, Niklaus, Professor of Economics, Labour and Industrial Economics Research Unit (LIU), University of Basle, Missionsstr. 64A, CH-4055 Basle
Etter, Christian, Head of International Services Section, Federal Office for Foreign Economic Affairs, Bundeshaus Ost, CH-3003 Berne
Felder, Stefan, Senior Assistant, Institute for Empirical Research in Economics, University of Zurich, Bliimlisalpstr. 10, CH-8006 Zurich
Finsinger, Jorg, Professor of Economics, Institute for Business Economics, University of Vienna, Tiirkenstr. 23110, A-I090 Vienna
Gobat, Jeanne, Assistant, Institute for Empirical Research in Economics, University of Zurich, Bliimlisalpstr. 10, CH-8006 Zurich
Graeber, Norbert, Assistant, Institute for Trade Affairs within the Institute for Empirical Research in Economics, University of Saarbruecken, 1m Stadtwald, Gebaude 15,0-6600 Saarbruecken 11
Kleeb, Ralph, Assistant, Institute for Empirical Research in Economics, University of Zurich, Bliimlisalpstr. 10, CH-8006 Zurich
Jeker, Rolf M., Ambassador, Deputy Director, Federal Office for Foreign Economic Affairs, Bundeshaus Ost, CH-3003 Berne

List of contributors (continued)
Muller, Karin, Assistant, Socioeconomic Institute, University of Zurich, Ramistr. 71, CH-8006 Zurich
Nielsen, Claudia, Assistant, Socioeconomic Institute, University of Zurich, Ramistr. 71, CH-8006 Zurich
Ortmann, B~nedikt, Assistant, Institute for Trade Affairs within the Institute for Empirical Research in Economics, University of Saarbruecken, 1m Stadtwald, Gebaude 15, D-6600 Saarbruecken 11
Prioni, Paola, Assistant, Socioeconomic Institute, University of Zurich, Ramistr. 71, CH-8006 Zurich
Schmid, Frank A., Assistant, Institute for Business Economics, University of Vienna, Tiirkenstr. 23110, A-I090 Vienna
Schwandt, Friedrich, Assistant, Institute for Public Policy in Economics and Finance, Humboldt University, Spandauerstr. 1,0-1020 Berlin
TIetz, Bruno, Professor of Economics, Institute for Trade Affairs within the Institute for Empirical Research in Economics, University of Saarbruecken, 1m Stadtwald, Gebaude 15, D-6600 Saarbruecken. 11
Zweifel, Peter, Professor of Economics, Institute for Empirical Research in Economics, University of Zurich, Blumlisalpstr. 10, CH-8006 Zurich