appendix l. economic and allocation …€¦ · · 2010-10-291.3 significance of allowance...
TRANSCRIPT

APPENDIX L. ECONOMIC AND ALLOCATION ADVISORY COMMITTEE
RECOMMENDATIONS
L-1

L-2
This Page Intentionally Left Blank

Allocating Emissions Allowances
Under a California Cap-and-Trade Program
Recommendations to the California Air Resources Board and California Environmental Protection Agency
from the Economic and Allocation Advisory Committee
March 2010
L-3

1
Contents Executive Summary .............................................................................................................................................. 2
1 Introduction ..................................................................................................................................................... 6
1.1 Climate Change, AB 32, and Cap and Trade .............................................................................. 6
1.2 Connections with Other U.S. Cap-and-Trade Programs ....................................................... 7
1.3 Significance of Allowance Allocation ........................................................................................... 8
1.4 Establishment and Role of the Economic and Allocation Advisory Committee ......... 9
1.5 This Report ............................................................................................................................................. 9
2 Mechanisms for Allowance Distribution............................................................................................ 11
2.1 The Main Alternatives: Free Allocation and Auctioning of Allowances ...................... 11
2.2 Rationales for Free Allocation and Auctioning ...................................................................... 12
2.3 Alternative Methods of Free Allocation .................................................................................... 16
2.4 Alternative Auction Designs .......................................................................................................... 19
3 Total Allowance Value ............................................................................................................................... 22
3.1 General Issues ..................................................................................................................................... 22
3.2 Factors Determining Abatement Costs ..................................................................................... 23
3.3 Policy Factors that Influence Allowance Prices..................................................................... 25
3.4 Range of Allowance Prices and Values ...................................................................................... 27
4 Making Use of Allowance Value: General Considerations .......................................................... 33
4.1 The Alternatives ................................................................................................................................. 33
4.2 Legal Issues .......................................................................................................................................... 34
5 Making Use of Allowance Value: Examining the Alternatives .................................................. 38
5.1 Prevention of Adverse Impacts .................................................................................................... 38
5.2 Financing Investments and Other Public Expenditure ...................................................... 48
5.3 Dividends to the Public .................................................................................................................... 56
5.4 Tax Rate Reduction ........................................................................................................................... 59
6 Recommendations....................................................................................................................................... 62
6.1 Basis for the Recommendations .................................................................................................. 62
6.2 Organization of the Recommendations .................................................................................... 63
6.3 Allowance Distribution Method ................................................................................................... 63
6.4 Provision of Allowance Value ....................................................................................................... 65
Glossary.................................................................................................................................................................... 71
References............................................................................................................................................................... 73
Appendix A: Market Barriers to Deploying Clean Energy Technologies ...................................... 78
Appendix B: Investment in Disadvantaged Communities ................................................................... 81
Appendix C: Distributional Effects on California Households of Carbon Prices ........................ 85
L-4

2
Executive Summary Spurred by threats to the environment, the economy and public health, California has made
strong commitments to reduce the greenhouse gas (GHG) emissions that contribute to climate change. One milestone was the enactment of the California Global Warming Solutions Act of 2006, also known as AB 32 (Núñez, 2006). AB 32 set a binding emissions target of 1990 levels by 2020. It authorized the Air Resources Board (ARB) to determine the specific measures or policies to implement in order to achieve that target and directed the ARB to publish a Scoping Plan detailing those policies.
The ARB issued its Scoping Plan in December 2008, identifying 73 measures. Included among these is a cap-and-trade program, a program that engages market forces to achieve desired emissions reductions. When implemented, California’s cap-and-trade program would extend to industrial and other sources accounting for about 85% of the state’s GHG emissions. A touted attraction of cap and trade is its ability to achieve GHG reductions at lower cost than other policy approaches. This means that whatever the overall impact of AB 32 on state income, the end result will be greater income than would be the case without cap and trade.
On May 22, 2009, the ARB and the California Environmental Protection Agency established the Economic and Allocation Advisory Committee (EAAC). The EAAC was assigned two roles: One was to provide advice to the ARB relating to its assessment of the economic impacts of the AB 32 Scoping Plan, an assessment that is being updated and will be released in March 2010. The other role relates to the cap-and-trade component of the Scoping Plan. The EAAC was asked to advise the ARB as to the best ways to allocate emissions allowances (emissions permits) under the cap-and-trade program.
This report documents the EAAC’s work relating to this second, allocation role.
There are two main elements of allocation design. One is to specify the mechanisms for allowance distribution, that is, the way that emissions allowances are to be put into circulation. This can be done by free provision to various entities or by auctioning. The other element is to determine the pattern of provision of allowance value, that is, how the value of the emissions allowances will be distributed across various parties. If allowances are freely issued, then allowance value goes to the recipients of these free allowances. If allowances are auctioned, allowance value goes to the parties to whom the revenues from the auction are directed.
This report articulates the EAAC’s findings regarding both the methods for putting allowances into circulation (auctioning and free allocation) and the alternative uses of the allowance value. The first five sections of the report describe the various alternatives and indicate their various advantages and disadvantages. This discussion provides a basis for the EAAC’s recommendations, which are provided in Section 6 of the report.
In evaluating alternative allocation options and arriving at its recommendations, the EAAC emphasized four criteria: cost-effectiveness, fairness, environmental effectiveness and simplicity. These four criteria encapsulate objectives and requirements included in the language of AB 32. The law states, for example, that the policies introduced should: “consider cost-effectiveness of these regulations” (California Health and Safety Code §38562(b)(5)); that the ARB should “design the regulations, including distribution of emissions allowances where appropriate, in a manner that is equitable” (§38562(b)(1)); that the policies should “minimize leakage” (§38562(b)(8)); and that those policies should “maximize additional environmental and economic benefits for California, as appropriate.” (§38570(b)(3)).
L-5
3
In arriving at its recommendations, the EAAC closely considered the existing legal rules that relate to possible allowance distribution methods and uses of allowance value. However, in forming its recommendations, the EAAC decided to consider broadly what seemed best for the state, recognizing the possibility that in some cases the most desirable allocation design might not fit within existing rules.
Based on its evaluation of these considerations, the EAAC recommends that the ARB incorporate the following features in allocating emissions allowances under any cap-and-trade program adopted by the ARB as part of its strategy to implement AB 32. (Note that a more complete list of the recommendations is in Section 6 of the EAAC report, and that a more extensive basis for these recommendations is offered in sections 2 – 5.)
Mechanisms for Allowance Distribution
The ARB should rely principally, and perhaps exclusively, on auctioning as a mechanism for distributing allowances (that is, for putting allowances into circulation). Auctioning is an especially transparent mechanism for allowance distribution, and it facilitates discovery of the actual costs associated with emissions abatement. It has the same potential as free allocation for achieving distributional or fairness objectives, since nearly every objective or conferral of allowance value sought through free allocation of allowances can be achieved through auctioning and the associated use of auction proceeds. In contrast with free provision, auctioning yields revenue and thereby can reduce the extent of the government’s reliance on ordinary taxes for financing expenditures; this can help reduce the overall costs of AB 32.
The ARB should rely on free allocation as a distribution mechanism only where necessary to address “emissions leakage,” i.e., increases in out-of-state GHG emissions generated by California’s climate policy. The need for free allocation to address emissions leakage is likely to be small, for two reasons. First, as a share of total allowance value, the share needed to deal with potential leakage is small. Second, other mechanisms such as border adjustments sometimes offer a more cost-effective way to address leakage.
Unless new and specific information should support an alternative, the uniform price, sealed bid (single round) auction is the appropriate design for an allowance auction. This design is simplest and most transparent. It also is relatively easy to develop a bidding strategy for this design.
The ARB should adopt distribution mechanisms that can be substantially modified as conditions change. Uncertainties about future economic conditions and government policies at the federal and regional levels suggest that the ARB’s commitments should be easily adaptable to changing circumstances.
Provision of Allowance Value
In keeping with the stipulated objectives of AB 32, sufficient allowance value should be earmarked for the purposes of (1) addressing emissions leakage (when other mechanisms cannot easily or effectively be engaged for this purpose), (2) avoiding disproportionate adverse economic impact of AB 32 on low income households, and (3) creating a contingency fund to be devoted to any communities eventually found to be experiencing
L-6
4
increased exposure to co-pollutants as a result of possible fossil-fuel burning stemming from AB 32 implementation. It is anticipated that a relatively small share of the state’s total allowance value would be needed for these purposes.
The (substantial) proportion of allowance value that is not devoted to the earmarked purposes above should be allocated to two major uses: (1) returning allowance value to households, and (2) financing investments to reduce emissions and other public expenditures. Roughly 75% of this value should be devoted to the first of these uses, and roughly 25% to the latter. Because the amount of allowance value is expected to be lower in early years than in later years, it is appropriate to allow these ratios to change over time. A share in excess of 25% might be devoted to investment in earlier years, when total allowance value is lower, so that high-priority investment needs can be financed. Among the investment alternatives, investments to achieve GHG reductions or adapt to the effects of climate change should be treated as senior obligations; that is, as objectives that must be addressed before allowance value can be allocated to other investment uses.
While the EAAC achieved consensus on all of the above recommendations, it did not reach full agreement as to the method for returning allowance value to households. Some members of the committee favored distributing allowance value (auction proceeds) to households in the form of income tax reductions or avoided income tax increases. Other committee members preferred distributing allowance value through rebate checks of a given amount, to be issued to households. Discussion of the attractions and limitations of these alternatives is provided in the main report.
The EAAC hopes that its analysis and recommendations will prove useful to the ARB as it decides on the form of allocation under any cap-and-trade program it adopts. The California Legislature and the Governor have been and continue to be recognized throughout the world for their leadership in addressing climate change. The EAAC members are grateful to the Governor, the Secretary for Environmental Protection, and the Chairman of the Air Resources Board for the opportunity to contribute to the climate change policy process. The EAAC also wishes to express its appreciation to staff members of the ARB and the California Environmental Protection Agency for their invaluable input to the committee as it prepared this report.
L-7

5
Economic and Allocation Advisory Committee Members Justin Adams Director, Chang & Adams Consulting Vicki Arroyo Executive Director, Georgetown State and Federal Resource Center Matthew Barger Senior Advisor, Hellman and Friedman LLC James K. Boyce Professor of Economics and Director, Program on Development, Peacebuilding, and the Environment, Political Economy Research Institute, University of Massachusetts, Amherst Dallas Burtraw Senior Fellow, Resources for the Future James Bushnell Associate Professor, Cargill Chair in Energy Economics, Iowa State University Robert Fisher Member of the Board of Directors, Gap, Inc. Richard Frank, Vice Chair Executive Director, Center for Law, Energy and the Environment, University of California, Berkeley Larry Goulder, Chair Shuzo Nishihara Professor in Environmental and Resource Economics and Director, Stanford Environmental and Energy Policy Analysis Center, Stanford University Dan Kammen Class of 1935 Distinguished Professor, Energy and Resources Group, Goldman School of Public Policy, and Department of Nuclear Engineering, University of California, Berkeley Christopher R. Knittel Associate Professor of Economics, Chancellor’s Fellow, University of California, Davis Stephen Levy Director and Senior Economist, Center for Continuing Study of the California Economy Joe Nation Director, Graduate Public Policy Practicum, Stanford University Nancy E. Ryan Deputy Executive Director for Policy and External Relations, California Public Utilities Commission Nancy Sidhu Chief Economist, Kyser Center for Economic Research, Los Angeles County Economic Development Corporation James L. Sweeney Professor, Management Science and Engineering, and Director, Precourt Energy Efficiency Center, Stanford University
L-8

6
1 Introduction
1.1 Climate Change, AB 32, and Cap and Trade
Addressing climate change is one of the most critical challenges of our time. Human activities are increasing the amount of carbon dioxide and other greenhouse gases (GHGs) in the atmosphere. There is now a strong consensus among climate scientists that this changes the world’s climate, and that without significant reductions in emissions of these gases, future climate changes will be considerably more pronounced. Higher concentrations of GHGs already lead to increased air and ocean temperatures, which contribute to glacial melting and rising sea levels. Hotter temperatures also lead to changes in precipitation patterns and disruptions to the functioning of ecosystems.
California is witnessing increased average temperatures, more extreme hot days, fewer cold nights, and shifts in the water cycle including snowmelt and rainwater runoff earlier in the year. As climate change continues, projected impacts in California include more, longer, and hotter heat waves, less water storage in the snow pack, more-frequent droughts, greater damage from fires, and increases in sea level and coastal erosion.
Spurred by these threats to the economy, public health, and the environment, as well as opportunities that come from early efforts to address a global problem, California has made strong commitments to reduce the global warming pollution that causes climate change. One milestone was the enactment of the California Global Warming Solutions Act of 2006, also known as AB 32. AB 32 set a binding emissions target of 1990 levels by 2020. It also authorized the Air Resources Board (ARB) to determine the specific policies to implement in order to achieve that target and to publish a Scoping Plan detailing those policies. The ARB issued its Scoping Plan in December 2008 (California Air Resources Board, 2008), identifying 73 measures.
The Scoping Plan’s policies will bring substantial benefits to California, the nation and the globe by reducing GHG emissions and thereby reducing the extent of climate change. Apart from these benefits, the question arises whether AB 32 will generate overall costs to the California economy. Studies reach different conclusions on this question. Some find that AB 32 will raise California’s income relative to what would occur in the absence of AB 32; others estimate it will lead to a slightly lower state income (Climate Action Team Economics Subgroup, 2007; California Air Resources Board, 2008; Electric Power Research Institute, 2007). However, the estimated impacts on state income from virtually all studies are small in relation to estimated costs to the California economy of unconstrained emissions growth.1 AB 32 produces substantial net benefits to California after taking into account the benefits to the environment and health. These environmental and health benefits provide the principal motivation for AB 32. Such benefits are not included in the cost calculations of many economic models.
Among the policies in the Scoping Plan is a cap-and-trade program; a program that engages market forces to achieve desired emissions reductions. When implemented, California’s cap-and-trade program would extend to industries accounting for about 85% of the state’s emissions. A touted attraction of cap and trade is its ability to achieve GHG reductions at very low cost. This
1 The draft 2009 Climate Action Team report states that “climate change will impose substantial [environmental-damage-related] costs to Californians in the order of tens of billions of dollars annually” (Climate Action Team, 2009, p. 2.27).
L-9

7
means that whatever the overall impact of AB 32 on state income, the end result will be greater income than would be the case without cap and trade.
Cap and trade has three key components:
First, the regulatory authority specifies the total quantity of allowances to be distributed in given periods. Each allowance entitles the holder to emit a certain quantity of emissions of a given pollutant. In the case of a climate policy cap-and-trade program, an allowance entitles the holder to a given quantity (usually one metric ton) of greenhouse gases in carbon dioxide equivalents2 (CO2e). The number of issued allowances can decline over time; in this case overall emissions decline through time as well.3
Second, the regulatory authority needs to distribute the emissions allowances. The allowances can be given out through free allocation, by selling them, or through some combination of the two.
Third, there are provisions for trading (or more generally, the purchase or sale) of allowances. The opportunities for private-parties to buy and sell emissions allowances, and to purchase any allowances auctioned by the state, lie behind cap and trade’s potential to achieve emissions reductions at low cost to the overall economy. Emitters will generally consider their costs of reducing emissions to the level required by their current holdings4 of allowances, and compare this with the market price of allowances. For emitters with especially high abatement (emission-reduction) costs, the market price will be less than this cost. In this case, the emitter will benefit by purchasing additional allowances instead of taking on additional abatement cost. For emitters with especially low abatement costs, the market price will be greater than this cost. In this case, the emitter benefits by selling some of its allowances; although this obliges the emitter to reduce emissions even further, the proceeds from the sale will more than offset the additional abatement costs. Allowance trading thus results in more of the emissions reduction being undertaken by facilities that can do it most cheaply. Buyers and sellers both benefit, yet the trading leads to no change in overall emissions as it does not alter the number of allowances in circulation.
1.2 Connections with Other U.S. Cap-and-Trade Programs
The Scoping Plan calls for links between California’s cap-and-trade program and the cap-and-trade programs of other jurisdictions participating in the Western Climate Initiative (WCI). The WCI is a collaboration of seven U.S. states (including California) and four Canadian provinces to reduce GHG emissions.5 The partner jurisdictions’ design for a cap-and-trade program allows the implementing jurisdictions to link, forming a regional program. Linkage involves reciprocal agreements to accept allowances issued by another jurisdiction for compliance in one’s own. Linkage can reduce the overall cost of meeting an emissions target by increasing the breadth of reduction opportunities available.
2 Some greenhouse gases (GHGs) have a greater climate effect than carbon dioxide (CO2). For example, methane is about 25 times as potent (Intergovernmental Panel on Climate Change, 2007, p. 212). To treat emissions uniformly, GHGs are referenced to their carbon dioxide equivalent, CO2e.
3 Under the cap-and-trade program proposed in the Scoping Plan, the number of allowances circulated would decline over time, with the total quantity of permits available in 2020 approximately 13% less than what will be issued in 2015. This assures ever-greater reductions in emissions over time.
4 The current holdings will be the number received free or purchased through an auction, plus any allowances previously purchased from other emitters.
5 The WCI’s U.S. member states are Arizona, California, Montana, New Mexico, Oregon, Utah and Washington. The participating Canadian provinces are British Columbia, Manitoba, Ontario and Quebec.
L-10

8
Introducing a federal cap-and-trade program would have important implications for a California or Western-regional program (and for other state and regional programs). For example, the American Clean Energy and Security Act (2009) would introduce a national cap-and-trade program and preempt any state or regional cap-and-trade program for six years. Even if a federal proposal did not involve preemption, the emergence of a national cap still impact the price of allowances in state programs by influencing the behavior of firms and consumers throughout the U.S. A federal program could also impact the environmental integrity of state programs; with a national cap in place, when one state reduces emissions it reduces pressure on the national cap and thereby creates room, within the national cap, for additional emissions from other states. It is impossible to predict the specific nature of future regional programs, or whether and how a national program will emerge. This makes it important for California to design its own cap-and-trade program in a way that will promote the state’s environmental goals under a range of future scenarios.
1.3 Significance of Allowance Allocation
The more allowances that a given facility owns, the less it must reduce emissions to be in compliance with the program. Firms generally are willing to pay a significant amount to lessen the extent to which they must reduce emissions, particularly if the cap-and-trade program calls for significant overall reductions. Thus the market price of allowances can be significant, as well as the total allowance value (the market price times the quantity of allowances in circulation).
As discussed later in this report, the total allowance value under California’s cap-and-trade program is likely to be several billions of dollars in each year of the program. The total allowance value is quite different from the economic cost of AB 32. Allowance value remains in the economy and does not constitute a cost. The economic cost of AB 32 may be a tiny fraction of allowance value. In fact, the same studies that predict that the economic cost of AB 32 (that the policy will raise state income) indicate a substantial allowance value.6
The ARB needs to make fundamental decisions regarding the allocation of allowances and allowance value.
The first decision relates to the mechanism for initially putting allowances into circulation. There are two main mechanisms for this distribution: free allocation and auctioning. These are not preclusive; the ARB could combine the two.
The second decision concerns the intended recipients and uses of allowance value. Here the ARB needs to consider what parties will receive allowance value, either in the form of free allowances or revenue from an allowance auction.
In principle, any entity—consumers, businesses, or public agencies—can obtain allowance value either by receiving free allowances or receiving revenue from an allowance auction.
Free allowances can be distributed to compliance entities (the emitters covered under a cap-and-trade program). However, allowances can be given free to other parties (for example, groups of consumers) as well. These parties could then sell the allowances to the compliance entities. When allowances are auctioned, the allowance value consists of the proceeds from the auction. This allowance value can be provided to various parties and serve various purposes. Thus, the choice between free allocation and auctioning as a distribution mechanism does not pose constraints on the individuals, firms or agencies that might receive allowance value.
6 E.g., Scoping Plan (California Air Resources Board, 2008), Appendix G.
L-11
9
Some of the purposes to which allowance value can be devoted include: preventing potential adverse impacts of AB 32 to certain parties, financing various investments or other public expenditures, and directing the value to citizens in the form of financial transfers (“dividends”) or reductions (or avoided increases) in California taxes.
1.4 Establishment and Role of the Economic and Allocation Advisory
Committee
On May 22, 2009, the ARB and the California Environmental Protection Agency established the Economic and Allocation Advisory Committee (EAAC). The EAAC has two main roles: to provide input on the evaluation of economic impacts of AB 32 and to offer recommendations regarding the allocation of allowance value. These two roles are in keeping with the resolution indicated by the ARB when it adopted the Scoping Plan, a resolution committing the ARB to solicit “input from experts to advise ARB on its continuing evaluation of the economic effects of implementing AB 32, including identification of additional models or other ongoing analysis tools that could be used in the ongoing economic analysis,” as well as to solicit “expert input on key questions related to the distribution or auction of allowances and the use of revenue” (California Air Resources Board, 2008, p. 131).
1.5 This Report
This report documents the EAAC’s work relating to its allocation role. It articulates the EAAC’s findings on the nature of the various options for distributing allowance value. It also presents the potential attractions and limitations of each option and offers the EAAC’s recommendations on which set of options seems best for California.
The EAAC recognized that the specific mechanisms for allowance distribution, and the particular way that allowance value is used, represent just a part of the overall design of a cap-and-trade program. Other design elements include the stringency of the overall cap and the range of sectors and gases covered. In its work, the EAAC considered the likely shape of a cap-and-trade program along these other dimensions, as indicated by the Scoping Plan. However, its recommendations pertain only to the allocation component of cap and trade.
In evaluating alternative allocation options and arriving at its recommendations, the EAAC employed four criteria: fairness, cost-effectiveness, environmental effectiveness and simplicity. These four criteria encapsulate objectives and requirements throughout AB 32, among them to:
“Consider cost-effectiveness of these regulations” (California Health and Safety Code §38562(b)(5));
“Design the regulations, including distribution of emissions allowances where appropriate, in a manner that is equitable” (§38562(b)(1));
“Minimize leakage” (§38562(b)(8)); and
“Maximize additional environmental and economic benefits for California, as appropriate.” (§38570(b)(3)).
In arriving at its recommendations, the EAAC closely considered the existing legal rules that relate to possible allowance distribution methods and uses of allowance value. However, in forming its recommendations, the EAAC decided to consider broadly what seemed best for the state, recognizing the possibility that in some cases the most desirable allocation design might not fit within existing rules.
L-12

10
The rest of this report is organized as follows. Section 2 describes and evaluates the main mechanisms of allowance distribution: namely, the free allocation and auctioning of allowances. Section 3 considers the magnitude of allowance value that might result under cap and trade. Section 4 introduces some general considerations relevant to evaluating various possible uses of allowance value, while Section 5 discusses in more detail the rationales for various uses. The discussion in sections 1 – 5 provide the factual and conceptual basis for the EAAC’s recommendations presented in Section 6 along with outlines of the bases for the recommendations. The appendixes offer further background material and relevant quantitative information.
L-13

11
2 Mechanisms for Allowance Distribution 2.1 The Main Alternatives: Free Allocation and Auctioning of
Allowances
In designing a cap-and-trade program, policy makers need to make important decisions about how to distribute emissions allowances. One of the most fundamental is whether the state should give allowances away for free or sell them via auction. The two alternatives are not mutually exclusive; some allowances can be freely allocated and the rest auctioned. Also, the split between free allocation and auctioning can change over time.
Both free allocation and auctioning provide allowance value to various entities. Free allocation offers this value directly to the recipients. Auctioning offers this value via the revenues from an allowance auction. These revenues can be distributed to industrial or commercial entities, to households, or to the public treasury.7
This section discusses free allocation and auctioning as mechanisms for allowance distribution. It describes basic rationales for each approach, indicates specific forms that each approach can take, and discusses some potential advantages and drawbacks of each approach.
2.1.1 Distribution Mechanisms and the Ultimate Receipt of Allowance Value
Free allocation can be used to distribute allowance value to compliance entities—the
parties required to submit allowances. However, free allocation can also be employed to provide allowance value to other parties; these parties can subsequently convert this allowance value into cash by selling the allowances to the compliance entities. For example, in a cap-and-trade program in which the compliance entities include electricity generators and refiners, allowance value could be offered to industrial users of electricity and refined fuels in the form of free allowances that subsequently can be sold.
In principle, nearly all entities that could obtain allowance value by receiving free allowances could also obtain such value as proceeds from an auction. Under each of these distribution mechanisms, allowance value can be conferred to serve a number of purposes. The EAAC examines these alternative potential uses of allowance value in sections 4 and 5.
Although both free allocation and auctioning are alternative mechanisms for distributing allowance value to almost any potential recipient, the two mechanisms can have different consequences. Awarding allowance value to certain parties might be simpler, or face fewer institutional challenges, under one mechanism than under the other. Also, the choice between the two approaches can have implications for the overall economic cost of the cap-and-trade program, and in some circumstances it can influence the extent to which the program achieves its environmental goals. In the subsections below the EAAC examines these issues.
2.1.2 Some General Considerations
7 It is also possible to employ auctioning subsequent to an initial free allocation: the state could freely allocate
allowances and allow recipients to sell the allowances into the market through an auction.
L-14

12
As mentioned, the options for allowance distribution are not simply 100% auctioning or 100% free allocation. Mixed approaches are also possible, with some portion of allowances being given for free and some auctioned, and that ratio may shift over time.
The relative attractiveness of free allocation or auctioning can depend on whether a regional or national cap-and-trade program is put into place. As discussed below, the prospect of emissions leakage can be invoked to justify a certain form of free allocation, and the extent of emissions leakage depends directly on the presence or absence of a regional or national cap-and-trade program. Given the uncertainties, it is important for the ARB to develop flexible distribution strategies so that the reliance on any one form of allowance distribution can easily be changed if the regional or national policy environment were to change.
2.2 Rationales for Free Allocation and Auctioning 2.2.1 Rationales for Free Allocation
Direct Provision of Compensation
Many view free allocation as a particularly expedient way to provide compensation to regulated entities. The compensation comes in the form of (valuable) free allowances. In contrast, when all allowances are auctioned, providing compensation to regulated entities involves both an auction and a subsequent recycling of auction revenue to these entities. Because the auction process involves two steps, compliance entities might feel that obtaining allowance value through the recycling of auction revenue carries greater risk than obtaining such value in one step through the receipt of free allowances. For firms with exceptionally limited cash reserves or ability to borrow in order to finance the purchase of auctioned allowances, receiving free allowances is much more attractive than receiving auction proceeds after having to purchase allowances. The state could establish a revolving fund to assist firms facing a limited cash flow to meet their short-term obligations.
However, economic analysis indicates that in most cases a large majority of the cost of allowance purchases will be passed on to consumers. In such cases firms will be able to recover the cost of allowance purchases even before the firms are actually required to obtain allowances for surrender at the end of a compliance period. Also, while free allocation might be relatively expedient when used to confer allowance value to compliance entities, it may be more cumbersome when used to provide allowance value to other entities. For example, when free allocation is used to grant allowance value to entities such as local governments or community-based organizations, or to individuals directly, there is an added transaction cost imposed on these parties (relative to the case where the parties receive auction proceeds) as these parties would subsequently need to sell the allowances to convert them to cash. One solution to this problem would be to enable allowance sellers to participate in the auction along with buyers.8
Automatic Adjustment of Value in Line with Compliance Costs
Free allocation has another potential attraction as a mechanism for offering compensation. The value of allowances given for free would adjust automatically when allowance prices change. If the goal is to compensate impacted parties for their increased costs arising from climate policy,
8 This approach is called a double auction, which enables sellers and buyers to sell or buy allowances.
L-15

13
this automatic adjustment might be an advantage because compliance costs tend to be closely related to allowance prices. Thus, when compliance costs rise, the amount of compensation will rise as well. On the other hand, such adjustments in value might be a disadvantage when the goal is to fund purposes not directly linked to the cost of compliance, such as investments in research and development.
Addressing Emissions Leakage
Introducing an environmental regulation in one jurisdiction can cause production costs and prices in that jurisdiction to increase relative to costs in jurisdictions that do not introduce comparable regulations. This can precipitate a shift in demand away from goods produced in the implementing jurisdiction toward goods produced elsewhere. As a result, the reduction in production and emissions in the implementing jurisdiction is offset by increased production and emissions elsewhere. The offsetting increase in emissions is called emissions leakage.
A particular form of free allocation—output-based updated free allocation—has the potential to mitigate emissions leakage by helping keep prices low for firms within the implementing jurisdiction and thereby helping those firms maintain a share of the larger market. Output-based updated allocation offers firms free allowances as a function of their levels of production in the current or in a recent time period. As discussed in subsection 2.3.2 below, it is in effect a subsidy to production. As a result, it can help in-state firms maintain their output levels and thereby retain market share.
Leakage may be especially of concern for firms with production processes involving intensive use of carbon-based fuels or with significant market competition from out-of-state producers. The carbon intensity of these firms suggests relatively large cost increases as a result of the higher fuel prices brought about by cap and trade, while the trade exposure suggests that as these firms aim to pass these costs on to consumers, they would lose considerable market share to out-of-state competitors. Hence considerable leakage would result. The American Clean Energy and Security Act (2009) refers to industries with such firms as “energy-intensive trade-exposed” industries.
However, it may be possible to address leakage through one or another form of border adjustment9 oriented to the GHG emissions associated with imported fuels or goods. One form is the “first-deliverer” approach to allowance requirements, which imposes the same compliance requirement on products consumed in the state regardless of their production location. Analyses focusing on avoiding leakage in the electricity sector (E3, 2008; Bushnell & Chen, 2009) examine this approach. In this sector, the first-deliverer approach would evaluate the emissions associated with the out-of-state generation of electricity and impose a compliance requirement at the first point of delivery in California. The emissions would be covered under cap and trade in the same manner as emissions from electricity delivered from in-state generation. This approach helps stem leakage by eliminating the cost advantage of imported electricity, thereby eliminating electric utilities’ incentives to shift purchases to electric power generated out of state. This approach could also be applied to cover liquid fuels imported to California by directly accounting for the CO2 embodied in the fuels, and with more difficulty, by accounting for the emissions related to production. The approach could work well in protecting against leakage in the production of goods used or consumed in California.
Another alternative border adjustment mechanism for addressing leakage is a border tax. This would involve a levy on imported fuels or other goods and services at a rate intended to
9 The term “border adjustment” is sometimes interpreted as referring only to border taxes. The EAAC interprets the term more broadly, so that it also encompasses the first-deliverer approach.
L-16

14
eliminate the cost disadvantage that California firms might otherwise face. In subsection 2.3 the EAAC compares output-based updated free allocation with these alternatives as mechanisms for confronting leakage.
One claimed drawback of free allocation is that it reduces firms’ incentives to reduce emissions. However, except in cases where firms can influence their receipt of allowances in the future by producing or emitting more in an earlier year (cases which the EAAC discusses below), the number of allowances a firm receives does not reduce incentives to abate emissions or to invest in new, low-emissions technologies. Firms minimize their costs by reducing emissions up to the level where the incremental cost of further emissions abatement just equals the allowance price. This level is largely unaffected by the number of allowances the firm receives for free.10
2.2.2 Rationales for Auctioning
Several cap-and-trade programs employ auctioning as a method of allowance value. Experience provides several rationales for the use of an auction for the initial distribution of emissions allowances.
Price Discovery Most policy discussions see a role for at least some percentage of auctioning in ensuring
the smooth functioning of the market, particularly when the market is in its infancy. For instance, under the Acid Rain Program within the 1990 Clean Air Act Amendments, sulfur dioxide emissions allowances were distributed free to historic emitters. However, the program also employs a small annual revenue-neutral auction with proceeds returned to emitters on a proportional basis. The auction played a valuable role in identifying the market-clearing price in the early years of the program.11
Transparency One attraction of auctioning is that it can make the assignment of allowance value more
transparent. Under other approaches for allocating emission allowances or other types of valuable licenses, administrative approaches can involve complicated formulas that obscure the identities
10 For each ton that a firm reduces its emissions, it either reduces the number of allowances it needs to purchase (assuming its allocation of free allowances was less than what it needed) or increases the number of allowances it can sell (assuming its allocation of free allowances was more than what it needed). In either case, the gross value (the value exclusive of abatement costs) to the firm of reducing its emissions by one unit is the same: it is the market price of an allowance.
At the same time, the number of allowances a firm receives for free does affect its profit. Suppose that the amount of emissions consistent with equating marginal abatement costs with the market allowance price is X. Then each additional free allowance that a firm receives reduces costs or adds to revenue either by (a) reducing the number of additional allowances the firm must purchase in order to have allowances sufficient to justify emissions of X, or (b) increasing the number of allowances the firm can sell in order to reduce its holdings of allowance to the amount just sufficient to justify X. Either way, additional allowances allow the firm to retain more revenue.
11 The allocation to emitters is based on their historical heat input (fuel use) multiplied by an emissions rate. Before the first auction occurred, initial bilateral trades (between two parties) revealed a wide distribution of prices for emissions allowances, reflecting uncertainty about the cost of emissions reductions among compliance entities and about the functioning and liquidity of the emerging market. The first auction in April 1993 cleared at a price that was well below most of the previous trades, and the second auction a year later did so again. While some observers doubted the performance of the auctions at the time, within weeks of the second auction the price for trades in the market fell to the level observed in the auction and since then the auction has tracked the market, and vice versa, very closely (Ellerman, Joskow, Schmalensee, Montero, & Bailey, 2000; Holt, Shobe, Burtraw, Palmer, & Goeree, 2007).
L-17

15
of the true recipients of this value or the magnitude of the value being distributed. The assignment of value raised through an auction is likely to be more accessible to observers because it would involve a direct transfer of dollar value.
Opportunities for Reduced Tax System Costs Another important attraction of auctioning is that auction revenues can be used to finance
cuts in existing taxes or to avoid future tax increases. This can lower the costs of the tax system and thereby reduce the overall cost of cap and trade. The government could use auction revenue to reduce existing income or sales taxes. Although these taxes help finance important government expenditures, they are widely believed to inhibit economic efficiency. Economists estimate that the efficiency improvements from a reduction in pre-existing income (labor and capital) taxes would raise private-sector income by 20 – 100% more than the tax reduction itself. As a result, using auction revenues to lower pre-existing taxes on labor and capital can substantially lower the net cost of a cap-and-trade program compared to an approach that distributes allowances for free (Parry & Oates, 2000; Sanstad & Wolff, 2000; Parry, Williams, & Goulder, 1999).
Easier Treatment of New Entrants A system in which all compliance entities must obtain allowances through an auction also
eliminates the need to adjust the allocation scheme to deal with sources entering and exiting the market. New entrants would see the same cost as their competitors when entering the market, and exiting entities would no longer need to purchase allowances.
Other Two additional arguments in favor of auctioning are often made. These arguments deserve
careful qualification. One argument is that auctioning is preferable to free allocation because auctioning will reward firms that have already reduced their emissions through investment in cleaner fuels or lower carbon technologies; such firms will have to purchase fewer allowances compared to firms that have not made these investments. In contrast, free allocation may fail to reward the more innovative firms. In fact, it could offer more allowances to firms that have relatively high emissions intensities compared with the competition. This is actually an argument against a particular form of free allocation; namely, freely allocating allowances simply according to historical emissions levels. Allowances need not be freely allocated on this basis. As discussed below, many existing cap-and-trade programs with free allocation are designed to avoid rewarding firms that have failed to make earlier investments in cleaner production methods.
A second argument is that auctioning provides a better signal of firms’ true costs of abatement than does free allocation. When allowances are introduced through a competitive auction, the market price of allowances indicates the costs that firms bear, at the margin, to reduce emissions.12 In contrast, under certain forms of free allocation—namely, those with updating of allocation over time—this may not be the case (see discussion in subsection 2.3.2).
12 This will be the case when the auction is competitive. An auction is more likely to be competitive when it has a large number of participants. When there are few participants, some bidders can gain strategic advantages by misrepresenting their willingness to pay for allowances.
L-18

16
2.3 Alternative Methods of Free Allocation
In fact many types of free allocation are possible. Each variant has attractions and drawbacks relative to the others. The EAAC examines these specific forms of free allocations in this subsection.
One may distinguish two main categories of free allocation. Under fixed free allocation, the allowances given are not adjusted in response to current or future behavior. Under contingent or updated free allocation, the allowances offered adjust over time in response to behavior and market conditions.
2.3.1 Fixed Allocation
Fixed allocation establishes the distribution of allowances in ways that are independent of the actions of consumers or firms with compliance responsibilities within the cap-and-trade program. The grandfathering approach is a special case of fixed allocation. Under grandfathering, the allocation is based on a metric such as the emissions or activity levels of firms or sectors during a previous baseline period. To be truly fixed, the baseline period must precede the date when the cap-and-trade program and the allocation were anticipated by those eligible to receive allowances.
An attraction of fixed allocation relative to updated allocation is that it tends to avoid unproductive changes in the abatement decisions of firms. A system in which firms alter behavior in order to influence future allocations is likely to lead to additional costs for the program overall and various other unintended consequences (Åhman, Burtraw, Kruger, & Zetterberg, 2007; Åhman & Holmgren, 2006).13 Fixed free allocation tends to avoid this problem; firms will recognize that they cannot affect their future allotments by changing their current behavior, and thus they have no incentive to change behavior to influence these allotments. As a result, a fixed allocation scheme has traditionally been viewed as the most economically efficient form of free allocation, at least with regard to the costs of complying with the emissions cap.
Fixed allocation draws criticism, however, because it is perceived to be unfair. Under a strictly fixed allocation scheme, the number of allowances a firm receives does not depend on whether it continues its operations. This is the case under the U.S. sulfur dioxide emissions trading program, where firms continue to receive allowances even if they close their facilities. Also, the particular case of grandfathered allowances is sometimes viewed as inequitable on the grounds that it “rewards” the largest emitters with the largest allocations. Others have argued that free allocation leads to unfair windfalls to firms that receive the free allowances. Studies indicate that windfalls are in fact likely if firms receive very large shares of the cap-and-trade program’s overall allowances. However, if a modest fraction of the total allowances are awarded free, windfalls need not occur.
Finally, fixed allocation is sometimes criticized as being unnecessarily rigid. Fixed allocation can tie the hands of regulators as they may be unable to respond to unexpected outcomes in the market by revising previously pledged allocations of free allowances.14 In the face
13 For example, the European Union’s Emissions Trading Scheme included adjustments to allocations to accommodate new sources or sources that retired. These features gave incentives that changed the investment ordering, and in some cases caused coal-fired generation to be favored over natural gas.
14 This issue was one of the ones identified by the DC Circuit Court when it vacated and subsequently remanded to the Environmental Protection Agency the Clean Air Interstate Rule because the rule would affect the allocation of SO2 emissions allowances that had been set in statute using a fixed “grandfathering” approach (North Carolina v. EPA, 2008).
L-19

17
of these criticisms, many existing allowance-trading programs employ some form of updating of the rules used for the allocation of emissions allowances.
2.3.2 Updated Allocation
Under updated free allocation, regulators revise the allocations in response to economic or allowance market conditions. The entry and exit of facilities is sometimes treated as the basis for updating. The closure of a plant could be a basis for forfeiting future allocations, while the construction of a new plant could trigger a new allocation. Although this practice may have intuitive appeal, it creates inefficiencies because firms alter their behavior in order to influence future allocations, thereby distorting methods and levels of production away from the cost-minimizing outcome (Åhman, Burtraw, Kruger, & Zetterberg, 2007).15 Nonetheless, updating has two attributes that many find appealing. One attribute that has political appeal is that an updating free allocation may lead to a smaller change in the product prices than would fixed free allocation (or auctioning). A second is that updating allocation can help reduce emissions leakage from the program.
Output-based Updating
A typical approach to updating is to base allocations in a future period on the level of production of a plant in the current period. This approach is usually called output-based updating.16 In the electricity context, for example, this means each firm receives an allocation proportional to the electricity it generates, measured in megawatt-hours (MWh), while holding the overall emissions cap intact.17 A main insight from recent research is that output-based updating is in effect a production subsidy: firms are rewarded, in the form of valuable allowances, for each additional unit of output (Jensen & Rasmussend, 2000; Fischer, 2003 ; Fischer & Fox, 2007). The subsidy reduces the variable cost of production and thereby induces firms to increase output relative to the level that they would choose under fixed allocation or allocation via auction. The reduced variable costs and higher output also tends to keep product prices of these firms from rising as much as they would under other forms of allocation. While the containment of price increases may seem attractive, this dampening of the price signal results in fewer reductions in emissions associated with these products and thus necessitates greater reductions and higher price increases in other sectors in order to meet the overall emissions cap. This induced change in the distribution of abatement efforts leads to higher economy-wide costs than would apply if the price signal were not dampened.
One possible justification for output-based updating is to address emissions leakage. As previously mentioned, introducing environmental regulation in one jurisdiction can cause emissions increases in other jurisdictions that offset the decreases in the original jurisdiction. This will be tend to be important in industries in which two conditions hold: they use relatively more
15 Åhman, Burtraw, Kruger, & Zetterberg (2007) show that removing allocations to sources that close or granting allocations to new sources can alter investment incentives in a way that increases the profitability of relatively less efficient (dirtier) sources.
16 An alternative approach would base future allocation on the current emissions of a facility, called emissions-based updating. A similar approach is input-based updating, which would base future allocation on the current input of energy at a facility. It is similar to emissions-based updating because in the absence of post-combustion controls to remove CO2 from the emissions of a facility, the energy input and fuel type will determine its emissions. The obvious criticism of emissions-based allocation is that it rewards firms for producing the very thing that the regulation is trying to reduce.
17 When dealing with industries other than electricity, some proposals call for “value added” as a financial measurement alternative to physical units of output.
L-20

18
energy in production (“energy intensive”) and they are exposed to unregulated competition in their export or import markets (“trade exposed”).18 However, energy intensity and trade exposure do not always imply potential leakage: other factors may apply.19
Output-based updating is not the only way to address potential leakage. As previously mentioned in subsection 2.2.1, the state can adopt some form of border adjustment to help keep the economic field level between California firms and out-of-state firms, and thereby help avoid emissions leakage. Two main options for border adjustment deserve consideration:
A first-deliverer approach to emissions embodied in imported fuels and products. Under this approach, the emissions associated with especially greenhouse-gas-intensive goods imported into California would be covered under the state’s cap-and-trade program in the same manner as emissions generated from in-state covered sectors.20
Border taxes on imported goods. This would involve levies at the border so that imported goods face the same change in costs associated with their embodied CO2 emissions as goods produced in California.21 This can be applied in a straight-forward manner for liquid fuels by accounting for imported refined products at the terminal rack, and imported natural gas either at the facility level (for large point sources taking their deliveries directly from interstate pipelines) or by regulating natural gas local distribution companies. An attraction of this approach is that it would maintain the price signal reflecting the scarcity value of CO2 emissions under the cap-and-trade program, at least with respect to imported goods. One should note that identifying the emissions associated with production of some goods could be difficult, especially where there is a supply chain that involves many inputs from various sources.
Leakage can also be associated with exports. California’s climate policy could raise costs for California firms that export goods to other states. This could cause these firms to lose market share in the broader market. As a result, their emissions may decline. At the same time, out-of-state emissions are likely to rise as the out-of-state competitors absorb a larger share of the market. Hence, there is leakage. This problem can be countered by providing exporters with output-based free allowances to help them lower their variable costs and maintain market share.
Benchmarking Benchmarking is an updating approach based on specific engineering or technological
criteria. It aims to encourage best-practice emissions rates for given entities. Benchmarking can be used within an output-based allocation approach to address differences among industries, technologies or fuels. Under the benchmarking approach, the regulator establishes a baseline
18 Under the American Clean Energy and Security Act (2009), the Administrator of the U.S. Environmental Protection Agency would be responsible for developing a list of industries to be classified as energy intensive and trade exposed. Under this Act, these industries would receive output-based free allowances in an effort to reduce international emissions leakage.
19 In a market that imports products, local producers can enjoy a cost advantage due to transportation or other costs. In these circumstances increasing CO2 regulation may raise local costs, but not enough to make imports cheaper than local production. In this case, local producers will experience lower profits but still maintain their local production as imports would still be a more expensive source. 20
The first-deliverer approach has been recommended in the ARB Scoping Plan for regulation of the electricity sector. It would assign responsibility for compliance to the entity that first delivers electricity to the California grid. Hence, it is intended to treat in-state and out-of-state generation sources in a comparable manner. 21 At the international level, a border correction is more likely to be found to violate World Trade Organization rules than updated output-based allocation, according to most observers. However, the test for California with respect to goods produced in other states would be the Commerce Clause established by the U.S. Supreme Court.
L-21
19
emissions rate for an industry (e.g., cement) or process (e.g., coal-fired electricity generation) and awards allowances to all facilities in that industry according to the “benchmark” GHG content of their output.22 The joint California Public Utilities Commission (CPUC) and California Energy Commission (CEC) recommended a form of benchmarking in supporting a different rate for output-based allocation for coal-fired and gas-fired power plants (California Public Utilities Commission, 2008).23
Simulation research indicates that benchmarking may not be as effective at mitigating leakage in electricity generation in California as output-based updating (Bushnell & Chen, 2009). This results because emission rates for electricity generation from outside the state are greater than for generation inside the state. Differentiating the allocation among sources according to fuel use reduces the allowance-based advantage to maintain generation inside the state.24
2.4 Alternative Auction Designs
Many types of auctions are in use today; they can be tailored to match the circumstances of specific goods or the needs of sellers and buyers. An important lesson from the economic literature on auctions is that one size does not fit all, but rather auctions should be designed for specific situations (Binmore & Klemperer, 2002).25 Therefore, the selection of an auction design for a cap-and-trade program should be based on attributes of an allowance market. Among the most important aspects of this context is recognition that the auction will distribute not just a single item (as in an art auction) but multiple items (allowances). In addition, the allowances are identical goods (each emissions allowance with a common vintage is of equal value).
2.4.1 Criteria for Choosing among Auction Designs
Several considerations are relevant to the choice of auction design. First, it is important to consider the administrative costs for the state and transaction costs for the bidders. Second, the auction should be transparent and easily understood by participants, including compliance entities with no prior involvement with auctions. Third, the auction should not be susceptible to attempts to manipulate the auction price (although there is no empirical evidence for manipulation in previous allowance auctions). Fourth, the auction’s design (such as inclusion of a reserve price) may help minimize price volatility in the auction and the secondary market. Fifth, the design should be compatible with existing electricity and energy markets.
Another relevant consideration is the ability to minimize uncertainty. As described above, the values are common to all who purchase them. Anyone who buys an allowance could resell it at
22 Sometimes the benchmarking approach resembles an intensity (performance) standard whereby changes in aggregate emissions vary with the level of economic activity. The benchmark emissions rate can be adjusted over time to achieve the aggregate emissions target, or else other regulated sectors not subject to a benchmarking allocation would be required to achieve emissions reductions at a level that balances with the cap.
23 The joint decision recommended that if the ARB does not eliminate allocation to deliverers by 2016, then the allocation should move to pure output-based allocation by 2020.
24 This result is mitigated somewhat by existing state legislation (Perata, 2006) that prohibits new long-term contracts for electricity supply from uncontrolled coal-fired power plants. Hence, the net effect of differentiating by fuel would be to account for existing power-purchase agreements with coal-fired power plants, rather than to provide an incentive for new investment.
25 There is an expansive economic literature applying analytical, empirical and experimental methods that can inform the design of an auction. In addition to collective experience with auctions generally, over the last couple of decades there has been experience with auctions for emissions allowances in particular that provides the basis for designing a potential auction in California.
L-22
20
the market price in a secondary market. There is initial uncertainty as to what the value of an allowance will eventually be, which is the precondition for what is known as the “winner’s curse,” where the highest bidders are usually the ones with the most extreme estimates of future allowance values. However, an active secondary market causes uncertainty and the risk of the winner’s curse to nearly vanish. Some authors have asserted that in the presence of uncertainty, a multi-round auction where bidders can adjust their estimates of allowance values in response to the actions of other bidders is an appropriate design.26 However, there is no empirical literature that finds that a multi-round auction actually does better than a sealed bid auction in avoiding the winner’s curse, and multi-round auctions may raise the possibility for collusion in the auction.27
2.4.2 The Alternatives
There are four general auction design choices that determine how the clearing price is determined and the auction outcome is achieved. These four choices are defined by two main features. One choice is between a single round (sealed bid) or multiple round (multi-round) auction wherein participants can revise their bids. Multi-round auctions are sometimes called clock auctions because the bid price moves up or down like the hands on a clock until supply equals demand. The second choice is whether bidders pay the amount they individually bid, called a “discriminating price” auction, or if all bidders pay the same “uniform price.”
One can find examples of each type of auction in practice. A uniform price, sealed bid auction is used in the Regional Greenhouse Gas Initiative cap-and-trade program that regulates CO2 emissions from the electricity sector in ten northeastern states. Nearly 90% of the emissions allowances are distributed through an auction. A discriminating price, sealed bid auction is used for allocating a small portion of the allowances under the Acid Rain Program. A uniform price multi-round auction was used by the State of Virginia to auction its emissions allowances in the NOx Budget Trading Program in the eastern U.S. A discriminatory price multi-round auction is used by the Federal Communications Commission to distribute licenses for broadcast rights.
Among these types, the uniform price, sealed bid auction is the simplest design and the easiest to understand. It is easy to develop a bidding strategy for this design and the operations and outcome of the auction are transparent to participants and observers. It also conveys a sense of transparency about the overall operation of the market. This makes it an accessible auction institution for participants, non-experts and the public. These attributes can be expected to help build public trust in the allowance market. In the absence of other compelling arguments, the uniform price, sealed bid auction type seems a reasonable choice.
One other important aspect of how the auction will function concerns the role of sellers other than the government. A double (two-sided) auction provides for buyers and sellers to bid into the auction. The Acid Rain Program auction includes this feature. This could be especially valuable if the state were to distribute allowances for free to local governments, other organizations, or directly to households, who then could liquidate their holdings through the auction.
2.4.3 Other Features of the Auction
26 The intuition is that when bidders are allowed to adjust their estimates of allowance values in response to the bidding behavior of others, they have less fear of the winner’s curse and are less likely to “shave” their bids downward, and also that the auction price more closely resembles the true market value (Milgrom, 1989).
27 The intuition is that a multi-round platform gives participants a better chance to coordinate bids (Burtraw, Goeree, Holt, Myers, Palmer, & Shobe, 2009).
L-23

21
In addition to the two main choices that identify the way that the market clearing price is determined in the auction, there are a number of other subordinate features that should be considered, including:
Frequency of the auction (e.g., quarterly)
Allowance vintages to be auctioned (e.g., current year and/or future year vintages)
Use of a reserve price (a minimum price in the auction)
Auction platform (where the auction will occur and who will run it)
Eligibility rules and financial prequalification
Passive bid provisions for small entities so they can be guaranteed a small quantity at the market clearing price
Market monitoring and oversight (to ensure against auction manipulation)
Disclosure of beneficial interests by bidders
Limitations on acquisition by single parties
Information from the auction to be revealed to the public
There is ample experience to draw on for choosing the design of these features. In addition to a voluminous literature and the on-the-ground experience in other jurisdictions, various authors have recommended the use of laboratory experiments to “stress test” the auction design to examine its performance according to criteria that are identified as important. In a laboratory setting, often the unexpected will occur. With a modest reward, participants can be motivated to search earnestly for ways to profit by taking advantage of the auction design, and they are likely to identify vulnerabilities in the design if there are any. Second, conducting laboratory experiments forces the precise definition of many features of the auction and related rules. This will help the agency finalize its plan for the operation of the auction.
Finally, in all previous emissions allowance auctions in the U.S., a third-party vendor has successfully run auctions on behalf of federal or state agencies at low cost. This is a sound approach for the state to consider. The state could run a bidding process to select a vendor to manage the auction.
L-24

22
3 Total Allowance Value 3.1 General Issues 3.1.1 Significance of Total Allowance Value and Its Changes Through Time
It is important to assess the likely magnitude of total allowance value as this influences how this value might be used. Some uses will have higher priority than others and depending on total allowance value certain lower-priority uses may or may not be advisable. As indicated below, total allowance value is likely to increase over time. This suggests an emphasis on higher priority uses in the shorter term, with additional, lower-priority uses over the longer term.
3.1.2 What Determines Allowance Value?
Figure 1 offers a stylized representation of California’s marginal costs of reducing emissions. This is a marginal abatement cost (MAC) curve. It represents the change in abatement costs associated with each additional unit reduction in emissions. Marginal abatement costs increase as emissions are reduced. The vertical line (e1) is the aggregate emissions cap. The aggregate value of allowances is determined by the quantity of emissions that are enabled (e1) and the price of allowances (p), where the latter depends on the marginal costs of abatement at the emissions quantity e1.
Figure 1
Figure 1 helps identify the information needed to estimate the allowance value that would become available by introducing a price on CO2. In particular, one would need estimates of the marginal costs of abatement associated with the cap-and-trade program’s cap for particular years. This would give the price of allowances in each year. One would then apply this price to the level of “residual” emissions (e1) expected each year to obtain total allowance value.
As indicated in Figure 1, allowance value is the product of two factors, the quantity of emissions allowances introduced in the system and their price. The allowance quantity is a policy
p
MAC
Allowance Value
Total Abatement Costs
e1 e0 Aggregate
Emissions
Aggregate Cap
L-25

23
choice representing the state’s commitment to achieving emissions targets over a specific time schedule. The allowance price depends on the emissions target and the cost (at the margin) of reducing emissions from their business-as-usual level to achieve that target. As discussed below, for the first couple of decades of a program in California the value of emissions allowances (the rectangle in the figure) can be expected to increase in real terms as the overall cap becomes more stringent.
The marginal cost of reducing emissions or, equivalently, the allowance price, is influenced by a range of factors, including the design of the emissions market. Subsection 3.2 describes factors that influence the marginal cost of achieving emissions reductions in the short run and in the long run. The discussion includes attention to policy variables that have a strong bearing on the cost of emissions reductions. The EAAC uses this information to report a range of probable allowance values, based on information available to the committee, and an estimate of the value of allowances that would be available for the state to direct to various purposes.
3.2 Factors Determining Abatement Costs 3.2.1 Technological and Behavioral Factors
The marginal costs of reducing (or abating) emissions depend on technological, behavioral, and policy-related factors. Compliance entities and consumers are likely to make a variety of adjustments to reduce emissions. The marginal abatement costs depend on the ease with which these adjustments can be made.
Fuel Substitution and Opportunities for Process Change Firms can reduce emissions by substituting low-GHG fuels for other fuels, or by
undertaking other changes in the methods of production. In the short run, opportunities for fuel substitution may be limited because of the type of production capital in place; however, in the long run the opportunities can be considerable.
Consider in particular the incentives for fuel substitution among fossil-fired power plants. With a price of zero on CO2 emissions, coal plants have lower marginal costs than natural gas plants, but as the price on CO2 increases, the marginal cost for coal increases faster than for natural gas because coal has roughly twice the emissions per kilowatt-hour of generation.
Table 1 illustrates the “flipping point CO2 price” (expressed in terms of dollars per million British thermal units of fuel input at a plant) at which substitution of natural gas-fired generation for coal-fired generation at existing plants would occur.28 For example, if natural gas were trading at $5 per million British thermal units (mmBTU) and coal were trading for $2.25 per mmBTU, an allowance price of $49 would equate the marginal cost of coal and natural gas generation. In other words, the allowance price would have to be $49 before there would be an important reduction in emissions achieved through fuel switching in the short run in the electricity sector.
28 The example pertains to plants operating at heat rates of 11.1 and 11.3 for coal and natural gas plants, respectively. These represent the average heat rates for coal and natural gas plants within the western region.
L-26

24
Table 1
Allowance Prices at Which Utilities Can Switch from Coal to Natural Gas
Natural Gas Price ($/mmBTUs)
Co
al P
rice
($
/mm
BTU
) $2.00 $2.50 $3.00 $3.50 $4.00 $4.50 $5.00 $5.50 $6.00 $6.50 $7.00
$1.50 $11 $21 $31 $41 $51 $61 $72 $82 $92 $102 $112
$1.75 $6 $16 $26 $36 $46 $56 $67 $77 $87 $97 $107
$2.00 $1 $11 $21 $31 $41 $51 $62 $72 $82 $92 $102
$2.25 $(4) $6 $16 $26 $36 $46 $57 $67 $77 $87 $97
$2.50 $(9) $1 $11 $21 $31 $41 $52 $62 $72 $82 $92
$2.75 $(14) $(4) $6 $16 $26 $36 $47 $57 $67 $77 $87
$3.00 $(19) $(9) $1 $11 $21 $32 $42 $52 $62 $72 $82
Reduced Output Another way to reduce emissions is to reduce the output of the good being produced.
Pricing GHGs will increase the prices consumers pay for greenhouse gas-intensive products. These higher prices will elicit a reduction in the quantity demanded for these products, leading to a reduction in greenhouse gas emissions.
The extent of output reduction will vary with time. In the short run, for electricity consumers, these reductions represent changes in consumer behavior such as increasing thermostat settings during the summer or switching to compact fluorescent lighting. Reductions in natural gas demand may come from reducing thermostat settings in the winter or adjusting hot water heater temperatures. Behavioral changes that reduce gasoline demand include reductions in vehicle miles traveled through carpooling, trip collection, and better engine and tire maintenance.
If greenhouse gas reductions only came from demand reductions in the short run, allowance prices would be high. For example, allowance prices would have to be roughly $115 per ton of CO2e to reduce electricity consumption, and thus greenhouse gas emissions from the electricity sector, by 15%. Even higher allowance prices would be required to reduce gasoline and natural gas consumption by 15%.29
What portfolio of responses is likely to occur in the short run? The EAAC conducts a simple back-of-the-envelope calculation allowing for both reductions in consumption within the electricity, natural gas and transportation fuels sectors and fuel switching in electricity generation. This suggests an allowance price of roughly $70 is required to achieve a 15% reduction in GHGs in the short run, before capital adjustments can occur.
29 Dahl (1993) summarizes the short-run elasticities for a variety of energy-intensive products, reflecting the percentage reduction in demand for a one percent increase in price. Dahl finds that the elasticity for electricity and natural gas is roughly 0.20, while the elasticity for gasoline is 0.26.
L-27

25
Capital adjustments that lead to larger reductions in output in response to increased prices may begin quickly. Over the medium term of 2 to 10 years, consumers have the ability to identify and use substitutes. Consumer adjustments might include replacing inefficient air conditioners, hot water heaters or automobiles.
Developing New Technologies Over the long term, capital adjustments can occur in the electricity supply technology and
other production activities. Pricing GHG emissions introduces incentives for firms to invest more in research and development in GHG reducing technologies. Absent a price on emissions, advances in GHG-reducing technologies must rely on “piggybacking” off cost-reducing advances that also reduce GHGs. For example, automobile firms have an incentive to invest in energy efficiency because consumers value fuel efficiency. These advances also reduce GHG emissions, but without pricing GHGs, firms and consumers have too little of an incentive to invest in energy efficiency. This suggests that rates of technological progress are likely to increase under a cap-and-trade program.30 Also, over the longer-term, demand side improvements such as improved building shells and changes in land use patterns are likely to emerge. These changes are expected to achieve greater emissions reductions at a given CO2 price, and to help bring down the price.
3.3 Policy Factors that Influence Allowance Prices
The most substantial factor affecting the allowance price is the stringency of the cap. However, other policy factors also can influence the allowance price, either by altering production incentives or by establishing links in abatement costs across regions or across time. The EAAC discusses these factors here.
Free Allocation with Output-Based Updating As discussed in Section 2, the way that emissions allowances are initially distributed is a
key policy variable that can have an important effect on the price of allowances. In particular, output-based updated free allocation tends to increase the allowance price compared to fixed free allocation or auctioning. This form of free allocation implicitly subsidizes output and thereby leads to a higher demand for allowances and higher allowance prices.31
Linkage with Larger CO2 Markets There is a significant likelihood that a California cap-and-trade program will be connected
in some way with a broader, regional market or with other established GHG allowance markets. One of California’s stated goals is to link with other jurisdictions as part of the Western Climate Initiative (California Air Resources Board, 2008). If California’s program is linked with other
30 A number of papers find evidence that higher energy prices lead to greater rates of technological change. For example, Newell, Jaffe, and Stavins (1999) find that higher electricity prices increase the rate of technological change in the energy efficiency for air conditioners. Using patent counts as a proxy for technological change, Popp (2002) finds these effects in a broader context. See Popp, Newell, and Jaffe (2009) for a review of the literature. 31 For similar reasons, emissions-based (as opposed to output-based) updated free allocation also leads to higher allowance prices.
L-28

26
systems, the price of allowances will reflect marginal abatement costs not only in California but in the entire system. Linking various systems introduces more opportunities to exploit especially low-cost abatement opportunities through trades in allowances across regions.
Availability (and Price) of CO2 Offsets In many CO2 markets, firms have the option to comply with the cap through the purchase
of carbon “offsets” from industries or regions beyond the scope of the cap-and-trade program. Usually this involves paying firms to take actions that reduce carbon emissions from their activities, or sequester CO2 from the atmosphere. The exact cost and availability of offsets will largely depend upon the criteria established for California’s allowance trading system. The stringency of the certification process for offsets, their ultimate availability, and their price will determine the extent to which they can influence the overall price of allowances.
To the extent that sufficient offsets are available and allowed by the rules for compliance, their price can form an upper bound on the allowance price. If the cost of direct mitigation rises above the cost of offsets, firms will utilize the offsets as their compliance strategy. If the amount of offsets allowed for compliance is limited, and this limit is binding, then offset prices would no longer establish an upper bound on allowance prices. The ARB’s Scoping Plan proposes an offset quantity limit of no more than 49% of emissions reductions.
Banking and Borrowing Provisions Banking and borrowing provisions introduce flexibility as to the timing of when
allowances are used. A banking provision enables firms to use a current-year allowance for compliance in some future year. A borrowing provision enables a firm to use a future-year allowance to comply in the present.
These provisions give firms more options as to the number of allowances they will use in any given period of time. As a result, the provisions impact the time profile of allowance prices. The prices in any given year will still reflect the marginal cost of emissions reduction in each period, but because the number of allowances used will change, so will the extent of abatement, the abatement costs, and the allowance prices.
Firms are likely to bank or borrow allowances in order to minimize the net present value of compliance. Other things being equal, the opportunity for banking and borrowing will lead to smooth changes in allowance prices over time.32 These provisions can be expected to alter the time profile of allowance prices. Increased stringency of the overall cap on emissions could imply a rising allowance price through time. Provisions for the banking of allowances can reduce the rate of increase in allowance prices, relative to the situation in which there are no such provisions.33
The Scoping Plan allows for unlimited banking and implicitly allows for borrowing within a three-year “compliance period.” However, some important considerations could limit the use of
32 If markets are competitive and banking and/or borrowing is allowed and utilized, then the value of an emissions allowance is expected to increase at the same rate over time as the opportunity cost of capital to the private sector. If it were to differ from that rate, for example if allowance prices grew faster than this rate, then investors would take money out of other investments and buy allowances causing the price of allowances to adjust accordingly.
33 If firms expect future allowance prices to be very high, they may wish to bank some current allowances so that they can sell the allowances at a high price in the future, or avoid the need to purchase as many high-priced allowances at that time. This reduces quantity supplied for trades in the near term, and increases the supply in the long term. In turn, this flattens the time profile by raising near-term allowance prices and lowering longer-term prices.
L-29

27
banking. A firm that chooses to bank a California allowance will have to consider the possibility that a California program may not exist in 2020, or may look very different. In particular, the prospect of federal legislation pre-empting California’s emissions market at some point over the next decade could limit the expected future value of California allowances.34
Impacts of Complementary Policies Under AB 32, allowance trading is only one element of a broad set of policies aimed at
reducing CO2 emissions. To the extent that mandated options would have been chosen under the allowance trading system even without the mandate, they will not impact the allowance price. However, if some mandated options have a marginal cost greater than the allowance price, they would not have been prompted by the cap-and-trade program. In this case, the mandated option will reduce the amount of emissions reduction that has to be achieved by other mechanisms that are selected by the market, and hence they will lower the allowance price.
Leakage Another important factor to consider in predicting an allowance price is the extent to
which “compliance” will be obtained through emissions leakage and economic activity to outside the state. When leakage stems from increased consumption of imported fuels or goods, there is less production by California-based firms. This implies a lower demand by firms for emissions allowances, which in turn implies lower allowance prices. Stemming this leakage therefore tends to put upward pressure on allowance prices. While this impact on allowance prices might seem unfortunate, it is not a compelling reason to ignore leakage. Addressing leakage is crucial to achieving AB 32’s environmental goals.
3.4 Range of Allowance Prices and Values 3.4.1 Allowance Price Range
Nature of Uncertainties Thus, a large number of factors influence the allowance price. The technological and
behavioral factors include the ease of substitution by firms to low-GHG methods of production, the extent to which consumers shift to low-GHG products in response to changes in relative prices, and the pace of technological progress. A number of policy factors also apply. These include the stringency of the overall cap and the nature of complementary policies. Other important policy factors include extent of output-based updated free allocation, linkages with other markets, CO2 offsets, provisions for allowance banking and borrowing, and leakage.
Given the uncertainties about the nature of these factors, it is impossible to predict with precision the time profile of allowance prices. The best one can do is to estimate time profiles based on reasonable estimates of technological opportunities and behavioral responses under various plausible policy scenarios. Several studies have reported an estimated allowance price for compliance with a cap-and-trade program under various scenarios that vary assumptions about coverage of the cap, underlying technological progress, emissions trajectory beyond 2020, banking
34 Although there are provisions in the currently proposed federal bills that would compensate firms for the value of banked state allowances, these provisions are ambiguous.
L-30

28
of allowances, availability of offsets, and methods of allocation. This brief summary describes several recent studies.
Estimates from Recent Studies The ARB’s Scoping Plan (California Air Resources Board, 2008) provides a comprehensive
approach for reducing state GHG emissions to the target level defined in AB 32. The Scoping Plan proposes a cap-and-trade program, coordinated with the WCI program, along with a broad set of complementary policies, such as a 33% renewable portfolio standard (RPS), designed to reduce emissions from specific sources. Using the Environmental Dynamic Revenue Assessment Model (E-DRAM), the ARB estimated the economic impacts of the Scoping Plan as a whole. This model does not include allowance banking or offsets. For the cap-and-trade program, the modeling results reflect a 2020 allowance price of $10 (in 2007 dollars) per metric ton. Despite this low allowance price, some of the complementary policies are expected to cost much more than this in order to achieve their emission reductions. In fact, the 33% RPS is estimated to have a cost of $133 (2007 dollars) per metric ton. This analysis did not incorporate a link to the WCI partner jurisdictions.
The WCI analysis (Western Climate Initiative, 2008) was performed using the ENERGY2020 model and covered eight of the 11 WCI partner jurisdictions. All of the cases examined include allowance banking and some complementary policies, but they also include different scopes of coverage, treatments of offsets, and energy prices. In these different cases, the allowance price in 2020 varies from $18 to $71 (2007 dollars) per metric ton. The narrower scope of coverage significantly increases the allowance price, as does prohibiting the use of offsets. The WCI analysis is currently being updated to incorporate all 11 partner jurisdictions and updated assumptions regarding economic growth, complementary policies and other factors.
The Electric Power Research Institute study (Electric Power Research Institute, 2007), prepared with Charles River Associates, used the Multi-Region National-North American Electricity and Environment Model (MRN-NEEM) to analyze several different policies and targets for emission reductions, none of which allowed for banking of allowances or the use of offsets. All of these policies achieved the target of reducing emissions to 1990 levels by 2020, but the reduction path following this date varies from no additional reductions to 80% below the 1990 level by 2050. Under these different scenarios, the allowance price in 2020 ranged from approximately $60 to $100 (2007 dollars) per metric ton. Another scenario also included a safety valve that allowed additional emissions if allowance prices reached a certain level. This scenario also resulted in an allowance price of about $60 (2007 dollars) per metric ton, but it did not achieve the same emission reductions. The documentation for this study does not specify if the model included complementary policies or if a link to the larger WCI region was considered.
David Roland-Holst’s analysis (Climate Action Team Economics Subgroup, 2007) used the Berkeley Energy and Resources (BEAR) model to examine a wide range of policies to achieve the necessary emission reductions by 2020. All of the cases modeled prohibit allowance banking and the use of offsets, but they do include all of the complementary policies proposed by the ARB. The cases differ based on the effectiveness of these complementary policies, the sectors covered by the cap-and-trade policy, and the level of technological innovation to reduce the cost of energy efficiency. This wide range of cases results in an allowance price in 2020 varying from $8 to $213 (2007 dollars) per metric ton. A more narrow scope of coverage and less effective complementary policies both increase the allowance price, while efficiency innovation reduces the price. The documentation for this study does not specify if the model included a link to the larger WCI region.
Researchers at Resources for the Future used the Haiku electricity model to analyze how different cap-and-trade policies would affect the electricity sector and what the resulting
L-31

29
allowance price would be (Palmer, Burtraw, & Paul, 2009). To do this, they estimated the expected contribution from the electricity sector within an economy-wide cap-and-trade policy, which is an emission reduction of 30% from the baseline in 2020. They modeled policies for both California and the larger WCI, and allocated allowances through both an auction and electricity local distribution companies. This model assumed no allowance banking or offsets, but it did include a 20% RPS in California and first-deliverer compliance for imported electricity. These different scenarios yielded an allowance price of $21 to $127 (2007 dollars) per metric ton in 2020.
Table 2 summarizes these studies and the scenarios they modeled, including information on different model assumptions and the allowance prices in 2020. These studies indicate that allowance values in 2020 could extend over a wide range, depending on critical features of the program design.
L-32

30
Table 2
Estimated Allowance Prices from Various Models under Different Policy Scenarios
Author Region
Scenarios Additional Policies Allowance Price in
20201
CARB (EDRAM) California Scoping Plan Vehicle standards, 20% RPS, etc. $10
WCI (ENERGY 2020) WCI Stationary Sources
Limited amount of offsets, banking allowed, current RPSs
$71
WCI Economy-wide $24 WCI Economy-wide – High Energy
Prices $18
WCI Economy-wide – Low Energy Prices
$56
WCI Economy-wide – High Natural Gas Prices
$20
WCI Economy-wide – No Offsets No offsets $63
Electric Power Research Institute (MRN-NEEM) California Binding Reductions2 No offsets, no banking $60 - $103 California Safety Valve3 Safety valve4 $60
Roland-Holst (BEAR) California Economy-wide5
No banking, no offsets, all CARB policies
$23 - $214 California 20% Cap-and-Trade6 $23 - $179 California 20% with Efficiency
Innovation6 $8 - $161
Palmer et al. (Haiku - electricity sector only)7 California Auction
20% RPS, no offsets, no banking, first-deliverer compliance
$58 California Local Distribution Company
(LDC) Allocation $127
WCI Auction $21 WCI LDC Allocation $26
Notes 1. All prices are in 2007$/metric ton CO2e. ARB and MRN-NEEM do not specify year for dollars, so
we assume their dollars are for the year preceding the year in which the study was released - 2007$ for CARB and 2006$ for CRA.
2. Multiple scenarios that meet the goal of 1990-level emissions in 2020 but vary for 2020-2050 (no reduction from 1990 emissions to 80% reduction from 1990 emissions by 2050).
3. Values approximate because estimated from a figure. 4. Safety valve allows additional emissions and breaks the cap. 5. Economy-wide scenarios that vary in the effectiveness of complementary policies. 6. Sectors covered by the cap-and-trade policy vary. 7. Emissions targets for the electricity sector derived from the assumed contribution of the
electricity sector within an economy-wide policy, assuming a linear emission path to 2020, where emissions are 30% below the 2020 baseline (64 million short tons in 2020).
L-33

31
In a memo to the EAAC, the Cal/EPA and the ARB EAAC Policy Team (2009) summarized the assumptions and allowance prices of several studies by saying:
“All the studies . . . include numerous assumptions about program design, fuel prices, economic growth, complementary policies, technologies, and other factors. . . Nevertheless, despite the differences in approaches and assumptions used in the studies, the review of allowance price estimates shows that allowance prices are most often estimated to be in the range of roughly $20 to $60 per metric ton of emissions in 2020.”
Although the studies examined here have a larger range of prices, $8 to $214 (2007 dollars) per metric ton, due to some sensitivity analyses, the general conclusion is the same: allowance price is highly dependent on the specific parameters of the policy. Based on the studies summarized here, it appears allowance prices on the lower end of the range are due to the use of complementary policies to assist a cap-and-trade program in reducing emissions, the use of emission offsets, and the inclusion of California in a larger WCI-wide policy. The presence of allowance banking and the method of allowance allocation also have an impact on the allowance price.
3.4.2 Allowance Value Range
As mentioned, the allowance value in a cap-and-trade program ultimately hinges on two numbers, the quantity of emissions allowances introduced under the cap and the price of allowances. Table 3 provides an example of plausible allowance values based on a combination of an example emission budget and expected allowance prices.
The emission budget is calculated using a constant rate of emission decline for each of two program phases: 2012 – 2014 and 2015 – 2020. The sources covered in the first compliance period start at their projected emission level in 2012 and follow a linear emission trajectory so as to meet their expected contribution to the emission target in 2020. Beginning in 2015, when more sources are covered for the first time, a new rate of emission decline is assumed in order for all of the covered sources to reach the reduction target in 2020.
The expected range of allowance prices is based on the analysis of the Cal/EPA and the ARB EAAC Policy Team that finds a plausible range of allowance prices of $20 to $60 (2007 dollars) per metric ton in 2020. As an example, when the example budget is combined with an assumed allowance price of $35 (2007 dollars) per metric ton in 2020, this yields a total allowance value of $4.4 billion in 2012, $11.0 billion in 2016, and $12.8 billion 2020 (all in 2007 dollars).
It is important to recognize that the allowance value associated with AB 32 is very different from AB 32’s cost to the economy. Allowance value does not leave the economy: it remains in the economy either as freely offered (though valuable) allowances or as proceeds from an auction of allowances. It is not an economic cost. The net economic impact (positive or negative) of AB 32 depends on other factors: a principal factor is the extent to which the program causes improved or worsened productivity in the way goods and services are produced and consumed in the state. Estimates for the increase or decrease in personal income in 2020 are generally less than 1%, (Climate Action Team Economics Subgroup, 2007; California Air Resources Board, 2008), though sensitivity tests in one report found a decrease of up to 1.6% (Electric Power Research Institute, 2007). The same studies that predict that AB 32 will raise state income also indicate substantial allowance value.
As stated previously, the allowance price will be highly dependent on several policy factors, so the allowance value will also be dependent on these factors. The studies the EAAC reviewed previously indicate that inclusion of complementary policies, offsets, allowance banking,
L-34

32
and a link to WCI states and provinces, as well as allocating allowances through auction rather than to local distribution companies, all appear to yield lower allowance prices. Consequently, these factors will lead to allowance values closer to the lower end of the range shown in Table 3.
Table 3
Illustrative 2020 Allowance Prices and Total Value of Allowances
Year
Illustrative Budget (MMTCO2e)
Illustrative 2020 Allowance Price
$20.00 $35.00 $45.00 $60.00
Price ($/ton)
Value (mill.)
Price ($/ton)
Value (mill.)
Price ($/ton)
Value (mill.)
Price ($/ton)
Value (mill.)
2012 200 $12.54 $2,508 $21.96 $4,392 $28.23 $5,646 $37.65 $7,530
2013 195 $13.29 $2,592 $23.28 $4,540 $29.92 $5,834 $39.91 $7,782
2014 190 $14.09 $2,677 $24.68 $4,689 $31.72 $6,027 $42.30 $8,037
2015 405 $14.94 $6,051 $26.16 $10,595 $33.62 $13,616 $44.84 $18,160
2016 397 $15.84 $6,288 $27.73 $11,009 $35.64 $14,149 $47.53 $18,869
2017 389 $16.79 $6,531 $29.39 $11,433 $37.78 $14,696 $50.38 $19,598
2018 381 $17.80 $6,782 $31.15 $11,868 $40.05 $15,259 $53.40 $20,345
2019 373 $18.87 $7,039 $33.02 $12,316 $42.45 $15,834 $56.60 $21,112
2020 365 $20.00 $7,300 $35.00 $12,775 $45.00 $16,425 $60.00 $21,900
Budget: Illustrative California cap-and-trade program emission allowance budget in millions of metric tons of carbon dioxide equivalent (MMTCO2e).
Price: Illustrative emission allowance price in each year in dollars per metric ton. The price trajectory is computed assuming a 6% annual price increase, resulting in the 2020 price noted in the table.
Value: Illustrative allowance value in millions of dollars, equal to the allowance price times the allowance budget.
Values are in 2007 dollars. Source: (Cal/EPA and ARB EAAC Policy Team, 2009).
L-35

33
4 Making Use of Allowance Value: General Considerations 4.1 The Alternatives
Section 2 contrasted the two main mechanisms for distributing allowance value: free allocation and auctioning. This section and the one following it concentrate on the alternative purposes to which allowance value can be directed. This section distinguishes four general ways to use allowance value. The first two can be characterized as ways to spend allowance value while the second two can be viewed as ways of returning value to California citizens. 4.1.1 Prevention of Adverse Impacts
Allowance value can be employed to prevent adverse impacts that might otherwise occur to various parties as a result of the implementation of AB 32. This report focuses on methods for distributing and employing allowance value from a cap-and-trade program. However, in considering how allowance value might be used to prevent adverse impacts, it takes account of impacts that derive from the overall AB 32 effort, not simply the cap-and-trade component.
Climate policy will benefit individuals and businesses in many ways, especially by preventing serious environmental damages. At the same time, such policy could potentially place burdens on some households and firms. AB 32 is likely to raise fuel and energy prices, and these price increases will be reflected in higher prices of consumer goods. The higher prices can be especially burdensome to low-income households, for which purchases of energy-intensive goods and services represent an especially large share of the household budget. Climate policy also can negatively impact businesses, particularly businesses whose products are highly energy intensive and that have difficulty passing cost increases on to customers. The impacts on business costs and profits can prompt changes in employment. While climate policy yields new types of jobs and new opportunities for employment, it may cause distress by displacing some workers. AB 32 is likely to change the geographical pattern of emissions of greenhouse gases and local pollutants. Some have suggested that the initiative could in fact lead to an increase in emissions in certain areas. To the extent that this in fact happens, allowance value could be used to address adverse impacts on communities where such increases occur.
Considerations of fairness motivate prevention of adverse impacts. In addition, providing allowance value to energy intensive, trade-exposed industry would serve to reduce leakage.
4.1.2 Financing Investments and Other Public Expenditures
Allowance value can be used to finance government expenditures of various kinds. It can be used to help industry make adjustments to adopt cleaner production processes or to support private efforts to invent new technologies that involve lower emissions. It can also be used to finance other types of investment, including investments in education and job training, or in various community development projects. It can be used to finance expenditures dedicated to planning to reduce regional emissions, to environmental remediation, and to biological carbon sequestration. In addition, it can be used to finance adaptation projects, that is, projects to plan for and adapt to climate change.35
35 Climate change poses both immediate and long-term threats to California communities, natural resources and economic sectors. These changes can already be seen in the increased magnitude and frequency of events including heat waves, droughts and floods, increases in coastal sea levels and land erosion, declines in drinking and irrigation water
L-36
34
The support of new, cleaner technologies may be viewed as a matter of equity, since it helps avoid climate-related or other environmental assaults that current production activities might otherwise impose on current or future generations. For similar reasons, fairness considerations also support the use of allowance value to finance adaptation projects, or to remediate environmental problems in disadvantaged communities. Cost-effectiveness considerations may apply as well. Allowance value can be used to promote public efforts to overcome market barriers to the development of cost-effective new technologies.
4.1.3 Dividends to the Public
Another potential use of allowance value is to provide the general public a “dividend” related to the public’s having granted firms the right to make use of the waste-disposal services of the atmosphere through their emissions. Support for this use of allowance value stems from the idea that the climate-regulating services of the atmosphere are a common property resource. If the general public is viewed as having ownership of these climate-regulating services, then it might seem appropriate that the allowance value that stems from allowing emitters to have access to these services should flow back to the general public.36 In effect, this alternative corresponds to having emitters of greenhouse gases pay the general public for the right to have access to, or to disrupt, these services. This use of allowance value resembles using allowance value to compensate households for adverse impacts of climate policy. However, the basis for supplying allowance value as a dividend is different: in this case it is a payment for a service rendered rather than compensation for an adverse impact (such as higher consumer good prices).
4.1.4 Tax Rate Reduction
Allowance value can be used to finance reductions in current taxes or prevent future tax increases. To the extent that California’s treasury receives revenue from auctioning emissions allowances, the state will not need to rely as much on other taxes (such as income and sales taxes) to meet given expenditure needs.
Using allowance value to cut tax rates has attractions in terms of economic efficiency. Most existing taxes lead to inefficiencies by discouraging work effort, saving and investment. The inefficiency is expressed by the fact that the reduction in private-sector income from these taxes exceeds the amount of revenue that they bring in. By lowering the rates of existing taxes or preventing increases in future taxes, California would enjoy an efficiency gain: the increase in income to the private sector would exceed the avoided tax payments. Section 5.4 discusses this result in more detail.
4.2 Legal Issues
This subsection presents some important legal rules that bear on allowance distribution methods and allowance value allocation. These rules provide important context for the EAAC’s recommendations. However, as mentioned in the introduction, the existing rules do not necessarily constrain the EAAC’s recommendations. In arriving at its recommendations, the EAAC
supply and quality, increases in the severity and frequency of wildfires, loss of biodiversity, and impacts to other state natural resources.
36 Allowance value can also be conferred to the general public through income tax reductions, as discussed below. However, the benefits of an income tax reduction do not accrue equally per capita.
L-37

35
decided to consider broadly what seemed best for the state, recognizing the possibility that in some cases the most desirable allocation design might not fit within existing rules.
Figure 2
Legal and Political Issues Affecting the Collection and Use of Allowance Value
Figure 2 illustrates three alternative general scenarios for the use of allowance value and the legal issues surrounding them. In the first scenario, the allowance value is collected by the state (through an auction or other means) and subsequently disbursed to the general fund. This maximizes the ways that allowance value can be used. In this scenario, existing constitutional requirements (e.g., the Proposition 98 funding guarantee for education) would divert some allowance value, but the legislature could appropriate the remaining allowance value for a wide variety of other programs and purposes, including all of those identified in Section 4.1. While this approach provides the greatest flexibility, it also requires a supermajority two-thirds vote by the
Allowance
Value
Disbursement to General Fund
Disbursement for AB 32-related programs
Disbursement to affected consumers, and for GHG reduction programs
Requires supermajority legislative vote; some legal experts believes this falls to a simple majority if revenues are offset by tax reduction of equal amount
Subject to existing constitutional requirements and/or future legislative appropriation
No restrictions on disbursement of value by program or type.
Does not require legislative action to collect value but requires specific appropriation
Subject to “Sinclair” restrictions, i.e., 1) allowance value collected must be reasonably related to the costs of regulation; 2) program “nexus” required, i.e., must be directly related to the regulatory purpose, which is defined broadly in AB 32.
Requires free allowances to firms for the benefit of their customers, or free allowances to households, and subsequent auction by third party
Requires legislative action to ensure free allowances provided to non-regulated entities results in consumer benefit and/or GHG reduction programs.
L-38

36
legislature and subsequent approval by the governor. Some legal experts believe that only a simple majority vote is required when the allowance value is offset by a corresponding, revenue-neutral tax reduction.
This second scenario would face constraints imposed under a principle of California law known as the Sinclair rule, the name of a key California Supreme Court case. The Sinclair decision raises key legal distinctions between "taxes" and "fees" under California law, and imposes important constraints on state government's ability to assess regulatory fees. (See the related sidebar, entitled “Cap and Trade, Taxes vs. Fees, and the ‘Sinclair Issue.’”)
In the final scenario, the state could provide allowances freely to firms for the benefit of their customers, or directly to households, who will ultimately bear the cost of GHG controls. The regulation could stipulate that allowances have to be used for compliance or transferred to another party within a period of time to ensure market liquidity, or else they may be reassigned in a subsequent allocation. One option for the allowances to enter the market would be through an auction run by the state or a third party, in which both sellers and buyers could participate. The allowance value would be retained by the allowance sellers, so the direct allocation of allowances in this scenario could directly support a range of greenhouse gas reduction programs described in Section 4.1. If this approach were used to give allowances to non-regulated entities, a central drawback would be the current lack of authority to ensure they direct allowance value to consumers or to implement any GHG reduction programs. As such, this third case would require future legislative action if allowance value were returned to non-regulated entities, which would be legally complex and uncertain.
As noted, existing laws constrain the collection and use of allowance value. The EAAC did not limit its recommended policies to those allowed by existing legal rules. In some cases, the EAAC will recommend changes to existing rules in order to make possible some allocation designs that it considers beneficial to the state and serving the main objectives of AB 32.
The next section discusses in more detail the implications of using allowance value in each of these alternative ways. This will help guide the recommendations in Section 6 as to how to allocate allowance value across the alternative uses.
L-39

37
Cap-and-Trade, Taxes vs. Fees and the “Sinclair” Issue
One legal issue that has arisen with considerable frequency is whether and to what extent implementation of a cap-and-trade program under AB 32 is constrained by the so-called “Sinclair” issue.
Under California’s Constitution, a regulatory fee may be established or authorized by a simple majority vote of the legislature, while a new state tax “enacted for the purpose of increasing revenues” requires legislative approval by a two-thirds super-majority (California Constitution, Article XIIIa (3)) (California Constitution). The legislature approved AB 32 by a simple majority.
California courts have established specific rules limiting the creation of regulatory fee programs under state law. The key case is the California Supreme Court’s 1997 decision in Sinclair Paint Co. v. State Board of Equalization (1997).
Sinclair provides that, unlike taxes, regulatory fees can only be imposed in an amount reasonably related to benefits received or burdens created by the fee payer. To prove a particular regulatory fee is valid, the state must document (1) “the estimated costs of the service or regulatory activity, and (2) the basis for determining the manner in which the costs are apportioned, so that the charges allocated to a payor bear a fair or reasonable relationship to the payor’s burdens on or benefits from the regulatory activity” (Sinclair Paint Co. v. State Bd. Of Equalization, 1997, p. 878).
The purpose of the Sinclair test is to ensure that the amount of fees assessed and paid do not exceed “the reasonable cost of providing the protective services for which the fees [are] charged, or that the fees [are not] levied for unrelated revenue purposes” (Sinclair Paint Co. v. State Bd. Of Equalization, 1997, p. 881). It is not necessary to determine precisely how much of the program’s costs are attributable to each fee payer (California Assoc. of Prof. Scientists v. Dept. of Fish and Game, 2000). “Legislators [and agencies writing regulations] need only apply sound judgment and consider probabilities according to the best honest viewpoint of informed officials in determining the amount of the regulatory fee” (California Assoc. of Prof. Scientists v. Dept. of Fish and Game, 2000). The regulatory program being funded must have a connection to the fee payers beyond the program’s connection to the general public. The fee schedule must take into account the relative contribution of each class of fee payers to the burden addressed (Rider v. County of San Diego, 1991; Pennell v. City of San Jose, 1986).
One issue raised repeatedly by stakeholders in the course of the EAAC’s deliberations is whether the Sinclair rule limits the ARB’s development of a cap-and-trade program under AB 32 and, by extension, whether it should constrain the EAAC’s policy recommendations to the ARB on the parameters of a cap-and-trade system. For example, if all or a portion of carbon allocations are auctioned, would allocations required to be purchased by emitters be deemed regulatory “fees” under Sinclair? And if a portion of the revenue proceeds from such an auction were used to fund dividends or a general reduction in tax rates for California residents, would such a direction of those proceeds pass legal muster under Sinclair?
The EAAC did not attempt to resolve such legal issues under Sinclair beyond the general conclusions presented elsewhere in this report as to one policy option that seems likely to require supermajority approval by the legislature. Rather, the EAAC has formulated its policy recommendations without conducting detailed legal analysis under Sinclair, confident that the legal feasibility of these options as part of a future California cap-and-trade program will become clearer over time with further analysis by the ARB and its legal advisors, whether or not there are further actions by the legislature or the courts relevant to the issue.
L-40

38
5 Making Use of Allowance Value: Examining the Alternatives
5.1 Prevention of Adverse Impacts 5.1.1 Preventing Disproportionate Impacts on Low-Income Households AB 32 will cause California households to face higher prices both directly for electricity, natural gas, and gasoline, and indirectly as businesses pass costs for GHG reduction on to consumers. Table 4 offers estimates of cost increases to households in different income categories.
Table 4
Impact of Carbon Pricing on California Households by Income Decile and Expenditure Category
Income Decile
Income per
Capita ($)
Cost ($ per capita @ $20/metric ton CO2) Total
Cost per Capita
Total Cost (%)
Ele
ctri
city
Gas
olin
e
Nat
ura
l Gas
He
atin
g O
il
Oth
er
Exp
en
dit
ure
s
1 3788 15.55 28.19 9.9 1.35 24.28 79.27 2.09
2 6545 19.32 43.07 13.2 1.71 36.86 114.16 1.74
3 9062 21.88 53.81 15.39 1.94 47.53 140.54 1.55
4 11752 24.09 63.27 17.23 2.13 58.4 165.12 1.41
5 14841 26.22 72.29 18.95 2.31 70.42 190.19 1.28
6 18603 28.41 81.37 20.63 2.49 84.58 217.49 1.17
7 23494 30.81 90.92 22.39 2.68 102.42 249.22 1.06
8 30469 33.65 101.52 24.32 2.89 127.07 289.45 0.95
9 42186 37.44 114.25 26.67 3.15 167.06 348.58 0.83
10 72895 44.43 132.59 30.24 3.57 267.14 477.98 0.66
Mean 24889 28.18 78.13 19.89 2.42 98.57 227.2 1.27
Median 16616 27.32 76.83 19.79 2.4 77.5 203.84 1.23 Source: (Boyce & Riddle, 2009)
L-41

39
The results shown in Table 4 are based on analysis by Boyce and Riddle (2009), and indicate that higher prices resulting from placing a price on CO2 could have a regressive impact. As indicated in the far-right column, as a percentage of their incomes, lower-income households will face larger cost increases than upper-income households. This occurs because a larger fraction of the budget of lower-income households is spent on relatively carbon-intensive goods (such as household fuels), whereas upper-income households generally spend a larger fraction on other goods and services.
There are some factors that mitigate the effects illustrated in Table 4 with respect to the impact on the energy costs of low-income households. First, electricity and natural gas prices for customers of California’s large investor-owned utilities will be largely determined by the California Public Utilities Commission (CPUC). Current electricity rates are highly skewed to charge large users of electricity considerably higher prices than modest users. Second, low-income utility customers can also qualify for alternative lower rates under the California Alternative Energy Rate (CARE) and other related programs. Because of programs such as these, any price increases experienced by low-income and small consumers of electricity will be smaller than the average increase experienced by other customers.
Nonetheless, households will be affected through changes in gasoline and other energy prices and through changes in the price of goods and services that use energy in production. Many would argue that the overall economic impact on low-income households will be disproportionate. From a fairness standpoint, there is a case for preventing such an impact.
Various criteria for “disproportionate economic impact” are possible. In this report, the EAAC will regard an economic impact on low-income households as disproportionate if the percentage loss of real income for such households is greater than that of other household income groups. It is also important to make clear which households are to be considered in the low-income category. In this report the EAAC adopts the criterion used by the U.S. Department of Commerce, which designates a low-income household as one with income below 150% of the poverty line.
Some recent research by Kunkel and Kammen (2009) suggests that preventing a disproportionate impact would not require a significant fraction of the total allowance value. This study calculated the impact to California households of the increase in direct and indirect energy expenditures stemming from a cap-and-trade program. The estimates were performed under a range of assumptions about allowance prices, and assume that the quantity of allowances in circulation is approximately 25% above the 1990 level. It then considered how much allowance value need to be provided to the low-income households37 to prevent the percentage reduction in real income from being any higher than that of other households. Table 5 contains their results.
37 Specifically, the study considered the allowance value needed by the low-income household with median income in that household category, and scaled up the allowance value by the number of households in the category.
L-42

40
Table 5
Transfers Required to Avoid Disproportionate Economic Impacts on Low-Income Households
Allowance Price ($/metric ton CO2)
10 20 30 40 50
Full Electricity Cost Pass Through
Per-capita transfer required ($) 6 12 18 24 30
Total transfer required (million $) 58 120 170 230 290
Total transfer as fraction of total allowance value 0.016 0.016 0.016 0.016 0.016
No Electricity Cost Pass Through
Per-capita transfer required ($) 2.3 4.5 6.8 9.1 11
Total transfer required (million $) 22 43 65 86 110
Total transfer as fraction of total allowance value 0.0061 0.0061 0.0061 0.0061 0.0061
These results suggest that a very small percentage of allowance value is needed to prevent
a disproportionate impact stemming from allowance prices. It is important to recognize that these estimates do not account for the impact of other AB 32 measures such as the low carbon fuel standard or the renewable portfolio standard. However, even if these other measures were to double the impact on households, the overall impact would remain very small. Thus, there seems good reason to expect that, compared to the total allowance value generated, very little would be needed to prevent a disproportionate impact.
A disproportionate economic impact could be prevented in a number of ways. One is by using allowance value to finance targeted subsidies that prevent energy prices from rising for low-income households. This is discussed below in the context of electricity prices. A difficulty with the subsidy approach is that it reduces incentives for consumers to reduce energy consumption. As a result, in order to meet the overall AB 32 cap, greater reductions are required from other entities in the cap-and-trade program. This raises the overall cost of the cap-and-trade program. An alternative is to use allowance value to finance cash transfers. Such transfers could provide compensation without reducing incentives to conserve energy.
A precedent for monetary compensation is the American Clean Energy and Security Act (2009), passed by the U.S. House of Representatives in June 2009, which would allocate 15% of allowance value to relief for low-income households. Under this bill, eligible households (with incomes at or below 150% of the official poverty line) would receive a monthly refund via the Electronic Benefit Transfer (EBT) cards that states already use to deliver food stamps and other benefits, or via an increase in the Earned Income Tax Credit.
There are also other existing programs to assist low-income consumers, such as low-income energy efficiency programs, transit passes, rate assistance and commuter checks that could be used as vehicles for compensating disproportionately impacted consumers.
Note that the allocation of allowance value to dividends (see subsection 5.3) would reduce or eliminate the need for compensation to low-income consumers, as they stand to receive the largest net benefits (dividends minus costs from higher fuel prices) from a cap-and-dividend policy.
5.1.2 Mitigating Price Increases to Electricity Consumers
L-43

41
A main way that consumers can be affected is through changes in electricity prices. The magnitude of these changes would likely vary geographically across the state, reflecting differences in the types of fuels used for power generation. Some LDCs rely to a greater extent on high-emitting out-of-state generation sources because of previous investments or long-term power purchase agreements that lock in the purchase of this power for years into the future. Historically, these agreements have tended to deliver power to their customers at lower cost than would otherwise have been achieved. Figure 3 indicates electricity prices across 12 large distribution companies in California, where the size of the bubbles represents quantity of sales. The rates tend to be lower for the LDCs with the most GHG-intensive resource mix. The introduction of a price for CO2 could cause changes in electricity prices that vary geographically across the state and affect households in different ways. This is especially true in the near term before new sources of supply are identified and brought on line and additional investments in energy efficiency are realized.
Figure 3
Sources: (Energy Information Administration, 2007; California Climate Action Reserve).
Figure 4 illustrates the expected change in retail electricity prices that would result in 2020 from putting a price on CO2. This figure displays results for the five largest local distribution companies (LDCs), plus one aggregation of smaller municipal utilities and electric service providers in northern California and one aggregation of smaller municipal utilities and electric service providers in southern California. The figure was created using the GHG Calculator that E-3 developed to support the CPUC and CEC’s joint proceeding to provide recommendations to the ARB on policies to implement AB 32 for the electric sector. The figure displays a reference case
0
0.1
0.2
0.3
0.4
0.5
0.6
0.7
0.8
0.9
0.08 0.09 0.10 0.11 0.12 0.13 0.14 0.15 0.16 2007 System Average Rate ($/kWh)
Carbon Intensity Versus Average Retail Rate Twelve Large Local Distribution Companies
(Bubble Size Shows 2007 Sales (GWh))
SCE
SDG&E
PG&E
MID SMUD
LADWP
IID
TID
Pasadena
Anaheim
Burbank Glendale
Weighted
Sales Weighted Average
Sales
Average
200
5 C
arb
on
In
ten
sit
y (
me
tric
to
ns
/MW
h)
L-44

42
which is the forecast in the absence of climate policy. 38 The figure also includes the CPUC and CEC recommendation to expand energy efficiency programs and increase the renewable energy standard to 33% for all local distribution companies, which is represented as the Accelerated Policy Case (“2020 accel policy”). The other three labels denote the additional impact of placing a price on CO2, at three different price levels per metric ton. Each LDC region has two bars. The first represents the forecast without recycling of revenues from an allowance auction back to LDCs and used to reduce electricity prices; the second includes revenue recycling.
Figure 4 indicates that average retail rates for the publicly owned utilities are currently considerably lower than for the investor owned utilities. The combined effects of current and recommended energy efficiency and renewable energy programs may lead to increases in real rates for all retail providers between 2008 and 2020 (Bird, Cory, & Swezey, 2008; Federal Energy Regulatory Commission, 2009).39 Absolute cost increases are somewhat higher for the southern California municipal utilities and much greater in percentage terms.40 Figure 4
Average Retail Rates in 2008 and Projected Reference Case Rates in 2020 with Incremental Rate Impacts from Accelerated Policy Case, and Cap and Trade
with and without Revenue Recycling
Revenue recycling to LDCs would reduce the incremental rate impact of cap and trade,
especially for coal-dependent providers. Without revenue recycling average rates for the Los
38 In addition to continuation of existing energy efficiency programs at current levels and the 20% RPS, the 2020 reference case also includes non-policy effects such as projected changes in real fuel prices and transition and distribution infrastructure upgrades.
39 However, some recent studies suggest that expanded use of renewables could eventually cause a decrease in retail electricity prices (Binz, 2004).
40 The average rate impacts in Figure 4 mask the fact that for some customers the rates would be greater than marginal costs of electricity generation, even accounting for allowance costs. This is the result of rate design issues that address a number of other public policy goals.
0.00
0.05
0.10
0.15
0.20
0.25
PG&E n
o RR
PG&E w
/ RR
SCE n
o RR
SCE w
/ RR
SDG&E n
o RR
SDG&E w
/ RR
SM
UD n
o RR
SM
UD w
/ RR
LADW
P no
RR
LADW
P w/ R
R
NorC
al no R
R
NorC
al w/ R
R
SoC
al no R
R
SoC
al w/ R
R
Avg
Rate
2008
$/kW
h C&T @ $100/tonne
C&T @ $50/tonne
C&T @ $30/tonne
2020 accel policy
2020 reference
2008
L-45

43
Angeles Department of Water and Power (LADWP) remain slightly below those of the IOUs, even when the allowance price is $100. Average rates for the southern California municipal utilities rise to levels at or slightly above the IOUs’ average rates. In addition, one clear result is that the decision to accelerate the renewable goals has a larger impact than the incremental additional introduction of a cap-and-trade program.
Several approaches have been considered to soften or phase in the financial impact of higher electricity prices or bills.41 One approach would give allowances to electricity generators. As described in subsection 2.3.2, doing this based on an updated output-based measure of a generator’s share of electricity generation serves as a subsidy to production especially for sources that have cleaner than average emission rates. This subsidy may help to reduce the change in electricity prices.
Another approach involves using electricity LDCs as vehicles for channeling allowance value to consumers. LDCs are publicly-owned utilities, or private (investor-owned) utilities regulated by the CPUC. The LDCs would use this allowance value to offset increases in electricity rates and/or bills to consumers. Although most of the discussion of this approach focuses on the electricity sector, this approach could be applied more broadly. It could be extended to natural gas LDCs. Local government agencies and community-based organizations might also serve as trustees of allowance value if they delivered efficiency services. Both of these approaches are embodied in the CPUC/CEC Joint Decision Recommendation (California Public Utilities Commission, 2008) for allocation of emisisons allowances. The recommendation differentiates among fuel types, providing for updating output-based allocation at different rates for gas-fired generators and for coal-fired generators, and it recommends a four-year phase out of output-based allocation to generators in favor of allocation to LDCs. Allocations to LDCs would be apportioned initially on the basis of historic emissions, transitioning to a (kWh) sales basis by 2020.42 The rationales cited by the commissions for this approach include sheltering consumers from the overall impact of the rate increases expected to result from AB 32 and phasing in these increases, especially for the customers of LDCs that have a GHG-intensive resource mix and are forecast to experience the larger rate increases (California Public Utilities Commission, 2008, pp. 202 – 212).
As initially discussed in subsection 2.3.2, there are serious potential disadvantages to these approaches. Reducing the change in electricity prices has the unfortunate effect of encouraging electricity consumption. This would lead to greater emissions associated with electricity generation, resulting in a higher allowance price, which would affect other sectors of the economy. It is crucially important that the cap-and-trade program provide strong price signals to encourage the rapid replacement of inefficient capital, but these signals are lost if consumers do not observe changes in product prices.
A significant issue is the manner in which electricity prices might be reduced by way of LDCs. An electricity bill includes both a fixed charge (that does not depend on the total quantity consumed) and a variable (or marginal) charge (that increases with each additional unit of electricity consumed). If the LDCs finance cuts in the variable component, consumers will have incentives to increase consumption of electricity, as discussed above. In contrast, if the LDCs
41 In the discussion that follows the terms rates and prices refer to volumetric charges assessed on a per kWh basis while bills refers to the total monthly charge to customers, which also includes fixed charges.
42 In the first year, the allowance value given for free to the electricity sector would be based on the sector’s proportion of total historical emissions in a chosen baseline, and this distribution among the sectors would be reduced proportionally over time. In the first year, 80% of allowance value given away for free in the electricity sector would be directed to generators, and 20% would be auctioned with revenue given to LDCs. This ratio would change by 20% each year, culminating in 100% of allowance value directed to LDCs after four years. Allowances given to the LDCs on behalf of their customers would initially be distributed based upon each entity’s historical emissions in a baseline year, transitioning to distribution on a kWh sales basis by 2020.
L-46

44
finance cuts in the fixed charge, the situation could, in theory, be different. Economic theory indicates that well-informed, rational consumers should concentrate on the variable or marginal price in making consumption decisions. However, in fact, it is difficult for consumers to split out the fixed and variable components. Electricity bills are not organized in a way that separate the fixed portion from the variable portion, and it is not clearly evident that consumers actually distinguish the two components in making consumption decisions.43 This implies that cutting the fixed portion would not have any advantage over cutting the variable component. To help differentiate these components, some have suggested lump-sum payments back to customers in a separate envelope. It is not clear, however, why a lump-sum payment is better accomplished through the LDCs than through direct distribution of allowance value back to households as separate lump-sum payments. The latter approach may reach more individuals, have lower administrative costs, and make the program more transparent overall. These advantages need to be balanced against the advantages of free allocation to LDCs.
Third, customers in regions that already have reduced energy use should not be penalized for their efforts.44
5.1.3 Preventing Losses to Business Owners
Which Firms Are Affected Most? Some firms are likely to experience a reduction in profits as a result of AB 32. This burden
depends on the extent to which costs rise and the extent to which firms can pass cost increases forward to consumers. The increase in cost will be related to the energy-intensity of production, as well as the ease with which firms can switch to production processes involving lower energy intensity.
Some interested parties have suggested that allowance value should be provided mainly to compliance entities on the grounds that these entities will incur the bulk of the costs of regulation. However, the actual economic impact of a cap-and-trade program does not necessarily fall solely, or even primarily, on compliance entities. The burden of regulation can be shifted from a regulated entity forward to a firm’s industrial, commercial or residential customers; and it can be
43 For instance, recent evidence indicates models of consumer response that have been used in many previous studies of increasing-block pricing are not realistic models of the information consumers have at the time they make consumption decisions (Borenstein, 2009). 44 If there were to be an allocation of allowance value to LDCs, an important question is how that allowance value would be apportioned among LDCs. Three ways are possible: on the basis of population, consumption, or emissions embodied in energy use. The leading federal climate proposals (American Clean Energy and Security Act, 2009; Clean Energy Jobs and American Power Act, 2009) propose apportionment among electricity LDCs according to a formula that provides 50% weight on emissions in a historic base period and 50% weight on average consumption in 2006 – 2008 per customer multiplied by the current number of customers (updated). This formula has won widespread support from diverse interests in the electricity industry nationally, but it penalizes LDCs that implemented efficiency programs prior to the 2006 – 2008 base period. An improvement might be to include avoided energy consumption achieved through energy efficiency (“nega-watt hours”) to the consumption basis of the calculation.
L-47

45
shifted backward to the firm’s suppliers.45 Thus, it is not necessarily the case that compliance entities face the principal burden.46
The ability to pass forward the cost increases depends on supply and demand. The less responsive the demand is to a change in price, the greater the industry’s ability to pass cost changes on to consumers. The greater the responsiveness of supply is, the smaller the profit loss to the firm would be. The elasticity of supply is closely related to the ability of physical capital to be redirected to other uses. An industry with flexible capital can avoid the costs of the program by transferring its capital to other uses. Both of these characteristics imply that such firms would suffer less harm than firms with immobile capital and customers whose purchasing habits are sensitive to price increases from the cap-and-trade program. In addition, a firm with many options for abatement would incur lower costs, implying less cost for both consumers and producers.
Concerns have been expressed about the possible disproportionate impact of AB 32 on small businesses relative to larger businesses. However, there is little evidence to support a disproportionate impact on small business. In general, small businesses are not exceptionally energy intensive. In addition, compared with larger firms, small businesses are less subject to competition from outside of California (Weiss & Sarro, 2009). It seems reasonable to expect that the average business will respond by changing its energy consumption and passing increased costs on to the consumer. However, some small firms might have greater difficulties reducing energy consumption because of relatively limited access to investment capital.
Difficulty of Identifying and Compensating Affected Stockholders A challenge in compensating the owners of publicly-held firms is the difficulty of matching
the recipient and the person originally harmed. The harm to shareholders occurs when the market recognizes the new cost of a regulation and anticipates the change in profits that are likely to result, a process that is likely to have begun with the passage of AB 32 in 2006, if not long before. In the intervening period, shares in the firm change hands. The owners today are not the same persons who owned the firm in the past. Unless the market in 2006 anticipated free allocation, owners suffered a loss then that would not be directly compensated by the decision to direct free allocation to these firms today.
In addition, it is not clear that the state should compensate shareholders who suffer from the implementation of AB 32. It seems reasonable that owners of stock recognize the potential impact of future energy or environmental policies and bear that specific risk along with the other risks and rewards of equity ownership.
5.1.4 Preventing Emissions Leakage
Energy-intensive, trade-exposed industries could be significantly affected by the introduction of a price on CO2. Since energy represents a substantial share of their production inputs, in the absence of countervailing policy measures these industries would likely see a
45 The ability of regulated entities to shift the burden of regulation forward is primarily determined by whether entities are legally permitted to raise prices (e.g., regulated entities), and by the elasticity of demand (sensitivity of demand to a change in price) in the affected markets (e.g., the less that consumer demand changes in response to price increases, the more that covered entities can shift the burden of compliance to customers). The ability of regulated entities to shift the burden of regulation backward to suppliers is primarily determined by the market power of covered entities as input purchasers.
46 Studies of a potential U.S. cap-and-trade system suggest that regulated entities would absorb less than 20% of the burden of such policy (Goulder, Hafstead, & Dworsky, 2009; Smith, Ross, & Montgomery, 2002; Burtraw & Palmer, 2008).
L-48
46
relatively large increase in their costs of production. And since these industries are trade-exposed, as they raise prices to offset the cost increases they will lose market share to unregulated out-of-state competitors. This implies emissions leakage: the decrease in emissions generated by California-based firms (reflecting their loss of market share) is offset by an increase in emissions by out-of-state firms as the latter firms gain market share. Leakage undermines the environmental integrity of the program. In addition, it would negatively affect firms and employees in the state without environmental benefits, which would appear tremendously unfair.
Preventing leakage is crucial to achieving the environmental goals of AB 32. Subsection 2.3.2 outlined alternative mechanisms for addressing leakage: output-based free allocation of emissions allowances, a first-deliverer approach to emissions accounting and border taxes. The first of these approaches would require the use of allowance value (in the form of freely allocated allowances). It appears that relatively little allowance value (as a fraction of the economy’s total) would be needed under this mechanism to address leakage. Consider that the current design of the cap-and-trade program includes border adjustments for the electricity industry, which accounts for two thirds of allowances in the 2012 – 2014 phase. For several of the remaining industries, the additional cost of putting a price on CO2 emissions may not exceed the additional cost of importing competing products. Last, for those remaining industries whose costs would rise above those of imports, only a fraction of the total emissions from those industries need to be covered via emissions updating to mitigate leakage. After 2014, transportation fuels will come under the cap. This industry will be associated with about 35% of total emissions and allowances used under the program, and it could be vulnerable to leakage if imported fuels are not subject to a border adjustment on their CO2 content. However, if border adjustments are applied to the CO2 content of imported fuels, there is reason to believe the potential for leakage in gasoline production will be limited.47 Leakage in jet fuels is unlikely, but leakage in maritime bunker fuels and other refinery byproducts could be more significant.
5.1.5 Offering Transition Assistance to Displaced California Workers
47 Currently, nearly all gasoline fuel used in California is refined in California, in part because of the special fuel configuration required to meet California's environmental standards. Other potential sources of supply include the Pacific Northwest, which has limited potential, and the Gulf Coast, which does not make California gasoline at this time. International competition from countries such as Singapore and India is possible, but currently they account for less than 0.2% of west coast gasoline supply in the U.S. (U.S. Energy Information Agency, “U.S. Finished Motor Gasoline Imports;” U.S. Energy Information Agency, “West Coast (PADD 5) Product Supplied for Crude Oil and Petroleum Products”).
The market shares of current production can be a misleading indicator of the potential changes in imports when there is an important cost change, although measures based on current import levels have played a role in defining trade exposure in other contexts, such as the American Clean Energy and Security Act (2009). A more important consideration is the cost differential between imports and fuels produced in California. Increased product flow can result when the product price differential is sufficient to overcome the increased cost of transportation and blending to California specifications (Chevron Corporation, 2010). Although estimates of this cost differential vary, they appear to fall in the range of 10 cents to 25 cents/gallon (Chevron Corporation, 2010).
A full assessment of the potential for leakage should compare the product and transportation cost differentials with the additional costs imposed by GHG regulations. The additional costs on transportation fuels that are imposed by allowance trading will change as the program expands to include the CO2 content of the fuels themselves. During the first phase, allowances will be required for refinery emissions only. For example, if one assumes that refinery emissions account for up to one fifth of total life cycle emissions in gasoline, regulatory costs begin to exceed the product and transport cost differential when CO2 prices reach around $50/ton. After 2014, the risk of leakage will depend upon the treatment of the CO2 content of imported fuels. If there are no adjustments for these fuels, there is potential for leakage of production at much lower CO2 prices.
It is important to note that, in order to mitigate leakage, it would only be necessary to allocate allowances sufficient to bring domestic sources down to cost parity with imports. This would likely be only a fraction of overall emissions.
L-49

47
Fairness considerations suggest possibly using allowance value to fund worker transition assistance (WTA) for any California firms’ employees who might lose their jobs or their fulltime status due to the AB 32 greenhouse gas reduction program. The assistance would be designed to give these displaced workers the time and resources to carry out a job search and, if necessary, the training to find a new job in another industry.
A model for this type of program already exists. The federal Trade Adjustment Assistance (TAA) program provides such assistance to workers who lose their jobs or their fulltime status, either because the firm’s customers switched to foreign suppliers or because the firm relocated the production facility to a foreign location. The federal process appears to be simple, though in practice it can take a good deal of time. A brief review of the TAA process follows:
First, a group of affected workers, a union official, a representative of the local One Stop Career Center, or an officer of the company must file a two-page petition. The Department of Labor (DoL) and a local TAA coordinator (the local Workforce Investment Board or One Stop Career Center) will administer the petition.
The firm will be asked to provide pertinent information about its business and its customers. The firm’s customers may also be asked to provide information. The DoL will not certify the petition until after it receives satisfactory responses to its requests for information.
TAA benefits can include cash transition payments, job search assistance, relocation allowances and trade training.
A California agency housed in the California Workforce Development Agency could be established to determine eligibility. The ARB would provide specialized technical expertise as required.
5.1.6 Remediation of Adverse Environmental Impacts
Final candidates for consideration are the communities, if any, that experience adverse environmental impacts as a result of AB 32 implementation. This consideration receives support from AB 32 (California Health and Safety Code §38570(b)), which mandates that “to the extent feasible” the ARB shall consider “localized impacts in communities that are already adversely impacted by air pollution” and “design any market-based compliance mechanism to prevent any increase in the emissions of toxic air contaminants or criteria air pollutants.”
For the state as a whole, AB 32 will reduce not only GHG emissions but also various “co-pollutants” that result from the same processes that generate GHG emissions. Co-pollutants include reactive organic gases, carbon monoxide, nitrogen oxides, sulfur oxides and particulate matter. Although AB 32 will reduce aggregate emissions of CO2 and the associated co-pollutants, it is conceivable that without countervailing policy measures pollution burdens could increase in specific localities. For example, this result could occur if implementation leads to the substitution of in-state natural gas-generated electricity for out-of-state coal-generated electricity.
It is not possible for the ARB or the EAAC to ascertain in advance whether or to what extent AB 32 implementation will be accompanied by the emergence of “hot spots” where co-pollutant damages do in fact increase. Should this occur, however, such communities could have a claim for remediation.48
If the ARB finds increased co-pollutant burdens in some communities, a share of allowance value could be allocated for environmental remediation in these communities (with
48 The allowance value for such environmental remediation would be distinct from and additional to the allowance value for investment in disadvantaged communities, discussed in subsection 5.2.2.
L-50

48
commensurate reductions in the share of allowance value allocated to other uses). For example, the ARB could direct a portion of the allowance value to finance energy efficiency improvements in these areas. Since the extent of such claims cannot be known in advance, this can be regarded as a contingent use of allowance value.
5.2 Financing Investments and Other Public Expenditure
Some portion of allowance value can be used to finance investments or other expenditures that would reduce the overall cost to California of meeting the AB 32 emissions limits, as well as help achieve the other goals of AB 32. Investments could be put toward a number of different areas, such as existing GHG emission reduction programs; efforts to adapt to future climate change; research, development and deployment (RD&D) of new clean technologies; capital investments including new infrastructure; job training; and programs or projects centered on disadvantaged communities. Additionally, public expenditures could be used to help fund the efforts of state and local agencies to meet their legislated GHG mandates. This subsection first offers general rationales for devoting auction revenues toward investments or other public expenditure, and then examines key market barriers to achievement of AB 32 GHG reduction goals and investments that could be made to reduce those barriers. It then considers other potential public investments and the mechanisms or vehicles for funding those investments. 5.2.1 Rationale for Investments
Because of market barriers, the price signal introduced by cap and trade plus the complementary policies of AB 32 are not sufficient to trigger all of the cost-effective and socially beneficial investments or other public expenditures that could help achieve the environmental goals of AB 32. Allowance value could be used to finance these beneficial investments or expenditures. The Scoping Plan and McKinsey & Company report (McKinsey, 2007) on GHG reductions suggest that there are many cost-effective opportunities to reduce GHG emissions that remain untapped. Figures 5 and 6 show a spectrum of investment opportunities displayed in recent reports by Sweeney (2009)and McKinsey (2007). The fact that investors have not exploited many of these apparently low-cost (and, in some cases, negative-cost) options attests to the presence of market failures (Brown, Chandler, Lapsa, & Sovacool, Revised January, 2008; Golove & Eto, 1996; Economic and Technology Advancement Advisory Committee, 2009).
In addition to market barriers, externalities offer a second reason why markets may fail to bring about certain investments that are highly beneficial to society. Some investments yield significant external benefits in the form of environmental improvements, benefits not reflected in the private returns. While the external benefits associated with GHG emissions are addressed through the cap-and-trade provisions and complementary policies of AB 32, there remain other external benefits that are not. This provides an additional rationale for directing some allowance value toward certain investments.
Figures 5 and 6 provide useful information, but they are not a complete guide as to the relative cost-effectiveness of the options shown. This is because the measure of “cost” in these figures does not capture two types of information highly relevant to the overall potential gains from these investments.
First, while these figures capture the direct investment cost (e.g., the construction and maintenance costs of the investments), they do not include the cost of removing the applicable market barriers to these technologies. For example, if the market barrier is a mismatch between the incentives of the investor and that of the ultimate user of the new technology, the cost measure
L-51

49
does not capture the cost of aligning these incentives. Or if the market barrier is a lack of information, the cost measure does not indicate the cost of providing the necessary information. This omission tends to bias the cost estimate downward.
Second, the figures do not account for the external benefits associated with the investments. For example, they do not capture the environmental co-benefits stemming from reduced emissions of various local pollutants. Accounting for these benefits would add to the attractiveness of the investments displayed in the figures.
A more comprehensive measure of cost effectiveness would account for both of these types of information. In the measure of cost per ton of GHG reductions, the “cost” would be expanded to include the cost of removing the market barrier and would be reduced by the value of the external benefits. In many cases, these additional components would be difficult to quantify; in such cases a more qualitative assessment would seem appropriate. But the difficulty of quantifying the costs of removing the market failure, or the external benefits associated with the investment, does not seem to justify ignoring these elements.
Figure 5
Scoping Plan Marginal Abatement Cost Estimates
L-52

50
Figure 6
McKinsey’s “Mid-Range Case” U.S. Cost Curve
5.2.2 Potential Investments Energy Efficiency49 Energy efficiency is a low-cost emission reduction opportunity that faces numerous non-
price market barriers, including:50
Split incentives: The potential purchaser/owner of the energy efficient product often is not the consumer/user of the energy (e.g., landlords are in a position to buy more efficient air conditioning systems, but it is the tenants that pay the energy bill each month).51
49 The Scoping Plan estimates California will save 4.3 MMTCO2 by 2020 from commercial and residential energy efficiency (measure CR1; see Table 8), with savings of $109 per MTCO2. Note: this measure consists of natural gas reduction programs (800 million therms saved), utility energy efficiency programs, building and appliance standards, and additional efficiency and conservation; none of the measures deal specifically with residential energy efficiency. The Scoping Plan does not include mandatory provisions for industrial energy efficiency, so this is potentially ripe for investment.
50 See Appendix A for additional market barriers facing energy efficiency measures.
51 The American Council for an Energy Efficient Economy (ACEEE), for instance, found that split incentives (also referred to as the ‘principal-agent problem’) affect 40–90% of commercial leased office space energy use (American Council for an Energy Efficient Economy, 2007).
L-53

51
High upfront costs: Purchasers of energy efficient products can be dissuaded by their high upfront costs, coupled with a lack of access to capital and the “payback gap” (where potential buyers of efficiency demand a much shorter payback period than do potential builders of new fossil-fuel power plants) (Economic and Technology Advancement Advisory Committee, 2009).
Informational barriers: Potential purchasers of energy efficient products often lack knowledge about what energy efficiency options are available to them,52 how their life-cycle costs compare to less efficient options and how the different technologies are expected to perform.
Transaction costs: Time and effort are required to analyze alternative projects and install energy efficiency measures.
Estimates indicate that these sorts of market barriers cause consumers nationally to use at least 20 – 40% more electricity than they would in a well-functioning, cost-minimizing market (Cavanagh, 2004).
The ARB estimates that implementing the energy efficiency measures called for in the Scoping Plan saves $109 – $190 per ton (California Air Resources Board, 2008, Appendix G). Numerous other studies confirm the payback, both in cost savings, job creation, and environmental co-benefits, that investments in energy efficiency can bring. A recent UC Berkeley analysis, for example, found that California’s energy efficiency investments from 1972 to 2006 provided $56 billion in savings and created about 1.5 million fulltime equivalent jobs with a payroll of $45 billion (Roland-Holst, 2008).
California’s efficiency codes and standards for new buildings and appliances and utility energy efficiency programs have a long history of overcoming market barriers and achieving cost-effective energy efficiency. While the state’s desire is to capture all cost-effective energy opportunities, and utilities and agencies need to continue to expand their energy efficiency efforts to reach that goal, there may be an important role for additional efforts in this direction. Auction revenue could be used to supplement existing funding sources to expand efficiency efforts.
Research, Development, &Demonstration for New Low- and Zero-Carbon Technologies Private companies under-invest in RD&D for new low- and zero-carbon technologies for a
number of reasons (see Appendix A). Several studies suggest that obtaining funding is particularly difficult for projects in the development and demonstration phase.
Economists often refer to knowledge spillover as a main source of under-investment in R&D or innovation. That is, entrepreneurs under-invest because they cannot appropriate all of the social return from their efforts; some of the knowledge they generate spills over to and benefits other parties.
Allowance value could be channeled into programs and policies targeted at overcoming the market barriers impeding private investment in RD&D.53 In particular, allowance value could be deployed during the technology demonstration/pre-commercialization phase in a product’s life cycle, which ETAAC has identified as the critical stage for public financing (Economic and Technology Advancement Advisory Committee, 2008). Private investors may be less willing to
52 For example, small businesses generally have fewer resources with which to monitor government policy so are less aware of subsidies, financing schemes and other policies aimed at implementing clean energy technologies.
53 See Appendix A for list of existing institutions currently working on clean-tech RD&D.
L-54

52
invest in technologies as they advance from invention to commercialization because of the difficulty of managing market, regulatory and other risks (Brown, Chandler, Lapsa, & Sovacool, Revised January, 2008). At this point, when return on investment cannot be readily projected, additional funding is necessary to see if the technology has commercial promise.
Land Use Planning and Public Transit In some localities, zoning restrictions impede the market for innovative emission reduction
solutions associated with land use. The most urgent need is to fund regional and local governments to update their plans and zoning codes to meet the goals of the SB 375 (Steinberg, 2008) regional Sustainable Communities Strategies (SCS) requirement.
The long-time horizon for paybacks on land use changes make it difficult to motivate cities to take action. It also makes it all the more critical to make these changes during the early years in order to reap the full benefits, both in terms of quality of life for Californians and reductions in GHG emissions, over time.
Several analyses indicate that investing in land use planning is highly cost effective. The Sacramento Area Council of Governments, for example, spent $3 – $4 million on developing a long-term Regional Transportation Plan that is projected to save $16 billion in infrastructure and mitigation costs over the life of the plan, while preserving open space and reducing GHG emissions by 15% (Sacramento Area Council of Governments and Valley Vision). The McKinsey Curve (McKinsey, 2007) also found that reductions in vehicle miles traveled will save $90 per ton, while Moving Cooler, a publication of the Urban Land Institute, found that a bundle of land use and transit mitigation measures strategies achieve net savings of $532 per ton (Cambridge Systematics, 2009).
Expanding both the extent of public transit systems and the frequency and reliability of public transit is beneficial for meeting California’s climate goals. Public transit, like all aspects of our transportation system, does not rely entirely, or even significantly, on the private market.54 Recent state budget cuts and sharp declines in sales and property taxes have taken a severe toll on California’s transit agencies (Transportation for America, 2009). Despite increasing ridership, transit agencies are forced to cut service and raise fares, both of which dissuade transit riders and limit transit’s potential to address climate change.
Similarly, investing in land use planning and implementation of ARB-approved SB 375 Sustainable Communities Strategies (SCS) could allow local governments and municipal planning organizations to structure communities more efficiently; for example, by better integrating residential and commercial zoning to reduce the amount of driving necessary to access daily needs. Local plans sometimes block the market demand for high density, which would in turn lead to reduced GHG emissions and a variety of other benefits. Using allowance revenue to allow regions to create SCS plans and local governments to update their general plans and zoning to implement the SCS plans can remove these barriers and ensure that developers can create communities that reduce per capita transportation related GHG emissions. To ensure consistency in applying funds to implementing SB 375, such use of allowance value should be consistent with Strategic Growth Council guidelines and Regional Transportation Advisory Committee recommendations.
Job Training
54 The overwhelming majority of transit operating funding comes from local sales and parcel taxes (roughly 60%) and fare box revenues (roughly 20%). Federal grants make up some of the difference. The legislature recently completely eliminated the State Transit Assistance program, which also contributed to operations.
L-55

53
Job training can be justified as another type of investment financed by allowance value. Such an investment would help ensure the state has an adequate supply of trained workers to staff the new jobs opening up in the green economy.
More than 100,000 California workers were employed in the “green economy”55 in 2007, and the number of green jobs is expected to grow rapidly, boosted by federal stimulus spending and the new opportunities created by AB 32-related programs and regulations. It is important that the state’s workforce be prepared to take on the new green jobs when the openings arise; such timeliness will hasten reductions in the state’s greenhouse gas emissions.
Disadvantaged Communities AB 32 specifically directs the ARB to consider the needs of disadvantaged communities.56
These communities also frequently bear disproportionate air pollution impacts, and AB 32 specifically directs the ARB to maximize co-benefits of GHG emission reduction and complement state efforts to improve air quality.57 Allowance value could be used to assist disadvantaged communities. The identification of eligible communities can build upon the ARB’s work to develop measures of cumulative environmental impacts and community vulnerability.
Investment in disadvantaged communities is supported by environmental, efficiency and fairness criteria. From an environmental standpoint, substantial gains can be achieved by directing investment to areas that face disproportionate environmental burdens. From an efficiency standpoint, policies should aim to secure greater GHG reductions where the co-benefits from co-pollutant reductions are larger. From a fairness standpoint, policies should aim to generate economic opportunities and environmental improvements in communities that have been historically disadvantaged in both respects.
Financing Agencies to Ensure That They Can Fully Implement AB 32 Another way in which allowance value could be used to quickly capture low-cost reduction
opportunities is to ensure that state, regional and local agencies have the staff resources they need to effectively implement all of the reduction strategies described in the Scoping Plan. The Scoping Plan recognizes that there are many cost-effective opportunities to reduce GHG emissions, and lays out various regulatory strategies for capturing them. However, some of the agencies tasked with implementing these strategies might be understaffed, and auction revenue could ensure that they have the resources they need.
Investment in Adaptation
55 According to Next 10 (2009), the green economy consists of 15 segments ranging from energy generation, storage, and infrastructure to energy efficiency to specialized manufacturing, advanced materials, green building, and finance and investment.
56 For instance, AB 32 requires the ARB, to the extent feasible, to “direct public and private investment toward the most disadvantaged communities in California,” (California Health and Safety Code §38565); “ensure that activities undertaken to comply with the regulations do not disproportionately impact low-income communities,” (§38562(b)(2)); and consider “direct, indirect, and cumulative impacts from these mechanisms, including localized impacts in communities that are already adversely impacted by air pollution;” (§38750(b)(1)).
57 AB 32 requires the ARB to design GHG reduction measures in a manner that “maximizes additional environmental and economic co-benefits for California, and complements the state's efforts to improve air quality.” (California Health and Safety Code §38501(h)).
L-56
54
Climate change will affect all sectors of California. The California Resources Agency and eight other state departments spent almost a year compiling the California Climate Adaptation Strategy, providing the best available science and recommendations for state agencies to address climate change impacts to seven of the state’s sectors (agriculture, biodiversity, forestry, oceans and coastal, public health, water, and transportation and energy infrastructure). The report promoted planning to adapt to changes anticipated from climate change. For example, assuming a 55-inch rise in sea levels, the report identified nearly half a million people, $100 billion in property, and $46 billion in the coastal-dependent economy would be at risk (California Natural Resources Agency, 2009).
However, the relevant agencies lack the necessary funding to actually implement the report’s recommendations. Additionally, adaptive actions are needed from entities other than state departments or agencies, including local governments and communities, the private sector and individuals. Resources are needed to provide more localized science and modeling tools on impacts, sector-specific and cross-sector applied research, technology and innovations for solutions to mitigate impacts, tools for adaptation planning and ongoing learning, and the expertise required to analyze, develop, implement and/or monitor adaptive options. There is also a need to coordinate activities across state agencies as well as across sectors and regions within the state.
In addition to adaptation to climate change effects, allowance value could be invested in the provision of ecological services including biological carbon sequestration. This would provide a way to support agricultural, forestry and soil conservation practices that reduce net GHG emissions by removing CO2 from the atmosphere, without necessarily relying on offsets to fund these investments.
5.2.3 Vehicles for Supporting Investments
Community Benefits Funds
Allowance value can be provided to a Community Benefits Fund (CBF) or similarly purposed vehicle to support investments in disadvantaged communities, geographically defined on the basis of socioeconomic and environmental criteria. The CBF would channel funds to governmental and non-governmental entities to reduce emissions of GHGs and co-pollutants; minimize public health impacts caused by climate change; upgrade energy efficiency in schools, senior centers, and low-income housing; improve the quality and accessibility of public mass transit, including fare subsidies to commuters; engage in transportation and land use planning consistent with SB 375; and invest in other environmental improvements in disadvantaged communities.58
A CBF can bring social and economic benefits not only to the targeted disadvantaged
community but to society more broadly. It can catalyze investments in renewable energy and energy
efficiency technologies that yield broad and significant social returns (Wei, Patadia, & Kamman, 2010).
In addition, a variety of organizations focusing on low income and minority community empowerment
(e.g., The California Utilities Diversity Council and the Ella Baker Center for Human Rights) have found
that investments in job training and initial seed capital can benefit the wider community by boosting
economic activity and by reducing premature school-leaving and unemployment and the associated
social costs.
Local and Regional Government Entities
58 The establishment of a Community Benefits Fund is proposed in AB 1405 (de Leon, 2009), a bill currently before the California legislature.
L-57

55
Allowance value can also be channeled to local and regional government entities including
cities, counties, regional planning agencies, school districts and other special districts including water and sanitation districts. These entities are well positioned to advance locally focused efforts on land use plans that facilitate carbon sequestration and avoided emissions from forests and grasslands, public transit agency investments, supporting individual and local business investments in more efficient appliances and weatherization, improved structures, and distributed renewable energy projects. Local entities are a natural focus of efforts to direct investment to disadvantaged communities.
Local Distribution Companies Local retail distribution companies have established programs to encourage energy
efficiency, renewable energy generation, and energy research and development. Allowance values could be allotted to these companies to enhance their efforts.
Investment Tax Credits An investment tax credit (ITC) granted to firms that invest in new equipment that reduces
GHG emissions can be justified as an “investment” use proposed for the allowance value created by California’s cap-and-trade program.
By reducing the net after-tax capital costs incurred, the ITC would help all California businesses that utilize the credit to finance their investment in new technologies.
This would be especially helpful in situations where there are split incentives to make such investments. For example, the ITC would encourage owners of residential, commercial and industrial space to make their buildings more energy efficient even though their tenants stand to benefit through reduced energy bills.
Also, making an ITC available in the early years of the AB 32 regulatory regime would incentivize businesses to adopt the new technologies sooner than might otherwise be the case.
Traditionally, investment tax credits have been used to support investments in capital equipment. However, this instrument could be applied to support many of the other forms of investment discussed in this subsection.
Zero or Low Cost Loans
Access to zero or low cost loans could be another means to help California businesses and other organizations reduce their GHG emissions. Financing could be a stand-alone program or could complement an ITC by helping pay for the remaining cost of this equipment after the credit. Such a program could be particularly helpful for small businesses that may otherwise have difficulty accessing capital to make economic energy efficiency investments.
5.2.4 Evaluating Investment Alternatives
The ARB should work with other relevant agencies to develop a process for applying the criteria listed below to determine to which investments to allocate allowance value. The ARB
L-58

56
should also establish an independent Investment Advisory Board to assist in screening potential investments and vehicles for delivering those investments.
Cost-Effectiveness As discussed in subsection 5.2.1, to evaluate the various options in terms of cost-
effectiveness, the measure of (net) cost needs to be more comprehensive than what is sometimes applied. In addition to capturing the direct investment cost (the setup cost and present value of operating costs), it needs to account for the costs of removing the relevant market barriers as well as the various external benefits from the investment.
Fairness
In addition to considering the social net benefits in the aggregate, the ARB should consider investments warranted by justice considerations. For example, it is appropriate to assign extra weight to investment proposals that will help disadvantaged communities. AB 32 (see California Health and Safety Code §38562 (a)(2), 28565, and 38570(b)(1)) clearly aims to help these communities while reducing GHG emissions.
Environmental Effectiveness The ARB should take account for environmental co-benefits in prioritizing alternative
investments. In addition, it should consider the extent to which investments aimed at reducing emissions could lead to emissions leakage (policy-induced increases in emissions in other locations).
Simplicity, Transparency, and Accountability The ARB should aim to promote investments with clear elements and potential outcomes.
It should give priority to established programs that already have experienced staff and administrative mechanisms in place. It should also look for programs that have an educational and training component to ensure continued human capital to carry out cost-effective GHG reductions in the future. Because public support for any investments is important, the aforementioned Investment Advisory Board should operate in full public view and endeavor to make the bases for its recommendations transparent.
It is worth emphasizing that the investments promoted by the ARB and other California agencies should be those that the private market would not otherwise initiate. The focus is to help the private market perform in way that is most beneficial to the state.
5.3 Dividends to the Public
The return of carbon permit auction revenues to the public in the form of equal per capita dividends, sometimes called a “cap-and-dividend” policy, transfers allowance value to households, leaving decisions on the final use of the money to the public. The rationales advanced for this policy include:
The principle of common ownership of nature’s wealth: Cap-and-dividend is founded on the premise that the atmosphere is a common property resource. Hence, the rights to the
L-59

57
limited carbon storage capacity of the atmosphere, and hence to share in the “rent” (permit revenue) obtained from its use, belong equally to all.
Protection of household real incomes: Dividends help to shield household real incomes from the impact of higher fossil fuel prices that result from an emissions cap. The net effect (dividends minus price impacts) on any individual household varies—those with the smallest “carbon footprints” see the biggest gain—but all households receive a tangible payment that reminds them of the benefits of the policy, without negating the clear price incentive to reduce their consumption of fossil fuels.
The size of the dividend paid to each California resident would depend on the total allowance value and the percentage of allowance value allocated to dividends. Table 6 shows annual per capita dividends for the years 2012 – 2020 based on a 2020 allowance price of $40 per ton of CO2 (Section 3.4) with different percentages of total allowance value allocated to dividends. Dividends rise over these years (holding their percentage of allowance value constant); for example, with 60% of allowance value allocated to this use, the per capita dividend rises from $77 in 2012 to $207 in 2020.
Table 6
Dividend per Capita with Different Percentages of Allowance Value Allocated to Dividends,
2012 – 2020 (Section 3.5).
YYear
Estimated Allowance
Value (millions)
Projected Population (millions)
Percentage of Allowance Value Allocated to Dividends
100% 80% 60% 40% 20%
2012 $5,016 38.90 $129 $103 $77 $52 $26
2013 $5,184 39.32 $132 $105 $79 $53 $26
2014 $5,354 39.74 $135 $108 $81 $54 $27
2015 $12,102 40.16 $301 $241 $181 $121 $60
2016 $12,576 40.58 $310 $248 $186 $124 $62
2017 $13,062 41.00 $319 $255 $191 $127 $64
2018 $13,564 41.42 $328 $262 $197 $131 $66
2019 $14,078 41.83 $337 $269 $202 $135 $67
2020 $14,600 42.25 $346 $276 $207 $138 $69
There are several precedents for this approach. One is the Alaska Permanent Fund which recycles oil-extraction royalties to Alaska residents as equal per-person dividends. The Alaska fund affirms the principle of common ownership of nature’s wealth and demonstrates that it is feasible for state government to administer a dividend policy. A second is the American Clean Energy and Security Act (2009), which would establish a Climate Change Consumer Refund Account that would provide tax refunds on an equal per capita basis to each household in the United States (Section 789(a)). If the Act becomes law, disbursements are expected to amount to roughly 50% of allowance value from 2030 onwards.
In terms of environmental considerations, dividends forego other possible uses of allowance value that might be directed toward environmental improvement. From an efficiency
L-60
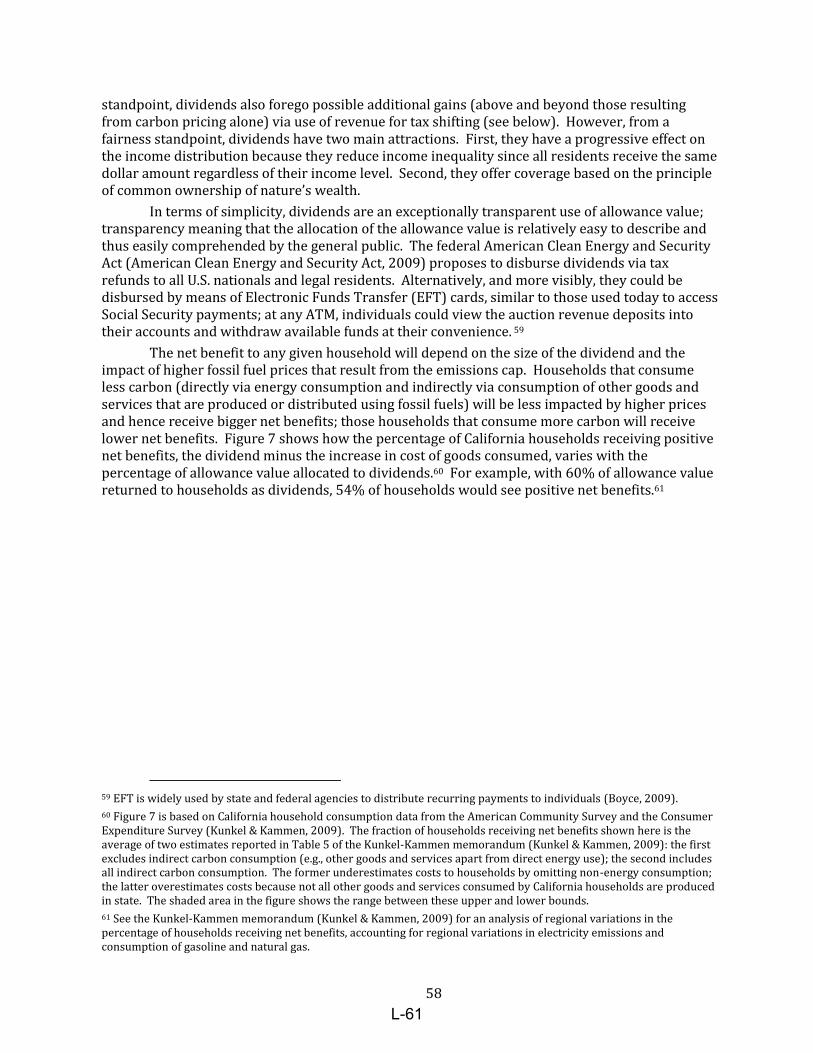
58
standpoint, dividends also forego possible additional gains (above and beyond those resulting from carbon pricing alone) via use of revenue for tax shifting (see below). However, from a fairness standpoint, dividends have two main attractions. First, they have a progressive effect on the income distribution because they reduce income inequality since all residents receive the same dollar amount regardless of their income level. Second, they offer coverage based on the principle of common ownership of nature’s wealth.
In terms of simplicity, dividends are an exceptionally transparent use of allowance value; transparency meaning that the allocation of the allowance value is relatively easy to describe and thus easily comprehended by the general public. The federal American Clean Energy and Security Act (American Clean Energy and Security Act, 2009) proposes to disburse dividends via tax refunds to all U.S. nationals and legal residents. Alternatively, and more visibly, they could be disbursed by means of Electronic Funds Transfer (EFT) cards, similar to those used today to access Social Security payments; at any ATM, individuals could view the auction revenue deposits into their accounts and withdraw available funds at their convenience. 59
The net benefit to any given household will depend on the size of the dividend and the impact of higher fossil fuel prices that result from the emissions cap. Households that consume less carbon (directly via energy consumption and indirectly via consumption of other goods and services that are produced or distributed using fossil fuels) will be less impacted by higher prices and hence receive bigger net benefits; those households that consume more carbon will receive lower net benefits. Figure 7 shows how the percentage of California households receiving positive net benefits, the dividend minus the increase in cost of goods consumed, varies with the percentage of allowance value allocated to dividends.60 For example, with 60% of allowance value returned to households as dividends, 54% of households would see positive net benefits.61
59 EFT is widely used by state and federal agencies to distribute recurring payments to individuals (Boyce, 2009).
60 Figure 7 is based on California household consumption data from the American Community Survey and the Consumer Expenditure Survey (Kunkel & Kammen, 2009). The fraction of households receiving net benefits shown here is the average of two estimates reported in Table 5 of the Kunkel-Kammen memorandum (Kunkel & Kammen, 2009): the first excludes indirect carbon consumption (e.g., other goods and services apart from direct energy use); the second includes all indirect carbon consumption. The former underestimates costs to households by omitting non-energy consumption; the latter overestimates costs because not all other goods and services consumed by California households are produced in state. The shaded area in the figure shows the range between these upper and lower bounds.
61 See the Kunkel-Kammen memorandum (Kunkel & Kammen, 2009) for an analysis of regional variations in the percentage of households receiving net benefits, accounting for regional variations in electricity emissions and consumption of gasoline and natural gas.
L-61

59
Figure 7
Percentage of California Households Receiving Net Benefits from Alternative Allocations to Dividends.
Source: (Kunkel & Kammen, 2009).
If dividends are taxable, a fraction of the allowance value distributed through this route ultimately returns to government. This revenue stream becomes available for other uses, including tax cuts or defraying the impact of higher fuel prices on government purchasing power.
5.4 Tax Rate Reduction
Another potential use of proceeds from an allowance auction is to finance cuts in existing California income or sales tax rates, or prevent future increases in such tax rates. This alternative effectively substitutes auction revenue for other taxes as a way of meeting the state’s spending needs.
Like the cap-and-dividend option previously described, this is a way to provide allowance value to households. However, while cap and dividend offers allowance value as a lump-sum payment, this approach offers such value through cuts in marginal tax rates.
A principal attraction of using auction revenue to cut marginal rates is the ability to lower the costs of a cap-and-trade program. Income and sales taxes lead to reduced production and incomes by reducing work incentives as well as incentives to save and invest. In economics vocabulary, these are “distortionary” taxes because they influence behavior in ways that are less productive or less beneficial to consumers overall. Distortionary taxes reduce the size of the overall economy (even after recycling the tax revenue or devoting the revenue toward public spending). The magnitude of the distortion increases with the tax rate. The impact on the economy (or “marginal excess burden”) from these taxes has been estimated to fall in the range of $.20 to $1.00, which means that for every extra dollar collected from these taxes, the loss of value created by the private sector (before returning the tax revenue) is between $1.20 and $2.00 (Browning, 1987; Jorgenson & Yun, 1991; Stuart, 1984). Using auction revenue to finance cuts in
0%
20%
40%
60%
80%
100%
10% 20% 30% 40% 50% 60% 70% 80% 90% 100%
Ho
use
ho
lds
Re
ceiv
ing
Ne
t B
en
efi
ts
Allowance Value Allocated to Dividends
L-62

60
the marginal rates of these existing taxes enables the state to avoid this excess burden. In effect, by using auction revenue to finance tax cuts, California relies on a non-distortionary source of revenue—the proceeds from allowance auction—as a substitute for distortionary taxes such as income and sales taxes.62,63
The cost savings under California’s cap-and-trade program could be substantial. This total saving is equal to the avoided excess burden, which is net reduction in collections from existing taxes times the marginal excess burden of those taxes. Subsection 3.4.2 Error! Reference source not found.offered estimates of total allowance value from an AB 32 cap-and-trade program. For the year 2015, the estimates ranged from $6 to $18 billion. Suppose that the auctioning of emissions allowances were to bring in net revenue of $10 billion. 64 Based on the estimates for marginal excess burden immediately above, devoting this net revenue to cuts in income tax rates would save between $2 billion and $10 billion in that year—a very large additional benefit to households over and above the benefit they would enjoy from the reductions in their income taxes.
These would be real savings in income to Californians.
In the context of the California economy, the savings could occur not only by lowering today’s taxes but by avoiding future increases in taxes. The Legislative Analyst’s Office and various other interested parties are currently discussing budget balancing measures that would increase marginal tax rates by extending recently enacted tax rate increases, suspending or eliminating recent tax rate cuts, and considering new taxes. Allowance value could be used to avoid some of these tax increases, thus avoiding the extra costs to Californians―costs that would be over and above the magnitude of the tax increases.
Using allowance value to finance tax reductions mainly serves cost-effectiveness objectives. On its own, or in its simplest form, it would not serve some other important goals. In particular, if allowance value were used to cut the rates of income taxes, then households that are already exempt from income taxes (perhaps because of very low incomes) would not benefit from the rate cuts. This raises equity concerns. However, not all allowance value needs to be devoted to income tax rate cuts. This approach does not preclude other uses of allowance value, including the targeting of some allowance value to compensate lower-income households, as discussed in subsection 5.1. A hybrid program in which allowance value is used both for tax-rate reduction and targeted compensation is an attractive way both to achieve considerable cost-savings while accomplishing fairness goals in a targeted way.65
Supporters of the previously discussed cap-and-dividend approach are attracted to the simplicity of that approach, which offers the same dividend to all households. The hybrid of tax cuts and targeted support to low-income households is less simple, but to supporters of the hybrid it has the advantage of flexibility. It offers two mechanisms—tax cuts and targeted
62 Another option, applicable in other settings, is to use auction proceeds to finance reductions in the deficit. Reducing the budget deficit implies lower future taxes because it leads to lower debt and lower interest payments that must be financed through future taxes. It therefore yields cost savings much as cuts in current tax rates do. However, since California law requires the state to balance its budget, the deficit-reduction issue does not apply here.
63 Many analysts have supported the idea of “green tax reform”—the substituting of environmental taxes such as carbon taxes or gasoline taxes for ordinary taxes such as income or sales taxes. Such reform causes the tax system to apply more to “bads” like pollution and less to “goods” like work effort, saving, or investment. Using auction proceeds is like green tax reform in that it changes the focus of government’s revenue collections, giving greater emphasis to pollution-related activities and less to ordinary taxes as sources of revenue.
64 Here the text refers to net revenue because the relevant value is gross auction revenue minus the change in tax revenue associated with changes in the tax base. To the extent that AB 32 reduces (increases) state income, the income tax base will fall (rise), and revenues from other taxes will fall (rise) as well.
65 Moreover, if allowance value is used to cut sales taxes, the impact is progressive as this amounts to reducing a regressive tax.
L-63

61
compensation—to address the two objectives of minimizing overall economic costs and addressing income-distributional concerns.
Some interested parties express doubts as to whether the state could be counted on to use the proceeds from an allowance auction to finance tax rate cuts. They may fear that the proceeds would be devoted to unproductive increases in government spending that otherwise would not occur. However, the state could explicitly commit to linking allowance proceeds to tax rate cuts. The Canadian province of British Columbia recently provided such linkage in requiring that the net proceeds from its recently passed carbon tax be devoted to income tax cuts, and it has followed through on its commitment.
L-64

62
6 Recommendations 6.1 Basis for the Recommendations 6.1.1 Criteria
This section presents the EAAC’s recommendations as to the method for allowance value distribution as well as the purposes to which such value is applied.
In arriving at its recommendations, the EAAC focused primarily on the four criteria listed in the introduction to this report, namely:
Cost effectiveness: achieving environmental targets at minimum cost.
Fairness: avoiding inequitable distribution of any adverse impacts of AB 32.
Environmental effectiveness: assuring that desired in-state emissions reductions are in fact achieved, and that they are not offset by policy-induced increases in other locations.
Simplicity: assuring that the policies introduced are transparent.
These four criteria encapsulate objectives and requirements throughout AB 32, among them to minimize costs and maximize benefits, including co-benefits and air quality (California Health and Safety Code §38501(h), §38562(b)(4 – 6), §38570(b)(2 – 3)); achieve maximum technologically feasible and cost-effective reductions (§38562(a)); “Design the regulations, including distribution of emissions allowances where appropriate, in a manner that is equitable, seeks to minimize costs and maximize the total benefits to California, and encourages early action to reduce greenhouse gas emissions,” (§38562(b)(1)); ensure no disproportionate impact on low-income communities (§38562(b)(2)); reward early voluntary reductions (§38562(b)(3)); minimize leakage (§38562(b)(8)); and direct public and private investment to the most disadvantaged communities and provide opportunities for community institutions (§38565).
6.1.2 Legal and Institutional Issues
In forming its recommendations, the EAAC took note of the existing California laws and institutional structures that might bear on the design of allocation elements of a cap-and-trade program. For example, it considered which agencies would have authority over the allocation of revenues from an allowance auction. This report has pointed out in various sections several of the relevant laws and institutional restrictions. However, in forming its recommendations, the EAAC decided to consider broadly what seemed best for the state, recognizing that in some cases the recommended actions would not fit within existing rules. In cases where implementing the recommendations would require changes in institutional or legal arrangements, the EAAC concluded that such changes were justified because they would enable California to achieve more effectively the goals of AB 32.
6.1.3 Issues of Scope
In considering how best to allocate emissions allowances, an important issue is how to prevent or redress adverse policy impacts. The EAAC viewed “policy impacts” as those that might arise from the entire suite of programs contained in AB 32, not simply those from its cap-and-trade component.
L-65

63
At the same time, in considering alternative designs, the EAAC restricted itself to features relating to the allocation features of a cap-and-trade program; that is, it considered only alternative mechanisms for distributing allowances and alternative ways to use the allowance value from the program. Hence it did not offer recommendations regarding other aspects of cap-and-trade design, such as the stringency of the cap, the sector coverage of the system, or the extent to which offsets could be utilized. Instead it explored how best to distribute and use allowance value, given these other features.
The introduction or design of regional or national cap-and-trade policies obviously lies beyond the EAAC’s purview. However, as mentioned in previous sections, the appropriate design of allowance distribution mechanisms and specifications for the use of allowance value depend critically on what is in place at the regional or national level. Given the uncertainties about how such programs will develop, it was important for the EAAC to consider alternative possible scenarios and offer recommendations for design that can adjust as circumstances change. Conditions at the regional or national level may change over time: a national program is not in place now, but might come into existence in a few years. California’s actions need to account for the possibility of such changes, as what makes sense in the near term may no longer be justified in the longer term.
6.2 Organization of the Recommendations
As indicated earlier in this report, there are two fundamental allocation dimensions that the ARB needs to address: the mechanism for distributing allowance value (free allocation versus auctioning) and the purposes or uses to which allowance value is directed. The recommendations below are organized into these two categories.
6.3 Allowance Distribution Method 1. The EAAC recommends that the ARB rely principally, and perhaps exclusively, on auctioning as
the method for distributing allowances.
As indicated in Section 2, auctioning has several attractions, including price discovery in the market and transparency in the assignment of allowance value. Auctioning is an especially transparent mechanism for allowance distribution, and it facilitates discovery of the actual costs associated with emissions abatement. In contrast with free provision, auctioning yields revenue and thereby can reduce the extent of the government’s reliance on ordinary taxes for financing expenditures; this can help reduce the overall costs of AB 32. Auctioning has the same potential as free allocation for achieving distributional or fairness objectives, since nearly every objective or conferral of allowance value sought through free allocation of allowances can be achieved through auctioning and the associated use of auction proceeds.
2. The EAAC recommends that the ARB employ free allocation only for the purpose of addressing emissions leakage associated with energy-intensive trade-exposed industries, and only in circumstances where the alternative of some form of border adjustment is not practical.
L-66
64
As discussed in Section 2, there are two main ways to address potential emissions leakage. One is through some form of border adjustment in which the emissions associated with imported fuels or other products are treated in a manner paralleling the treatment of in-state generated emissions.66 This eliminates incentives to escape the regulations through increased imports. The other way is the awarding of free, output-based allowances. As indicated in Section 2, border adjustments are a better approach because they do not promote inefficient increases in output. However, in some instances it will be difficult to obtain the information needed to introduce border adjustments effectively. In addition, in certain industries there may be legal constraints that restrict implementation of border adjustments. In those circumstances, free, output-based allocation appears appropriate.
The EAAC’s initial finding is that addressing leakage through free allocation would require a very small share of allowance value. The EAAC arrives at this conclusion based on three observations. First, the industries with both high energy-intensity and substantial trade-exposure represent a very small share of California production. Second, in many cases, border adjustments (a more cost-effective option) are feasible. Third, the problem of leakage—which provides the main potential basis for free allocation—would be substantially reduced with the arrival of a regional or national-level cap-and-trade policy.
3. The EAAC advises the ARB to adopt policy instruments that can be substantially modified or
eliminated as leakage problems change with the emergence of regional or federal policies. The ARB should avoid policies that create property rights or other entitlements that cannot be changed should regional or federal policies be adopted. The ARB’s commitments to border adjustments or other leakage-oriented measures should be of short duration (though renewable), thereby allowing more adaptability.
The emergence of regional or federal policies would likely keep the economic playing field more level between California and other states, compared with the case where California acts more on its own. As a result, these policies would reduce or eliminate the leakage that occurs from the diversion of Californian’s energy demands from California-produced goods to goods produced out of state. (It may be noted that the emergence of these policies would not eliminate international leakage—that is, leakage reflecting increased demands for goods or services provided by other nations.)
Conversely, the creation of a national cap-and-trade program could introduce a different type of leakage challenge in that GHG reductions in California would leave room for increased emissions elsewhere under the national cap.
The prospect of these changing circumstances implies that the ARB’s commitments should be easily adaptable to changing circumstances and conditional on the absence of regional or national climate efforts.
66 As indicated in Section 2, there are two main options for border adjustments related to imports: (1) a first-deliverer approach, under which estimated emissions associated with imports would be covered within the cap-and-trade program, and (2) a border tax approach, under which a levy would be imposed on imports in proportion to the estimated embodied emissions.
L-67

65
4. A uniform price, sealed bid (single round), double auction is a strong candidate for the choice of auction design, and it is a good default choice in the absence of compelling reasons for choosing an alternative. Resolution of ancillary design features that EAAC identifies, including more detailed rules governing the auction, should be considered through subsequent analysis sponsored by the ARB. Laboratory experiments are recommended to test the auction design and guide decisions about subordinate auction rules. The state may want to conduct a bidding procedure to select a third-party vendor to run the auction.
As discussed in Section 2, the uniform price, single-round auction is the simplest design and the easiest to understand. It is easy to develop a bidding strategy for this design, and the operations and outcome of the auction are transparent to participants and observers. It also conveys a sense of transparency about the overall operation of the market. This makes it an accessible auction institution for participants, non-experts and the public. These attributes can be expected to help build public trust in the allowance market. Unless new and specific information should support an alternative, the uniform price, sealed bid auction design is the appropriate design choice.
A double auction, with sellers as well as buyers able to participate, provides assurance to many parties that there will be a low-cost way to participate in the market and there will be a liquid market.
6.4 Provision of Allowance Value 5. The State of California should devote allowance value to several different purposes, including:
preventing adverse impacts of AB 32 to certain individuals, communities, or businesses; financing various investments or other public expenditures; and directing the value to citizens in the form of financial transfers (“dividends”) or reductions in California income or sales taxes.
6. The EAAC recommends that sufficient allowance value be conferred to low-income households
to avoid disproportionate adverse economic impact of AB 32 on such households. Such conferral should be accomplished through financial transfers rather than through subsidized energy prices. The EAAC recommends that households with income below 150% of the poverty line be regarded as low-income households. It is important to consider the impact of AB 32 as a whole, not just the impact of the cap-and-trade component.
This recommendation is in keeping with the language of AB 32, requiring that the law be implemented in a way that “ensures that activities undertaken to comply with the regulations do not disproportionately impact low-income communities.” (California Health and Safety Code §38562(b)(2)) Allowance value could be directed to the low-income households as financial transfers.
Financial transfers prevent disproportionate economic impacts on household incomes without eliminating consumers’ incentives to conserve energy and thereby reduce their contributions to GHG emissions. Subsidized prices remove such incentives, thus contravening a main objective of AB 32. They undermine the program by distorting the
L-68

66
relative prices of goods and services away from a uniform accounting for the cost of CO2 and other GHG emissions.
The required financial transfer would depend on the extent to which the costs of AB 32 are passed through to consumers through higher electricity bills, increased fuel costs, and indirect impacts on the prices of goods and services. The cumulative financial burden of these effects cannot be assessed with any certainty at this time; however, the ARB’s ongoing economic analysis of AB 32 may help bound their range. (The alternative of dividends to the public, referred to under recommendation 12 below, would also serve as means of distributing value that could offset the negative impact of AB 32 on low-income households.)
7. While the EAAC supports using allowance value to protect incomes of low-income households,
it recommends against the additional conferral of allowance value to electricity consumers (whether directly or indirectly through provision to local distribution companies).
In the absence of counteracting measures, AB 32 could noticeably increase electricity rates and overall electricity bills. Although various measures to avoid these impacts have been proposed,67 the EAAC believes that preventing such increases in electricity rates would undercut a main purpose of AB 32: to provide incentives for reduced electricity consumption (and associated emissions reductions). The EAAC believes that it is appropriate to prevent low-income households from experiencing disproportionate adverse impacts, and that the most effective and environmentally responsible way to do this is through the direct transfer of allowance value to households via financial transfers (as discussed in Recommendation 6) rather than through cuts in electricity rates or other forms of bill relief.
8. The EAAC recommends against supporting industry profits with allowance value, except when this is a byproduct of efforts to prevent potential leakage.
The EAAC believes that the state should not support industry profitability per se. AB 32 can lead to lower profits in some industries and higher profits in others. In some publicly held companies, AB 32 may lead to a reduction in stock prices, a reflection of expected reductions in profitability. Similarly, the value or sales price of some privately-held California companies may decrease. To a significant extent, these stock prices or values have already been affected by the anticipation of AB 32, and many stockholders or owners have already sold their shares or companies at a loss. Awarding allowance value to current owners will not benefit these prior sellers. Moreover, it is not at all clear that the state should absorb the risks associated with ownership by buttressing profits. However, two exceptions to this general approach seem warranted. First, many private companies are relatively small, and it may be that small businesses could use some
67 For example, the CPUC and CEC jointly recommended giving allowance value to LDCs subject to a requirement that the funds be used exclusively to finance “direct steps aimed at reducing GHG emissions (e.g. investments in energy efficiency and renewable energy) and also bill relief to the extent that the GHG program leads to increased utility costs and wholesale price increases.” The commissions emphasized, however, that “any mechanism implemented to provide bill relief be designed so as not to dampen the price signal resulting from the cap-and-trade program.” (California Public Utilities Commission, 2008, p. 227)
L-69

67
assistance in making the transition required under AB 32. In particular, such firms typically lack capital and ready access to the financing needed to invest in energy efficient equipment and greener production processes. Transition assistance for these purposes would be an appropriate investment option under Recommendation 10 below. Second, as noted in Section 5.1.4, preventing leakage is crucial to achieving the environmental goals of AB 32. Energy-intensive, trade-exposed industries in California may lose market share to lower-cost, out-of-state competitors if they try to recoup their increased energy costs under AB 32 by raising prices. This implies leakage; reduced emissions due to lower production at facilities in California are offset by higher production and emissions elsewhere, undermining the environmental integrity of the AB 32 program. The EAAC believes that it is important for the ARB to address leakage. In addressing leakage the ARB would mitigate or prevent adverse impacts on output and profits in these industries.
9. To meet the objectives of AB 32, the EAAC recommends that the ARB devote a significant share of allowance value toward financing public and private investments. The investments to consider include those oriented toward achieving low-cost emissions reductions (both directly and through investments in clean tech RD&D), adaptation to climate impacts, environmental remediation, improvements to disadvantaged communities, and job training.
There are three main justifications for employing allowance value to support these investments. First, as discussed in sections 4 and 5, because of market barriers and external benefits there are some private-sector investments (e.g., in energy efficiency improvements) that would not be triggered by the price of emissions allowances and complementary policies, but that would nonetheless help achieve AB 32’s goals in a cost-effective and fair way. Second, job training, infrastructure improvements, adaptation and environmental remediation are public goods that generally require public-sector investments. Finally, as discussed in Section 5, there are some beneficial local and state-level plans (e.g., improvements to land-use) that may not be successfully implemented if agencies are not sufficiently funded. Several state agencies are tasked with implementation of various components of AB 32, and in some cases successful implementation will require additional funding.
10. The EAAC recommends that the ARB’s selection among alternative investments to be financed through allowance value be based on an expanded measure of cost effectiveness (one that accounts for environmental co-benefits) as well as fairness, accountability and transparency. The EAAC recommends that the ARB work with other relevant agencies to arrive at a process for applying these criteria in determining the investments to which allowance value shall be devoted. The EAAC also recommends establishing an independent Investment Advisory Board to assist in screening potential investments and investment vehicles that meet the recommended criteria. The ARB should also respond to AB 32’s directive that public and private investments be devoted “where applicable and when feasible … toward the most disadvantaged communities in California…” (California Health and Safety Code §38565).
About half of the EAAC members also recommend that, of the allowance value to be devoted to investment, a given percentage be set aside for investments in disadvantaged communities via a Community Benefits Fund or other investment vehicles.
L-70

68
As discussed in Section 5, the expanded cost-effectiveness criterion captures more than the direct capital cost of the investment, but also accounts for the cost of removing relevant market barriers and nets out (i.e., subtracts) the estimated value of the external (including environmental) benefits. The environmental benefits include investment-related reductions in local pollutants, conservation of water, conservation of habitat and wildlife, conservation of open space and enhancements in quality of life. Some of the external benefits cannot be precisely quantified and would need to be evaluated qualitatively.
Disadvantaged communities face especially pressing investment needs. To assist these communities, allowance value can be used to reduce greenhouse gas emissions, minimize health impacts caused by climate change, and improve environmental quality. The allowance value could be channeled through a Community Benefits Fund or a similarly tasked entity to local governments, transit systems, local and state public health agencies, locally-based small businesses, schools, and/or non-governmental and community-based organizations.
11. The EAAC recommends that a fraction of allowance value be allocated to a contingency fund to be devoted to any communities experiencing increased exposure to co-pollutants as a result of any possible fossil-fuel burning stemming from AB 32 implementation. The funds would be for the purpose of environmental remediation.
As noted in Section 5, whether or where such increases will occur cannot be ascertained in advance. Air pollution in vulnerable communities should be monitored, with additional investments in monitoring infrastructure as needed. Insofar as adverse impacts are avoided, allowance value set aside for this purpose would be reallocated to the other recommended uses.
12. The EAAC supports the return of a significant fraction of allowance value to households either
through lump-sum rebates (as under the “cap and dividend” proposal) or through cuts or avoided increases in the state’s individual income or sales tax rates.
The EAAC did not reach full agreement as to which of these two approaches should be adopted. Proponents of the cap-and-dividend approach emphasize the idea that the climate-regulating services of the atmosphere are a common property resource, owned by the general public, and that the public therefore is entitled to the allowance value that stems from emitters’ access to this resource. As indicated in Section 5, an attraction of this approach is that it is relatively transparent and would not require changes to the tax system. Many are also attracted to the fact that it can simultaneously protect incomes of low-income households while also benefiting middle- and upper-income households, and that it would not involve an eligibility requirement for receiving financial transfers.
Reducing existing tax rates or preventing future tax increases has the attraction of enabling the state’s economy to operate more efficiently, thereby reducing the costs of AB 32 and leading to increases in private income to low-, middle- and high-income individuals over and above the increases enjoyed directly from the tax cuts. It is also consistent with the view that the public is entitled to the allowance value associated with the environmental public good. Supporters of this option favor its use in conjunction with the direct transfers
L-71

69
to low-income households discussed in Recommendation 6; this two-pronged approach—the combination of transfers and tax cuts—is seen as a more flexible way to meet the twin objectives of fairness and economic efficiency.
13. The EAAC recommends that the total allowance value over the interval 2012 – 2020 be
apportioned across the various uses in the following manner:
a. Some allowance value should be earmarked for the following purposes or contingencies. First,
as discussed in Recommendation 2 above, to the extent that addressing leakage requires the use of output-based free allocation, allowance value should be devoted to this purpose. Second, as indicated in Recommendation 11 above, a sufficient allowance value amount should be placed in a contingency fund to finance environmental remediation in any communities found to experience increased exposure to co-pollutants as a result of any possible fossil-fuel burning stemming from AB 32 implementation. Third, if (as indicated under b below) allowance value is returned to households through tax rate cuts, a small fraction of the allowance value should first be reserved to finance income transfers to low-income households so as to avoid disproportionate economic impacts on such households, as discussed under Recommendation 6.68 As discussed earlier in this report, a relatively small share of the total allowance value over the interval 2012 – 2020 is likely to be needed to serve these three objectives.
b. The remaining allowance value is expected to represent the bulk of this value. This value should be allocated to two major uses: (1) financing investments to reduce emissions and other public expenditures as described in Section 5 and in recommendations 9 through 11, and (2) returning allowance value to households as described in recommendation 12. Roughly 75% of this value should be returned to households either through lump-sum payments or through cuts in individual income or sales tax rates. Roughly 25% of this value should be devoted to financing investments and other public expenditure, along the lines indicated in recommendations 9 through 11. Because the amount of allowance value is expected to be lower in early years than in later years, it would be appropriate to allow these ratios to change over time. In particular, it would be appropriate to apply a larger share to investment in earlier years, when total allowance value is lower, so that high-priority investment needs can be financed. Among the investment alternatives, investments to achieve greenhouse gas reductions or adapt to the effects of climate change should be treated as senior obligations; that is, as objectives that must be addressed before allowance value can be allocated to other investment uses.
The criteria of cost effectiveness, fairness, environmental integrity and simplicity are all relevant to considerations of the appropriate relative emphasis on the different major uses of allowance value. But these criteria are not sufficient to determine the shares of allowance value that should go to these major uses. The relative support for one major use or another will depend on how much one criterion is emphasized relative to another. Reasonable people can disagree as to the relative importance of the different criteria.
68 If allowance value is returned to households through equal per-capita lump-sum payments, then disproportional impacts on low-income households will be avoided and there is no need for separate earmarking of allowance value for this purpose.
L-72

70
Despite these challenges, and differences in preferences among EAAC members, the EAAC converged on the view that: (1) it is appropriate to earmark some allowance value as indicated in paragraph “a” above, and that (2) of the allowance value that is not earmarked, the largest share (roughly 75%) of allowance value should be returned to California households either through tax rate cuts or via lump-sum transfers, with a smaller share (roughly 25%) used to finance socially beneficial investments and public expenditures. Although the EAAC proposes returning more allowance value to households than is used for investments, it affirms that the latter use is critical and warranted in light of the market barriers and funding shortages outlined in Section 5.
L-73

71
Glossary AB 32: The California Global Warming Solutions Act of 2006, which mandates that
California meet a greenhouse gas emission target in 2020, is commonly known by its bill number, Assembly Bill (AB) 32.
Abatement: Strategies or investments to reduce emissions.
Adaptation: Responses to the observed and predicted impacts of climate change. Compare to mitigation.
Allocation: The distribution of allowances by a regulator. The allowances may be sold or transferred without charge.
Allowance: An instrument used for compliance with an emissions cap-and-trade program. An allowance is a limited permit to emit a certain quantity of a pollutant. Emitters must surrender to the regulator allowances equal to their emissions.
Allowance price: In a cap-and-trade program, allowances may be traded (bought and sold). Because they can be traded, allowances have a price. If the properties of all allowances are uniform, there will be a single price for allowances. If different types of allowances have different properties—e.g., that some could be used in only one year while others could be used in multiple years—they may develop different prices.
Allowance value: The collective monetary value of all allowances. Because allowances can be traded, each has a value equal to the allowance price. In allocation, a regulator must distribute the allowance value as well as the allowances.
Auction: An auction is often considered the most transparent and fairest way for a government to sell something of value, like allowances. Those who wish to purchase allowances may bid to receive a certain number at a certain price. The auction winners, who bid highest, receive allowances for cash. By monetizing allowance value, the regulator can separate the distribution of allowance and the distribution of value.
Benchmarking: The creation of a standard (benchmark) that relates emissions to input, e.g., fuel consumption, or output, e.g., megawatt-hour of electricity generated. Benchmarks can be average or best practices in an industry, and can be created for different processes with the same input or output (e.g., separate benchmarks for coal-fired and gas-fired electricity generation). Benchmarking can also refer to distribution of allowance value based on a benchmark.
Community Benefit Fund: A fund to support investments directed specifically to disadvantaged communities geographically defined on the basis of socioeconomic and environmental criteria.
Intensity: The amount of one measured unit per some other measured unit. Rather than an absolute quantity, intensities are ratios. For example, energy intensity measures the amount of energy used to create a unit of output. The unit of output could be, e.g., a ton of cement or a megawatt-hour of electricity, or a dollar of value added.
Double auction: An auction in which multiple sellers, as well as multiple buyers, may participate.
Energy intensive: An industry or process that is above some threshold of energy intensity.
Fixed allocation: Allocation that is established once by a regulator and does not change. Compare with updated allocation.
L-74

72
Free allocation: The transfer of allowances without charge. The value of the allowances is transferred with the allowance. In principle, nearly any entity that receives allowance value could do so either in the form of allowances or cash.
Grandfathering: Using a historical period to establish the measurement on which an allocation decision would be based.
Leakage: The transfer of production or capital, and with them emissions, outside a jurisdiction due to a difference in regulation. Leakage results in a reduction of both emissions and economic activity within the jurisdiction with tighter regulation. In the case of greenhouse gases, which mix thoroughly in the atmosphere and persist there for relatively long times, there would be no environmental benefit to a shift in the location of emissions.
Linkage: The connection of two or more cap-and-trade programs by reciprocal arrangements to recognize instruments, especially allowances, for compliance. Through the Western Climate Initiative, the California Air Resources Board proposes linking a California greenhouse gas cap-and-trade program to those of six other US states and four Canadian provinces.
Marginal abatement cost: The incremental cost to reduce greenhouse gases by an incremental amount. There are a range of strategies and investments available through the sectors covered by a cap-and-trade program to reduce (abate) emissions, at a range of costs. These reduction opportunities can be ordered from least expensive to most expensive on a "marginal abatement cost curve." Assuming that the least-cost opportunities are taken first, the total abatement cost to reach an emissions target will be the sum of the marginal costs for every abatement increment.
Mitigation: The policies, strategies, and investments undertaken to reduce greenhouse gas emissions. Compare to adaptation.
Offset: Offset projects sequester greenhouse gases, or reduce their emission by sources that are not covered by the cap-and-trade program. These projects may be recognized by a regulator that issues offset certificates. Use of offset certificates may be allowed in lieu of use of allowances to meet a compliance obligation. When they are allowed, they may increase the number of abatement strategies and investments available, changing the marginal abatement cost curve.
Secondary market: The trade of allowances after they have been distributed by regulators. The initial distribution, including any auction, can be called the primary market.
Trade exposure: The extent to which the market for an industry's goods or services includes sellers outside of the jurisdiction in question. Trade exposure is one measure by which the risk of leakage can be assessed.
Updated allocation: Allocation that can change with new information, for example on the emissions or output of the recipient of allowance value.
L-75

73
References Åhman, M., & Holmgren, K. (2006). New Entrant Allocation in the Nordic Energy Sectors:
Incentives and Options in the EU ETS. Climate Policy , 6, 423 – 440.
Åhman, M., Burtraw, D., Kruger, J., & Zetterberg, L. (2007). A Ten-Year Rule to Guide the Allocation of EU Emission Allowances. Energy Policy , 35, 1718 – 1730.
American Council for an Energy Efficient Economy. (2007). Quantifying the Effects of Market Failures in the End-Use of Energy. Retrieved December 13, 2009, from http://www.aceee.org/Energy/IEAmarketbarriers.pdf.
Ash, Michael, Boyce, James K., Chang, Grace, Pastor, Manuel, Scoggins, Justin, & Tran, Jennifer. (2009). Justice in the Air: Tracking Toxic Pollution from America's Industries and Companies to Our States, Cities, and Neighborhoods. Political Economy Research Institute. Retrieved March 18, 2010, from: http://www.peri.umass.edu/fileadmin/pdf/dpe/ctip/justice_in_the_air.pdf.
Berk, M. M. (2006). Sustainable Energy: Trade-offs and Synergies Between Energy Security, Competitiveness, and Environment. Bilthoven: Netherlands Environmental Assessment Agency (MNP).
Binmore, K., & Klemperer, P. (2002). The Biggest Auction Ever: The Sale of the British 3G Telecom Licenses. Economic Journal, 112, C74 – C96.
Binz, R. J. (2004). The Impact of a Renewable Energy Portfolio Standard on Retail Electric Rates in Colorado. Denver: Public Policy Consulting.
Bird, L. A., Cory, K. S., & Swezey, B. G. (2008). Renewable Energy Price-Stability Benefits in Utility Green Power Programs. National Renewable Energy Laboratory Technical Report TP-670-43532.
Borenstein, S. (2009). To What Electricity Price Do Consumers Respond? Residential Demand Elasticity Under Increasing-Block Pricing. University of California Working Paper.
Boyce, J. (2009). Electronic Funds Transfer. Retrieved March 4, 2010, from http://www.climatechange.ca.gov/eaac/documents/member_materials/Boyce%20memo%20on%20Electronic%20Funds%20Transfer%2012-13-09.pdf.
Boyce, J. K., & Riddle, M. E. (2009). Cap and Dividend: A State-by-State Analysis. Political Economy Research Institute. Retrieved March 17, 2010, from http://www.e3network.org/papers/CAP_DIVIDEND_states.pdf.
Brown, M. A., Chandler, J., Lapsa, M. V., & Sovacool, B. K. (Revised January, 2008). Carbon Lock-In: Barriers to Deploying Climate Change Mitigation Technologies. Oak Ridge National Laboratory.
Browning, E. K. (1987). On the Marginal Welfare Cost of Taxation. American Economic Review , 77, 11 – 23.
Burtraw, D., & Palmer, K. (2008). Compensation Rules for Climate Policy in the Electricity Sector. Journal of Public Policy Analysis and Management , 27, 819 – 847.
Burtraw, D., Goeree, J., Holt, C. A., Myers, E., Palmer, K., & Shobe, W. (2009). Collusion in Auctions for Emissions Permits: An Experimental Analysis. Journal of Policy Analysis and Management , 28, 672 – 691.
Bushnell, J., & Chen, Y. (2009, March). Regulation, Allocation, and Leakage in Cap-and-Trade Markets for CO2. Center for the Study of Energy Markets Working Paper 183. Retrieved February 1, 2010, from http://www.ucei.berkeley.edu/PDF/csemwp183.pdf.
L-76

74
Cal/EPA and ARB EAAC Policy Team. (2009). Estimates of Allowance Prices. Retrieved March 8, 2010, from http://www.climatechange.ca.gov/eaac/documents/state_reports/Allowance_Prices--Memo_from_State_Staff.pdf.
California Air Resources Board. (2008). Climate Change Scoping Plan: A Framework for Change.
California Association of Professional Scientists v. Department of Fish and Game (79 Cal. App.4th 935 2000).
California Climate Action Reserve. Public Reports. Retrieved March 8, 2010, from Climate Action Registry Reporting Online Tool: https://www.climateregistry.org/CARROT/public/reports.aspx.
California Constitution Article XIIIa (Prop. 13).
California Natural Resources Agency. (2009). 2009 California Climate Adaptation Strategy. Retrieved February 1, 2010, from http://www.energy.ca.gov/2009publications/CNRA-1000-2009-027/CNRA-1000-2009-027-F.PDF.
California Public Utilities Commission. (October 16, 2008). Decision 08-10-037, Final Opinion on Greenhouse Gas Regulatory Strategies.
California Transit Association. (n.d.). Aftermath Archive. Retrieved December 13, 2009, from http://www.caltransit.org/node/902
Cambridge Systematics. (2009). Moving Cooler: An Analysis of Transportation Strategies for Reducing Greenhouse Gas Emissions. Retrieved December 13, 2009, from http://www.movingcooler.info/.
Cavanagh, R. (2004). Energy Efficiency in Buildings and Equipment: Remedies for Pervasive Market Failures. Retrieved December 13, 2009, from NCEP Technical Appendix: Chapter 3: Improving Energy Efficiency: http://bipartisanpolicy.org/sites/default/files/TA_C3.pdf
Chevron Corporation. (January 8, 2010). Comments from Chevron Corporation to the Economic and Allocation Advisory Committee. Retrieved March 4, 2010, from http://www.climatechange.ca.gov/eaac/comments/2010-01-08_Chevron.pdf.
Climate Action Team. (2009). DRAFT Climate Action Team Biennial Report to the Governor and Legislature. Retrieved March 4, 2010, from http://www.energy.ca.gov/2009publications/CAT-1000-2009-003/CAT-1000-2009-003-D.PDF.
Climate Action Team Economics Subgroup. (October 15, 2007). Updated Macroeconomic Analysis of Climate Strategies Presented in the March 2006 Climate Action Team Report. Retrieved December 29, 2009, from http://www.climatechange.ca.gov/events/2007-09-14_workshop/final_report/2007-10-15_MACROECONOMIC_ANALYSIS.PDF.
Dahl, C. A. (1993). A survey of energy demand elasticities in support of the development of the NEMS. Retrieved March 8, 2010, from MPRA Paper No. 13962: http://mpra.ub.uni-muenchen.de/13962/1/MPRA_paper_13962.pdf.
de León, Kevin. AB 1405. (RS August 27, 2009).
E3. (2008). Western Climate Initiative: Electricity Leakage Analysis. Retrieved February 1, 2010, from http://www.westernclimateinitiative.org/component/remository/func-startdown/53/
Economic and Technology Advancement Advisory Committee. (2009). Advanced Technology to Meet California's Climate Goals: Opportunities, Barriers & Policy Solutions. Retrieved March 17, 2010, from http://www.arb.ca.gov/cc/etaac/meetings/ETAACAdvancedTechnologyFinalReport12-14-09.pdf.
L-77
75
Economic and Technology Advancement Advisory Committee. (2008). Recommendations of the Economic and Technology Advancement Advisory Committee (ETAAC): Final Report: Technologies and Policies to Consider for Reducing Greenhouse Gas Emissions in California. Retrieved December 13, 2009, from http://www.arb.ca.gov/cc/etaac/ETAACFinalReport2-11-08.pdf.
Electric Power Research Institute. (2007). An Updated Macroeconomic Analysis of Recent California Climate Action Team Strategies. Retrieved December 29, 2009, from http://my.epri.com/portal/server.pt?Abstract_id=000000000001015510.
Ellerman, A. D., Joskow, P. L., Schmalensee, R., Montero, J.-P., & Bailey, E. M. (2000). Markets for Clean Air: The U.S. Acid Rain Program. Cambridge and New York: Cambridge University Press.
Energy Information Administration. (2007). Annual Electric Utility Data - EIA-861 Data File. Retrieved March 4, 2010, from http://www.eia.doe.gov/cneaf/electricity/page/eia861.html.
Federal Energy Regulatory Commission. (August 6, 2009). Testimony of Jon Wellinghoff, Chairman, Federal Energy Regulatory Commission before the Committee on Environmenment and Public Works, United States Senate.
Fischer, C. (2003). Combining Rate-Based and Cap-and-Trade Emissions Policies. Climate Policy , S89-S109.
Fischer, C., & Fox, A. K. (2007). Output-Based Allocation of Emissions Permits for Mitigating Tax and Trade Interactions. Land Economics , 83 (4), 575-599.
Golove, W. H., & Eto, J. H. (1996). Market Barriers to Energy Efficiency: A Critical Reappraisal of the Rationale for Public Policies to Promote Energy Efficiency. Retrieved December 13, 2009, from http://eetd.lbl.gov/EA/emp/reports/38059.pdf.
Goulder, L. H., Hafstead, M. A., & Dworsky, M. (2009). Impacts of Alternative Emissions Allowance Allocation Methods Under a Federal Cap-and-Trade Program. Retrieved December 13, 2009, from Social Science Research Network: http://ssrn.com/abstract=1457155.
Groosman, B., Muller, N. Z., & O’Neill, E. (2009). The Ancillary Benefits from Climate Policy in the United States. Retrieved March 17, 2010, from Middelbury College Economics Discussion Paper No. 0920: http://sandcat.middlebury.edu/econ/repec/mdl/ancoec/0920.pdf.
Holt, C., Shobe, W., Burtraw, D., Palmer, K., & Goeree, J. (2007). Auction Design for Selling CO2 Emission Allowances Under the Regional Greenhouse Gas Initiative. Retrieved March 8, 2010, from http://www.rggi.org/docs/rggi_auction_final.pdf.
Intergovernmental Panel on Climate Change. (2007). Fourth Assessment Report, Working Group I Report.
Jensen, J., & Rasmussend, T. N. (2000). Allocation of CO2 Emissions Permits: A General Equilibrium Analysis of Policy Instruments. Journal of Environmental Economics and Management , 40 (2), 111-136.
Jorgenson, D., & Yun, K.-Y. (1991). The Excess Burden of the US Tax System. Journal of Accounting, Auditing, and Finance , 6, 487-509.
Kunkel, C., & Kammen, D. M. (November 9, 2009). Taxable Cap and Dividend. Retrieved December 13, 2009, from http://www.climatechange.ca.gov/eaac/documents/member_materials/Kunkel_and_Kammen_cap_and_dividend_taxable_dividend_%202009-11-09.pdf.
McKinsey & Company. (2007). Reducing Greenhouse Gas Emissions: How Much at What Cost?. Retrieved December 13, 2009, from: http://www.mckinsey.com/clientservice/ccsi/pdf/US_ghg_final_report.pdf.
Milgrom, P. (1989). Auctions and Bidding: A Primer. The Journal of Economic Perspectives , 3, 3 – 22.
L-78

76
National Academy of Sciences. (2009). Hidden Costs of Energy: Unpriced Consequences of Energy Production and Use. Committee on Health, Environmental, and Other External Costs and Benefits of Energy Production and Consumption. National Research Council.
Newell, R. G., Jaffe, A. B., & Stavins, R. (1999). The Induced Innovation Hypothesis and Energy-Saving Technological Change. The Quarterly Journal of Economics 114 , 941 – 975.
Next 10. (2009). Many Shades of Green: Diversity and Distribution of California's Green Jobs. Retrieved March 18, 2010 from: http://www.coecon.com/Reports/GREEN/ManyShadesofGreen_1209.pdf.
North Carolina v. EPA, 531 F.3d 896 (D.C. Cir. 2008).
Núñez, Fabian. (2006). AB 32, California Global Warming Solutions Act of 2006. Statutes of 2006, Chapter 488.
Palmer, K., Burtraw, D., & Paul, A. (2009). Allowance Allocation in a CO2 Emissions Cap-and-Trade Program for the Electricity Sector in California. Retrieved January 10, 2010, from http://www.rff.org/RFF/Documents/RFF-DP-09-41.pdf.
Parry, I. W., & Oates, W. E. (2000). Policy Analysis in the Presence of Distorting Taxes. Journal of Policy Analysis and Management , 19, 603 – 614.
Parry, I. W., Williams, R. C., & Goulder, L. H. (1999). When Can Carbon Abatement Policies Increase Welfare? The Fundamental Role of Distorted Factor Markets. Journal of Environmental Economics and Mangement , 37, 52 – 84.
Pastor, M., Morello-Frosch, R., & Sadd, J. (2009). Air Quality, Environmental Justice, and Social Vulnerability.
Pastor, M., Morello-Frosch, R., & Sadd, J. (2008). Environmental Justice Screening Method: Integrating Indicators of Cumulative Impact and Community Vulnerability into Regulatory Decision-making.
Pennell v. City of San Jose (42 Cal.3d 365 1986).
Perata, Don. (2006). SB 1368. Statutes of 2006, Chapter 598.
Popp, D. (2002). Induced Innovation and Energy Prices. American Economic Review , 91, 160 – 180.
Popp, D., Newell, R. G., & Jaffe, A. B. (2009). Energy, the Environment, and Technological Change. NBER Working Paper No. 14832.
Rider v. County of San Diego (1 Cal.4th 1 1991).
Roland-Holst, D. (2008). Energy Efficiency, Innovation, and Job Creation in California. Retrieved December 13, 2009, from Center for Energy, Resources, and Economic Sustainability: http://are.berkeley.edu/~dwrh/CERES_Web/Docs/UCB%20Energy%20Innovation%20and%20Job%20Creation%2010-20-08.pdf.
Sacramento Area Council of Governments and Valley Vision. (n.d.). Sacramento Region Blueprint. Retrieved December 13, 2009, from http://www.sacregionblueprint.org/sacregionblueprint/home.cfm
Sanstad, A. H., & Wolff, G. H. (2000). Tax Shifting and the Likelihood of Double Dividends: Theoretical and Computational Issues. Redefining Progress.
Sinclair Paint Co. v. State Bd. Of Equalization, 15 Cal.4th 866,875 (Supreme Court of California 1997).
Smith, A. E., Ross, M. T., & Montgomery, D. W. (2002). Implications of Trading Implementation Design for Equity-Efficiency Trade-offs in Carbon Permit Allocations. Retrieved December 13, 2009, from
L-79
77
http://www.crai.com.au/uploadedFiles/RELATING_MATERIALS/Publications/Consultant_publications/Smith,_A/files/carbon-permit-allocations.pdf.
Steinberg, Darrell. (2008). SB 375. Statutes of 2008, Chapter 728.
Stuart, C. (1984). Welfare Costs per Dollar of Additional Tax Revenue in the United States. American Economic Review , 74, 352 – 62.
Sweeney, J. (August 13, 2009,). Presentation of the Economic Modeling Subcommittee. Retrieved December 13, 2009, from http://www.climatechange.ca.gov/eaac/meetings/2009-08-13/presentations/Economic_Modeling_Subcommittee.pdf.
Transportation for America. (2009). Stranded at the Station: The Impact of the Financial Crisis in Public Transportation. Retrieved December 13, 2009, from http://www.t4america.org/docs/081809_stranded_at_thestation.PDF.
U.S. Energy Information Agency. (n.d.) West Coast (PADD 5) Product Supplied for Crude Oil and Petroleum Products. Retrieved March 8, 2010, from: http://tonto.eia.doe.gov/dnav/pet/pet_cons_psup_dc_r50_mbbl_a.htm.
U.S. Energy Information Agency. (n.d.). U.S. Finished Motor Gasoline Imports. Retrieved March 8, 2010, from: http://tonto.eia.doe.gov/dnav/pet/pet_move_impcus_a2_nus_epm0f_im0_mbbl_a.htm
U.S. House. 111th Congress. H.R. 2454, American Clean Energy and Security Act. (EH June 26, 2009).
U.S. Senate. 111th Congress. S. 1733, Clean Energy Jobs and American Power Act. (RS November 5, 2009).
Wei, M., Patadia, S., & Kamman, D. M. (2010). Putting Renwables and Energy Efficiency to Work: How Many Jobs Can the Clean Energy Industry Generate in the U.S.? Energy Policy , 38, 919 –931.
Weiss, J., & Sarro, M. (2009). The Economic Impact of AB 32 on California Small Businesses. Retrieved March 18, 2010, from: http://www.ucsusa.org/assets/documents/global_warming/AB-32-and-CA-small-business-report.pdf.
Western Climate Initiative. (2008). Design Recommendations for the WCI Regional Cap-and-Trade Program. Retrieved March 4, 2010, from http://westernclimateinitiative.org/component/remository/general/design-recommendations/Design-Recommendations-for-the-WCI-Regional-Cap-and-Trade-Program/.
L-80

78
Appendix A: Market Barriers to Deploying Clean Energy
Technologies
L-81

79
L-82

80
Source: (Economic and Technology Advancement Advisory Committee, 2009, pp. 1-9 – 1-11)
L-83

81
Appendix B: Investment in Disadvantaged Communities
This appendix elaborates on issues related to investment in disadvantaged communities, including localities that are disproportionately impacted by co-pollutants associated with use of fossil fuels.
Co-pollutants
Co-pollutants, such as particulate matter, nitrogen oxides (NOx), and air toxics, can be released simultaneously with greenhouse gases as fossil fuels are burned. If policy seeks to maximize net social benefits from reducing greenhouse gas emissions, benefits from co-pollutant reductions should also be considered.
Groosman, Muller, and O’Neill (2009) estimate that on average, the co-benefits from co-pollutant reductions due to a nationwide cap on carbon emissions will be on the same order of magnitude as the benefits from carbon emissions reduction itself. In a study of the co-benefits of carbon emission reductions in the European Union, Berk et al. (2006) reach similar conclusions. A recent study by the National Academy of Sciences (2009) estimates that the burning of fossil fuels in the United States is responsible for roughly 20,000 premature deaths each year, translating into $120 billion/year in health damages. This estimate is based on the effects of criteria air pollutants, and does not include damages from climate change, harm to ecosystems, or other air pollutants such as mercury.
In addition to improvements in the quantity and quality of life, benefits from co-pollutant reductions include health-care cost savings, reductions in days lost from work due to illness and the need to care for ill children and other dependents, and gains in property values.
Disproportionate Impacts
Some communities—often lower-income communities—are overburdened by co-pollutants. Figure 8 illustrates this point, showing health risks from air toxics for the same three industrial sectors, relative to the shares of demographic subgroups in the national population. Petroleum refineries have the most disproportionate impact.
L-84

82
Figure 8
Minority Share of Health Risk from Air Toxics Releases, by Sector, 2006
Source: Calculated using the methodology of Ash et al., 2009.
The ARB recently resolved “to develop a methodology using available information to assess the potential cumulative air pollution impacts of proposed regulations to implement the Scoping Plan” and “to identify communities already adversely impacted by air pollution as specified in Health and Safety Code section 38750(b)(1) before the adoption of a cap-and-trade program” (California Air Resources Board, 2008, p. 130).
Researchers at the University of Southern California, Occidental College, and the University of California, Berkeley, have initiated work to assist the ARB in these tasks, developing a Cumulative Impact score method to screen for disproportionate air pollution impacts based on (i) hazard proximity and sensitive land uses, (ii) health risk, and (iii) social and health vulnerability (Pastor, Morello-Frosch, & Sadd, 2009). Applying this methodology, the researchers have identified the highest-scoring census tracts in the six-county SCAG (Southern California Association of Governments) area. Socio-demographic data show that these tracts have relatively high percentages of Latinos and African-Americans and relatively low incomes (see Table 7).
0
10
20
30
40
50
Petroleum Refineries
Cement Manufacturing
Power Plants US Population
Min
ority
Share
of
Health R
isk (
or
Popula
tion)
Other MinoritiesAsian-PacificLatinoAfrican-American
L-85

83
Table 7
Socio-Demographic Characteristics (2000) for Tracts
with Highest Cumulative Impact Score, Six-County SCAG Area
Top 6.2% of Tracts
Top 12.9% of Tracts
Top 20.1% of Tracts
SCAG Area Totals
Total population 924,584 2,035,173 3,270,659 16,479,143
% population 5.6% 12.3% 19.8% 100.0%
% nonwhite 95.4% 92.8% 89.9% 61.2%
% below poverty 33.2% 30.2% 27.9% 15.7%
Median household income $25,269 $27,533 $29,686 $50,165
Per capita income $9,221 $10,097 $10,880 $21,101
% black 7.7% 9.2% 10.4% 7.3%
% Hispanic 79.0% 74.5% 69.9% 40.6%
% Asian 7.4% 7.7% 7.8% 10.4%
% other race 1.2% 1.5% 1.8% 2.8%
Source: Unpublished data furnished upon request by Dr. Manuel Pastor, University of Southern California, Program for Environmental & Regional Equity.
Air pollution is generated by a variety of sources, not all of them related to fossil fuels. Examples of other sources include solvent evaporation, waste disposal, and (in the case of particulate matter) windblown dust. However, the production and use of fossil fuels account for a substantial share of emissions of many important pollutants.
Table 8 presents data on fossil-fuel related emissions of reactive organic gases and four criteria air pollutants as a share of total statewide emissions. The contribution of fossil fuels ranges from 41% in the case of fine particulate matter to 96% in the case of nitrogen oxides. The transportation sector (mobile sources) accounts for the major share with the exception of fine particulate matter, where stationary and residential sources contribute slightly more to the total.
L-86

84
Table 8
Percentage Share of California Emissions Derived from Production and Use of Fossil Fuels
Pollutants ROG CO NOX SOX PM2.5
Sources:
Fuel combustion (stationary & residential) 3.8 7.2 10.4 2.9 20.8
Mobile sources 51.2 79.8 85.5 58.9 19.7
Petroleum production & marketing 6.1 0.1 0.3 14.1 0.5
Total 61.1 87.1 96.2 73.0 41.0
Key: ROG = reactive organic gases
CO = carbon monoxide NOX = nitrogren oxides
SOX = sulfur oxides PM2.5 = fine particular matter
Source: California Air Resources Board, “Almanac Emission Projection Data” (2009) online at http://www.arb.ca.gov/app/emsinv/emssumcat_query.php?F_YR=2008&F_DIV=-4&F_SEASON=A&SP=2009&F_AREA=CA
If, as is commonly assumed, air pollution damages are convex in total exposure—that is, marginal damage per ton of pollution exceeds average damage per ton—then the environmental significance of reductions in co-pollutants as a co-benefit of carbon policy may be even larger than the numbers in the table suggest.
L-87

85
Appendix C: Distributional Effects on California Households of
Carbon Prices The gross cost to a household from carbon pricing is a function of the amount of fossil
carbon embodied in the production and distribution of the goods and services it consumes (the household’s “carbon footprint”). The breakdown across expenditure categories for the median California household, based on data from the 2003 Consumer Expenditure Survey, the 2003 Input-Output Tables and the 2002 Benchmark Input-Output Tables, is shown in Figure 9 (Boyce & Riddle, 2009).
Because lower-income households generally consume less than higher-income households, they typically have smaller carbon footprints. Differences across income brackets in California are shown in Figure 10. In the highest decile, carbon emissions per capita are roughly six times greater than in the lowest decile.
As a share of their income, however, low-income households consume more carbon than higher-income households—that is, more carbon per dollar—as shown in Figure 11. This is largely because fuels and electricity account for a larger share of their household budgets, whereas upper-income groups spend a higher share on other items. In the absence of offsetting transfers of allowance value, putting a price on carbon therefore is regressive; the higher prices arising from the introduction of carbon permits takes a larger share of income from the poor than from households in upper-income brackets.
Figure 9
Carbon Footprint by Expenditure Category: Median CA Household
Source: Calculated using the methodology of Boyce and Riddle (2009).
Electricity 12%
Heating Oil 1%
Natural Gas 9%
Gasoline 35%
Indirect 43%
L-88

86
Figure 10
Carbon Footprint by Income Decile in California
(Metric Tons CO2 per Capita)
Source: Calculated using the methodology of Boyce and Riddle (2009).
Figure 11
Carbon Footprint by Income Decile in California
(kg CO2 per Dollar)
Source: Calculated using the methodology of Boyce and Riddle (2009).
Household Carbon Footprint
by Income Decile (kg CO2 per $ income)
0.00
0.20
0.40
0.60
0.80
1.00
1.20
1 2 3 4 5 6 7 8 9 10 Income Decile
1 2 3 4 5 6 7 8 9 10 Income Decile
Household Carbon Footprint
by Income Decile (Metric Tons CO2 per Capita)
$30
$20
$10
$0
L-89