appendix l – economic analysis 51 - josh staiger design final report... · table b.1. material...
TRANSCRIPT
Appendices Appendix A – Ethanol Market Analysis and Projections ....................................................... 22 Appendix B – Preliminary Material Balance ........................................................................... 24 Appendix C – Derivation of the Kinetic Rate Law .................................................................. 26 Appendix D – MSDS for Ethanol, Acetic Acid, and Acetaldehyde........................................ 30 Appendix E – Environmental Regulations ............................................................................... 31 Appendix F – CSTR Volume and Productivity Determination.............................................. 32 Appendix G - TPXY Data for Components in System ............................................................ 33 Appendix H - Sizing the Molecular Sieve ................................................................................. 34 Appendix I – Design of Separation Section of Process ............................................................ 36 Appendix J - ChemCAD Process............................................................................................... 37 Appendix K - ChemCAD Report Summary............................................................................. 39 Appendix L – Economic Analysis.............................................................................................. 51
21
Appendix A – Ethanol Market Analysis and Projections
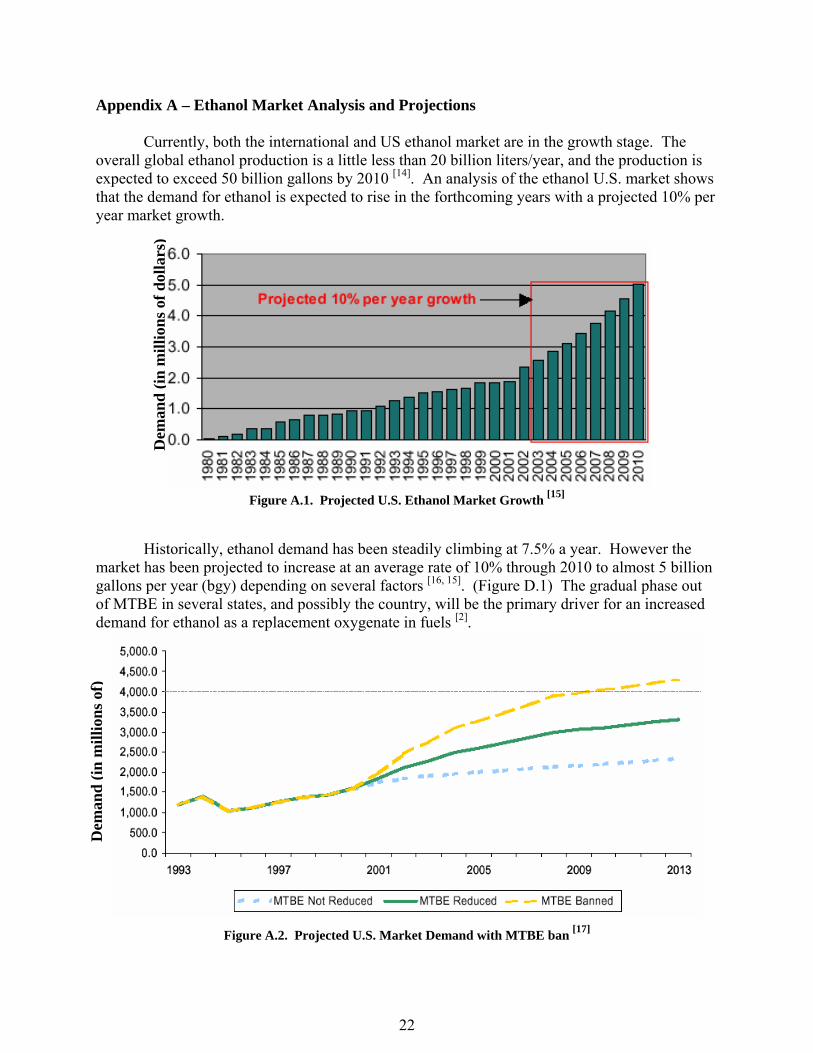
Currently, both the international and US ethanol market are in the growth stage. The overall global ethanol production is a little less than 20 billion liters/year, and the production is expected to exceed 50 billion gallons by 2010 [14]. An analysis of the ethanol U.S. market shows that the demand for ethanol is expected to rise in the forthcoming years with a projected 10% per year market growth.
Dem
and
(in m
illio
ns o
f dol
lars
)
Figure A.1. Projected U.S. Ethanol Market Growth [15]
Historically, ethanol demand has been steadily climbing at 7.5% a year. However the market has been projected to increase at an average rate of 10% through 2010 to almost 5 billion gallons per year (bgy) depending on several factors [16, 15]. (Figure D.1) The gradual phase out of MTBE in several states, and possibly the country, will be the primary driver for an increased demand for ethanol as a replacement oxygenate in fuels [2].
Dem
and
(in m
illio
ns o
f)
Figure A.2. Projected U.S. Market Demand with MTBE ban [17]
22

Figure A.3 shows that the price of ethanol is projected to steadily rise over the next 10
years regardless of the future of MTBE. This indicates that the investment of selling ethanol in the fuels industry would be profitable.
23
y = 6E-05x - 1.0994
0.8
0.9
1
1.1
1.2
1.3
1.4
1.5
1.6
1.7
1.8
1/9/2001 11 9/18/2014
Pric
e ($
/gal
lon)
10/6/2003 7/2/2006 3/28/2009 12/23/20
Date
Historic Ethanol PricesProjected Ethanol PriceLinear (Historic Ethanol Prices)
Figure A.3. Ethanol price projection for the next 10 years without MTBE phase out or RFS [18]
24
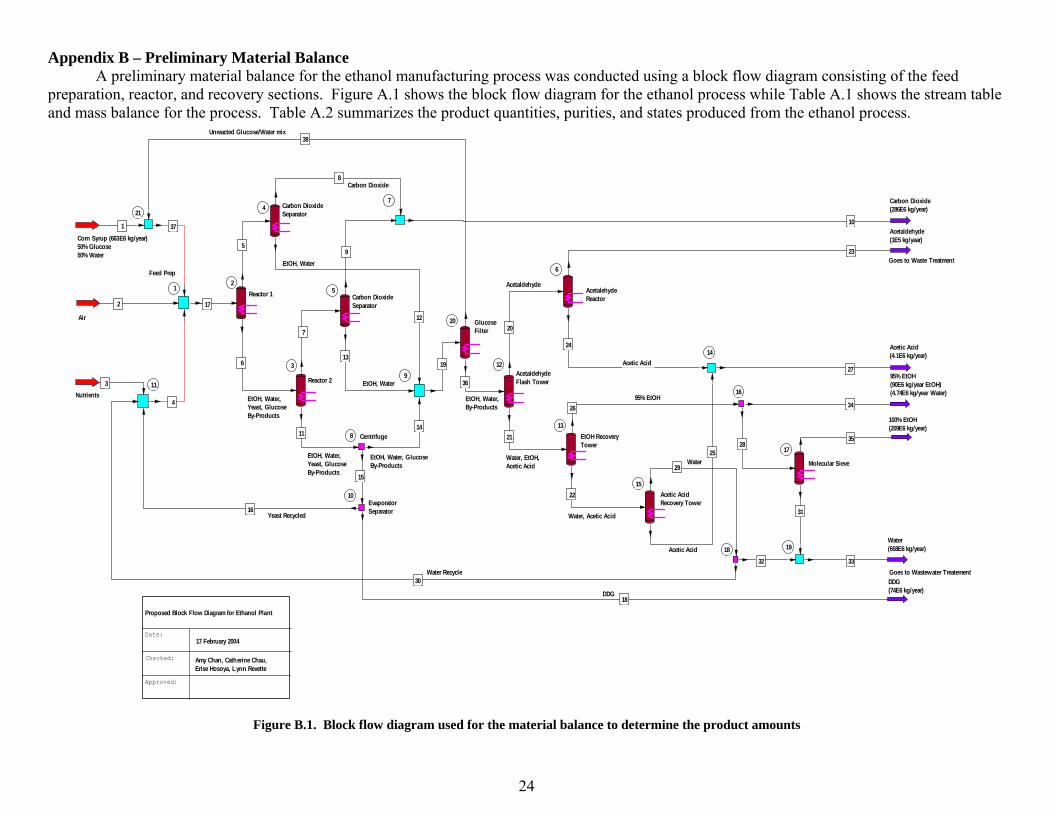
Appendix B – Preliminary Material Balance A preliminary material balance for the ethanol manufacturing process was conducted using a block flow diagram consisting of the feed
preparation, reactor, and recovery sections. Figure A.1 shows the block flow diagram for the ethanol process while Table A.1 shows the stream table and mass balance for the process. Table A.2 summarizes the product quantities, purities, and states produced from the ethanol process.
Feed Prep
Reactor 1
Reactor 2
Corn Syrup (663E6 kg/year)50% Glucose50% Water
Nutrients
Air
21
3
4
5
5
6
7
7
10
8
9
Carbon DioxideSeparator
Carbon Dioxide Separator
811
9
12
13
14Centrifuge
10
15
18
Yeast Recycled
2 17
DDG(74E6 kg/year)
12
6
13
15
20
AcetaldehydeFlash Tower
21
Water, EtOH,Acetic Acid
22
Water, Acetic Acid
AcetalehydeReactor
23
1424
25
16
2695% EtOH
Acetic Acid
Acetaldehyde(1E5 kg/year)
Goes to Waste Treatment
Acetic Acid
Carbon Dioxide(286E6 kg/year)
27
1728
Evaporator Separator
113
4
16
18
30
29
19
31
32 33
34
35
Water(658E6 kg/year)
100% EtOH(209E6 kg/year)
95% EtOH(90E6 kg/year EtOH)(4.74E6 kg/year Water)
Acetic Acid(4.1E6 kg/year)
Goes to Wastewater Treatement
Carbon Dioxide
EtOH, Water
EtOH, Water
DDG
Acetaldehyde
EtOH, Water, Yeast, GlucoseBy-Products
EtOH, Water, Yeast, GlucoseBy-Products
EtOH, Water, GlucoseBy-Products
20
19
36
21
1 37
38Unreacted Glucose/Water mix
EtOH, Water,By-Products
Water
EtOH RecoveryTower
Acetic AcidRecovery Tower
Molecular Sieve
GlucoseFilter
Date:
Approved:
Checked:
Proposed Block Flow Diagram for Ethanol Plant
17 February 2004
Amy Chan, Catherine Chau, Erise Hosoya, Lynn Revette
Water Recycle
Figure B.1. Block flow diagram used for the material balance to determine the product amounts

Table B.1. Material balance for the ethanol production process
Stream # Glucose Water Yeast Air Ethanol DDG CO2
Acetic Acid Acetaldehyde Total
1 663 663 0 0 0 0 0 0 0 13262 0 0 0 0 0 0 0 0 0 0 3 0 0 0 0 0 0 0 0 0 0 4 0 511 70 0 0 0 0 0 0 581 5 0 16 0 0 16 0 163 0 0 195 6 311 1183 112 0 154 0 0 1.2 1.2 17627 0 13 0 0 13 0 123 0 0 149 8 0 0 0 0 0 0 163 0 0 163 9 0 0 0 0 0 0 123 0 0 123 10 0 0 0 0 0 0 286 0 0 286 11 25 1170 144 0 270 0 0 2.1 2.1 161312 0 16 0 0 16 0 0 0 0 32 13 0 13 0 0 13 0 0 0 0 26 14 25 659.5 0 0 270 0 0 2.1 2.1 959 15 0 511 144 0 0 0 0 0 0 655 16 0 511 70 0 0 0 0 0 0 581 17 688 1199 70 0 0 0 0 0 0 195718 0 0 0 0 0 74 0 0 0 74 19 25 688.5 0 0 299 0 0 2.1 2.1 101720 0 0 0 0 0 0 0 0 2.1 2 21 0 663.5 0 0 299 0 0 2.1 0 965 22 0 647.76 0 0 0 0 0 2.1 0 650 23 0 0 0 0 0 0 0 0 0.105 0 24 0 0 0 0 0 0 0 1.995 0 2 25 0 0 0 0 0 0 0 2.1 0 2 26 0 15.74 0 0 299 0 0 0 0 315 27 0 0 0 0 0 0 0 4.095 0 4 28 0 11 0 0 209 0 0 0 0 220 29 0 647.76 0 0 0 0 0 0 0 648 30 0 0 0 0 0 0 0 0 0 0 31 0 11 0 0 0 0 0 0 0 11 32 0 647.76 0 0 0 0 0 0 0 648 33 0 658.76 0 0 0 0 0 0 0 659 34 0 4.74 0 0 90 0 0 0 0 95 35 0 0 0 0 209 0 0 0 0 209 36 0 663.5 0 0 299 0 0 2.1 2.1 967 37 688 688 0 0 0 0 0 0 0 137638 25 25 0 0 0 0 0 0 0 50
* in millions kg/year
Table B.2. Product summary for the purities and amounts produced
Product Purity Quantity (kg/yr) State Carbon Dioxide ~100% 259 E 6 Gas Acetic Acid ~99% Acetic Acid, with impurities 4.00 E 6 Liquid 95% Ethanol 95% Ethanol, 5% Water 94.74 E 6 Liquid 100% Ethanol 100% Ethanol 209 E 6 Liquid DDGs 97% dead yeast and nutrient, 3% Water 290 E 6 Solid
25
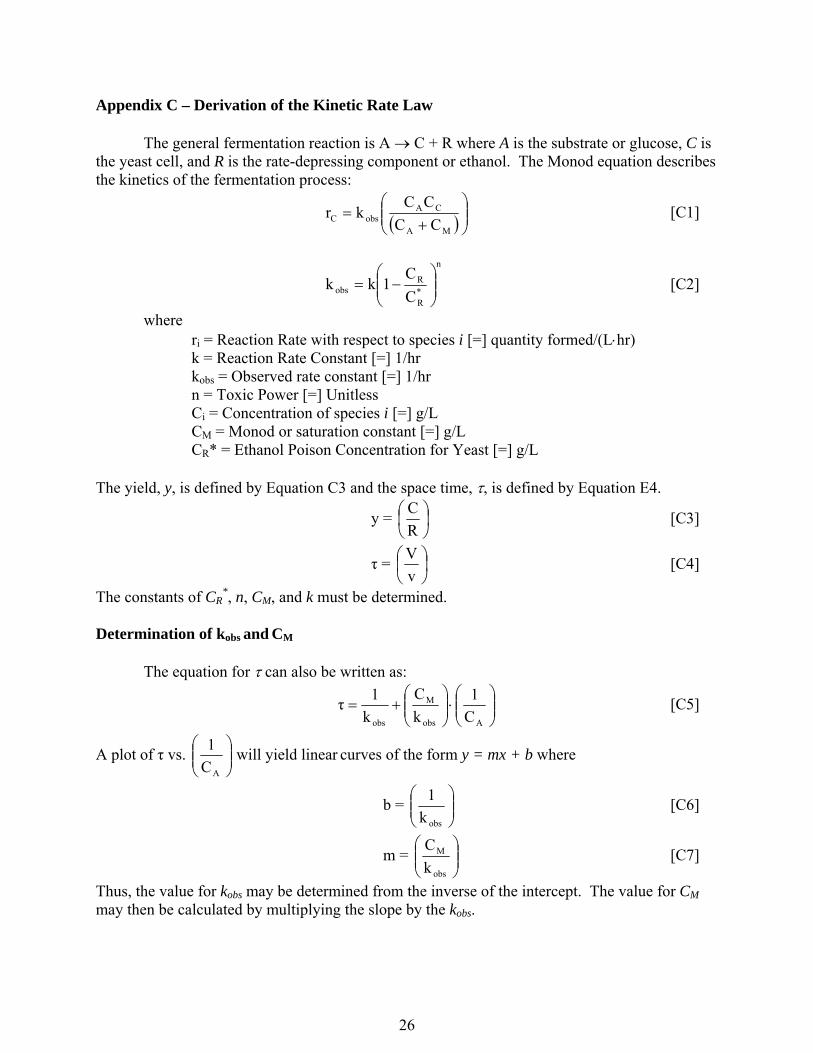
Appendix C – Derivation of the Kinetic Rate Law The general fermentation reaction is A → C + R where A is the substrate or glucose, C is
the yeast cell, and R is the rate-depressing component or ethanol. The Monod equation describes the kinetics of the fermentation process:
( )⎟⎟⎠
⎞⎜⎜⎝
⎛+
=MA
CAobsC CC
CCkr [C1]
n
*R
Robs C
C1kk ⎟⎟
⎠
⎞⎜⎜⎝
⎛−= [C2]
where ri = Reaction Rate with respect to species i [=] quantity formed/(L⋅hr) k = Reaction Rate Constant [=] 1/hr kobs = Observed rate constant [=] 1/hr n = Toxic Power [=] Unitless Ci = Concentration of species i [=] g/L CM = Monod or saturation constant [=] g/L CR* = Ethanol Poison Concentration for Yeast [=] g/L
The yield, y, is defined by Equation C3 and the space time, τ, is defined by Equation E4.
y = ⎟⎠⎞
⎜⎝⎛
RC [C3]
τ = ⎟⎠⎞
⎜⎝⎛
vV [C4]
The constants of CR*, n, CM, and k must be determined.
Determination of kobs and CM
The equation for τ can also be written as:
⎟⎟⎠
⎞⎜⎜⎝
⎛⋅⎟⎟
⎠
⎞⎜⎜⎝
⎛+=
Aobs
M
obs C1
kC
k1τ [C5]
A plot of τ vs. ⎟⎟⎠
⎞⎜⎜⎝
⎛
AC1
will yield linear curves of the form y = mx + b where
b = ⎟⎟⎠
⎞⎜⎜⎝
⎛
obsk1 [C6]
m = ⎟⎟⎠
⎞⎜⎜⎝
⎛
obs
M
kC
[C7]
Thus, the value for kobs may be determined from the inverse of the intercept. The value for CM may then be calculated by multiplying the slope by the kobs.
26

CR = 81.3 g/Lτ = 1.5853(1/CA) + 7.1185
R2 = 0.9971CR = 61.29 g/L
τ = 0.8935(1/CA)+ 3.4738R2 = 0.9907
CR = 29.19 g/Lτ = 0.6241(1/CA) + 2.7177
R2 = 0.9983
CR = 4.37 g/Lτ = 0.5541(1/CA) + 2.4128
R2 = 0.9974
-10
-5
0
5
10
15
20
25
30
-10 -5 0 5 10 15 20 2
1/CA (1/g)
τ (h
r)
5
Figure C.2.Linear Regressions for Dr. Breakthrough Kinetic Data at Various CR
The yield of the reaction [1] is closest to the data set with R/C = 4.88, or with CR = 81.3 g/L, so the appropriate data set was used to find the values for kobs and CM, as shown below:
kobs = 7.1185hr
1intercept
1= = 0.1405/hr
CM = = obskslope× 0.1405/hrmol/L1.5853hr ×⋅ = 0.2227 mol/L The calculations are shown in Table E.3 for all of the data sets.
27

Table C.1. Calculations used for the calculations and graphs in the determination of the rate constants.
1/CA τ CR* R/C kobs m Cm log(1-Cr/Cr*) log(1/k) k
L/g hr L/g - - (g·h)/L g/L - - 1/h
20.8 13.88 4.37 3.65 0.414 0.554 0.230 -0.023 -0.383 0.4234.3 5.21 4.37 3.65 0.414 0.554 0.230 -0.023 -0.383 0.423
2.67 3.79 4.37 3.65 0.414 0.554 0.230 -0.023 -0.383 0.4232.5 3.7 4.37 3.65 0.414 0.554 0.230 -0.023 -0.383 0.423
0.22 2.38 4.37 3.65 0.414 0.554 0.230 -0.023 -0.383 0.42322.2 16.67 29.19 3.76 0.368 0.624 0.230 -0.181 -0.434 0.4298.2 7.58 29.19 3.76 0.368 0.624 0.230 -0.181 -0.434 0.4292.1 3.97 29.19 3.76 0.368 0.624 0.230 -0.181 -0.434 0.4290.2 3.21 29.19 3.76 0.368 0.624 0.230 -0.181 -0.434 0.429
0.15 2.66 29.19 3.76 0.368 0.624 0.230 -0.181 -0.434 0.42911.49 13.66 61.29 3.33 0.288 0.894 0.257 -0.548 -0.541 0.458
3.7 7.25 61.29 3.33 0.288 0.894 0.257 -0.548 -0.541 0.4582.1 4.96 61.29 3.33 0.288 0.894 0.257 -0.548 -0.541 0.458
12.05 26.04 81.3 4.88 0.140 1.5853 0.223 -1.31 -0.852 0.4254.35 14.37 81.3 4.88 0.140 1.5853 0.223 -1.31 -0.852 0.4253.7 13.44 81.3 4.88 0.140 1.5853 0.223 -1.31 -0.852 0.425
2.08 10.42 81.3 4.88 0.140 1.5853 0.223 -1.31 -0.852 0.4252.08 9.92 81.3 4.88 0.140 1.5853 0.223 -1.31 -0.852 0.4250.17 7.25 81.3 4.88 0.140 1.5853 0.223 -1.31 -0.852 0.425
Average 4.02 Average 0.431 St. Dev. 0.62 St. Dev. 0.012
Determination of k, n, CR
*
Figure C.2. was made from the data in Table E.1 to determine CR
* and n using Equation C2.
log(k) = 0.3676*log(1-CR/CR*) - 0.366
R2 = 0.9965
-0.900
-0.800
-0.700
-0.600
-0.500
-0.400
-0.300
-0.200
-0.100
0.000-1.400 -1.200 -1.000 -0.800 -0.600 -0.400 -0.200 0.000
log(1-CR/CR*)
log(
k)
Figure C.3. Graph used to Determine CR
* and n
28

A plot of log kobs vs. log ⎟⎟⎠
⎞⎜⎜⎝
⎛− *
R
R
CC
1 yields a curve with a y-intercept of log k. CR* is determined
using a trial and error method. The curve was linear when the correct value of CR* was chosen.
From the regression equation, the value of CR* was determined:
log k = -0.366
k = 10-0.366 = 0.431/hr
CR* = 85.5 mol/L
Equation C2 was used to solve for n, as shown below:
n
*R
Robs C
C1kk ⎟⎟⎠
⎞⎜⎜⎝
⎛−=
⎟⎟⎠
⎞⎜⎜⎝
⎛−= *
R
Robs
CC
1lognk
klog
=⎟⎠⎞
⎜⎝⎛ −
=
⎟⎟⎠
⎞⎜⎜⎝
⎛−
=
85.5mol/L81.3mol/L1log
0.4305/hr0.1405/hrlog
CC
1log
kk
logn
*R
R
obs
0.367
29

Appendix D – MSDS for Ethanol, Acetic Acid, and Acetaldehyde
30

Appendix E – Environmental Regulations
Table E.1. Workplace Permissible Exposure Limits [5]
Organization Amount of Time Ethanol Acetic Acid Acetaldehyde OSHA 8-hr work shift 1,000 ppm 10 ppm 200 ppm NIOSH 10-hr work shift 1,000 ppm 10 ppm lowest possible ACGIH 8-hr work shit 1,000 ppm 10 ppm 25 ppm (any time)
Table E.2. Environmental Emission Standards from the EPA [19]
Pollutant Averaging Period Standard Primary
NAAQS Secondary NAAQS
1-hr Not to be at or above this level more than once per calendar year. 35.5 ppm 35.5 ppm
Carbon Monoxide 8-hr Not to be at or above this level more
than once per calendar year. 9.5 ppm 9.5 ppm
Nitrogen Dioxide Annual Not to be at or above this level. 54 ppb 54 ppb
24-hr Not to be at or above this level on more than three days over three years with daily sampling.
155 µg/m3 155 µg/m3Respirable Particulate Matter (10 microns or less) (PM10) Annual
The three-year average of annual arithmetic mean concentrations at each monitor within an area is not to be at or above this level.
51 µg/m3 51 µg/m3
24-hr
The three-year average of the annual 98th percentile for each population-oriented monitor within an area is not to be at or above this level.
66 µg/m3 66 µg/m3
Respirable Particulate Matter (2.5 microns or less) (PM2.5)
Annual
The three-year average of annual arithmetic mean concentrations from single or multiple community-oriented monitors is not to be at or above this level.
15.1 µg/m3 15.1 µg/m3
31

Appendix F – CSTR Volume and Productivity Determination
Table F.1. shows the spreadsheet used to calculate the reactor volume and productivity.
Table F.1. Excel spreadsheet used to determine CSTR volume and productivity.
vol. flow 629035 L/hr k 0.431 1/hr Go 1.284182 g/L n 0.3678 - Yo 0 g/L E* 85.5 g/L Eo 68.56589 g/L Km 0.2227 g/L e/g 0.434 y/g 0.108 Insert Sheet Numbers Here: Gi 136.1845 Vol. Flow In 610576 L/hr Ei Glucose Flow In 83151 kg/hr Ethanol Flow In 9859 kg/hr Vol. Flow Out 647494 L/hr Glucose Flow Out 831.5 kg/hr Ethanol Flow Out 44396 kg/hr Reaction Rate (y) 0.202482 Reaction Rate (g) 1.874833 Reactor Volume 426,800 L - Productivity 80.92087 g/L.hr Conversion Iterate! 0.99057
The flow values were obtained from the ChemCAD simulation of the process, which is shown in Appendix J. The volume of the CSTR was calculated from the CSTR design equation, as shown in Equation F1.
A
Ao
rXF
V−
= [F1]
where V is the reactor volume in liters, FAo is the input flow of glucose, X is the conversion with respect to glucose, and –rA is the rate law with respect to the glucose. The rate law was converted between different species by using the yield data from Dr. Breakthrough, as shown in Equation F2.
A
C
rr
yield = → yield
rr C
A = [F2]
The reactor was optimized with respect to the volume productivity, or VP, which is defined by Equation F3.
hLg ][
VF
VolumeReactor Produced EtOH of Flow MassVP R
⋅=== [F3]
The effect of key variables on the volume productivity was studied and the values for each variable were selected to maximize the VP for the reactor.
32

Appendix G - TPXY Data for Components in System
Figure G.1. TPXY Data for Ethanol/Water at 1 atm by UNIFAC
Figure G.1 shows that an EtOH/Water azeotrope occurs for 95 wt% EtOH, and a method other than distillation must be used to achieve pure EtOH. From Figure G.2 shows the water/acetic acid azeotrope.
Figure G.2. TPXY Data for Water/Acetic Acid at 1 atm by UNIFAC
33
Appendix H - Sizing the Molecular Sieve Based on the Chemcad simulation, 1405 kg/h of water had to be removed from a 25621 kg/h
stream consisting of 95 wt% ethanol to produce anhydrous alcohol. The following physical parameters were available [20]:
Quality of Adsorbent: q* = 0.103 adsorber kg
OH kg 2
Heat of Adsorption: molkJ9.42Hads =
Density of Adsorbent: 3ads mkg1210
mLg 21.1 ρ ==
Density of Solution: 3sol mkg789
mLg 789.0 ρ ==
The assumptions used in the design of the molecular sieves are the following:
− Liquid feed is a homogenous 2 component system − Model sieve as a plug flow system − EtOH is not adsorbed and the molecular sieve is initially free of EtOH − Process is isothermal − Total mole change is negligible – No accumulation within the system − No axial dispersion The vessel volume must be calculated from the mass of adsorbent required to remove the
water in the ethanol stream. The mass of the adsorbent required to remove the specified amount of water in a one hour time basis was calculated using q*:
adsorbent of kg 13643OH kg 0.103
adsorbent kg 1OH kg 1405m2
2ads =⋅= [H1]
The volume of the adsorbent was calculated by dividing mads by ρads:
adsorbent of kg 1210
m 1kg 36431 ρm
V3
ads
adsads
3m 11.275=⋅== [H2]
To determine the dimensions of the molecular sieves, a heuristic was used to determine the optimum L/D ratio of 3 for process vessels [21].
322
ads m 11.275(3D)2DπL
2DπV =⎟
⎠⎞
⎜⎝⎛=⎟
⎠⎞
⎜⎝⎛= [H3]
Solving Equation H3 yielded a diameter of 1.685 m corresponding to a vessel length of 5.06 m. The space time, τ, was calculated for the molecular sieves. The volumetric flow of the feed to the separator was calculated:
hm 47.32
789kgm 1
hrkg 25621V
33
sol =⋅= [H4]
Thus, the τ was determined to be 20.8 min, as shown below:
34

min 20.8 ==== hr 347.0
hm 32.47
m 11.275VV
3
3
sol
adsτ
The volume and space time must be corrected by a safety factor. This value was determined from uptake curves to be 50% at an operating temperature of 40ºC [20]. Thus, the corrected volume for the molecular sieve was 16.9 m3 and the corrected space time was 31.2 min. The new dimensions were calculated by solving Equation H3. Based on heuristics, the optimum diameter was 1.93 m and the corresponding length was 5.79 m.
Four molecular sieves will be rotated as they become saturated to ensure a pseudo-state process. When one molecular sieve vessel becomes saturated with water, the water will be desorbed by spraying hot air at a temperature of 200ºC. The mass of 1405 kg/h of water can be converted to 78056 mol/h, which requires 930,162 W to adsorb:
W930162==⋅=⋅=hkJ3348583
watermol1kJ 9.42
h watermol 78056 Hn Q adsOH2
[H5]
According to a heuristic, the optimum temperature approach,ΔTlm, is 15ºC and the typical heat transfer coefficient, U, is 60 W/(m2·C) [21]. A proposed schematic of the heat exchanger is shown in Figure H.1.
ΔT = 15ºC
Air 200ºC
Air 55ºC
Water 185ºC
Water 40ºC
Water Desorption
Figure H.1: Proposed schematic of heat exchanger to desorb water from molecular sieve Based on these values, the area of a heat exchanger can be calculated to be 1034 m2:
2m 1034=⋅
⋅
=Δ⋅
=C )15(
CmW)60(
W(930162)TU
Q A
2lm
[H6]
The amount of air required for the adsorption can be calculated from Equation A7. Q = m·Cp·ΔT [H7] From Chemcad, the specific heat of air, Cp, is 1001 J/(kg·C). Thus, the mass of air required is equal to 23071 kg/h.
hkg 23071==
⋅⋅
=Δ⋅
=s
kg 41.6C )145(
CmJ)0011(
sJ (930162)
TCQ m
2p
air
The water in the air will be removed in a flash tower before the air is recycled to the desorption process. The heat exchanger and desorption process will be incorporated in the final process flow design.
35

36
Appendix I – Design of Separation Section of Process The flash units and distillation columns used to recover CO2 and separate acetic acid and acetaldehyde from water were designed based upon technical heuristics for equipments sizes, operating conditions and performance. Additionally, design parameters were varied in ChemCAD process simulations to test the performance and feasibility of the process. The following heuristics were applied in the design of the distillation towers in ChemCAD:
− Height of the column can not exceed 300 ft high due to safety issues. − The column cannot have more than 150 trays if the tray spacing is 2 ft. − The temperature constraints depending on materials of construction are:
· Most processes designed to operate between 40 and 260ºC · Towers can operate between -200 and 400ºC
− The ratio of L/D is between 2 and 20. − The economically optimum number of stages is 2Nmin. − The economically optimum reflux ratio is 1.2Rmin. − The sequence of separations:
· Perform easiest separation first, as defined by fewest trays · If relative volatility or feed composition is similar, then remove components
individually as overhead products · Separate components in order of decreasing volatility: CO2, acetaldehyde, ethanol,
water, acetic acid For the Chemcad simulation, the heuristics were applied in the following manner:
− To have a reasonable tower size, the reflux ratio was increased so that fewer stages are required to obtain the desired separation
− To minimize the boiler duty, feed streams were preheated using the excess heat of streams from other parts of the process through a heat integration network The sequence of separations was based on the order of volatility: − · Flash units were used to remove the most volatile components when the components
were present in large quantities Because of its volatility, CO- 2 was recovered using a vacuum unit and purified
using a distillation tower. ile water was the most abund· Wh ant component, it was not the easiest component to
separate first because of its relative volatility and azeotropes

Appendix J - ChemCAD Process
1
3
4
Corn Syrup
Water RecycleE-101
P-101 A/B
Yeast Creamto dryer
R-101T-101
P-102 A/B
C-1015
4
8
910
15
6
18
14
28
11
19
7 11
8
1
21
12 34
20
25
26
13
17
39
2730
40
41
42
15
22
27
35
50
21
1318
22
14
41
16
64
3831
42 31
43
66
67
2
32
24
Air
37

38
Gas Stream
16
12
23
28
45
20
33
24
36
37
17
2925
3049
29
32
26
33
48
35
54
34
47
51
53
Acetaldehyde
Waste Products to Treatment
38
39
23
100% Ethanol
4059
63
95% Ethanol
DDGs
36
6543
46
57 68
69
37
4672
6219
44
5270
47
60 73
61
4571
74
55
Excess Gas
24
44
56

Appendix K - ChemCAD Report Summary CHEMCAD 5.3.0 Page 1 Job Name: Separation Final Divide 1 Air Date: 04/06/2004 Time: 22:42:54 FLOWSHEET SUMMARY Equipment Label Stream Numbers 1 MIXE 1 58 15 -3 2 HTXR 3 -4 3 PUMP 4 -5 4 REAC 6 -8 5 REAC 5 -7 -6 6 FLAS 8 -11 -9 7 PUMP 9 -10 8 SCDS 34 -64 -18 9 CFUG 10 -13 -30 10 DIVI 42 -14 -15 11 MIXE 11 7 -12 12 SCDS 24 -29 -20 -33 13 VALV 18 -22 14 DIVI 38 -31 -16 15 FLAS 50 -35 -32 16 MIXE 29 65 -25 17 SCDS 56 -19 -23 18 DRYE 43 14 -27 -28 19 MIXE 22 39 -21 20 HTXR 21 44 -24 -2 21 COMP 12 -34 22 HTXR 27 35 -50 -38 23 MIXE 32 20 -36 24 MIXE 37 36 -49 25 CFUG 13 -17 -40 26 CFUG 17 -39 -41 27 MIXE 40 41 30 -42 28 SCDS 33 -45 -37 29 MIXE 55 25 -46 30 HTXR 49 61 -26 -44 31 HTXR 67 -43 32 FLAS 26 -47 -48 33 FLAS 48 -51 -54 34 MIXE 53 47 51 -55 35 FLAS 54 -53 -56 36 DIVI 72 -58 -57 37 HTXR 19 -52 38 CSEP 62 -59 -60 39 MIXE 23 74 -61 40 DIVI 70 -63 -62 41 MIXE 16 64 -65 42 MIXE 31 66 -67 43 HTXR 57 46 -68 -69 44 VALV 52 -70 45 PUMP 71 -74 46 VALV 2 -72 47 CSEP 60 -73 -71 Stream Connections CHEMCAD 5.3.0 Page 2 Job Name: Separation Final Divide 1 Air Date: 04/06/2004 Time: 22:42:54 Stream Equipment Stream Equipment Stream Equipment From To From To From To 1 1 26 30 32 51 33 34 2 20 46 27 18 22 52 37 44 3 1 2 28 18 53 35 34 4 2 3 29 12 16 54 33 35 5 3 5 30 9 27 55 34 29 6 5 4 31 14 42 56 35 17
39

7 5 11 32 15 23 57 36 43 8 4 6 33 12 28 58 36 1 9 6 7 34 21 8 59 38 10 7 9 35 15 22 60 38 47 11 6 11 36 23 24 61 39 30 12 11 21 37 28 24 62 40 38 13 9 25 38 22 14 63 40 14 10 18 39 26 19 64 8 41 15 10 1 40 25 27 65 41 16 16 14 41 41 26 27 66 42 17 25 26 42 27 10 67 42 31 18 8 13 43 31 18 68 43 19 17 37 44 30 20 69 43 20 12 23 45 28 70 44 40 21 19 20 46 29 43 71 47 45 22 13 19 47 32 34 72 46 36 23 17 39 48 32 33 73 47 24 20 12 49 24 30 74 45 39 25 16 29 50 22 15 Calculation mode : Sequential Flash algorithm : Normal Equipment Calculation Sequence 1 2 3 5 4 6 7 9 25 26 27 10 14 42 31 11 21 8 13 19 20 12 46 36 18 22 15 28 23 24 30 32 33 35 17 37 44 40 38 47 45 39 34 41 16 29 43 Equipment Recycle Sequence 1 2 3 5 4 6 7 9 25 26 27 10 14 42 31 11 21 8 13 19 20 12 46 36 18 22 15 28 23 24 30 32 33 35 17 37 44 40 38 47 45 39 Recycle Cut Streams 58 15 44 38 35 61 Recycle Convergence Method: Direct Substitution Max. loop iterations 100 Recycle Convergence Tolerance Flow rate 1.000E-003 Temperature 1.000E-003 CHEMCAD 5.3.0 Page 3 Job Name: Separation Final Divide 1 Air Date: 04/06/2004 Time: 22:42:54 Pressure 1.000E-003 Enthalpy 1.000E-003 Vapor frac. 1.000E-003 Recycle calculation has converged. COMPONENTS ID # Name 1 134 Ethanol 2 62 Water 3 776 Alpha-D-Glucose 4 438 Urea * solid * 5 128 Acetaldehyde 6 130 Acetic Acid 7 49 Carbon Dioxide * Henry's Comp * 8 474 Phosphoric Acid 9 475 Air 10 329 MIBK THERMODYNAMICS K-value model : UNIFAC
40

No corrrection for vapor fugacity Enthalpy model : Latent Heat Liquid density : Library * Component ID 438 does not have UNIFAC subgroups. * Component ID 49 does not have UNIFAC subgroups. * Component ID 474 does not have UNIFAC subgroups. * Component ID 475 does not have UNIFAC subgroups. CHEMCAD 5.3.0 Page 4 Job Name: Separation Final Divide 1 Air Date: 04/06/2004 Time: 22:42:54 Overall Mass Balance kmol/h kg/h Input Output Input Output Ethanol 0.000 775.579 0.000 35730.149 Water 4440.744 4440.630 80000.003 79998.000 Alpha-D-Glucose 444.055 4.030 80000.000 726.032 Urea 0.000 148.037 0.000 8890.538 Acetaldehyde 0.000 5.606 0.000 246.974 Acetic Acid 0.000 4.091 0.000 245.685 Carbon Dioxide 0.000 776.281 0.000 34164.120 Phosphoric Acid 0.000 0.000 0.000 0.003 Air 12084.418 12085.729 349856.000 349894.000 MIBK 0.000 0.000 0.000 0.000 Total 16969.217 18240.000 509856.024 509895.373 CHEMCAD 5.3.0 Page 5 Job Name: Separation Final Divide 1 Air Date: 04/06/2004 Time: 22:42:54 EQUIPMENT SUMMARIES Mixer Summary Equip. No. 1 11 16 19 Name Output Pressure atm 1.0000 1.0000 1.0000 Equip. No. 23 24 27 29 Name Output Pressure atm 1.0000 2.0000 1.0000 Equip. No. 34 39 41 42 Name Output Pressure atm 1.0000 1.0000 Heat Exchanger Summary Equip. No. 2 20 22 30 Name Pressure drop 1 atm 0.0700 0.1000 Pressure drop 2 atm 0.1000 T Out Str 1 C 40.0000 15.0000 T Out Str 2 C 40.0000 100.0000 No. of SS Passes 0 1 0 0 No. of TS Passes 0 1 0 0 Calc Ht Duty MJ/h 6500.6553 94879.1016 124519.1953 30147.5039 LMTD (End points) C 6.3644 24.5940 19.9002 LMTD Corr Factor 1.0000 1.0000 1.0000 1.0000 Str1 Pout atm 0.9300 0.9000 0.9900 2.0000 Str2 Pout atm 1.9000 9.0000 2.0000 Equip. No. 31 37 43 Name Pressure drop 1 atm 0.0100 0.1000 T Out Str 1 C 80.0000 40.0000 T Out Str 2 C 25.0000 Calc Ht Duty MJ/h 205221.2188 -38554.7461 6084.4043 LMTD (End points) C 13.8583 LMTD Corr Factor 1.0000 1.0000 1.0000 Str1 Pout atm 0.9900 1.9000 1.0000
41

Str2 Pout atm 1.0000 CHEMCAD 5.3.0 Page 6 Job Name: Separation Final Divide 1 Air Date: 04/06/2004 Time: 22:42:54 EQUIPMENT SUMMARIES Pump Summary Equip. No. 3 7 45 Output pressure atm 1.0000 1.0000 2.0000 Efficiency 0.8000 0.8500 0.8500 Calculated power MJ/h 5.4888 63.5920 0.1683 Calculated Pout atm 1.0000 1.0000 2.0000 Head m 0.6494 9.3364 10.3683 Vol. flow rate 618645.1250 585804.1250 1410.6626 (liter/hr) Mass flow rate kg/h 688978.0000 589944.0000 1405.7598 Reactor Summary Equip. No. 4 5 Thermal mode 1 2 Temperature C 32.2803 40.0000 Heat duty MJ/h -1695.7787 Key Component 8 3 Frac. Conversion 1.0000 0.9900 Calc H of Reac. 561221.4375 7620.2949 (kJ/kmol) Mass base flag 1 1 Stoichiometrics: Ethanol 0.000E+000 0.434 Alpha-D-Glucose 1.000 -1.000 Urea 0.000E+000 0.108 Acetaldehyde 0.000E+000 3.000E-003 Acetic Acid 0.000E+000 3.000E-003 Carbon Dioxide 0.000E+000 0.415 Phosphoric Acid -1.000 0.037 Flash Summary Equip. No. 6 15 32 33 Flash Mode 2 2 2 2 Param 1 40.0000 -10.0000 110.0000 110.0000 Param 2 0.0900 9.0000 4.0000 3.0000 Heat duty MJ/h 133368.7656 -216866.5938 19920.6133 8.1029 K values: Ethanol 12.373 5.750E-003 3.741 4.988 Water 0.814 3.163E-004 0.356 0.474 Alpha-D-Glucose 1.000E-020 1.000E-020 1.000E-020 1.000E-020 Urea 1.000E-010 1.000E-010 1.000E-010 1.000E-010 Acetaldehyde 127.062 0.199 14.293 19.058 CHEMCAD 5.3.0 Page 7 Job Name: Separation Final Divide 1 Air Date: 04/06/2004 Time: 22:42:54 EQUIPMENT SUMMARIES Acetic Acid 1.575 7.254E-004 0.536 0.714 Carbon Dioxide 30884.010 49.971 7207.508 9610.012 Phosphoric Acid 1.762E-003 4.831E-007 1.207E-003 1.609E-003 Air 1.316E+006 3925.604 41060.938 54747.918 MIBK 123.751 0.074 22.543 30.060 Equip. No. 35 Flash Mode 2 Param 1 100.0000 Param 2 2.0000 Heat duty MJ/h -17160.2383
42
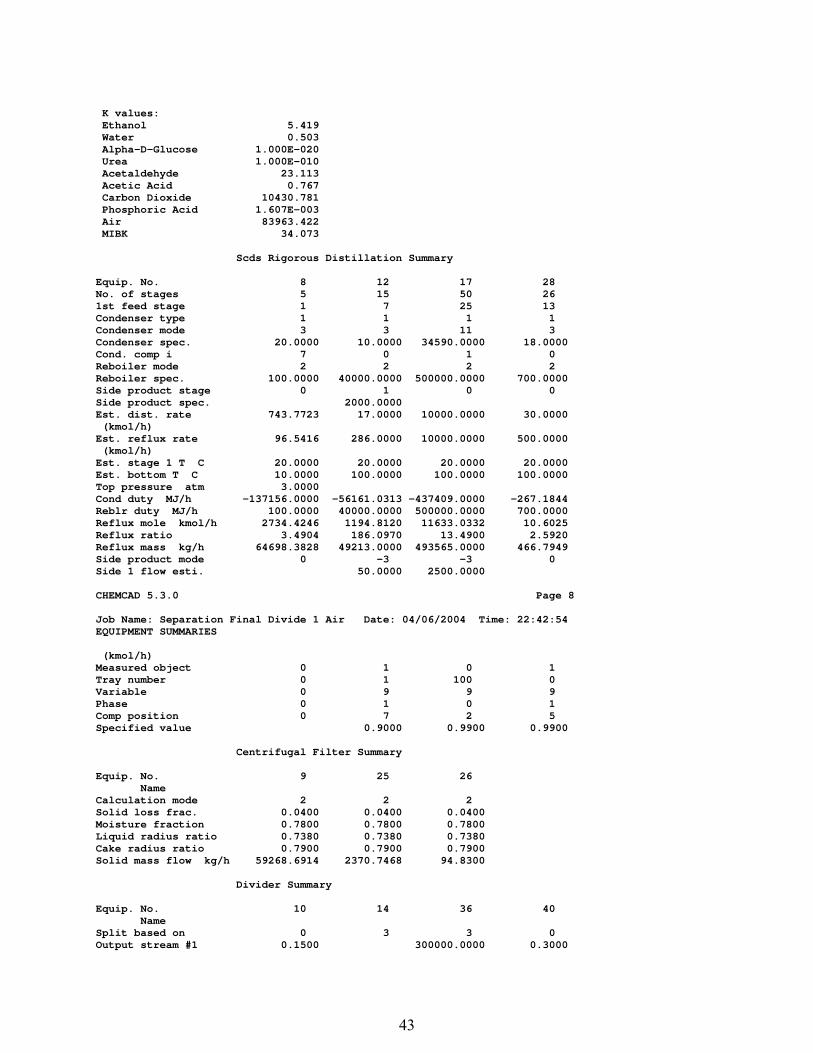
K values: Ethanol 5.419 Water 0.503 Alpha-D-Glucose 1.000E-020 Urea 1.000E-010 Acetaldehyde 23.113 Acetic Acid 0.767 Carbon Dioxide 10430.781 Phosphoric Acid 1.607E-003 Air 83963.422 MIBK 34.073 Scds Rigorous Distillation Summary Equip. No. 8 12 17 28 No. of stages 5 15 50 26 1st feed stage 1 7 25 13 Condenser type 1 1 1 1 Condenser mode 3 3 11 3 Condenser spec. 20.0000 10.0000 34590.0000 18.0000 Cond. comp i 7 0 1 0 Reboiler mode 2 2 2 2 Reboiler spec. 100.0000 40000.0000 500000.0000 700.0000 Side product stage 0 1 0 0 Side product spec. 2000.0000 Est. dist. rate 743.7723 17.0000 10000.0000 30.0000 (kmol/h) Est. reflux rate 96.5416 286.0000 10000.0000 500.0000 (kmol/h) Est. stage 1 T C 20.0000 20.0000 20.0000 20.0000 Est. bottom T C 10.0000 100.0000 100.0000 100.0000 Top pressure atm 3.0000 Cond duty MJ/h -137156.0000 -56161.0313 -437409.0000 -267.1844 Reblr duty MJ/h 100.0000 40000.0000 500000.0000 700.0000 Reflux mole kmol/h 2734.4246 1194.8120 11633.0332 10.6025 Reflux ratio 3.4904 186.0970 13.4900 2.5920 Reflux mass kg/h 64698.3828 49213.0000 493565.0000 466.7949 Side product mode 0 -3 -3 0 Side 1 flow esti. 50.0000 2500.0000 CHEMCAD 5.3.0 Page 8 Job Name: Separation Final Divide 1 Air Date: 04/06/2004 Time: 22:42:54 EQUIPMENT SUMMARIES (kmol/h) Measured object 0 1 0 1 Tray number 0 1 100 0 Variable 0 9 9 9 Phase 0 1 0 1 Comp position 0 7 2 5 Specified value 0.9000 0.9900 0.9900 Centrifugal Filter Summary Equip. No. 9 25 26 Name Calculation mode 2 2 2 Solid loss frac. 0.0400 0.0400 0.0400 Moisture fraction 0.7800 0.7800 0.7800 Liquid radius ratio 0.7380 0.7380 0.7380 Cake radius ratio 0.7900 0.7900 0.7900 Solid mass flow kg/h 59268.6914 2370.7468 94.8300 Divider Summary Equip. No. 10 14 36 40 Name Split based on 0 3 3 0 Output stream #1 0.1500 300000.0000 0.3000
43

Output stream #2 0.8500 350000.0000 0.7000 Valve Summary Equip. No. 13 44 46 Name Pressure out atm 1.0000 1.0000 1.0000 Dryer Summary Equip. No. 18 Name Prod. moisture frac 0.0200 Final vapor moisture 0.0100 Final solid temp C 25.0000 Moisture component 2.0000 CHEMCAD 5.3.0 Page 9 Job Name: Separation Final Divide 1 Air Date: 04/06/2004 Time: 22:42:54 EQUIPMENT SUMMARIES Compressor Summary Equip. No. 21 Name Pressure out atm 3.0000 Type of Compressor 1 Efficiency 0.8500 Actual power MJ/h 13951.0605 Cp/Cv 1.2599 Theoretical power 11858.4014 (MJ/h) Ideal Cp/Cv 1.2487 Calc Pout atm 3.0000 Calc. mass flowrate 99034 (kg/h) Component Separator Summary Equip. No. 38 47 Name Top Temp Spec 25.0000 25.0000 Bottom Temp Spec 25.0000 25.0000 Component No. 1 1.0000 Component No. 7 1.0000 Component No. 9 1.0000 CHEMCAD 5.3.0 Page 94 Job Name: Separation Final Divide 1 Air Date: 04/06/2004 Time: 22:42:55 FLOW SUMMARIES Stream No. 1 2 3 4 Stream Name Temp C 25.0000 40.0000 37.3881 40.0000 Pres atm 1.0000 1.9000 1.0000 0.9300 Enth MJ/h -1.8598E+006 -5.9461E+006 -9.5636E+006 -9.5571E+006 Vapor mass fraction 0.00000 0.00000 0.00000 0.00000 Total kg/h 160000.00 380551.07 688978.00 688978.00 Flowrates in kg/h Ethanol 0.00 3654.32 9803.64 9803.64 Water 80000.00 373396.02 544252.00 544252.00 Alpha-D-Glucose 80000.00 2342.08 83151.30 83151.30 Urea 0.00 3.79 50378.15 50378.15 Acetaldehyde 0.00 0.91 5.85 5.85 Acetic Acid 0.00 1153.98 1387.08 1387.08 Carbon Dioxide 0.00 0.00 0.05 0.05 Phosphoric Acid 0.00 0.01 0.01 0.01 Air 0.00 0.00 0.00 0.00
44
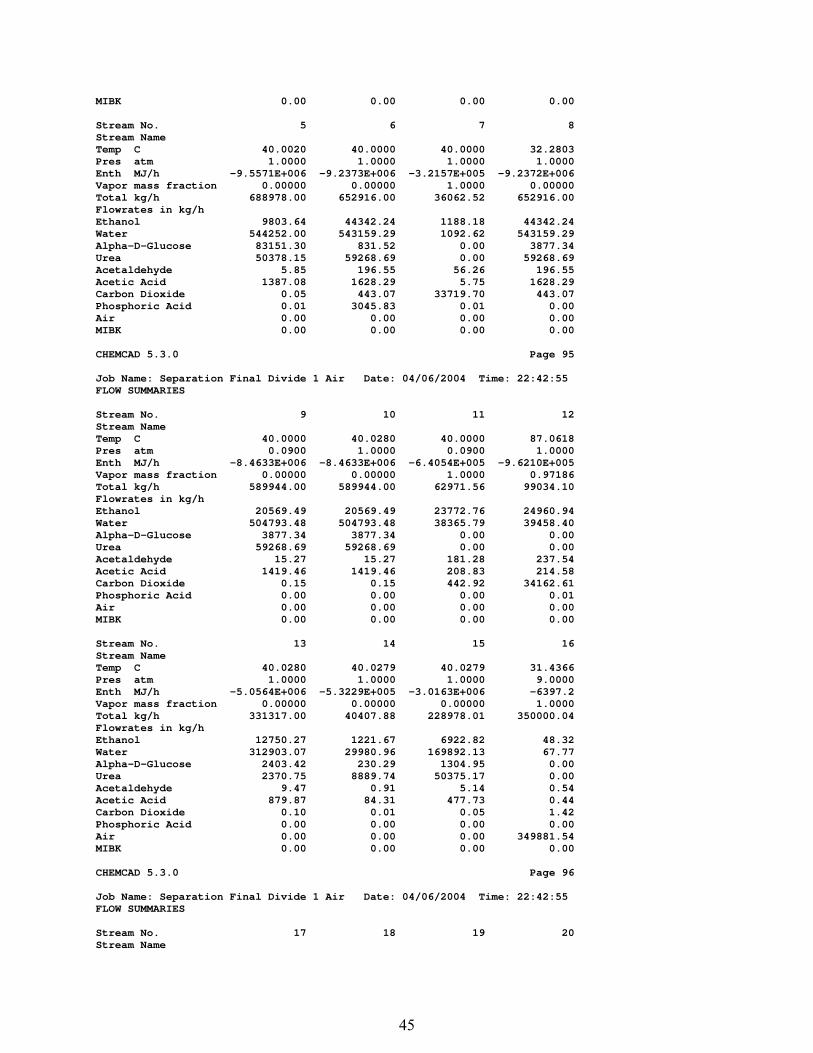
MIBK 0.00 0.00 0.00 0.00 Stream No. 5 6 7 8 Stream Name Temp C 40.0020 40.0000 40.0000 32.2803 Pres atm 1.0000 1.0000 1.0000 1.0000 Enth MJ/h -9.5571E+006 -9.2373E+006 -3.2157E+005 -9.2372E+006 Vapor mass fraction 0.00000 0.00000 1.0000 0.00000 Total kg/h 688978.00 652916.00 36062.52 652916.00 Flowrates in kg/h Ethanol 9803.64 44342.24 1188.18 44342.24 Water 544252.00 543159.29 1092.62 543159.29 Alpha-D-Glucose 83151.30 831.52 0.00 3877.34 Urea 50378.15 59268.69 0.00 59268.69 Acetaldehyde 5.85 196.55 56.26 196.55 Acetic Acid 1387.08 1628.29 5.75 1628.29 Carbon Dioxide 0.05 443.07 33719.70 443.07 Phosphoric Acid 0.01 3045.83 0.01 0.00 Air 0.00 0.00 0.00 0.00 MIBK 0.00 0.00 0.00 0.00 CHEMCAD 5.3.0 Page 95 Job Name: Separation Final Divide 1 Air Date: 04/06/2004 Time: 22:42:55 FLOW SUMMARIES Stream No. 9 10 11 12 Stream Name Temp C 40.0000 40.0280 40.0000 87.0618 Pres atm 0.0900 1.0000 0.0900 1.0000 Enth MJ/h -8.4633E+006 -8.4633E+006 -6.4054E+005 -9.6210E+005 Vapor mass fraction 0.00000 0.00000 1.0000 0.97186 Total kg/h 589944.00 589944.00 62971.56 99034.10 Flowrates in kg/h Ethanol 20569.49 20569.49 23772.76 24960.94 Water 504793.48 504793.48 38365.79 39458.40 Alpha-D-Glucose 3877.34 3877.34 0.00 0.00 Urea 59268.69 59268.69 0.00 0.00 Acetaldehyde 15.27 15.27 181.28 237.54 Acetic Acid 1419.46 1419.46 208.83 214.58 Carbon Dioxide 0.15 0.15 442.92 34162.61 Phosphoric Acid 0.00 0.00 0.00 0.01 Air 0.00 0.00 0.00 0.00 MIBK 0.00 0.00 0.00 0.00 Stream No. 13 14 15 16 Stream Name Temp C 40.0280 40.0279 40.0279 31.4366 Pres atm 1.0000 1.0000 1.0000 9.0000 Enth MJ/h -5.0564E+006 -5.3229E+005 -3.0163E+006 -6397.2 Vapor mass fraction 0.00000 0.00000 0.00000 1.0000 Total kg/h 331317.00 40407.88 228978.01 350000.04 Flowrates in kg/h Ethanol 12750.27 1221.67 6922.82 48.32 Water 312903.07 29980.96 169892.13 67.77 Alpha-D-Glucose 2403.42 230.29 1304.95 0.00 Urea 2370.75 8889.74 50375.17 0.00 Acetaldehyde 9.47 0.91 5.14 0.54 Acetic Acid 879.87 84.31 477.73 0.44 Carbon Dioxide 0.10 0.01 0.05 1.42 Phosphoric Acid 0.00 0.00 0.00 0.00 Air 0.00 0.00 0.00 349881.54 MIBK 0.00 0.00 0.00 0.00 CHEMCAD 5.3.0 Page 96 Job Name: Separation Final Divide 1 Air Date: 04/06/2004 Time: 22:42:55 FLOW SUMMARIES Stream No. 17 18 19 20 Stream Name
45
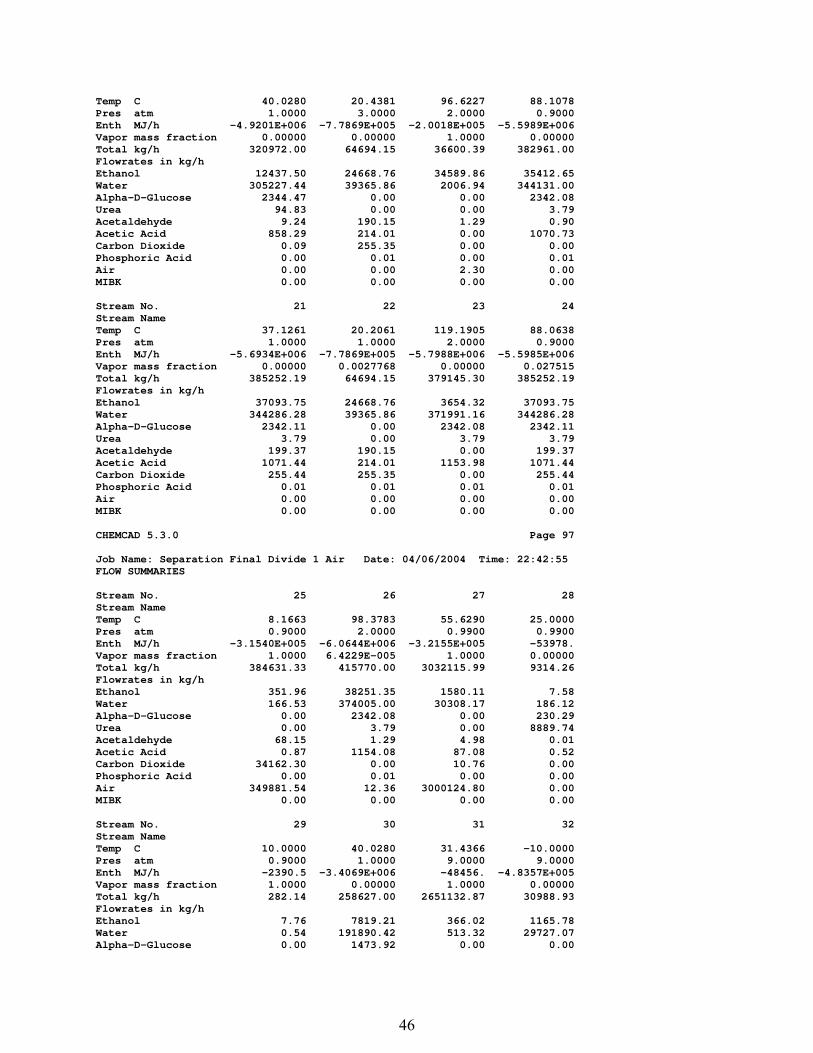
Temp C 40.0280 20.4381 96.6227 88.1078 Pres atm 1.0000 3.0000 2.0000 0.9000 Enth MJ/h -4.9201E+006 -7.7869E+005 -2.0018E+005 -5.5989E+006 Vapor mass fraction 0.00000 0.00000 1.0000 0.00000 Total kg/h 320972.00 64694.15 36600.39 382961.00 Flowrates in kg/h Ethanol 12437.50 24668.76 34589.86 35412.65 Water 305227.44 39365.86 2006.94 344131.00 Alpha-D-Glucose 2344.47 0.00 0.00 2342.08 Urea 94.83 0.00 0.00 3.79 Acetaldehyde 9.24 190.15 1.29 0.90 Acetic Acid 858.29 214.01 0.00 1070.73 Carbon Dioxide 0.09 255.35 0.00 0.00 Phosphoric Acid 0.00 0.01 0.00 0.01 Air 0.00 0.00 2.30 0.00 MIBK 0.00 0.00 0.00 0.00 Stream No. 21 22 23 24 Stream Name Temp C 37.1261 20.2061 119.1905 88.0638 Pres atm 1.0000 1.0000 2.0000 0.9000 Enth MJ/h -5.6934E+006 -7.7869E+005 -5.7988E+006 -5.5985E+006 Vapor mass fraction 0.00000 0.0027768 0.00000 0.027515 Total kg/h 385252.19 64694.15 379145.30 385252.19 Flowrates in kg/h Ethanol 37093.75 24668.76 3654.32 37093.75 Water 344286.28 39365.86 371991.16 344286.28 Alpha-D-Glucose 2342.11 0.00 2342.08 2342.11 Urea 3.79 0.00 3.79 3.79 Acetaldehyde 199.37 190.15 0.00 199.37 Acetic Acid 1071.44 214.01 1153.98 1071.44 Carbon Dioxide 255.44 255.35 0.00 255.44 Phosphoric Acid 0.01 0.01 0.01 0.01 Air 0.00 0.00 0.00 0.00 MIBK 0.00 0.00 0.00 0.00 CHEMCAD 5.3.0 Page 97 Job Name: Separation Final Divide 1 Air Date: 04/06/2004 Time: 22:42:55 FLOW SUMMARIES Stream No. 25 26 27 28 Stream Name Temp C 8.1663 98.3783 55.6290 25.0000 Pres atm 0.9000 2.0000 0.9900 0.9900 Enth MJ/h -3.1540E+005 -6.0644E+006 -3.2155E+005 -53978. Vapor mass fraction 1.0000 6.4229E-005 1.0000 0.00000 Total kg/h 384631.33 415770.00 3032115.99 9314.26 Flowrates in kg/h Ethanol 351.96 38251.35 1580.11 7.58 Water 166.53 374005.00 30308.17 186.12 Alpha-D-Glucose 0.00 2342.08 0.00 230.29 Urea 0.00 3.79 0.00 8889.74 Acetaldehyde 68.15 1.29 4.98 0.01 Acetic Acid 0.87 1154.08 87.08 0.52 Carbon Dioxide 34162.30 0.00 10.76 0.00 Phosphoric Acid 0.00 0.01 0.00 0.00 Air 349881.54 12.36 3000124.80 0.00 MIBK 0.00 0.00 0.00 0.00 Stream No. 29 30 31 32 Stream Name Temp C 10.0000 40.0280 31.4366 -10.0000 Pres atm 0.9000 1.0000 9.0000 9.0000 Enth MJ/h -2390.5 -3.4069E+006 -48456. -4.8357E+005 Vapor mass fraction 1.0000 0.00000 1.0000 0.00000 Total kg/h 282.14 258627.00 2651132.87 30988.93 Flowrates in kg/h Ethanol 7.76 7819.21 366.02 1165.78 Water 0.54 191890.42 513.32 29727.07 Alpha-D-Glucose 0.00 1473.92 0.00 0.00
46

Urea 0.00 56897.94 0.00 0.00 Acetaldehyde 20.21 5.81 4.08 0.37 Acetic Acid 0.00 539.59 3.30 83.34 Carbon Dioxide 253.63 0.06 10.75 0.00 Phosphoric Acid 0.00 0.00 0.00 0.00 Air 0.00 0.00 2650235.21 12.36 MIBK 0.00 0.00 0.00 0.00 CHEMCAD 5.3.0 Page 98 Job Name: Separation Final Divide 1 Air Date: 04/06/2004 Time: 22:42:55 FLOW SUMMARIES Stream No. 33 34 35 36 Stream Name Temp C 10.0000 148.6177 -10.0000 80.6591 Pres atm 0.9000 3.0000 9.0000 1.0000 Enth MJ/h -13270. -9.4815E+005 -1.7936E+005 -6.0824E+006 Vapor mass fraction 0.00000 1.0000 1.0000 7.6640E-005 Total kg/h 1999.94 99034.10 3001127.24 413950.00 Flowrates in kg/h Ethanol 1672.99 24960.94 414.34 36578.43 Water 146.87 39458.40 581.09 373858.00 Alpha-D-Glucose 0.00 0.00 0.00 2342.08 Urea 0.00 0.00 0.00 3.79 Acetaldehyde 178.26 237.54 4.61 1.28 Acetic Acid 0.00 214.58 3.74 1154.07 Carbon Dioxide 1.82 34162.61 10.76 0.00 Phosphoric Acid 0.00 0.01 0.00 0.01 Air 0.00 0.00 3000112.55 12.36 MIBK 0.00 0.00 0.00 0.00 Stream No. 37 38 39 40 Stream Name Temp C 75.5190 31.4366 40.0280 40.0280 Pres atm 0.9000 9.0000 1.0000 1.0000 Enth MJ/h -12147. -54854. -4.9147E+006 -1.3628E+005 Vapor mass fraction 0.00000 1.0000 0.00000 0.00000 Total kg/h 1819.78 3001132.45 320558.01 10345.08 Flowrates in kg/h Ethanol 1672.92 414.34 12425.00 312.77 Water 146.84 581.09 304920.41 7675.62 Alpha-D-Glucose 0.00 0.00 2342.11 58.96 Urea 0.00 0.00 3.79 2275.92 Acetaldehyde 0.02 4.62 9.23 0.23 Acetic Acid 0.00 3.73 857.43 21.58 Carbon Dioxide 0.00 12.17 0.09 0.00 Phosphoric Acid 0.00 0.00 0.00 0.00 Air 0.00 3000116.41 0.00 0.00 MIBK 0.00 0.00 0.00 0.00 CHEMCAD 5.3.0 Page 99 Job Name: Separation Final Divide 1 Air Date: 04/06/2004 Time: 22:42:55 FLOW SUMMARIES Stream No. 41 42 43 44 Stream Name Temp C 40.0280 40.0279 80.0000 100.0000 Pres atm 1.0000 1.0000 0.9900 2.0000 Enth MJ/h -5451.0 -3.5486E+006 1.5677E+005 -5.8512E+006 Vapor mass fraction 0.00000 0.00000 1.0000 0.00000 Total kg/h 413.80 269386.00 3001022.46 380551.07 Flowrates in kg/h Ethanol 12.51 8144.49 366.02 3654.32 Water 307.02 199873.08 513.33 373396.02 Alpha-D-Glucose 2.36 1535.24 0.00 2342.08 Urea 91.04 59264.90 0.00 3.79 Acetaldehyde 0.01 6.05 4.08 0.91 Acetic Acid 0.86 562.04 3.30 1153.98
47

Carbon Dioxide 0.00 0.06 10.75 0.00 Phosphoric Acid 0.00 0.00 0.00 0.01 Air 0.00 0.00 3000124.80 0.00 MIBK 0.00 0.00 0.00 0.00 Stream No. 45 46 47 48 Stream Name Temp C 18.0000 8.9805 110.0000 110.0000 Pres atm 0.9000 1.0000 4.0000 4.0000 Enth MJ/h -690.62 -3.1552E+005 -34.555 -6.0445E+006 Vapor mass fraction 1.0000 1.0000 1.0000 0.00000 Total kg/h 180.16 384655.23 8.40 415761.26 Flowrates in kg/h Ethanol 0.07 359.12 2.01 38249.34 Water 0.03 173.15 1.87 374003.00 Alpha-D-Glucose 0.00 0.00 0.00 2342.08 Urea 0.00 0.00 0.00 3.79 Acetaldehyde 178.24 68.15 0.00 1.29 Acetic Acid 0.00 0.90 0.01 1154.07 Carbon Dioxide 1.82 34162.30 0.00 0.00 Phosphoric Acid 0.00 0.00 0.00 0.01 Air 0.00 349891.63 4.52 7.84 MIBK 0.00 0.00 0.00 0.00 CHEMCAD 5.3.0 Page 100 Job Name: Separation Final Divide 1 Air Date: 04/06/2004 Time: 22:42:55 FLOW SUMMARIES Stream No. 49 50 51 52 Stream Name Temp C 80.6562 15.0000 110.0000 40.0000 Pres atm 2.0000 0.9900 3.0000 1.9000 Enth MJ/h -6.0946E+006 -4.4607E+005 -56.891 -2.3874E+005 Vapor mass fraction 2.5986E-005 1.0000 1.0000 6.0919E-005 Total kg/h 415770.00 3032115.99 10.18 36600.39 Flowrates in kg/h Ethanol 38251.35 1580.11 3.29 34589.86 Water 374005.00 30308.17 3.06 2006.94 Alpha-D-Glucose 2342.08 0.00 0.00 0.00 Urea 3.79 0.00 0.00 0.00 Acetaldehyde 1.29 4.98 0.00 1.29 Acetic Acid 1154.08 87.08 0.01 0.00 Carbon Dioxide 0.00 10.76 0.00 0.00 Phosphoric Acid 0.01 0.00 0.00 0.00 Air 12.36 3000124.80 3.81 2.30 MIBK 0.00 0.00 0.00 0.00 Stream No. 53 54 55 56 Stream Name Temp C 100.0000 110.0000 104.5282 100.0000 Pres atm 2.0000 3.0000 2.0000 2.0000 Enth MJ/h -31.774 -6.0444E+006 -123.22 -6.0615E+006 Vapor mass fraction 1.0000 0.00000 1.0000 0.00000 Total kg/h 5.30 415751.00 23.89 415746.00 Flowrates in kg/h Ethanol 1.86 38246.05 7.17 38244.19 Water 1.69 374000.00 6.62 373998.02 Alpha-D-Glucose 0.00 2342.08 0.00 2342.08 Urea 0.00 3.79 0.00 3.79 Acetaldehyde 0.00 1.29 0.00 1.29 Acetic Acid 0.01 1154.05 0.03 1154.04 Carbon Dioxide 0.00 0.00 0.00 0.00 Phosphoric Acid 0.00 0.01 0.00 0.01 Air 1.74 4.03 10.07 2.30 MIBK 0.00 0.00 0.00 0.00 CHEMCAD 5.3.0 Page 101 Job Name: Separation Final Divide 1 Air Date: 04/06/2004 Time: 22:42:55 FLOW SUMMARIES
48

Stream No. 57 58 59 60 Stream Name Temp C 40.0000 40.0000 25.0000 25.0000 Pres atm 1.0000 1.0000 1.0000 1.0000 Enth MJ/h -1.2586E+006 -4.6875E+006 -1.4583E+005 -22283. Vapor mass fraction 0.00000 0.00000 0.00000 0.0011532 Total kg/h 80551.07 300000.00 24212.90 1407.37 Flowrates in kg/h Ethanol 773.51 2880.81 24212.90 0.00 Water 79036.57 294359.45 0.00 1404.85 Alpha-D-Glucose 495.75 1846.33 0.00 0.00 Urea 0.80 2.99 0.00 0.00 Acetaldehyde 0.19 0.71 0.00 0.91 Acetic Acid 244.26 909.72 0.00 0.00 Carbon Dioxide 0.00 0.00 0.00 0.00 Phosphoric Acid 0.00 0.01 0.00 0.00 Air 0.00 0.00 0.00 1.61 MIBK 0.00 0.00 0.00 0.00 Stream No. 61 62 63 64 Stream Name Temp C 118.8455 39.9966 39.9966 20.0000 Pres atm 2.0000 1.0000 1.0000 3.0000 Enth MJ/h -5.8210E+006 -1.6711E+005 -71621. -3.0661E+005 Vapor mass fraction 0.00000 7.6580E-005 7.6580E-005 1.0000 Total kg/h 380551.07 25620.28 10980.12 34349.17 Flowrates in kg/h Ethanol 3654.32 24212.90 10376.96 295.87 Water 373396.02 1404.85 602.08 98.22 Alpha-D-Glucose 2342.08 0.00 0.00 0.00 Urea 3.79 0.00 0.00 0.00 Acetaldehyde 0.91 0.91 0.39 47.40 Acetic Acid 1153.98 0.00 0.00 0.43 Carbon Dioxide 0.00 0.00 0.00 33907.26 Phosphoric Acid 0.01 0.00 0.00 0.00 Air 0.00 1.61 0.69 0.00 MIBK 0.00 0.00 0.00 0.00 CHEMCAD 5.3.0 Page 102 Job Name: Separation Final Divide 1 Air Date: 04/06/2004 Time: 22:42:55 FLOW SUMMARIES Stream No. 65 66 67 68 Stream Name Temp C 8.9692 25.0000 11.8372 21.7565 Pres atm 1.0000 1.0000 1.0000 1.0000 Enth MJ/h -3.1300E+005 -0.0084798 -48456. -1.2647E+006 Vapor mass fraction 1.0000 1.0000 1.0000 0.00000 Total kg/h 384349.20 349856.00 3000988.67 80551.07 Flowrates in kg/h Ethanol 344.19 0.00 366.02 773.51 Water 165.99 0.00 513.32 79036.57 Alpha-D-Glucose 0.00 0.00 0.00 495.75 Urea 0.00 0.00 0.00 0.80 Acetaldehyde 47.93 0.00 4.08 0.19 Acetic Acid 0.87 0.00 3.30 244.26 Carbon Dioxide 33908.68 0.00 10.75 0.00 Phosphoric Acid 0.00 0.00 0.00 0.00 Air 349881.54 349856.00 3000091.23 0.00 MIBK 0.00 0.00 0.00 0.00 Stream No. 69 70 71 72 Stream Name Temp C 25.0000 39.9966 25.0000 40.0000 Pres atm 1.0000 1.0000 1.0000 1.0000 Enth MJ/h -3.0943E+005 -2.3874E+005 -22283. -5.9461E+006 Vapor mass fraction 1.0000 7.6580E-005 0.00000 0.00000 Total kg/h 384655.23 36600.39 1405.76 380551.07 Flowrates in kg/h
49

Ethanol 359.12 34589.86 0.00 3654.32 Water 173.15 2006.94 1404.85 373396.02 Alpha-D-Glucose 0.00 0.00 0.00 2342.08 Urea 0.00 0.00 0.00 3.79 Acetaldehyde 68.15 1.29 0.91 0.91 Acetic Acid 0.90 0.00 0.00 1153.98 Carbon Dioxide 34162.30 0.00 0.00 0.00 Phosphoric Acid 0.00 0.00 0.00 0.01 Air 349891.63 2.30 0.00 0.00 MIBK 0.00 0.00 0.00 0.00 CHEMCAD 5.3.0 Page 103 Job Name: Separation Final Divide 1 Air Date: 04/06/2004 Time: 22:42:55 FLOW SUMMARIES Stream No. 73 74 Stream Name Temp C 25.0000 25.0286 Pres atm 1.0000 2.0000 Enth MJ/h -0.019844 -22283. Vapor mass fraction 1.0000 0.00000 Total kg/h 1.61 1405.76 Flowrates in kg/h Ethanol 0.00 0.00 Water 0.00 1404.85 Alpha-D-Glucose 0.00 0.00 Urea 0.00 0.00 Acetaldehyde 0.00 0.91 Acetic Acid 0.00 0.00 Carbon Dioxide 0.00 0.00 Phosphoric Acid 0.00 0.00 Air 1.61 0.00 MIBK 0.00 0.00
50
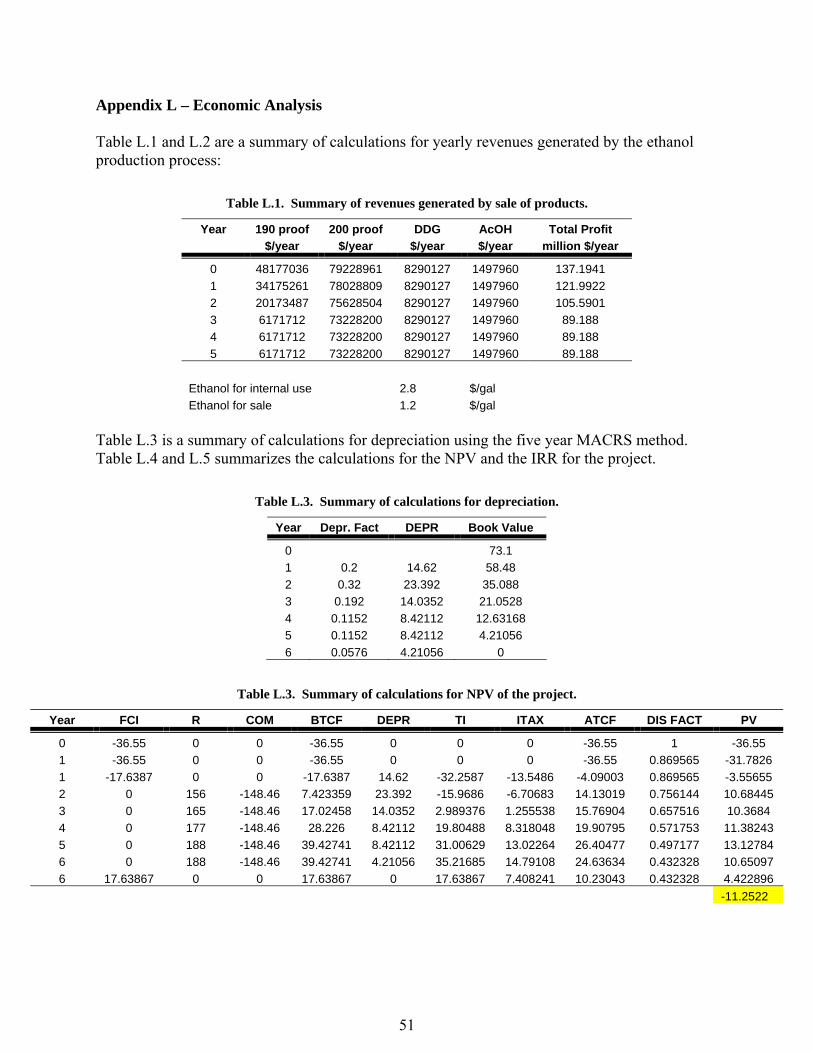
Appendix L – Economic Analysis Table L.1 and L.2 are a summary of calculations for yearly revenues generated by the ethanol production process:
Table L.1. Summary of revenues generated by sale of products.
Year 190 proof 200 proof DDG AcOH Total Profit $/year $/year $/year $/year million $/year
0 48177036 79228961 8290127 1497960 137.1941 1 34175261 78028809 8290127 1497960 121.9922 2 20173487 75628504 8290127 1497960 105.5901 3 6171712 73228200 8290127 1497960 89.188 4 6171712 73228200 8290127 1497960 89.188 5 6171712 73228200 8290127 1497960 89.188
Ethanol for internal use 2.8 $/gal Ethanol for sale 1.2 $/gal
Table L.3 is a summary of calculations for depreciation using the five year MACRS method. Table L.4 and L.5 summarizes the calculations for the NPV and the IRR for the project.
Table L.3. Summary of calculations for depreciation.
Year Depr. Fact DEPR Book Value
0 73.1 1 0.2 14.62 58.48 2 0.32 23.392 35.088 3 0.192 14.0352 21.0528 4 0.1152 8.42112 12.63168 5 0.1152 8.42112 4.21056 6 0.0576 4.21056 0
Table L.3. Summary of calculations for NPV of the project.
Year FCI R COM BTCF DEPR TI ITAX ATCF DIS FACT PV
0 -36.55 0 0 -36.55 0 0 0 -36.55 1 -36.55 1 -36.55 0 0 -36.55 0 0 0 -36.55 0.869565 -31.7826 1 -17.6387 0 0 -17.6387 14.62 -32.2587 -13.5486 -4.09003 0.869565 -3.55655 2 0 156 -148.46 7.423359 23.392 -15.9686 -6.70683 14.13019 0.756144 10.68445 3 0 165 -148.46 17.02458 14.0352 2.989376 1.255538 15.76904 0.657516 10.3684 4 0 177 -148.46 28.226 8.42112 19.80488 8.318048 19.90795 0.571753 11.38243 5 0 188 -148.46 39.42741 8.42112 31.00629 13.02264 26.40477 0.497177 13.12784 6 0 188 -148.46 39.42741 4.21056 35.21685 14.79108 24.63634 0.432328 10.65097 6 17.63867 0 0 17.63867 0 17.63867 7.408241 10.23043 0.432328 4.422896
-11.2522
51

Table L.4. Calculation for the internal rate of return.
Cum. CF DIS FACT PV Cum CF
-36.55 1 -36.55 -36.55 -68.33 0.910062 -33.2628 -69.8128 -71.89 0.910062 -3.72218 -73.535 -61.20 0.828214 11.70281 -61.8321 -50.84 0.753726 11.88554 -49.9466 -39.45 0.685938 13.65561 -36.291 -26.33 0.624246 16.48308 -19.8079 -15.68 0.568103 13.99598 -5.81194 -11.25 0.568103 5.811937 -7.4E-07
-7.4E-07 ITAX rate 0.42
IRR 9.88%
52