appendix j2, onshore emf assessment
TRANSCRIPT

Slu1rise \~ti11cl
Powered by 0rsted & Eversource
Construction and Operations Plan Appendix J2 – Onshore EMF Assessment
Sunrise Wind Farm Project
Appendix J2 Onshore EMF Assessment
Prepared for:
August 23, 2021

Sunrise \~'incl
Powered by 0rsted & Eversource
CONSTRUCTION AND OPERATIONS PLAN
This page intentionally left blank

Sl,11r1se \~'i11cl
Powered by 0rsted & Eversource
~:~~~ ;.::.-::
Onshore DC and AC Magnetic-Field Assessment Sunrise Wind Farm Project
Prepared for: Sunrise Wind LLC
Prepared by: Exponent Engineering P.C.
June 2021

Sunrise Wind Farm Project – Onshore DC and AC Magnetic-Field Assessment
Contents Acronyms and Abbreviations iv
Executive Summary vi
1.0 Introduction 1
1.1 Project Description 1
1.2 Technical Background 3 1.2.1 DC and AC Magnetic-Fields 3 1.2.2 Guidelines for Human Exposure to DC Magnetic Fields 4 1.2.3 Guidelines for Human Exposure to AC Magnetic Fields 4
2.0 Transmission Cable Configurations 5
2.1 DC Onshore Transmission Cable 5
2.2 AC Onshore Interconnection Cable 5
3.0 Modeling Results 6
3.1 DC Modeling Results 6 3.1.1 DC Magnetic-Field Levels 6 3.1.2 Compass Deflection 7
3.2 AC Modeling Results 7
4.0 Conclusions 8
5.0 References 9
Attachment A - Duct Bank Cross Section and Cable Configurations Attachment B - Calculation Methods Attachment C - Calculated Magnetic Fields
June 2021 ii 1907679.EX0 – 5158

Sunrise Wind Farm Project – Onshore DC and AC Magnetic-Field Assessment
List of Tables Table 1. Calculated DC magnetic-field deviations from the Earth’s ambient geomagnetic field of
506 mG evaluated at various horizontal distances 3.3 ft (1 m) above ground and at average loading 6
Table 2. Calculated AC magnetic-field levels (mG) at various horizontal distances 3.3 ft (1m) above ground at average loading 7
List of Figures Figure 1. Overview of the proposed Onshore Interconnection and Transmission Cable routes. 2
June 2021 iii 1907679.EX0 – 5158

Sunrise Wind Farm Project – Onshore DC and AC Magnetic-Field Assessment
Acronyms and Abbreviations
µT Microtesla A Ampere AC Alternating current cm Centimeter DC Direct current Eversource Eversource Investment LLC Exponent Exponent Engineering PC ft Feet GCC Ground continuity conductor HDD Horizontal directional drilling Hz Hertz ICD Implantable cardioverter defibrillator ICES International Committee on Electromagnetic Safety ICNIRP International Commission on Non-Ionizing Radiation Protection IEEE Institute of Electrical and Electronics Engineers km Kilometer kV Kilovolt kV/m Kilovolt per meter Lease Area Renewable Energy Lease Area OCS-0487 LIPA Long Island Power Authority m Meter mi Mile mG Milligauss mm Millimeter nm Nautical mile nT Nanotesla NY New York OCS‒DC Offshore Converter Station (direct current electrical technology) OD Outer diameter OnCS–DC Onshore Converter Station (direct current electrical technology) Orsted NA Orsted North America, Inc. PDE Project design envelope Project Sunrise Wind Farm Project PVC Polyvinyl chloride SRWEC Sunrise Wind Export Cable SRWF Sunrise Wind Farm Sunrise Wind Sunrise Wind LLC TJB Transition joint bay XLPE Cross-linked polyethylene
June 2021 iv 1907679.EX0 – 5158
Sunrise Wind Farm Project – Onshore DC and AC Magnetic-Field Assessment
Limitations
At the request of TRC Environmental Corporation (TRC) and Sunrise Wind LLC (Sunrise Wind), Exponent Engineering PC (Exponent) modeled the alternating current and direct current magnetic fields and induced electric fields associated with the operation of the onshore cables proposed for the Sunrise Wind Offshore Wind Farm Project (the Project).
This report summarizes the analysis performed to date and presents the findings resulting from that work. In the analysis, we have relied on cable design geometry, usage, specifications, and various other types of information provided by TRC and Sunrise Wind. We cannot verify the correctness of this input data and rely on TRC and Sunrise Wind for the data’s accuracy. Although Exponent has exercised usual and customary care in the conduct of this analysis, the responsibility for the design and operation of the Project remains fully with the client. TRC has confirmed to Exponent that the data contained herein are not subject to Critical Energy Infrastructure Information restrictions.
The analyses presented herein are made to a reasonable degree of engineering and scientific certainty. Exponent reserves the right to supplement this report and to expand or modify opinions based on review of additional material as it becomes available, through any additional work, or review of additional work performed by others.
The scope of services performed during this investigation may not adequately address the needs of other users of this report, and any re-use of this report or its findings, conclusions, or recommendations presented herein for purposes other than intended for project permitting are at the sole risk of the user. The opinions and comments formulated during this assessment are based on observations and information available at the time of the investigation. No guarantee or warranty as to future life or performance of any reviewed condition is expressed or implied.
Benjamin R.T. Cotts, Ph.D., P.E. (Licensed Electrical Engineer, New York, #103209) employed by Exponent, performed and reviewed calculations of the electric and magnetic fields associated with the operation of the proposed Project.
______________________
Benjamin Cotts, Ph.D., P.E.
June 2021 v 1907679.EX0 – 5158

Sunrise Wind Farm Project – Onshore DC and AC Magnetic-Field Assessment
Executive Summary
Orsted North America Inc. (Orsted NA) and Eversource Investment LLC (Eversource) have proposed the Sunrise Wind Farm Project (the Project) to be located off Rhode Island and Long Island, New York. The electricity generated by the Project will be brought to shore over direct current (DC) submarine cables and then delivered by an underground Onshore Transmission Cable to the Onshore Converter Station (OnCS– DC). At the OnCS–DC, the electricity is converted to 60 Hertz (Hz) alternating current (AC) at 138 kilovolts for transmission over the underground Onshore Interconnection Cable to the existing Holbrook Substation in the Town of Brookhaven, New York.
At the request of TRC Environmental Corporation (TRC) and Sunrise Wind LLC (Sunrise Wind), Exponent Engineering PC (Exponent) calculated the DC and AC magnetic fields associated with the operation of these onshore underground cables.
The DC electricity on the Onshore Transmission Cable will produce a local change to the Earth’s geomagnetic field in the area immediately surrounding the cable. The resulting deviations from the Earth’s ambient geomagnetic field and compass deflections will diminish rapidly with distance. The highest total magnetic field at 3.3 feet (1 meter) above ground at average loading is 708 milligauss (mG), and at peak loading is 890 mG, which reflects the contribution from the ambient geomagnetic field of 506 mG and a maximum change from the DC cables of 202 mG and 384 mG for average and peak loading, respectively. Elsewhere on the Onshore Transmission Cable route, the cables are calculated to reduce the ambient geomagnetic field to a minimum of 306 mG and 134 mG for average and peak loading, which reflects the contribution from the ambient geomagnetic field of 506 mG and respective reductions of 200 mG and 372 mG from the DC cables.
The calculated DC magnetic-field levels are far below the International Commission on Non-Ionizing Radiation Protection’s standard for human exposure to static (i.e., DC) magnetic fields (i.e., < 0.1 percent of the general public exposure limit of 4,000,000 mG) for all cable configurations evaluated. The highest calculated magnetic field is also well below the applicable medical device standard of 10,000 mG for exposure of implanted medical devices to static magnetic fields.
The DC and AC magnetic-field levels associated with the operation of equipment within the OnCS–DC were not calculated, as fields from these sources can be expected to be at minimal levels outside the boundaries of the OnCS–DC. Therefore, the dominant sources of magnetic fields at the perimeter of the OnCS–DC will be the new underground Onshore Transmission Cable and the new underground Onshore Interconnection Cable. The AC magnetic fields at the edges of the right-of-way (ROW) on which the Onshore Interconnection Cable will be installed are calculated to be well below the New York State Public Service Commission’s limit of 200 mG from 60-Hz magnetic fields from new transmission lines at ROW edges.
Note that this Executive Summary does not contain all of Exponent’s technical evaluations, analyses, conclusions, and recommendations. Hence, the main body of this report is at all times the controlling document.
June 2021 vi 1907679.EX0 – 5158

Sunrise Wind Farm Project – Onshore DC and AC Magnetic-Field Assessment
1.0 Introduction 1.1 Project Description
Sunrise Wind LLC (Sunrise Wind), a 50/50 joint venture between Orsted North America Inc. (Orsted NA) and Eversource Investment LLC (Eversource), proposes to construct, own, and operate the Sunrise Wind Farm Project (the Project) in federal waters on the outer continental shelf in the designated Bureau of Ocean Energy Management (BOEM) Renewable Energy Lease Area OCS-A 0487 (Lease Area)1. The Lease Area is approximately 18.9 statute miles (mi) (16.4 nautical miles [nm]; 30.4 kilometers [km]) south of Martha’s Vineyard, Massachusetts; approximately 30.5 mi (26.5 nm; 48.1 km) east of Montauk, New York (NY); and 16.7 mi (14.5 mi; 26.8 km) from Block Island, Rhode Island. Components of the Project will be located in federal waters on the outer continental shelf, in state waters of NY, and onshore in the Town of Brookhaven, Long Island, NY. The proposed interconnection termination will be the existing Holbrook Substation, which is owned and operated by the Long Island Power Authority.
The electricity generated by the offshore wind turbines will be converted to direct current (DC) for transmission to shore over the ±320 kilovolt (kV) Sunrise Wind Export Cable (SRWEC). At the landfall location, the submarine cables enter conduits installed by horizontal directional drilling (HDD) to connect to the underground Onshore Transmission Cable at transition joint bays (TJB). The Onshore Transmission Cable will connect the TJBs to the Onshore Converter Station (OnCS–DC) where the DC power will be converted to 60-Hertz (Hz) alternating current (AC) for transmission over the 138-kV AC Onshore Interconnection Cable to the Holbrook Substation. Exponent evaluated the magnetic fields associated with each of the onshore Project components:
• The Onshore Transmission Cable between TJBs and the OnCS–DC; and, • The Onshore Interconnection Cable between the OnCS–DC and the existing Holbrook Substation. 2
Figure 1 provides an overview of the routes of the Onshore Transmission and Interconnection Cables.
1 A portion of Lease Area OCS-A 0500 (Bay State Wind LLC) and the entirety of Lease Area OCS-A 0487 (formerly Deepwater Wind New England LLC) were assigned to Sunrise Wind LLC on September 3, 2020, and the two areas were merged and a revised Lease OCS-A 0487 was issued on March 15, 2021. Thus, when using the term “Lease Area” within this COP, Sunrise Wind is referring to the new merged Lease Area OCS-A 0487.
2 The fields associated with the operation of the OnCS–DC itself were not calculated because the strongest fields at the site boundary will come from the lines connecting to this type of facility as described in Institute of Electrical and Electronic Engineers Guide for the Design, Construction, and Operation of Electric Power Substations for Community Acceptance and Environmental Compatibility (IEEE Std. 1127-2013). New York: IEEE, 2013.
June 2021 1 1907679.EX0 - 5158

Facilities
Sunrise \Alirtcl
Powered by 0rsted & Eversource
.._ 1::11 ........ -.., c,,w - 51.nise- Wnd ~ CC:!H- ~'m--OCS~ -= ~wnd~Clr~ ~ llla'!.C•HrS)
- ~~II'~[~ .. ~ ''""'' Op,ic<,J ~ ~!'CIIOI H00A
- 1,,0J"QIQ1t<CI$, = 1.0l'Cllo1t"OOC
= - WO~l100 1)1;.W P1C.0)
0f'r1Cf'f~CCIC'f-
- t.e~~~~~ - Ol'tsl'l<)' ,t ~CIICl'lccc.+~
- ~/\•~=:~ WQl'l(~-OCt l?3 ~SUtmoticM,
l!!!ln L ~NB:rcutc .... t-a-.. - lic:r.d!=l~=iofr.. i!cut-c-a,c irdii!,~
-and ~h:-~O.:V--cfow:rw• =--" ~ i.t;G:s"'hott~~
Di>:e- 12/18'2020 ~,e.viH-clt +.ll/'2021
Proie-c: t Number 20281131j? ... _.y •• 11'4t-A.,,.-.'l'd e.,. LI
0 I mie " 0 Utm @
kd<!'e>!'l h11:1~ t.AD l~~HlM!:.no, !!Il l
Sunrise Wind Farm Project – Onshore DC and AC Magnetic-Field Assessment
Figure 1. Overview of the proposed Onshore Facilities.
June 2021 2 1907679.EX0 - 5158
Sunrise Wind Farm Project – Onshore DC and AC Magnetic-Field Assessment
A range of onshore Project design and routing alternatives are being considered to allow for assessments of proposed activities and the flexibility to make development decisions prior to construction. The Project design envelope (PDE) involves scenarios with potential magnetic-field effects that are associated with onshore Project infrastructure. This onshore magnetic-field assessment considers the information available at this time; the precise locations and schedule of the construction and operation scenarios may be subject to change as the engineering design progresses.
The Onshore Transmission Cable and Onshore Interconnection Cable will be the dominant sources of magnetic fields above ground. This report presents the DC 0-Hz (i.e., static) magnetic field associated with the Onshore Transmission Cable and the 60-Hz AC magnetic field associated with the Onshore Interconnection Cable.
An assessment of the magnetic fields and induced electric fields in the marine environment associated with the offshore elements of the Project is provided in the companion report, Offshore DC and AC Electric- and Magnetic-Field Assessment (Exponent 2021a). An additional report for the regulatory permitting of the cables in NY, titled Sunrise Wind Magnetic-Field Assessment in New York (Exponent 2021b) has been provided to the New York Department of Public Service in compliance with requirements of Article VII projects in NY.
1.2 Technical Background
1.2.1 DC and AC Magnetic-Fields
Magnetic fields associated with electricity flowing on the Onshore Transmission Cable and Onshore Interconnection Cables are reported as magnetic flux density in units of milligauss (mG), where 1 Gauss is equal to 1,000 mG. In some countries and in some technical literature, magnetic fields may be reported as microtesla (µT), where 1 mG is equal to 0.1 µT.
The Onshore Transmission Cable will generate a static DC magnetic field like the static geomagnetic field of the Earth, and the Onshore Interconnection Cable will generate an AC magnetic field for which the direction oscillates 60 times each second (i.e., a frequency of 60 Hz). These magnetic fields differ in their interactions with organisms and the environment, so are calculated and evaluated separately.
The Earth’s geomagnetic field (used for compass navigation) is ubiquitous. As noted, the Earth’s geomagnetic field is a static magnetic field, meaning that it does not vary substantially in strength or direction with time. The DC magnetic field generated by the Onshore Transmission Cable will combine via vector addition with the Earth’s geomagnetic field (i.e., the DC field from the Onshore Transmission Cable may increase or decrease the magnitude of the local geomagnetic field and its direction near the cable).
The voltage applied to the conductors within the both the Onshore Transmission Cable and Onshore Interconnection Cable creates an electric field, but it will not be a direct source of any electric field above ground due to the cable construction, the duct bank, and burial underground, so above-ground electric fields are not discussed further in this report.
The magnetic-field levels for both the Onshore Transmission Cable and the Onshore Interconnection Cable, around the Onshore Interconnection Cable’s conductors, will vary depending on the magnitude of the electrical current—expressed in units of amperes (A)—that flows through the cables. Since current on the conductors will vary with varying power generation (dependent upon the speed of the wind and operational status), measurements or calculations of these fields represent only a snapshot of conditions at one moment in time.
June 2021 3 1907679.EX0 - 5158

Sunrise Wind Farm Project – Onshore DC and AC Magnetic-Field Assessment
On a given day, throughout a week, or over the course of months or years, the magnetic-field and induced electric-field levels also will vary. To account for this variability, calculations were performed for annual average load and for the peak load generated by the Project, which will produce the average and maximum field levels expected for the proposed Project.
1.2.2 Guidelines for Human Exposure to DC Magnetic Fields
There is no federal standard for exposure to magnetic fields from DC transmission lines. The International Commission on Non-Ionizing Radiation Protection (ICNIRP) recommends a limit of 4,000,000 mG for general public exposure, not including persons with implantable medical devices, such as pacemakers or implantable cardiac defibrillators (ICD) (ICNIRP 2009). For individuals with implanted medical devices, the standard from the Association for the Advancement of Medical Instrumentation (ISO/ANSI/AAMI 14117:2019) specifies that pacemaker and ICD functions should not be affected when exposed to DC magnetic fields less than 10,000 mG. Exposure of these devices to magnetic fields up to 500,000 mG should not affect functions after discontinuation of exposure (ISO 2019).
1.2.3 Guidelines for Human Exposure to AC Magnetic Fields
The federal government has not enacted any limits for electric fields or magnetic fields from land- or marine-based AC cables or other sources of 60-Hz fields.3 The World Health Organization recommends that countries follow limits on human exposure to AC electric fields and magnetic fields, such as those developed by two international organizations—the International Committee on Electromagnetic Safety (ICES) and ICNIRP. ICES operates “under the rules and oversight of the Institute of Electrical and Electronics Engineers (IEEE) Standards Association Board,”4 and developed an exposure reference level limit to 60-Hz magnetic fields of 9,040 mG for the general public (ICES 2019). ICNIRP, an independent organization that provides scientific advice and guidance on health and environmental effects of non-ionizing radiation, determined a reference level limit of 2,000 mG for whole-body exposure to 60-Hz magnetic fields (ICNIRP 2010). These limits are the result of extensive review and evaluation of relevant research of health and safety issues, and the limits they propose are designed to protect the health and safety of persons in an occupational setting and for the general public. The electric fields induced by AC magnetic fields from the Onshore Interconnection Cable are roughly one million times lower than limits recommended by either ICES or ICNIRP for electric-field exposure, so human exposure to electric fields is not addressed further.
For individuals with implanted medical devices (such as pacemakers or ICDs), the European Committee for Electrotechnical Standardization (CENELEC) has recommended a not-to-exceed reference level of 1,000 mG for magnetic fields (CENELEC 2010).
3 While NY has guidelines for electric fields and magnetic fields from new AC transmission lines; these are addressed in a separate report regarding Article VII compliance, titled Sunrise Wind Magnetic-Field Assessment in New York (Exponent 2021b).
4 http://www.ices-emfsafety.org/.
June 2021 4 1907679.EX0 - 5158

Sunrise Wind Farm Project – Onshore DC and AC Magnetic-Field Assessment
2.0 Transmission Cable Configurations The configurations of the Onshore Transmission Cable and Onshore Interconnection Cable used to calculate the magnetic fields are described in Attachment B. The DC and AC fields from the equipment within the OnCS–DC and Holbrook Substation are not included in this report since the highest magnetic-field levels around the perimeter of these facilities will be due to the Onshore Transmission Cable and Onshore Interconnection Cable entering and exiting the substation. This is consistent with IEEE Standard 1127, which notes:
In a substation, the strongest fields near the perimeter fence come from the transmission and distribution lines entering and leaving the substation. The strength of fields from equipment inside the fence decreases rapidly with distance, reaching very low levels at relatively short distances beyond substation fences (IEEE 2013).
2.1 DC Onshore Transmission Cable
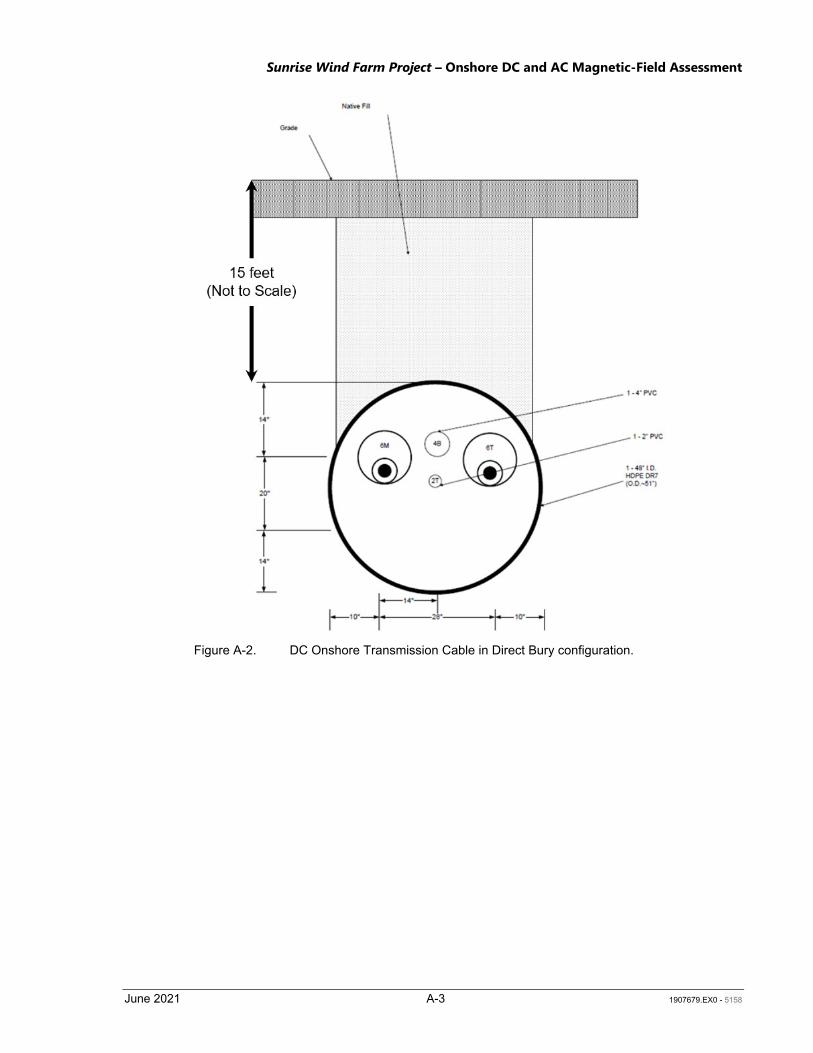
The Onshore Transmission Cable will consist of two conductors encased in cross-linked polyethylene (XLPE), each installed in a separate 8-inch (20-centimeter [cm]) polyvinyl chloride (PVC) conduit. Over the majority of the onshore route, the Onshore Transmission Cable will be installed in an underground duct bank as shown in Attachment A, Figure A-1. For short portions of the route, the Onshore Transmission Cable will be installed in a direct bury configuration shown in Attachment A, Figure A-2. A summary of DC modeling parameters is provided in Attachment A, Table A-1, and details of the DC modeling methods are provided in Attachment B.
2.2 AC Onshore Interconnection Cable
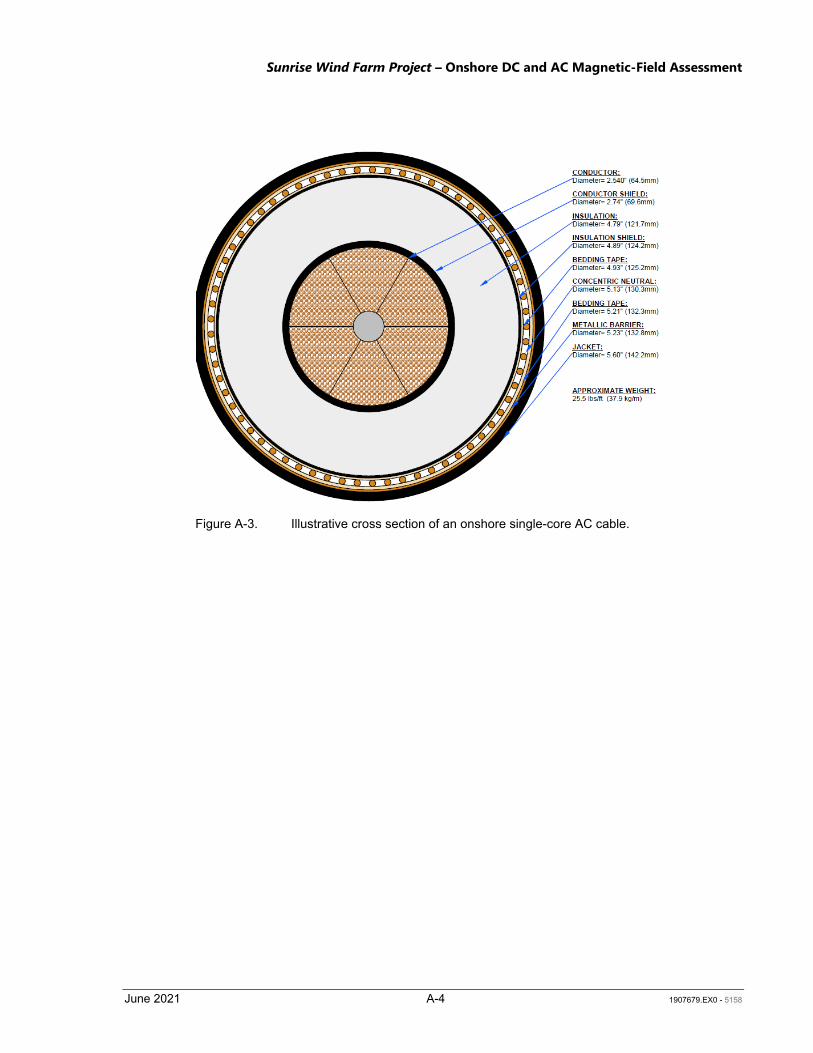
At the OnCS–DC, the electricity will be converted from DC to 138-kV AC for transmission to the point of interconnection at the Holbrook Substation. The 138-kV Onshore Interconnection Cable will be installed in twin duct banks, each of which will house a single-circuit, comprised of six single-core XLPE cables, two for each phase (shown in Attachment A, Figure A-3). The XLPE covered cables in each duct bank will be installed in separate 8-inch (20-cm) PVC conduits. separated by an edge-edge distance of 15 feet (ft) (4.6 meters [m]) (as shown in Attachment A, Figure A-4). A summary of the input data used in the AC modeling is provided in Attachment A, Table A-2, and details of the AC modeling methods are provided in Attachment B.
June 2021 5 1907679.EX0 - 5158

Sunrise Wind Farm Project – Onshore DC and AC Magnetic-Field Assessment
3.0 Modeling Results 3.1 DC Modeling Results For the Onshore Transmission Cable, the combined DC magnetic field from the cable and the Earth’s ambient geomagnetic field of 506 mG were evaluated together. The deviation from the Earth’s ambient geomagnetic field also was evaluated.
3.1.1 DC Magnetic-Field Levels
At the DC duct bank, the highest total magnetic field at 3.3 ft (1 m) above ground at average loading is 708 mG, which reflects the contribution from the ambient geomagnetic field of 506 mG and a maximum change of 202 mG from the DC cables (where the DC duct bank is installed in an east-west direction). Elsewhere on the Onshore Transmission Cable route, the DC fields are calculated to reduce the ambient geomagnetic field to a minimum of 306 mG (a reduction of about 200 mG). These maximum deviations (both increases and decreases) occur close to the duct bank and decrease rapidly with distance. At 10 ft (3 m) from the DC duct bank, the total magnetic field is within about 10 percent of background levels (i.e., a deviation of 51 mG or less). The results of the deviation from the Earth’s ambient geomagnetic field at average loading are shown in Table 1. Magnetic-field deviations at peak loading will be larger (a maximum of –372 mG to 384 mG falling to –80 to 99 mG), that is, about a 20 percent change from background levels at a distance of 10 ft (3 m) from the DC duct bank. Detailed calculated magnetic field values at average loading are summarized in Attachment C, Tables C-1, C-2, and C-4; calculations at peak loading are summarized in Attachment C, Table C- and C-5.
Where the Onshore Transmission Cable is installed via direct bury, the DC magnetic-field levels (and deviations) are much lower due to the greater burial depth; a maximum deviation from the ambient geomagnetic field is calculated to be approximately 38 mG relative to the Earth’s ambient geomagnetic field at average loading. For peak loading, this calculated maximum deviation is approximately 85 mG. Graphical results for all configurations are shown in Attachment C, Figure C-1 to Figure C-7.5
Table 1. Calculated DC magnetic-field deviations from the Earth’s ambient geomagnetic field of 506 mG evaluated at various horizontal distances 3.3 ft (1 m) above ground and at average loading
DC Magnetic Fields (mG)
–25 ft –10 ft +10 ft +25 ft Configuration* (–7.6 m) (–3 m) (+) Max (‒) Max (+3 m) (+7.6 m) DC Duct Bank ‒16 to 16 ‒45 to 51 29 to 202 ‒200 to ‒24 ‒39 to 46 ‒15 to 15
DC Direct Bury ‒8.9 to 9.2 ‒25 to 25 4.9 to 38 ‒38 to ‒4.7 ‒27 to 27 ‒7.7 to 8.0 * As shown in Attachment B, the deviation from the Earth’s ambient geomagnetic field depends on the geographic
orientation of the cables. These results summarize the range of deviations over all assessed geographic directions, summarized in Attachment A, Table A-1.
Magnetic field levels where the Onshore Transmission cable passes via HDD beneath water bodies (e.g., Yaphank Creek) were not calculated because of the much greater burial depth expected at these locations. Field levels in the water above the HDD-buried cables are likely to be similar to or lower than magnetic-field levels in Table 1 due to greater burial depths and similar or smaller conductor spacings.
June 2021 6 1907679.EX0 - 5158
5

Sunrise Wind Farm Project – Onshore DC and AC Magnetic-Field Assessment
3.1.2 Compass Deflection
Traditional compasses that rely on the Earth’s geomagnetic field may detect a small change in the compass reading above the Onshore Transmission Cable that will diminish quickly with distance. Modern navigational instruments that obtain compass readings and locations from global positioning system receivers would not be affected by the DC magnetic-field deflections from the Onshore Transmission Cable.
Computed compass deviations at a height of 3.3 ft (1 m) above ground at average loading are 39 degrees or less directly above the DC duct bank, and 2.3 degrees or less at 25 ft (7.6 m) from the centerline. Maximum deviations over the DC direct bury configuration at a height of 3.3 ft (1 m) above ground at average loading are lower (6.9 degrees or less), but decrease somewhat more slowly (a maximum deviation of 4 degrees at a distance of 25 ft [7.6 m] from the centerline). Given the ubiquity of navigation systems that do not rely on the Earth’s geomagnetic field and the proposed location of the Onshore Transmission Cable, a local deviation of a few degrees for such a short distance would not likely interfere with the use of ordinary compasses. Detailed results of this analysis are provided in Attachment C, Figures C-9 to C-14 and Tables C-6 to C-10.
3.2 AC Modeling Results
The calculated AC magnetic-field levels from the Onshore Interconnection Cable are summarized below in Table 2. The magnetic-field level decreases rapidly with distance from the centerline. At 3.3 ft (1 m) directly above the Onshore Transmission Cable at average loading, the magnetic field is calculated to be 34 mG. At a distance of ±10 ft (±3 m) and ±25 ft (±7.6 m) from the duct bank centerline, the values decrease to 32 mG and 11 mG, respectively.
A graph of the AC magnetic field as a function of horizontal distance from the Onshore Interconnection Cable is shown in Attachment C, Figure C-15, and tabular results for peak and average loading are shown in Attachment C, Table C-11.
Table 2. Calculated AC magnetic-field levels (mG) at various horizontal distances 3.3 ft (1m) above ground at average loading
Configuration
AC Magnetic Fields (mG)*
–25 ft (–7.6 m)
–10 ft (–3 m) Max +10 ft
(+3 m) +25 ft
(+7.6 m)
Onshore Interconnection Cable 11 32 34 32 11
* As shown in Attachment A, Figure A-4, for the Onshore Interconnection Cable, the 12 cables are divided into two groups (separated by 15 to 20 ft [4.6 to 6 m]). The horizontal distance is measured from the center of the AC duct bank or from the midpoint of the twin AC direct bury or twin AC interconnection duct banks.
June 2021 7 1907679.EX0 - 5158
Sunrise Wind Farm Project – Onshore DC and AC Magnetic-Field Assessment
4.0 Conclusions Magnetic-field levels are routinely assessed in terms of standards and guidelines developed by scientific and health agencies to protect health and safety and are based on reviews and evaluations of relevant health research.
The calculated DC magnetic-field levels for the Onshore Transmission Cable are far below ICNIRP’s standard for human exposure to static magnetic fields (i.e., < 0.1 percent of the general public exposure limit of 4,000,000 mG) for all cable configurations evaluated. The highest calculated magnetic-field level also is well below the applicable medical device standard of 10,000 mG for exposure of implanted medical devices to static magnetic fields.
The maximum calculated AC magnetic-field levels directly above the Onshore Interconnection Cable at average or peak loading are substantially below the guidelines for the general population of 2,000 mG and 9,040 mG set by ICNIRP and ICES, respectively, and decrease rapidly with distance. These levels are also far below the 1,000 mG limit specified in the CENELEC 50527-1:2010 standard for medical devices.
The AC and DC magnetic fields associated with the operation of equipment within the OnCS–DC were not calculated, as fields from these sources can be expected to be at minimal levels outside the perimeter of the OnCS–DC. Therefore, the dominant sources of magnetic fields at the OnCS–DC perimeters will be the new underground Onshore Transmission Cable and underground Onshore Interconnection Cable that connect the OnCS–DC to the Holbrook Substation.
The Onshore Transmission Cable and Onshore Interconnection Cable will not be a direct source of any electric field above ground due to the cable construction, duct bank, and burial underground.
June 2021 8 1907679.EX0 - 5158

Sunrise Wind Farm Project – Onshore DC and AC Magnetic-Field Assessment
5.0 References European Committee for Electrotechnical Standardization (CENELEC). 2010. Procedure for the Assessment of the Exposure to Electromagnetic Fields of Workers Bearing Active Implantable Medical Devices – Part 1 – General. EN 50527-1. CENELEC, Brussels.
Exponent, Inc. (Exponent). 2021a. Offshore DC and AC Electric- and Magnetic-Field Assessment. Prepared for Sunrise Wind LLC. Exponent, Bowie, MD.
Exponent, Inc. (Exponent). 2021b. Sunrise Wind Magnetic-Field Assessment in New York. Prepared for Sunrise Wind LLC. Exponent, Bowie, MD.
Institute of Electrical and Electronics Engineers (IEEE). 2010. IEEE Recommended Practice for Measurements and Computations of Electric, Magnetic, and Electromagnetic fields with respect to Human Exposure to Such Fields, 0 Hz to 100 kHz (IEEE Std. C95.3.1-2010). IEEE, New York.
Institute of Electrical and Electronic Engineers (IEEE). 2013. IEEE Guide for the Design, Construction, and Operation of Electric Power Substations for Community Acceptance and Environmental Compatibility (IEEE Std. 1127-2013). IEEE, New York.
Institute of Electrical and Electronics Engineers (IEEE). 2019. Standard Procedures for Measurement of Power Frequency Electric and Magnetic Fields from AC Power Lines (ANSI/IEEE Std. 644-2019). IEEE, New York.
International Commission on Non-Ionizing Radiation Protection (ICNIRP). 2009. Guidelines on limits of exposure to static magnetic fields. Health Phys. 96:504-514.
International Commission on Non-ionizing Radiation Protection (ICNIRP). 2010. Guidelines for limiting exposure to time-varying electric and magnetic fields (1 Hz to 100 kHz). Health Phys. 99:818-836.
International Committee on Electromagnetic Safety (ICES). 2019. IEEE Standard for Safety Levels with Respect to Human Exposure to Electromagnetic Fields 0 to 300 GHz. IEEE Std C95.1-2019 (Revision of IEEE Std C95.1-2005/ Incorporates IEEE Std C95.1-2019/Cor 1-2019). IEEE, New York.
International Geomagnetic Reference Field Model 1945 – 2025 (IGRF-13) and Related Parameters. https://ccmc.gsfc.nasa.gov/modelweb/models/igrf_vitmo.php.
International Organization for Standardization (ISO). 2019. Active implantable medical devices — Electromagnetic compatibility — EMC test protocols for implantable cardiac pacemakers, implantable cardioverter defibrillators and cardiac resynchronization devices (ISO/ANSI/AAMI 14117:2019).
June 2021 9 1907679.EX0 - 5158

Attachment A
Duct Bank Cross Section and Cable Configurations

Sunrise Wind Farm Project – Onshore DC and AC Magnetic-Field Assessment
Table A-1. Summary of DC Onshore Transmission Cable Specifications
Configuration 1 2
Description DC Onshore Transmission Cable (Duct Bank)
DC Onshore Transmission Cable (Direct Bury)
Source capacity 1200 MW Voltage ±320 kV Average Loading per Cable* 1015 A Peak Loading per Cable* Confidential
Number of Cables 2 (positive and negative poles)
Phase Cable Type, Outer Diameter (OD)
XLPE: 5.6-inch OD (142.2 millimeter [mm])
Horizontal conduit spacing 19.25-inches (489 mm)
Geographic Orientation (Degrees North from East)
30° and 75° 110° and 155°
north-south east-west
Burial Depth 3 ft (0.9 m) 15 ft (4.6 m)
Evaluation Height At 3.3 ft (1 m) above ground
* The polarity (direction) of current flow affects the calculated magnetic field. Therefore, both polarities have been assessed (i.e., left cable carrying current towards the OnCS–DC, with right cable carrying current away from the OnCS–DC, and vice-versa).
Table A-2. Summary of AC Onshore Interconnection Cable and Installation Specifications.
Description AC Onshore Interconnection Cable
Source capacity 880 MW Voltage 138 kV Average Loading per Cable 590 A Peak Loading per Cable Confidential Number of Cables 12 (4 of each phase) Separation between Duct Banks or Conduits 15 ft (4.6 m)
Phase Cable Type, Outer Diameter (OD)
Single-core XLPE, 4.9-inch OD (123.2 mm)
Phase Conductor Diameter 2.5-inches (64.5 mm)
GCC cable type, Outer Diameter (OD)
750 kcmil copper, 1.2-inch OD (30.5 mm)
Burial Depth 3 ft (0.9 m)
Evaluation Height At 3.3 ft (1 m) above ground
June 2021 A-1 1907679.EX0 - 5158
SHC ,4 ,. PVC CO .DUI
16 SCH O PVC METALLIC RETI.I R
co 1 DWT
(2)1 8~ SCH Cl PVC PO IERCAB!LE
CO DUITS
FLIJIDIIZED THEIR . AL BAC FILL ~~
FLUIDIZED THER -AIL B,ACKFILL
2"
Sunrise Wind Farm Project – Onshore DC and AC Magnetic-Field Assessment
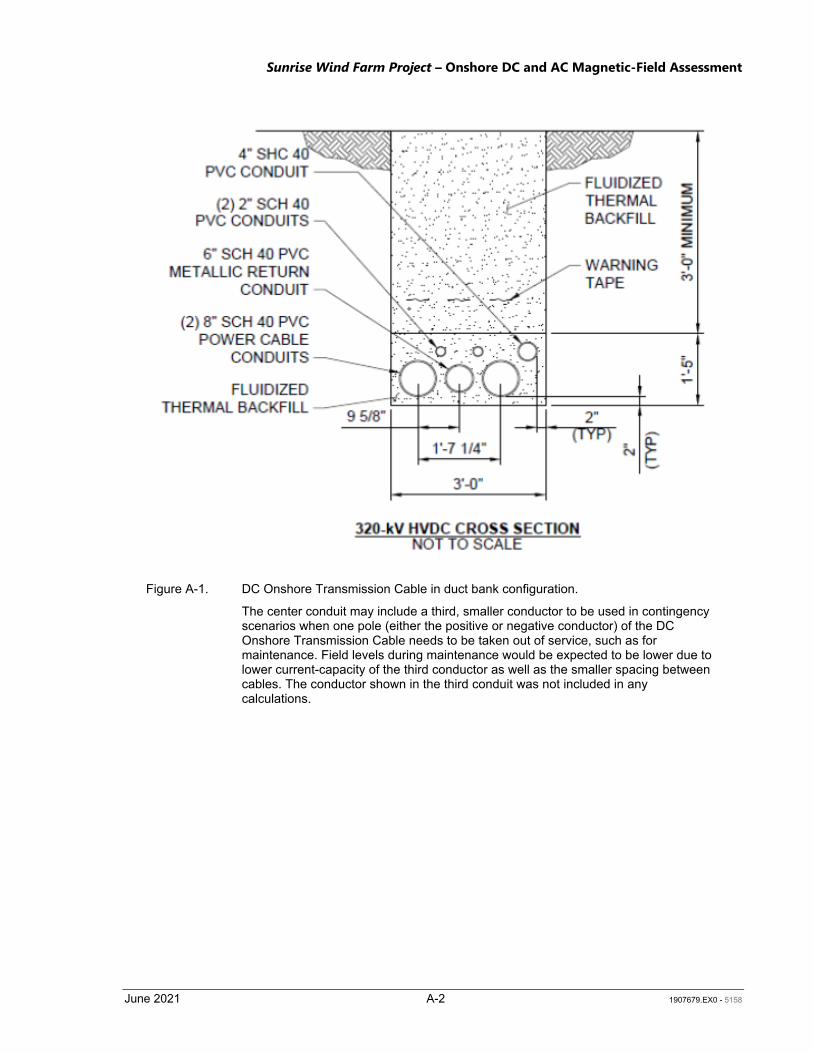
Figure A-1. DC Onshore Transmission Cable in duct bank configuration.
The center conduit may include a third, smaller conductor to be used in contingency scenarios when one pole (either the positive or negative conductor) of the DC Onshore Transmission Cable needs to be taken out of service, such as for maintenance. Field levels during maintenance would be expected to be lower due to lower current-capacity of the third conductor as well as the smaller spacing between cables. The conductor shown in the third conduit was not included in any calculations.
June 2021 A-2 1907679.EX0 - 5158
feet (Not to Scale)
l~ , ..
, .. l
1-4" PVC
Sunrise Wind Farm Project – Onshore DC and AC Magnetic-Field Assessment
Figure A-2. DC Onshore Transmission Cable in Direct Bury configuration.
June 2021 A-3 1907679.EX0 - 5158
NDUCTOR: iameter= 2.540" (64 .5mm)
CONDUCTOR SHIELD: iameler= 2.74" (69.6mm)
INSULATION: iameler= 4.79" (121.7mm)
INSULATION SHIELD: iameler= 4.89" (124.2mm)
BEDDING TAPE: iameler= 4.93" (125.2mm)
CONCENTRIC NEUTRAL: iameter-= 5.13" (130.3mm)
BEDDING TAPE: iameler= 5.21 " (132.3mm)
METALLIC BARRIER : iameter= 5.23" (132.8mm)
APPROXIMATE WEIGHT: 25.5 lbs/fl (37.9 kglm)
Sunrise Wind Farm Project – Onshore DC and AC Magnetic-Field Assessment
Figure A-3. Illustrative cross section of an onshore single-core AC cable.
June 2021 A-4 1907679.EX0 - 5158

feet
Sunrise Wind Farm Project – Onshore DC and AC Magnetic-Field Assessment
e
Figure A-4. AC 138-kV Onshore Interconnection Cables in twin duct bank configurations.
For each duct bank, the Onshore Interconnection Cable is proposed to be installed with two conductors per phase, with the phasing arrangement of the conductors selected to minimize magnetic fields above ground (as shown above). Two ground continuity conductors will be installed in 2-inch conduits.
June 2021 A-5 1907679.EX0 - 5158

Attachment B
Calculation Methods

Sunrise Wind Farm Project – Onshore DC and AC Magnetic-Field Assessment
DC Magnetic-Field Modeling Methods
Since the magnetic field generated by the Onshore Transmission Cable is combined with the Earth’s geomagnetic field by vector addition, the relative orientation of these two fields changes the resulting combined magnetic field. To assess the range of DC magnetic-field levels that could be associated with the cable when oriented in different directions, calculations were performed for six representative cable directions, as shown in Figure B-1—two between Fire Island and where the route turns west (75 and 110 degrees east of north); two in a general westerly direction (30 and 155 degrees east of north), and along a north-south orientation and an east-west orientation to provide additional bounds on the calculated field levels.
Since in principle it is possible for the direction of current flow to change during operation (i.e., which cable will carry current towards the DC offshore converter station (OCS‒DC), and which will carry current away from the OCS‒DC, both options were assessed. The interaction of the DC magnetic-field vectors from the cable with the Earth’s geomagnetic field vectors will yield different results for each segment of the onshore routes. Typical DC magnetic-field levels were calculated by assuming an average load on the cables. To obtain peak DC magnetic-field levels, the current flow equal to the maximum power output of the Project was assumed.
Onshore Transmission Cable modeling results are shown for each of four cable and current flow configurations at both peak and average loading and six geographic directions to determine the upper bound of magnetic-field levels.
Earth’s Geomagnetic Field
The total DC magnetic field near the Onshore Transmission Cable depends on the magnitude and direction of the DC magnetic field from the cables, as well as the strength and direction of Earth’s ambient geomagnetic field. The strength of Earth’s ambient geomagnetic field was obtained from the International Geomagnetic Reference Field (IGRF-13) Model.6 The geomagnetic field at 40.83°N, 71.53°W (approximately at the center of the SRWEC cable route) is used in all calculations, corresponding to the geomagnetic components shown in Table B-1. At this location, the geomagnetic field has a ‒14-degree declination (westward of geographic north) and a 65.8-degree inclination (downward). Along the Onshore Transmission Cable route, the geomagnetic field does not vary sufficiently to affect the reported ambient geomagnetic-field values by more than approximately 1 percent.
Table B-1. Geomagnetic magnetic field at coordinates 40.83°N, 71.53°W
Component Geomagnetic field (in nanotesla [nT] and mG)
Northern component 20,510.9 nT = 205 mG
Eastern component ‒5,036.1 nT = ‒5.0 mG
Downward component 45,945.6 nT = 459 mG
Total geomagnetic field* 506 mG
*Total geomagnetic field is calculated as the square root of the sum of the components squared
https://ccmc.gsfc.nasa.gov/modelweb/models/igrf_vitmo.php
June 2021 B-1 1907679.EX0 – 5158
6

Sunrise Wind Farm Project – Onshore DC and AC Magnetic-Field Assessment
Magnetic-Field From DC Cable
DC current flowing through a conductor creates a DC (i.e., static) magnetic field. The static magnetic field from the DC current is calculated by the application of the Biot-Savart Law, which is derived from fundamental laws of physics. Application of the Biot-Savart Law is particularly appropriate for long straight conductors such as the Onshore Transmission Cable for which analytical solutions are straightforward and are given by the formula:
μ0I|𝐵𝐵| = μ0|𝐻𝐻| =
2π𝑟𝑟
where B is the magnetic flux density, μ0 is the magnetic permeability of a vacuum, I is the current, and r is the distance from each cable conductor. In order to calculate the total magnetic field, the calculated magnetic-field vector from the Onshore Transmission Cable is added to Earth’s geomagnetic-field vector.
Compass Deflection
The strength of the total DC magnetic field due to the combined field from the Onshore Transmission Cable and the Earth’s geomagnetic field is one way to describe the effect of the DC cable on the local environment. Another is to evaluate how much the local geomagnetic field changes direction and strength as a result of the Onshore Transmission Cable. For example, a compass needle typically points along the direction of the Earth’s geomagnetic field, but a new nearby DC magnetic-field source may cause a local deviation to a new apparent direction of magnetic north around the cable. Here, this deviation is calculated as the compass deflection, which is the difference in angular direction in degrees between the horizontal component of the ambient geomagnetic field and the horizontal component direction of the combined geomagnetic field from the Earth and from the Onshore Transmission Cable.
June 2021 B-2 1907679.EX0 – 5158

degrees north of east
I ~north-south
Onshore Fac ilities
Sunrise \~'incl
Powered by 0rsted & Eversource
leg,nO
c:::I Sl.lr.rise Wino farm (S..Wf] = $1.Jl'Yise Wna ~ COOi@- /Sli!WEC-OCS) = sunrise Wino e(pon COOle- [SRWec-N'l'Sj
- ~W?C- UYS (We s.em LOnofOI opTionJ
== lonofa HODA = lOn:Jfal l-iOO& = lOnafol liOOC = lmrOCOCntOI waterway HOO flCW HOO)
~ Trarurrislion OJt>.e
- Uf SEMCe llooo ~ e - onsncre ten:onMCtion coooe lloule
IJIIIII :::n::~=!:'sronon1ones-oc) Im HO!croolt Subnar.on
Dote 12/18 /2020 Revise d; 6/1 /'2021
Project Number 202811 3199
Prepared By PB
Reviewed By u
1 mile
0 I.S km
N
@ ~ Clle ci\lal7: 1:6J.ld0
1~198320l 1U"t.t~ler~
Sunrise Wind Farm Project – Onshore DC and AC Magnetic-Field Assessment
Figure B-1. Geographic orientation of Onshore Transmission Cable and Onshore Interconnection Cable routes.
June 2021 B-3 1907679.EX0 – 5158

Sunrise Wind Farm Project – Onshore DC and AC Magnetic-Field Assessment
AC Magnetic-Field Modeling Methods
For the Onshore Interconnection Cable, magnetic-field levels were calculated using the commercial software package COMSOL MultiPhysics Version 5.5, which is a finite element analysis, solver, and simulation software suite. The conductor locations were determined with the assumption that each cable rests at the bottom of its containing conduit. All conductors were modeled as straight, parallel to one another, and infinite in extent below a flat ground.7 The proximity of ground continuity conductors (GCC) to the phase conductors results in an induced current flowing on the GCC, which in turn is the source of an opposing magnetic field. This current on the GCCs is included in the calculations of the total resultant magnetic field. Typical magnetic-field levels were calculated by assuming an average load on the cable. To obtain peak AC magnetic-field levels, a current flow is used equal to the maximum power output of the Project.8
Magnetic-field levels are reported at 3.3 ft (1 m) above ground as the root mean square value of the resultant field in accordance with IEEE Standard C95.3.1-2010 and IEEE Standard 644-2019 (IEEE 2010, 2019). Magnetic-field levels are reported out to a distance of ±100 ft (±30 m) from the centerline of the duct bank.
7 The effects of current imbalance, sheath currents, ground currents, and cable materials surrounding the copper conductor, including ferromagnetic shielding effects and eddy currents, were not modeled. It was further assumed there would be no attenuation of magnetic fields by any surrounding materials (e.g., the duct bank, the Earth, etc.).
8 New York Article VII filings require magnetic-field modeling to be performed at winter normal conductor rating (rather than average or peak loading presented herein) and reported as the maximum of the magnetic field ellipse (rather than the resultant of three orthogonal vectors as reported herein). Field levels calculated and presented in Exponent (2021b) therefore will be different than reported herein.
June 2021 B-4 1907679.EX0 – 5158

Attachment C
Calculated Magnetic Fields

Sunrise Wind Farm Project – Onshore DC and AC Magnetic-Field Assessment
DC Onshore Transmission Cables
DC Magnetic Field
The DC current load within the Onshore Transmission Cable, whether installed in duct banks or via direct bury, generates a static magnetic field around these cables. The magnetic field was calculated for four representative cable directions (30 degrees, 75 degrees, 110 degrees, and 155 degrees north of east), plus the two cardinal directions, north-south and east-west, to cover the full range of possible directions. For each of the cable orientations, the magnetic field was calculated for the DC duct bank configuration and the DC direct bury configuration. For both configurations, current was modeled to flow toward the OnCS–DC in the left duct and flow away from the OnCS–DC in the right duct, as well as for opposite polarity (current flowing toward the OnCS–DC in the right duct and away from the OnCS–DC in the left duct). Calculations were performed for both average and peak loading.
Figure C-1 shows calculations for the DC duct bank configuration in an east-west orientation for average loading. In each subplot, the dashed gray line is the value of Earth’s ambient geomagnetic field at the location of the cable, and the solid blue line is the total magnetic-field level (DC Onshore Transmission Cables + Earth’s geomagnetic field) calculated at 3.3 ft (1 m) above ground. This figure shows that the direction of the current has a significant effect on the total calculated field level. Both graphs show the total magnetic-field level (B total = Bcable + Bearth), but for current flowing out of the page in the left conduit (Figure C-1a), the total magnetic increases near the duct bank, whereas for current flowing out of the page in the right conduit (Figure C-1b), the total magnetic field decreases near the duct bank.
This same information can be summarized in tabular format, but instead of presenting the total magnetic-field level (B total = Bcable + Bearth), Table C- shows the difference (or deviation) between the total field and the ambient geomagnetic field (BDeviation = |B total| - |Bearth|).9 Table C-1 shows the maximum positive deviation ‘(+) Max,’ maximum negative deviation ‘(–) Max,’ and the deviation at ±10 ft (±3 m) from the Onshore Transmission Cable centerline. The first two rows of Table C- show the results corresponding to Figure C-1 for the DC duct bank, with the two subsequent rows showing the results for the same orientation (east-west) for the DC direct bury configuration. For example, the maximum negative deviation from the Earth’s geomagnetic field (the first row of Table C-, corresponding to the solid blue line in Figure C-1a) is larger (–200 mG) than the maximum positive deviation (+53 mG). At a distance of –10 ft (–3 m) from the DC duct bank centerline, the deviation is +51 mG, while at +10 ft (+3 m) from the DC duct bank centerline, the deviation is –1.4 mG. Using a similar analysis of Figure C-1b, the combined summary for the east-west direction is that the maximum positive deviation varies from 53 to 202 mG and the maximum negative deviation varies between –200 and –45 mG. Table C-1 also shows that at ±10 ft (±3 m) from the centerline, the magnetic-field deviation varies between –45 and +51 mG and demonstrates that within ±10 ft (±3 m) from the Onshore Transmission Cable (whether installed in duct banks or via direct bury), the effect on the local magnetic field is quite small—a change of less than 10 percent relative to the ambient geomagnetic field. Detailed results of every configuration and geographic orientation at average loading are presented below in Figure C-1 to Figure C-7. Tabular summaries at both average and peak loading are provided in Table C-1 to Table C-.
Tabular results are shown as the deviation from the ambient geomagnetic field because in tabular form, even very far from the cables, the reported values will be ~506 mG, which in tabular form can make it difficult to see the distance at which the effect of the cable on the local magnetic field decreases to near background levels.
June 2021 C-1 1907679.EX0 - 5158
9

1000 --3.3 ft above Ground
view facing 0° from E toward N
900 - - - Ambient Geomagnetic Field
6' 800 E
c 700
~ 600 :::J
(/) Q)
a: 500 ""O ai u:::: 400 u ·m
300 C C)
ro ~ 200
100
0 -50 -40 -30 -20 -10 0 10 20 30 40 50
Distance from Centerline (ft)
1000 --3.3 ft above Ground
view facing 0° from E toward N
900 - - - Ambient Geomagnetic Field
CJ 800 E
c 700
~ 600 :::J
(/) Q)
a: 500 ""O ai u:::: 400 u ·m
300 C C) ro ~ 200
100
0 -50 -40 -30 -20 -10 0 10 20 30 40 50
Distance from Centerline (ft)
Sunrise Wind Farm Project – Onshore DC and AC Magnetic-Field Assessment
a)
b)
Figure C-1 Total calculated magnetic field at average loading for the Onshore Transmission Cable in the DC duct bank configuration for cables oriented along the east-west direction, evaluated at a height of 3.3 ft (1 m) above ground.
The figure insets depict two current flow scenarios. For (a), the cables are modeled with current flowing out of the page on the left conduit and into the page on the right conduit, while for (b), the cables are modeled with current flowing out of the page on the right conduit and into the page on the left conduit.
June 2021 C-2 1907679.EX0 - 5158

100®1 1®001
-
10@1 \.._ ~
-
1~0, \..._ ~
Sunrise Wind Farm Project – Onshore DC and AC Magnetic-Field Assessment
Table C-1. Magnetic-field deviation (mG) from the ambient geomagnetic field for an east-west cable orientation, evaluated at various horizontal distances 3.3 ft (1 m) above ground and average loading
Installation Type Configuration†
DC Magnetic-Field Deviation (mG)
‒10 ft (‒3 m) (+) Max (‒) Max +10 ft (+3 m)
DC Duct Bank
51 53 ‒200 ‒1.4
‒45 202 ‒45 11
east-west summary ‒45 to 51 53 to 202 ‒200 to ‒45 ‒1.4 to 11
DC Direct Bury
‒6.0 9.2 ‒38 ‒27
7.8 38 ‒8.9 27
east-west summary ‒6.0 to 7.8 9.2 to 38 ‒38 to ‒8.9 ‒27 to 27
† Figures depict direction of current flow.
June 2021 C-3 1907679.EX0 - 5158
Sunrise Wind Farm Project – Onshore DC and AC Magnetic-Field Assessment
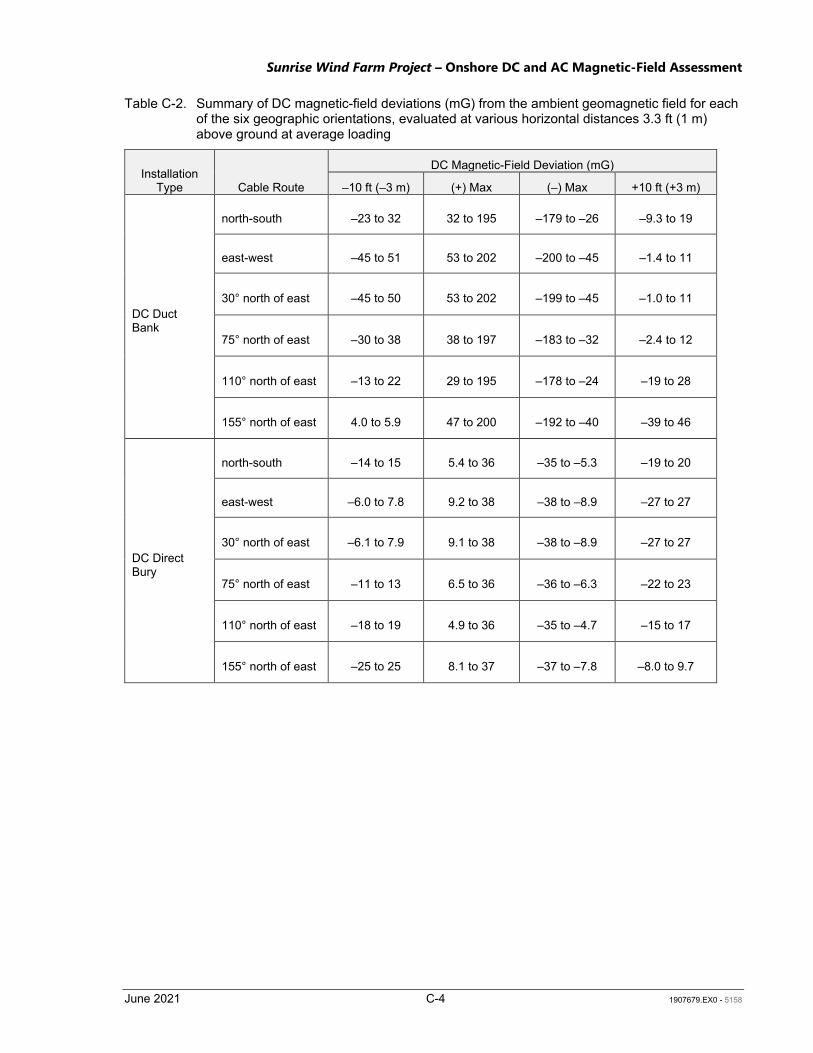
Table C-2. Summary of DC magnetic-field deviations (mG) from the ambient geomagnetic field for each of the six geographic orientations, evaluated at various horizontal distances 3.3 ft (1 m) above ground at average loading
Installation Type Cable Route
DC Magnetic-Field Deviation (mG)
‒10 ft (‒3 m) (+) Max (‒) Max +10 ft (+3 m)
DC Duct Bank
north-south ‒23 to 32 32 to 195 ‒179 to ‒26 ‒9.3 to 19
east-west ‒45 to 51 53 to 202 ‒200 to ‒45 ‒1.4 to 11
30° north of east ‒45 to 50 53 to 202 ‒199 to ‒45 ‒1.0 to 11
75° north of east ‒30 to 38 38 to 197 ‒183 to ‒32 ‒2.4 to 12
110° north of east ‒13 to 22 29 to 195 ‒178 to ‒24 ‒19 to 28
155° north of east 4.0 to 5.9 47 to 200 ‒192 to ‒40 ‒39 to 46
DC Direct Bury
north-south ‒14 to 15 5.4 to 36 ‒35 to ‒5.3 ‒19 to 20
east-west ‒6.0 to 7.8 9.2 to 38 ‒38 to ‒8.9 ‒27 to 27
30° north of east ‒6.1 to 7.9 9.1 to 38 ‒38 to ‒8.9 ‒27 to 27
75° north of east ‒11 to 13 6.5 to 36 ‒36 to ‒6.3 ‒22 to 23
110° north of east ‒18 to 19 4.9 to 36 ‒35 to ‒4.7 ‒15 to 17
155° north of east ‒25 to 25 8.1 to 37 ‒37 to ‒7.8 ‒8.0 to 9.7
June 2021 C-4 1907679.EX0 - 5158

Sunrise Wind Farm Project – Onshore DC and AC Magnetic-Field Assessment
Table C-3. Summary of DC magnetic-field deviations (mG) from the ambient geomagnetic field for each of the six geographic orientations, evaluated at various horizontal distances 3.3 ft (1 m) above ground at peak loading
Installation Type Cable Route
DC Magnetic-Field Deviation (mG)
‒10 ft (‒3 m) (+) Max (‒) Max +10 ft (+3 m)
DC Duct Bank
north-south ‒36 to 66 66 to 375 ‒289 to ‒46 ‒9.1 to 43
east-west ‒80 to 99 109 to 384 ‒372 to ‒80 5.8 to 29
30° north of east ‒79 to 99 108 to 384 ‒369 to ‒80 6.4 to 29
75° north of east ‒50 to 77 79 to 376 ‒304 to ‒56 3.8 to 31
110° north of east ‒16 to 49 60 to 374 ‒286 to ‒42 ‒28 to 60
155° north of east 16 to 19 97 to 381 ‒337 to ‒70 ‒68 to 91
DC Direct Bury
north-south ‒24 to 31 13 to 81 ‒78 to ‒12 ‒36 to 42
east-west ‒5.7 to 15 21 to 85 ‒84 to ‒20 ‒55 to 58
30° north of east ‒6.0 to 15 21 to 85 ‒84 to ‒20 ‒55 to 57
75° north of east ‒18 to 26 15 to 82 ‒80 to ‒14 ‒42 to 47
110° north of east ‒32 to 39 11 to 81 ‒78 to ‒11 ‒27 to 34
155° north of east ‒50 to 53 19 to 83 ‒82 to ‒17 ‒10 to 19
June 2021 C-5 1907679.EX0 - 5158

Sunrise Wind Farm Project – Onshore DC and AC Magnetic-Field Assessment
Table C-4. Summary of DC magnetic-field deviations (mG) at various horizontal distances 3.3 ft (1 m) above ground at average loading
Evaluation Height
DC Magnetic-Field Deviation (mG)
‒75 ft (‒23 m)
‒50ft (‒15 m)
‒25 ft (‒18 m)
‒10ft (‒3 m)
‒5 ft (‒1.5 m) (+) Max (‒) Max
+5 ft (+1.5 m)
+10 ft (+3 m)
+25 ft (+18 m)
+50 ft (+15 m)
+75 ft (+23 m)
DC Duct ‒1.8 to ‒4.1 to ‒16 to ‒45 to ‒73 to 29 to ‒200 to ‒86 to ‒39 to ‒15 to ‒4.0 to ‒1.8 to Bank 1.8 4.1 16 51 98 202 ‒24 106 46 15 4.0 1.8
DC Direct ‒2.6 to ‒5.0 to ‒8.9 to ‒25 to ‒35 to 4.9 to ‒38 to ‒36 to ‒27 to ‒7.7 to ‒4.7 to ‒2.5 to Bury 2.6 5.0 9.2 25 35 38 ‒4.7 36 27 8.0 4.7 2.5
Table C-5. Summary of DC magnetic-field deviations (mG) at various horizontal distances 3.3 ft (1 m) above ground at peak loading
Evaluation Height
DC Magnetic-Field Deviation (mG)
‒75 ft (‒23 m)
‒50ft (‒15 m)
‒25 ft (‒18 m)
‒10ft (‒3 m)
‒5 ft (‒1.5 m) (+) Max (‒) Max
+5 ft (+1.5 m)
+10 ft (+3 m)
+25 ft (+18 m)
+50 ft (+15 m)
+75 ft (+23 m)
DC Duct ‒3.4 to ‒7.8 to ‒30 to ‒80 to ‒106 to 60 to ‒372 to ‒ ‒132 to ‒68 to ‒28 to ‒7.6 to ‒3.4 to Bank 3.5 7.8 30 99 197 384 42 211 91 28 7.6 3.4
DC Direct ‒4.9 to ‒9.9 to ‒20 to ‒50 to ‒77 to 11 to ‒84 to ‒ ‒81 to ‒55 to ‒17 to ‒9.4 to ‒4.7 to Bury 4.9 9.9 21 53 78 85 11 81 58 19 9.4 4.7
June 2021 C-6 1907679.EX0 - 5158

1000 --3.3 ft above Ground
view facing 90° from E toward N
900 - - - Ambient Geomagnetic Field
C, 800
_§_ 700 c
~ 600 :::,
V, Q)
a: 500 -0 Q) u:: 400
" ·c1; 300 C:
0,
"' ::e 200
100
0 -50 -40 -30 -20 -10 0 10 20 30 40 50
Distance from Centerline (ft)
1000 +-;::====-='======-='======.::'._,---~--~---~--~~-v-ie-w-fa-cLin-g-90~.-,,-o-mLE-to_w_a-,d-N-+ 1
--3.3 ft above Ground I - - - Ambient Geomagnetic Field I 900
c, 800
_§_ 700 c )!! "3 600 V, Q)
a: 32 Q)
u:: g Q) C: 0,
"' ::e
500
400
300
200
100
0
-50 -40 -30 -20 -10 0 10 20 30 40 50 Distance from Centerline (ft)
--3.3 ft above Ground view facing 90° from E toward N
1000
900 - - - Ambient Geomagnetic Field
C, 800
_§_ 700 c
~ 600 :::,
V, Q)
a: 500 -0 Q) u:: 400
" ·c1; 300 C:
0,
"' ::e 200
100
0 -50 -40 -30 -20 -10 0 10 20 30 40 50
Distance from Centerline (ft)
1000 +-;::====.:::'======.:::'======.:::''::;---~--~---~--~-v-ie_w_fa_cLin_g_90~.~,,-o-mLE_t_ow-a-,d-N+-l--3.3 ft above Ground I - - - Ambient Geomagnetic Field I 900
c, 800
_§_ 700 c )!! "3 600 V, Q)
a: 32 Q)
u:: g Q) C: 0,
"' ::e
500
400
300
200
100
0
-50 -40 -30 -20 -10 0 10 20 30 40 50 Distance from Centerline (ft)
Sunrise Wind Farm Project – Onshore DC and AC Magnetic-Field Assessment
a) b)
c) d)
Figure C-2. Total magnetic field at average loading for the Onshore Transmission Cable oriented in a north-south direction, calculated at a height of 3.3 ft (1 m) above ground for both DC duct bank (a and b) and DC direct bury (c and d) configurations. Each evaluated for two different current flow scenarios (indicated by the inset figure at the bottom-center of each plot).
June 2021 C-7 1907679.EX0 - 5158

1000 --3.3 ft above Ground
view facing 0° from E toward N
900 - - - Ambient Geomagnetic Field
C, 800
.s 700 c !!! "S 600 u, Q)
a: 500 :!2 Q)
LL 400
" -~ 300 C
"' "' :a 200
100
0 -50 -40 -30 -20 -10 0 10 20 30 40 50
Distance from Centerline (ft)
1000 +---~--~~--~--~--~---~--~--vi-ew_ fJac- in_g_0_0 _fro-m~ E- t-o-wa- ,d- N+-
l--3.3 ft above Ground I - - - Ambient Geomagnetic Field [ 900
c, 800
.S 700 j :::, 600 u, Q)
'; 500 J----~- --~~==~--~=-..::..:...:.._:....::.:..:..:.:...::-=-=--- --- - --- -iQ)
LL 400
" -~ 300 g, :a 200
-50 -40 -30 -20 -10 0 10 20 30 40 50 Distance from Centerline (ft)
--3.3 ft above Ground view facing 0° from E toward N
1000
900 - - - Ambient Geomagnetic Field
C, 800
.s 700 c
~ 600 :::,
u, Q)
a: 500 -0 Q) LL 400
" ·c1; 300 C
"' "' :a 200
100
0 -50 -40 -30 -20 -10 0 10 20 30 40 50
Distance from Centerline (ft)
1000 1--3.3 ft above Ground , I 900 - - - Ambient Geomagnetic Field
view facing 0° from E toward N
C, 800
.s 700 c
~ 600 :::,
u, Q)
a: 500 -0 Q) LL 400
" "c] 300 C
"' "' :a 200
100
-50 -40 -30 -20 -10 0 10 20 30 40 50 Distance from Centerline (ft)
Sunrise Wind Farm Project – Onshore DC and AC Magnetic-Field Assessment
a) b)
c) d)
Figure C-3. Total magnetic field at average loading for the Onshore Transmission Cable oriented along an east-west direction, calculated at a height of 3.3 ft (1 m) above ground for both DC duct bank (a and b) and DC direct bury (c and d) configurations. Each evaluated for two different current flow scenarios (indicated by the inset figure at the bottom-center of each plot). Note that plots a and b are repeated from Figure C-1.
a) b)
June 2021 C-8 1907679.EX0 - 5158

1000 --3.3 ft above Ground
view facing 30° from E toward N
900 - - - Ambient Geomagnetic Field
C, 800
_§_ 700 c
~ 600 :::,
V, Q)
a: 500 -0 Q) u:: 400
" ·c1; 300 C:
0,
"' ::e 200
100
0 -50 -40 -30 -20 -10 0 10 20 30 40 50
Distance from Centerline (ft)
1000 +-;::====-='======-='======.::'._,---~--~---~--~~-v-ie-w-fa-cLin-g-30~.-,,-o-mLE-to_w_a-,d-N-+ 1
--3.3 ft above Ground I - - - Ambient Geomagnetic Field I 900
c, 800
_§_ 700 c )!! "3 600 V, Q)
a: 32 Q)
u:: g Q) C: 0,
"' ::e
500
400
300
200
100
0
-50 -40 -30 -20 -10 0 10 20 30 40 50 Distance from Centerline (ft)
--3.3 ft above Ground view facing 30° from E toward N
1000
900 - - - Ambient Geomagnetic Field
C, 800
_§_ 700 c
~ 600 :::,
V, Q)
a: 500 -0 Q) u:: 400
" ·c1; 300 C:
0,
"' ::e 200
100
0 -50 -40 -30 -20 -10 0 10 20 30 40 50
Distance from Centerline (ft)
1000 +-;::====.:::'======.:::'======.:::''::;---~--~---~--~-v-ie_w_fa_cLin-g-30~.~,,-o-mLE_t_ow-a-,d-N+-1
--3.3 ft above Ground I - - - Ambient Geomagnetic Field I 900
c, 800
_§_ 700 c )!! "3 600 V, Q)
a: 32 Q)
u:: g Q) C: 0,
"' ::e
500
400
300
200
100
0
-50 -40 -30 -20 -10 0 10 20 30 40 50 Distance from Centerline (ft)
Sunrise Wind Farm Project – Onshore DC and AC Magnetic-Field Assessment
a) b)
c) d)
Figure C-4. Total magnetic field at average loading for the Onshore Transmission Cable oriented 30 degrees north of east, calculated at a height of 3.3 ft (1 m) above ground for both DC duct bank (a and b) and DC direct bury (c and d) configurations. Each evaluated for two different current flow scenarios (indicated by the inset figure at the bottom-center of each plot).
June 2021 C-9 1907679.EX0 - 5158

1000 --3.3 ft above Ground
view facing 75 ° from E toward N
900 - - - Ambient Geomagnetic Field
C, 800
_§_ 700 c
~ 600 :::,
V, Q)
a: 500 -0 Q) u:: 400
" ·c1; 300 C:
0,
"' ::e 200
100
0 -50 -40 -30 -20 -10 0 10 20 30 40 50
Distance from Centerline (ft)
1000 +-;::====-='======-='======.::'._,---~--~---~--~~-v-ie-w-fa-cLin_g_75~.-,,-o-mLE-to_w_a-,d-N-+ 1
--3.3 ft above Ground I - - - Ambient Geomagnetic Field I 900
c, 800
_§_ 700 c )!! "3 600 V, Q)
a: 32 Q)
u:: g Q) C: 0,
"' ::e
500
400
300
200
100
0
-50 -40 -30 -20 -10 0 10 20 30 40 50 Distance from Centerline (ft)
--3.3 ft above Ground view facing 75 ° from E toward N
1000
900 - - - Ambient Geomagnetic Field
C, 800
_§_ 700 c
~ 600 :::,
V, Q)
a: 500 -0 Q) u:: 400
" ·c1; 300 C:
0,
"' ::e 200
100
0 -50 -40 -30 -20 -10 0 10 20 30 40 50
Distance from Centerline (ft)
1000 +-;::====.:::'======.:::'======.:::''::;---~--~---~--~-v-ie_w_fa_cLin_g_75~.~,,-o-mLE_t_ow-a-,d-N+-l--3.3 ft above Ground I - - - Ambient Geomagnetic Field I 900
c, 800
_§_ 700 c )!! "3 600 V, Q)
a: 32 Q)
u:: g Q) C: 0,
"' ::e
500
400
300
200
100
0
-50 -40 -30 -20 -10 0 10 20 30 40 50 Distance from Centerline (ft)
Sunrise Wind Farm Project – Onshore DC and AC Magnetic-Field Assessment
a) b)
c) d)
Figure C-5. Total DC magnetic field at average loading for the Onshore Transmission Cable oriented 75 degrees north of east, calculated at a height of 3.3 ft (1 m) above ground for both DC duct bank (a and b) and DC direct bury (c and d) configurations. Each evaluated for two different current flow scenarios (indicated by the inset figure at the bottom-center of each plot).
June 2021 C-10 1907679.EX0 - 5158

1000 --3.3 ft above Ground
view facing 110° from E toward N
900 - - - Ambient Geomagnetic Field
C, 800
_§_ 700 c
~ 600 :::,
V, Q)
a: 500 -0 Q) u:: 400
" ·c1; 300 C:
0,
"' ::e 200
100
0 -50 -40 -30 -20 -10 0 10 20 30 40 50
Distance from Centerline (ft)
1 OOO +-;::====-='======-='======.::'._,---~--~---~--~~v-ie_w_f-ac-inLg-,-,o~.-,,-o-mLE-to_w_a-,d-N-+ 1
--3.3 ft above Ground I - - - Ambient Geomagnetic Field I 900
c, 800
_§_ 700 c )!! "3 600 V, Q)
a: 32 Q)
u:: g Q) C: 0,
"' ::e
500
400
300
200
100
0
-50 -40 -30 -20 -10 0 10 20 30 40 50 Distance from Centerline (ft)
--3.3 ft above Ground view facing 110° from E toward N
1000
900 - - - Ambient Geomagnetic Field
C, 800
_§_ 700 c
~ 600 :::,
V, Q)
a: 500 -0 Q) u:: 400
" ·c1; 300 C:
0,
"' ::e 200
100
0 -50 -40 -30 -20 -10 0 10 20 30 40 50
Distance from Centerline (ft)
1000 +-;::====.:::'======.:::'======.:::''::;---~--~---~--~-v-ie_w_f_ac-inLg-,-,~o•~,,-o-mLE_t_ow-a-,d-N+-1
--3.3 ft above Ground I - - - Ambient Geomagnetic Field I 900
c, 800
_§_ 700 c )!! "3 600 V, Q)
a: 32 Q)
u:: g Q) C: 0,
"' ::e
500
400
300
200
100
0
-50 -40 -30 -20 -10 0 10 20 30 40 50 Distance from Centerline (ft)
Sunrise Wind Farm Project – Onshore DC and AC Magnetic-Field Assessment
a) b)
c) d)
Figure C-6. Total DC magnetic field at average loading for the Onshore Transmission Cable oriented 110 degrees north of east, calculated at a height of 3.3 ft (1 m) above ground for both DC duct bank (a and b) and DC direct bury (c and d) configurations. Each evaluated for two different current flow scenarios (indicated by the inset figure at the bottom-center of each plot).
June 2021 C-11 1907679.EX0 - 5158

1000 --3.3 ft above Ground
view facing 155° from E toward N
900 - - - Ambient Geomagnetic Field
C, 800
_§_ 700 c
~ 600 :::,
V, Q)
a: 500 -0 Q) u:: 400
" ·c1; 300 C:
0,
"' ::e 200
100
0 -50 -40 -30 -20 -10 0 10 20 30 40 50
Distance from Centerline (ft)
1 OOO +-;::====-='======-='======.::'._,---~--~---~--~~v-ie_w_f-ac-inLg-1-55~.-,,-o-mLE-to_w_a-,d-N-+ 1
--3.3 ft above Ground I - - - Ambient Geomagnetic Field I 900
c, 800
_§_ 700 c )!! "3 600 V, Q)
a: 32 Q)
u:: g Q) C: 0,
"' ::e
500
400
300
200
100
0
-50 -40 -30 -20 -10 0 10 20 30 40 50 Distance from Centerline (ft)
1000 --3.3 ft above Ground
view facing 155° from E toward N
900 - - - Ambient Geomagnetic Field
C, 800
_§_ 700 c
~ 600 :::,
V, Q)
a: 500 -0 Q) u:: 400
" ·c1; 300 C:
0,
"' ::e 200
100
0 -50 -40 -30 -20 -10 0 10 20 30 40 50
Distance from Centerline (ft)
1000 +-;::====.:::'======.:::'======.:::''::;---~--~---~--~-v-ie_w_f_ac-inLg-1-5~5.~f,-o-mLE_t_ow-a-,d-N+-1
--3.3 ft above Ground I - - - Ambient Geomagnetic Field I 900
c, 800
_§_ 700 c )!! "3 600 V, Q)
a: 32 Q)
u:: g Q) C: 0,
"' ::e
500
400
300
200
100
0
-50 -40 -30 -20 -10 0 10 20 30 40 50 Distance from Centerline (ft)
Sunrise Wind Farm Project – Onshore DC and AC Magnetic-Field Assessment
a) b)
c) d)
Figure C-7. Total DC magnetic field at average loading for the Onshore Transmission Cable oriented 155 degrees north of east, calculated at a height of 3.3 ft (1 m) above ground for both DC duct bank (a and b) and DC direct bury (c and d) configurations. Each evaluated for two different current flow scenarios (indicated by the inset figure at the bottom-center of each plot).
June 2021 C-12 1907679.EX0 - 5158
Sunrise Wind Farm Project – Onshore DC and AC Magnetic-Field Assessment
Compass Deflection
A compass needle typically points along the direction of the Earth’s geomagnetic field, but a new DC magnetic-field source may cause a local deviation in the apparent direction of magnetic north. Here, this deviation is calculated as the compass deflection, which is the difference in angular direction in degrees between the horizontal component of the ambient geomagnetic field and the horizontal component direction of the combined DC field from the Earth and from the Onshore Transmission Cable. Modern navigational instruments that obtain compass readings and locations from global positioning system receivers would not be affected by magnetic-field deflections from the Project cables.
To assess the effect of the Onshore Transmission Cable on potential compass readings, the deflections of the horizontal component of the total magnetic field from that of the Earth’s geomagnetic field were calculated. As an illustrative representation of the results, the plotted data in Figure C-8 show the calculated compass deflection for both of the DC cable configurations when the cables are oriented east-west for the DC duct bank configuration. This figure shows that the direction of the current plays a role in the location of where the maximum compass deviation will be observed, but does not play as large a role as in the magnetic-field deviation from the ambient geomagnetic field (discussed above in relation to Figure C-1).
The results of this analysis, summarized in Table C-1, show the maximum compass deviation for either current direction is approximately 22 degrees and that within ±10 ft (±3 m) of the DC duct bank centerline, compass deviations are approximately 6.3 degrees or less. Detailed compass deflection results for every configuration and geographic orientation at average loading are presented below in Figure C-9 to Figure C-14. Tabular summaries at both average and peak loading are provided in Table C-6 to Table C-10.
June 2021 C-13 1907679.EX0 - 5158

en 1--3.3 ft above Ground I ~ 60 Ol (I)
:S. 40 C: 0
~ c: 20 0 (I)
"O
~ o, -----------_,, 0
co (') ~ -20 E e ~ -40 0 ·u (I)
~ -60 0
en (I)
~ Ol (I)
:s. C: 0 "-§ C:
0 (I)
"O
~ 0
co (')
60
40
20
0
~ -20 E e ~ -40 0
u (I)
~ -60 0
-50 -40 -30
1-- 3.3 ft above Ground I
-50 -40 -30
-20 -10 0 10
Distance from Centerline (ft)
-20 -10 0 10
Distance from Centerline (ft)
view facing 0° from E toward N
20 30 40 50
view facing 0° from E toward N
20 30 40 50
Sunrise Wind Farm Project – Onshore DC and AC Magnetic-Field Assessment
a)
b)
Figure C-8 Compass deflection (degrees) from magnetic north for the Onshore Transmission Cable in the DC duct bank configuration, oriented in an east-west direction for average loading and calculated at a height of 3.3 ft (1 m) above ground.
The figure insets depict two current flow scenarios. For (a), the cables are modeled with current flowing out of the page on the left conduit and into the page on the right conduit, while for (b), the cables are modeled with current flowing out of the page on the right conduit and into the page on the left conduit.
June 2021 C-14 1907679.EX0 - 5158

100®1 1®001
-
10@1 \.._ ~
-
1~0, \.._ ~
Sunrise Wind Farm Project – Onshore DC and AC Magnetic-Field Assessment
Table C-6. Compass deflection (degrees) from magnetic north for an east-west cable orientation, evaluated at various horizontal distances 3.3 ft (1 m) above ground at average loading
Installation Type Configuration†
Compass deflection (degrees) from magnetic north
‒10 ft (‒3 m) (+) Max (‒) Max +10 ft (+3 m)
DC Duct Bank
‒3.3 22 ‒5.4 6.3
6.3 22 ‒5.4 ‒3.3
east-west summary ‒3.3 to 6.3 22 ‒5.4 ‒3.3 to 6.3
DC Direct Bury
‒1.4 1.9 ‒1.5 1.8
1.8 1.9 ‒1.5 ‒1.4
east-west summary ‒1.4 to 1.8 1.9 ‒1.5 ‒1.4 to 1.8
† Figures depict direction of current flow.
June 2021 C-15 1907679.EX0 - 5158
Sunrise Wind Farm Project – Onshore DC and AC Magnetic-Field Assessment
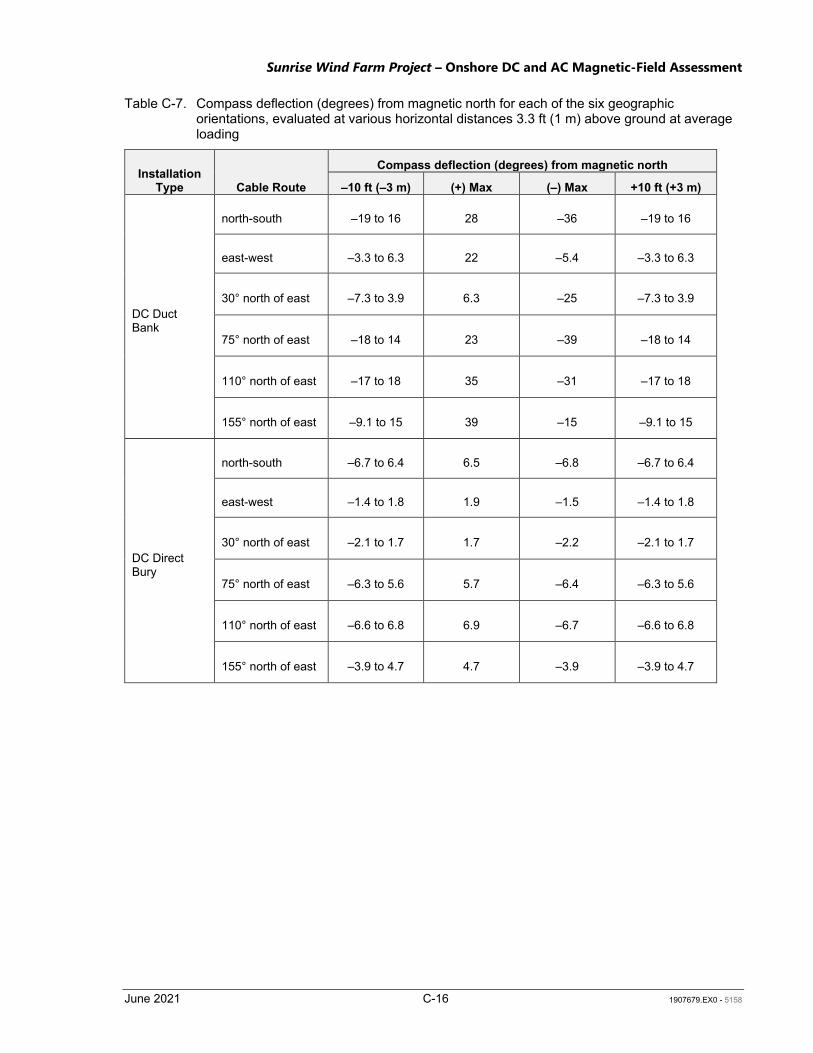
Table C-7. Compass deflection (degrees) from magnetic north for each of the six geographic orientations, evaluated at various horizontal distances 3.3 ft (1 m) above ground at average loading
Installation Type Cable Route
Compass deflection (degrees) from magnetic north
‒10 ft (‒3 m) (+) Max (‒) Max +10 ft (+3 m)
DC Duct Bank
north-south ‒19 to 16 28 ‒36 ‒19 to 16
east-west ‒3.3 to 6.3 22 ‒5.4 ‒3.3 to 6.3
30° north of east ‒7.3 to 3.9 6.3 ‒25 ‒7.3 to 3.9
75° north of east ‒18 to 14 23 ‒39 ‒18 to 14
110° north of east ‒17 to 18 35 ‒31 ‒17 to 18
155° north of east ‒9.1 to 15 39 ‒15 ‒9.1 to 15
DC Direct Bury
north-south ‒6.7 to 6.4 6.5 ‒6.8 ‒6.7 to 6.4
east-west ‒1.4 to 1.8 1.9 ‒1.5 ‒1.4 to 1.8
30° north of east ‒2.1 to 1.7 1.7 ‒2.2 ‒2.1 to 1.7
75° north of east ‒6.3 to 5.6 5.7 ‒6.4 ‒6.3 to 5.6
110° north of east ‒6.6 to 6.8 6.9 ‒6.7 ‒6.6 to 6.8
155° north of east ‒3.9 to 4.7 4.7 ‒3.9 ‒3.9 to 4.7
June 2021 C-16 1907679.EX0 - 5158

Sunrise Wind Farm Project – Onshore DC and AC Magnetic-Field Assessment
Table C-8. Compass deflection (degrees) from magnetic north for each of the six geographic orientations, evaluated at various horizontal distances 3.3 ft (1 m) above ground at peak loading
Installation Type Cable Route
Compass deflection (degrees) from magnetic north
‒10 ft (‒3 m) (+) Max (‒) Max +10 ft (+3 m)
DC Duct Bank
north-south ‒34 to 27 43 ‒59 ‒34 to 27
east-west ‒5.2 to 19 122 ‒7.6 ‒5.2 to 19
30° north of east ‒22 to 6.1 8.9 ‒116 ‒22 to 6.1
75° north of east ‒37 to 22 34 ‒69 ‒37 to 22
110° north of east ‒29 to 33 54 ‒47 ‒29 to 33
155° north of east ‒14 to 35 86 ‒21 ‒14 to 35
DC Direct Bury
north-south ‒16 to 14 14 ‒16 ‒16 to 14
east‒west ‒2.9 to 5.0 5.0 ‒2.9 ‒2.9 to 5.0
30° north of east ‒5.8 to 3.4 3.4 ‒5.8 ‒5.8 to 3.4
75° north of east ‒15 to 12 12 ‒15 ‒15 to 12
110° north of east ‒15 to 15 15 ‒15 ‒15 to 15
155° north of east ‒7.9 to 12 12 ‒7.9 ‒7.9 to 12
June 2021 C-17 1907679.EX0 - 5158

Sunrise Wind Farm Project – Onshore DC and AC Magnetic-Field Assessment
Table C-9. Summary of compass deflection (degrees) at various horizontal distances 3.3 ft (1 m) above ground at average loading
Evaluation Height
Compass deflection (degrees) from magnetic north
‒75 ft (‒23 m)
‒50ft (‒15 m)
‒25 ft (‒18 m)
‒10ft (‒3 m)
‒5 ft (‒1.5 m) (+) Max (‒) Max
+5 ft (+1.5 m)
+10 ft (+3m)
+25 ft (+18 m)
+50 ft (+15 m)
+75 ft (+23 m)
DC Duct ‒0.1 to ‒0.3 to ‒2.2 to ‒19 to ‒38 to 6.3 to ‒39 to ‒38 to ‒19 to ‒2.2 to ‒0.3 to ‒0.1 to Bank 0.1 0.3 2.3 18 37 39 ‒5.4 37 18 2.3 0.3 0.1
DC Direct ‒0.3 to ‒1.0 to ‒4.0 to ‒6.7 to ‒4.6 to 1.7 to ‒6.7 to ‒4.6 to ‒6.7 to ‒4.0 to ‒1.0 to ‒0.3 to Bury 0.3 1.0 4.0 6.8 4.7 6.9 ‒1.5 4.7 6.8 4.0 1.0 0.3
Table C-10. Summary of compass deflection (degrees) at various horizontal distances 3.3 ft (1 m) above ground at peak loading
Evaluation Height
Compass deflection (degrees) from magnetic north
‒75 ft (‒23 m)
‒50ft (‒15 m)
‒25 ft (‒18 m)
‒10ft (‒3 m)
‒5 ft (‒1.5 m) (+) Max (‒) Max
+5 ft (+1.5 m)
+10 ft (+3m)
+25 ft (+18 m)
+50 ft (+15 m)
+75 ft (+23 m)
DC Duct ‒0.2 to ‒0.6 to ‒4.2 to ‒37 to ‒113 to 8.9 to ‒116 to ‒ ‒113 to ‒37 to ‒4.2 to ‒0.6 to ‒0.2 to Bank 0.2 0.6 4.3 35 118 122 7.6 118 35 4.3 0.6 0.2
DC Direct ‒0.6 to ‒1.8 to ‒7.9 to ‒16 to ‒11 to 3.4 to ‒16 to ‒11 to ‒16 to ‒7.9 to ‒1.8 to ‒0.6 to Bury 0.6 1.8 8.0 15 11 15 ‒2.9 11 15 8.0 1.8 0.6
June 2021 C-18 1907679.EX0 - 5158

"' 1--3.3 tt above Ground I IB 60 O> Q)
~ 40 0
~ ·" 20 1i "O
~ o-+----------o
°' M ~ -20 E e
-;::: -40 .Q
~ ~ -60 0
-50 -40 -30
T 60 1--3.3 tt above Ground I C) Q)
~ 40 0
~ ·" 20 1i
-20 -10 0 10 Distance from Centerline (ft)
~ o~------------------0 (X)
.,; ~ -20 E e
-;::: -40 0
n Q)
~ -60 0
-50 -40 -30 -20 -10 0 10
Distance from Centerline (ft)
view facing 90° from E toward N
20 30 40 50
view facing 90° from E toward N
20 30 40 50
"' 1--3.3 tt above Ground I IB 60 O> Q)
~ 40 0
~ ·" 20 1i "O
~ Or --------0
°' M ~ -20 E e
-;::: -40 .Q
~ ~ -60 0
-50 -40 -30
T 60 1--3.3 tt above Ground I C) Q)
~ 40 0
~ ·" 20 1i "O
-20 -10 0 10 Distance from Centerline (ft)
f Or-----------°' M ~ -20 E e
-;::: -40 0
n Q)
~ -60 0
-50 -40 -30 -20 -10 0 10
Distance from Centerline (ft)
view facing 90° from E toward N
20 30 40 50
view facing 90° from E toward N
20 30 40 50
Sunrise Wind Farm Project – Onshore DC and AC Magnetic-Field Assessment
a) b)
c) d)
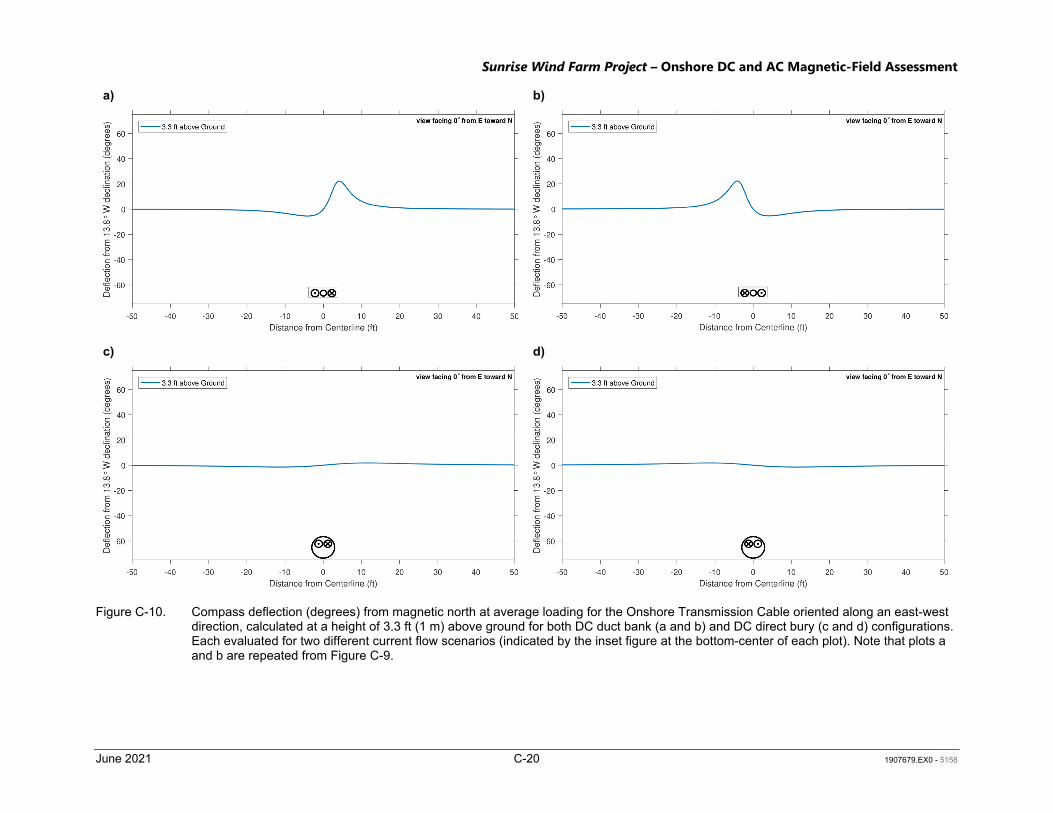
Figure C-9. Compass deflection (degrees) from magnetic north at average loading for the Onshore Transmission Cable oriented in a north-south direction, calculated at a height of 3.3 ft (1 m) above ground for both DC duct bank (a and b) and DC direct bury (c and d) configurations. Each evaluated for two different current flow scenarios (indicated by the inset figure at the bottom-center of each plot).
June 2021 C-19 1907679.EX0 - 5158
"' 1--3.3 ft above Ground I ~ 60 0) Q)
~ 40 0 -~
.E 20 ~ "O
~ o---r------------_____,, co cry ~ -20 E e ~ -40 0
u Q)
~ -60 0
-50 -40 -30 -20 -10 0 10 Distance from Centerline (ft)
"' 1--3.3 ft above Ground I IB 60 O> Q)
~ 40 0 -~
.E 20 u Q)
"O
view facing 0° from E toward N
20 30 40 50
view facing 0° from E toward N
~ o-t---------------------------+ 0
"< C'J ~ -20 E e ~ -40 .Q
~ ~ -60 0
-50 -40 -30 -20 -10 0 10 20 30 40 50 Distance from Centerline (ft)
"' 1--3.3 ft above Ground I IB 60 O> Q)
~ 40 0
~ .E 20 ~ "O
~ o--1------------o
"< C'J ~ -20 E e ~ -40 .Q
~ ~ -60 0
-50 -40 -30
"' 1--3.3 ft above Ground I IB 60 O> Q)
~ 40 0
~ .E 20 u Q)
"O
-20 -10 0 10 Distance from Centerline (ft)
view facing 0° from E toward N
20 30 40 50
view facing 0° from E toward N
~ o-t---------------------------+ 0
"< C'J ~ -20 E e ~ -40 .Q
~ ~ -60 0
-50 -40 -30 -20 -10 0 10 20 30 40 50 Distance from Centerline (ft)
Sunrise Wind Farm Project – Onshore DC and AC Magnetic-Field Assessment
a) b)
c) d)
Figure C-10. Compass deflection (degrees) from magnetic north at average loading for the Onshore Transmission Cable oriented along an east-west direction, calculated at a height of 3.3 ft (1 m) above ground for both DC duct bank (a and b) and DC direct bury (c and d) configurations. Each evaluated for two different current flow scenarios (indicated by the inset figure at the bottom-center of each plot). Note that plots a and b are repeated from Figure C-9.
June 2021 C-20 1907679.EX0 - 5158

"' 1--3.3 tt above Ground I IB 60 O> Q)
~ 40 0
~ ·" 20 1i "O
~ o--1-----------o
°' M ~ -20 E e
-;::: -40 .Q
~ ~ -60 0
-50 -40 -30 -20 -10 0 10 Distance from Centerline (ft)
T 60 1--3.3 tt above Ground I C) Q)
~ 40 0
~ ·" 20 1i "O
view facing 30° from E toward N
20 30 40 50
view facing 30° from E toward N
~ o+--------------------------+ 0 (X)
.,; ~ -20 E e
-;::: -40 0
n Q)
~ -60 0
-50 -40 -30 -20 -10 0 10 20 30 40 50 Distance from Centerline (ft)
"' 1--3.3 tt above Ground I IB 60 O> Q)
~ 40 0
~ ·" 20 1i "O
~ 0r ----------o
°' M ~ -20 E e
-;::: -40 .Q
~ ~ -60 0
-50 -40 -30
T 60 1--3.3 tt above Ground I C) Q)
~ 40 0
~ ·" 20 1i "O
-20 -10 0 10 Distance from Centerline (ft)
view facing 30° from E toward N
20 30 40 50
view facing 30° from E toward N
~ 0-1---------------------------+ 0
°' M ~ -20 E e
-;::: -40 0
n Q)
~ -60 0
-50 -40 -30 -20 -10 0 10 20 30 40 50 Distance from Centerline (ft)
Sunrise Wind Farm Project – Onshore DC and AC Magnetic-Field Assessment
a) b)
c) d)
Figure C-11. Compass deflection (degrees) from magnetic north at average loading for the Onshore Transmission Cable oriented 30 degrees north of east, calculated at a height of 3.3 ft (1 m) above ground for both DC duct bank (a and b) and DC direct bury (c and d) configurations. Each evaluated for two different current flow scenarios (indicated by the inset figure at the bottom-center of each plot).
June 2021 C-21 1907679.EX0 - 5158

"' 1--3.3 tt above Ground I IB 60 O> Q)
~ 40 0
~ ·" 20 1i "O
~ o+---------o
°' M ~ -20 E e
-;::: -40 .Q
~ ~ -60 0
-50 -40 -30
T 60 1--3.3 tt above Ground I C) Q)
~ 40 0
~ ·" 20 1i
-20 -10 0 10 Distance from Centerline (ft)
~ o~-----------------0 (X)
.,; ~ -20 E e
-;::: -40 0
n Q)
~ -60 0
-50 -40 -30 -20 -10 0 10
Distance from Centerline (ft)
view facing 75° from E toward N
20 30 40 50
view facing 75° from E toward N
20 30 40 50
"' 1--3.3 tt above Ground I IB 60 O> Q)
~ 40 0
~ ·" 20 1i "O
~ o-i-------------0
°' M ~ -20 E e
-;::: -40 .Q
~ ~ -60 0
-50 -40 -30
T 60 1--3.3 tt above Ground I C) Q)
~ 40 0
~ ·" 20 1i "O
-20 -10 0 10 Distance from Centerline (ft)
f 01 ---------°' M ~ -20 E e
-;::: -40 0
n Q)
~ -60 0
-50 -40 -30 -20 -10 0 10
Distance from Centerline (ft)
view facing 75° from E toward N
20 30 40 50
view facing 75° from E toward N
20 30 40 50
Sunrise Wind Farm Project – Onshore DC and AC Magnetic-Field Assessment
a) b)
c) d)
Figure C-12. Compass deflection (degrees) from magnetic north at average loading for the Onshore Transmission Cable oriented 75 degrees north of east, calculated at a height of 3.3 ft (1 m) above ground for both DC duct bank (a and b) and DC direct bury (c and d) configurations. Each evaluated for two different current flow scenarios (indicated by the inset figure at the bottom-center of each plot).
a) b)
June 2021 C-22 1907679.EX0 - 5158

"' 1--3.3 tt above Ground I IB 60 O> Q)
~ 40 0
~ ·" 20 1i "O
~ o+---------o
°' M ~ -20 E e
-;::: -40 .Q
~ ~ -60 0
-50 -40 -30
T 60 1--3.3 tt above Ground I C) Q)
~ 40 0
~ ·" 20 1i
-20 -10 0 10 Distance from Centerline (ft)
~ o~-----------------0 (X)
.,; ~ -20 E e
-;::: -40 0
n Q)
~ -60 0
-50 -40 -30 -20 -10 0 10
Distance from Centerline (ft)
view facing 110° from E toward N
20 30 40 50
view facing 110° from E toward N
20 30 40 50
"' 1--3.3 tt above Ground I IB 60 O> Q)
~ 40 0
~ ·" 20 1i "O
~ Or --------0
°' M ~ -20 E e
-;::: -40 .Q
~ ~ -60 0
-50 -40 -30
T 60 1--3.3 tt above Ground I C) Q)
~ 40 0
~ ·" 20 1i "O
-20 -10 0 10 Distance from Centerline (ft)
f Or------------°' M ~ -20 E e
-;::: -40 0
n Q)
~ -60 0
-50 -40 -30 -20 -10 0 10
Distance from Centerline (ft)
view facing 110° from E toward N
20 30 40 50
view facing 110° from E toward N
20 30 40 50
Sunrise Wind Farm Project – Onshore DC and AC Magnetic-Field Assessment
a) b)
c) d)
Figure C-13. Compass deflection (degrees) from magnetic north at average loading for the Onshore Transmission Cable oriented 110 degrees north of east, calculated at a height of 3.3 ft (1 m) above ground for both DC duct bank (a and b) and DC direct bury (c and d) configurations. Each evaluated for two different current flow scenarios (indicated by the inset figure at the bottom-center of each plot).
June 2021 C-23 1907679.EX0 - 5158

"' 1--3.3 tt above Ground I IB 60 O> Q)
~ 40 0
~ ·" 20 1i "O
~ o--1------------o
°' M ~ -20 E e
-;::: -40 .Q
~ ~ -60 0
-50 -40 -30
T 60 1--3.3 tt above Ground I C) Q)
~ 40 0
~ ·" 20 1i
-20 -10 0 10 Distance from Centerline (ft)
~ o~-----------------0 (X)
.,; ~ -20 E e
-;::: -40 0
n Q)
~ -60 0
-50 -40 -30 -20 -10 0 10
Distance from Centerline (ft)
view facing 155° from E toward N
20 30 40 50
view facing 155° from E toward N
20 30 40 50
"' 1--3.3 tt above Ground I IB 60 O> Q)
~ 40 0
~ ·" 20 1i "O
~ o---i-----------0
°' M ~ -20 E e
-;::: -40 .Q
~ ~ -60 0
-50 -40 -30
T 60 1--3.3 tt above Ground I C) Q)
~ 40 0
~ ·" 20 1i "O
-20 -10 0 10 Distance from Centerline (ft)
f o-i--------------°' M ~ -20 E e
-;::: -40 0
n Q)
~ -60 0
-50 -40 -30 -20 -10 0 10
Distance from Centerline (ft)
view facing 155° from E toward N
20 30 40 50
view facing 155° from E toward N
20 30 40 50
Sunrise Wind Farm Project – Onshore DC and AC Magnetic-Field Assessment
a) b)
c) d)
Figure C-14. Compass deflection (degrees) from magnetic north at average loading for the Onshore Transmission Cable oriented 155 degrees north of east, calculated at a height of 3.3 ft (1 m) above ground for both DC duct bank (a and b) and DC direct bury (c and d) configurations. Each evaluated for two different current flow scenarios (indicated by the inset figure at the bottom-center of each plot).
June 2021 C-24 1907679.EX0 - 5158

Buried Interconnection
- 80 C) E -75 ft +75 ft -C cu
.:±= ::::> 60 en Q)
a: -0 Q)
u::: 40 -~ -Q) C 0) cu ~ 20
o~-~~-~--~-~--~--~-~--~-~~-~ -100 -80 -60 -40 -20 0 20 40 60 80 100
Distance from Centerline (ft)
Sunrise Wind Farm Project – Onshore DC and AC Magnetic-Field Assessment
AC Onshore Interconnection Cables
AC Magnetic Field
The calculated AC magnetic field for the Onshore Interconnection Cable configuration installed in two duct banks depicted in Figure A-4 is shown below in Figure C-15.
Figure C-15. AC magnetic field for the twin Onshore Interconnection duct bank configuration.
June 2021 C-25 1907679.EX0 - 5158

Sunrise Wind Farm Project – Onshore DC and AC Magnetic-Field Assessment
Table C-11. Calculated AC magnetic-field levels (mG) at various horizontal distances 3.3 ft (1m) above ground at average and peak loading
AC Magnetic Field (mG)*
–100 ft –75 ft –50 ft –25 ft –10 ft +10 ft +25 ft +50 ft +75 ft +100 ft Configuration Loading (–30 m) (–23 m) (–15 m) (–7.6 m) (–3 m) Max (+3 m) (+7.6 m) (+15 m) (+23 m) (+30 m)
AC Interconnection Average 2.2 3.0 5 11 32 34 32 11 5 3.0 2.2
Peak 3.7 5.0 8 19 55 57 54 19 8 5.0 3.7 * As shown in Attachment A, Figure A-4, for the Onshore Interconnection Cable configuration the phase cables are divided into two groups (separated by 15 to
20 ft [4.6 to 6 m]). The horizontal distance is measured from the centerline of the twin AC Interconnection duct banks.
June 2021 C-26 1907679.EX0 - 5158