appendix - independent market research...
TRANSCRIPT

APPENDIX - INDEPENDENTMARKET RESEARCH REPORTByCushman&WakefieldIndia
A India: Economic & Commercial Real Estate Overview1 India Economic Overview2 Investment Scenario in India3 Overview of IT/ITES Industry in India4OverviewofOfficeSpaceMarketinIndia5 Outlook
B Bangalore Commercial Market Overview1 Micro-Market Description2 Supply, Absorption & Vacancy Trends3 Supply and Absorption Trends in PBD for Commercial Space
C ITPB: Property Analysis1 Introduction2 Location & Accessibility3 Tenant Mix4DevelopmentPerformance5 Competition Analysis6SWOTAnalysis7 Outlook
D Chennai Commercial Market Overview1 Micro-Market Description2 Supply, Absorption & Vacancy Trends3 Supply, Absorption Trends for Office Space in Suburban Market
E ITPC: Property Analysis1 Introduction2 Location & Accessibility3 Tenancy Mix4DevelopmentPerformance5 Competition Analysis6SWOTAnalysis7 Outlook
F Hyderabad Commercial Market Overview1 Micro-Market Description2 Supply, Absorption & Vacancy Trends3 Supply, Absorption Trends for Office Space in Suburban Market
G The V: Property Analysis1 Introduction2 Profile of The V, Hyderabad3 Location & Accessibility4TenantMix5 Development Performance6 Competition Analysis7SWOTAnalysis
H CyberPearl: Property Analysis1 Profile of CyberPearl, Hyderabad2 Location & Accessibility3 Tenant Mix4DevelopmentPerformance5 Competition Analysis6SWOTAnalysis7 Outlook
I Caveats & Limitations
ThisindependentmarketresearchhasbeencarriedoutbyCushman&WakefieldIndiaaspertherequirementsstatedbyandis addressed to its client, Ascendas Property Fund Trustee Pte Ltd (as Trustee-Manager of Ascendas India Trust). The report expressesCushman&WakefieldIndia’sindependentopinionandnotnecessarilythatofAscendasPropertyFundTrusteePteLtd (as Trustee-Manager of Ascendas India Trust).
31 March 2011
150

A INDIA: ECONOMIC & COMMERCIAL REAL ESTATE OVERVIEW 1 India Economic Overview India is the world’s twelfth largest economy at market exchange rates and the fourth largest economy when adjusted for purchasing power parity1.Withgrowingurbanisation,30%oftheIndianpopulationcurrentlyiscity-dwellingandby2050, thepercentageisexpectedtotouch55%2.
Indian economy has been one of the fastest growing economies in the world and has consistently demonstrated a positivegrowthrateaveragingjustbelow9%overthelastfive-years3.Withtheonsetofglobalrecession,India’s economy did suffer a visible impact. By the third quarter of 2008, India felt the tremors of the economic meltdown. However,inspiteofthemeltdown,theestimatedGrossDomesticProduct(“GDP”)for2010–11wasINR48,792 billion4(USD1,084billion5)ascomparedtoINR44,937billion(USD998billion)for2009–10(+8.6%yearonyear). TheGDPforApril,2010–December,2010wasatINR35,534billion(USD789billion)ascomparedtoINR32,713billion (USD726billion)forApril,2009–December,2009(8.6%yearonyear).TheprojectedgrowthrateofGDPfor2011–12 estimatedat9%6 suggests that domestic momentum remains strong for India.
There are several progressive indicators for the economy at large, including positive estimates for the GDP, exports and Foreign Direct Investment (“FDI”) for the year ahead. India’s exports during the year 2010-11 amounted to USD 245.8billion(provisional),ascomparedtoUSD178.7billionrecordedduring2009-10.India’simportsduring2010-11 stood at USD 350.7 billion (provisional), as compared to USD 288.3 billion during 2009-10. Overall, trade deficit for 2010- 11amountedtoUSD104.9billion(provisional),ascomparedtoUSD109.6billionduring2009-10.Inlinewiththe rebound in global economic activity and trade, India’s exports have registered positive growth rates since November 20097. India’s foreign exchange reserves increased to USD 279.1 billion by March 2010, from USD 252.0 billion as on March2009andhavefurtherincreasedtoUSD294.0billionasatJanuary7,2011.Intherecenttimes,Indiahasentered into several Free Trade Agreements and Preferential Trade Agreements like South Asia Free Trade Agreement (SAFTA), Global System of Trade Preferences (GSTP), Asia Pacific Trade Agreement (APTA), India-ASEAN FTA and others, with the objective of promoting trade with many countries and regional groupings of which Commonwealth countries are members8. As per the Ministry of Commerce & Industry, Government of India, the country registered exports of USD 164.7billion(INR7,516billion)duringtheyearApril–December,2010registeringagrowthof29.5%inDollarterms and23.4%inRupeetermsoverthesameperiodlastyear9.
TheIndianbankstoohaveemergedstrongerandhavemadeittothelistof‘Top500GlobalFinancialBrands2009’with the biggest gainer being HDFC Bank, besides 13 government-run, new entrants. Indian banks have been considered safeandsecurewithnetaverageNPAof1%in2009-10.TheAverageCapitalAdequacyRatio(“CAR”)ofprivatesector banksimprovedfrom15.23%inFY2008-2009to17.45%in2009-1010, indicating a strong performance by the Indian banking sector.
The Indian Economy is growing at a faster pace after the recent recession; however the rising global commodity and crude oil prices would have an adverse affect on the inflation and trade deficit. Indian economy being second fastest growing economy in Asia with a well established banking system and vibrant trade links, provides a great opportunity for investment in India.
2 Investment Scenario in India AccordingtotheWorldInvestmentReport2010,globalinvestmentinflowsareexpectedtoreachoverINR54trillion\ (USD 1.2 trillion), INR 58.5–67.5 trillion (USD 1.3–1.5 trillion), and INR 72–90 trillion (USD 1.6-2 trillion) by 2010, 2011, and 2012, respectively. However, majority of the investments are expected to be in the services and primary sectors. AccordingtoUnitedNationsConferenceonTradeAndDevelopmentWorldInvestmentProspectsSurvey2009-2011, India ranked 3rd among global FDI destinations after China and United States (“US”) in 2009, and is expected to remain among the top five most attractive destinations for international investors during 2010-11. Ernst and Young’s 2010 European Attractiveness Survey is another study that ranks India in the top five, where India is the fourth most attractive FDI destination in 2010. According to Department of Industrial Policy & Promotion, Ministry of Commerce and Industry,
1 CIA World Factbook 2010.2 United Nations.3 Central Statistical Organisation (CSO), Government of India.4 Ministry of Statistics and Programe Implementation, CSO.5 Exchange rate: 1USD = INR 45.6 Union Budget 2011 – 2012 – Macro Economic Framework Statement.7 www.eximbankindia.com.8 http://commerce.nic.in.9 Ministry of Commerce and Industry, Government of India.10 A Profile of Banks 2009-10, Reserve Bank of India.
151

APPENDIX - INDEPENDENTMARKET RESEARCH REPORTByCushman&WakefieldIndia
A INDIA: ECONOMIC & COMMERCIAL REAL ESTATE OVERVIEW (continued)2 Investment Scenario in India (continued) total FDI11 inflow was recorded at INR 1,165.5 billion (USD 25.9 billion) (up to February 2011), as compared to INR 1,674.0billion(USD37.2billion)duringFY2010.Likewise,investmenttrendsin9MFY2011(Apr–Dec2010)havebeen moderate, recording total FDI of only INR 731.712 billion (USD 16.03 billion)13. Mauritius, Singapore and US were the top investingcountriesinIndiaaccountingfor42.2%,9.4%,and7.5%,respectivelyinthecumulativetotalFDIinflowssince Apr 2000-Dec 2010.
Country wise cumulative FDI Equity Inflow (April ’00 - Dec ‘10)
2,500 –
2,000 –
1,500 –
1,000 –
500 –
0 –
Mauriti
us
Singap
ore USA UK
Nether
lands
Japan
Cypru
s
German
y
Fran
ceUAE
(%) o
f to
tal fl
ow
In IN
R B
illio
n
42%
9% 7% 5% 4% 4% 4%2% 2% 1%
–45%
–40%
–35%
–30%
–25%
–20%
–15%
–10%
–5%
–0%
Source: Ministry of Commerce and Industry
11 Includes equity, reinvested earnings, and other capital.12 Department of Industrial Policy & Promotion, Ministry of Commerce and Industry.13 Exchange rate : USD 1 = INR 45.
152

A INDIA: ECONOMIC & COMMERCIAL REAL ESTATE OVERVIEW (continued)2 Investment Scenario in India (continued) Sector wise cumulative FDI Equity Inflow (April ‘00 - Dec ‘10)
250,000 –
200,000 –
150,000 –
100,000 –
50,000 –
0 –
Mumbai
Delhi
Bangalo
re
Ahmed
abad
Chenn
ai
Hyder
abad
Kolkata
(%) o
f to
tal fl
ow
In IN
R B
illio
n
35%
19%
6% 5% 5% 5%1%
–40%
–35%
–30%
–25%
–20%
–15%
–10%
–5%
–0%
Source: Ministry of Commerce and Industry
TheservicesectoraccountedforthehighesttotalFDIwithcumulativeinflowofINR1,182.7billion(USD26.4billion)from Apr2000tillDec2010accountingfor21%shareofthetotalinflow.ComputerSoftware&Hardwareand Telecommunication sectors ranked 2nd and 3rd in cumulative total FDI inflows (from Apr 2000 till Oct 2010), attracting INR471.4billion(USD10.6billion)(withashareof8.5%)andINR467.2billion(USD10.2billion)(withashareof8.1%), respectively.Housing&realestatesectorattractedINR420.5billion(USD9.4billion)fromApr2000toDec2010(7.4% of the cumulative total FDI inflow).
State wise cumulative FDI Equity Inflow (April ‘00 - Dec ‘10)
During Apr 2000 to Dec 2010, Mumbai region (which includes Maharashtra, U.T. of Dadra & Nagar Haveli, Daman & Diu) attractedthehighestcumulativeEquityFDIinflowinIndiaofINR1,976billion(USD44.2billion)(35%ofthecumulative Equity FDI inflow). During the same period, New Delhi (which includes Delhi, part of Uttar Pradesh and Haryana) attractedcumulativeEquityFDIinflowofINR1,113billion(USD24.6billion)(accountingfor20%),andBangalore (Karnataka)attractedINR357billion(USD8billion)(accountingfor6%).
According to India Brand Equity Foundation, India’s real estate sector (market size) is expected to reach INR 8,100 billion (USD 180 billion) by 202014,supportedbyINR945billion(USD21billion)freshFDIinvestmentoverthenext10years. ThecurrentcontributionoftherealestatesectortoIndia’sGDPisapproximately5%,whichisalsoexpectedtogrowin the coming years.
1,400–
1,200 –
1,000 –
800 –
600 –
400–
200 –
0 –
Servic
e
Compute
r
Telec
om
Real E
state
Constr
uctio
n
Automob
ile
Power
Metal
Petrole
um
Chemica
l
(%) o
f to
tal fl
ow
In IN
R B
illio
n
21%
8% 8%7% 7%
4% 4%3% 3%
2%
–25%
–20%
–15%
–10%
–5%
–0%
Source: Ministry of Commerce and Industry
14 IBEF.org.
153

Particulars Unit 2006-07 2007-08 2008-09 2009-10 2010-11E
IT Software & Services USD Billion 39.3 52.0 59.9 63.7 76.0
Growth in IT software & services % 30% 32% 15% 6% 19%
Exports USD Billion 31.1 40.4 47.1 49.7 59.0
Growth in exports % 32% 30% 17% 6% 19%
Exports % of total % 79% 78% 79% 78% 78%
Employment No. 1,621,000 2,010,000 2,196,000 2,300,000 2,540,000
Increase No. 328,000 389,000 186,000 92,010 240,000
APPENDIX - INDEPENDENTMARKET RESEARCH REPORTByCushman&WakefieldIndia
A INDIA: ECONOMIC & COMMERCIAL REAL ESTATE OVERVIEW (continued)3 Overview of IT/ITES Industry in India The IT/ITeS15 industry in India has become a country’s premier growth engine, contributing substantially to the country’s GDP, employment and exports. The Federal and the State Governments have played a major role in positioning India as the IT hub and a major outsourcing location in Asia. Notable policies included the IT policy and creation of Software Technology Parks of India (“STPI”) and promulgation of Special Economic Zones (“SEZ”). On the fiscal front, companies were provided incentives such as duty-free imports of software and hardware products and exemptions in the corporate income tax. This promoted investment having potential for growth in the country and gave a further boost to employment. Growth in the IT/ITeS industry in India has fuelled demand for all kinds of real estate asset classes like commercial office space, residential, retail and hospitality in the country.
The following table highlights the industry’s performance over the last couple of years:
As can be seen from the above table, the IT/ITeS industry has more than doubled during the above period. During 2009- 10, the industry’s steady double digit growth was affected by the global recession. However, in year 2010-11, with theglobaleconomyimproving,theIndianIT/ITeSindustrywitnessedaquickreboundandisexpectedtogrowby19%. AsaproportionofnationalGDP,thesectorrevenueshavegrownfrom1.2%inyear2007-2008to6.1%inyear2009-10 andfurthertoanestimated6.4%inyear2010-11.India’sshareintheglobalsourcingmarkethasincreasedfrom51% in2009-10to55%in2010-11.Thetotaldirectemploymentfromtheindustryisalsoestimatedtohavereached 2.5million.Itisestimatedthatforevery1directemployment,theindustrygeneratesindirectemploymentof3.6-4.0 person translating to about 9-10 million indirect employment. In year 2011-12 Software and services export revenues anddomesticrevenuesisexpectedtogrowby16-18%and15-17%respectively.
Availability of quality talent at cost effective rates, rapidly developing infrastructure, an enabling innovation environment, supportive regulatory policies and a positive overall business environment – are all central pillars to India’s value proposition.
Source: NASSCOM
15 Information Technology and Information Technology Enabled Services.
154

A INDIA: ECONOMIC & COMMERCIAL REAL ESTATE OVERVIEW (continued)3 Overview of IT/ITES Industry in India (continued) The industry’s vertical mix is well balanced across several mature (like BFSI16) and emerging sectors (like retail, hospitality).WhileBFSIasaverticalandUSasgeographyaccountedforthelargestrevenuegrowth,emergingverticals and new geographies growth rate was 1.3-1.5 times of core markets reiterating the industry’s focus on diversification in the coming decade.
EventhoughIndiahasa50-55%marketshareoftheoffshoringmarket,thereistremendousheadroomforgrowthas current off shoring market is still a small part of the outsourcing industry. Significant opportunities exist in core vertical and geographic segments of BFSI and US, and emerging geographies and vertical markets such as Asia Pacific, retail, healthcare and government respectively. Development of these new opportunities can triple the current addressable market, and can lead Indian IT/ITeS revenues to USD 225 billion by 2020. The industry also has the potential to transform India by harnessing technology for inclusive growth.
4 Overview of Office Space Market in India Withsignsofeconomicstabilisationandpositivebusinesssentimentaidedbystrongeconomicexpansion,property markets in India have picked up the momentum during the year 2010. Many of India’s corporate expansion plans that were put on hold because of the financial crisis were executed in the first half of 2010, resulting in a healthy revival of the office market nationwide. The occupancy levels in office market recovered substantially from the downtrend seen in2009topositivegrowthin2010.Therentalsincreasedintherangeof5-15%inmajormicro-marketsacrosstheleading commercial centres of India17.
Byend-2010,commercialofficespacesupplyacrossmajorcitieswasrecordedatapprox.43millionsq.ft18. SEZ supply for the year recorded at approximately 9.2 million sq. ft.19,witnessingadropof30%fromthepreviousyear. Bangalore accounted for the highest SEZ supply, followed by NCR and Hyderabad.
The major demand for office space continues to be from Information Technology / Information Technology Enabled Services (“IT/ITES”) followed by Banking, Financial Services and Insurance (“BFSI”) and Pharmaceutical sectors.
5 Outlook The year 2011 is also expected to be strong for real estate sector. Corporate office space has witnessed an increasing occupier interest and is expected to continue in the current year. Construction activity, which had slowed down in the year 2009, has gained momentum in the past few months and is expected to provide a substantial addition to the existing stock levels in the current year. This supply addition is also expected to counter the effects of increasing demand levels thereby keeping the price escalation in control.
16 Banking, Financial Services and Insurance.17 Cushman & Wakefield Research.18 Cushman & Wakefield Research.19 Cushman & Wakefield Research.
155

APPENDIX - INDEPENDENTMARKET RESEARCH REPORTByCushman&WakefieldIndia
B BANGALORE COMMERCIAL MARKET OVERVIEW1 Micro-Market Description Bangalore is the capital of State of Karnataka and is located in the south east of the State. Greater Bangalore is spread over a total area of over 786 sq km (conurbation area) with a population of around 5.6 Million (2001 census). As per BangaloreDevelopmentAuthoritypopulationofBangaloreMetropolitanAreaisestimatedtobe8.84millionby2015. Currently, it is the third most populous city and the fi fth most populous urban agglomeration in India.
The city, known as Silicon Valley of India, has emerged as a favourite IT/ITES destination over the last 5-7 years. Home tocompanieslikeMicrosoft,Yahoo,Wipro,Infosys,IBM,GE,Google,Accenture,TCS,etc,thecityhasbeenthefront runner in attracting technology companies. Apart from successfully attracting IT companies, Bangalore is also considered to be a Biotech destination as well. Bangalore houses some of the most prominent biotechnology research institutions of India like Indian Institute of Science and National Centre for Biological Resources.
TheotherindustriesinBangalorerelatedtomanufacturingofAircraft,Earthmovingequipment,Watches,Garments, Silk, Machine Tools amongst others. The city has the presence of prominent educational institutions like Indian Institute of Management, Indian Institute of Science, National Law School and a number of engineering/medical colleges offering talent pool to the existing corporations.
156
B BANGALORE COMMERCIAL MARKET OVERVIEW (continued)1 Micro-Market Description (continued) Government of Karnataka has initiated various infrastructure projects which are expected to have significant impact on the growth of Bangalore city. At present, some of these projects are still in the planning stage. The projects are aimed at introducing international standard infrastructure into the city, which is also a key necessity for the balanced growth of the city. The same has been highlighted in the table below.
Projects Description
Airport City The new International Airport is expected to provide impetus for economic activities in the northern Bangalore region. The Airport City is expected to bring in commercial, retail and hospitality developments. However, it should be noted that the commercial component is expected to be developed in a phased manner spreading over the next 5 – 8 years time horizon. Commercial component: The airport commercial complex is expected to have office space development of approximately 8 million sq. ft. supporting aeronautical and non-aeronautical activities.
Retail Component: The total built up of the retail component is expected to be approximately 750,000 sq. ft. within the terminal.
Hospitality Component: The upcoming star category hotel under the Trident Hilton brand will be located approximately 600 metres from the airport terminal comprising 321 rooms.
Metro Rail Project The project is to be developed in two phases covering a total area of 33 km across the city. The first phase consists of two corridors of double lines- the east-west corridor and the north-south corridor.
The total number of passengers expected to travel on the metro per day are 1 million in 2011 and 1.6 million in 2021. The first leg of the first phase of the project is expected to be operational by mid 2011.
Peripheral Ring Road A Peripheral Ring Road (“PRR”) of about 110 km is proposed around Bangalore at a radial distance between 2.80 to 11.50 km from the existing Outer Ring Road and 14 to 22 km from the city centre.
The PRR will link major highways at Tumkur Road, Mysore Road, Old Madras Road, and the Hosur Road.
Townships Bangalore Metropolitan Regional Development Authority is planning the development of five satellite townships around Bangalore offering a total of 61,000 acres for development. Currently these townships are at planning stage with no defined development plans. The townships are:
• Sathanur Township (16,230 acres)• Ramanagaram Township (4,000 acres)• Bidadi Township (9,178 acres)• Solur Township (12,500 acres)• Nandagudi Township (18,500 acres)
The Bidadi Township was the first township scheduled for development. The Bangalore Metropolitan Region Development Authority (“BMRDA”) in 2007 invited bids for the development. After evaluation of bids, DLF Ltd. was awarded the project. However, DLF has put forward a proposal to BMRDA to withdraw from the project and hence the project has not started.
There are no definite timelines on the development of these townships currently.
Bangalore Mysore Infra-structure Corridor
The project consists of the construction of a 4-lane (convertible to 6) toll expressway, 5 townships and associated link roads, power plant and support infrastructure. The 4-lane, 111km concrete expressway will connect Bangalore with Mysore and is expected to cut driving time from the present 4 hours to 90 minutes.
At the Bangalore end, a 41km tolled outer peripheral road connects the expressway to NH 4 (Bangalore-Pune) and NH 7 (Bangalore-Hosur). A major portion of this toll expressway is complete and has become operational since December 2008.
157

APPENDIX - INDEPENDENTMARKET RESEARCH REPORTByCushman&WakefieldIndia
The real estate development has evolved from the centre of the city, with the core Business District (MG Road) located at the centre of the city. The development pattern of the city is undergoing a significant shift with development shifting from the central areas to the peripheral areas, mainly along the south-eastern corridor owing to the IT/ITES companies and the northern corridor due to the International Airport at Devanahalli. These corridors have witnessed large scale commercial as well as residential developments.
EasterncorridorcomprisingWhitefield,OuterRingRoad(Sarjapur–Marathahalli)andsoutheasterncorridorcomprising Hosur Road represents the largest clusters of IT/ITES companies in Bangalore. These peripheral areas have accounted forapproximately70%oftheaggregateleasinginthecity.TheCBDandOffCBDlocationsloseouttothesuburbanand peripheral locations because of the lack of large contiguous spaces.
The International Airport at Devanahalli has led to a spurt in development along the northern quadrant of Bangalore. Numerous residential and commercial projects are under development in this micro market.
The western and north western corridors of Bangalore city have been concentrated with industries. The major industrial presenceisrepresentedbyPeenyaIndustrialAreaalongBangalore-Tumkurroad(NH–4).Thesouthwesterncorridor has been a trading and residential hub with industrial presence being mainly represented by the Bidadi Industrial Development Area along the Bangalore-Mysore state highway.
The development of Ring Roads is expected to boost real estate developments in the city. The development of the Outer Ring Road has contributed to the connectivity of the peripheral areas of the city. The proposed development of the Intermediate Ring Road and the Satellite Town Ring Road is expected to further improve the connectivity of the peripheral locations to the other parts of the city.
B BANGALORE COMMERCIAL MARKET OVERVIEW (continued)1 Micro-Market Description (continued) Bangalore micro-market classification and location for commercial sector
Micro-market Locations included
Central Business District (CBD) MG Road
Off Central Business District (Off CBD)
Lavelle Road, Infantry Road, Vittal Mallya Road, Palace Road, Residency Road, Millers Road, Richmond Road, Queens Road, Cunningham Road, Ulsoor Road, Kasturba Road, Victoria Road, Brigade Road, Murphy Road
Suburban Business District (SBD)
Koramangala including Adugodi (Hosur Road), Bannerghatta Road up to Outer Ring Road, Indiranagar, Hosur Road (till Silk Board Junction), Airport road including Intermediate Ring Road, CV Ramannagar, JP Nagar, Jayanagar and Old Madras Road
Peripheral Business District (PBD)
Whitefield, Electronic City, Outer Ring Road (Hebbal Flyover – Sarjapur Road), Hosur Road (From Silk Board Junction – Electronic City)
158
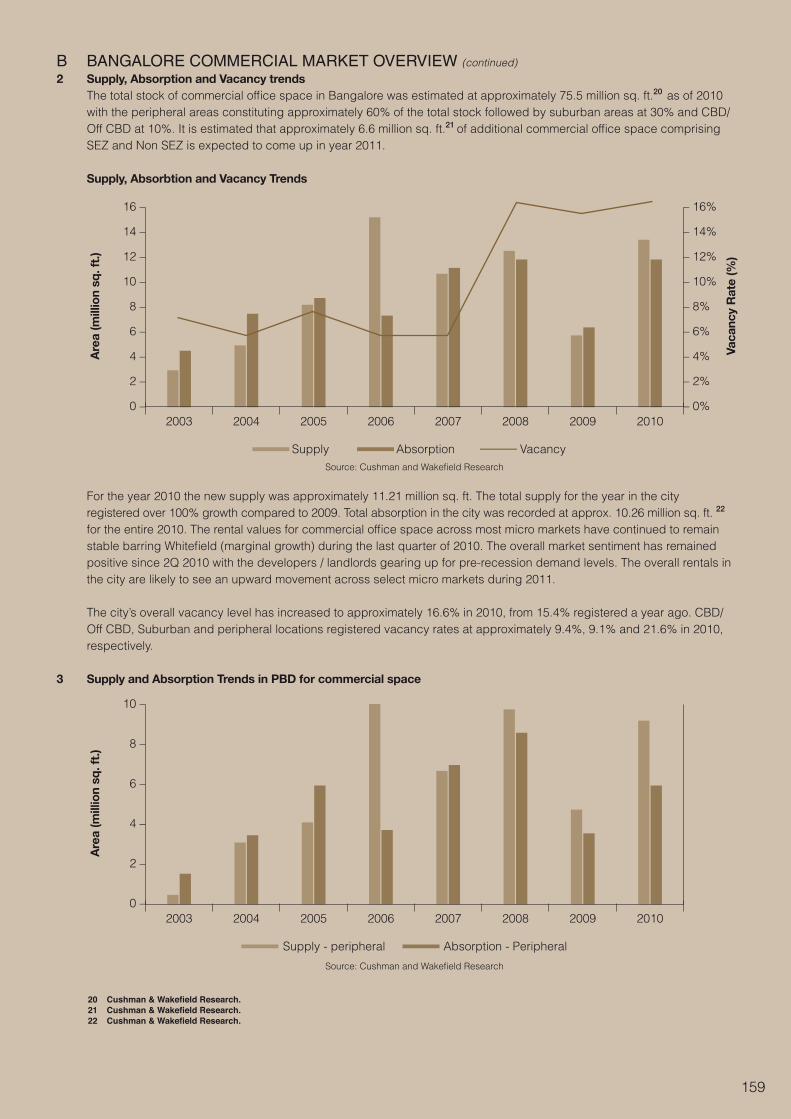
B BANGALORE COMMERCIAL MARKET OVERVIEW (continued)2 Supply, Absorption and Vacancy trends The total stock of commercial office space in Bangalore was estimated at approximately 75.5 million sq. ft.20 as of 2010 withtheperipheralareasconstitutingapproximately60%ofthetotalstockfollowedbysuburbanareasat30%andCBD/ OffCBDat10%.Itisestimatedthatapproximately6.6millionsq.ft.21 of additional commercial office space comprising SEZ and Non SEZ is expected to come up in year 2011.
Supply, Absorbtion and Vacancy Trends
For the year 2010 the new supply was approximately 11.21 million sq. ft. The total supply for the year in the city registeredover100%growthcomparedto2009.Totalabsorptioninthecitywasrecordedatapprox.10.26millionsq.ft.22 for the entire 2010. The rental values for commercial office space across most micro markets have continued to remain stablebarringWhitefield(marginalgrowth)duringthelastquarterof2010.Theoverallmarketsentimenthasremained positive since 2Q 2010 with the developers / landlords gearing up for pre-recession demand levels. The overall rentals in the city are likely to see an upward movement across select micro markets during 2011.
Thecity’soverallvacancylevelhasincreasedtoapproximately16.6%in2010,from15.4%registeredayearago.CBD/ OffCBD,Suburbanandperipherallocationsregisteredvacancyratesatapproximately9.4%,9.1%and21.6%in2010, respectively.
3 Supply and Absorption Trends in PBD for commercial space
16 –
14–
12 –
10 –
8 –
6 –
4–
2 –
0 –
10 –
8 –
6 –
4–
2 –
0 –
2003
2003
2008
2008
2010
2010
2009
2009
2007
2007
2006
2006
2005
2005
2004
2004
Vaca
ncy
Rat
e (%
)
Are
a (m
illio
n sq
. ft.
)A
rea
(mill
ion
sq. f
t.)
–16%
–14%
–12%
–10%
–8%
–6%
–4%
–2%
–0%
Supply - peripheral Absorption - Peripheral
Supply Absorption VacancySource:CushmanandWakefieldResearch
Source:CushmanandWakefieldResearch
20 Cushman & Wakefield Research.21 Cushman & Wakefield Research.22 Cushman & Wakefield Research.
159

APPENDIX - INDEPENDENTMARKET RESEARCH REPORTByCushman&WakefieldIndia
C INTERNATIONAL TECH PARK BANGALORE (“ITPB”): PROPERTY ANALYSIS1 Introduction ThepropertyislocatedinWhitefield(EastBangalore)withintheExportPromotionIndustrialParkzone(approximately 650acres).Themicro-markethousesover400companies,prominentamongstthemareOracle,SAP,TCS,CapGemini, IBM,GM,Nipuna,GE,HUL,iGate,Aviva,24*7,HCLPerotSystems,Inteletc.Currently,theaccessibilityinthemicro- market is good with access to MG Road - the CBD and the new International Airport at Devanahalli. Further the connectivity is expected to improve in the future with the development of the Peripheral Ring Road.
Profile of International Tech Park Bangalore (ITPB)
Overview
Date of Operation Nov 1998
Configuration
Total Project Area (Land) 68.5 acres
Development Mix Commercial development with support retail and other amenities. The retail mall and SEZ office building are expected to be operational by July 2011.
Built up Area Non SEZ office space - 1.8 million sq. ft. of owned space (SBA). The area is in 6 blocks along with the retail mall.
Park Square Mall – 0.4 million sq. ft.
Voyager (SEZ office space under construction) – 0.5 million sq. ft.
Floor Plate Area (Approx) Varying floor plates
No. of Floors Varying floors for different blocks
Location
Address Whitefield main road, Sadarmangala / Pattandur Agrahara, Krishnarajpura Hobli, Bangalore Urban District, India
Business District Peripheral Business District (PBD)
Proximity to CBD 20 km (45 - 60 minutes)
Proximity to Airport 45 km (75 -115 minutes)
Proximity to Railway Station (Bangalore city station) 20 km (45 - 60 minutes)
Proximity to nearest Prime Residential Development: Kormangala and HSR layout
12 km (25 - 30 minutes)
Proximity to nearest Retail / Entertainment Within ITPB
Connecting arterial roads Whitefield main road
160

C INTERNATIONAL TECH PARK BANGALORE (“ITPB”): PROPERTY ANALYSIS (continued)1 Introduction (continued) Profi le of International Tech Park Bangalore (ITPB) (continued)
2 Location & Accessibility ITPBislocatedinWhitefieldwhichisaPBDofBangalore.WhitefieldislocatedintheEasternquadrantofBangalore.Itis approximately20kmfromtheCBDand45kmfromtheInternationalAirportatDevanahalli.
Location
Surrounding Localities Whitefi eld main Road on the north, on the west is GR Tech Park, on the east is Nagarjuna Signet building while the south the property is abutted by a connecting road.
Access to Public Transport ITPB is well connected by the local Bangalore bus network to important commercial and residential locations in Bangalore.
Access to Hired Transport Close to the development are auto rickshaw stands and call cabs vendors.
Infrastructure
Power Supply Dedicated captive power plant of 20 MW operating in synchronous with 220 KV state grid.
Voice & Data Communication The park is supported by eight service providers for voice and data for seamless communication connectivity. The park has WiFi-enabled zones as well.
Security System Advanced security systems, including CCTV camera surveillance, boom/fl ap barriers and visitor management system.
Fire Protection System Includes smoke detectors, water sprinklers, portable fi re extinguishers and fi re hydrant hose reels and 24-hour security.
Building Management System
Centrally monitored and controlled at a common console. Common area lighting and air conditioning are time controlled through the building management system.
Parking Basement car park and a Multi Level Car Park.
Amenities
Business Centre Incubation centre for companies wishing to start an office immediately, comprising cabins, discussion and conference rooms. It has six cabins with total 9 workstations, two suites with 16 workstations and one discussion room and three multi purpose halls.
Retail Mall (covers the basement fl oors)
ATMs, food court, coffee shops, telephone service providers, convenience store, travel agent, and health care centre/ clinic and pharmacy.
Source: Ascendas Property Fund Trustee Pte. Ltd.
161

Building Name DeveloperYear of Completion
Total Area(sq.ft)
Vacancy(sq.ft) Type
Quoted Rental (INR per sq. ft. per month)
Main Occupiers
Salarpuria GR Tech Park
Salarpuria Group 2006 1,200,000 77,924 Fully
Furnished 56
HP, Sapient, TCS, Goldman Sachs
Prestige Featherlite Prestige
Constructions 2006 98,946 52,920 Fully Furnished 48
Thomson Holdings, Next Edge, Ametek
Raheja Whitefield Palms B Raheja 2007 200,975 200,975 Warm shell 30 -
Adarsh Ecoplace Adarsh Developers 2007 200,000 90,000 Fully
Furnished 51Cem Technologies, Allignbiz
APPENDIX - INDEPENDENTMARKET RESEARCH REPORTByCushman&WakefieldIndia
C INTERNATIONAL TECH PARK BANGALORE (“ITPB”): PROPERTY ANALYSIS (continued)3 Tenant Mix The property has a diverse client base of IT/ITES, Telecom, Engineering, Advanced Research industry occupiers. The major tenants in the development are Affiliated Computer Services, General Motors and First India Corporation. etc. The development caters to companies with space requirements in the range of 10,000-150,000 sq. ft.
4 Development Performance ITPBwasconceptualisedasa‘plug-and-play’conceptandisequippedwithsuchfeaturestoprovideacompletelifestyle environment with value-added amenities. Some of these features include - • Dedicatedcaptivepowerplantof20.0MW,WiFi/broadbandconnectivity. • Largefloorplatesforefficientspaceusageandlayout,centralair-conditioning. • State-of-the-artfireandsecuritysystems,centrallycontrolledandmonitoredbuildingmanagementsystems. • Lushlandscapingwithwaterfeaturesaddsanaestheticappealtotheproperty. • Inaddition,round-the-clockin-housemaintenanceteamsandqualifiedprojectmanagementteamsareavailableto oversee all requirements such as general maintenance and fit-out requirements of the tenants. • Dedicatedretailareawithfoodcourtsandfivestarhotel.
5 Competition Analysis ITPB was the first Grade A office space development in Bangalore. ITPB provides extended warm shell space while most developments in the vicinity offer only warm shell space23. Due to the extended warm shell specification as well as the other facilities ITPB offers, it commands higher rentals as compared to any other development in the vicinity.
Whitefield’scommercialmicromarketcomprisesamixofBuild-To-Suit,campusandspeculativedevelopment’s.The success of ITPB led to development of many commercial buildings/projects in the micro -market. The present stock of officespaceinWhitefieldisapproximately20millionsq.ft.(includingITPB)andaccountsforapproximately26%ofthe officestockinthecity.Themicro-markethaswitnessedhighinfusionofofficespaceinthelast3–4yearsleadingtoover supply. Additionally the micro-market witnesses competition from developments on Outer Ring Road too.
Current Commercial Developments in Whitefield
23 Includes A/C ducting, False Ceiling, Lighting and Fire Fighting Systems.
162

Building Name DeveloperYear of Completion
Total Area(sq.ft)
Vacancy(sq.ft) Type
Quoted Rental (INR per sq. ft. per month)
Main Occupiers
Embassy Crest Embassy Group 2007 266,081 266,081 Warm shell 38 -
RMZ CentennialRMZ 2008 888,215 48,825 Warm shell 28
AVIVA, Shell networks and Tyco
Tata Xylem Tata Housing 2008 360,000 360,000 Warm shell 40 Invitrogen
Embassy Paragon
Embassy Group 2009 367,323 160,358 Warm shell 38 Intel and
Hypermarket
Kalyani Platina Kalyani Developers 2009 360,000 70,000 Warm shell 31 Delphi, UL
India
DivyaSree Techno Park A2
DivyaSree developers 2010 200,000 Nil - - Accenture
Brigade Metropolis
Brigade Group 2010 800,000 550,000 Warm shell 33 Cap Gemini
Global Axis
Gopalan Enterprises 2010 2,500,000 Nil Bare shell 30
L&T Infotech, Infinite Computer Solutions and TCS
Kalyani Platina - Block 2
Mohan Enterprises 2010 420,000 Nil Fully
Furnished 52
EFI, APC, Infineon Technologies, HP and Mu Sigma
Prestige Shanthinekatan
Prestige Constructions 2010 3,100,000 3,029,000 Warm shell 35 Sonus
Networks
Building Name DeveloperExpected Completion
Status (Delayed / On time) Area (sq. ft.)
Quoted Rentals (INR per sq. ft.per month)
Bhoruka Tech Park Bhoruka Park Pvt. Ltd. 2011 Delayed 650,000 32
Global Research Triangle Beary’s Group 2011 Delayed 750,000 36
DivyaSree Technopark - C4 DivyaSree developers 2011 Delayed 625,000 _
Gopalan Axis Gopalan Enterprises (India) Pvt. Ltd 2012 Delayed 540,000 30
C INTERNATIONAL TECH PARK BANGALORE (“ITPB”): PROPERTY ANALYSIS (continued)5 Competition Analysis (continued)
Upcoming Commercial Developments in Whitefield
Theupcomingsupplyfortheyear2011isestimatedatapproximately2.2millionsq.ft.inWhitefield.WhileITPBis commandingrentalsintherangeofINR45-50persq.ft.permonthforextendedwarmshellwhichiscomparabletothe suburbanlocation,thequotedrentalsforthewarmshellcommercialspaceinWhitefieldmicromarketisbetweenINR25- 38persq.ft.permonthashighlightedinthetableabove.HowevertransactionsinWhitefieldhavebeenintherangeof INR 26 – 30 per sq. ft. ITPB commands higher rentals compared to the market due to its brand, the quality of infrastructure it provides and its facility management services directed towards reducing the overall occupancy cost of the occupiers.
The growth of IT/ITeS offices created a significant demand for residential / retail spaces in the vicinity. In the recent past, theWhitefieldmicromarketwitnessedfewmall/standaloneretaildevelopmentswithfewmoreinplanning/ development stages.
Source:CushmanandWakefieldResearch
Source:CushmanandWakefieldResearch
163
APPENDIX - INDEPENDENTMARKET RESEARCH REPORTByCushman&WakefieldIndia
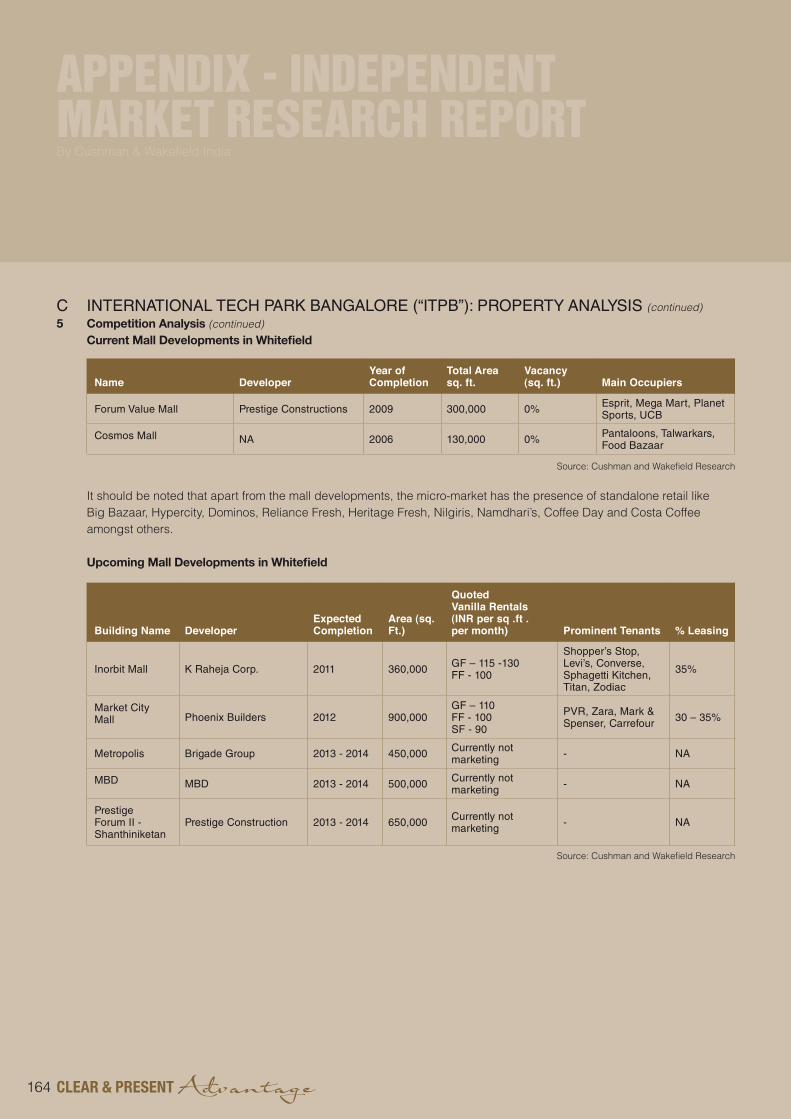
C INTERNATIONAL TECH PARK BANGALORE (“ITPB”): PROPERTY ANALYSIS (continued)5 Competition Analysis (continued) Current Mall Developments in Whitefield
It should be noted that apart from the mall developments, the micro-market has the presence of standalone retail like Big Bazaar, Hypercity, Dominos, Reliance Fresh, Heritage Fresh, Nilgiris, Namdhari’s, Coffee Day and Costa Coffee amongst others.
Upcoming Mall Developments in Whitefield
Building Name DeveloperExpected Completion
Area (sq. Ft.)
QuotedVanilla Rentals (INR per sq .ft .per month) Prominent Tenants % Leasing
Inorbit Mall K Raheja Corp. 2011 360,000 GF – 115 -130FF - 100
Shopper’s Stop, Levi’s, Converse, Sphagetti Kitchen, Titan, Zodiac
35%
Market City Mall Phoenix Builders 2012 900,000
GF – 110FF - 100SF - 90
PVR, Zara, Mark & Spenser, Carrefour 30 – 35%
Metropolis Brigade Group 2013 - 2014 450,000 Currently not marketing - NA
MBD MBD 2013 - 2014 500,000 Currently not marketing - NA
Prestige Forum II - Shanthiniketan
Prestige Construction 2013 - 2014 650,000 Currently not marketing - NA
Name DeveloperYear of Completion
Total Areasq. ft.
Vacancy(sq. ft.) Main Occupiers
Forum Value Mall Prestige Constructions 2009 300,000 0% Esprit, Mega Mart, Planet Sports, UCB
Cosmos Mall NA 2006 130,000 0% Pantaloons, Talwarkars, Food Bazaar
Source:CushmanandWakefieldResearch
Source:CushmanandWakefieldResearch
164

C INTERNATIONAL TECH PARK BANGALORE (“ITPB”): PROPERTY ANALYSIS (continued)6 SWOT Analysis
7 Outlook Over the next 5-10 years the micro market is expected to become a satellite town with good connectivity to the airport andtheCBD.Rentalsareexpectedtoremainstableovernext3-4yearsduetocurrentvacantstockandpotential upcoming supply. However, due to the facilities provided by ITPB and the extended warm shell option, the property is expected to continue commanding premium in the future. Additionally, the development of the SEZ in the property is expected to cater to the demand in that segment.
D CHENNAI COMMERCIAL MARKET OVERVIEW1 Micro-market description Chennai,thecapitalcityofTamilNaduisspreadoveratotalareaof174sq.km(MetropolitanArea:1,177sq.km.).Ithas a population of approximately 7.0 million people. The city has a fairly well developed physical infrastructure and it possesses a reasonably mature road, rail, air and sea transport network.
Chennai is the third largest commercial and industrial centre in India, and is known for its cultural heritage and temple architecture.Thecity,knownasthe‘automobilemanufacturinghub’ofIndia,isapreferredmanufacturingdestinationwith over40%shareofIndia’sautomobileindustry.
Chennai serves as the manufacturing base for large multinationals like Ford Motors, Hyundai, Saint-Gobain, Nokia and Flextronics.ItisalsohometoIT/ITeSmajorslikeInfosys,Wipro,Polaris,Accenture,I-Flex,TCS,Cognizant,etc.
Infrastructure Development Chennai is well connected to the rest of the country by rail, road and air network. Chennai’s airport provides both domestic and international connectivity and is located off GST Road, 16 km from the city centre. Chennai is currently serviced by 19 international and 9 domestic airlines. Chennai is a leader in bandwidth capability with 13.52 tbps bandwidth availability via two submarine cables. The world’s biggest and India’s first private submarine Optical Fibre Cableprojecti2inetworkwithabandwidthof8.4tbpswillmakeChennaithe‘ConnectivityGatewayofIndia’.Chennai port is the second largest port in India, after Mumbai. The Chennai city gets funding for about 18 infrastructure projects from the Jawaharlal Nehru National Urban Renewal Mission for improving facilities within the city. Some of the important projects are the Mass Rapid Transit System (extension from Velacherry), Outer Ring Road project, Infrastructure development on IT corridor. The other infrastructure development planned by the state includes improvement of Mount Poonamalle High road, Flyover project on Kathipara junction and development of the satellite township at Maraimalai Nagar. The primary growth drivers in the region are: • IT/ITeSservices; • AutomobileIndustryand • Telecommunicationindustry.
Strength Weakness
• Established Brand with International quality Grade A development
• Located within the IT corridor of the city with good connectivity and enjoys good frontage on the access road
• A part of the development is an SEZ and can cater to demand for such space in the future
• Captive power plant and high tension 220 KV Bescom backup power line makes it a state of art facility with no power cuts round the year
• It has large scope for expansion to cater to future market demand and expansion needs of existing occupiers
• The integrated development (retail / SEZ / Non SEZ / hospitality) adds value to the property
• Traffic congestion during peak hours
Infrastructure Location
• Preferred location for clients requiring higher warm shell specifications
• With development of retail, residential and hotel projects on Whitefield Road, the location is expected to become more self-sufficient and thus attractive in near future
• Upcoming supply in the micro-market.
165

Initiatives for Development Present Status Impact
Outer Ring Road:The Chennai Metropolitan Development Authority (“CMDA”) proposed to have an Outer Ring Road alignment as an express way with Rapid Rail system from Vandalur to Minjur for a length of 62 kms with inter-change facilities at five major road crossing at an estimated cost of Rs 4 billion.
Pegmarking of the area for Phase II of ORR is in progress.
The ORR upon its completion would reduce commute times by easing the traffic of heavy vehicles in the city and would provide an alternative route for vehicles, which were otherwise passing through the city.
Improvement of Mount Poonamallee Road:The CMDA undertook the project of widening and improving a 10 kilometre stretch of Mount Poonamallee road – a major light industrial area in Chennai and an emerging IT/ITeS industry corridor.
Completed The re-development of Mount Poonamallee Road has improved its accessibility and visibility as an attractive destination for manufacturing and service industries.
Flyover Project On Kathiapara Junction Completed Improvement in movement of traffic.
Development of the Satellite Township of Maraimalai Nagar:The project envisages development of 2100 acres in phases to accommodate one lakh population in a time span of 20 years. CMDA has developed so far 1400 acres. The development consists of mainly developedplots for residential and industrial purposes.
The planning and development of this township is underway.
The development of these townships will add to the growth of the residential sector in the peripheral locations of Chennai.
Mass Rapid Transit System - II (“MRTS”):Following the completion of the MRTS phase I, Phase II of the project was launched by extending the project from Thirumylai to Velachery.
The planning and development of this township is underway.
The Metro Rail project would substantially ease the pressure of vehicular traffic on the already congested roads and enable easy movement of population.
Metro Rail Corridor (Upcoming):
A Detailed Project Report (DPR) relating to the Chennai Metro Rail Project was prepared and submitted by the Delhi Metro Rail Corporation Limited (DMRC). The DPR envisages the creation of 2 initial corridors under the proposed Chennai Metro Rail Project as shown below
Corridor-1: Washermenpet – Broadway (Prakasam Road), Chennai Central Station – Rippon Building along Cooum River – Tarapore Towers – Spencers – Gemini – Anna Salai – Saidapet – Guindy – Chennai Airport.
Corridor-2: Chennai Fort – Chennai Central – along EVR Periyar Salai – Vepery, Kilpauk Medical College, Aminjikarai, Shenoy Nagar – Annanagar East – Anna Nagar Tirumangalam – Koyambedu – CMBT – along Inner Ring Road – Vadapalani – Ashok Nagar – SIDCO – Alandur – St. Thomas Mount.
The planning and development of this initiative is underway
The Metro Rail project would substantially ease the pressure of vehicular traffic on the already congested roads and enable easy movement of population.
APPENDIX - INDEPENDENTMARKET RESEARCH REPORTByCushman&WakefieldIndia
D CHENNAI COMMERCIAL MARKET OVERVIEW (continued)1 Micro-market description (continued) Infrastructure Development (continued)
166

D CHENNAI COMMERCIAL MARKET OVERVIEW (continued)1 Micro-market description (continued) Infrastructure Development (continued) There are primarily six commercial clusters in the city and with the exception of peripheral areas of Old Mahabalipuram Road and GST Road, all clusters are a mix of commercial and retail developments. Based on areas with high concentration of commercial, IT/ ITeS and IT SEZ developments, Chennai can be divided into the following established commercial micro markets:
Central Business District (“CBD”) TheCBDencompassesanareaof3-4kmsofroadwaysradiatingoutfromtheGeminiFlyover(AnnaFlyover),whichisa central landmark. The primary areas within the CBD are Anna Salai / Mount Road, Nungambakkam High Road (N H Road) and Radha Krishnan Salai (R K Salai), which includes Cathedral Road. Some prominent off-CBD locations are TTK Road (Off R.K. Salai), Village Road, College Road, Haddows Road and K H Road. Anna Salai or Mount Road is the arterial commercial road of Chennai. In addition to being a prominent offi ce micro market, N H Road is also an established high street retail destination.
Secondary Business District (“SBD”) The areas which comprise Chennai’s SBD are spread out and not concentrated in any one region. From the northwest (Ambattur) to the south (Guindy - Velachery, Sardar Patel Road, Mount Ponamalle road and Adyar), areas within the SBD are mostly a mix of commercial and retail establishments, except for Guindy and Ambattur, which are former industrial estates and are being re-developed into commercial destinations.
Peripheral Business District (“PBD”) The PBD consists primarily of Old Mahabalipuram Road (“OMR”), a 26 km stretch promoted by the State government as the “IT Highway” and extending from Taramani (Tidel Park) to Siruseri in the South. Although a former industrial area, it has rapidly transformed into a software corridor, spurred on by Tidel Park, one of the largest and earliest software technologyparksinIndia.TheothernotablePeripheralBusinessDistrictlocationisalongNH-45(GreatSouthernTrunkRoad).
167

APPENDIX - INDEPENDENTMARKET RESEARCH REPORTByCushman&WakefieldIndia
D CHENNAI COMMERCIAL MARKET OVERVIEW (continued)2 Supply, Absorption and Vacancy trends The stock of commercial office space till 2010 in Chennai was approximately 66.3 million sq. ft. with the suburban areas constitutingapproximately45%ofthetotalstockfollowedbyOffCBDat15%,CBD(CentralBusinessDistrict)at19% andPeripheralat21%each.
Supply, Absorbtion and Vacancy Trends
Outoftotalsupplyofaround9.8Millionsq.ftintheyear2008,about68%waslocatedintheSuburbanmicromarkets and23%inthePeripheralregion.Thesametrendwaswitnessedintheyear2009;theyearsawsupplyof8.39Millionsq. ft.with70%inthesuburbanand29%inperipheralregions.Totalsupplyfor2010was4.8millionsq.ft.
During 2010 Chennai office market witnessed consistent demand and controlled supply which resulted in higher rentals and lower vacancy levels in comparison to 2009. Due to steady demand in the CBD and Off CBD regions, rental values have remained stable during the fourth quarter. Also peripheral regions have continued to witness high vacancies as a result of which rentals have remained stable.
Totalnewsupplyfortheyear2010was4.87millionsq.ft.whichwasconsiderablylowerincomparisontothetotalsupply of 8.39 million sq. ft. in 2009. The total demand for the quarter was estimated at 950,000 sq. ft. which consisted of 30,000 sq.ft.ofpre-commitmentsand920,000sq.ft.offreshabsorption.Withthetotalabsorptionof990,000sq.ft.during fourth quarter of 2010, the total absorption for all of 2010 was at 3.85 million sq. ft.
Theoverallvacancyforthecityhasremainedstableat20.4%incomparisontothepreviousquarterbuthasdeclined by4.0percentagepointswhencomparedtothevacancyattheendof2009.Thisdeclineinvacancymaybeattributed tothefactthataround66.3%ofthefreshsupplyduring2010wasabsorbedduringtheyear.WhilstCBDandOffCBD locationshaveregisteredlowvacancyof6.1%and10.6%respectively,peripheralregionregisteredavacancyof36.8%.
12 –
10 –
8 –
6 –
4–
2 –
0 – 2002 20102009200820072006200520042003
Vaca
ncy
Rat
e (%
)
Are
a (m
illio
n sq
. ft.
)
–27%
–24%
–21%
–18%
–15%
–12%
–9%
–6%
–3%
–0%
Supply Absorption Vacancy
Source:CushmanandWakefieldResearch
168

D CHENNAI COMMERCIAL MARKET OVERVIEW (continued)2 Supply, Absorption and Vacancy trends (continued) Chennai office market is expected to witness increased supply and demand in the year 2011 with a projected supply of5.49millionsq.ft.Around19.1%ofthesupplyisexpectedtocomeinthefirstquarterof2011.Withtheimproved supply demand situation, rentals in most markets of the city are expected to remain balanced or witness slight appreciation in short term.
3 Supply, Absorption trends for Office space in Suburban Market
As at the end of 2010, the total commercial office stock in suburban micro market was estimated at approximately 28 million sq. ft. Some of the prominent existing commercial office developments in Taramani / Perungudi micro market are listed as under:
The total potential supply in the micro market is estimated to be in the range of 5 - 6 million sq. ft. in the next few years of which approximately 1.5 million sq. ft is expected to come up in year 2011. By the end of 2010, the vacancy in the micromarketwasapproximately20%.TheprevailingquotedwarmshellinTaramani/PerungudiwasINR27-44/sq.ft./ month.
8 –
7 –
6 –
5 –
4–
3 –
2 –
1 –
0 – 2002 20102009200820072006200520042003
Ren
tals
in IN
R/s
q ft
/mo
nth
Are
a (m
illio
n sq
. ft.
)
– 50
–45
–40
– 35
– 30
– 25
– 20
– 15
– 10
– 5
– 0
Supply Absorption Rent
Source:CushmanandWakefieldResearch
Prominent Developments Area sft
Ascendas ITPC 2,000,000
RMZ Millenia 2,200,000
SP Info city 2,600,000
India Infoline 250,000
TVH Agnitio 600,000
Prince Info city I 300,000
Prince Info city II 800,000
Royala Tech Park 125,000
TIDEL Park 1,280,000
Sterling Technopolis 220,000
KG 360 230,000
Stargate 300,000
Arihant Insight II 130,000
169

APPENDIX - INDEPENDENTMARKET RESEARCH REPORTByCushman&WakefieldIndia
E INTERNATIONAL TECH PARK CHENNAI (“ITPC”): PROPERTY ANALYSIS1 Introduction Taramani as an established IT/ITeS micro market, located at the beginning of the IT growth corridor of OMR. It is known for IT parks situated in this area like Tidel Park, ITPC, Elnet Software City, and TICEL Biotech Park. It is located adjacent to the posh residential locality of Adyar in south Chennai. Tidel Park, an information technology park that houses many IT companies.
Taramani borders the Indian Institute of Technology (“IIT”), Chennai. Taramani is home to several research labs and institutions, such as Central Leather Research Institute (“CLRI”), Central Electronics Engineering Research Institute (“CEERI”), National Environmental Engineering Research Institute (“NEERI”), and Voluntary Health Services and the most renownedpolytechnicofTamilNadu,CentralPolytechnic(“CPT”).80%ofthosewhohavestudiedatCPTareworking abroad. The National Institute of Fashion Technology (“NIFT”) is also present in Taramani. Further south, several small scale industries and factories are located in the Vikram Sarabhai Instronics Estate
TheWorldBankopenedoneofitslargestofficesintheworldinTaramanitohouseitsgrowingfinancialandtechnical support services. The 120,000 sq. ft. facility is on a 3.5-acre plot near ITPC.
The area is developing rapidly owing to the IT sector booming around the locality. Good roads had been laid and it is also developing to be one of the attractive residential localities in Chennai. The Taramani Railway station is in Thandhai Periyar Nagar, a prominent avenue in the locality. It is also close to the newly developed residential locality of Velachery.
Profile of ITPC
Overview
Date of Operation Phase 1 – August 2005, Phase 2 – December 2007 and Phase 3 – December 2010
Configuration
Total Project Area (Land) 15 Acres
Development Mix Commercial development with support retail and other amenities
Built up Area Approximately 2 million sq. ft. (Phase I,II&III)
Floor Plate Area (Approx) 65,000 sq. ft. (Phase I), 70,000 sq. ft. (Phase II), 70,000 sq. ft. (Phase III)
No. of Floors 12 (Phase I), 15 (Phase II), 14 (Phase III)
170

E INTERNATIONAL TECH PARK CHENNAI (“ITPC”): PROPERTY ANALYSIS (continued)1 Introduction (continued) Profile of ITPC (continued)
Location
Address Taramani, off Old Mahabalipuram Road, Chennai, India
Business District Peripheral
Proximity to CBD 9 km (20 - 25 minutes)
Proximity to Airport 10 - 12 km (20 - 25 minutes)
Proximity to Railway Station (Chennai Central) 20 - 23 km (50 - 60 minutes)
Proximity to nearest Prime Residential Development 1 - 2 km (5 minutes)
Connecting arterial roads Taramani Road
Surrounding Localities Taramani Road on the north, American School on the south, World Bank and vacant land on the west and TIDEL Biotech Park and vacant land on the east.
Access to Public Transport Thiruvanmiyur MRTS station is at a distance of less than a kilometre from ITPC.
Access to Hired Transport Intermediate public (auto rickshaws and call taxis) transport is available from OMR (which is only 100 metres away).
Infrastructure
Power Supply Dual primary power through two sub-stations and 100% generator power backup.
Voice & Data Communication The park is supported by five service providers for voice and data for seamless communication connectivity. The park has WiFi-enabled zones as well.
Security System Advanced security systems, including CCTV camera surveillance, boom/flap barriers and visitor management system.
Fire Protection System Includes smoke detectors, water sprinklers, portable fire extinguishers and fire hydrant hose reels.
Building Management System
Centrally monitored and controlled at a common console. Common area lighting and air conditioning are time-controlled through the building automation system.
Parking A total of 1,083 car parking lots and 2,019 two-wheeler parking lots.
Amenities
Fitness Centre Includes a fully equipped gymnasium, an aerobics studio and shower and changing facilities.
Business Centre Incubation centre for companies wishing to start an office immediately. Comprises of cabins, discussion and conference rooms.
Retail ATMs, food court, coffee shops, telephone service providers, convenience store, travel agent, and pharmacy.
171

APPENDIX - INDEPENDENTMARKET RESEARCH REPORTByCushman&WakefieldIndia
E INTERNATIONAL TECH PARK CHENNAI (“ITPC”): PROPERTY ANALYSIS (continued)2 Location and Accessibility The property is located in Taramani, Chennai. It is located along Chennai’s IT Corridor and is at a distance of approximately 10 km from the Chennai CBD. Surrounding of the property are primarily commercial developments like TIDEL Park, ELNET IT Park, SP Infocity and RMZ Millenia.
The subject project is well connected to major locations in the city via road networks. The distances of the subject site from major locations are as follows: • Approximately10kmfromtheChennaiCBD. • Approximately2.5kmfromtheMadhyakailashjunctionand • Approximately11kmfromtheChennaiinternationalairport.
3 Tenancy Mix The IT Park has a tenant mix of IT, BPO, ITES and other knowledge based industries. The development caters to companies in the IT/ITeS space with space requirements in the range of 10,000-150,000 sq. ft. Some of the major tenants are iNautix Technologies, Merrill Lynch, and Pfi zer.
172

E INTERNATIONAL TECH PARK CHENNAI (“ITPC”): PROPERTY ANALYSIS (continued)4 Development Performance ITPCwasconceptualisedasa‘plug-and-play’conceptandisequippedwithsuchfeaturestoprovideacompletelifestyle environment with value-added amenities. Some of these features include: • Foodcourts,100%powerbackup,WiFi/broadbandconnectivity. • Largefloorplatesforefficientspaceusageandlayout,centralair-conditioning. • State-of-the-artfireandsecuritysystemscentrallycontrolledandmonitoredbuildingmanagementsystems,anda pharmacy. • Lushlandscapingwithfountainsaddsanaestheticappealtotheproperty. • Inaddition,round-the-clockin-housemaintenanceteamsandqualifiedprojectmanagementteamsareavailableto oversee all requirements such as general maintenance and fit-out requirements of the tenants.
5 Competition Analysis ITPC is equipped with unique features to provide an integrated business environment with complete lifestyle and value- added amenities. Due to the high end warm shell office space and the facilities provided, it commands higher rentals in the market although the micro-market landscape is dotted with plenty of similar developments.
Current Commercial Developments around Taramani
The total stock around Taramani is approximately 9.5 million sq. ft. spread across over 22 projects some of which are highlighted in the table above. Even though this location was the first to witness a Grade A commercial development as early as 2001, the location was not a preferred destination until the declaration of OMR as IT corridor.
Future Commercial Developments around Micro-market (Taramani)
Building Name DeveloperYear of Completion
Total Area sq. ft.
Vacancy (sq. ft.)
Quoted Rentals (INR per sq. ft. per month) Main Occupiers
Tidel Park TIDCO & ELCOT 2000 1,280,000 30,000 40 TCS, Satyam , Ajuba, iNautix
Prince Info City I Prince Foundations 2005 300,000 23,000 35KLA Tencor , Dun & Bradstreet, CG Maersk
ETL Chennai One ETL Infrastructure 2006 1,400,000 127,000 45 TCS, Sutherland , Siemens
Rayala Techno Park Rayala Grop 2006 125,000 0 0 C-Dot Alcatel , K7 Computing
KG 360 Degrees KG Developers 2007 230,000 150,000 35 Temenos
Prince IT Park Prince Foundations 2007 190,000 190,000 35 Earlier tenant 3i Infotech
Techscape Towers Indus Cityscape 2008 250,000 100,000 35 India Infoline
Tek Medows Rattha 2008 240,000 100,000 26 First Source
AKDR Tech Park Individual 2009 200,000 200,000 25 -
SP Info City (Phase I) Shapoorji & Pallonji 2009 900,000 300,000 38 Amazon , Saksoft
RMZ Millennia Phase II RMZ Corp 2010 1,600,000 200,000 40 Ford, Caterpillar ,
Shell, HP, Adventity
Building Name DeveloperYear of Completion
Total Area sq. ft.
Vacancy (sq. ft.)
Quoted Rentals (INR per sq. ft. per month) Main Occupiers
TRIL Ramanujan IT City TRIL Phase I – 2011 600,000 375,000 58 NA
TRIL Ramanujan IT City TRIL Rest of the
development 2,400,000 NA NA NA
Source:CushmanandWakefieldResearch
Source:CushmanandWakefieldResearch
173

APPENDIX - INDEPENDENTMARKET RESEARCH REPORTByCushman&WakefieldIndia
E INTERNATIONAL TECH PARK CHENNAI (“ITPC”): PROPERTY ANALYSIS (continued)6 SWOT Analysis
7 Outlook ITPCcommandsrentalsthatarehigherasagainstthosedemandedbymostotherprojectsinthevicinity.Wedonot foresee a situation of significant rental correction or higher vacancies in ITPC in the immediate future. This ability to hold on to the higher rentals as well as higher occupancy would be a result of its established reputation and high quality of facilities which has enabled it to differentiate itself from the rest of the market.
ITPC phase III is ready, which will be an additional supply of approximately 737,000 sq. ft. New SEZ developments within Taramani could pose competition to this new development. For eg. Tata Realty is proposing to set up a 3,000,000 sq. ft. IT SEZ development in Taramani which will add significant supply to the micro market.
Strength Weakness
• The project is located in the IT Corridor, which is a prominent and established IT/ITeS location.
• The current expansion can cater to future market demand and expansion needs of existing occupiers.
• The project is integrated with retail uses and food court.
• ITPC is located close to the MRTS corridor. It is thus easily accessible by train to the downtown locations in central Chennai and the southern suburbs – an advantage enjoyed by few projects on OMR.
• Lack of additional land for expansion beyond Zenith.
Opportunities Threats
• It enjoys proximity to residential catchment areas of Adayar and Velacheri. OMR is also witnessing high supply of residential apartments.
• With proposed road connections to GST Road through Velacheri and Pallavaram, the location will have speedy access to airport.
• Tenant Mix: With the current tenant mix, the subject property may attract high profile tenants.
• Micro Market Supply: Upcoming real estate supply in the micro-market.
• Competition: Might face competition from other IT SEZ’s in the city offering lower lease rentals
174

F HYDERABAD COMMERCIAL MARKET OVERVIEW1 Micro-Market Description Hyderabad, the capital city of the State of Andhra Pradesh, is an established IT/ITeS, Pharmaceutical and Biotech destination. It is the economic and financial capital of Andhra Pradesh. The city of Hyderabad is spread over five districts viz. Hyderabad, Ranga Reddy, Medak, Nalgonda and Mahboobnagar. The Hyderabad Metropolitan area (under the jurisdiction of HMDA24) comprises of nearly 6300 sq km and is proposed to be extended to 7100 sq km. Industrial activity in Hyderabad is quite broad based with sectors like IT, bio-technology, apparel parks, pharmaceuticals, construction etc. having presence in the city. IT and pharmaceutical & biotechnology industry are the dominant players and are expected to play an increasing role even in future. Hyderabad as an office destination presents a number of advantages: • RelativelylowcostoflivingascomparedtootherIndianmetros; • Relativelybetterqualityoflife;and • Rapidpaceofinfrastructuredevelopment.
Hyderabad is well connected to various parts of the country through a good network of road, rail and airport. Various initiatives undertaken by the Government to enhance the infrastructure in Hyderabad are as follows:
The growth in Hyderabad city’s economic base (primarily establishment of IT/ITeS industry) has altered the real estate dynamics in the city. There has been development of all segments of real estate (office space, residential, retail and hospitality) in the city. The entry of leading national and international developers into the city has accelerated real estate development.
The city houses many of the Fortune 500 Corporations, majority of them related to the IT industry – Microsoft (the largest R&D campus outside the US) Computer Associates, Amazon, GE, IBM, AMD, Accenture, Google, Motorola, Deloitte, Yahoo, Dell, QUALCOMM, Verizon, Convergys, Hewlett-Packard and the likes. Besides international giants, Indian companiesalsohaveastrongpresencehere.Infosys,Wipro,CognizantTechnologies,TCS,ICICI,Polarisandmorehave setuptheirdevelopmentcentresinthecity.HyderabadisalsohometoseveralfinancialservicescompanieslikeWells Fargo, GE, Deloitte, UBS (now Cognizant). The establishment of these industries has triggered the growth of the commercial office market in Hyderabad.
Based on areas of commercial developments, Hyderabad can be divided into the following established commercial micro markets.
Initiatives for Development Present Status Impact
Outer Ring Road (ORR)• Phase I - INR 1610 million (35.2 million USD) project of 22 km stretching from Gachibowli to Shamshabad
• Phase II - to be carried out in two sub-phases of A and B
a. Phase II-A from Shamshabad to Hayathnagar would be covering a distance of 62.3 km &
b. Phase II-B - the remaining distance of 77.7 km is of phase II-B from Hayathnagar to Gachibowli.
Phase I - Already Operational from November 2008
Phase II- Under construction (Expected to be ready 2012)
Expected to relieve congestion in the city area, facilitate development of satellite townships, and provide linkage to the proposed Multi Modal Transport system (“MMTS”), Mass Rapid Transport System (“MRTS”) and bus networks through radial roads.
Metro Rail Transit System The project is proposed to cover a distance of approximately 71 km
Work on this has commenced recently
Expected to improve the connectivity of various micro markets across the city.
Elevated expressway12 km stretch from Shamshabad (International airport) to Mehdipatnam.
Operational Better connectivity to airport from the city.
24 Hyderabad Metropolitan Development Authority.
175

APPENDIX - INDEPENDENTMARKET RESEARCH REPORTByCushman&WakefieldIndia
F HYDERABAD COMMERCIAL MARKET OVERVIEW (continued)1 Micro-Market Description (continued)
Thereareprimarilyfivecommercialclustersinthecity.WiththeexceptionofsuburbanareasofMadhapurand Gachibowli, all clusters have a mix of commercial and retail developments. A detailed profi le of the commercial corridors of Hyderabad is listed in the table below:
Cluster Locations Nature
Central Business District (CBD)
Banjara Hills Road no. 1, 2, 10 ,12
Located in the heart of the city, this commercial micro market comprises largely corporate offices of infrastructure/ construction, real estate, IT & fi nancial companies. It is the prime commercial micro market of the city. Most of the developments are a mix of commercial and retail developments. Prominent companies that have presence in this micro market are Broadridge, D E Shaw, Karvy, HSBC (Hongkong and Shanghai Corporation Limited), IVR Prime, Aparna Constructions, Applabs, Uninor.
176

F HYDERABAD COMMERCIAL MARKET OVERVIEW (continued)1 Micro-Market Description (continued)
The suburban micro-market is located in the north western quadrant of Hyderabad city. This micro-market is the IT/ITeS hub of Hyderabad housing leading IT/ITeS and financial services companies. It is well connected to major parts of the city through road and rail network and enjoys good physical infrastructure. The commercial developments in Madhapur being recent, comprise of large scale Grade A commercial developments. Companies like Tata Consultancy Services, Google,Accenture,Cognizant,Deloitte,WellsFargoetchavepresenceinthismicromarket.SomeoftheprominentIT parks in the micro market are The V and K Raheja IT Park (Mindspace). Among all the commercial micro markets in the city, this micro market is currently witnessing considerable activity.
2 Supply, Absorption and Vacancy trends Thestockofcommercialofficespacetill2010inHyderabadwasapproximately31.74millionsq.ft.withthesuburban areasconstitutingapproximately70%ofthetotalstockfollowedbyOffCBDat14%,CBD(CentralBusinessDistrict)at 8%andPrimeSuburbanandPeripheralat4%each.SEZstockwhichaccountsforabout20%ofthetotalcitystockis located in the Suburban and Peripheral commercial markets.
TheCityhaswitnessedfreshsupplyofapproximately3-4millionsq.ft.everyyearfrom2006till2008.Intheyear2009, thetotalfreshcommercialsupplyinthecitywashighestatapproximately5.4millionsq.ft.duetosomelarge officebuildingsbecomingoperationallikeTSIWaveRock(approximately0.7millionsq.ft.),DLFCyberCityBlockno. 3 (approximately 0.85 million sq. ft.) and Raheja Mindspace Building no. 9 (approximately 1.0 million sq. ft.). 2010 closed at 2.77 million sq. ft. of fresh supply. It is estimated that approximately 3.9 million sq. ft. of commercial office space isexpectedtocomeupinyear2011withSEZspaceaccountingforabout29%.SuburbanmicromarketsofMadhapur& Gachibowliremainedasthemostactiveregionandaccountedforapproximately80%ofthefreshsupplyinyear2010.
Averageabsorptioninthecityhasalsobeenapproximately3-4millionsq.ft.peryeartillyear2009.2008witnessed leastabsorptionofapproximately1.8millionsq.ft.duetoeconomicslowdown.Withtheeconomicandcommercial markets recovering in year 2010, various companies firmed up their expansion and consolidation plans resulting in year 2010 closing at a record high of 5.27 million sq. ft. of absorption with suburban micro market accounting approximately 92%ofthetotalabsorption.SEZabsorptionhasaccountedforabout25%-27%ofthetotalabsorptioninthecitywith 2010beinganexception.In2010,SEZabsorptionhasbeenat38%.
Vacancyrateswhichwerehoveringintherangeof5%during2005-2007increasedto9-14%during2008andfurther toabout29%inQ42009.Duetoimprovedabsorption,year2010closedatcommercialofficevacancyofabout14%. Thevacancyinthesuburbanmarketdroppedtoapproximately8%inyear2010.
Cluster Locations Nature
Off CBD areas Begumpet, Somajiguda, Rajbhavan road , S P Road
Located on the eastern and southern periphery of the CBD, this micro market has regional/sales/marketing offices of companies of various industries. The developments in this micro market are a mix of commercial and retail developments. Prominent companies in this micro market are Nokia Siemens, YES Bank, Aurobindo Pharma, Sonata, Bharti AXA life insurance, Aircel, Airtel.
Prime Suburban areas Rest of Banjara Hills, Jubliee Hills
Located on the northern and western periphery of the CBD, this micro market has companies in IT, Consulting & Advisory. Most of the developments in this micro market are a mix of commercial and retail developments. Companies that have presence here are Madhucon, Halcrow, Monster, Seaways Shipping, Prajay Construction.
Suburban areas Madhapur, Gachibowli Located in the western quadrant of the city and approximately 5-7 km north-west of the CBD of Hyderabad, this micro market largely houses offices of IT/ITeS and financial services companies. The developments mostly comprise large scale Grade A commercial developments. Companies like Infosys, TCS, IBM, Accenture, Oracle, Deloitte, Wells Fargo have presence in this micro market.
Peripheral areas Pocharam, Shamshabad
Located in periphery of the city this micro market currently has only few developments. Existing and upcoming commercial developments are mostly IT/ITeS focused. There is yet to be significant leasing momentum.
177

APPENDIX - INDEPENDENTMARKET RESEARCH REPORTByCushman&WakefieldIndia
F HYDERABAD COMMERCIAL MARKET OVERVIEW (continued)2 Supply, Absorption and Vacancy trends (continued) Leaserentalswitnessedanupwardtrendfromyear2006to2008(8-37%acrossvariousmicromarkets)duetolimited supplyofofficespace.In2009,duetoeconomicslowdowntherentalscorrectedbyapproximately15%-21%across various commercial corridors. 2010 witnessed increase in absorption due to revival of the economic and commercial markets coupled with prevailing low rentals. During 2010, as the vacancy rates dipped, downward correction of the rentals was arrested and the rentals more or less witnessed stabilization.
City - Supply, Absorption, Rent Trend
3 Supply, Absorption trends for Office space in Suburban Market
5 –
4–
3 –
2 –
1 –
0 –
5 –
4–
3 –
2 –
1 –
0 –
2001 2010
2010
2009
2009
2008
2008
2007
2007
2006
2006
2005
2005
2004
2004
2003
2003
2002
2002
Ren
tals
in IN
R/s
q ft
/mo
nth
Ren
tals
in IN
R/s
q ft
/mo
nth
Are
a (m
illio
n sq
. ft.
)A
rea
(mill
ion
sq. f
t.)
– 70
– 60
– 50
–40
– 30
– 20
– 10
– 0
–45
–40
– 35
– 30
– 25
– 20
– 15
– 10
– 5
– 0
Supply Absorption CBD Rentals
Supply Absorption Suburban Rentals
Source:CushmanandWakefieldResearch
Source:CushmanandWakefieldResearch
178

F HYDERABAD COMMERCIAL MARKET OVERVIEW (continued)3 Supply, Absorption trends for Office space in Suburban Market (continued) As at the end of 2010, the total commercial office stock in suburban micro market was estimated at approximately 22 million sq. ft. Some of the prominent existing commercial office developments in Madhapur / Gachibowli micro market are listed as under:
The total potential supply in the micro market is estimated to be in the range of 15-16 million sq. ft. in the next few years of which approximately 3.9 million sq. ft. is expected to come up in year 2011. Most of the supply is expected to come up from2012onwards.Bytheendof2010,thevacancyinthemicromarketwasapproximately8%.Theprevailingquoted warm shell in Madhapur/ Gachibowli was INR 37-38/sq. ft. / month.
G THE V: PROPERTY ANALYSIS1 Introduction Themicro-marketofMadhapurislocatedintheNorthWestofHyderabadcity.Thismicro-marketisclosetoprominent locations like Gachibowli and Jubilee hills. It is well connected to major parts of the city through road and rail network. Madhapur micro market largely houses offices of IT/ITeS and financial services companies. These developments being recent, comprise large scale Grade A commercial developments. Companies like Infosys, Tata Consultancy Services, IBM,Accenture,UBS,Deloitte,WellsFargohavepresenceinthismicromarket.Amongallthecommercialmicro markets, this micro market is currently witnessing considerable activity. There are several IT parks such as The V and K Raheja IT Park (Mindspace). Inorbit mall, which is one of the biggest malls in south India is located in the micro-market. The micro-market also has several large scale residential projects like My Home Navadweepa and Fortune Towers.
2 Profile of The V, Hyderabad
Prominent Developments Area sft
Raheja Mindspace (SEZ & non SEZ) 6,200,000
Ascendas V 1,200,000
CyberPearl 430,000
Cyber Tower 580,000
Lakshmi Cyber City 575,000
Divyasree Omega 900,000
L&T Hitec - II (SEZ) 910,000
Ananth Infopark 420,000
DLF SEZ 2,600,000
Q-City 800,000
TSI Waverock 700,000
Divyasree Orion 480,000
Lanco Hills 388,000
Overview
Date of Operation Mariner (2000)Auriga (2002)Orion (2004)Capella (2005)Vega (2008)
Configuration
Total Project Area (Land) 19.4 acres
Development Mix Commercial Office
Built up Area 1.28 million sq. ft.
No. of Floors Mariner (4 floors)Auriga (7 floors)Orion (8 floors)Capella (8 floors)Vega (14 floors)
179

APPENDIX - INDEPENDENTMARKET RESEARCH REPORTByCushman&WakefieldIndia
G THE V: PROPERTY ANALYSIS (continued)2 Profile of The V, Hyderabad (continued)
3 Location & accessibility The property is located in HITEC (Hyderabad Information Technology Engineering Consultancy) city, Madhapur, Hyderabad. It is located approximately 1 km from Cyber Towers and is adjacent to the Inorbit mall at Madhapur. The surrounding real estate are commercial developments like Mindspace IT Park, I labs and Infotech campuses. The IT Park is spread over an area of approximately 19 acres with a total area of approximately 1.28 million sq. ft. spread over five commercial office buildings/ blocks (Mariner, Auriga, Orion, Capella & Vega). The IT park (property) has been developed in phases over 8 years with Vega being the latest (operational from 2008). The property is located adjacent to the Inorbit Mall.
The subject property is well connected to major locations in the city via road networks. The distance of the subject site from major locations is as follows:
• Approximately3-4kmfromtheOuterringroadatGachibowli • Approximately25-27kmfromtheInternationalairportthroughORR(OuterRingRoad) • Approximately12-13kmfromBegumpetmicromarket(erstwhileCBD)
Location
Address Software units layout, Madhapur
Proximity to CBD Approximately 11 km from CBD
Proximity to Airport Approximately 25 km from International airport
Proximity to Railway Station Approximately 3-4 km from HITEC city railway station
No. of approach roads 3 (from Durgam cheruvu, from Gachibowli and from Cyber Towers)
Surrounding areas Kondapur, Gachibowli and Jubilee hills
Availability of public transport Buses and Auto rickshaws
Infrastructure
Power Supply & Back up There is 100% back up for all the facilities in the IT park
Fire Protection System The facility includes fire alarm, sprinklers and 24 hour security
Parking There are 2466 parking slots for 4 wheelers & 2 wheelers
Amenities
Convenience stores, gyms, recreation areas form major amenities in the IT park
Source: Ascendas Property Fund Trustee Pte. Ltd.
180

G THE V: PROPERTY ANALYSIS (continued)3 Location & accessibility (continued)
4 Tenant mix The tenants in The V are major IT and BPO fi rms along with some fi nance companies. Some of the major companies in The V are Cognizant Technologies, JDA Software, EA Games, etc.
5 Development performance The IT Park is spread over 19 acres with a total area of approximately 1.28 million sq. ft spread over fi ve commercial offi ce buildings/ blocks (Mariner, Auriga, Orion, Capella & Vega). Apart from the offi ce spaces these buildings also have cafeterias,conveniencestores,gyms,auditorium,recreationareas,100%powerback-up,highefficiencyoffices,food courts and high-tech management systems which provide a unique experience and compared to other IT parks in the vicinity.
6 Competition analysis Some of the large scale commercial developments (SEZ and non SEZ) in the suburban region of Madhapur & Gachibowli are Mind Space IT Park, L&T (Larsen & Toubro) HITEC city, Cyber Towers, Cyber Gateway, RMZ Futura and I Labs. The vacancies & expansions in the existing commercial developments coupled with upcoming supply in and around the micro market like Divyasree Orion, Divyasree Omega, K Raheja Corporation (KRC) Mindspace (Building # 20), Meenakshi Techpark etc. are expected to be competition for The V. The following table shows the details of major upcoming commercial space in the suburban micro market till 2012:
Mind space IT park, Madhapur 1 million sq. ft. in Building # 20 by 2011
Divyasree Orion 0.6 million sq. ft. in 2011
Divyasree Omega 0.4 million sq. ft. by 2012
TSI Waverock 1.7 million sq. ft. by 2012
Meenakshi Techpark 0.7 million sq. ft. by 2011
Source:CushmanandWakefieldResearch
181

APPENDIX - INDEPENDENTMARKET RESEARCH REPORTByCushman&WakefieldIndia
G THE V: PROPERTY ANALYSIS (continued)7 SWOT analysis
Strength Weakness
• Location: Well located in the commercial and business hub of Hyderabad i.e. HITEC City, Madhapur and Gachibowli.
• Accessibility: It is on the road connecting HITEC city and Durgam Cheruvu, which is a prime commercial road. It is also easily accessible and close to old Mumbai highway and expressway. The property is also close to the new road (under construction) connecting HITEC City & Gachibowli, which shall further enhance the accessibility of the property.
• Good tenant profile: The tenant profile of the subject property is considered good as they comprise of leading IT/ITeS companies.
• Contracted Lease Rent: The contracted leases in the subject properties have been contracted at higher rates than the prevailing market rents in the region.
• Lack of land for further expansion.
Opportunities Threats
• The improving profile of Madhapur and its surrounding areas as a world class commercial destination.
• Improving infrastructure profile of the locality.
• Well Maintained: despite few of the blocks being more than 5 years old, the property has been well maintained which would increase the attractiveness of the property compared to the similar ones in the vicinity.
• Upcoming supply in this micro market is likely to pose a threat on the market rentals.
182

H CYBERPEARL: PROPERTY ANALYSIS1 Profile of CyberPearl, Hyderabad
2 Location & accessibility The property is located in HITEC city, Madhapur, Hyderabad. It is located at a distance of less than ½ km from Cyber Towers and is next to Cyber Gateway. The surrounding real estate are primarily commercial developments like TCS Deccan Park, Cyber Gateway and Infotech campuses. The IT park is spread over a land area of approximately 6 acres withaleasableareaofapproximately0.43millionsq.ft.Apartfromtheofficespacesthesebuildingsalsohave cafeterias, gyms and recreation areas. CyberPearl has two buildings.
The subject project is well connected to major locations in the city. The distance of the subject site from major locations is as follows:
• Approximately3-4kmfromtheOuterRingRoadatGachibowli; • Approximately25-27kmfromtheInternationalairportthroughORR(outerringroad); • Approximately12-13kmfromBegumpetmicromarket(erstwhileCBD).
Overview
Date of Operation Phase I (2004)Phase II (2006)
Configuration
Total Project Area 6.05 acres
Development Mix Commercial
Built up Area 0.43 million sq. ft.
No. of Floors Block 1 – Stilt +7 floors, Block 2 – 7 floors
Location
Address Software units layout, Madhapur
Proximity to CBD Approximately 11 km from CBD
Proximity to Airport Approximately 25 km from International airport
Proximity to Railway Station Approximately 3-4 km from HITEC city railway station
No. of approach roads 3 (from Durgam cheruvu, from Gachibowli and from Cyber Towers)
Surrounding areas Kondapur, Gachibowli and Jubilee hills
Availability of public transport Buses and Auto rickshaws
Infrastructure
Power Supply & Back up There is 100% back up for all the facilities in the IT park
Fire Protection System The facility includes fire alarm, sprinklers and 24 hour security
Parking There are 850 parking slots for 4 wheelers & 2 wheelers
Amenities
Convenience stores, gyms, recreation areas form major amenities in the building
Source: Ascendas Property Fund Trustee Pte. Ltd.
183

APPENDIX - INDEPENDENTMARKET RESEARCH REPORTByCushman&WakefieldIndia
H CYBERPEARL: PROPERTY ANALYSIS (continued)2 Location & accessibility (continued)
3 Tenant mix The tenants in CyberPearl are major IT and BPO fi rms along with some fi nance companies. Some of the major companies in CyberPearl are GE India, Xilinx India Technology Services and Powerwave Technologies R&D.
4 Development performance TheITParkisspreadoveranareaofapproximately6acreswithaleasableareaofapproximately0.43millionsq.ft. The CyberPearl block is located in two separate wings (buildings). Apart from the offi ce spaces these buildings also havecafeterias,gyms,recreationareas,100%powerback-up,highefficiencyoffices,foodcourtsandhigh-tech management systems which provide a unique experience and compared to other IT parks in the vicinity.
184

H CYBERPEARL: PROPERTY ANALYSIS (continued)5 Competition analysis Some of the large scale commercial developments (SEZ and non SEZ) in the suburban region of Madhapur & Gachibowli are Mind Space IT Park, L&T (Larsen & Toubro) HITEC city, Cyber Towers, Cyber Gateway, RMZ Futura and I Labs. The vacancies & expansions in the existing commercial developments coupled with upcoming supply in and around the micro market like Divyasree Orion, Divyasree Omega, K Raheja Corporation (KRC) Mindspace (Building # 20), Meenakshi Techpark etc. are expected to be competition for the property. The following table shows the details of major upcoming commercial space in the suburban micro market till 2012:
6 SWOT analysis
7 Outlook The Hyderabad commercial office market posted a strong increase in demand in 2010 with increased leasing activity being witnessed in terms of entry of new players such as JP Morgan Chase and Facebook and the expansion of existing tenants including TCS, Accenture, Google and Cognizant in the city. Though the prevailing rentals in various commercial markets in the city have shown significant increase from last year (2010), considerable supply of commercial office space (mostly in suburban micro market) is expected to be infused by 2012 resulting in slight correction or stabilization of rentals.
Mind space IT park, Madhapur 1 million sq. ft. in Building # 20 by 2011
Divyasree Orion 0.6 million sq. ft. in 2011
Divyasree Omega 0.4 million sq. ft. by 2012
TSI Waverock 1.7 million sq. ft. by 2012
Meenakshi Techpark 0.7 million sq. ft. by 2011
Source:CushmanandWakefieldResearch
Strength Weakness
• Location: Well located in the commercial and business hub of Hyderabad i.e. HITEC City, Madhapur and Gachibowli.
• Accessibility: It is on the road connecting HITEC city and Durgam Cheruvu, which is a prime commercial road. It is also easily accessible and close to old Mumbai highway and expressway. The property is also close to the new road (under construction) connecting HITEC City & Gachibowli, which shall further enhance the accessibility of the property.
• Good tenant profile: The tenant profile of the subject property is considered good as they comprise of leading IT/ITeS companies.
• Lack of land for further expansion.
Opportunities Threats
• The improving profile of Madhapur and its surrounding areas as a world class commercial, institutional destination.
• Improving infrastructure profile of the locality and its vicinity (Gachibowli).
• Upcoming supply in this micro market is likely to pose a threat on the market rentals.
185

APPENDIX - INDEPENDENTMARKET RESEARCH REPORTByCushman&WakefieldIndia
I CAVEATS & LIMITATIONS 1. The Market Research Report (hereafter referred to as “Report”) will not be based on comprehensive market research oftheoverallmarketforallpossiblesituations.Cushman&WakefieldIndia(hereafterreferredtoas“C&WI”)will coverspecificmarketsandsituations,whichwillbehighlightedintheReport.C&WIwillnotbecarryingout comprehensive field research based analysis of the market and the industry given the limited nature of the scope of theassignment.Inthisconnection,C&WIwillrelysolelyontheinformationsuppliedtoC&WIandupdateitby reworking the crucial assumptions underlying such information as well as incorporating published or otherwise available information. 2. Inconductingthisassignment,C&WIhascarriedoutanalysisandassessmentsofthemarket(s)underconsideration andthedemand-supplyforthecommercial/retail/hospitality/residentialsectoringeneral.C&WIhasalsoobtained other available information and documents that were additionally considered relevant for carrying out the exercise. The opinions expressed in the Report will be subject to the limitations expressed below. a. C&WIisnotaregisteredvaluerofproperties.Intheabsenceofmandatorystatutoryvaluationstandardsunder theIndianlawsforevaluatingaproperty,C&WIhasadoptedvaluationmethodbasedonitsownexpertiseand knowledge and has endeavored to develop forecasts on demand, supply and pricing on assumptions that were considered relevant and reasonable at that point of time. All of these forecasts are in the nature of likely or possible events/occurrences and the Report does not constitute a recommendation to Ascendas Property Fund Trustee Pte Ltd (hereafter referred to as the “Client”) or its affiliates and subsidiaries or its customers or any other party to adopt a particular course of action. The use of the Report at a later date may invalidate the assumptions and bases on which forecasts have been generated and is not recommended as an input to a financial decision. b. ItshouldbenotedthatC&WI’svalueassessmentswillbebaseduponthefactsandevidenceavailableatthedate of assessment. It is therefore recommended that the value assessments be periodically reviewed. c. Changes in socio-economic and political conditions could result in a substantially different situation than those presentedatthestatedeffectivedate.C&WIassumesnoresponsibilityforchangesinsuchexternalconditions. d. Intheabsenceofadetailedfieldsurveyofthemarketandindustry(asandwhereapplicable),C&WIwillrely upon secondary sources of information for a macro-level analysis. Hence, no direct link is sought to be established between the macro-level understandings on the market with the assumptions estimated for the analysis. e. The services provided will be limited to assessment and will not constitute an audit, a due diligence, tax related servicesoranindependentvalidationoftheprojections.Accordingly,C&WIwillnotexpressanyopiniononthe financial information of the business of any party, including the Client and its affiliates and subsidiaries. The Report will be prepared solely for the purpose stated, and should not be used for any other purpose. f. WhiletheinformationincludedintheReportwillbebelievedtobeaccurateandreliable,norepresentationsor warranties,expressedorimplied,astotheaccuracyorcompletenessofsuchinformationisbeingmade.C&WI will not undertake any obligation to update, correct or supplement any information contained in the Report.
186

I CAVEATS & LIMITATIONS (continued) g. InthepreparationoftheReport,C&WIwillrelyonthefollowinginformation: i. Information provided to us by the Client and its affiliates and subsidiaries and third parties; ii. Recent data on the industry segments and market projections; iii. OtherrelevantinformationprovidedtousbytheClientanditsaffiliatesandsubsidiariesatC&WI’srequest; iv. OtherrelevantinformationavailabletoC&WI;and v. Other publicly available information and reports.
3. The Report will reflect matters as they currently exist. Changes may materially affect the information contained in the Report.
4. Allassumptionsmadeinordertodeterminetheopinionofvalueoftheidentifiedproperty(ies)willbebasedon informationoropinionsascurrent.Inthecourseoftheanalysis,C&WIwouldberelyingoninformationoropinions, both written and verbal, as current obtained from the Clients as well as from third parties provided with, including limited information on the market, financial and operating data, which would be accepted as accurate in bona-fide belief. No responsibility is assumed for technical information furnished by the third party organisations and this is bona-fidely believed to be reliable.
5. No investigation of the title of the assets will be made and owners’ claims to the assets will be assumed to be valid. No consideration will be given to liens or encumbrances, which may be against the assets. Therefore, no responsibility is assumed for matters of a legal nature.
6. C&WI’stotalaggregateliabilitytotheClientincludingthatofanythirdpartyclaims,incontract,tortincluding negligence or breach of statutory duty, misrepresentation, restitution or otherwise, arising in connection with the performance or contemplated performance of the services shall be limited to an aggregate sum not exceeding three timesthetotalfeespaidforeachinstructionsaccepted.C&WIshallnotbeliableforanypureeconomicloss,loss of profit, loss of business, depletion of goodwill, in each case whether direct or indirect or consequential or any claims for consequential loss compensation whatsoever which, arise out of or in connection with services provided under this engagement.
7. C&WIendeavorstoprovideservicestothebestofabilityandinbona-fidegoodfaith.Thereportissuedshallbeonly fortheusebytheClientandtheAuthorisedParties.IntheeventthatitisprovenbyC&WIbeyondreasonable doubt that the Client has provided a copy of the Report to any person or entity other than any of the Authorised Parties and in violation by the Client of its obligations pursuant to this agreement, the Client shall indemnify and holdC&WIharmlessfromandagainstalldamages,expenses,claimsandcosts,includingreasonableattorneyfees butnotincludingindirectorconsequentialdamages,incurredbyC&WIininvestigatinganddefendinganyclaim madebyaparty(notbeinganyoftheauthorisedparties)againstC&WIforsuchparty’srelianceonthereport provided that any liability incurred by the Client hereunder shall not at any time exceed an amount equivalent to three timesthetotalfeespayabletoC&WIbytheClientpursuanttotheengagementletter.TheClientandC&WIeach disclaims any and all of its respective liability to any other party other than to each other and as provided in the engagement letter.
8. The Client including its agents, affiliates and employees, must not use, reproduce or divulge to any third party any informationitreceivesfromC&WIforanypurposeandshouldtakeallreasonableprecautionstoprotectsuch information from any sort of disclosure. The information or data, whether oral or in written form (including any negotiations,discussion,informationordata)forwardedbyC&WItotheClientmaycompriseconfidentialinformation and the Client undertakes to keep such information strictly confidential at all times.
9. IntheeventofanypartywantstodiscloseanyinformationitshalltakepriorwrittenconsentofC&WIandshallmake onlysuchdisclosuresasallowedbyC&WI.However,thenon-disclosureconditionshallnotapplytoanyinformation that is already in the public domain or required by any court of law or authorities under any law. In such an event the disclosing party shall intimate the other party before making such disclosure.
10. This engagement shall be governed by and construed in accordance with Indian laws and any dispute arising out of or in connection with the engagement, including the interpretation thereof, shall be submitted to the exclusive jurisdiction of courts in Bangalore.
187