regionalupload.xinhua08.com/2012/0914/1347608942329.pdfsee appendix i for important disclosures and...
TRANSCRIPT
SEE APPENDIX I FOR IMPORTANT DISCLOSURES AND ANALYST CERTIFICATIONS
14 September 2012
Regional Daily
Top Views BREAKING NEWS PK. Basu Fed Launches Open-Ended QE3 - The US FOMC announced an open-ended commitment to QE3, pledging
to purchase MBS (mortgage-backed securities) in sufficient quantities (US$40b monthly to begin with) until unemployment declines enough ("in the context of price stability"). It also extended its conditional commitment to keep the Fed Funds rate near zero until mid-2015.
- The Fed has done all that the market asked for (and far more than we expected), with its open-ended QE even extending its commitment to "a highly accommodative stance" for monetary policy until "a considerable time after the economic recovery strengthens". This is an attempt to demonstrate that the Fed's reaction function has changed decisively (addressing the issue raised by the monetary economist Michael Woodford at Jackson Hole). Unlike Japan, the US has forestalled deflation throughout this crisis, and US banks have increased their net lending steadily for the past year (since August 2011). So there is less need for action (than in Japan, for instance, in 1997-98) but the FOMC remains very aggressive in its monetary easing.
- Central banks in Indonesia, the Philippines and Korea left rates unchanged yesterday. This is appropriate given that markets are likely to move back into "risk-on" mode, with substantial liquidity likely to flow to Asia. We have noted that Asia’s foreign reserves were stagnant in the past year, so Asia does have room to accommodate some liquidity inflow. However, inflation concerns (especially for commodity prices) are likely to remain paramount with Asian central banks. The PBOC has room to act (with China’s CPI inflation at 2% YoY and PPI down 3.5% YoY), and we expect a cut in China's RRR or policy rate this upcoming weekend.
REGIONAL STRATEGY Tham Mun Hon Another Bernanke Put - The new unlimited MBS buying will support further risk-on trade in the
coming week. A quick run-through of where Asia may benefit: retailers and manufacturers selling to the US, transport names, auto makers selling to the US, energy and commodities (with a lag given the high inventory still being piled up in China), ship builders and property names, especially in HK and Singapore on prospects of further global liquidity inflows.
TP UPGRADE McapUSD1.0b ADTV USD1.5m PH: First Philippine Holdings Corp (FPH PM) Laura Dy-Liacco P3 Conglomerates | Bottom Up | BUY | Upside 36.3% - We believe First Philippine Holdings Corp (FPH) remains the best bargain
among the Lopez-owned stocks given its cheap valuation, reasonable dividend yield and healthy financial position.
- FPH offers the highest potential return to our price target, which we have revised up by 6% to PHP103/sh from PHP97/sh. The potential upside, inclusive of a 2.6% dividend yield, is 36.3%,
- While FPH has historically traded below its book value, we believe the magnitude of this discount, currently at 42%, is undeserved for a firm that derives close to 90% of its value from FGEN and Manila Electric Co (MER). If we reckon FPH’s NAV based simply on the share prices of these units, this would amount to PHP115/sh, 49% higher than its current price.
P K Basu [email protected] (65) 6432 1821 ONG Seng Yeow [email protected] (852) 2268 0644 Jeremy TAN [email protected] (852) 2268 0635
Today’s Content… Country US QE 3 Philippines First Philippine Holdings Corp Thailand Rojana Industrial Estate India PTC India Singapore Cosco Corp Malaysia SP Setia
Top Buys…
Company Ticker Spot Target Upside (%)
LICHF LICHF IN 245.25 332.00 35.37 B. Armada BAB MK 3.72 4.88 31.18 Yes Bank YES IN 338.55 434.00 28.19 First Philippine Holdings FPH PM 77.05 97.80 26.93 Siam Makro MAKRO TB 382.00 478.00 25.13 SembMarine SMM SP 4.99 6.20 24.25 STPI STPI TB 39.00 47.50 21.79 Venture Corp VMS SP 7.94 9.65 21.54 China State Construction 3311 HK 8.96 10.80 20.54 Charoen Pokphand Indo CPIN.IJ 2800.00 3300.00 17.86 KLCC Property KLCC MK 5.46 6.38 16.85 Top Glove TOPG MK 5.14 6.00 16.7
Top Sells… Company Ticker Spot Target Downside(%) Ajisen China 538 HK 5.31 3.21 39.55 Jai Prakash Associates JPA IN 69.05 47.00 31.93 GMA Network Inc GMAP PM 9.58 6.90 27.97 Cosco Corp COS SP 0.99 0.75 23.86
Maybank-KE Events Date Event Location 17-21 Sep Thai Strategy | Analyst Marketing US 17-28 Sep Asia Macro| Regional Head Research &
Economics US
18-19 Sep Philippines Strategy Roadshow SG/MY 20-21 Sep Philippines Strategy Roadshow HK
14 September 2012
Regional Daily
McapUSD356m ADTV USD0.59m Rojana Industrial Estate (ROJNA TB) Pongrat R 4 Industrials| Flooding Unlikely to Hit ROJNA | BUY | Upside 64% - Flood concerns have started to hit ROJNA, down nearly 7% in the past
week. Based on our conversation with the management we conclude that the likelihood of a severe flooding recurring this year is very low.
- Nonetheless ROJNA is better prepared this time with its Bt2.8B floodwall - 77kms in length and 6m in height. Construction is all but complete except the entrance area.
- Regardless, land sales target remain intact with most of the pre-sales coming from ROJNA IEP and ROJNA IER and could exceed 2000 rai – a new high. Land sales next year could exceed 1000 rais, ahead of our forecast 950 rais, leaving good upside to our earnings. Maintain BUY with PT 15.25.
Company Notes EST. DOWNGRADE McapUSD0.3b ADTV USD1.2m IN:PTC India (PTC IN) Ganesh Ram 5 Utilities | Policy Inaction Continues to Hurt | SELL | Downside38% - Policy inaction to reduce PTCIN’s earnings. We remain negative on
PTCIN as the delay in policy reforms to improve coal/ fuel availability to power producers and reduce operating losses of PTCIN’s customers (state-owned power distributors) would lead to reduced trading volume and declining gross margin and earnings.
- PTCIN’s Q1 EPS declined 44% YoY due to 2% decline in volume, 30bp cut in gross margin, and cost of funding increased receivables. With no visibility on gov’t reforms, we do not expect the situation to improve in H2. We cut our FY13F EPS by 15% to Rs4.1 (-14%).
- The cheap P/BV of 0.6x fails to attract investor interest as risk of bad debt may reduce book value. Our new TP of Rs33/sh (-14%) is based on PER of 8x FY13F. Maintain SELL.
McapUSD1.8b ADTV USD4.3m SG: Cosco Corp (COS SP) Yeak Chee Keong 6 Industrials | Not Worth the Premium | SELL | Downside26% - With persistent weak outlook in the shipbuilding sector, Cosco’s rich
valuation relative to peers is simply unjustified. Simply put, why should a yard faced with tough domestic competition in China, faltering shipbuilding orders and weak offshore margins, trade at higher valuations than established Singapore and Korean yards?
- Order cancellations could become more prevalent and this could prompt another round of sector-wide de-rating. Due to its strong PRC government links however, Cosco is unlikely to go bust. But things could get worse before they get better.
- Offshore projects have yet to show profitability and execution is a concern. While we are positive on the offshore sector, Cosco is not ready to ride this wave. At 19.0x/18.4x FY12F/13F PER, Cosco is trading at an unjustified premium. Reiterate Sell with TP of SGD0.73, pegged to 1.3x P/BV.

14 September 2012
Regional Daily
3Q12 REVIEW Mcap USD2.4b ADTV USD0.7m MK: SP Setia (SPSB MK) Wong Wei Sum 7 Property | Decent Sales To Continue | HOLD | Upside 5.8 % - SPSB’s 9M12 results are tracking expectations, accounting for 73-74% of
our and consensus full-year estimates. - 10M12 property sales were MYR3.3b (on track to meet its MYR4b sales
target for FY10/12) whilst unbilled sales remain healthy at MYR3.8b as at July 2012 (1.2x of our property revenue forecast).
- We maintain our earnings forecasts and TP of MYR4.00 (15% discount to MYR4.71 RNAV).
SEE APPENDIX I FOR IMPORTANT DISCLOSURES AND ANALYST CERTIFICATIONS
RegionalMarket Strategy 14 September 2012
The Big Picture Another Bernanke Put
The new unlimited MBS buying program from the Fed will support further
risk-on trade in the coming week. The scale of the monetary injection is
unprecedented as it is open ended till there is a substantial improvement in
the US labour market. From what we have seen over the last 20 years, the
Fed has only lifted the Fed funds rate when the unemployment rate falls to
the 4-5% range. We are now at 8.1%.
There are definitely concerns that the US may be the next Japan; facing
another 2 decades of deflation. But what is different for the US is that they
have ring fenced the bad assets in the banking system very early on in the
crisis and the banks are actually lending as opposed to the zombie banks
Japan had to live with for quite some time. The second point is that the US
has clear targets for the economy in terms of lowering unemployment rate.
The US is now clearly targeting a sustained recovery in the labour and
housing market, both critical for further improvement in retail spending (still
by far the biggest growth driver in the US).
A quick run-through of where Asia may benefit:
- Retailers and manufacturers selling to the US in the likes of Li & Fung,
Techtronic, Johnson Electric.
- Transport names like OOIL, COSCO Pacific, NOL, Cathay Pacific (more
freight exposure than Singapore Airlines), container makers like
Singamas.
- Auto makers selling to the US, mostly Korean names.
- Energy and commodities will only benefit with a lag given the high
inventory still being piled up in China. Ship builders will also benefit with
a lag, given excess capacity in shipping.
- Property names (both developers and investors) in Asia, especially in
HK and Singapore due to the prospects of further global liquidity inflows.
We believe that this risk-on trade can run for a week or so, before
consolidation sets in. The MSCI Asia ex-Japan index is 7.4% below the highs
reached at end-Feb. For a successful breakout, investors would probably
look for more improvement in Europe. Even though the ECB has the MOT in
place and the ESM will be ratified, investors would like to see Spain step
forward and seek assistance; which will bring us one step closer to reaching
a credible solution to Europe’s funding crisis.
As such, we do not think there will be any meaningful sell down in REITs and
dividend yield plays until we get better clarity on the European situation and
the US budget process. At this juncture, investors will only deploy their cash
sitting on the side-lines to buy high beta names.
THAM Mun Hon, CFA [email protected] (852) 2268 0630
SEE APPENDIX I FOR IMPORTANT DISCLOSURES AND ANALYST CERTIFICATIONS
Philippines
Company Update
14 September 2012
First Philippine Holdings Corp Bottom up
Cheaper alternative to EDC and FGEN. We believe First Philippine Holdings Corp (FPH) remains the best bargain among the Lopez-owned stocks given its cheap valuations, reasonable dividend yield and healthy financial position. It offers the highest potential return to our price target, which we have revised up by 6% to PHP103/sh from PHP97/sh. The potential upside, inclusive of a 2.6% dividend yield, is 36%, higher than the estimated return of 22% for Energy Development Corp (EDC – BUY) and 17% for First Gen Corp (FGEN – BUY).
Deep discount to book value undeserved. While our profit forecast is little changed, we raised our NAV estimate on FPH by 6% to PHP128.94/sh, to reflect similar changes to investee companies EDC and FGEN. Our target price, which represents a 34% upside from its current price, is based on a 20% discount to NAV. While FPH has historically traded below its book value, we believe the magnitude of this discount, currently at 43%, is undeserved for a firm that derives close to 90% of its NAV from FGEN and Manila Electric Co (MER). If we reckon FPH’s NAV based simply on the share prices of these units, this would amount to PHP113/sh, 47% higher than its current price.
NAV upgraded on higher price target for listed units. We raised our price target on FGEN by 18% to PHP22/sh to reflect the strong 1H12 results of its operating units. Affiliate EDC and its subsidiary First Gen Hydro Power Corp (which in turn is 40% directly owned by FGEN) posted 1H12 results that exceeded our expectations. This prompted us to raise our NAV estimate on EDC and FG Hydro by a combined 8%. We now have a price target of PHP7.20/sh for EDC from PHP7.10/sh previously. FGEN’s natural gas plants also performed better than expected, allowing us to increase our NAV estimate on these gas plants by 3.6%. For MER, where FPH maintains a 3.9% stake, we have a revised price target of HP268/sh, up from PHP250/sh.
Rockwell Land still valued at book. Rounding out the balance is the net book value of its residual assets and liabilities. We do not have a fair-value estimate yet on Rockwell Land Corp (ROCK) and thus currently based its value on book. ROCK, 86.8% owned by FPH, has a book value of PHP9b as of end-2011 while current market cap is at PHP18b. Valuing FPH simply on the basis of the market value of its holdings in FGEN, MER and ROCK plus its investments in FGEN Perps, and parent net cash, we derive a higher NAV of PHP142.32/sh.
First Philippine Holdings Corp– Summary Earnings Table FYE 31 Dec (PHPm) 2009A 2010A 2011A 2012F 2013F
Revenue 56,997 61,508 69,753 77,998 81,410 EBITDA 6,842 4,890 5,224 5,059 4,404 Recurring Net Profit to Common (250) 321 2,797 5,098 6,027 Recurring Basic EPS to Common
(0.42) 0.54 4.98 9.34 11.04
EPS growth (%) (83.9) (228.0) 816.7 87.7 18.2 DPS (PHP) 1.00 2.00 2.00 2.00 2.00 PER (181.7) 143.4 15.6 8.3 7.0 Div Yield (%) 1.3 2.6 2.6 2.6 2.6 P/BV(x) 1.2 0.7 0.7 0.6 0.5 Net Gearing (%) 88.4 32.1 31.9 21.2 21.8 ROE (%) (0.8) 0.6 4.4 7.6 8.2 ROA (%) (0.1) 0.2 1.7 3.0 3.5 Consensus Net Profit (PHPm) na na na 4,221 5,628
Source: FPH, Maybank ATR Kim Eng Securities, Inc
BUY (Unchanged) Share price: PHP77.05 Target price: PHP103.00 (from PHP97.00) Laura Dy-Liacco [email protected] (632) 849 8840
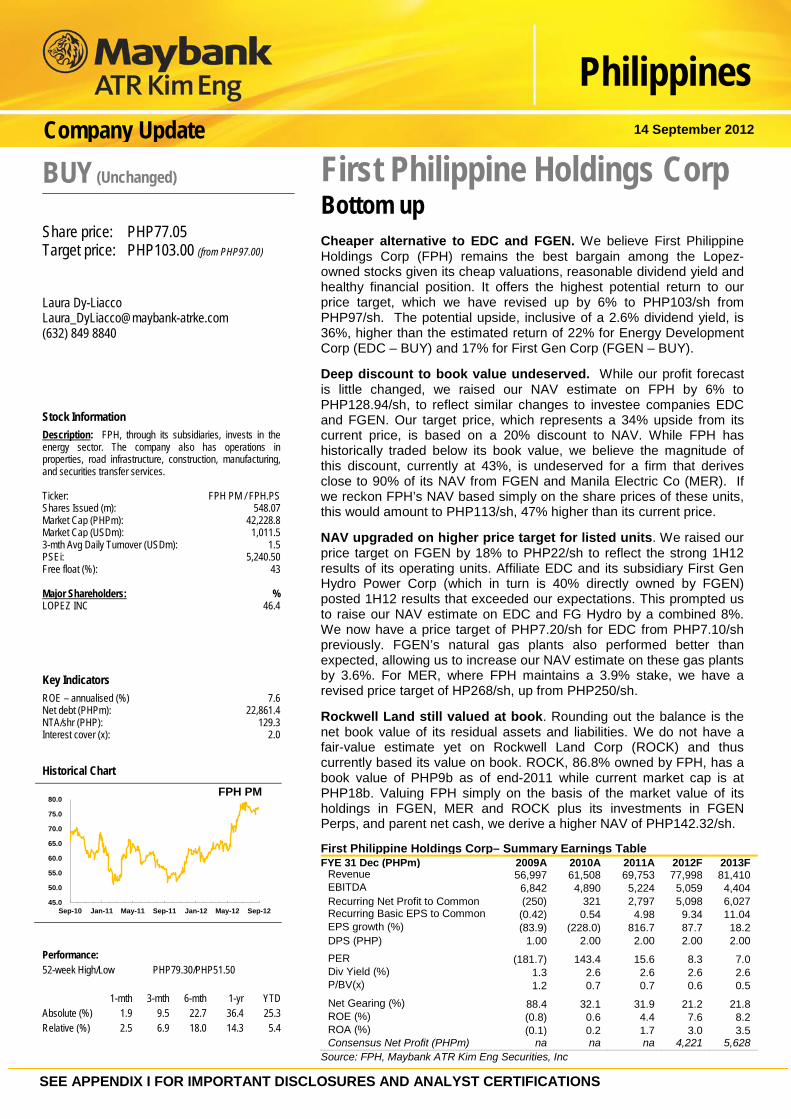
Stock Information Description: FPH, through its subsidiaries, invests in the energy sector. The company also has operations in properties, road infrastructure, construction, manufacturing, and securities transfer services. Ticker: FPH PM / FPH.PS Shares Issued (m): 548.07 Market Cap (PHPm): 42,228.8 Market Cap (USDm): 1,011.5 3-mth Avg Daily Turnover (USDm): 1.5 PSEi: 5,240.50 Free float (%): 43 Major Shareholders: % LOPEZ INC 46.4 Key Indicators ROE – annualised (%) 7.6 Net debt (PHPm): 22,861.4 NTA/shr (PHP): 129.3 Interest cover (x): 2.0
Historical Chart
45.0
50.0
55.0
60.0
65.0
70.0
75.0
80.0
Sep-10 Jan-11 May-11 Sep-11 Jan-12 May-12 Sep-12
FPH PM
Performance: 52-week High/Low PHP79.30/PHP51.50 1-mth 3-mth 6-mth 1-yr YTD Absolute (%) 1.9 9.5 22.7 36.4 25.3 Relative (%) 2.5 6.9 18.0 14.3 5.4
SEE APPENDIX I FOR IMPORTANT DISCLOSURES AND ANALYST CERTIFICATIONS
14 September 2012
Thailand
Rojana Industrial Park (ROJNA) Flooding Unlikely To Hit ROJNA
What’s new? ROJNA’s management has advised that flooding in Ayudhya this year will not be as severe as last year. Several districts in the Ayudhya province are starting to be inundated by floods as the water runs its natural course through the designated runoff areas, but the water levels this year are within historical averages. Implications: Very low probability of severe flooding: The images that we see in the press currently appear to show a flooding situation that is just as bad as last year. However, water levels in the districts of Pak Hai, Bangban, Sena, Bang Pa-In, Bang Sai and Pranakorn Sri Ayutthaya that have been designated as catchment areas are similar to those in an average year, the company advised. In addition, what made the situation worse last year were the five tropical storms that came during the monsoon season: Haima, Nock Ten, Haitang, Nesat and Nalgae. This year, the Meteorological Department of Thailand forecasts only one or two tropical storms will hit Thailand, in late September. The floodwall: Construction of ROJNA’s 77-km flood prevention wall (6m high) will be completed this month; only the entrance remains to be built. In addition, ROJNA has set up a team to monitor the flooding situation. Land sales outlook intact: Management acknowledges that some potential customers may delay their decisions to buy land at ROJNA’s IEA to see how the flooding this year pans out. However, the waitlist for the IEA remains unchanged. The company guides that the majority of pre-sales this year will come from the 2,400-rai ROJNA IEP (previously the Prosperity Industrial Estate Co Ltd), with another 500 rai from ROJNA IER. This totals to pre-sales of at least 2,000 rai, a new high for ROJNA. Our FY13 forecasts are based on land sales of 950 rai – so there is upside to our estimates. Action: Our 12-month price target is THB15.25. Maintain BUY rating. Rojana Industrial Park – Summary Earnings Table
FY ends Dec 31 (Btm) 2010A 2011A 2012F 2013F 2014F Revenue 8,417 6,461 6,857 9,780 10,592 EBITDA 1,958 -226 3,439 3,148 2,874 Recurring income 666 681 223 1,446 1,235 Recurring Basic EPS 0.71 0.61 0.19 1.20 1.02 Reported Net Profit 666 -838 1,773 1,446 1,235 Reported Basic EPS 0.7 (0.8) 1.5 1.2 1.0 EPS Growth (%) (16.5) (205.6) 298.3 (19.1) (15.0) DPS (Bt) 0.7 0.2 0.6 0.8 0.7 PER (x) 15.1 Na 6.4 7.9 9.2 EV/EBITDA (x) 13.2 (114.2) 8.6 9.3 9.9 Div Yield (%) 6.5 3.6 6.5 8.5 7.2 P/BV (x) 1.4 1.0 1.4 1.2 1.2 Net Gearing (%) 63.2 68.4 65.8 61.4 57.6 ROE (%) 9.1 (13.3) 21.9 15.8 12.6 ROA (%) 2.9 (3.2) 6.6 5.3 4.5 Consensus Net Profit
894 1,150 1,175
Closing price: September 12. Source: Institutional Research, MBKET
BUY (Unchanged) Share price: Bt9.30 Target price: Bt15.25 Pongrat Ratanatavanananda [email protected] (662) 658 6300 ext 1398 Stock Information Description: ROJNA is an industrial land developer with one industrial estate in Ayudhya (ROJNA IEA) and two in the Eastern Seaboard, Rayong (ROJNA IER) and one in Prachinburi (ROJNA IEP). The firm has extended to include utilities, power, solar and waste water and diversified into condo in Thailand and China. ROJNA was listed in December 1995. Ticker: ROJNA TB Shares Issued (m): 1,186.6 Market Cap (US$ m): 361.7 3-mth Avg Daily Turnover (US$ m): 0.28 SET Index: 1,257.6 Free float (%): 15.7 Major Shareholders: % Vinichbutr family 31.1 Sumikin Bussan Corporation 21.2 Mazahiro Property Co., Ltd. 8.4 Key Indicators ROE – 2013 (%) 15.8 Net Gearing (%): 61.4 NTA/shr (Bt): 7.6 Interest cover (x): 4.3
Historical Chart
-60
-40
-20
0
20
40
Aug-11 Oct-11 Dec-11 Mar-12 May-12 Jul-12
ROJNA SET Performance: 52-week High/Low Bt5.5/Bt9.8 1-mth 3-mth 1-yr YTD Absolute (%) 6.3 10.7 3.3 67.6 Relative (%) 3.7 1.5 -12.7 36.6 Closing price: September 12
SEE APPENDIX I FOR IMPORTANT DISCLOSURES AND ANALYST CERTIFICATIONS
EST. DOWNGRADE 14 September 2012
India
PTC India (PTCIN) Policy Inaction Continues to Hurt
Policy inaction to reduce PTCIN’s earnings. We remain negative on PTCIN as the delay in policy reforms to improve coal/ fuel availability to power producers and reduce operating losses of PTCIN’s customers (state-owned power distributors) would lead to reduced trading volume and declining gross margin and earnings. PTCIN’s Q1 EPS declined 44% YoY due to 2% decline in volume, 30bp cut in gross margin, and cost of funding increased receivables. With no visibility on gov’t reforms, we do not expect the situation to improve in H2. We cut our FY13F EPS by 15% to Rs4.1 (-14%). The cheap P/BV of 0.6x fails to attract investor interest as risk of bad debt may reduce book value. Our new TP of Rs33/sh (-14%) is based on PER of 8x FY13F. Maintain SELL. FY13F sales volume -5% to 23bn units. Q1 volume declined 2% YoY due to reduced supply. For FY13, we forecast PTCIN’s trading volume to decline due to: 1) delay in new power projects on uncertainty in fuel supply and 2) negligible demand for additional power from distributors due to inability to make payments. Further, PTCIN has stopped supplying to TN from Sept ’11 and reduced supply to UP from Nov ’11 due to its inability to make payments. We do not expect PTCIN to resume supply to the power distributors in TN and UP in H2. FY13F gross margin -16bp to 4% on reduced long term contracts. PTCIN’s long-term contracts are at 7 paise/ unit margin vs. 4paise/ unit for short-term contracts. Restricted supply to the troubled power distributors would reduced long -term contract volume to 18% of total volume vs. 20% in FY12. We do not expect PTCIN’s sales volume from long-term contracts to improve in H2. Receivables would remain high at 1x BV. PTCIN’s receivable days increased to 120 in Mar ’12 from 40 in Mar ‘11. The major delay is from the power distributor in TN (28% of receivables) who increased tariffs by 30% in Apr ‘12. However, the increase would only meet its power purchase cost, leading to uncertainty on settlement of past dues. The delay increases the risk of bad debts as receivables worth Rs13bn are due for more than a year (nearly half of the book value). We do not expect the receivables to reduce in H2 as the power distributors are unable to raise new debt/ equity. Trading at cheap P/BV of 0.6x but expensive PER of 13x FY13F. In addition to risk of bad debts, we believe P/BV would remain cheap due to declining ROE. We forecast ROE to decline to 4.7% in FY13 from 7.1% in FY11.
PTCIN – Summary Earnings Table FY Mar 31 (Rsm) FY10 FY11 FY12 FY13F FY14F Revenue 78,393 91,953 79,514 75,619 75,293 EBITDA 1,014 2,380 2,983 2,721 2,813 Recurring Net Profit 1,234 1,660 1,397 1,205 1,325 Recurring Basic EPS (Rs) 4.2 5.6 4.7 4.1 4.5 EPS growth (%) -4.0 34.3 -15.9 -13.7 10.0 DPS (Rs) 1.2 1.2 1.5 1.7 1.8 PER (x) 12.9 9.6 11.4 13.2 12.0 EV/EBITDA (x) 24.4 10.4 8.3 9.1 8.8 Div Yield (%) 2.2 2.2 2.8 3.1 3.3 P/BV(x) 0.7 0.7 0.6 0.6 0.6 Net Debt/Equity (%) -43.8 -26.4 17.7 24.7 18.3 ROE (%) 5.8 7.1 5.6 4.7 5.0 ROA (%) 3.8 4.1 2.7 2.4 2.7 Source: Company data, Bloomberg, KESI estimates
SELL (Unchanged) Share price: Rs54/sh Target price: Rs33/sh (Downgraded from
Rs38/sh) Ganesh Ram [email protected] (91) 22 66232607
Stock Information Description: Power trading company with 56% market share in India Ticker: PTCIN IN Shares Issued (m): 295.0 Market Cap (US$ bn): 0.3 6-mth Avg Daily Volume (US$m): 1.2 SENSEX: 17,853 Free float (%): 83.7 Major Shareholders: % Gov’t owned power companies 16.3
Key Indicators (FY13F) ROE – annualised (%) 4.7 Net debt (Rs bn): 6.7 NTA (Rs/sh): 87.1 Interest cover (x): 3.6
Historical Chart
-50
-35
-20
-5
10
Sep-11 Jan-12 May -12 Sep-12
(%)
PTCIN SENSEX
Performance: 52-week High/Low Rs76/ 38 1-mth 3-mth 6-mth 1-yr YTD Absolute (%) -10.7 -9.1 -5.2 -24.1 35.8 Relative (%) -12.4 -16.2 -6.7 -32.3 20.8

SEE APPENDIX I FOR IMPORTANT DISCLOSURES AND ANALYST CERTIFICATIONS
Company Update 14 September 2012
Singapore
Co. Reg No: 198700034E MICA (P) : 099/03/2012
Cosco Corp Not Worth the Premium
Rich valuations unjustified, reiterate SELL. With persistent weak outlook in the shipbuilding market, Cosco’s richer valuation relative to peers is simply unjustified. Why should a yard faced with tough domestic competition in China, faltering shipbuilding orders and weak offshore margins, trade at a higher valuation than established Singapore and Korean rig-building yards? We reiterate our SELL call and 1.3x P/BV target price of SGD0.73. Things could get worse before they get better. Order cancellations could become more prevalent. Fellow shipbuilder Yangzijiang already had eight bulk carrier orders cancelled in 2Q12, mainly due to customer funding difficulties. This could prompt another round of sector-wide de-rating. Due to its strong PRC government links however, Cosco is unlikely to go bust. In the long run, it should emerge stronger from the current industry downturn. Recovery seen only from 2014. However, we expect the shipping market to recover only from 2014 if ship supply tightens. One sign would be if the current global orderbook-to-fleet ratio falls further towards the 10% level. Currently, it stands at 17.9%, from a peak of above 50% in 2008. Another sign could be more orders for bigger and fuel-efficient ships, as shipping lines combat high bunker prices and prepare for low-emission requirements. AP Maersk-Moller has led the trend with orders placed for 18,000 TEU fuel-efficient containerships. Offshore orders only help it stay afloat. Orders are not at a complete stop. Cosco recently announced a USD200m harsh environment accommodation semi-sub contract, bringing YTD orders to USD1.55b. However, the majority are offshore orders and Cosco has yet to demonstrate satisfactory profitability on these projects. Nevertheless, they do help to fill yard capacity and support fixed costs, which is the key surviving strategy for many Chinese shipyards currently. Maintain SELL. While we are positive on the offshore sector, Cosco is not ready to ride this wave. We cut FY13F-14F net profits by 6-8% on lower margin assumptions. We reiterate our SELL rating with target price of SGD0.73 based on 1.3x P/BV. At 19.0x/18.4x FY12F/13F PERs, Cosco is trading at an unjustified premium above peers. Cosco Corp – Summary Earnings Table FYE Dec (SGD m) 2010 2011 2012F 2013F 2014F Revenue 3,861.4 4,162.9 4,135.9 3,560.9 3,700.5 EBITDA 598.5 469.1 466.6 447.6 476.0 Recurring Net Profit 248.8 139.4 115.9 119.6 137.9 Recurring Basic EPS (SGD cts) 11.1 6.23 5.18 5.34 6.16 EPS growth (%) 126.1 -44.0 -16.8 3.2 15.3 DPS (SGD cts) 4.0 3.0 2.0 2.0 2.0 PER (x) 8.9 15.8 19.0 18.4 16.0 EV/EBITDA (x) 4.7 5.9 6.0 6.2 5.9 Div Yield (%) 4.1 3.0 2.0 2.0 2.0 P/BV(x) 1.8 1.7 1.6 1.5 1.4 Net Gearing (%) 7.0 29.1 47.3 41.0 34.3 ROE (%) 20.8 10.7 8.4 8.3 9.0 ROA (%) 4.1 2.0 1.7 1.9 2.1 Consensus Net Profit (SGD m) 114.2 110.6 125.5 Source: Company, Maybank KE estimates
SELL (Unchanged) Share price: SGD0.985 Target price: SGD0.73 (unchanged) YEAK Chee Keong, CFA [email protected] (65) 6433 5730 Stock Information Description: Currently the largest shipyard group in China, by dock space. Provides ship repair and shipbuilding services. A relatively new entrant in the offshore segment. Ticker: COS SP Shares Issued (m): 2,239.2 Market Cap (USD m): 1,792.8 3-mth Avg Daily Turnover (USD m): 4.3 ST Index: 3,030.14 Free float (%): 36 Major Shareholders: % China Ocean Shipping Group 53 Key Indicators ROE – annualised (%) 8.9 Net gearing (%): 53 NAV/shr (SGD): 0.56 Interest cover (x): 3.2
Historical Chart
Performance: 52-week High/Low SGD1.315/SGD0.825 1-mth 3-mth 6-mth 1-yr YTD Absolute (%) -1.5 -1.0 -17.4 -2.5 12.6 Relative (%) -0.4 -9.0 -18.5 -12.2 -1.7
SEE APPENDIX I FOR IMPORTANT DISCLOSURES AND ANALYST CERTIFICATIONS
17 October 2011
PP16832/01/2012 (029059)
Results Review 13 September 2012
PP16832/01/2013 (031128)
Page 1 of 2
Malaysia
SP Setia Decent Sales To Continue
Reiterate HOLD. SPSB’s 9M12 results are tracking expectations,
accounting for 73-74% of our and consensus full-year estimates. Whilst
its participation in the GBP8b worth of Battersea Power Station project
in London will be positive for its long-term earnings growth, near-term
upside potentials in share price could be capped due to linger election
uncertainties. We maintain our earnings forecasts and TP of MYR4.00
(15% discount to MYR4.71 RNAV).
A good quarter. SPSB’s 3Q net profit of MYR100m (+10% YoY, +9%
QoQ) took 9M12 core earnings to MYR267m (+26% YoY). On QoQ
basis, the underlying earnings strength was driven by stronger progress
billings and take-ups as well as better pretax margin (+1.5ppt QoQ)
thanks to improvement in property development division (+3ppt QoQ),
offsetting the YoY decline in manufacturing and trading division.
Strong sales recorded. SPSB has locked in MYR3.3b sales in 10M12
or 83% of its MYR4b sales target for FY10/12 (> MYR3.1b property
sales in FY10/11). Key sales contributors include: 1) KL Eco City
residential tower 1 and boutique and strata offices (19% of total sales),
2) Setia Alam (16%) and 3) Fulton Lane (10%). SPSB’s unbilled sales
were at all time high at MYR3.8b as at July’12 (1.2x of our 2013
forecast), providing near-term earnings visibility.
Highly achievable sales target. New launches in Aug 2012 recorded
strong take-ups. Setia Eco Glades at Cyberjaya which was soft-
launched in Aug 2012 (Phase 1: MYR500m in GDV; MYR398psf ASP;
281 units of terraces and semi-D) is 90%-booked within a week whilst
non-bumi lots of 88 Setia (phase 1) in Johor Bahru is fully booked
(condominium; Phase 1 with e.MYR150-200m in GDV; MYR700psf
ASP). These would further lift its YTD property sales to c.MYR3.9b.
Fund raising for future growth. Post-the completion of Battersea
Power Station (BPS) site acquisition, SPSB’s net gearing is expected to
surge to 0.47x, from 0.33x as at July 2012. It has recently proposed an
up to 322.6m new shares placement (MYR1.2b proceeds assuming an
MYR3.59 issue price at 5% discount to current price) to fund its local
and international projects (see Table 2). We estimate the proposed
placement to dilute our 2013-14 EPS by 14-15% and RNAV by 3%.
SP Setia – Summary Earnings Table Source: Maybank KE FYE Oct (MYR m) 2010A 2011A 2012F 2013F 2014F Revenue 1,745.9 2,232.5 2,631.5 3,498.3 4,987.2
EBITDA 263.5 454.4 555.6 719.9 1,031.7
Recurring Net Profit 187.8 294.6 365.4 465.1 672.1
Recurring Basic EPS (cents) 10.7 16.2 19.0 24.2 35.0
EPS growth (%) 24.2 52.1 17.2 27.3 44.5
DPS (cents) 10.0 10.5 11.4 14.5 21.0
PER 35.4 23.3 19.9 15.6 10.8
EV/EBITDA (x) 9.9 16.8 29.5 24.1 14.0
Div Yield (%) 2.6 2.8 3.0 3.8 5.6
P/BV(x) 3.0 2.0 2.0 1.9 1.8
Net Gearing (%) 26.5 (2.7) 9.4 23.5 20.6
ROE (%) 11.5 9.5 10.2 12.3 16.6
ROA (%) 5.7 5.9 6.7 8.0 10.5
Consensus Net Profit (MYR m) - - 362.0 436.36 524.89
Hold (unchanged)
Share price: MYR3.78 Target price: MYR4.00 (unchanged)
Wong Wei Sum, CFA [email protected] (03) 2297 8679
Stock Information
Description: A versatile property developer with a spectrum of mid-to high end products to its credentials, including the reputable Setia Alam and Setia Eco Park. Next key earnings driver include its MYR6-7b KL Eco City, MYR10b Setia City and MYR8b Setia Federal Hill. Ticker: SPSB MK Shares Issued (m): 2,001.0 Market Cap (MYR m): 7,563.9 3-mth Avg Daily Turnover (US$ m): 0.73 ST Index: 1,628.40 Free float (%): 14.2 Major Shareholders: % PNB 70.0 Tan Sri Liew Kee Sin 5.6 EPF 5.2 KWAP 5.0
Key Indicators
ROE – annualised (%) 10.2 Net cash (MYR m): (1,318.7) NTA/shr (MYR): 2.00
Historical Chart
Performance:
52-week High/Low MYR1.74/MYR0.92
1-mth 3-mth 6-mth 1-yr YTD
Absolute (%) 8.3 1.3 (3.8) 21.2 (1.8)
Relative (%) 9.8 (2.0) (6.9) 7.9 (8.2)
0.0
1.0
2.0
3.0
4.0
5.0
Sep-10 Jan-11 May-11 Sep-11 Jan-12 May-12
SPSB MK Equity
14 September 2012
Regional Daily
RESEARCH OFFICES REGIONAL
P K BASU Regional Head, Research & Economics (65) 6432 1821 [email protected]
WONG Chew Hann, CA Acting Regional Head of Institutional Research (603) 2297 8686 [email protected]
THAM Mun Hon Regional Strategist (852) 2268 0630 [email protected]
ONG Seng Yeow Regional Products & Planning (852) 2268 0644 [email protected]
ECONOMICS Suhaimi ILIAS Chief Economist Singapore | Malaysia (603) 2297 8682 [email protected]
Luz LORENZO Economist Philippines | Indonesia (63) 2 849 8836 [email protected]
MALAYSIA WONG Chew Hann, CA Head of Research (603) 2297 8686 [email protected] Strategy Construction & Infrastructure Desmond CH’NG, ACA (603) 2297 8680 [email protected] Banking - Regional LIAW Thong Jung (603) 2297 8688 [email protected] Oil & Gas Automotive Shipping ONG Chee Ting (603) 2297 8678 [email protected] Plantations Mohshin AZIZ (603) 2297 8692 [email protected] Aviation Petrochem Power YIN Shao Yang, CPA (603) 2297 8916 [email protected] Gaming – Regional Media Power WONG Wei Sum, CFA (603) 2297 8679 [email protected] Property & REITs LEE Yen Ling (603) 2297 8691 [email protected] Building Materials Manufacturing Technology
LEE Cheng Hooi Head of Retail [email protected] Technicals
HONG KONG / CHINA Edward FUNG Head of Research (852) 2268 0632 [email protected] Construction Ivan CHEUNG, CFA (852) 2268 0634 [email protected] Property Industrial Ivan LI, CFA (852) 2268 0641 [email protected] Banking & Finance Jacqueline KO, CFA (852) 2268 0633 [email protected] Consumer Staples Andy POON (852) 2268 0645 [email protected] Telecom & equipment Alex YEUNG (852) 2268 0636 [email protected] Industrial
INDIA Jigar SHAH Head of Research (91) 22 6623 2601 [email protected] Oil & Gas Automobile Cement Anubhav GUPTA (91) 22 6623 2605 [email protected] Metal & Mining Capital goods Property Ganesh RAM (91) 226623 2607 [email protected] Telecom Contractor
SINGAPORE Stephanie WONG Head of Research (65) 6432 1451 [email protected] Strategy Small & Mid Caps Gregory YAP (65) 6432 1450 [email protected] Technology & Manufacturing Telcos - Regional Wilson LIEW (65) 6432 1454 [email protected] Hotel & Resort Property & Construction James KOH (65) 6432 1431 [email protected] Logistics Resources Consumer Small & Mid Caps YEAK Chee Keong, CFA (65) 6433 5730 [email protected] Healthcare Offshore & Marine Alison FOK (65) 6433 5745 [email protected] Services S-chips Bernard CHIN (65) 6433 5726 [email protected] Transport (Land, Shipping & Aviation) ONG Kian Lin (65) 6432 1470 [email protected] REITs / Property Wei Bin (65) 6432 1455 [email protected] S-chips Small & Mid Caps
INDONESIA Katarina SETIAWAN Head of Research (62) 21 2557 1125 [email protected] Consumer Strategy Telcos Lucky ARIESANDI, CFA (62) 21 2557 1127 [email protected] Base metals Coal Oil & Gas Rahmi MARINA (62) 21 2557 1128 [email protected] Banking Multifinance Pandu ANUGRAH (62) 21 2557 1137 [email protected] Auto Heavy equipment Plantation Toll road Adi N. WICAKSONO (62) 21 2557 1130 [email protected] Generalist Anthony YUNUS (62) 21 2557 1134 [email protected] Cement Infrastructure Property Arwani PRANADJAYA (62) 21 2557 1129 [email protected] Technicals
PHILIPPINES Luz LORENZO Head of Research +63 2 849 8836 [email protected] Strategy Laura DY-LIACCO (63) 2 849 8840 [email protected] Utilities Conglomerates Telcos Lovell SARREAL (63) 2 849 8841 [email protected] Consumer Media Cement Kenneth NERECINA (63) 2 849 8839 [email protected] Conglomerates Property Ports/ Logistics Katherine TAN (63) 2 849 8843 [email protected] Banks Construction Ramon ADVIENTO (63) 2 849 8842 [email protected] Mining
THAILAND Mayuree CHOWVIKRAN Head of Research (66) 2658 6300 ext 1440 [email protected] Strategy
Maria BRENDA SANCHEZ LAPIZ Co-Head of Research Dir (66) 2257 0250 | (66) 2658 6300 ext 1399 [email protected] Consumer/ Big Caps
Andrew STOTZ Strategist (66) 2658 6300 ext 5091 [email protected]
Suttatip PEERASUB (66) 2658 6300 ext 1430 [email protected] Media Commerce Sutthichai KUMWORACHAI (66) 2658 6300 ext 1400 [email protected] Energy Petrochem Termporn TANTIVIVAT (66) 2658 6300 ext 1520 [email protected] Property Woraphon WIROONSRI (66) 2658 6300 ext 1560 [email protected] Banking & Finance Jaroonpan WATTANAWONG (66) 2658 6300 ext 1404 [email protected] Transportation Small cap. Chatchai JINDARAT (66) 2658 6300 ext 1401 [email protected] Electronics Pongrat RATANATAVANANANDA (66) 2658 6300 ext 1398 [email protected] Services/ Small Caps
VIETNAM Michael KOKALARI, CFA Head of Research +84 838 38 66 47 [email protected] Strategy Nguyen Thi Ngan Tuyen +84 844 55 58 88 x 8081 [email protected] Food and Beverage Oil and Gas Ngo Bich Van +84 844 55 58 88 x 8084 [email protected] Banking Nguyen Quang Duy +84 844 55 58 88 x 8082 [email protected] Rubber Dang Thi Kim Thoa +84 844 55 58 88 x 8083 [email protected] Consumer Nguyen Trung Hoa +84 844 55 58 88 x 8088 [email protected] Steel Sugar Macro
14 September 2012
Regional Daily
APPENDIX I: TERMS FOR PROVISION OF REPORT, DISCLAIMERS AND DISCLOSURES DISCLAIMERS This research report is prepared for general circulation and for information purposes only and under no circumstances should it be considered or intended as an offer to sell or a solicitation of an offer to buy the securities referred to herein. Investors should note that values of such securities, if any, may fluctuate and that each security’s price or value may rise or fall. Opinions or recommendations contained herein are in form of technical ratings and fundamental ratings. Technical ratings may differ from fundamental ratings as technical valuations apply different methodologies and are purely based on price and volume-related information extracted from the relevant jurisdiction’s stock exchange in the equity analysis. Accordingly, investors’ returns may be less than the original sum invested. Past performance is not necessarily a guide to future performance. This report is not intended to provide personal investment advice and does not take into account the specific investment objectives, the financial situation and the particular needs of persons who may receive or read this report. Investors should therefore seek financial, legal and other advice regarding the appropriateness of investing in any securities or the investment strategies discussed or recommended in this report. The information contained herein has been obtained from sources believed to be reliable but such sources have not been independently verified by Maybank Investment Bank Berhad, its subsidiary and affiliates (collectively, “MKE”) and consequently no representation is made as to the accuracy or completeness of this report by MKE and it should not be relied upon as such. Accordingly, MKE and its officers, directors, associates, connected parties and/or employees (collectively, “Representatives”) shall not be liable for any direct, indirect or consequential losses or damages that may arise from the use or reliance of this report. Any information, opinions or recommendations contained herein are subject to change at any time, without prior notice. This report may contain forward looking statements which are often but not always identified by the use of words such as “anticipate”, “believe”, “estimate”, “intend”, “plan”, “expect”, “forecast”, “predict” and “project” and statements that an event or result “may”, “will”, “can”, “should”, “could” or “might” occur or be achieved and other similar expressions. Such forward looking statements are based on assumptions made and information currently available to us and are subject to certain risks and uncertainties that could cause the actual results to differ materially from those expressed in any forward looking statements. Readers are cautioned not to place undue relevance on these forward-looking statements. MKE expressly disclaims any obligation to update or revise any such forward looking statements to reflect new information, events or circumstances after the date of this publication or to reflect the occurrence of unanticipated events. MKE and its officers, directors and employees, including persons involved in the preparation or issuance of this report, may, to the extent permitted by law, from time to time participate or invest in financing transactions with the issuer(s) of the securities mentioned in this report, perform services for or solicit business from such issuers, and/or have a position or holding, or other material interest, or effect transactions, in such securities or options thereon, or other investments related thereto. In addition, it may make markets in the securities mentioned in the material presented in this report. MKE may, to the extent permitted by law, act upon or use the information presented herein, or the research or analysis on which they are based, before the material is published. One or more directors, officers and/or employees of MKE may be a director of the issuers of the securities mentioned in this report. This report is prepared for the use of MKE’s clients and may not be reproduced, altered in any way, transmitted to, copied or distributed to any other party in whole or in part in any form or manner without the prior express written consent of MKE and MKE and its Representatives accepts no liability whatsoever for the actions of third parties in this respect. This report is not directed to or intended for distribution to or use by any person or entity who is a citizen or resident of or located in any locality, state, country or other jurisdiction where such distribution, publication, availability or use would be contrary to law or regulation. This report is for distribution only under such circumstances as may be permitted by applicable law. The securities described herein may not be eligible for sale in all jurisdictions or to certain categories of investors. Without prejudice to the foregoing, the reader is to note that additional disclaimers, warnings or qualifications may apply based on geographical location of the person or entity receiving this report. Malaysia Opinions or recommendations contained herein are in the form of technical ratings and fundamental ratings. Technical ratings may differ from fundamental ratings as technical valuations apply different methodologies and are purely based on price and volume-related information extracted from Bursa Malaysia Securities Berhad in the equity analysis. Singapore
This report has been produced as of the date hereof and the information herein may be subject to change. Maybank Kim Eng Research Pte. Ltd. (“Maybank KERPL”) in Singapore has no obligation to update such information for any recipient. For distribution in Singapore, recipients of this report are to contact Maybank KERPL in Singapore in respect of any matters arising from, or in connection with, this report. If the recipient of this report is not an accredited investor, expert investor or institutional investor (as defined under Section 4A of the Singapore Securities and Futures Act), Maybank KERPL shall be legally liable for the contents of this report, with such liability being limited to the extent (if any) as permitted by law. Thailand The disclosure of the survey result of the Thai Institute of Directors Association (“IOD”) regarding corporate governance is made pursuant to the policy of the Office of the Securities and Exchange Commission. The survey of the IOD is based on the information of a company listed on the Stock Exchange of Thailand and the market for Alternative Investment disclosed to the public and able to be accessed by a general public investor. The result, therefore, is from the perspective of a third party. It is not an evaluation of operation and is not based on inside information. The survey result is as of the date appearing in the Corporate Governance Report of Thai Listed Companies. As a result, the survey may be changed after that date. Maybank Kim Eng Securities (Thailand) Public Company Limited (“MBKET”) does not confirm nor certify the accuracy of such survey result. Except as specifically permitted, no part of this presentation may be reproduced or distributed in any manner without the prior written permission of MBKET. MBKET accepts no liability whatsoever for the actions of third parties in this respect. US
This research report prepared by MKE is distributed in the United States (“US”) to Major US Institutional Investors (as defined in Rule 15a-6 under the Securities Exchange Act of 1934, as amended) only by Maybank Kim Eng Securities USA Inc (“Maybank KESUSA”), a broker-dealer registered in the US (registered under Section 15 of the Securities Exchange Act of 1934, as amended). All responsibility for the distribution of this report by Maybank KESUSA in the US shall be borne by Maybank KESUSA. All resulting transactions by a US person or entity should be effected through a registered broker-dealer in the US. This report is not directed at you if MKE is prohibited or restricted by any legislation or regulation in any jurisdiction from making it available to you. You should satisfy yourself before reading it that Maybank KESUSA is permitted to provide research material concerning investments to you under relevant legislation and regulations. UK This document is being distributed by Maybank Kim Eng Securities (London) Ltd (“Maybank KESL”) which is authorized and regulated, by the Financial Services Authority and is for Informational Purposes only. This document is not intended for distribution to anyone defined as a Retail Client under the Financial Services and Markets Act 2000 within the UK. Any inclusion of a third party link is for the recipients convenience only, and that the firm does not take any responsibility for its comments or accuracy, and that access to such links is at the individuals own risk. Nothing in this report should be considered as constituting legal, accounting or tax advice, and that for accurate guidance recipients should consult with their own independent tax advisers.
14 September 2012
Regional Daily
DISCLOSURES Legal Entities Disclosures Malaysia: This report is issued and distributed in Malaysia by Maybank Investment Bank Berhad (15938-H) which is a Participating Organization of Bursa Malaysia Berhad and a holder of Capital Markets and Services License issued by the Securities Commission in Malaysia. Singapore: This material is issued and distributed in Singapore by Maybank KERPL (Co. Reg No 197201256N) which is regulated by the Monetary Authority of Singapore. Indonesia: PT Kim Eng Securities (“PTKES”) (Reg. No. KEP-251/PM/1992) is a member of the Indonesia Stock Exchange and is regulated by the BAPEPAM LK. Thailand: MBKET (Reg. No.0107545000314) is a member of the Stock Exchange of Thailand and is regulated by the Ministry of Finance and the Securities and Exchange Commission. Philippines: MATRKES (Reg. No.01-2004-00019) is a member of the Philippines Stock Exchange and is regulated by the Securities and Exchange Commission. Vietnam: Kim Eng Vietnam Securities Company (“KEVS”) (License Number: 71/UBCK-GP) is licensed under the State Securities Commission of Vietnam. Hong Kong: KESHK (Central Entity No AAD284) is regulated by the Securities and Futures Commission. India: Kim Eng Securities India Private Limited (“KESI”) is a participant of the National Stock Exchange of India Limited (Reg No: INF/INB 231452435) and the Bombay Stock Exchange (Reg. No. INF/INB 011452431) and is regulated by Securities and Exchange Board of India. KESI is also registered with SEBI as Category 1 Merchant Banker (Reg. No. INM 000011708) US: Maybank KESUSA is a member of/ and is authorized and regulated by the FINRA – Broker ID 27861. UK: Maybank KESL (Reg No 2377538) is authorized and regulated by the Financial Services Authority. Disclosure of Interest Malaysia: MKE and its Representatives may from time to time have positions or be materially interested in the securities referred to herein and may further act as market maker or may have assumed an underwriting commitment or deal with such securities and may also perform or seek to perform investment banking services, advisory and other services for or relating to those companies. Singapore: As of 14 September 2012, Maybank KERPL does not have any interest in the companies mentioned in this report. The covering analysts have positions in CapitaMalls Asia. CWT Ltd, Cosco, Global Logistics Properties, SingTel, SPH & Singapore Exchange.Thailand: MBKET may have a business relationship with or may possibly be an issuer of derivative warrants on the securities /companies mentioned in the research report. Therefore, Investors should exercise their own judgment before making any investment decisions. MBKET, its associates, directors, connected parties and/or employees may from time to time have interests and/or underwriting commitments in the securities mentioned in this report. Hong Kong: KESHK may have financial interests in relation to an issuer or a new listing applicant referred to as defined by the requirements under Paragraph 16.5(a) of the Hong Kong Code of Conduct for Persons Licensed by or Registered with the Securities and Futures Commission.
As of 14 September 2012, KESHK and the authoring analyst do not have any interest in any companies recommended in this research report. MKE may have, within the last three years, served as manager or co-manager of a public offering of securities for, or currently may make a primary market in issues of, any or all of the entities mentioned in this report or may be providing, or have provided within the previous 12 months, significant advice or investment services in relation to the investment concerned or a related investment. OTHERS Analyst Certification of Independence The views expressed in this research report accurately reflect the analyst’s personal views about any and all of the subject securities or issuers; and no part of the research analyst’s compensation was, is or will be, directly or indirectly, related to the specific recommendations or views expressed in the report. Reminder Structured securities are complex instruments, typically involve a high degree of risk and are intended for sale only to sophisticated investors who are capable of understanding and assuming the risks involved. The market value of any structured security may be affected by changes in economic, financial and political factors (including, but not limited to, spot and forward interest and exchange rates), time to maturity, market conditions and volatility and the credit quality of any issuer or reference issuer. Any investor interested in purchasing a structured product should conduct its own analysis of the product and consult with its own professional advisers as to the risks involved in making such a purchase. No part of this material may be copied, photocopied or duplicated in any form by any means or redistributed without the prior consent of MKE.
Definition of Ratings Maybank Kim Eng Research uses the following rating system: BUY Total return is expected to be above 15% in the next 12 months HOLD Total return is expected to be between -15% to +15% in the next 12 months SELL Total return is expected to be below -15% in the next 12 months
Applicability of Ratings The respective analyst maintains a coverage universe of stocks, the list of which may be adjusted according to needs. Investment ratings are only applicable to the stocks which form part of the coverage universe. Reports on companies which are not part of the coverage do not carry investment ratings as we do not actively follow developments in these companies.
Some common terms abbreviated in this report (where they appear): Adex = Advertising Expenditure FCF = Free Cashflow PE = Price Earnings BV = Book Value FV = Fair Value PEG = PE Ratio To Growth CAGR = Compounded Annual Growth Rate FY = Financial Year PER = PE Ratio Capex = Capital Expenditure FYE = Financial Year End QoQ = Quarter-On-Quarter CY = Calendar Year MoM = Month-On-Month ROA = Return On Asset DCF = Discounted Cashflow NAV = Net Asset Value ROE = Return On Equity DPS = Dividend Per Share
NTA = Net Tangible Asset ROSF = Return On Shareholders’ Funds EBIT = Earnings Before Interest And Tax P = Price WACC = Weighted Average Cost Of Capital EBITDA = EBIT, Depreciation And Amortisation P.A. = Per Annum YoY = Year-On-Year EPS = Earnings Per Share PAT = Profit After Tax YTD = Year-To-Date EV = Enterprise Value PBT = Profit Before Tax

14 September 2012
Regional Daily
Malaysia Maybank Investment Bank Berhad (A Participating Organisation of Bursa Malaysia Securities Berhad) 33rd Floor, Menara Maybank, 100 Jalan Tun Perak, 50050 Kuala Lumpur Tel: (603) 2059 1888; Fax: (603) 2078 4194
Singapore Maybank Kim Eng Securities Pte Ltd Maybank Kim Eng Research Pte Ltd 9 Temasek Boulevard #39-00 Suntec Tower 2 Singapore 038989 Tel: (65) 6336 9090 Fax: (65) 6339 6003
London Maybank Kim Eng Securities (London) Ltd 6/F, 20 St. Dunstan’s Hill London EC3R 8HY, UK Tel: (44) 20 7621 9298 Dealers’ Tel: (44) 20 7626 2828 Fax: (44) 20 7283 6674
New York Maybank Kim Eng Securities USA Inc 777 Third Avenue, 21st Floor New York, NY 10017, U.S.A. Tel: (212) 688 8886 Fax: (212) 688 3500
Stockbroking Business: Level 8, Tower C, Dataran Maybank, No.1, Jalan Maarof 59000 Kuala Lumpur Tel: (603) 2297 8888 Fax: (603) 2282 5136
Hong Kong Kim Eng Securities (HK) Ltd Level 30, Three Pacific Place, 1 Queen’s Road East, Hong Kong Tel: (852) 2268 0800 Fax: (852) 2877 0104
Indonesia PT Kim Eng Securities Plaza Bapindo Citibank Tower 17th Floor Jl Jend. Sudirman Kav. 54-55 Jakarta 12190, Indonesia
Tel: (62) 21 2557 1188 Fax: (62) 21 2557 1189
India Kim Eng Securities India Pvt Ltd 2nd Floor, The International 16, Maharishi Karve Road, Churchgate Station, Mumbai City - 400 020, India Tel: (91).22.6623.2600 Fax: (91).22.6623.2604
Philippines Maybank ATR Kim Eng Securities Inc. 17/F, Tower One & Exchange Plaza Ayala Triangle, Ayala Avenue Makati City, Philippines 1200 Tel: (63) 2 849 8888 Fax: (63) 2 848 5738
Thailand Maybank Kim Eng Securities (Thailand) Public Company Limited 999/9 The Offices at Central World, 20th - 21st Floor, Rama 1 Road Pathumwan, Bangkok 10330, Thailand Tel: (66) 2 658 6817 (sales) Tel: (66) 2 658 6801 (research)
Vietnam In association with Kim Eng Vietnam Securities Company 1st Floor, 255 Tran Hung Dao St. District 1 Ho Chi Minh City, Vietnam Tel : (84) 838 38 66 36 Fax : (84) 838 38 66 39
Saudi Arabia In association with Anfaal Capital Villa 47, Tujjar Jeddah Prince Mohammed bin Abdulaziz Street P.O. Box 126575 Jeddah 21352 Tel: (966) 2 6068686 Fax: (966) 26068787
South Asia Sales Trading Connie TAN [email protected] Tel: (65) 6333 5775 US Toll Free: 1 866 406 7447
North Asia Sales Trading Eddie LAU [email protected] Tel: (852) 2268 0800 US Toll Free: 1 866 598 2267
www.maybank-ke.com | www.kimengresearch.com