appendix – i - comptroller and auditor general of india report 2007-08... · web...
TRANSCRIPT

Appendices
Appendix 1.1-Part A(Reference to paragraph 1.1 Page 1)
Structure and Form of Government Accounts
Structure of Government Accounts:
The accounts of the State Government are kept in three parts
(i) Consolidated Fund
(ii) Contingency Fund and
(iii) Public Account
Part I: Consolidated Fund
All revenues received by the State Government, all loans raised by issue of treasury bills, internal and external loans and all moneys received by the Government in repayment of loans shall form one consolidated fund entitled ‘The Consolidated Fund of State’ established under Article 266(1) of the Constitution of India.
Part II: Contingency Fund
The Contingency Fund of State established under Article 267(2) of the Constitution is in the nature of an imprest placed at the disposal of the Governor to enable him to make advances to meet urgent unforeseen expenditure, pending authorisation by Legislature. Approval of the Legislature for such expenditure and for withdrawal of an equivalent amount from the Consolidated Fund is subsequently obtained, whereupon the advances from the Contingency Fund are recouped to the Fund.
Part III: Public Account
Receipts and disbursements in respect of certain transactions such as small savings, provident funds, reserve funds, deposits, suspense, remittances etc. which do not form part of the Consolidated Fund, are kept in the Public Account set up under Article 266(2) of the Constitution and are not subject to vote by the State Legislature.
175

Audit Report (Civil) for the year ended 31 March 2008
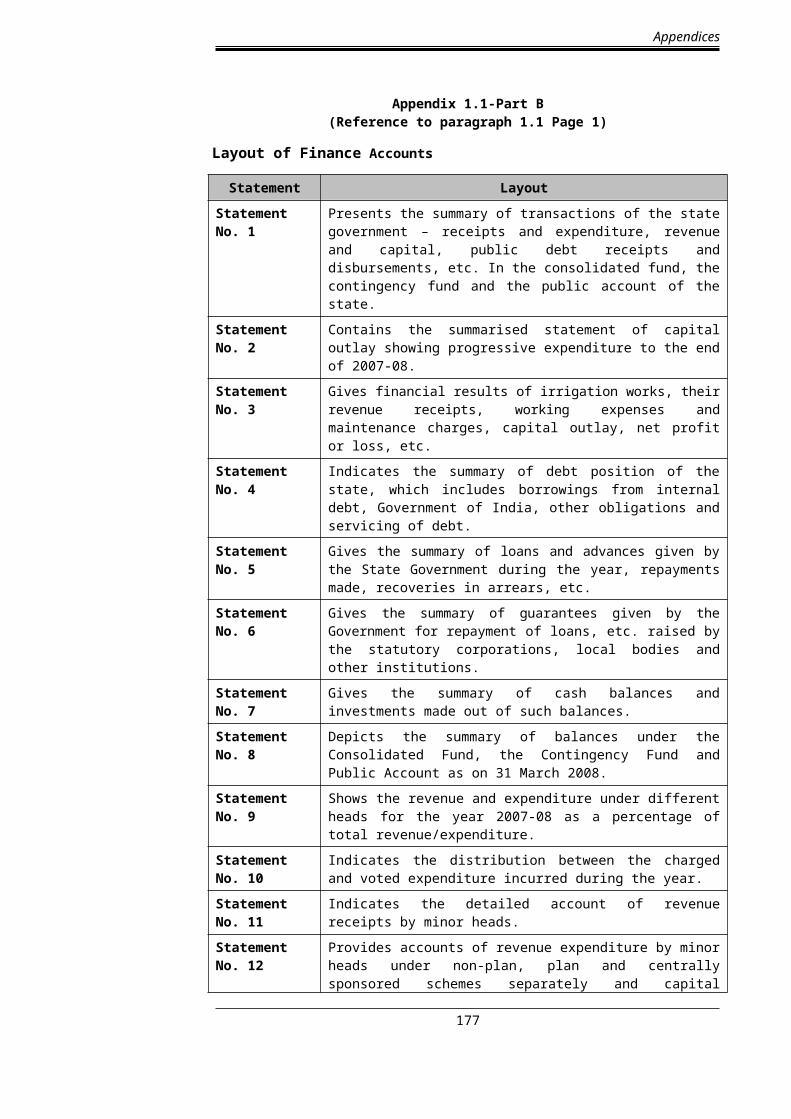
Appendix 1.1-Part B(Reference to paragraph 1.1 Page 1)
Layout of Finance Accounts
Statement Layout
Statement No. 1 Presents the summary of transactions of the state government – receipts and expenditure, revenue and capital, public debt receipts and disbursements, etc. In the consolidated fund, the contingency fund and the public account of the state.
Statement No. 2 Contains the summarised statement of capital outlay showing progressive expenditure to the end of 2007-08.
Statement No. 3 Gives financial results of irrigation works, their revenue receipts, working expenses and maintenance charges, capital outlay, net profit or loss, etc.
Statement No. 4 Indicates the summary of debt position of the state, which includes borrowings from internal debt, Government of India, other obligations and servicing of debt.
Statement No. 5 Gives the summary of loans and advances given by the State Government during the year, repayments made, recoveries in arrears, etc.
Statement No. 6 Gives the summary of guarantees given by the Government for repayment of loans, etc. raised by the statutory corporations, local bodies and other institutions.
Statement No. 7 Gives the summary of cash balances and investments made out of such balances.
Statement No. 8 Depicts the summary of balances under the Consolidated Fund, the Contingency Fund and Public Account as on 31 March 2008.
Statement No. 9 Shows the revenue and expenditure under different heads for the year 2007-08 as a percentage of total revenue/expenditure.
Statement No. 10 Indicates the distribution between the charged and voted expenditure incurred during the year.
Statement No. 11 Indicates the detailed account of revenue receipts by minor heads.
Statement No. 12 Provides accounts of revenue expenditure by minor heads under non-plan, plan and centrally sponsored schemes separately and capital expenditure by major head wise.
Statement No. 13 Depicts the detailed capital expenditure incurred during and to the end of 2007-08.
Statement No. 14 Shows the details of investment of the State Government in statutory corporations, Government companies, other joint stock companies, cooperative banks and societies, etc. Up to the end of 2007-08.
Statement No. 15 Depicts the capital and other expenditure to the end of 2007-08 and the principal sources from which the funds were provided for that expenditure.
Statement No. 16 Gives the detailed account of receipts, disbursements and balances under heads of account relating to Debt, Contingency Fund and Public Account.
Statement No. 17 Presents the detailed account of debt and other interest bearing obligations of the Government of Andhra Pradesh.
Statement No. 18 Provides the detailed account of loans and advances given by the Government of Andhra Pradesh, the amount of loan repaid during the year, the balance as on 31 March 2008.
Statement No. 19 Gives the details of earmarked balances of reserve funds.
176
Appendices
177

Audit Report (Civil) for the year ended 31 March 2008
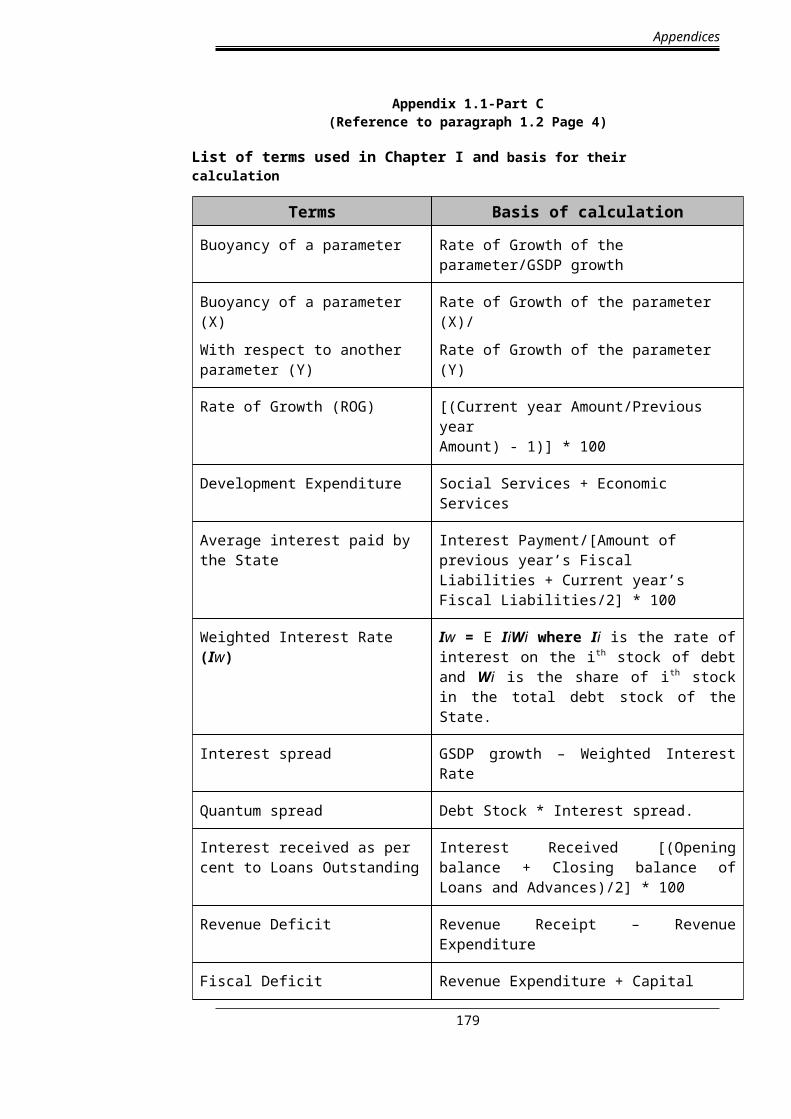
Appendix 1.1-Part C(Reference to paragraph 1.2 Page 4)
List of terms used in Chapter I and basis for their calculation
Terms Basis of calculation
Buoyancy of a parameter Rate of Growth of the parameter/GSDP growth
Buoyancy of a parameter (X)
With respect to another parameter (Y)
Rate of Growth of the parameter (X)/
Rate of Growth of the parameter (Y)
Rate of Growth (ROG) [(Current year Amount/Previous year Amount) - 1)] * 100
Development Expenditure Social Services + Economic Services
Average interest paid by the State Interest Payment/[Amount of previous year’s Fiscal Liabilities + Current year’s Fiscal Liabilities/2] * 100
Weighted Interest Rate (Iw) Iw = E IiWi where Ii is the rate of interest on the ith stock of debt and Wi is the share of ith stock in the total debt stock of the State.
Interest spread GSDP growth – Weighted Interest Rate
Quantum spread Debt Stock * Interest spread.
Interest received as per cent to Loans Outstanding
Interest Received [(Opening balance + Closing balance of Loans and Advances)/2] * 100
Revenue Deficit Revenue Receipt – Revenue Expenditure
Fiscal Deficit Revenue Expenditure + Capital Expenditure + Net Loans and Advances – Revenue Receipts – Miscellaneous Capital Receipts
Primary Deficit Fiscal Deficit – Interest payments
Balance from Current Revenue (BCR)
Revenue Receipts minus all Plan grants and Non-Plan Revenue Expenditure, excluding expenditure recorded under the major head 2048 - Appropriation for reduction of Avoidance of Debt
178
Appendices
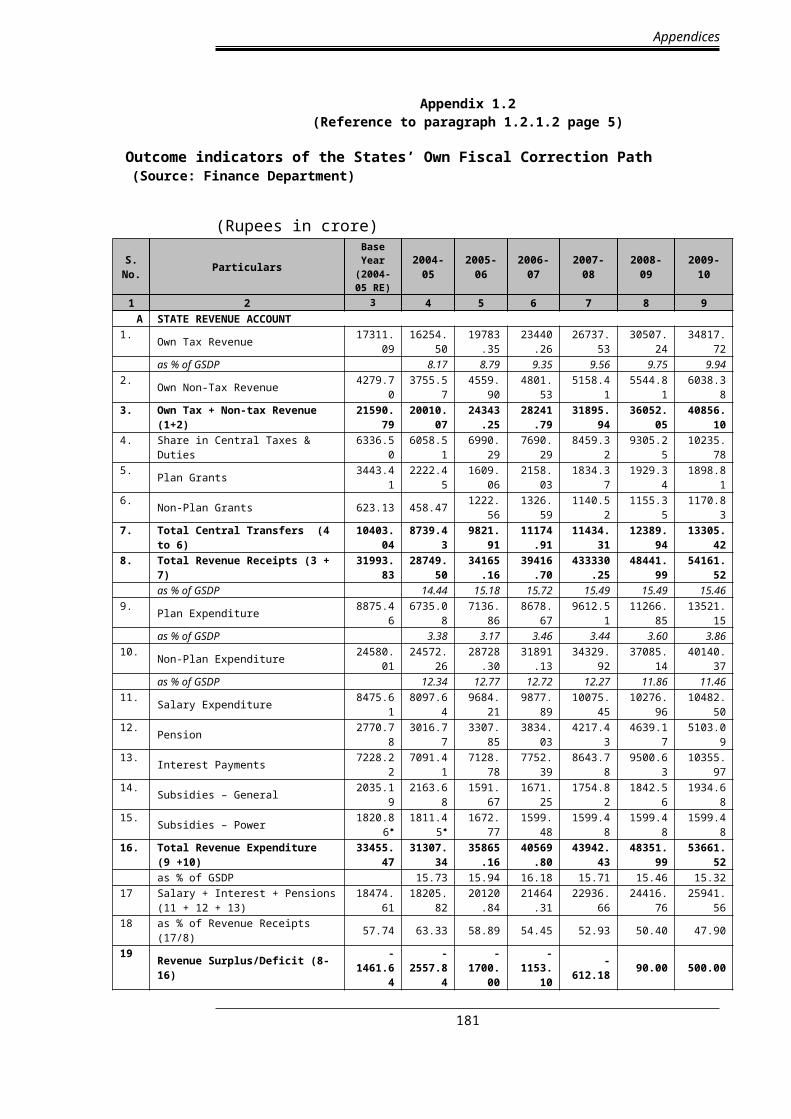
Appendix 1.2(Reference to paragraph 1.2.1.2 page 5)
Outcome indicators of the States’ Own Fiscal Correction Path (Source: Finance Department)
(Rupees in crore)
S. No. Particulars
Base Year
(2004-05 RE)
2004-05 2005-06 2006-07 2007-08 2008-09 2009-10
1 2 3 4 5 6 7 8 9A STATE REVENUE ACCOUNT
1. Own Tax Revenue 17311.09 16254.50
19783.35
23440.26 26737.53 30507.24 34817.72
as % of GSDP 8.17 8.79 9.35 9.56 9.75 9.942. Own Non-Tax Revenue 4279.70 3755.57 4559.90 4801.53 5158.41 5544.81 6038.383. Own Tax + Non-tax Revenue (1+2) 21590.79 20010.0
724343.2
528241.7
9 31895.94 36052.05 40856.10
4. Share in Central Taxes & Duties 6336.50 6058.51 6990.29 7690.29 8459.32 9305.25 10235.785. Plan Grants 3443.41 2222.45 1609.06 2158.03 1834.37 1929.34 1898.816. Non-Plan Grants 623.13 458.47 1222.56 1326.59 1140.52 1155.35 1170.837. Total Central Transfers (4 to 6) 10403.04 8739.43 9821.91 11174.9
1 11434.31 12389.94 13305.42
8. Total Revenue Receipts (3 + 7) 31993.83 28749.50
34165.16
39416.70
433330.25 48441.99 54161.52
as % of GSDP 14.44 15.18 15.72 15.49 15.49 15.469. Plan Expenditure 8875.46 6735.08 7136.86 8678.67 9612.51 11266.85 13521.15
as % of GSDP 3.38 3.17 3.46 3.44 3.60 3.8610. Non-Plan Expenditure 24580.01 24572.2
628728.3
031891.1
3 34329.92 37085.14 40140.37
as % of GSDP 12.34 12.77 12.72 12.27 11.86 11.4611. Salary Expenditure 8475.61 8097.64 9684.21 9877.89 10075.45 10276.96 10482.5012. Pension 2770.78 3016.77 3307.85 3834.03 4217.43 4639.17 5103.0913. Interest Payments 7228.22 7091.41 7128.78 7752.39 8643.78 9500.63 10355.9714. Subsidies – General 2035.19 2163.68 1591.67 1671.25 1754.82 1842.56 1934.6815. Subsidies – Power 1820.86 1811.45
1672.77 1599.48 1599.48 1599.48 1599.48
16. Total Revenue Expenditure (9 +10) 33455.47 31307.34
35865.16
40569.80 43942.43 48351.99 53661.52
as % of GSDP 15.73 15.94 16.18 15.71 15.46 15.3217 Salary + Interest + Pensions (11 + 12 +
13) 18474.61 18205.82
20120.84
21464.31 22936.66 24416.76 25941.56
18 as % of Revenue Receipts (17/8) 57.74 63.33 58.89 54.45 52.93 50.40 47.9019 Revenue Surplus/Deficit (8-16) -1461.64 -2557.84 -
1700.00-
1153.10 -612.18 90.00 500.00
as % of GSDP -1.28 -0.76 -0.46 -0.22 0.03 0.14B CONSOLIDATED REVENUE ACCOUNT
1 Power Sector loss/profit net of actual subsidy transfer 57.00 116.00 121.00 125.00 130.00 135.00
2 Increase in debtors during the year in power utility accounts [increase (-)]
3 Interest payment on off-budget borrowings and SPV borrowings made by PSU/SPUs outside budget
4 Total (1 to 3) 0.00 57.00 116.00 121.00 125.00 130.00 135.005 Consolidated Revenue Deficit (A 19 + B
4) -1461.64 -2500.84 -1584.00
-1032.10 -487.18 220.00 635.00
C CONSOLIDATED DEBT1. Outstanding Debt and Utility 66202.86 71427.0
579557.3
687738.2
1 95920.29 104085.68
112185.97
as % of GSDP 35.88 35.35 35.00 34.29 33.28 32.032. Total outstanding guarantee 17231.94 17508.3
019087.8
020042.1
9 21044.30 22096.51 23201.34
as % of GSDP 8.79 8.48 8.00 7.52 7.07 6.62of which Guarantee on account off-budget borrowing and SPV borrowing 2300.60 2356.61 2238.78 2126.84 2020.50 1919.47
179

Audit Report (Civil) for the year ended 31 March 2008
D CAPITAL ACCOUNT1. Capital Outlay 5880.22 5414.23 6937.69 7620.26 7988.47 8620.34 9309.97
as % of GSDP 2.72 3.08 3.04 2.86 2.76 2.662 Disbursement of Loans and Advances 845.68 1593.14 1123.27 1234.66 1321.32 1448.93 1159.593 Recovery of Loans and Advances 1480.66 1372.98 1757.40 1127.17 1139.89 1153.88 1169.274 Other Capital Receipts 700.00 700.00 700.00 700.005 Gross Fiscal Deficit (GFD) -6706.88 -8192.23 -
8003.56-
8180.85 -8082.08 -8125.39 -8100.29
as % of GSDP -4.12 -3.56 -3.26 -2.89 -2.60 -2.31GSDP (Rs in crores) at Current prices 199075 199075 225054 250674 279732 312741 350295Actual/Assumed Nominal Growth Rate (%) 10.10 13.05 11.38 11.59 11.80 12.01
GFD as per para 19 of the guidelinesincluded in Plan expenditure
180
Appendices
Appendix 1.3(Reference to paragraphs 1.2 and1.7 page 3 and 20)
Summarised financial position of the Government of Andhra Pradesh as on 31 March 2008
As on 31.03.2007 Liabilities (Rupees in crore) As on 31.03.200830086.82 Internal Debt –Total 6003(St.17)(Public debt) 36269.20
23543.27 Market loans bearing interest 29185.601.00 Market Loans not bearing interest 0.76
-- Market Loans Suspense ---2096.24 Loans from LIC 1750.15
139.23 Loans from GIC 129.602357.29 Loans from NABARD 3188.511949.79 Loans from other Institutions 2014.58
-- Ways and Means Advances ----- Overdraft from Reserve Bank of India ---
15169.13 Loans and Advances from Central Government - 15125.69462.75 Pre 1984-85 Loans 9.36349.24 Non-plan Loans 106.22
14244.75 Loans for State Plan Schemes 14896.7525.82 Loans for Central Plan Schemes 23.6986.57 Loans for Centrally Sponsored Plan Schemes 89.67
-- Other Ways and Means Advances ---49.64 Contingency Fund 49.07
30165.45 Small Savings, Provident Funds, etc 31084.0710679.59 Deposits 14116.28
2296.93 Reserve Funds 3120.6871.63 Suspense and Miscellaneous Balances 202.47
864.15 Remittance Balances 1807.4789383.34 Total 101774.93
As on 31.03.2007 Assets (Rupees in crore) As on 31.3.200850120.18$ Gross Capital Outlay on Fixed Assets - 62894.91
5776.17 Investments in shares of Companies, Corporations, Cooperatives, etc 5931.4244344.01 Other Capital Outlay 56963.49
10648.16 A) Loans and Advances 13377.933716.05 a) Loans for Power Projects 3707.496726.79 b) Other Development Loans 9453.46
205.32 c) Loans to Government servants and Miscellaneous loans 216.9813.19 Advances 11.73
-- Remittance Balances ----- Suspense and Miscellaneous Balances ---
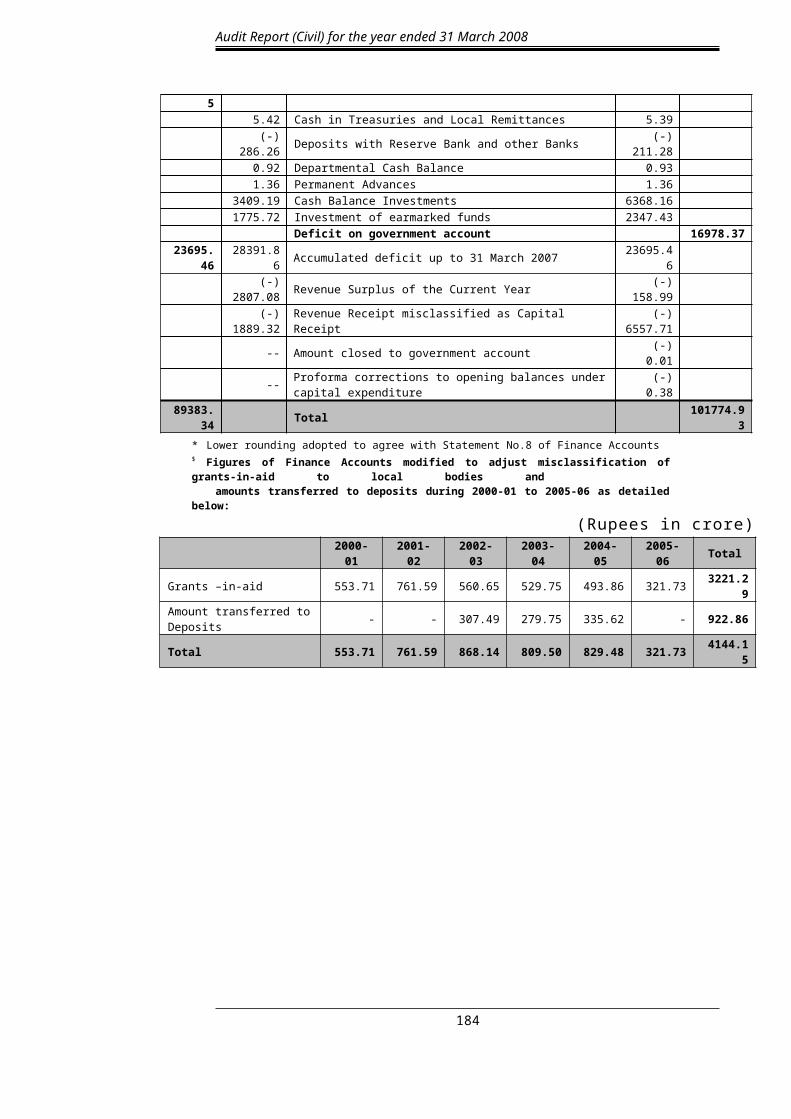
4906.35 Cash – 8511.995.42 Cash in Treasuries and Local Remittances 5.39
(-) 286.26 Deposits with Reserve Bank and other Banks (-) 211.280.92 Departmental Cash Balance 0.931.36 Permanent Advances 1.36
3409.19 Cash Balance Investments 6368.161775.72 Investment of earmarked funds 2347.43
Deficit on government account 16978.3723695.46 28391.86 Accumulated deficit up to 31 March 2007 23695.46
(-) 2807.08 Revenue Surplus of the Current Year (-) 158.99
(-) 1889.32 Revenue Receipt misclassified as Capital Receipt (-) 6557.71
-- Amount closed to government account (-) 0.01-- Proforma corrections to opening balances under capital expenditure (-) 0.38
89383.34 Total 101774.93* Lower rounding adopted to agree with Statement No.8 of Finance Accounts$ Figures of Finance Accounts modified to adjust misclassification of grants-in-aid to local bodies and amounts transferred to deposits during 2000-01 to 2005-06 as detailed below:
(Rupees in crore)2000-01 2001-02 2002-03 2003-04 2004-05 2005-06 Total
Grants –in-aid 553.71 761.59 560.65 529.75 493.86 321.73 3221.29Amount transferred to Deposits - - 307.49 279.75 335.62 - 922.86
181

Audit Report (Civil) for the year ended 31 March 2008
Total 553.71 761.59 868.14 809.50 829.48 321.73 4144.15
182

Appendices
Appendix 1.4(Reference to paragraphs 1.2 and 1.7 page 3 and 20)
Time Series Data on State Government Finances
(Rupees in crore)2002-03 2003-04 2004-05 2005-06 2006-07 2007-08
Part A. Receipts1. Revenue Receipts 23003(74) 26869(69) 28750(72) 34851(89) 44245(86) 54143(75)
(i) Tax Revenue 12618(55) 13806(51) 16254(57) 19207 (55) 23926 (54) 28794(53)Taxes on Sales, Trade, etc. 8322(66) 9187(66) 11041(68) 12542 (65) 15467 (65) 19026(66)State Excise 1857(15) 1915(14) 2093(13) 2684 (14) 3437 (14) 4041(14)Taxes on Vehicles 929(7) 1068(8) 1169(7) 1356 (7) 1365 (6) 1604(6)Stamps and Registration fees 1000(8) 1112(8) 1388(9) 2013 (11) 2865 (12) 3086(11)Land Revenue 86(1) 35 33(-) 69 (-) 114 (-) 144(-)Other Taxes 424(3) 489(4) 530(3) 543 (3) 678 (3) 893(3)(ii) Non Tax Revenue 3529(15) 3605(14) 3756(13) 4691 (14) 6488 (15) 7064(13)(iii) State's share in Union taxes and duties 4316(19) 5069(19) 6059(21) 6951 (20) 8866 (20) 11184(21)
(iv) Grants in aid from GOI 2540(11) 4389(16) 2681(9) 4002 (11) 4965 (11) 7101(13)2. Misc. Capital Receipts -- -- -- -- 1889 6558
3. Total revenue and Non-debt capital receipts (1+2) 23003 26869 28750 34851 46134 60701
4. Recovery of loans and advances 460(1) 1256 (3) 1373(3) 182 (1) 471 (1) 191(-)5. Public Debt Receipts 7802(25) 10627 (28) 9833(25) 3971 (10) 4550 (9) 11132(15)
Internal Debt(excluding Ways and Means Advances and Overdraft)
5254(67) 7509 (71) 7992(81) 3449 (87) 4236 (93) 10223(92)
Net transactions under Ways and Means Advances and Overdraft -- -- -- -- -- ---
Loans and Advances from Government of India 2548#(33) 3118# (29) 1841(19) 522 (13) 314 (7) 909(8)
6. Total receipts in the Consolidated Fund (3+4+5) 31265 38752 39956 39004 51155 72024
7. Contingency Fund receipts 3 -- 23 -- 1 ---8. Public Account receipts 25646 30495 39439 41366 51060 613809. Total receipts of Government (6+7+8) 56914 69247 79418 80370 102216 133404
Part B. Expenditure/Disbursement10. Revenue Expenditure 26925 (87)* 30640 (86)* 32137(84)* 35237 (81) 41438 53984(77)
Plan 5848 (22) 7345 (24) 7229(22) 6805 (19) 9519 13901(26)Non-plan 21077 (78) 23295 (76) 24908(78) 28432 (81) 31920 40083(72)General Services (including interest payments) 11004 (41) 12133 (40) 13202(41) 13492 (38) 15314 18170(34)
Social Services 8904 (33) 10600 (34) 10808(34) 12159 (35) 15369 18660(35)Economic Services 6755 (25) 7627 (25) 7901(24) 9361 (26) 10510 16904(31)Grants-in-aid and contributions 262 (1) 280 (1) 226(1) 225 (1) 245 249(-)
11. Capital Expenditure 2928 (9)* 3441 (10)* 4585(12)* 7340(17)* 9904 12774(18)
Plan 2778 (95) 3417 (99) 4597(100) 7378 (100) 9909 12866(100)
Non-plan 150 (5) 24 (1) (-) 12 (-) 38 (-) (-) 5 (-) 92 (-)General Services 82(3) 58 (2) 19 26 (-) 344 36(-)Social Services 518 (18) 259 (7) 449(10) 155 (2) 164 (2) 284(2)Economic Services 2328(79) 3124 (91) 4117(90) 7159 (98) 9396 12454(97)
12. Disbursement of Loans and Advances 1235 (4) 1494 (4) 1593(4) 756 (2) 907 (2) 2920 (4)13. Total (10+11+12) 31088 35575 38315 43333 52249 69678
# Includes Ways and Means Advances from Government of India
183
Audit Report (Civil) for the year ended 31 March 2008
*The figures of Revenue and Capital expenditure have been adopted after adjustment of the misclassification mentioned under the relevant statements in Finance Accounts
2002-03 2003-04 2004-05 2005-06 2006-07 2007-0814. Repayment of Public debt 3284 5925 7432 5295 4253 4993
Internal Debt(excluding Ways and Means Advances and Overdraft)
992 (30) 2225 (38) 3014(41) 4688 (89) 3063 (72) 4041(81)
Net transactions under Ways and Means Advances and Overdraft --- --- --- -- -- ---
Loans and Advances from Government of India# 2292 (70) 3700 (62) 4418(59) 607 (11) 1190 (28) 952(19)
15. Appropriation to Contingency Fund -- --- --- -- -- ---
16. Total disbursement out of Consolidated Fund (13+14+15) 34372 41500 45747 48628 56502 74671
17. Contingency Fund disbursements 4 19 $ 1 Z 118. Public Account disbursements 22465 26459 32370 31421 44216 55126
1 Total disbursements by the State (16+17+18) 56841 67978 78117 80050 100718 129798
Part C. Deficits20. Revenue Deficit (-)/Surplus (+) (10-1) (-)3922 (-)3771 (-)3387 (-)386 (+) 2807 (+) 15921. Fiscal Deficit (-)/Surplus (+) (1+2+4-13) (-)7625 (-)7450 (-)8192 (-)8300 (-) 5644 (-) 8786
22. Primary Deficit (-)/Surplus (+) (21-23) (-)1494 (-)594 (-)1101 (-)1292 (+) 1636 (-)1197
Part D. Other data
23. Interest Payments (included in revenue expenditure) 6131 6856 7091 7008 7280 7589
24.Arrears of Revenue(percentage of Tax & Non Tax Revenue receipts)
3021(19) 3672(21) 5028(25) N.A N.A NA
25. Financial Assistance to local bodies etc. 9259 10965 11213 9702 10767 18642
26. Ways and Means Advances/Overdraft availed (days) 170 212 --- -- -- ---
27. Interest on Ways and Means Advances/Overdraft 12 16 --- -- -- ---
28. Gross State Domestic Product (GSDP)* 168143 190880 210449(R) 236034 (P) 269173(Q) 311752(A)29. Outstanding fiscal liabilities (year end) @ 54831 64545 74288 79549 86622 9736830. Outstanding guarantees (year end) 15317 17427 17893 17711 18018 1450231. Maximum amount guaranteed (year end) 24810 29545 28165 30200 29160 1879832. Number of incomplete projects 23 24^ NA NA NA 53^33. Capital blocked in incomplete projects 8692 9254^ NA NA NA 30939^
Note: Figures in brackets represent percentages (rounded) to total of each sub heading
R: Revised; P: Provisional, Q: Quick and A: Advanced Estimates$ Rupees 9.85 lakh; Z: Rupees 32.60 lakh# Includes Ways and Means Advances from Government of India* The GSDP data for 2002-03 to 2007-08 have been adopted from the Economic Survey for 2007-08 published by the Planning Department@Nomenclature and its components were changed so as to show total liabilities of Government (i.e., Public Debt and other obligations) as per revised format of Chapter I
^ The information is not exhaustive but is as furnished by the departmental authorities
NA: Not available
184

Appendices
Appendix 1.5(Reference to paragraph 1.2 page 3)
Abstract of Receipts and Disbursements for the year 2007-08
(Rupees in crore)
Receipts Disbursements
2006-07 2007-08 2006-072007-08
Non-Plan Plan Total
Section-A: Revenue44245.4
7I. Revenue receipts
54142.55 41438.40 I. Revenue
expenditure-53983.5
723926.2
0-Tax revenue
28794.05 15313.98 General services 17112.3
81057.8
618170.2
4
15369.33 Social Services- 10619.31
8041.07
18660.38
6487.83 -Non-tax revenue 7064.13 6035.62 -Education, Sports, Art
and Culture 5784.71 820.12 6604.83
1853.92 -Health and Family Welfare 1653.08 785.98 2439.06
8866.00
-State’s share of Union Taxes
11183.64 2637.41
-Water Supply, Sanitation Housing and Urban Development,
357.88 3432.19 3790.07
1183.07 -Non-Plan grants 1167.60 71.44 -Information and
Broadcasting 72.41 52.40 124.81
2372.37-Grants for State Plan Schemes
3797.99 1870.96
-Welfare of Scheduled Castes, Scheduled Tribes and Other Backward Classes
1128.14 1397.54 2525.68
1410.00 -Grants for Central and Centrally sponsored Plan Schemes
2135.14
92.55 -Labour and Labour Welfare 93.02 66.33 159.35
2789.76 -Social Welfare and Nutrition 1510.06 1486.1
1 2996.17
17.67 -Others 20.01 0.40 20.41
10510.27 Economic Services- 12102.45
4801.66
16904.11
1438.12 -Agriculture and Allied Activities 892.00 1182.6
8 2074.68
2445.95 -Rural Development 1264.31 1736.23 3000.54
3176.56 -Irrigation and Flood Control 3516.03 1142.6
0 4658.63
1601.12 -Energy 4577.66 21.08 4598.74232.11 -Industry and Minerals 179.94 343.42 523.36
1134.25 -Transport 1522.27 5.00 1527.27
7.23- Environment, Science, and Technology
1.59 7.83 9.42
474.93 -General Economic Services 148.64 362.82 511.46
244.82 Grants-in-aid and Contributions 248.83 --- 248.83
II. Revenue deficit carried over to Section B
--- 2807.08II. Revenue Surplus carried over to Section B
185

Audit Report (Civil) for the year ended 31 March 2008
* Finance Accounts figures modified to adjust misclassification of grants-in-aid of Rs 321.73 crore to local bodies
Section-B: Others
3407.61
III. Opening Cash balance including Permanent Advances and Cash Balance Investment
4906.35 --III. Opening Overdraft from RBI
1889.32
IV. Miscellaneous Capital receipts
6557.71
9904.00* IV. Capital Outlay- 12773.9
4344.22 General Services- 0.72 35.06 35.78163.82 Social Services- 0.42 283.47 283.89
77.88 -Education, Sports, Art and Culture --- 126.24 126.24
6.77 -Health and Family Welfare 0.03 43.13 43.16
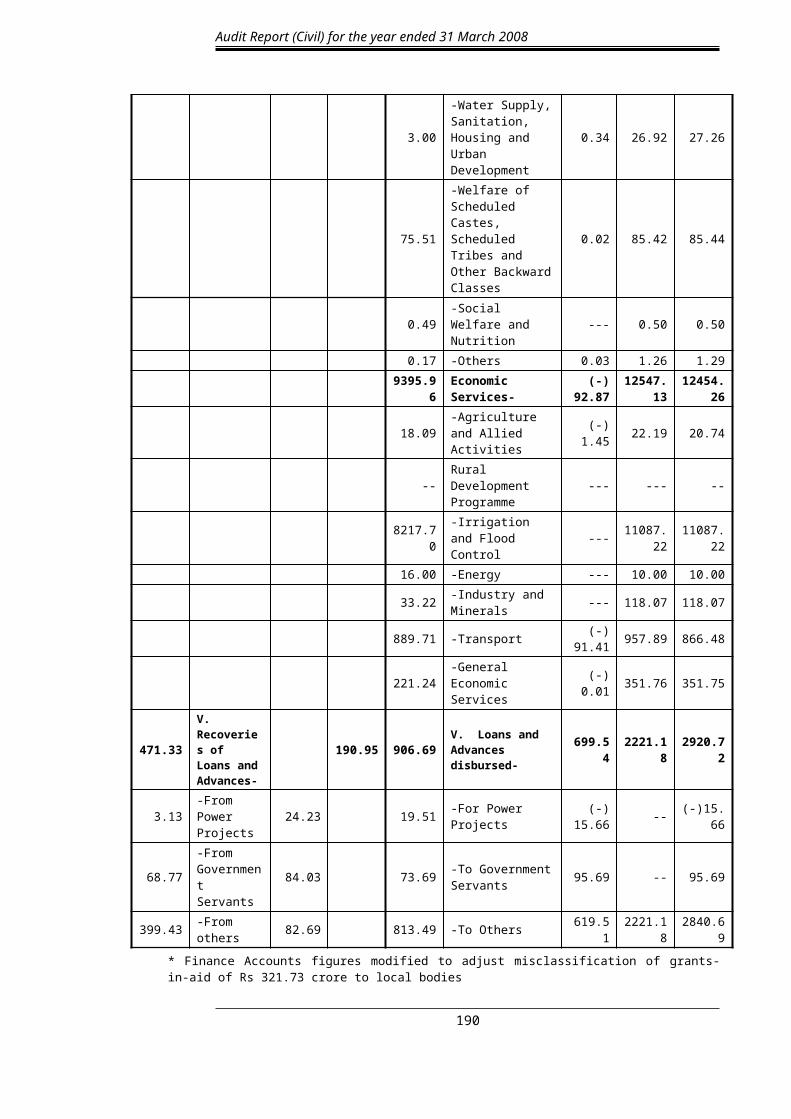
3.00
-Water Supply, Sanitation, Housing and Urban Development
0.34 26.92 27.26
75.51
-Welfare of Scheduled Castes, Scheduled Tribes and Other Backward Classes
0.02 85.42 85.44
0.49 -Social Welfare and Nutrition --- 0.50 0.50
0.17 -Others 0.03 1.26 1.29
9395.96 Economic Services- (-) 92.87
12547.13
12454.26
18.09 -Agriculture and Allied Activities (-) 1.45 22.19 20.74
-- Rural Development Programme --- --- --
8217.70 -Irrigation and Flood Control --- 11087.2
211087.2
216.00 -Energy --- 10.00 10.00
33.22 -Industry and Minerals --- 118.07 118.07
889.71 -Transport (-) 91.41 957.89 866.48
221.24 -General Economic Services (-) 0.01 351.76 351.75
471.33V. Recoveries of Loans and Advances-
190.95 906.69 V. Loans and Advances disbursed- 699.54 2221.18 2920.72
3.13 -From Power Projects 24.23 19.51 -For Power Projects (-)
15.66 -- (-)15.66
68.77-From Government Servants
84.03 73.69 -To Government Servants 95.69 -- 95.69
399.43 -From others 82.69 813.49 -To Others 619.51 2221.18 2840.69
* Finance Accounts figures modified to adjust misclassification of grants-in-aid of Rs 321.73 crore to local bodies
186

Appendices
2807.08VI. Revenue surplus brought down
158.99 385.84VI. Revenue deficit brought down
---
4550.22 VII. Public debt receipts- 11132.44 4252.72 VII. Repayment
of Public Debt- 4993.50
4235.65
-Internal debt other than Ways and Means Advances and Overdraft
10223.45 3062.53
-Internal debt other than Ways and Means Advances and Overdraft
4041.07
- Net transactions of Ways and Means Advances including Overdraft
-- --
-Net transaction of Ways and Means Advances including Overdraft
---
314.57
-Loans and Advances from Central Government
908.99 1190.19
-Repayment of Loans and Advances to Central Government
952.43
….
VIII. Appropriation to Contingency Fund
--
VIII. Appropriation to Contingency Fund
---
0.85
IX. Amount recouped to Contingency Fund
0.36 0.33
IX. Expenditure from Contingency Fund
0.93
51059.57 X. Public Account receipts- 61380.37 44215.88
X. Public Account disbursements-
55126.09
5934.20-Small Savings and Provident Funds
2369.43 1217.82-Small Savings and Provident Funds
1429.09
1022.93 -Reserve funds 1199.67 650.53 -Reserve Funds 375.92
9594.22 -Suspense and Miscellaneous
10680.46 9846.64 -Suspense and
Miscellaneous10549.6
2
11685.20 -Remittances 17077.62 11719.01 -Remittances 16134.3
0
22823.22 -Deposits and Advances
30053.19 20781.88 -Deposits and
Advances26637.1
6
--
XI. Closing Overdraft from Reserve Bank of India
-- --
4906.35 XI. Closing Cash Balance - 8511.99
542.40Cash in Treasuries and Local Remittances
5.39
(-) 28760.58Deposits with Reserve Bank and other Banks
(-) 211.28
91.64
Departmental cash balance including permanent advances
2.29
177572.33
Cash balance investment and investment of earmarked funds
8715.59
187

Audit Report (Civil) for the year ended 31 March 2008
108431.45 Total 138469.72 108431.45 Total 138469.72
188

Appendices
Appendix 1.6(Reference to paragraphs 1.2 and 1.3 page 3 and 6)
Sources and Application of Funds
(Rupees in crore)2006-07 Sources 2007-0844245.47 1. Revenue receipts 54142.551889.32 2. Miscellaneous Capital Receipts 6557.71471.33* 3. Recoveries of Loans and Advances 190.95297.50 4. Increase in Public Debt 6138.94
6843.69 5. Net receipts from Public Account 6254.284716.38 Net effect of Small Savings 940.342041.34 Net effect of Deposits and Advances 3416.03372.20 Net effect of Reserve Funds 823.75
(-) 252.42 Net effect of Suspense and Miscellaneous transactions 130.8433.81 Net effect of Remittance transactions 943.320.52 6. Net effect of Contingency Fund transactions (-) 0.57
-- 7. Decrease in closing cash balance ---53747.83 Total 73283.86
Application41438.40 1. Revenue expenditure 53983.57
906.69 2. Lending for development and other purposes 2920.729904.00 3. Capital expenditure 12773.93
-- 4. Net effect of Contingency Fund transactions ----- 5 Decrease in Public Debt ---
1498.74 6. Increase in closing cash balance 3605.6453747.83 Total 73283.86
* lower rounding adopted
Explanatory Notes to Appendix 1.3 and 1.4
The abridged accounts in the foregoing statements have to be read with comments and explanations in the Finance Accounts.
1. Government accounts being mainly on cash basis, the deficit on government account, as shown in Appendix 1.3 indicates the position on cash basis, as opposed to accrual basis in commercial accounting. Consequently, items payable or receivable or items like depreciation or variation in stock figures etc., do not figure in the accounts.
2. Suspense and Miscellaneous balances include cheques issued but not paid, inter-departmental and inter-Government payments and others awaiting settlement.
3. There was a net difference of Rs 103.06 crore (credit) between the figures reflected in the accounts (Rs 287.60 crore – credit) and that intimated by the Reserve Bank of India (Rs 174.55 crore – debit) under the head deposits with Reserve Bank. The difference was under reconciliation.
189
Audit Report (Civil) for the year ended 31 March 2008
Appendix 1.7(Reference to paragraph 1.5.6 page 19)
Accounts due by autonomous bodies covered under Sections 19(2), 19(3) and 20(1) of the Act
S. No.
Name of the body Period for which accounts due
Section 19(2)
1. AP Legal Services Authority 2006-07, 2007-08 (2)
2. District Legal Services Authority 2006-07, 2007-08 (2)
3. High Court Legal Services Authority (23) 2006-07, 2007-08 ( 23 units X 2 yrs = 46)
Section 19(3)
4. Andhra Pradesh Khadi and Village Industries Board (APKVIB), Hyderabad 2006-07, 2007-08 (2)
5. Andhra Pradesh Vaidya Vidhana Parishad (APVVP) 2001-02 to 2007-08 (7)
Section 20(1)
6. Integrated Tribal Development Authority (ITDA), Srisailam 2003-04 to 2007-08 (5)
7. ITDA, Bhadrachalam 2004-05 to 2007-08 (4)
8. ITDA, Parvathipuram 2007-08
9. ITDA, Paderu 2005-06 to 2007-08 (3)
10. ITDA, K.R.Puram 2002-03 to 2007-08 (6)
11. ITDA, Utnoor 2007-08
12. ITDA, Eturunagaram 2002-03 to 2007-08 (6)
13. ITDA, Seethampeta 2005-06 to 2007-08 (3)
14. ITDA, Rampachodavaram 2000-01 to 2007-08 (8)
15. Environment Protection, Training and Research Institute, Hyderabad 2007-08
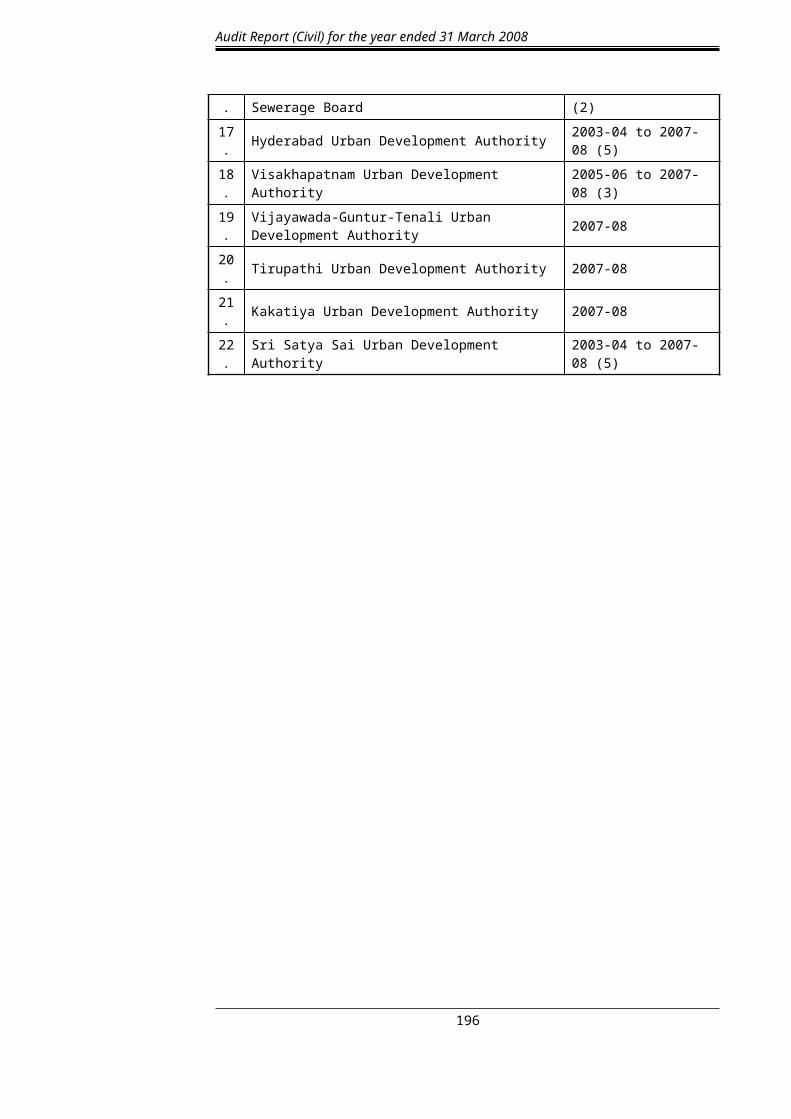
16. Hyderabad Metro Water Supply & Sewerage Board 2006-07, 2007-08 (2)
17. Hyderabad Urban Development Authority 2003-04 to 2007-08 (5)
18. Visakhapatnam Urban Development Authority 2005-06 to 2007-08 (3)
19. Vijayawada-Guntur-Tenali Urban Development Authority 2007-08
20. Tirupathi Urban Development Authority 2007-08
21. Kakatiya Urban Development Authority 2007-08
22. Sri Satya Sai Urban Development Authority 2003-04 to 2007-08 (5)
190

Appendices
Appendix 1.8(Reference to paragraph 1.6 page 20)
Cases of Misappropriation reported to Audit(Rupees in lakh)
S. No. Department
Up to2003-04 2004-05 2005-06 2006-07 2007-08 Total
N A N A N A N A N A N A
1. Agriculture and Cooperation
25 83.33 - - 25 83.33
2. Animal Husbandry and Fisheries
4 2.63 - - 4 2.63
3. Education 32 86.23 2 5.30 1 20.66 35 112.19
4. Environment, Forests, Science and Technology
8 55.92 2 46.46 10 102.38
5. Finance and Planning (Treasuries and Accounts)
5 186.03 1 1.98 1 0.30 7 188.31
6. Health, Medical and Family Welfare
50 148.56 1 0.50 4 25.11 2 11.03 57 185.20
7. Home 11 11.30 1 4.34 1 0.97 1 3.32 14 19.93
8. Industries and Commerce
- - - - 1 ANF 1 ANF
9. Labour, Employment Training and Factories
4 5.02 - - 4 5.02
10. Law 1 0.49 3 0.46 2 1.26 5 40.84 11 43.05
11. Legislature 1 7.80 - - 1 7.80
12. Municipal Administration and Urban Development
1 4.35 - - 1 4.35
13. Panchayat Raj and Rural Development
19 124.77 2 71.75 1 0.36 22 196.88
14. Revenue 262 99.33 - - 1 0.40 263 99.73
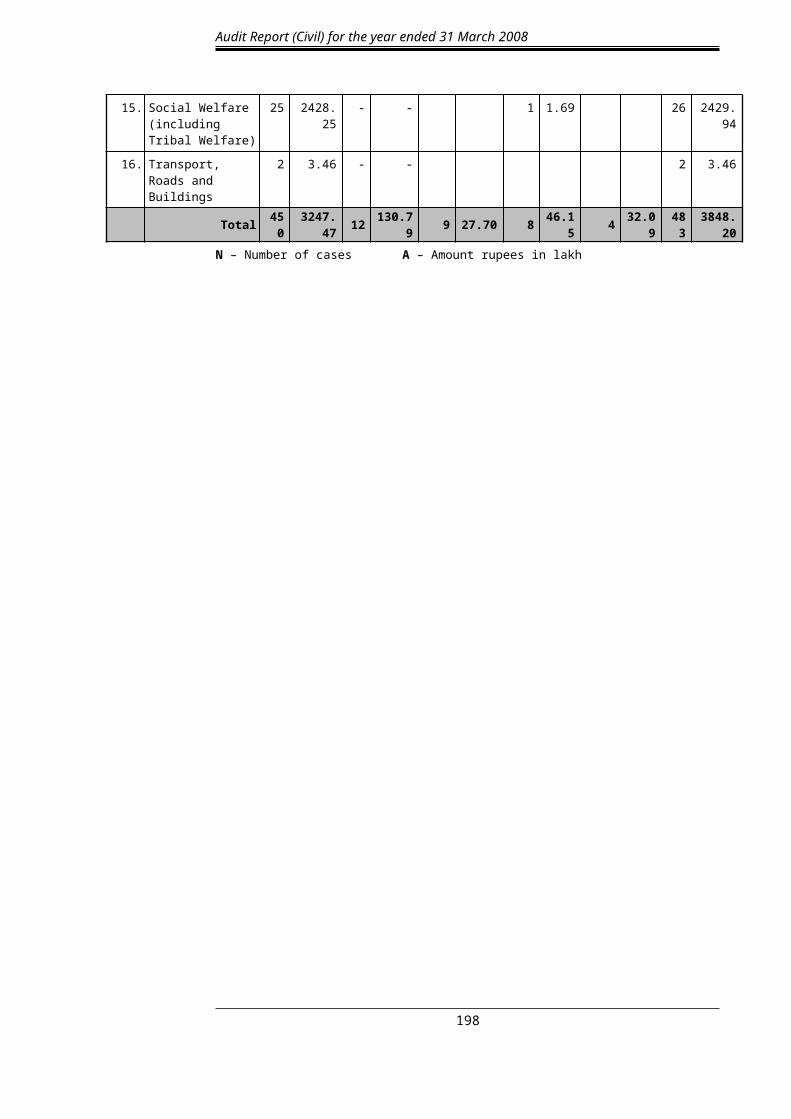
15. Social Welfare (including Tribal Welfare)
25 2428.25 - - 1 1.69 26 2429.94
16. Transport, Roads and Buildings
2 3.46 - - 2 3.46
Total 450 3247.47 12 130.79 9 27.70 8 46.15 4 32.09 483 3848.20
N – Number of cases A – Amount rupees in lakh
191

Audit Report (Civil) for the year ended 31 March 2008
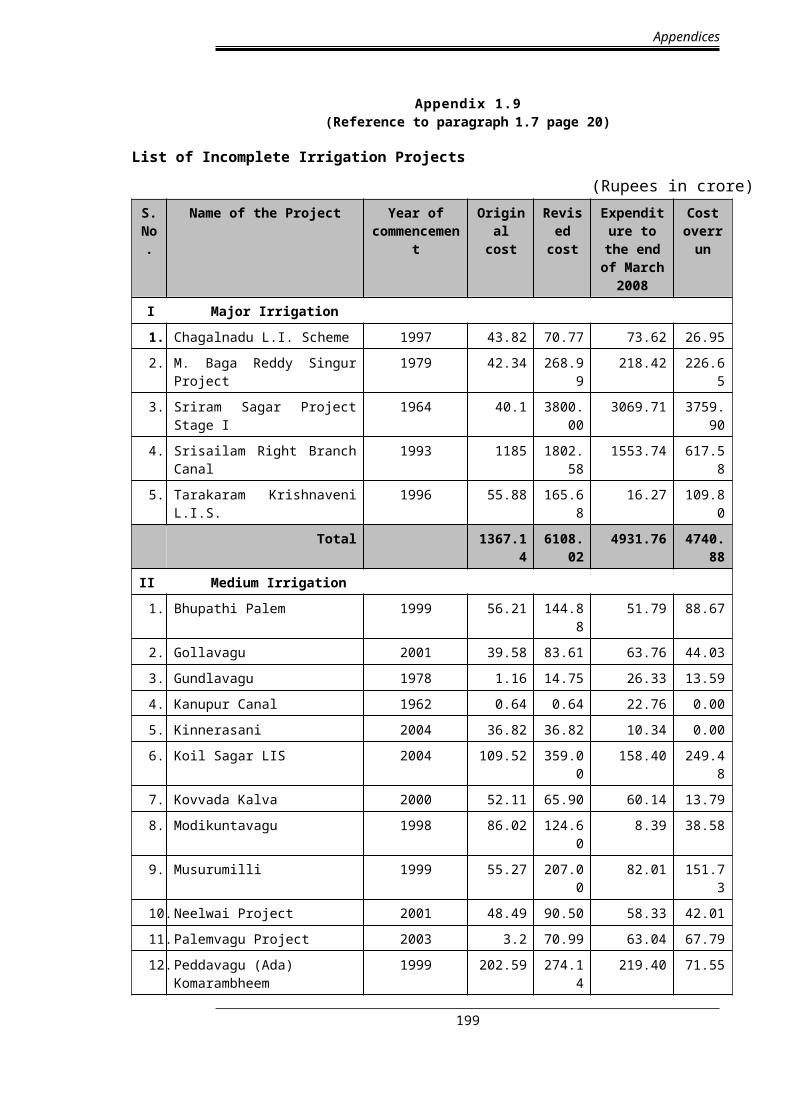
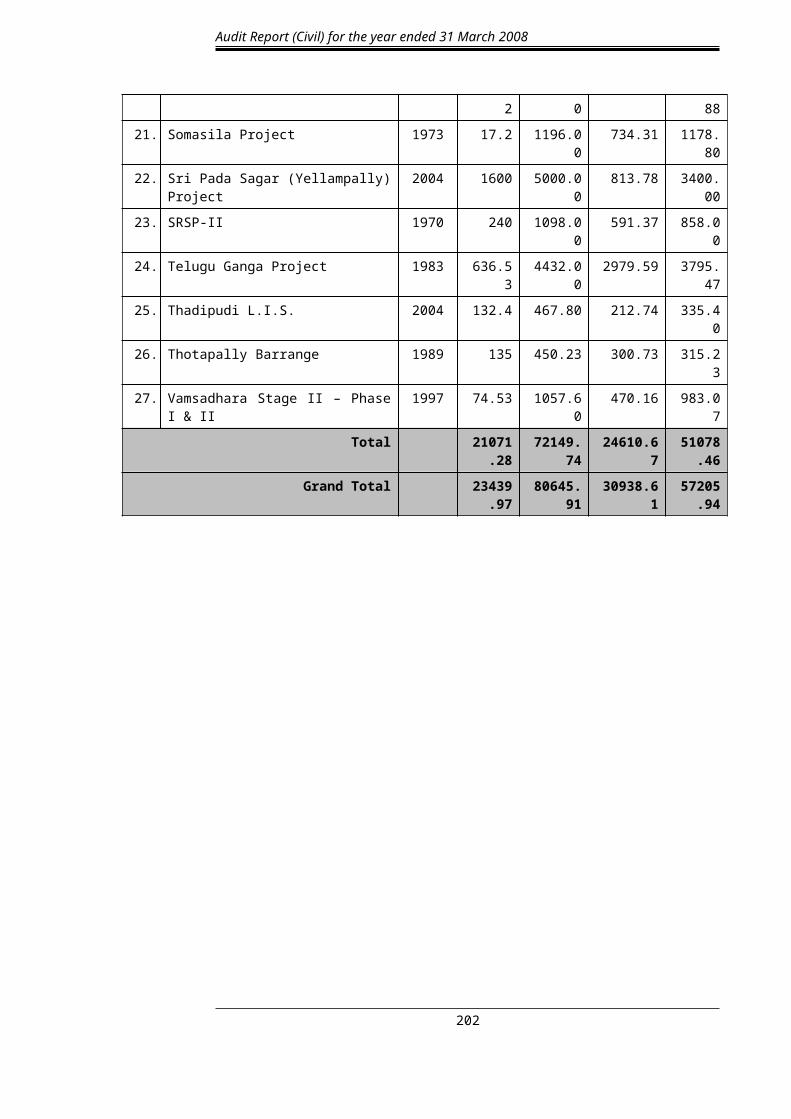
Appendix 1.9(Reference to paragraph 1.7 page 20)
List of Incomplete Irrigation Projects
(Rupees in crore)S.
No.Name of the Project Year of
commencementOriginal
costRevised cost
Expenditure to the end of March
2008
Cost overru
n
I Major Irrigation
1. Chagalnadu L.I. Scheme 1997 43.82 70.77 73.62 26.95
2. M. Baga Reddy Singur Project 1979 42.34 268.99 218.42 226.65
3. Sriram Sagar Project Stage I 1964 40.1 3800.00
3069.71 3759.90
4. Srisailam Right Branch Canal 1993 1185 1802.58
1553.74 617.58
5. Tarakaram Krishnaveni L.I.S. 1996 55.88 165.68 16.27 109.80
Total 1367.14 6108.02
4931.76 4740.88
II Medium Irrigation
1. Bhupathi Palem 1999 56.21 144.88 51.79 88.67
2. Gollavagu 2001 39.58 83.61 63.76 44.03
3. Gundlavagu 1978 1.16 14.75 26.33 13.59
4. Kanupur Canal 1962 0.64 0.64 22.76 0.00
5. Kinnerasani 2004 36.82 36.82 10.34 0.00
6. Koil Sagar LIS 2004 109.52 359.00 158.40 249.48
7. Kovvada Kalva 2000 52.11 65.90 60.14 13.79
8. Modikuntavagu 1998 86.02 124.60 8.39 38.58
9. Musurumilli 1999 55.27 207.00 82.01 151.73
10. Neelwai Project 2001 48.49 90.50 58.33 42.01
11. Palemvagu Project 2003 3.2 70.99 63.04 67.79
12. Peddavagu (Ada) Komarambheem
1999 202.59 274.14 219.40 71.55
13. Raiwada 1977 8.88 8.88 2.52 0.00
14. Ralivagu 2001 26.71 33.30 43.32 6.59
15. Sangambanda Project 1997 69.35 141.81 68.86 72.46
16. Surampalem 1990 23.19 70.06 50.62 46.87
17. Swarnamukhi Barrage 2004 22 52.04 48.33 30.04
18. Tharakaram Thirtha Sagaram 1999 109.7 220.04 38.15 110.34
19. Veligallu 1993 4.12 208.72 163.19 204.60
20. Yerrakalva 10.41 124.95 109.20 114.54
21. Yerravagu 2000 35.58 55.52 47.30 19.94
192

Appendices
Total 1001.55 2388.15
1396.18 1386.60
193

Audit Report (Civil) for the year ended 31 March 2008
III Other Projects
1. Ali Sagar L.I.S 2002 107.87 261.30 213.22 153.43
2. AMRP including tunnel (SLBC) including Udayasamudram
1985 353 5135.03 1639.03 4782.03
3. Chitravathi Balancing Reservoir (P.B.C) 2.78 2300.13 1090.93 2297.35
4. FFC from SRSP 1997 859 3736.11 1770.72 2877.11
5. G.N.S.S. 1993 1408.41 8100.00 2194.20 6691.59
6. Gutpa L.I.S 2002 145 204.00 132.13 59.00
7. Guru Raghavendra L.I.S. 1998 136.35 136.35 122.96 0.00
8. H.N.S.S. Phase I & II 1993 1478.74 6850.00 1829.28 5371.26
9. Indira Sagar (Polavaram) Project 1996 8916 10206.00 1640.42 1290.00
10. J. Chokka Rao (Godavari) L.I.S 2003 930 7000.00 1948.22 6070.00
11. Janjhavati 1975 15.51 124.00 103.24 108.49
12. Jawahar (Nettampudi) L.I.S. 1995 68.7 1428.00 721.50 1359.30
13. K.L. Rao Sagar (Pulichintala) 1989 146.02 681.60 485.26 535.58
14. Kandula Obula Reddy Project (Gundlakamma)
2003 275 520.39 414.29 245.39
15. Lendi Project 1995 177.61 432.40 52.97 254.79
16. Mahatma Gandhi (Kalwakurthy) LIS 1994 1200 2990.00 1392.46 1790.00
17. Pennar Ahobilam Stage-II (TBP H.L.C-II)
1967 9.15 536.00 598.80 526.85
18. Pula Subbaiah Veligonda Project 1993 978.96 5040.00 949.46 4061.04
19. Pushkaram L.I.S 2004 280 608.40 358.49 328.40
20. Rajiv (Bhima) L.I.S 1993 747.52 2158.40 850.41 1410.88
21. Somasila Project 1973 17.2 1196.00 734.31 1178.80
22. Sri Pada Sagar (Yellampally) Project 2004 1600 5000.00 813.78 3400.00
23. SRSP-II 1970 240 1098.00 591.37 858.00
24. Telugu Ganga Project 1983 636.53 4432.00 2979.59 3795.47
25. Thadipudi L.I.S. 2004 132.4 467.80 212.74 335.40
26. Thotapally Barrange 1989 135 450.23 300.73 315.23
27. Vamsadhara Stage II – Phase I & II 1997 74.53 1057.60 470.16 983.07
Total 21071.28
72149.74 24610.67 51078.46
Grand Total 23439.97
80645.91 30938.61 57205.94
194

Appendices
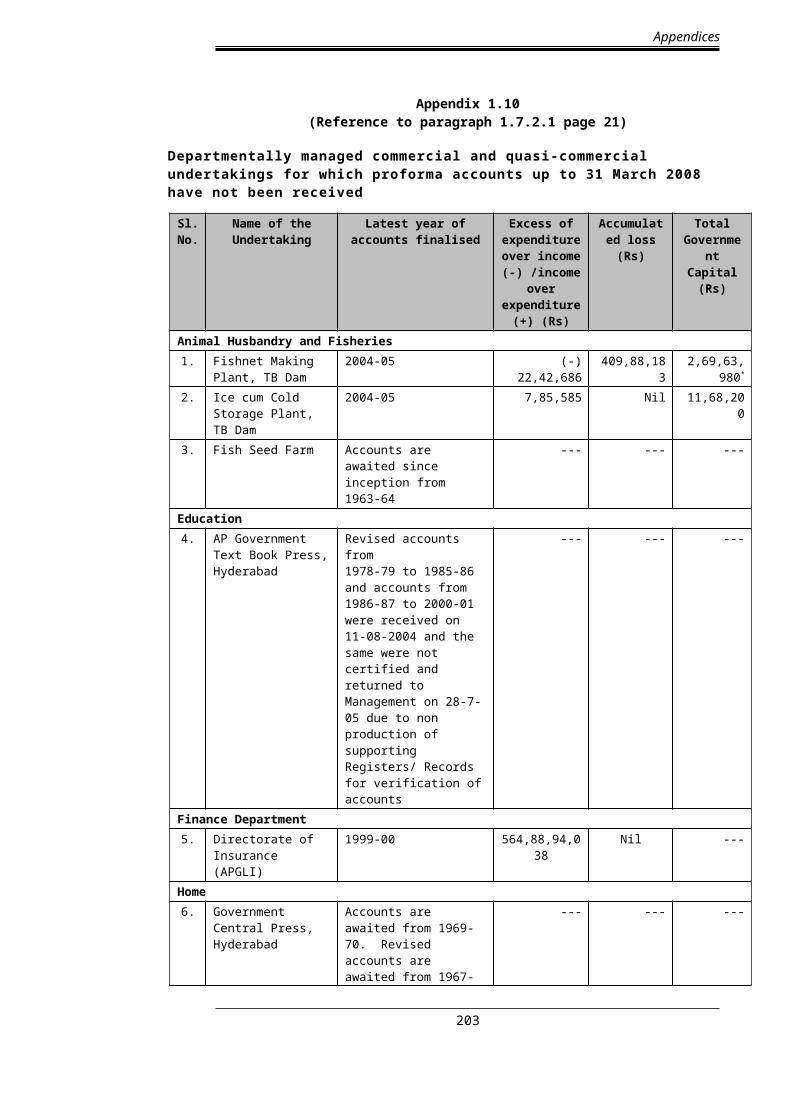
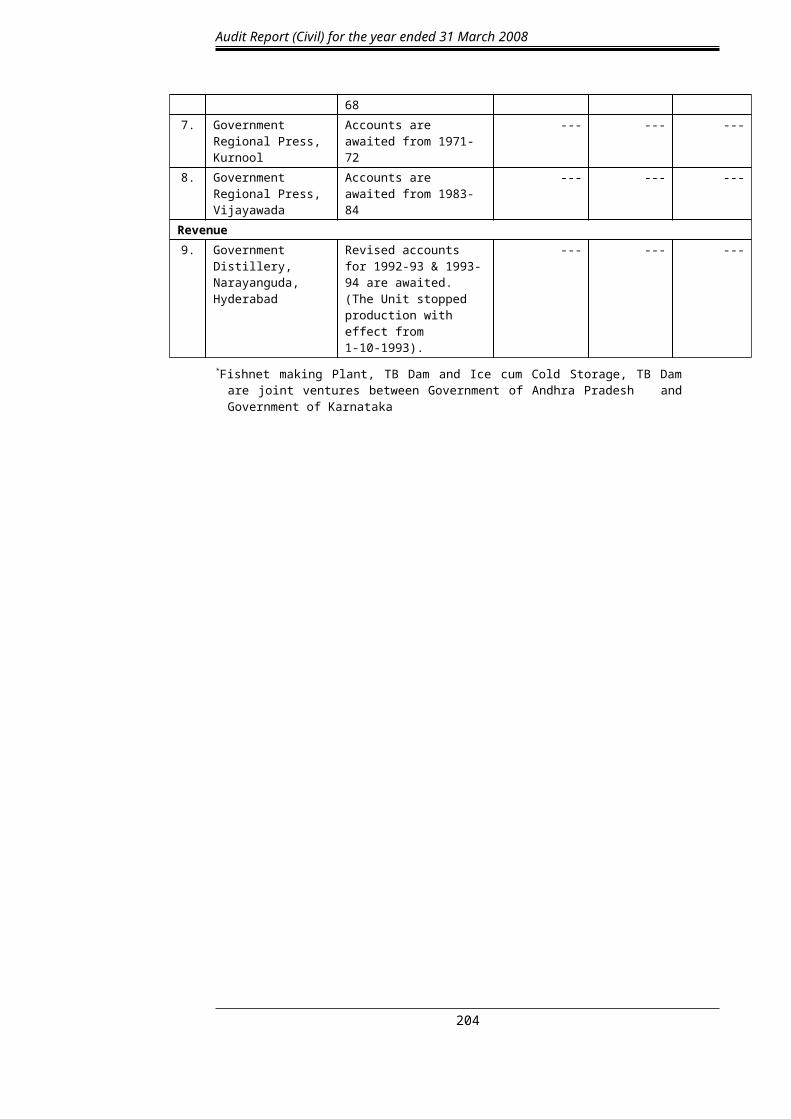
Appendix 1.10(Reference to paragraph 1.7.2.1 page 21)
Departmentally managed commercial and quasi-commercial undertakings for which proforma accounts up to 31 March 2008 have not been received
Sl. No.
Name of the Undertaking
Latest year of accounts finalised
Excess of expenditure over income
(-) /income over expenditure (+)
(Rs)
Accumulated loss (Rs)
Total Government Capital (Rs)
Animal Husbandry and Fisheries1. Fishnet Making Plant,
TB Dam2004-05 (-) 22,42,686 409,88,183 2,69,63,980*
2. Ice cum Cold Storage Plant, TB Dam
2004-05 7,85,585 Nil 11,68,200
3. Fish Seed Farm Accounts are awaited since inception from 1963-64
--- --- ---
Education4. AP Government Text
Book Press, HyderabadRevised accounts from 1978-79 to 1985-86 and accounts from 1986-87 to 2000-01 were received on 11-08-2004 and the same were not certified and returned to Management on 28-7-05 due to non production of supporting Registers/ Records for verification of accounts
--- --- ---
Finance Department5. Directorate of Insurance
(APGLI)1999-00 564,88,94,038 Nil ---
Home6. Government Central
Press, HyderabadAccounts are awaited from 1969-70. Revised accounts are awaited from 1967-68
--- --- ---
7. Government Regional Press, Kurnool
Accounts are awaited from 1971-72
--- --- ---
8. Government Regional Press, Vijayawada
Accounts are awaited from 1983-84
--- --- ---
Revenue9. Government Distillery,
Narayanguda, Hyderabad
Revised accounts for 1992-93 & 1993-94 are awaited. (The Unit stopped production with effect from 1-10-1993).
--- --- ---
*Fishnet making Plant, TB Dam and Ice cum Cold Storage, TB Dam are joint ventures between Government of Andhra Pradesh and Government of Karnataka
195
Audit Report (Civil) for the year ended 31 March 2008
Appendix 2.1(Reference to paragraph 2.3.1 page 35)
Areas in which major savings occurred
Grant No./ Major Head
Areas in which major savings occurred Savings (Rupees in
crore)IX Fiscal Administration, Planning, Surveys and Statistics (Revenue Voted)
2052 Secretariat General Services 17.96
(Revenue Charged)
2049 Interest Payments 1039.91
(Public Debt)
6003 Internal Debt of the State Government 2894.76
XII School Education (Revenue Voted)
2202 General Education 1056.72
(Capital Voted)
4202 Capital outlay on Education, Sports, Art and Culture
111.93
XVIII Housing (Revenue Voted)
2216 Housing 241.77
XXXI Panchayat Raj (Revenue Voted)
2515 Other Rural Development Programmes 435.63
XXXIII Major and Medium Irrigation (Revenue Voted)
2701 Major and Medium Irrigation 709.51
196

Appendices
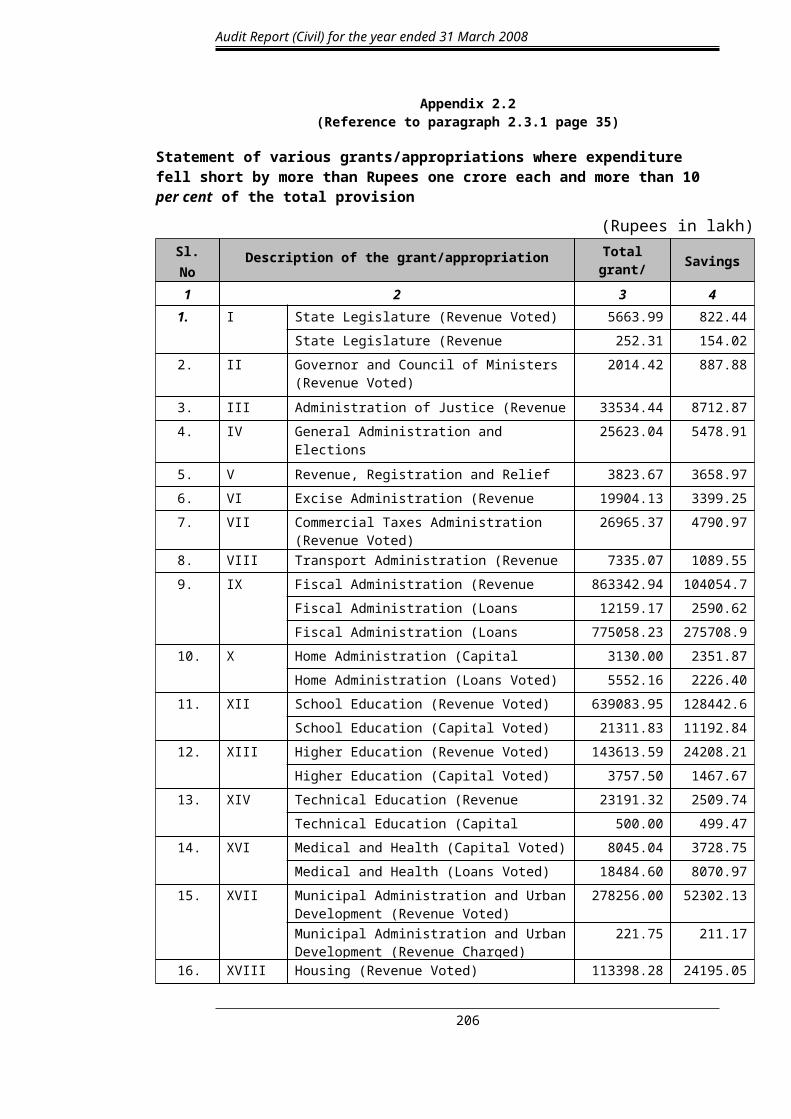
Appendix 2.2(Reference to paragraph 2.3.1 page 35)
Statement of various grants/appropriations where expenditure fell short by more than Rupees one crore each and more than 10 per cent of the total provision
(Rupees in lakh)Sl.No
Description of the grant/appropriation Total grant/ appropriation Savings
1 2 3 41. I State Legislature (Revenue Voted) 5663.99 822.44
State Legislature (Revenue Charged) 252.31 154.02
2. II Governor and Council of Ministers (Revenue Voted)
2014.42 887.88
3. III Administration of Justice (Revenue Voted) 33534.44 8712.87
4. IV General Administration and Elections (Revenue Voted)
25623.04 5478.91
5. V Revenue, Registration and Relief (Capital Voted) 3823.67 3658.97
6. VI Excise Administration (Revenue Voted) 19904.13 3399.25
7. VII Commercial Taxes Administration (Revenue Voted)
26965.37 4790.97
8. VIII Transport Administration (Revenue Voted) 7335.07 1089.55
9. IX Fiscal Administration (Revenue Charged) 863342.94 104054.74
Fiscal Administration (Loans Voted) 12159.17 2590.62
Fiscal Administration (Loans Charged) 775058.23 275708.97
10. X Home Administration (Capital Voted) 3130.00 2351.87
Home Administration (Loans Voted) 5552.16 2226.40
11. XII School Education (Revenue Voted) 639083.95 128442.62
School Education (Capital Voted) 21311.83 11192.84
12. XIII Higher Education (Revenue Voted) 143613.59 24208.21
Higher Education (Capital Voted) 3757.50 1467.67
13. XIV Technical Education (Revenue Voted) 23191.32 2509.74
Technical Education (Capital Voted) 500.00 499.47
14. XVI Medical and Health (Capital Voted) 8045.04 3728.75
Medical and Health (Loans Voted) 18484.60 8070.97
15. XVII Municipal Administration and Urban Development (Revenue Voted)
278256.00 52302.13
Municipal Administration and Urban Development (Revenue Charged)
221.75 211.17
16. XVIII Housing (Revenue Voted) 113398.28 24195.05
Housing (Loans Voted) 435000.00 203443.45
17. XIX Information and Public Relations (Revenue Voted) 12706.15 226.72
197
Audit Report (Civil) for the year ended 31 March 2008
18. XX Labour and Employment (Capital Voted) 837.05 710.50
19. XXI Social Welfare (Revenue Voted) 163573.91 22700.14
Social Welfare (Capital Voted) 15163.00 10938.61
20. XXII Tribal Welfare (Revenue Voted) 61631.65 8075.52
Tribal Welfare (Capital Voted) 14651.00 12619.09
21. XXIII Backward Classes Welfare (Revenue Voted) 54313.48 5877.34
Backward Classes Welfare (Capital Voted) 1969.00 684.54
22. XXV Women Child and Disabled Welfare (Revenue Voted)
104295.52 21157.52
Women Child and Disabled Welfare (Capital Voted)
294.66 244.86
23. XXVI Administration of Religious Endowments (Revenue Voted)
2799.94 769.42
24. XXVII Agriculture (Revenue Voted) 141046.39 14132.84
Agriculture (Loans Voted) 2400.00 2400.00
25. XXVIII Animal Husbandry and Fisheries (Revenue Voted) 55354.29 8737.68
Animal Husbandry and Fisheries (Capital Voted) 3956.47 2148.54
Animal Husbandry and Fisheries (Loans Voted) 2843.76 1159.42
26. XXIX Forest, Science, Technology and Environment (Revenue Voted)
40873.01 9863.24
Forest, Science, Technology and Environment (Capital Voted)
562.00 133.33
27. XXX Co-operation (Revenue Voted) 16652.00 1922.90
Co-operation (Capital Voted) 2069.90 2089.21
Co-operation (Loans Voted) 4240.63 308.50
28. XXXI Panchayat Raj (Revenue Voted) 369166.67 66976.93
Panchayat Raj (Revenue Charged) 25.67 14.59
29. XXXIII Major and Medium Irrigation (Revenue Voted) 468700.48 79272.08
Major and Medium Irrigation (Revenue Charged) 3039.29 595.68
Major and Medium Irrigation (Capital Charged) 11076.82 6904.41
30. XXXIV Minor Irrigation (Capital Voted) 71373.86 10596.30
31. XXXV Energy (Loans Voted) 19896.97 18330.60
32. XXXVI Industries and Commerce (Revenue Voted) 62313.12 16540.25
Industries and Commerce (Capital Voted) 12451.72 647.50
33. XXXVII Tourism, Art and Culture (Revenue Voted) 13052.65 7413.25
Tourism, Art and Culture (Capital Voted) 600.00 480.62
34. XL Public Enterprises (Loans Voted) 1500.00 829.52
Total 5204653.86 1211701.18
198
Appendices
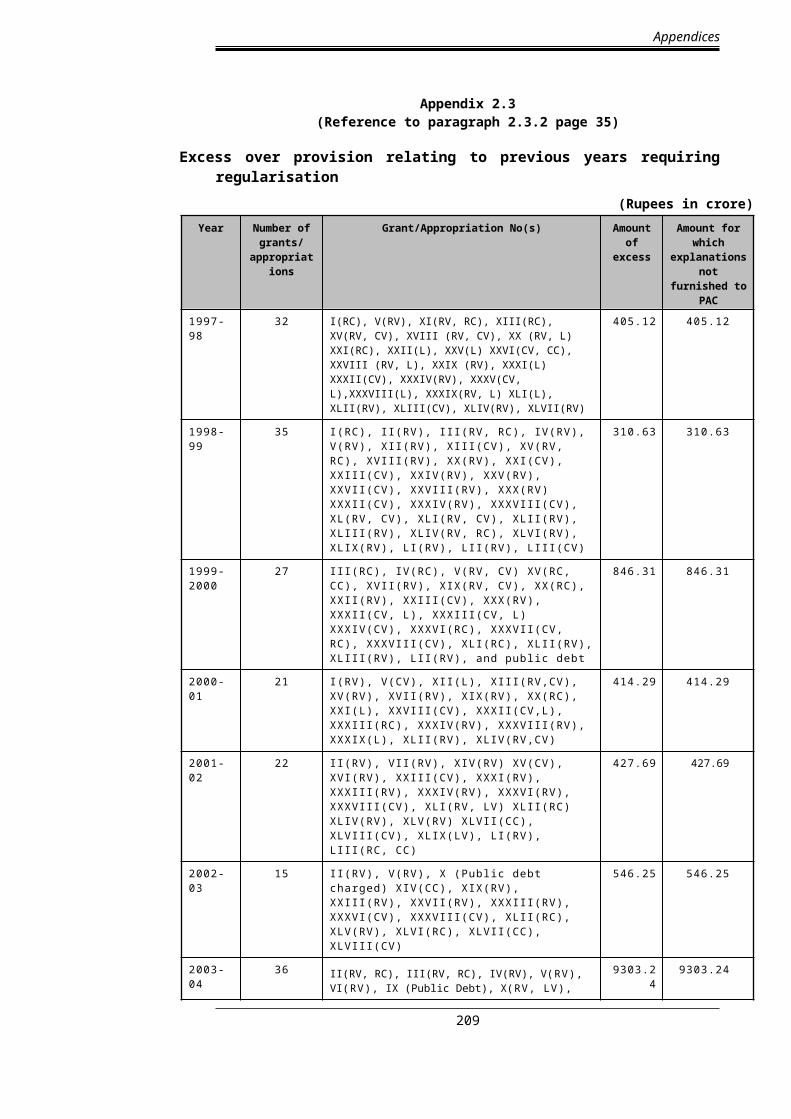
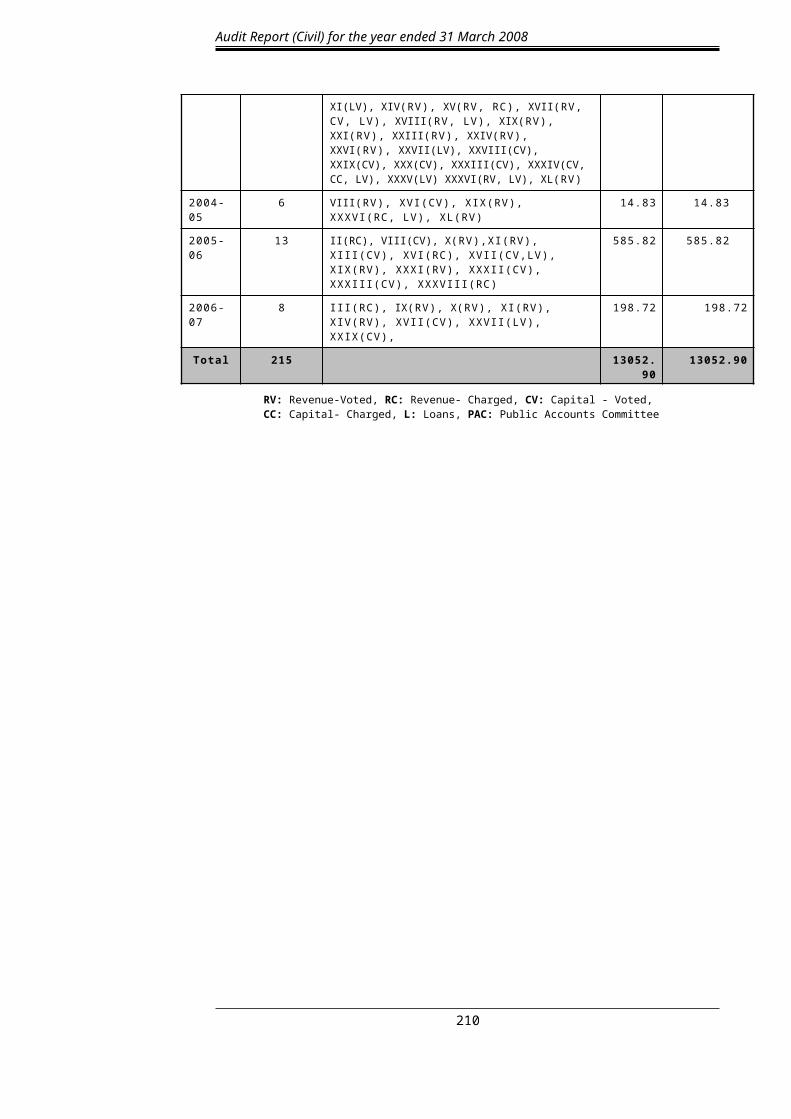
Appendix 2.3(Reference to paragraph 2.3.2 page 35)
Excess over provision relating to previous years requiring regularisation(Rupees in crore)
Year Number of grants/
appropriations
Grant/Appropriation No(s) Amount of excess
Amount for which
explanations not furnished to
PAC
1997-98 32 I(RC), V(RV), XI(RV, RC), XIII(RC), XV(RV, CV), XVIII (RV, CV), XX (RV, L) XXI(RC), XXII(L), XXV(L) XXVI(CV, CC), XXVIII (RV, L), XXIX (RV), XXXI(L) XXXII(CV), XXXIV(RV), XXXV(CV, L),XXXVIII(L), XXXIX(RV, L) XLI(L), XLII(RV), XLIII(CV), XLIV(RV), XLVII(RV)
405.12 405.12
1998-99 35 I(RC), II(RV), III(RV, RC), IV(RV), V(RV), XII(RV), XIII(CV), XV(RV, RC), XVIII(RV), XX(RV), XXI(CV), XXIII(CV), XXIV(RV), XXV(RV), XXVII(CV), XXVIII(RV), XXX(RV) XXXII(CV), XXXIV(RV), XXXVIII(CV), XL(RV, CV), XLI(RV, CV), XLII(RV), XLIII(RV), XLIV(RV, RC), XLVI(RV), XLIX(RV), LI(RV), LII(RV), LIII(CV)
310.63 310.63
1999-2000
27 III(RC), IV(RC), V(RV, CV) XV(RC, CC), XVII(RV), XIX(RV, CV), XX(RC), XXII(RV), XXIII(CV), XXX(RV), XXXII(CV, L), XXXIII(CV, L) XXXIV(CV), XXXVI(RC), XXXVII(CV, RC), XXXVIII(CV), XLI(RC), XLII(RV), XLIII(RV), LII(RV), and public debt
846.31 846.31
2000-01 21 I(RV), V(CV), XII(L), XIII(RV,CV), XV(RV), XVII(RV), XIX(RV), XX(RC), XXI(L), XXVIII(CV), XXXII(CV,L), XXXIII(RC), XXXIV(RV), XXXVIII(RV), XXXIX(L), XLII(RV), XLIV(RV,CV)
414.29 414.29
2001-02 22 II(RV), VII(RV), XIV(RV) XV(CV), XVI(RV), XXIII(CV), XXXI(RV), XXXIII(RV), XXXIV(RV), XXXVI(RV), XXXVIII(CV), XLI(RV, LV) XLII(RC) XLIV(RV), XLV(RV) XLVII(CC), XLVIII(CV), XLIX(LV), LI(RV), LIII(RC, CC)
427.69 427.69
2002-03 15 II(RV), V(RV), X (Public debt charged) XIV(CC), XIX(RV), XXIII(RV), XXVII(RV), XXXIII(RV), XXXVI(CV), XXXVIII(CV), XLII(RC), XLV(RV), XLVI(RC), XLVII(CC), XLVIII(CV)
546.25 546.25
2003-04 36 II(RV, RC), III(RV, RC), IV(RV), V(RV), VI(RV), IX (Public Debt), X(RV, LV), XI(LV), XIV(RV), XV(RV, RC), XVII(RV, CV, LV), XVIII(RV, LV), XIX(RV), XXI(RV), XXIII(RV), XXIV(RV), XXVI(RV), XXVII(LV), XXVIII(CV), XXIX(CV), XXX(CV), XXXIII(CV), XXXIV(CV, CC, LV), XXXV(LV) XXXVI(RV, LV), XL(RV)
9303.24 9303.24
2004-05 6 VIII(RV), XVI(CV), XIX(RV), XXXVI(RC, LV), XL(RV)
14.83 14.83
2005-06 13 II(RC), VIII(CV), X(RV),XI(RV), XIII(CV), XVI(RC), XVII(CV,LV), XIX(RV), XXXI(RV), XXXII(CV), XXXIII(CV), XXXVIII(RC)
585.82 585.82
2006-07 8 III(RC), IX(RV), X(RV), XI(RV), XIV(RV), XVII(CV), XXVII(LV), XXIX(CV),
198.72 198.72
Total 215 13052.90 13052.90
RV: Revenue-Voted, RC: Revenue- Charged, CV: Capital - Voted, CC: Capital- Charged, L: Loans, PAC: Public Accounts Committee
199

Audit Report (Civil) for the year ended 31 March 2008
Appendix 2.4(Reference to paragraph 2.3.2 page 35)
Excess over grants/appropriations(in Rupees)
S. No.
Number and name of the grant/appropriation Total grant or appropriation
Actual expenditure
Amount of excess
Voted Grants-Revenue
1. X Home Administration 2066,55,01,000 2148,93,41,968 82,38,40,968
2. XI Roads, Buildings and Ports 1351,19,51,000 1415,31,25,178 64,11,74,178
3. XXXII Rural Development 1976,76,02,000 1982,83,22,411 6,07,20,411
Capital
4. XVII Municipal Administration and Urban Development
1,02,51,000 136,56,431 34,05,431
5. XXXIII Major and Medium Irrigation 104,05,42,91,000 10442,90,70,248 37,47,79,248
6. XXXV Energy Nil 10,00,00,000 10,00,00,000
Loans
7. XXXVI Industries and Commerce 19,18,16,000 20,00,76,000 82,60,000
Total Voted Grants 15820,14,12,000 16021,35,92,236 201,21,80,236
Charged Appropriation – Revenue
8. II Governor and Council of Ministers 4,28,40,000 4,28,46,350 6,350
9. IV General Administration and Elections
11,85,25,000 11,92,63,339 7,38,339
10. XIV Technical Education Nil 1,06,100 1,06,100
Total Charged Appropriation 16,13,65,000 16,22,15,789 8,50,789
Grand Total 15836,27,77,000 16037,58,08,025 201,30,31,025
200

Appendices
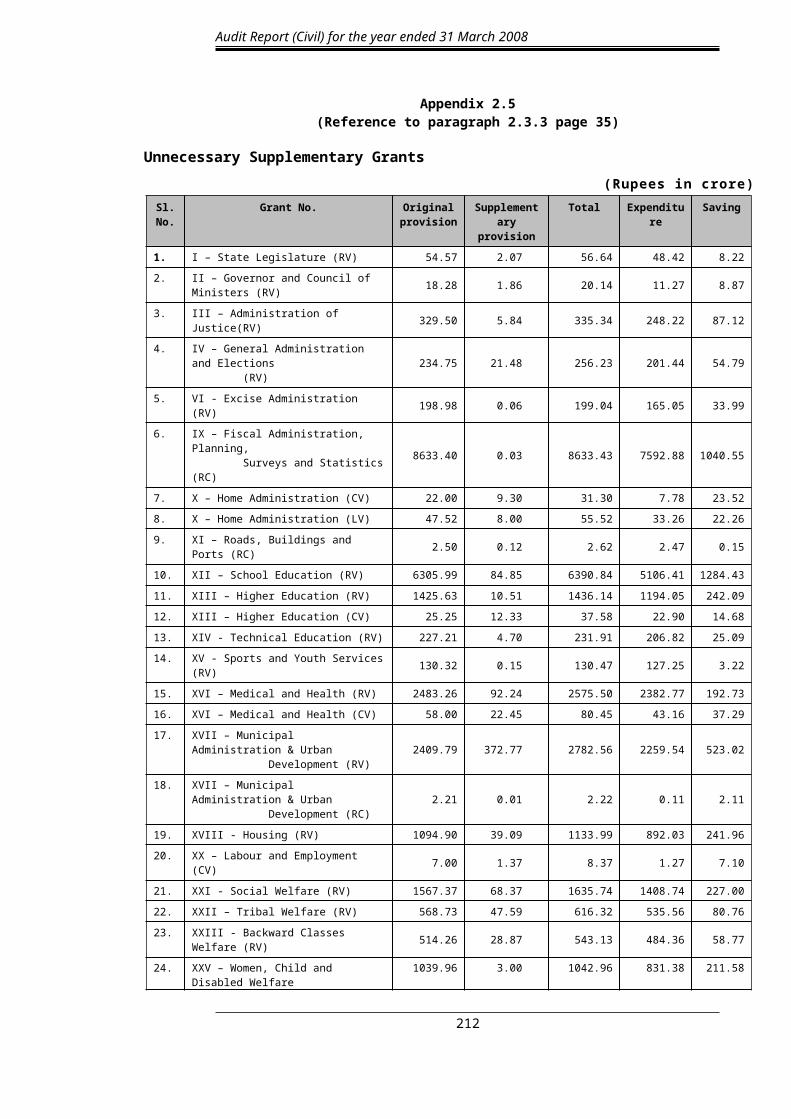
Appendix 2.5(Reference to paragraph 2.3.3 page 35)
Unnecessary Supplementary Grants(Rupees in crore)
Sl. No.
Grant No. Original provision
Supplementary provision
Total Expenditure Saving
1. I – State Legislature (RV) 54.57 2.07 56.64 48.42 8.22
2. II – Governor and Council of Ministers (RV) 18.28 1.86 20.14 11.27 8.87
3. III – Administration of Justice(RV) 329.50 5.84 335.34 248.22 87.12
4. IV – General Administration and Elections (RV) 234.75 21.48 256.23 201.44 54.79
5. VI - Excise Administration (RV) 198.98 0.06 199.04 165.05 33.99
6. IX – Fiscal Administration, Planning, Surveys and Statistics (RC) 8633.40 0.03 8633.43 7592.88 1040.55
7. X – Home Administration (CV) 22.00 9.30 31.30 7.78 23.52
8. X – Home Administration (LV) 47.52 8.00 55.52 33.26 22.26
9. XI – Roads, Buildings and Ports (RC) 2.50 0.12 2.62 2.47 0.15
10. XII – School Education (RV) 6305.99 84.85 6390.84 5106.41 1284.43
11. XIII – Higher Education (RV) 1425.63 10.51 1436.14 1194.05 242.09
12. XIII – Higher Education (CV) 25.25 12.33 37.58 22.90 14.68
13. XIV - Technical Education (RV) 227.21 4.70 231.91 206.82 25.09
14. XV - Sports and Youth Services (RV) 130.32 0.15 130.47 127.25 3.22
15. XVI – Medical and Health (RV) 2483.26 92.24 2575.50 2382.77 192.73
16. XVI – Medical and Health (CV) 58.00 22.45 80.45 43.16 37.29
17. XVII – Municipal Administration & Urban Development (RV) 2409.79 372.77 2782.56 2259.54 523.02
18. XVII – Municipal Administration & Urban Development (RC) 2.21 0.01 2.22 0.11 2.11
19. XVIII - Housing (RV) 1094.90 39.09 1133.99 892.03 241.96
20. XX – Labour and Employment (CV) 7.00 1.37 8.37 1.27 7.10
21. XXI - Social Welfare (RV) 1567.37 68.37 1635.74 1408.74 227.00
22. XXII – Tribal Welfare (RV) 568.73 47.59 616.32 535.56 80.76
23. XXIII - Backward Classes Welfare (RV) 514.26 28.87 543.13 484.36 58.77
24. XXV – Women, Child and Disabled Welfare
(RV)1039.96 3.00 1042.96 831.38 211.58
25. XXVII - Agriculture (CV) 0.03 0.57 0.60 0.03 0.57
26. XXVII - Agriculture (LV) --- 24.00 24.00 --- 24.00
27. XXIX – Forest, Science, Technology and Environment (RV) 388.45 20.28 408.73 310.10 98.63
28. XXX – Co-operation (RV) 166.42 0.10 166.52 147.29 19.23
29. XXXIII – Major and Medium Irrigation (RC) 30.35 0.04 30.39 24.44 5.95
30. XXXIII – Major and Medium Irrigation (CC) 109.76 1.01 110.77 41.72 69.05
31. XXXVI – Industries and Commerce (RV) 509.89 113.24 623.13 457.73 165.40
32. XXXVII - Tourism Art and Culture (RV) 120.53 10.00 130.53 56.39 74.14
Total 28726.81 1006.30 29733.11 24844.84 4888.27
RV: Revenue-Voted, RC: Revenue- Charged, CV: Capital - Voted, CC: Capital- Charged, L: Loans
201
Audit Report (Civil) for the year ended 31 March 2008
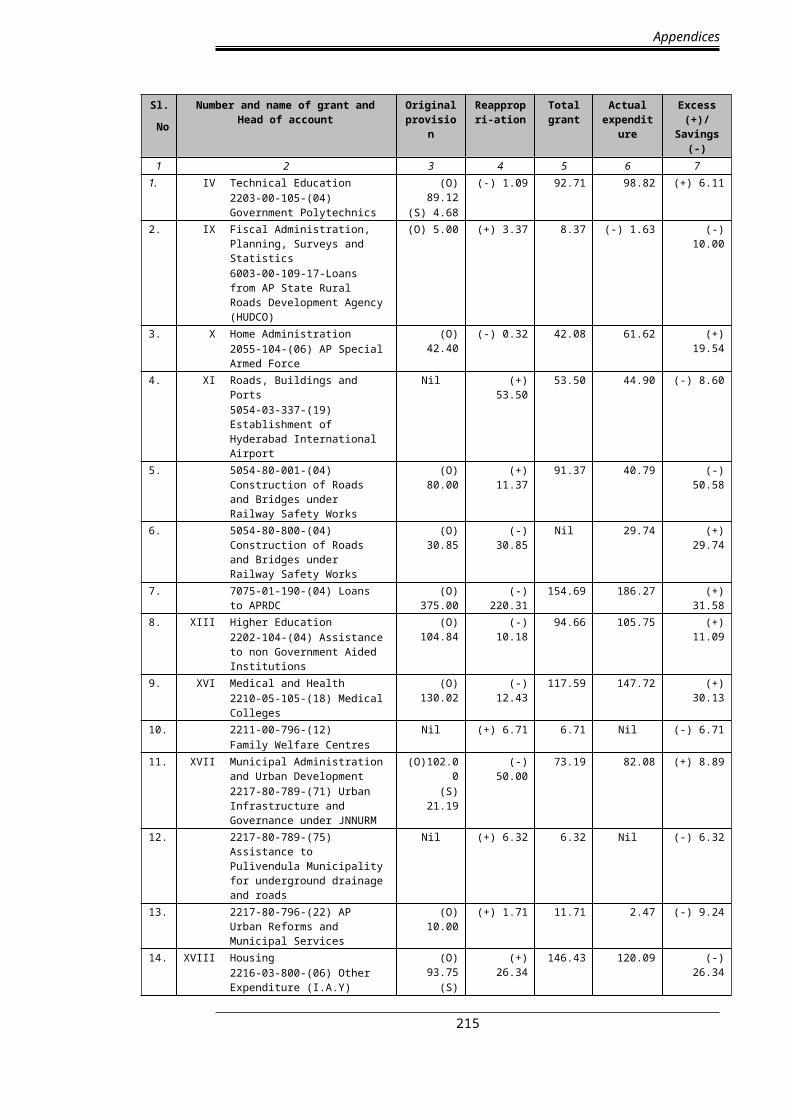
Appendix 2.6(Reference to paragraph 2.3.4 page 35)
Excessive/unnecessary reappropriation of funds (Cases where injudicious reappropriation of funds proved excessive or resulted in savings, by over Rs 5 crore)
(Rupees in crore)
202
Appendices
Sl.
No
Number and name of grant and Head of account
Original provision
Reappropri-ation
Total grant
Actual expenditure
Excess (+)/ Savings (-)
1 2 3 4 5 6 71. IV Technical Education
2203-00-105-(04) Government Polytechnics
(O) 89.12(S) 4.68
(-) 1.09 92.71 98.82 (+) 6.11
2. IX Fiscal Administration, Planning, Surveys and Statistics6003-00-109-17-Loans from AP State Rural Roads Development Agency (HUDCO)
(O) 5.00 (+) 3.37 8.37 (-) 1.63 (-) 10.00
3. X Home Administration2055-104-(06) AP Special Armed Force
(O) 42.40 (-) 0.32 42.08 61.62 (+) 19.54
4. XI Roads, Buildings and Ports5054-03-337-(19) Establishment of Hyderabad International Airport
Nil (+) 53.50 53.50 44.90 (-) 8.60
5. 5054-80-001-(04) Construction of Roads and Bridges under Railway Safety Works
(O) 80.00 (+) 11.37 91.37 40.79 (-) 50.58
6. 5054-80-800-(04) Construction of Roads and Bridges under Railway Safety Works
(O) 30.85 (-) 30.85 Nil 29.74 (+) 29.74
7. 7075-01-190-(04) Loans to APRDC (O) 375.00 (-) 220.31 154.69 186.27 (+) 31.588. XIII Higher Education
2202-104-(04) Assistance to non Government Aided Institutions
(O) 104.84 (-) 10.18 94.66 105.75 (+) 11.09
9. XVI Medical and Health 2210-05-105-(18) Medical Colleges
(O) 130.02 (-) 12.43 117.59 147.72 (+) 30.13
10. 2211-00-796-(12)Family Welfare Centres
Nil (+) 6.71 6.71 Nil (-) 6.71
11. XVII Municipal Administration and Urban Development2217-80-789-(71) Urban Infrastructure and Governance under JNNURM
(O)102.00(S) 21.19
(-) 50.00 73.19 82.08 (+) 8.89
12. 2217-80-789-(75) Assistance to Pulivendula Municipality for underground drainage and roads
Nil (+) 6.32 6.32 Nil (-) 6.32
13. 2217-80-796-(22) AP Urban Reforms and Municipal Services
(O) 10.00 (+) 1.71 11.71 2.47 (-) 9.24
14. XVIII Housing 2216-03-800-(06) Other Expenditure (I.A.Y)
(O) 93.75(S) 26.34
(+) 26.34 146.43 120.09 (-) 26.34
15. XX Labour and Employment 4250-00-203-(74) Buildings
(O) 5.00 (+) 0.46 5.46 0.10 (-) 5.36
16. XXII Tribal Welfare2225-02-102-11-(05)
(O) 16.89(S) 10.11
(-) 21.15 5.85 26.12 (+) 20.27
17. XXVII Agriculture2401-001-(03)- District Officers
(O) 147.33 (-) 22.58 124.75 131.89 (+) 7.14
18. 3451-090-(26) Rain shadow Areas Development Department
(O) 3.99(S) 5.15
(-) 0.14 9.00 30.63 (+) 21.63
19. XXIX Forest, Science, Technology and Environment2406-01-001-(03) District Offices
(O) 138.41 (+) 2.87 141.28 133.78 (-) 7.50
20. XXXI Panchayat Raj2215-01-102-(03) District Officers (Executive Establishment)
(O) 75.41 (+) 1.60 77.01 69.96 (-) 7.05
21. 2215-01-196-(25) Accelerated Urban Water Supply Scheme
(O) 27.67 (-) 7.69 19.98 24.18 (+) 4.20
22. 2215-00-197-(04) Assistance to Mandal Parishads
(O) 308.07 (+) 0.82 308.89 263.86 (-) 45.03
23. 2515-198-(08) Assistance to Gram Panchayats
(O) 269.88 (+) 0.65 270.53 218.74 (-) 51.79
24. XXXII Rural Development2235-60-789-(06) Welfare Pensions under Indiramma Programme
(S) 16.85 (+) 36.43 53.28 42.99 (-) 10.29
203
Audit Report (Civil) for the year ended 31 March 2008
25. XXXIII
Major and Medium Irrigation2701-01-101 Nagarjunasagar Project
(O) 475.21 (+) 5.50 480.71 269.97 (-) 210.74
26. 2701-01-111 Nizamsagar Project (O) 5.18 (+) 1.07 6.25 0.73 (-) 5.5227. 2701-01-113 Tungabhadra Project
(High Level Canal) Stage II(O) 58.05 (-) 0.12 57.93 64.91 (+) 6.98
28. 2801-01-105-(26) Dam and Appurtenant Works
(O) 19.09 (+) 1.73 20.82 11.83 (-) 8.99
29. 4701-01-109- Kurnoll Kadapa Canal (CV)
(O) 83.75 (-) 74.15 9.60 26.60 (+) 17.00
30. 4701-01-109- Kurnoll Kadapa Canal (CC)
(O) 5.55 (+) 4.68 10.23 0.01 (-) 10.22
31. 4701-01-112- Somasila Project (CV) (O) 137.82 (-) 31.04 106.78 127.96 (+) 21.1832. 4701-01-112- Somasila Project (CC) (O) 3.00 (+) 5.00 8.00 0.06 (-) 7.9433. 4701-01-116- Eleru Reservoir
Scheme (CC)(O) 1.20(S) 0.64
(+) 7.98 9.82 0.64 (-) 9.18
34. 4701-01-117- Singur Project (CV) (O) 39.96 (-) 10.10 29.86 38.50 (+) 8.6435. 4701-01-117- Singur Project (CC) (O) 10.16 (+) 4.73 14.89 Nil (-) 14.8936. 4701-01-130-Polavaram Barrange
(Indira Sagar Project) (CV)(O) 466.50 (-) 38.65 427.85 502.95 (+) 75.10
37. 4701-01-122-Jurala Project (CC) (O) 16.00 (+) 12.57 28.57 Nil (-) 28.5738. 4701-01-128-Pulichintala Project
(CV)(O) 298.00 (-) 208.74 89.26 188.47 (+) 99.21
39. 4701-01-131-Neredi Barrage under Vamsadhara Project (Stage-II Boddepalli Raja Gopal Rao Project (CV)
(O) 146.00 (-) 70.05 75.95 9.56 (+) 66.39
40. 4701-01-135-Pulivendala Canal Scheme (CV)
(O) 97.00 (+) 442.27 539.27 531.28 (-) 7.99
41. 4701-01-136-Krishna Delta System (CV)
(O) 25.00 (-) 16.78 8.22 15.53 (+) 7.31
42. 4701-01-144-Nettampadu Lift Irrigation Scheme Jawahar Lift Irrigation Scheme (CV)
(O) 286.10 (+) 8.60 294.71 277.11 (-) 17.59
43. 4701-01-152-Godavari Water Utilisation Authority (CV)
(O) 1695.00 (-) 291.70 1403.30 1686.79 (+) 283.49
44. 4701-01-158-Thatipudi Lift Irrigation Scheme(CV)
(O) 170.00 (-) 95.43 74.57 103.10 (+) 28.53
45. 4701-01-163-Thungabadhra Project (Low level canal (CV)
(O) 50.00 (+) 12.00 62.00 32.89 (-) 29.11
46. 4701-01-789-Special Component Plan for SCs (for GWUA) (CV)
Nil (+) 379.56 379.56 373.18 (-) 6.38
47. 4701-01-800-Other Expenditure (CV)
(O) 311.87 (+) 16.85 328.72 248.10 (-) 80.62
48. 4701-03-192-Palemvagu (Tribal Area Sub-plan) (CV)
(O) 25.00 (+)17.02 42.02 34.37 (-) 7.65
49. 4701-03-240-Musurumelli Project (Tribal Area Sub-Plan (CV)
(O) 50.00 (+) 8.11 58.11 31.45 (-) 26.66
50. XXXVI
Industries and Commerce2851-00-103-(56) Development of Integrated Textile Park by Brandix Lanka Limited at Visakhapatnam
(O) 10.00 (-) 5.00 5.00 10.00 (+) 5.00
51. 2852-08-201-(10) Assistance to Sugar Factories for non agreemental cane crushed towards loss of sugar recovery
Nil (+) 6.36 6.36 Nil (-) 6.36
52. XXXIV
Minor Irrigation4702-00-101-(12) Construction and Restoration of Minor Irrigation Sources
(O) 257.74 (+) 43.00 300.74 293.23 (-) 7.51
204

Appendices
Appendix 2.7(Reference to paragraph 2.3.5 page 35)
Reappropriation without Original and Supplementary provision (Rs 1 crore and above)
(in Rupees)
205
Audit Report (Civil) for the year ended 31 March 2008
S. No. Grant and Head of Account Expenditure
V Revenue Registration and Relief
1. 2245-05-101-04-002 19,71,00,000
VII Commercial Taxes Administration
2. 2040-00-001-(03)-800 2,20,49,000
X Home Administration
3. 2055-00-101-05-520 1,27,09,000
4. 2055-00-115-10-04-510 13,91,63,000
5. 2055-00-115-10-04-520 6,52,56,000
6. 2055-00-117-04-270 3,40,00,000
XI Roads, Buildings and Ports
7. 3053-80-800-05-310 1,12,26,000
8. 5051-02-209-11-04-540 9,75,00,000
9. 5053-80-800-05-500 16,18,46,000
10. 5054-03-337-11-19-530 37,36,70,000
11. 5054-03-337-11-19-540 16,14,00,000
12. 5054-04-800-11-19-530 1,29,36,000
XVI Medical and Health
13. 2210-01-110-11-(14)-310 1,56,45,000
14. 2210-01-110-11-(42)-310 18,00,00,000
15. 2211-00-103-(06)-310 1,91,38,000
16. 2211-00-789-11-(12)-010 2,42,00,000
17. 2211-00-796-11-(12)-010 6,71,00,000
XVII Municipal Administration and Urban Development
18. 2215-01-190-11-(07)-310 86,00,00,000
19. 2215-02-105-11-(09)-310 2,00,00,000
20. 2217-80-789-06-(12)-310 1,52,71,000
21. 2217-80-789-06-(35)-310 3,10,19,000
22. 2217-80-789-10-(12)-310 3,22,76,000
23. 2217-80-789-11-(68)-310 8,66,00,000
24. 2217-80-789-11-(75)-310 6,31,80,000
25. 2217-80-796-10-(12)-310 1,31,49,000
26. 2217-80-796-11-(68)-310 3,30,00,000
27. 2217-80-796-11-(75)-310 2,57,40,000
XXIII Backward Classes Welfare
28. 2225-03-277-11-(20)-310 2,28,17,000
XXVII Agriculture
29. 2401-00-119-06-22-310 4,92,52,000
XXIX Forest, Science, Technology and Environment
30. 2406-01-800-11-(12)-010 1,14,38,000
XXXI Panchayat Raj
31. 2215-01-102-03-500 1,59,82,000
32. 2215-01-102-11-310 2,74,50,000
33. 2215-01-196-11-26-310 12,00,00,000
34. 2215-02-191-11-05-310 21,72,67,000
206

Appendices
35. 2215-00-800-11-13-310 30,00,00,000
XXXII Rural Development
36. 2235-02-101-11-07-310 4,63,00,000
37. 2235-02-789-11-07-310 2,45,00,000
38. 2235-02-796-11-07-310 1,22,00,000
39. 2235-60-789-11-07-310 3,40,00,000
40. 2235-60-796-11-07-310 1,70,00,000
41. 2501-01-800-11-19-310 30,00,00,000
42. 2501-01-800-11-20-310 1,14,27,000
XXXIII Major and Medium Irrigation
43. 2701-01-101-03-(32)-130 1,01,00,000
44. 2701-01-101-03-(32)-260 1,26,00,000
45. 2701-01-101-03-(32)-280 1,34,00,000
46. 2701-80-800-11-(14)-270 24,65,00,000
47. 4701-01-106-11-(27)-530 1,38,68,000
48. 4701-01-146-11-(27)-530 46,31,20,000
49. 4701-01-789-11-(26)-530 16,24,67,000
50. 4701-01-789-11-(27)-530 363,01,78,000
51. 4701-01-796-11-(26)-530 13,72,98,000
52. 4701-01-796-11-(27)-530 96,60,00,000
53. 4701-03-104-11-(27)-530 5,15,00,000
54. 4701-03-184-11-(27)-530 1,47,70,000
55. 4701-03-214-07-(26)-530 1,70,00,000
56. 4701-03-245-11-(26)-530 1,24,00,000
57. 4701-80-800-11-(04)-530 10,00,00,000
XXXVI Industries and Commerce
58. 2852-08-201-11-10-310 6,35,99,000
XXXVIIICivil Supplies Administration
59. 3456-00-103-11-(08)-500 2,31,60,000
XXXIX Information Technology and Communications
60. 3451-00-789-11-(06)-280 1,57,95,000
207

Audit Report (Civil) for the year ended 31 March 2008
Appendix 2.8(Reference to paragraph 2.3.6 page 36)
Anticipated savings not surrendered(Rupees in crore)
Sl. No
Number and name of the grant Total grant
Savings Unsurrendered savings (and its
percentage of savings)
(1) (2) (3) (4) (5)1. I State Legislature (RV) 56.64 8.22 3.50 (42.58%)2. II Governor and Council of Ministers
(RV)20.14 8.88 4.63 (52.14%)
3. III Administration of Justice (RV) 335.34 87.13 35.8 (41.09%)Administration of Justice (RC) 37.06 0.80 0.80 (100%)
4. IV General Administration and Elections (RV)
256.03 54.79 201.24 (78.60%)
5. V Revenue, Registration and Relief (RV) 1464.99 146.16 135.30 (92.57%)
Revenue, Registration and Relief (RC) 0.03 0.02 0.02 (100%)Revenue, Registration and Relief (CV) 38.24 36.59 36.59 (100%)
6. VI Excise Administration (RV) 199.04 33.99 33.99 (100%)7. IX Fiscal Administration, Planning,
Surveys and Statistics (RV)7065.73 151.05 111.92
(74.09%)Fiscal Administration, Planning, Surveys and Statistics (RC)
8633.43 1040.55 169.26 (16.27%)
8. X Home Administration (RC) 0.35 0.28 0.28 (100%)Home Administration (CV) 31.30 23.52 4.30 (18.30%)Home Administration (LV) 55.52 22.26 1.00 (4.51%)
9. XI Roads, Buildings and Ports (RC) 2.47 0.15 0.15 (100%)Roads, Buildings and Ports (CV) 1076.08 87.94 34.78
(39.54%)10. XII School Education (RV) 6390.84 1284.43 302.99
(23.59%)School Education (CV) 213.12 111.93 107.70
(96.23%)11. XIII Higher Education (RV) 1436.14 242.08 41.82
(17.28%)Higher Education (CV) 37.58 14.68 0.87 (5.91%)
12. XIV Technical Education (RV) 231.91 25.10 0.04 (0.16%)13. XV Sports and Youth Services (RV) 130.47 3.21 0.27 (8.4%)14. XVI Medical and Health (RV) 2575.50 192.74 28.87
(14.98%)Medical and Health (RC) 0.53 0.34 0.34 (100%)Medical and Health (CV) 80.45 37.29 16.00
(42.91%)Medical and Health (LV) 184.85 80.71 6.67 (8.26%)
15. XVII Municipal Administration and Urban Development (RV)
2782.56 523.02 519.21 (99.27%)
208
Appendices
Municipal Administration and Urban Development (RC)
2.22 2.11 2.11 (100%)
16. XVIII Housing (RV) 1133.98 241.95 39.26 (16.23%)
17. XIX Information and Public Relations (RV) 127.06 2.27 0.11 (4.85%)Information and Public Relations (CV) 0.13 0.10 0.10 (100%)
18. XX Labour and Employment (RV) 273.40 20.04 12.34 (61.58%)
Labour and Employment (CV) 8.37 7.10 5.97 (84.08%)19. XXII Tribal Welfare (CV) 146.51 126.19 87.58
(69.40%)20. XXIII B.C. Welfare (RV) 543.13 58.77 15.12
(25.73%)B.C. Welfare (CV) 19.69 6.85 3.30 (48.18%)
21. XXI Social Welfare (RV) 1635.74 227.00 20.78 (9.15%)
Social Welfare (CV) 151.63 109.39 13.95 (12.75%)
22. XXIV Minority Welfare (RV) 113.67 0.34 0.34 (100%)23. XXV Women, Child and Disabled Welfare
(RV)1042.96 211.58 210.00
(99.25%)Women, Child and Disabled Welfare (CV)
2.95 2.45 0.08 (3.44%)
24. XXVI Administration of Religious Endowments (RV)
28.00 7.69 7.69 (100%)
25. XXVII Agriculture (CV) 0.60 0.57 0.27 (47.37%)Agriculture (LV) 24.00 24.00 24.00 (100%)
26. XXVIII Animal Husbandry and Fisheries (RV) 553.54 87.38 4.53 (5.18%)Animal Husbandry and Fisheries (CV) 39.56 21.49 0.12 (0.56%)
27. XXIX Forest, Science, Technology and Environment (RV)
408.73 98.63 16.92 (17.16%)
Forest, Science, Technology and Environment (CV)
5.62 1.33 1.99 (83.46%)
28. XXX Cooperation (RV) 166.52 19.23 12.73 (66.20%)
Cooperation (CV) 20.70 20.89 20.70 (99.09%)
29. XXXI Panchayat Raj (RV) 3691.67 669.77 425.18 (63.47%)
Panchayat Raj (RC) 0.26 0.15 0.15 (100%)30. XXXIII Major and Medium Irrigation (RV) 5479.73 792.72 733.75
(92.56%)Major and Medium Irrigation (RC) 30.39 5.96 5.96 (100%)Major and Medium Irrigation (CC) 110.77 69.04 67.21
(97.34%)31. XXXIV Minor Irrigation (RV) 197.07 106.59 94.92
(89.05%)Minor Irrigation (CV) 713.74 105.96 103.96
(98.11%)Minor Irrigation (CC) 0.90 0.90 0.90 (100%)
209
Audit Report (Civil) for the year ended 31 March 2008
32. XXXV Energy (RV) 4806.70 283.99 3.35 (1.18%)Energy (LV) 198.97 183.31 18.67
(10.18%)33. XXXVI Industries and Commerce (CV) 124.52 6.48 2.88 (44.40%)34. XXXVII Tourism, Art and Culture (RV) 130.53 74.13 49.05
(66.17%)Tourism, Art and Culture (CV) 6.00 4.81 2.14 (44.49%)
35. XXXVIII Civil Supplies Administration (RV) 1002.67 1.16 1.16 (100%)36. XL Public Enterprises (RV) 1.26 0.54 0.15 (28.15%)
Total 56280.23
7820.72 3807.76
210

Appendices
Appendix 2.9(Reference to paragraph 2.3.7 page 36)
Amount surrendered on the last day of March 2008
(Rupees in thousand)
211
Audit Report (Civil) for the year ended 31 March 2008
S. No. Grant No. Name of the grant Amount
1 2 3 4
1. I State Legislature (RV) 4,71,95
State Legislature (RC) 1,83,56
2. II Governor and Council of Ministers (RV) 3,25,08
Governor and Council of Ministers (RC) 3
3. III Administration of Justice (RV) 51,33,54
4. IV General Administration and Elections (RV) 37,19,77
General Administration and Elections (RC 86,40
5. V Revenue, Registration and Relief (RV) 10,73,91
6. IX Fiscal Administration (RV) 26,13,02
Fiscal Administration (RC) 871,28,46
Fiscal Administration (LV) 25,89,71
Fiscal Administration (LC) 2757,08,81
7. X Home Administration (RV) 29,30,05
Home Administration (CV) 19,21,54
Home Administration (LV) 21,26,00
8. VII Commercial Taxes Administration (RV) 53,46,44
9. VIII Transport Administration (RV) 15,65,76
10. XI Roads, Buildings and Ports (RV) 4,87,72
Roads, Buildings and Ports (CV) 50,49,25
Roads, Buildings and Ports (LV) 220,30,90
11. XII School Education (RV) 981,43,92
School Education (CV) 4,22,27
12. XIII Higher Education (RV) 170,25,72
Higher Education (CV) 138086
13. XIV Technical Education (RV) 25,05,76
Technical Education (CV) 5,00,00
14. XV Sports and Youth Services (RV) 2,39,20
15. XVI Medical and Health (RV) 159,65,97
Medical and Health (CV) 21,28,57
Medical and Health (LV) 74,04,00
16. XVII Municipal Administration and Urban Development (RV)
3,80,66
17. XVIII Housing (RV) 202,68,66
Housing (LV) 2034,43,45
18. XIX Information and Public Relations (RV) 2,15,48
19. XX Labour and Employment (RV) 7,70,06
Labour and Employment (CV) 1,13,15
20. XXI Social Welfare (RV) 2,06,21,57
Social Welfare (CV) 71,43,63
212

Appendices
21. XXII Tribal Welfare (RV) 106,57,91
Tribal Welfare (CV) 87,57,60
22. XXIII BC Welfare (RV) 15,11,87
BC Welfare (CV) 3,30,00
23. XXV Women, Child and Disabled Welfare (RV) 1,57,73
Women, Child and Disabled Welfare (CV) 2,36,44
24. XXVII Agriculture (RV) 151,44,86
Agriculture (CV) 30,00
25. XXVIII Animal Husbandry and Fisheries (RV) 82,54,88
Animal Husbandry and Fisheries (CV) 21,37,31
Animal Husbandry and Fisheries (LV) 11,59,41
26. XXIX Forest, Science, Technology and Environment (RV) 81,71,34
Forest, Science, Technology and Environment (CV) 21,73
27. XXX Cooperation (RV) 12,72,86
Cooperation (CV) 20,69,90
Cooperation (LV) 42,10,63
28. XXXI Panchayat Raj (RV) 242,59,27
29. XXXII Rural Development (RV) 4,30,23
30. XXXIII Major and Medium Irrigation (RV) 7,04,16
Major and Medium Irrigation (CV) 139,01,21
Major and Medium Irrigation (CC) 1,83,84
31. XXXIV Minor Irrigation (RV) 11,67,58
32. XXXV Energy (RV) 244,56,11
33. XXXVI Industries and Commerce (RV) 158,69,91
Industries and Commerce (CV) 3,60,00
34. XXXVII Tourism, Art and Culture (RV) 25,08,14
Tourism, Art and Culture (CV) 2,67,20
35. XXXIX Information Technology and Communications (RV) 9,65,05
36. XL Public Enterprises (RV) 38,52
Public Enterprises (LV) 8,29,52
Total 9692,30,04
213
Audit Report (Civil) for the year ended 31 March 2008
Appendix 2.10(Reference to paragraph 2.3.8 page 36)
Surrenders in excess of actual saving/even without saving(Rupees in crore)
Sl. No
Number and name of the grant/appropriation Total grant
Saving (-)/ Excess (+)
Amount surrendered
Amount surrendered in
excess1 2 3 4 5 61. I State Legislature (Revenue Charged) 2.52 (-) 1.54 1.84 0.302. IV General Administration and Elections
(Revenue Charged)11.85 (+) 0.07 0.86 0.86
3. VII Commercial Taxes Administration (Revenue Voted)
269.65 (-) 47.91 53.46 5.55
4. VIII Transport Administration (Revenue Voted)
73.35 (-) 10.90 15.66 4.76
5. X Home Administration (Revenue Voted)
2066.55 (+) 82.38 29.30 29.30
6. XI Roads, Buildings and Ports (Loans Voted)
421.42 (-) 195.88 220.31 24.43
7. XIV Technical Education (Capital Voted) 5.00 (-) 4.99 5.00 0.018. XXII Tribal Welfare (Revenue Voted) 616.32 (-) 80.76 106.58 25.829. XXVII Agriculture (Revenue Voted) 1410.46 (-) 141.33 152.02 10.6910. XXXII Rural Development (Revenue Voted) 1976.76 (+) 6.07 4.30 4.30
11. XXXIII Major and Medium Irrigation (Capital Voted)
10405.43 (+) 37.48 340.72 340.72
12. XXXVI Industries and Commerce (Revenue Voted)
623.13 (-) 165.40 168.79 3.39
13. XXXIX Information Technology and Communications (Revenue Voted)
103.42 (-) 0.67 9.65 8.98
Total 17985.86 (-) 523.38 1108.49 459.11
Appendix 2.11(Reference to paragraph 2.3.10 page 36)
Expenditure without provision (Rs 50 lakh and above)
(Rupees in thousand)Sl. No. Grant and Head of Account Expenditure
V – Revenue Registration and Relief1. 2235-60-200-20 19,69,24
XI – Roads Buildings and Ports2. 3054-04-797-04 78,50,01
XVII – Municipal Administration and Urban Development3. 2515-02-107-07 75,00
XXII – Tribal Welfare4. 2225-02-190-04-310 3,28,795. 2225-02-277-11-05-010 30,81,69
XXIII – Backward Classes Welfare6. 2225-02-277-11-20-310 1,88,00
XXXIII – Rural Development7. 2501-01-101-14 1,47,928. 2501-01-101-15 7,89,009. 2501-01-796-14 73,9610. 2501-01-796-15 3,94,5011. 2515-00-796-10 1,88,79
214
Appendices
Total 1508690
215

Audit Report (Civil) for the year ended 31 March 2008
Appendix 2.12(Reference to paragraph 2.3.12 page 37)
Drawal of funds in advance of requirement (in
Rupees)Name of
Department/Drawing officer
Amount drawn
Month/Year of drawl
Purpose Amount utilised
Balance as of July/August 2008
PD Account Bank Account
Fire & Emergency Department
Director General of Fire and Emergency Services
17,14,00,000 03/2007 Procurement of equipment to the fire services
17,53,650 16,96,46,350PD Account No.213 of APHMHDC, Hyderabad
---
Revenue Department
District Collector Nizamabad
6,93,00,000 06/2006 Rural Water Supply
5,90,63,600 1,02,36,400
2,07,00,000 03/2007 - do - Nil 2,07,00,000
9,00,00,000 3,09,36,400
SBH Main Branch Nizamabad
Agriculture Department
Joint Director of Agriculture, (JDA) Anantapur
16,12,20,000 09/2007 Subsidy to farmers
4,60,95,937 11,51,24,063Andhra Bank, Collectorate Branch Anantapur
J.D.A. Warangal 45,00,000 03/2005 Construction of Office building
Nil 45,00,000Kakatiya Grameena Bank, Hanamkonda
J.D.A. Nalgonda 13,63,15,000 07/2007 Subsidy to farmers
12,20,60,092 1,42,54,708
Tribal Welfare Department
District Tribal Officer, Chittoor
33,00,000 11/2004 Construction of Tribal Welfare Boys Hostel at Madanapalle
Nil 16,94,46,350 33,00,000SBH, Greenspet, Chittoor
Total 56,67,35,000 22,89,73,479 16,96,46,350 16,81,15,171
216

Appendices
Appendix 2.13(Reference to paragraph 2.3.13 page 37)
Statement showing the details of non-adjustment of Abstract Contingent bills
(Rupees in crore)Department 2007-08 2006-07 2001-02
to2005-06
1996-97to
2000-01
1985-86to
1995-96
Total Number of Certificates
Total amount
Agriculture and Cooperation
1.11 --- 0.39 0.10 --- 384 1.60
Animal Husbandry and Fisheries
0.31 --- --- 1.45 --- 18 1.76
Education 3.47 1.60 6.34 22.36 2.30 19702 36.07
Finance 2.87 --- 6.59 --- --- 8 9.46
General Administration 0.73 1.28 9.74 77.20 26.95 5960 115.90
Health Medical and Family Welfare
4.24 0.12 10.68 34.32 20.19 59114 69.55
Home 2.45 1.00 6.50 22.34 13.11 1474 45.40
Information and Public Relations
--- --- --- 0.01 0.35 561 0.36
Irrigation and Command Area Development
1.43 --- 0.51 0.01 --- 53 1.95
Labour, Employment and Training
0.01 --- 6.91 0.44 --- 66 7.36
Law 0.93 3.51 0.65 0.06 --- 14 5.15
Municipal Administration and Urban Development
--- --- 1.38 0.69 --- 11 2.07
Planning --- --- 0.05 0.71 0.03 145 0.79
Panchayat Raj and Rural Development
2.17 --- --- 6.58 2.78 1333 11.53
Revenue 13.76 --- 0.26 1.04 --- 450 15.06
Secretariat 0.59 1.76 5.61 --- --- 129 7.96
Social Welfare 2.38 --- 99.62 --- --- 71 102.00
Tribal Welfare --- --- --- 0.27 0.01 4 0.28
Transport, Roads and Buildings
0.08 0.07 0.11 0.10 --- 8 0.36
Women Development, Child and Disabled Welfare
--- --- 0.06 0.02 --- 30 0.08
Youth Advancement, Tourism, Art and Culture
0.40 1.91 0.42 0.51 --- 26 3.24
Total 36.93 11.25 155.82 168.21 65.72 89561 437.93
217

Audit Report (Civil) for the year ended 31 March 2008
Appendix 2.14(Reference to paragraph 2.3.14 page 37)
Statement showing department-wise unreconciled expenditure during the year 2007-08
(Rupees in crore)
Sl. No.
Name of the Department Amount
1. Agriculture and Cooperation 92.73
2. Animal Husbandry, Dairy Development & Fisheries 1.23
3. Law 5.42
4. Home 477.85
5. Energy 3886.74
6. Environment, Forest, Science and Technology 38.72
7. Housing 2351.29
8. Irrigation and Command Area Development 510.29
9. Social Welfare & Tribal Welfare 72.40
10. General Administration Department 356.95
11. Panchayat Raj & Rural Development 2027.31
12. Transport, Roads and Buildings 392.97
13. Revenue, Registration and Relief 23646.86
14. Education 454.36
15. Food, Civil Supplies and Consumer Affairs 50.21
16. Finance & Planning 16710.25
17. Women Development, Child Welfare and Disabled Welfare 59.59
18. Industries and Commerce 123.51
19. Youth Advancement, Tourism, Culture 191.75
20. Labour Employment and Training 58.66
21. Minorities Welfare 122.13
22. Municipal Administration and Urban Development 1682.87
23. Health Medical and Family Welfare 682.94
24. Information and Public Relations 106.75
25. Public Enterprises 7.43
26. Commercial Taxes 217.18
27. Other Social Services 5.41
28. IT and Communications 53.34
29. Miscellaneous General Services 772.84
Total 55159.98
218
Appendices
Appendix 3.1 (Reference to paragraphs 3.1.6.1 page 45)
Funding pattern for various components of the scheme of Nutritional Support to Primary Education
Components of the scheme Funding pattern
1. Lifting of Foodgrains Cost of foodgrains provided for PS/AIE/EGS to be reimbursed by GOI to FCI(State Government to make its own arrangements for foodgrains for UPS/Anganawadi, etc.)
2. Transportation Cost Actual cost of transportation of foodgrains from the FCI to schools to be reimbursed by GOI
Up to August 2004 GOI: Rs 50 per quintal;
From September 2004 onwards GOI: Rs 75 per quintal
3. Cooking cost Cost of cooking to be provided to Implementing Agencies (per child per school day)
Enrolment Up to 31 July 2006 From 01 August 2006 onwards
GOI (Rs) State (Rs) GOI (Rs) State (Rs)
Up to 50 1.00 1.00 1.50 1.00
51 to 100 0.75 0.75
101 and above 0.50 0.50
State Government has to bear the entire cooking cost towards mid-day meal for UPS/Anganawadi, etc.
4. Infrastructure Expenditure incurred on construction of Kitchen Sheds, provision of kitchen devices and water facilities
Up to June 2006 GOI: Funds available from other Central schemes and remaining cost by State Government
From July 2006 onwards GOI: Rs 60000 per Kitchen sheds per school; Rs 5000 per Kitchen devises per school and also funds available under other Central development programmes.
5. Monitoring, Management and Evaluation
Assistance for management, monitoring and evaluation
Up to June 2006 GOI: Not less than 0.9 per cent of total assistance on foodgrains, transport and cooking cost
From July 2006 onwards GOI: Not less than 1.8 per cent of total assistance on foodgrains, transport and cooking cost
Appendix 3.2 (Reference to paragraph 3.1.7.4 page 50)
Excess claim of transportation charges by AP State Civil Supplies Corporation
(Rupees in crore)
Name of the District
Transport charges claimed and received
Actual expenditure incurred on transport of foodgrains
Difference
Kurnool 2.34 0.59 1.75Nalgonda 1.98 0.52 1.46Warangal 1.80 0.49 1.30Anantapur 2.13 0.82 1.31Nellore 1.38 0.44 0.95Ranga Reddy 1.66 0.23 1.43
Total 11.29 3.09 8.20
219

Audit Report (Civil) for the year ended 31 March 2008
Appendix 3.3 (Reference to paragraph 3.2.6.1 page 65)
Statement showing the receipts and expenditure of the University during the period 2003-08
(Rupees in crore)Year Receipts Expenditure
Block grant
Internal sources
UGC Non-UGC Total University funds
UGC Non-UGC Total
2003-04 31.26 11.00 4.49 2.59 49.34 42.51 5.10 2.51 50.12
2004-05 31.89 12.66 7.49 4.19 56.22 47.36 5.21 2.58 55.14
2005-06 33.96 13.91 3.69 5.35 56.92 48.06 2.83 4.19 55.08
2006-07 42.13 17.33 13.92 10.99 84.37 59.59 10.32 11.31 81.22
2007-08* 42.13 19.79 11.68 8.39 81.99 64.23 12.71 8.94 85.88
Total 181.37 74.69 41.27 31.51 328.84 261.75 36.17 29.53 327.44
* Estimated figures (Accounts yet to be prepared)
Appendix 3.4(Reference to paragraph 3.2.6.11 page 69)
Statement showing the year-wise advances pending with departmental officers
(Rupees in lakh)
Year Amount of advances pending
Year Amount of advances pending
1982-83 0.18 1995-96 5.90
1983-84 0.24 1996-97 19.67
1984-85 3.73 1997-98 7.16
1985-86 3.69 1998-99 7.43
1986-87 3.19 1999-2000 19.88
1987-88 69.95 2000-2001 8.29
1988-89 0.00 2001-2002 38.57
1989-90 0.00 2002-2003 32.81
1990-91 0.06 2003-2004 96.74
1991-92 3.53 2004-2005 186.87
1992-93 2.85 2005-2006 192.39
1993-94 20.17 PG Centre, Kadapa 0.39
1994-95 15.10 PG Centre, Kavali 0.61
Total 122.69 Total 616.71
Grand Total 739.40
220

Appendices
Appendix 3.5(Reference to paragraph 3.2.8.5 page 76)
Ongoing /Completed Research Projects during 2002-07
Sl.No.
Name of the Department (Year of establishment)
No. of ongoing projects during
2002-07 and their outlay
No. of research projects completed during
2002-07 and their outlay
No. of patents
generated
No. Outlay(Rs in lakh)
No. Outlay(Rs in lakh)
1. Econometrics (1976) - - 1 0.99 -
2. Economics (1955) 2 8.88 4 5.73 -
3. Fine Arts (1989) - - - - -
4. Law (1976) 2 4.62 1 3.12 -
5. Political Science & Public Administration (1971)
2 5.52 1 2.25 -
6. Population Studies (1973) - - 4 10.00 -
7. Sociology (1971) - - 1 2.30 -
8. Anthropology (1971) 5 55.00 12 35.53 -
9. Biochemistry (1978) 5 39.00 2 23.00 -
10. Biotechnology (1995) 3 33.00 1 40.95 -
11. Botany (1959) 1 10.00 5 95.93 -
12. Fishery Science & Aquaculture (1997) 2 39.00 2 46.80 -
13. Geography (1972) - - 2 2.60 -
14. Geology (1959) 5 89.17 5 30.43 -
15. Home Science (1963) 1 7.80 2 25.80 -
16. Psychology (1959) 3 21.48 2 28.60 -
17. Virology (1988) 3 77.00 7 86.80 -
18. Zoology (1954) 2 23.81 18 169.10 -
19. Commerce (1969) 5 42.53 4 15.54 -
20. Computer Science (1989) 1 14.98 1 1.00 -
21. Library & Information Sciences (1974) - - - - -
22. Management Studies (1983) 1 8.65 3 3.15 -
23. Adult & Continuing Education (1972) 6 1.09 - - -
24. Education (1971) 1 0.25 - - -
25. Centre for Extension Studies (1989) 3 - - - -
26. Physical Education (1955) - - - - -
27. English (1954) 2 7.20 1 1.68 -
28. Hindi (1959) 2 12.69 1 3.15 -
29. Linguistics & Foreign Languages (1990)
- - 2 5.25 -
30. Philosophy (1954) - - - - -
221
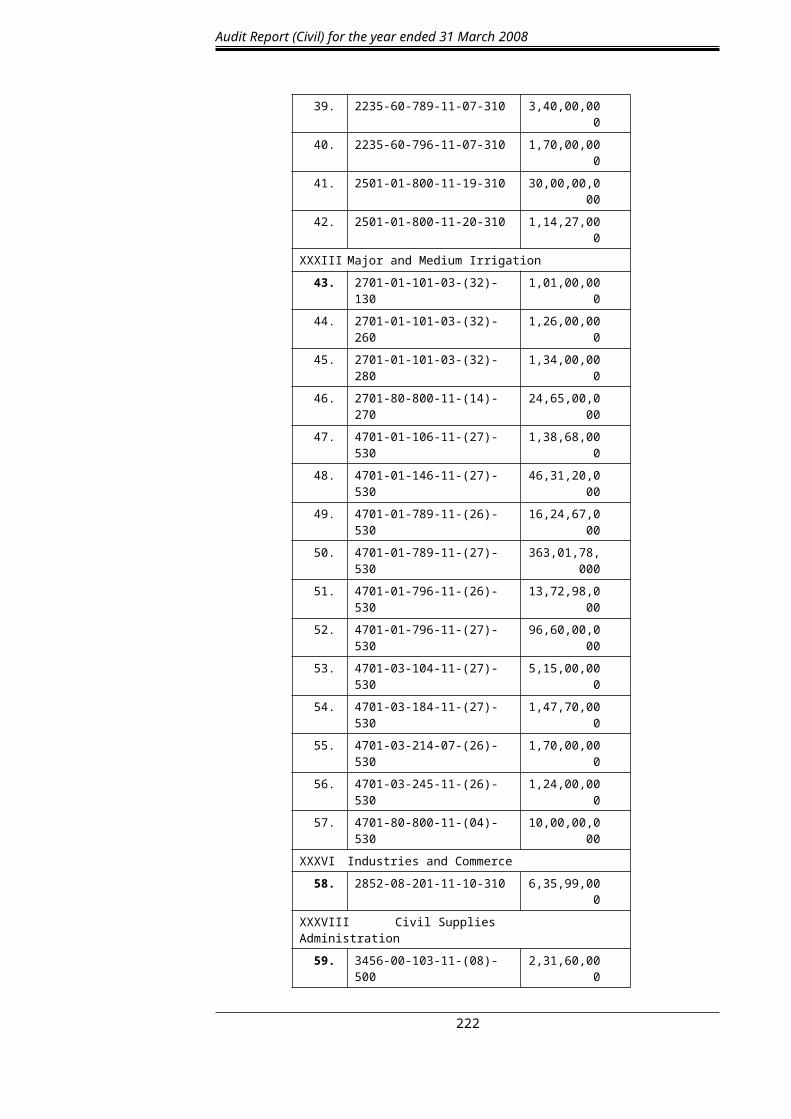
Audit Report (Civil) for the year ended 31 March 2008
31. Sanskrit (1959) 1 5.33 - - -
32. Tamil (1970) 3 13.00 3 10.00 -
33. Telugu (1959) 2 42.00 5 11.50 -
34. Urdu (1959) - - 1 0.61 -
35. Ancient Indian History, Culture & Archaeology (1959)
2 6.01 - - -
36. History (1959) - - 1 - -
37. Human Rights & Social Development (1997)
- - - - -
38. Southeast Asian and Pacific Studies (1976)
- - - - -
39. Chemistry (1954) 13 142.56 15 71.61 -
40. Environmental Sciences (1997) 3 36.30 2 9.70 -
41. Mathematics (1954) - - 2 5.40 -
42. Physics (1954) 19 555.15 15 346.87 2
43. Statistics (1958) - - - - -
44. Instrumentation (USIC) (1959) - - 1 5.19 -
45. Chemical Engineering (1977) - - - - -
46. Civil Engineering (1959) - 1.00 9 245.73 -
47. Computer Science & Engineering (1992)
- - - - -
48. Electrical & Electronics Engineering (EEE 1959 and ECE 1972)
2 18.60 - - -
49. Mechanical Engineering (1959) - - - - -
50. PG Centre: Commerce (1973) 1 2.05 1 3.12 -
51. PG Centre: Economics (1972) 1 6.80 1 0.99 -
52. PG Centre: Microbiology (2005) 2 17.92 - - -
53. PG Centre: Physics (1979) 1 7.77 1 3.27 -
54. PG Centre: Zoology (1979) 2 26.00 2 16.00 -
55. Oriental Research Institute (1956) 1 2.52 5 32.85 -
56. Institute of Advanced Studies in Education (1998)
- - - - -
Total 112 1384.68 146 1402.54 2
222

Appendices
Appendix 3.6(Reference to paragraph 3.4.7 page 102)
Activity-wise financial targets and achievements
Component Target Achievement(Rupees in crore)
1. Creation of enabling environment(i) Capacity building of Forest Department 20.38 11.40(ii) Capacity building of communities 18.96 15.68(iii) Project management 76.19 84.58
(+) 1.92 (PPF)Sub-total 115.53 113.58
2. Forest Management(i) Forest treatment & forest management and
Planning
360.98 261.43
(ii) Social Forestry 6.66 10.53(iii) Applied Research 25.65 29.90(iv) Tsunami mitigation 24.26 45.96
Sub-total 417.55 347.923. Community Development
(i) CFM support 41.75 28.60(ii) Tribal Development Plan (TDP) 32.52 16.30(iii) Village Development Plan (VDP) 15.87 6.80(iv) Resettlement Action Plan (RAP) 30.75 10.30
Sub-total 120.89 62.86Grand Total 653.97 523.40
Appendix 3.7(Reference to paragraph 3.4.8.3 page 106)
Raising of palm rose seeds
Division Quantity Purchased
(in Kgs)
Agency Rate per kg (Rs)
Amount Cost of sowing
Total cost
(in Rupees)Khammam 1,500 M/s Rayalaseema
Seeds Development Society, Anantapur
170 2,55,000 1,84,002 4,39,002
Paloncha 2,000 170 3,40,000 - 3,40,000
Bhadrachalam North 750 170 1,27,500 36,129 1,63,629
Kothagudem 2,000 170 3,40,000 - 3,40,000
Nirmal 600 200 1,20,000 90,850 2,10,850
Kaghaznagar 1,235 200 2,47,000 64,188 3,11,188
Kamareddy 5,000 M/s Sree Venkateswara Seeds Suppliers, Anantapur
170 8,50,000 96,292 9,46,292
Chittoor East 3,430 M/s Jai Ganesh Aromatics, Chittoor
165 5,65,950 21,991 5,87,941
223

Audit Report (Civil) for the year ended 31 March 2008
Total 28,45,450 4,93,452 33,38,902
Appendix 3.8(Reference to paragraph 3.4.8.4 page 106)
Statement of revenue to be realized to VSS in disposal of decongestion material as industrial cuts to paper mills
I. Approximate weight of 60 Industrial cuts bundles is 1 MT
(Record of discussions held with ITC Limited on 23.11.2003 at Paloncha on supply of Industrial cuts to the mills)In view of nature of material to be obtained in decongestion, 70 Industrial cuts are considered to be weighted as 1 MTEach Industrial Cuts bundle is consisting of 20 pieces of 2 meters long in size. Each culm/bamboo that was removed during decongestion is taken as each pieceApproximate average number of culms/bamboo are to be removed from each clump are Four (4) (Baseline survey reports of Kaghaznagar division)
II. Total number of culms/bamboos removed during decongestion
2003-04 395019X4 1580076 Kaghaznagar
2004-05 56313X4 225252 Kaghaznagar
2005-06 44234X4 176936 Kaghaznagar
III. Revenue to be realized
2003-04
158007620x70
1128.62 MT
1128.62 MT X Rs 1453 Rs 1639885
2004-05
22525220x70
160.89 MT
160.89 MT X Rs 1453 Rs 233773
2005-06
17693620x70
126.38 MT
126.38 MT X Rs 1495 Rs 188938
Total: Rs 20,62,596
224
Selling price fixed by the Government
2003-04 Rs 1453/ MT
2004-05 Rs 1453/ MT
2005-06 Rs 1495/ MT

Appendices
Appendix 3.9(Reference to paragraph 3.4.9 page 108)
Non-maintenance/improper maintenance of allied recordsName of the division and
VSSs test-checkedAssets Register Yield Register Forest treatment register
Nirmal (8 VSSs) Improper maintenance in 2 VSSs, non-maintenance in 4 VSSs
-- --
Khammam (37 VSSs)
Not maintained in 9 VSSs
-- Improper maintenance in 15 VSSs, non-maintenance in 19 VSSs
Bhadrachalam (North) (21 VSSs)
Not maintained in 13 VSSs
Not maintained in13 VSSs
Not maintained in 13 VSSs, improper maintenance in 8 VSSs
Bhadrachalam (South) (20 VSSs)
Not maintained in 20 VSSs Not maintained in20 VSSs
Not maintained in 20 VSSs
Warangal (South) (40 VSSs)
Not maintained in 37 VSSs
Not maintained in 37 VSSs
Not maintained in 37 VSSs, improper maintenance in 3 VSSs
Srikakulam (23 VSSs)
Improper maintenance in 10 VSSs, non-maintenance in 2 VSSs
Improper maintenance in 2 VSS, non-maintenance in 6 VSSs
Improper maintenance in 11 VSSs
Chittoor East (35 VSSs)
Improper maintenance in 4 VSSs
Improper maintenance in 2 VSSs
--
Kamareddy (31 VSSs)
No entries in the registers in 29 VSSs
Improper maintenance in 6 VSSs
No entries in 29 VSSs
Appendix 4.1
(Reference to paragraph 4.2.3 page 115)
Statement showing excess payment of Rs 38.49 lakh due to incorrect application of rates
Sl.No
Circle/Division Quantity in cum.
Expenditure incurred in Rupees
Expenditure to be incurred in
Rupees
Total excess payment
(in Rupees)(a) Adoption of higher rates without considering the reduced volume of work 1. Nizamabad/DFO(T),Nizamabad 12829 1543411 460887 10825242. Nizamabad/DFO(T),Medak 27104 1213563 606781 6067823. Nisamabad/DFO(T), Medak 21320 1478000 1106700 371300
Nisamabad/DFO(T), Medak 103004. Nizamabad/DFO(T),Kamareddy 19636 981821 687275 294546
Total 2355152(b) Adoption of higher rates for earthwork done by machine
1. Nizamabad/DFO(T),Kamareddy 134374 3230903 2914120 316783Nizamabad /DFO(T),Kamareddy 56299
2. Adilabad/DFO(T)/Mancharial 89578 1455643 1164514 2911293. Nizamabad/DFO(T), Medak 202099 3516523 3282088 2344354. Adilabad/DFO(T),Kagaznagar 13251 608464 457795 150669
Adilabad/DFO(T), Kagaznagar 219645. Nizamabad/DFO(T)/Nizamabad 12599 204608 163787 40821
Total 1033837(c) Adoption of higher rates applicable to SMC works for forestry works
Visakhapatnam/DFO(T),Vizianagaram 18793 915854 456102 459752
225
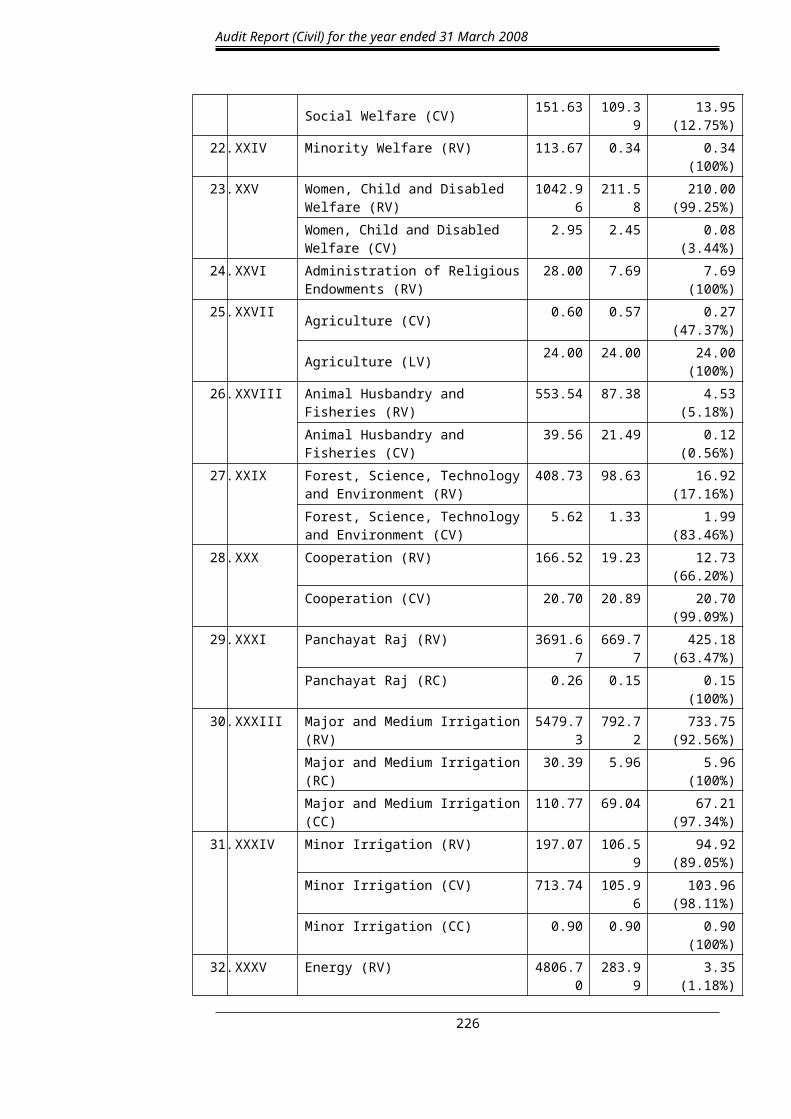
Audit Report (Civil) for the year ended 31 March 2008
Grand Total (a+b+c) 3848741
Appendix 4.2(Reference to paragraph 4.2.4 page 115)
Excess payment of Water charges and Sewerage cess by Gandhi Hospital, Secunderabad
Month Water consumption(Kilo Litres)
water charges @
Rs 35(Rs)
Amounts excess paid Total excess of water cess and sewerage cess
(Rs)
Rebate 20%(Rs)
Sewerage cess on rebate at 35%
(Rs)January 2007 29490 1032150 206430 72251 278681February 2007 26971 943985 188797 66079 254876March 2007 35973 1259055 251811 88134 339945April 2007 39861 1395135 279027 97659 376686May 2007 36805 1288175 257635 90172 347807June 2007 34052 1191820 238364 83427 321791July 2007 32913 1151955 230391 80637 311028August 2007 35060 1227100 245420 85897 331317September 2007 36362 1272670 254534 89087 343621October 2007 39117 1369095 273819 95837 369656November 2007 34993 1224755 244951 85733 330684December 2007 33746 1181110 236222 82678 318900January 2008 34927 1222445 244489 85571 330060February 2008 33010 1155350 231070 80875 311945March 2008 32139 1124865 224973 78741 303714April 2008 37031 1296085 259217 90726 349943May 2008 41023 1435805 287161 100506 387667June 2008 43121 1509235 301847 105646 407493July 2008 37662 1318170 263634 92272 355906August 2008 41631 1457085 291417 101996 393413
Total 715887 25056045 5011209 1753923 6765132
Water Cess: Rs 50.11 lakh; Sewerage cess: Rs 17.54 lakh – Total excess payment: Rs 67.65 lakh
Appendix 4.3(Reference to paragraph 4.2.5 page 116)
Statement showing avoidable interest payment at higher rates by the Government during March 2004 - September 2007
(Rupees in crore)
Amount of loan
Rate of interest
(Percentage)
Date of interest payment
Interest paid half yearly at 12/13
per cent
Interest at 9 per cent offered by
GIC
Avoidable payment of
interest
517 12 27 March 2004 0.16 0.12 0.04
24 September 2004 0.11 0.11 0.00
28 March 2005 0.15 0.11 0.04
27 September 2005 0.14 0.10 0.03
24 March 2006 0.14 0.10 0.03
226

Appendices
25 September 2006 0.12 0.09 0.03
29 March 2007 0.12 0.09 0.03
26 September 2007 0.11 0.08 0.03
546 12 27 March 2004 0.18 0.14 0.05
24 September 2004 0.13 0.13 0.00
28 March 2005 0.17 0.13 0.04
27 September 2005 0.16 0.12 0.04
24 March 2006 0.16 0.12 0.04
25 September 2006 0.14 0.11 0.04
29 March 2007 0.14 0.11 0.04
26 September 2007 0.13 0.10 0.03
626 12 27 March 2004 0.24 0.17 0.08
24 September 2004 0.16 0.16 0.00
28 March 2005 0.23 0.16 0.07
27 September 2005 0.21 0.15 0.07
24 March 2006 0.21 0.15 0.07
25 September 2006 0.20 0.14 0.06
29 March 2007 0.20 0.14 0.06
26 September 2007 0.18 0.12 0.06
710 13 27 March 2004 0.30 0.20 0.09
24 September 2004 0.19 0.19 0.00
28 March 2005 0.28 0.19 0.09
27 September 2005 0.26 0.18 0.08
24 March 2006 0.26 0.18 0.08
25 September 2006 0.24 0.17 0.07
29 March 2007 0.24 0.17 0.07
26 September 2007 0.22 0.15 0.07
954 13 27 March 2004 0.42 0.29 0.13
24 September 2004 0.27 0.27 0.00
28 March 2005 0.40 0.27 0.12
27 September 2005 0.37 0.26 0.11
24 March 2006 0.37 0.26 0.11
25 September 2006 0.35 0.24 0.11
29 March 2007 0.35 0.24 0.11
26 September 2007 0.32 0.22 0.10
1736 13 27 March 2004 0.95 0.66 0.29
24 September 2004 0.62 0.62 0.00
28 March 2005 0.90 0.62 0.28
27 September 2005 0.86 0.59 0.26
24 March 2006 0.86 0.59 0.26
25 September 2006 0.81 0.56 0.25
29 March 2007 0.81 0.56 0.25
26 September 2007 0.77 0.53 0.24
Total 15.31 11.18 4.13
Payment (July 2005) of outstanding interest due as of September 2004 (Rs in crore) 0.32Avoidable interest payment at higher rates (Rs in crore) 4.45
227

Audit Report (Civil) for the year ended 31 March 2008
228
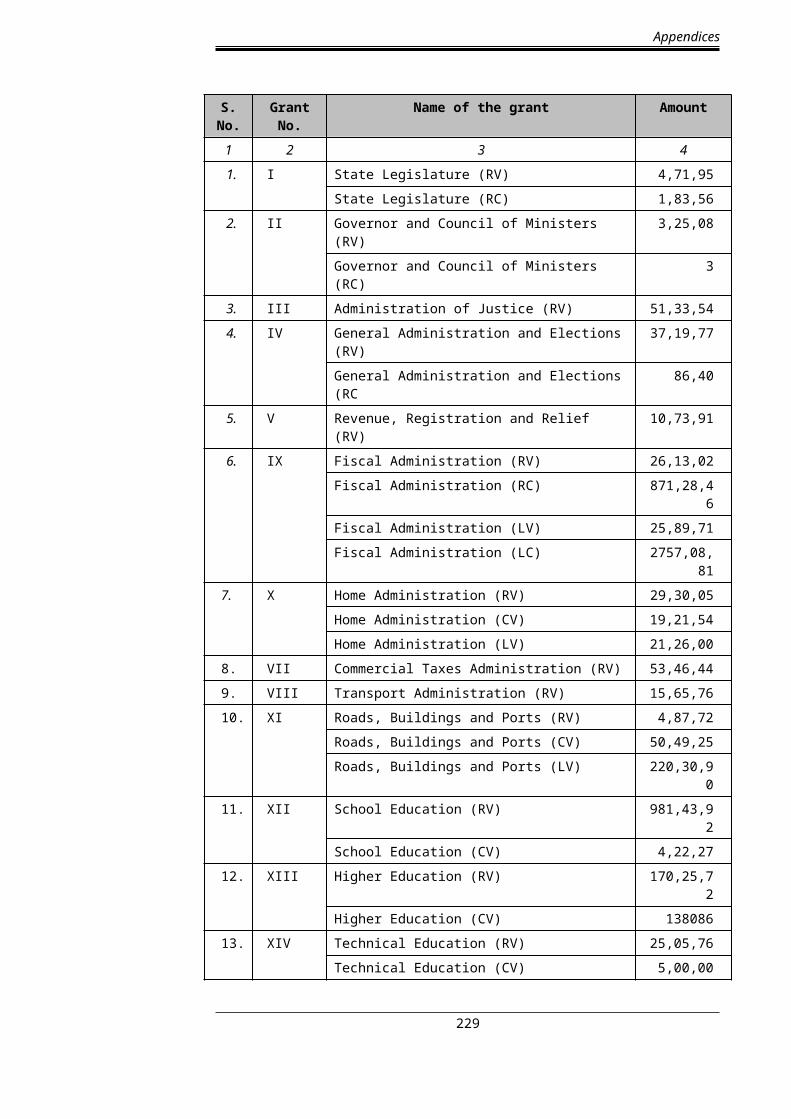
Appendices
Appendix 4.4(Reference to paragraph 4.2.16 page 127)
Details of Minor Irrigation works executed without downstream development works by Special Minor Irrigation Division, Utnoor, during 1995-2006
Sl.No
Mandal Village Name of the work Amount of Estimate
(Rs in lakh)
Amount incurred(Rs in lakh)
Contemplated Ayacut in
Ac
Actualayacut
irrigated
Year of sanction
1. Adilabad Chinchughat FNT a/c l/s 45.620 38.750 160 100 2002-032. Adilabad Dharaloddi H/o Khandala FNT a/c l/s 13.100 8.120 45 20 2001-023. Adilabad Khandala M.I.Tank 14.900 14.750 37 20 1997-984. Adilabad Maleboregaon Anicut 4.950 4.900 40 35 1995-965. Adilabad Maleboregaon FNT a/c l/s 33.560 34.540 130 100 2001-026. Asifabad Ada dasnapur Small kunta no.II 3.000 2.960 22 5 1995-967. Asifabad Devadurgam M.I.Tank 15.450 16.410 106 50 1997-988. Asifabad Koudan H/o Movad Small kunta 3.290 3.220 25 5 1997-989. Asifabad Koudan Movad Form of M.I.Tank
Pochamma kunta 6.990 6.800 30 12 1997-98
10. Asifabad Malangondi Small kunta pochubai kunta 3.000 2.040 22 10 1996-9711. Asifabad Movad Form of Jangubai cheru 23.600 23.000 100 30 1999-0012. Bazarhatnoor Jatherla M.I.Tank 24.160 25.400 75 20 2001-0213. Bazarhatnoor Kothaguda H/o Jatherla FNT a/c l/s 37.600 35.400 140 35 1995-9614. Bejjur Andugulagudem H/o O.S
pallyM.I.Tank Mayalamma kunta 24.850 22.390 190 50 1999-00
15. Bejjur Arkagudem H/o O.S. pally Formn. of M.I tank Nandi kunta 21.800 14.160 83 37 1999-00
16. Bejjur Mugavelly Restn. of M.I.Tank Chicken kunta 4.760 4.050 37 29 2001-02
17. Bejjur Old gerre H/o Somni Formation of new tank a/c l/s 11.100 10.080 35 8 1996-9718. Bejjur Shivapally M.I tank 20.040 18.070 85 70 2001-0219. Bejjur Somini Formn. of Gavude kunta 3.460 2.250 15 12 2003-0420. Bejjur Sulugupally H/o
OotsarangapallyRestoring of Advi cheruvu 5.520 4.440 120 120 2001-02
21. Bejjur Sulugupally H/o Ootsarangapally
Form of Batti kunta a/c l/s 17.550 17.440 72 55 2001-02
22. Bejjur Sushmeer Form of Pochamma cheruvu 20.000 21.070 72 40 2001-0223. Bela Downa FNT a/c 1/s 47.950 48.760 160 0 2002-0324. Bheemni Dhampur Formn. of MI tank yellagani
kunta 24.470 25.350 70 25 2001-02
25. Bheemni Yellaram FNT a/c Malapadu vorrey 26.000 27.530 87 20 2001-0226. Boath Gollapur M.I. Tank 4.960 4.230 30 30 1995-9627. Boath Pardi-B H/o Chinthalabori Restn. of M I Tank
Thummaloddi 9.000 6.280 50 45 1999-00
28. Boath Thiviti M.I tank 12.200 11.300 42 20 1995-9629. Dahegaon Digda FNT a/c Kunkala vorrey 27.560 20.190 100 35 2002-0330. Dahegaon Ravulapally FNT a/c l/s 29.850 29.860 100 35 2002-0331. Indravelly Gattepally FNT a/c l/s 9.100 7.630 30 10 2001-0232. Indravelly Ginnera Restoration of L.B tank 12.400 11.900 100 35 2001-0233. Indravelly Dasnapur Restoration of M.I tank no. II 9.930 9.370 50 45 1999-0034. Indravelly Dasnapur Restoration of M.I tank no. I 14.320 15.190 80 10 1999-0035. Indravelly Dasnapur FNT a/c l/s 43.300 37.050 160 20 2002-0336. Indravelly Ginnerathanda FNT a/c l/s 48.000 46.950 160 40 2002-0337. Indravelly Keslapur FNT a/c l/s 48.010 42.770 160 16 2002-0338. Indravelly Kolamguda H/o Gattepally FNT a/c l/s 8.500 7.760 40 10 2002-0339. Indravelly Mallapur FNT a/c l/s 25.270 24.920 270 55 2001-0240. Indravelly Pochampally Restn of M.I.Tank 3.600 2.900 40 5 1999-0041. Indravelly Wadgaon FNT a/c I/s 7.220 6.990 40 25 2002-0342. Indravelly Wadgaon Construction of Anicut 47.990 24.460 192 5 2002-0343. Indravelly Waipet Repairs to Pedda cheruvu 4.750 4.100 100 25 2002-0344. Jainoor Ashapally FNT a/c l/s 12.100 12.500 50 45 1995-9645. Jainoor Dhaboli M.I. Tank No.I 16.480 13.940 51 25 1997-9846. Jainoor Dhaboli M.I. Tank No.II 23.580 21.990 88 40 1997-98
229

Audit Report (Civil) for the year ended 31 March 2008
47. Jainoor Dubbaguda FNT a/c l/s 46.800 43.940 160 20 2002-0348. Jainoor Lendijhala FNT a/c l/s 21.900 2.300 73 30 2002-0349. Jainoor Markaguda H/o ashapally FNT a/c l/s 47.010 45.740 160 80 2002-0350. Jainoor Marlawai Formn. of small kunta 24.600 22.810 80 60 2001-0251. Kaddam Maddipadaga Repairs to anicut a/c bugga
vagu 4.950 4.770 30 20 2005-06
52. Kasipet Buggagudem H/o Kanikalapur
M.I. Tank 26.400 26.530 78 30 1997-98
53. Kasipet Gurvapur FNT a/c l/s 31.320 31.660 130 15 1999-0054. Kasipet Kothawari pet H/o
KanikalapurFormn. of M I tank a/c l/s 19.050 13.630 55 20 2001-02
55. Kasipet Sonapur M.I.Tank 17.450 17.480 60 10 1995-9656. Kerameri Babjhari Formn. of M I tank Maharaj
kunta 5.160 4.800 25 5 2000-01
57. Kerameri Bheemangondi Formn. of pothurajula cheru 17.430 18.120 102 30 1996-9758. Kerameri Chalbardi Formn. of M I tank, Koya
kunta 4.920 0.200 25 15 2000-01
59. Kerameri Chinthakarra M I tank 4.990 4.070 25 11 1997-9860. Kerameri Hedthagondi H/o
BheemangondiFNT a/c l/s 45.240 43.130 160 60 2002-03
61. Kerameri Koppaguda H/o Mettapipri Small kunta chandu kunta 3.000 3.200 20 5 1997-9862. Kerameri Mettapipri MI tank chandu kunta 5.330 5.590 28 0 1999-0063. Kerameri Thummaguda H/o Devapur Formn. of M I tank 5.320 5.050 28 14 2000-0164. Narnoor Balampur Formation of small kunta 3.000 2.960 30 16 2001-0265. Narnoor Bethalguda H/o Sonapur FNT a/c l/s 48.080 1.970 160 45 2002-0366. Narnoor Dharmuguda H/o
Paraswada-KFNT a/c l/s 47.600 46.550 159 65 2002-03
67. Narnoor Dongargaon M.I.Tank 24.930 25.120 78 20 1997-9868. Narnoor Gangapur FNT a/c l/s 27.780 28.110 70 60 2001-0269. Narnoor Gangapur FNT a/cl/s 42.500 36.740 150 30 2002-0370. Narnoor Godruguda FNT a/c l/s 46.500 44.500 160 45 2002-0371. Narnoor Khandowrampur M.I.Tank 20.500 16.790 105 25 1997-9872. Narnoor Sedwai M.I.Tank 23.070 22.580 80 30 1997-9873. Narnoor Shivanara FNT a/c l/s 48.000 42.130 160 90 2002-0374. Sirpur-U Aliguda H/o Mahagaon M.I.Tank 11.400 12.970 47 30 1995-9675. Sirpur-U Babjipet M.I.Tank 27.250 23.700 80 50 1997-9876. Sirpur-U Bogadaguda H/o Pullara FNT a/c l/s 42.800 42.410 150 70 2002-0377. Sirpur-U Chapri H/o Dhanora FNT a/c l/s 46.900 40.160 160 80 2002-0378. Sirpur-U Chinna Gumnur FNT a/c l/s 47.500 35.820 170 135 2001-0279. Sirpur-U Kohinoor-K Formation of new tank a/cl/s 47.940 48.600 170 120 2002-0380. Sirpur-U Kommuguda H/o Pangdi FNT a/c l/s 48.600 47.640 160 75 2002-0381. Sirpur-U Thummaguda H/o Pullara FNT a/c l/s 46.270 45.280 150 0 2002-0382. Thalamadugu Kappardevi FNT a/c l/s 48.000 17.980 160 70 2002-0383. Thalamadugu Kosai FNT a/c l/s 27.250 21.840 79 45 2001-0284. Thamsi Burkapally H/o Bheempur M.I.Tank 33.700 31.880 125 70 1997-9885. Thamsi Gunjala FNT a/c l/s 47.910 33.160 160 120 2002-0386. Thamsi Khairguda H/o Anderband M.I.Tank 16.340 19.000 59 35 1997-9887. Thandur Bejjal H/o Abbapur Form of Jangu kunta a/cl/s 11.000 9.860 35 10 2001-0288. Thandur Narsapur Form of MI tank a/c l/s 11.210 11.390 40 20 2001-0289. Thiryani Bheempur Form of Mirchiloddi tank 32.820 34.330 106 30 1996-9790. Thiryani Chiklaguda H/o Gundala Form of Motiram kunta 4.760 3.550 25 5 2001-0291. Thiryani Chinthala maadara Small kunta 3.300 3.440 20 5 1998-9992. Thiryani Chinthala maadara H/o
PangidiCheck dam/ anicut 10.000 9.860 80 25 1997-98
93. Thiryani Chinthalamadara H/o PG Madara
Small kunta 3.000 3.110 20 5 1997-98
94. Thiryani Dabaguda H/o Gundala M.I.Tank Bajirao kunta 5.000 5.160 25 25 1995-9695. Thiryani Danthanpally Small kunta 3.300 3.430 20 5 1998-9996. Thiryani Doddiguda H/o Gundala Formn. of Small kunta
Devari kunta 4.810 3.250 27 10 2001-02
97. Thiryani Ginnedhari FNT a/c Jata vorrey 24.000 25.070 110 15 2001-0298. Thiryani Goina Small kunta Chintha kunta 3.300 3.450 20 3 1998-9999. Thiryani Gopera H/o Mangi Formn. of MI tank
Singarwadi tank 30.580 2.770 150 60 2001-02
100. Thiryani Gundala Restoration of mysamma 1.820 1.690 100 40 1999-00
230

Appendices
kunta101. Thiryani Gundala Restn. of Yegatu Anicut 2.880 2.680 24 10 2001-02102. Thiryani Jevni Small kunta 3.000 3.140 22 5 1997-98103. Thiryani Kothapet H/o Ginnedhari Small kunta K.K.kunta 2.560 2.640 20 3 1997-98104. Thiryani Koutaguda H/o Mangi M.I Tank Challiah kunta 7.100 7.180 68 10 1995-96105. Thiryani Kurasguda H/o Pangidi
madaraSmall kunta Devani kunta 3.260 3.020 20 5 1997-98
106. Thiryani Lingiguda M.I.tank 4.990 5.180 35 20 1997-98107. Thiryani Pangidi maadara Small kunta Markaloddi
kunta 3.000 3.140 25 15 1997-98
108. Thiryani Pangidimadara Small kunta kotha kunta 3.300 3.120 20 10 1997-98109. Thiryani Parkaguda H/o
PangidimadaraSmall kunta Bheemanna kunta 3.300 3.030 20 15 1998-99
110. Thiryani Patelguda H/o M.G.pet Small kunta 3.000 2.810 20 10 1997-98111. Thiryani Patelguda H/o Mangi M.I.Tank Bellaji Kunta 7.500 7.760 75 25 1995-96112. Thiryani Salpalaguda H/o
PangidimadaraSmall kunta Venkatadri kunta 6.570 5.790 30 10 1997-98
113. Utnoor Chikramguda FNT a/c l/s 46.000 39.130 160 50 2002-03114. Utnoor Durgapur Restoration of L.B.tank 12.867 10.750 100 35 2001-02115. Utnoor Luxettipet Restoration of Kotha cheruvu 11.670 12.310 60 25 2001-02116. Utnoor Narsapur (B) Formation of small kunta 4.800 2.570 27 10 2005-06117. Utnoor Rajulaguda H/o Chanduri Formation of small kunta 4.900 4.740 25 4 2005-06118. Utnoor Ramalingampet Restn of anicut 4.000 3.800 200 80 2002-03119. Wankidi Navadhari FNT a/c l/s 48.550 50.020 150 70 2002-03120. Wankidi Neemgaon Restn. of M.I.Tank 3.300 0.130 89 50 1999-00
Total 2364.977 2068.37 9920 3955
FNT: Formation of new tank; a/c: across; l/s: local stream
Appendix 4.5(Reference to paragraph 4.5.2 page 140)
Statement showing the excess posts created in ex-cadre posts and expenditure incurred thereon in respect of All India Services
Period Number of posts Number of posts Number of posts Number of posts
S O E A S O E A S O E A S O E A
IAS (Fixed grade) IAS (Above super time scale) IPS IFS
2002-03 3 4 1 0.44 10 18 8 2.98 2 3 1 5.53 1 - - -
2003-04 3 2 - - 11 23 12 4.68 2 6 4 23.26 1 - - -
2004-05 3 6 3 1.37 10 27 17 7.12 2 6 4 24.84 1 - - -
2005-06 3 10 7 3.39 12 32 20 8.89 2 4 2 13.16 1 1 - -
2006-07 3 13 10 5.27 10 29 19 9.01 2 5 3 14.12 1 3 2 1.10
2007-08 - - - - - - - - 2 4 2 7.51 2 1 -
3 13 10(3/07 to 6/07)
5.27 12 31 19(3/07 to 8/07)
9.43 - - - - - - - -
3 12 9(7/07 to 8/07)
4.95 12 30 18
(9/07 to 11/07)
9.33 - - - - - - - -
3 11 8(9/07 to 10/07)
4.40 12 28 16(12/07 to 2/08)
8.29 - - - - - - - -
3 10 7(11/07 to 2/08)
3.85 - - - - - - - - - - -
Total - - - 28.94 - - - 59.73 - - - 88.42 - - - 1.10
231

Audit Report (Civil) for the year ended 31 March 2008
S: Sanctioned; O: Operated, E: Excess; A: Amount (Rupees in lakh)
232
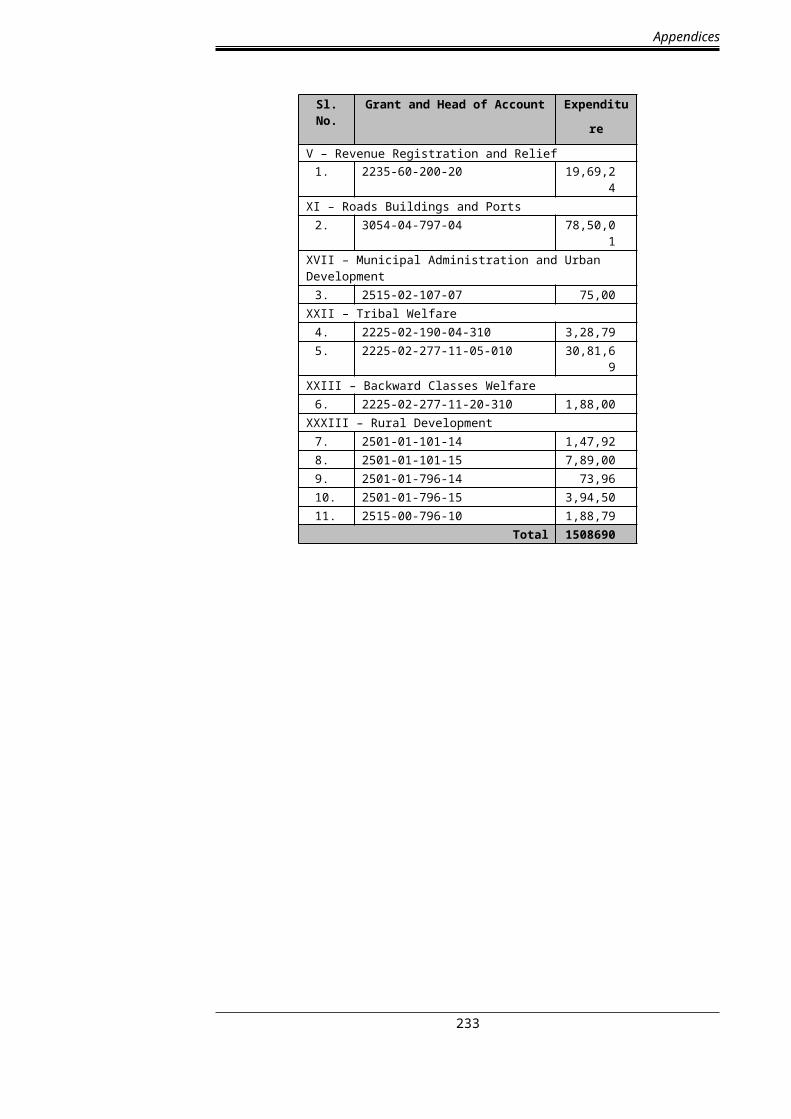
Appendices
Appendix 4.6(Reference to paragraph 4.5.5 page 144)
A. Statement showing the works sanctioned, completed and those not yet completed under MPLAD funds in five districts
(Rupees in lakh)
DRDA YearSanctioned Completed Not completed
No. of works
Estimated cost
No. of works
Estimated cost
No. of works
Estimated cost
Karimnagar 2001-02 312 425.03 303 412.53 9 12.50
2002-03 567 1004.44 551 908.99 16 95.45
2003-04 534 794.31 476 705.61 58 88.70
2004-05 261 651.34 232 552.74 29 98.60
2005-06 261 538.15 195 354.20 66 183.95
2006-07 204 405.20 93 170.20 111 235.00
Khammam 2001-02 302 611.01 302 611.01 NIL NIL
2002-03 267 409.06 264 402.56 3 6.50
2003-04 353 475.15 345 457.90 8 17.25
2004-05 226 400.14 199 347.88 27 52.26
2005-06 217 401.80 152 283.48 65 118.32
2006-07 188 375.90 53 92.40 135 283.50
Mahaboobnagar $ 2001-02 NA NA NA NA NA NA
2002-03 23 33.85 16 24.85 7 9.00
2003-04 57 69.06 40 41.96 17 27.10
2004-05 54 89.41 42 77.70 12 11.71
2005-06 39 73.72 23 49.32 16 24.40
2006-07 107 139.61 90 109.66 17 29.95
Ranga Reddy 2001-02 186 548.85 63 277.08 123 271.77
2002-03 179 499.09 92 347.72 87 151.37
2003-04 166 617.80 50 183.34 116 434.46
2004-05 111 202.35 28 92.57 83 109.78
2005-06 191 359.46 112 54.62 79 304.84
2006-07 108 429.26 27 42.60 81 386.66
Visakhapatnam 2001-02 310 563.26 270 410.01 40 153.25
2002-03 443 606.75 380 469.83 63 136.92
2003-04 381 542.73 318 394.59 63 148.14
2004-05 129 372.58 100 273.35 29 99.23
2005-06 494 987.36 358 528.00 136 459.36
2006-07 199 522.75 80 181.40 119 341.35
Total 6869 13149.42 5254 8858.10 1615 4291.32$ The figures relate to three Executing agencies only. The details for other executing agencies were not available with PD, DRDA
233
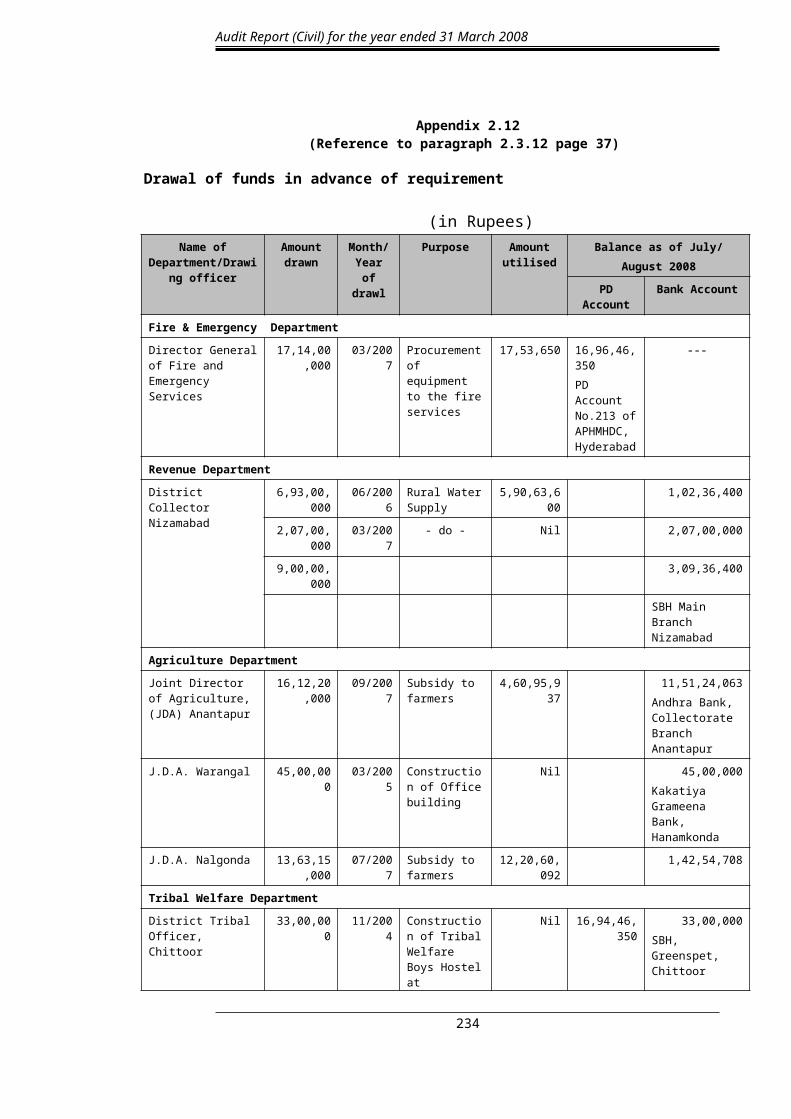
Audit Report (Civil) for the year ended 31 March 2008
B. Statement showing the details of works sanctioned but not completed (works in progress and works not commenced)
(Rupees in lakh)
DRDA Year
Works sanctioned but not completedWorks in progress Not commenced
No. of works
Estimated cost
Expenditure incurred
No. of works
Estimated cost
Amount Released
Karimnagar 2001-02 2 3.50 1.15 7 9.00 9.00
2002-03 10 77.90 27.04 6 17.55 17.55
2003-04 28 50.75 26.73 30 37.95 37.95
2004-05 27 95.60 26.11 2 3.00 3.00
2005-06 38 73.30 22.32 28 110.65 110.65
2006-07 86 148.90 23.99 25 86.10 86.10
Khammam 2001-02 NIL NIL NIL NIL NIL NIL
2002-03 2 5.00 NA 1 1.50 1.50
2003-04 6 14.75 NA 2 2.50 1.75
2004-05 23 40.45 NA 4 11.81 9.31
2005-06 21 41.52 NA 44 76.80 72.60
2006-07 68 125.30 NA 67 158.20 82.20
Mahaboobnagar 2001-02 NA NA NA NA NA NA
2002-03 5 4.70 2.83 2 4.30 NA
2003-04 12 16.90 10.30 5 10.20 NA
2004-05 10 8.51 4.86 2 3.20 2.10
2005-06 13 21.65 10.24 3 2.75 0.95
2006-07 14 23.45 10.37 3 6.50 2.50
Ranga Reddy 2001-02 52 179.19 7.50 71 92.58 22.96
2002-03 73 132.37 1.88 14 19.00 4.68
2003-04 59 326.54 8.46 57 107.92 38.53
2004-05 62 93.33 2.74 21 16.45 12.15
2005-06 66 243.04 11.69 13 61.80 29.65
2006-07 59 286.81 NA 22 99.85 21.42
Visakhapatnam 2001-02 40 153.25 20.23 NIL NIL NIL
2002-03 60 131.82 22.86 3 5.10 5.10
2003-04 60 125.14 21.27 3 23.00 23.00
2004-05 27 77.23 6.72 2 22.00 22.00
2005-06 114 421.66 43.39 22 37.70 37.50
2006-07 110 337.35 27.31 9 4.00 4.00
Total 1147 3259.91 339.99 468 1031.41 658.15
NA: Not available
234

Appendices
Appendix 4.7(Reference to paragraph 4.5.5 page 145)
Statement showing the ineligible works under MPLAD Scheme
Name of the district Inadmissible works No. of
worksAmount
(Rupees in crore)
Karimnagar(i) Construction of community halls (ii) Works at religious places (iii) Works for employees association, temples shadikhanas (iv) repairs and development works of roads etc.
309 4.32
Khammam (i) Repairs to roads (ii) Construction of community halls etc 96 2.51
Mahaboobnagar(i) Construction of community halls, grave yards (ii) electrification works (iii) repairs and improvements of roads (iv) Works of Govt. buildings, etc.
188 6.61
Ranga Reddy(i) Construction of community halls (ii) Compound walls to grave yards (iii) Electrification works (iv) Repairs and improvements to roads, etc
122 3.21
Visakhapatnam (i) Repairs and improvement to roads (ii) Construction of community halls, kalyanamandapams, etc. 107 3.62
Total 822 20.27
Appendix 4.8 (Reference to paragraph 4.5.5 page 145)
Statement showing MPLAD Scheme funds invested in FDRs
(Rupees in crore)
Name of the districtAmount deposited by
DRDA Implementing Agencies
Karimnagar 24.66 -Khammam 5.73 0.14
Mahaboobnagar 4.61 -Ranga Reddy 4.88 -
Visakhapatnam 3.19 0.65Total 43.07 0.79
Appendix 4.9(Reference to paragraph 4.5.5 page 146)
Non-transfer of assets to user agencies (Rupees in crore)
Name of the DRDA No. of works AmountKarimnagar 3404 40.70Khammam 3816 54.18
Mahaboobnagar 4967 64.32Ranga Reddy 1112 19.88
Visakhapatnam 3987 53.84Total 17286 232.92
235
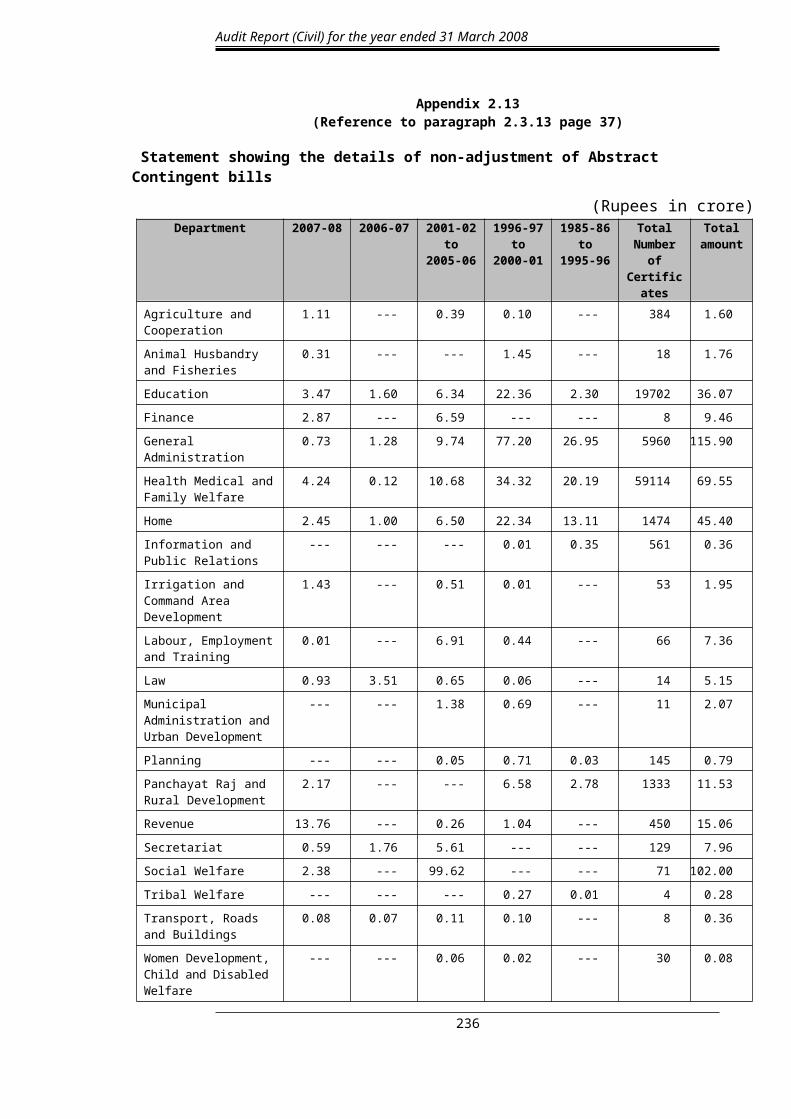
Audit Report (Civil) for the year ended 31 March 2008
Appendix 4.10(Reference to paragraph 4.5.7 page 150)
Injudicious extension of Voluntary Retirement Scheme to unidentified posts
Sl. No.
Cadre Posts identified surplus
Number of Persons given VRS benefit
No. of excess unidentified
posts for which VRS
implementedPhase
IPhase
IIPhase
III Total
1. General Manager/Regional Manager Nil Nil Nil 2 2 2
2. Divisional Manager/ Dy. General Manager
3 3 Nil 1 4 1
3. Senior Manager/Accounts Officers 10 5 4 2 11 1
4. Junior Managers/ Superintendent 9 6 1 5 12 3
5. Senior Assistants /Senior Accountants /Senior Stores Assistants/Sales Executives/Senior Credit Assistants
52 51 18 14 83 31
6. Junior Assistants/CCPAs /Junior Accountants/DEO/Plant Operator/Junior Typists
63 42 22 15 79 16
7. Salesman Nil Nil 31 Nil 31 31
8. HV Drivers Nil Nil 13 1 14 14
9. LV Drivers Nil Nil 5 5 10 10
10. HGAs/Bee Field man 3 4 Nil 1 5 2
11. MCW/Attender/Lorry Cleaner 179 154 38 25 217 38
Total 319 265 132 71 468 149
Appendix 4.11(Reference to paragraph 4.6.1 page 151)
Statement showing number of paragraphs in respect of which Explanatory Notes had not been received for specific paras from Government (as of August 2008)
A. Audit Reports for the years 1996-97 to 2000-01
Department 1996-97 1997-98 1998-99 1999-2000 2000-01 Total
Environment, Forests, Science and Technology 1 0 0 0 0 1
Health, Medical and Family Welfare 0 0 0 0 2 2
Labour, Employment, Training and Factories 0 0 0 1 0 1
Planning 0 0 0 1 0 1
Revenue 0 1 1 0 0 2
Total 1 1 1 2 2 7
236

Appendices
B. Audit Reports for the years 2001-02 to 2006-07
Department 2001-02 2002-03 2003-04 2004-05 2005-06 2006-07 Total
Agriculture and Cooperation 0 3 0 1 0 1 5
Animal Husbandry Dairy Development and Fisheries
0 1 1 0 0 1 3
Backward Classes Welfare 1 2 0 0 0 0 3
Environment, Forests, Science and Technology
0 1 1 0 1 0 3
Finance 0 0 0 0 0 2 2
Food, Civil Supplies and Consumer Affairs
0 0 0 1 1 0 2
General Administration 0 0 1 0 0 0 1
Health, Medical and Family Welfare 1 4 4 3 2 2 16
Higher Education 0 0 0 0 3 2 5
Home 0 0 1 0 1 1 3
Housing 0 0 0 1 0 0 1
Information Technology and Communications
0 0 1 0 0 0 1
Irrigation and Command Area Development
3 1 0 0 5 11 20
Labour, Employment, Training and Factories
0 0 0 1 0 0 1
Municipal Administration and Urban Development
0 0 1 2 3 4 10
Panchayati Raj 0 1 1 2 1 1 6
Planning 0 0 0 0 0 1 1
Revenue 2 3 0 1 3 1 10
Rural Development 0 1 2 3 0 5 11
School Education 3 1 2 1 2 1 10
Social Welfare 0 0 0 0 0 1 1
Transport, Roads and Building 0 0 2 0 0 4 6
Tribal Welfare 0 3 0 0 0 3 6
Women Development, Child and Disabled Welfare
0 0 1 0 1 2 4
Youth Advancement, Tourism, Arts and Culture
0 0 0 0 1 2 3
Total 10 21 18 16 24 45 134
Appendix 4.12
237

Audit Report (Civil) for the year ended 31 March 2008
(Reference to paragraph 4.6.3 page 152)
Status of outstanding Recommendations of the Public Accounts Committee as of August 2008
S. No.
Department ATNs Not Received
1. Agriculture and Co-operation 242. Animal Husbandry, Dairy Development and Fisheries 43. Backward Classes Welfare 24. Energy 05. Environment, Forests, Science and Technology 2
6. Finance 27. Food , Civil Supplies and Consumer Affairs 08. General Administration 139. Health, Medical and Family Welfare 2610. Higher Education 811. Home 212. Housing 013. Industries and Commerce 314. Irrigation and Command Area Development 22215. Labour, Employment, Training and Factories 216. Municipal Administration and Urban Development 417. Panchayati Raj 1218. Planning 019. Revenue 4620. Rural Development 621. School Education 3522. Social Welfare 923. Transport, Roads and Buildings 424. Tribal Welfare 425. Women Development, Child and Disabled Welfare 126. Youth Advancement, Tourism and Culture (Sports) 2
Total 433
Appendix 4.13(Reference to paragraph 4.6.4 page 153)
Year-wise break-up of Inspection Reports and Paragraphs
YearNumber of outstanding Number for which even first
replies have not been receivedIRs Paragraphs IRs Paragraphs
2003-04 and earlier years 6738 19499 6 772004-05 1201 3758 4 562005-06 1601 5556 27 1952006-07 1998 8468 25 1892007-08 2131 10064 1099 5364
Total 13669 47345 1161 5881
Appendix 4.14
238

Appendices
(Reference to paragraph 4.6.4 page 153)
Department-wise details of outstanding Inspection Reports and Paragraphs as on 30 June 2008
Department Number of Outstanding
Earliest year of the
outstanding IRs
Number for which even first replies
have not been received
Earliest year of the report for
which first replies have not been receivedIRs Paragraphs IRs Paragraphs
Agriculture and Cooperation 629 2188 1996-97 81 469 2002-03
Animal Husbandry, Dairy Development and Fisheries 293 847 1996-97 52 193 2003-04
Backward Classes Welfare 107 351 1996-97 13 83 2004-05
Education (Higher Education) 1888 8403 1996-97 73 569 2007-08
Education (School Education) 535 2707 1996-97 36 320 2007-08
Energy 4 9 1996-97 0 0 -
Environment, Forests, Science and Technology 348 859 1996-97 11 79 2007-08
Finance 1415 3610 1996-97 199 682 2007-08
Food, Civil Supplies and Consumer Affairs 113 274 1996-97 25 76 2007-08
General Administration 147 448 1996-97 21 60 2007-08
Health, Medical and Family Welfare 996 5217 1996-97 73 552 2007-08
Home 329 1052 1996-97 13 113 2007-08
Housing 15 191 1997-98 2 36 2003-04
Industries and Commerce 218 655 1996-97 9 40 2007-08
Information Technology and Communications 4 41 2004-05 1 4 2007-08
I& C. A D. (Project Wing) 698 1665 1996-97 4 19 2007-08
I& C. A D. (Irrigation Wing) 951 2533 1996-97 50 244 2007-08
Labour, Employment, Training & Factories 478 1269 1996-97 18 46 2007-08
Law 569 1092 1996-97 65 142 2006-07
Legislature 3 21 1996-97 0 0 -
Minorities Welfare 20 65 1996-97 4 15 1998-99
Municipal Administration and Urban Development 215 880 1996-97 25 181 2005-06
Panchayati Raj 60 325 1996-97 4 183 2006-07
Rural Development 171 1475 1996-97 10 231 2007-08
Planning 53 169 2000-01 8 36 2006-07
Public Enterprises 4 6 2003-04 2 3 2007-08
Revenue 1604 4006 1996-97 264 779 2007-08
Social Welfare 288 2037 1996-97 21 255 2003-04
Tribal Welfare 254 1450 1996-97 16 140 2005-06
Transport, Roads and Buildings 481 1224 2000-01 12 20 2007-08
Women Development, Child and Disabled Welfare 617 1719 1996-97 25 182 2007-08
Youth Advancement, Tourism and Culture 162 557 1996-97 24 129 1997-98
Total 13669 47345 1161 5881
Appendix 4.15
239

Audit Report (Civil) for the year ended 31 March 2008
(Reference to paragraph 4.6.4 page 153)
Departments which have not conducted State level Departmental Audit and Accounts Committee Meetings since reconstitution in June 2004
Sl. no. Department
1 Backward Classes Welfare
2 Energy
3 Environment, Forests, Science and Technology
4 Finance (Works and Projects)
5 Health, Medical and Family Welfare
6 Higher Education
7 Housing
8 Industries and Commerce
9 Irrigation and Command Area Development
10 Law
11 Legislature
12 Minorities Welfare
13 Planning
14 Public Enterprises
15 Revenue
16 Social Welfare
17 Transport, Roads and Buildings
18 Youth Advancement, Tourism and Culture
240