appendix h. faro dataonlinepubs.trb.org/onlinepubs/nchrp/nchrp_w197appendixh.pdf · h-1 appendix h....
TRANSCRIPT
H-1
APPENDIX H. FARO DATA
The FARO was used to track the motions of 57 targets applied to the gussets and members. Figure H1 shows the approximate locations of these targets. On each member there were three targets located near the mid depth of the member. These were measured by placing the spherically mounted reflector (SMR) in a “pin nest” which has a 0.25 inch diameter shoulder. For the first three specimens, the pin nest was slipped into aluminum blocks with 0.25 inch diameter holes drilled in them, which were in turn glued to the members. However, this mounting solution proved to be unreliable because of the frequency the targets would debond, plus the locations were not constant from one specimen to the next. From the fourth specimen onward, 0.25 inch diameter holes were drilled directly into the members to accept the pin nest.
The remaining 42 targets were mounted on select bolts connecting the gusset plate and members. A special machined nut was threaded onto the bolt stickout that could solidly accept the SMR for a repeatable measurement. Since each plate had its own unique geometry and bolt pattern, the same bolts were not tracked for each specimen.
The FARO system was always positioned on the North side of the load frame for monitoring the targets during testing. Therefore, targets on the south side of the load frame could not be monitored during testing. Though, when the gusset plate shapes were encoded pre- and post-test, a “device move” was used to reposition the FARO to the south side to attain data in a consistent coordinate system.
Every specimen had a coordinate system established as shown in Figure H1. The SMR with an “edge nest” was swept along the bottom horizontal edge of the gusset plate and the West vertical edge. The best-fit line through the horizontal edge data defined the x-axis. The origin of the coordinate system was defined as the intersection of the best-fit lines from the horizontal and vertical edge data. The software automatically establishes an orthogonal coordinate system once the x-axis is defined, and a general direction of +y. The right-hand rule is used to establish the +z direction, which in this case is to the south.
Before each test was started, zero data was taken with no load applied to any of the members. Subsequently throughout the testing, the data was collected from all 57 targets at each hold in load. This allowed for the relative motion of each target to be calculated considering the pre-test location to be the zero locations.
For brevity, this appendix will only present the data from the final test to failure for each specimen. For all specimens, the same series of plots will be presented in this appendix. Sometimes data was accidently not collected and no figure could be made. A description of the plots are as follows:
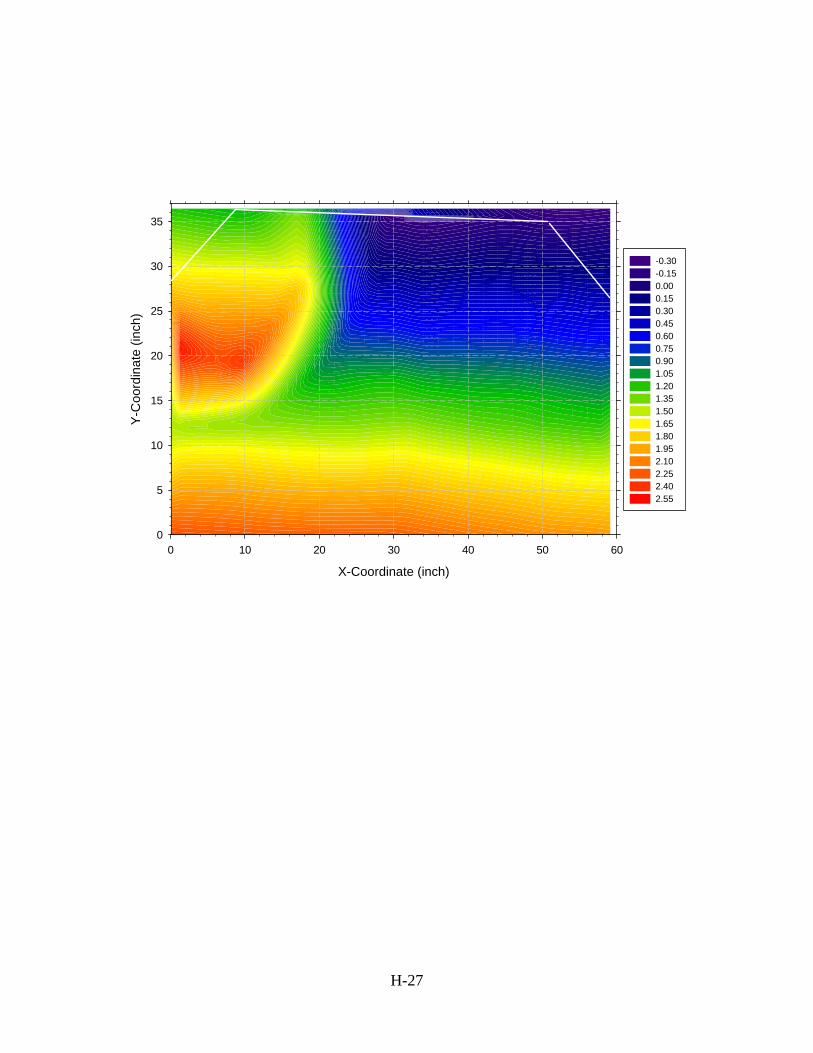
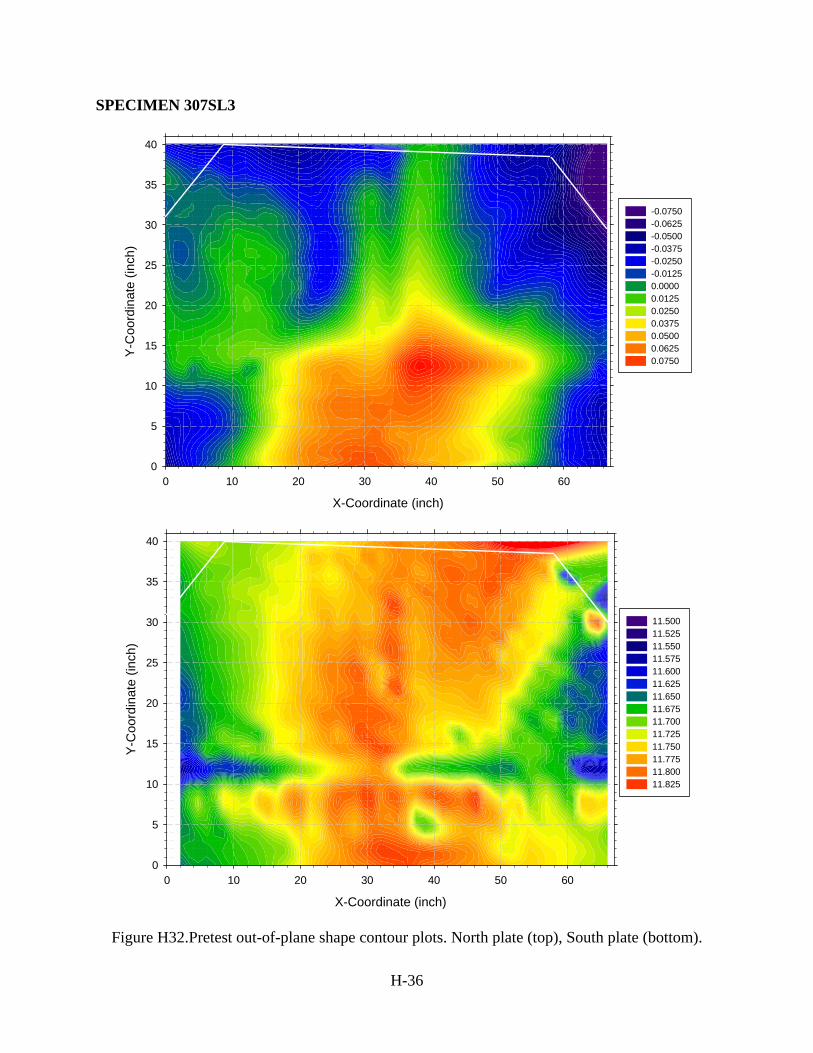
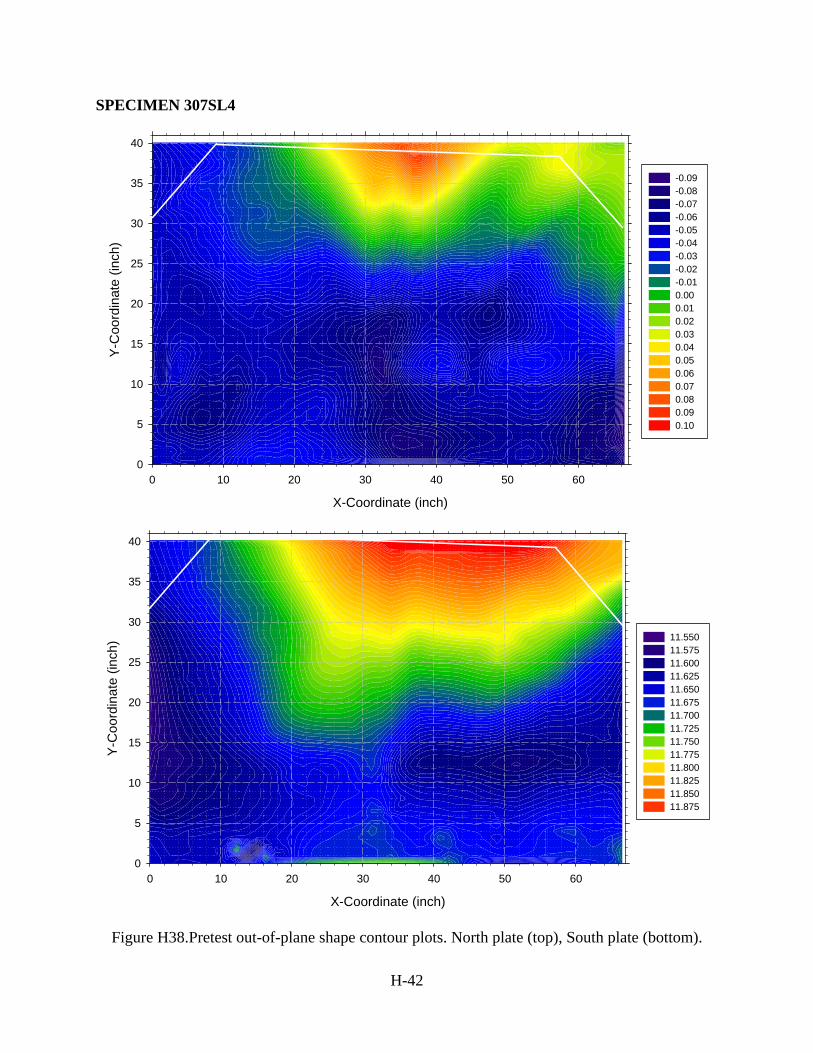
1. “ Pretest out-of-plane shape contour plots”. Before each test, the SMR was swept across the entire gusset plate surface of the as-built connection, collecting a data point approximately every square inch. This data was used to develop out-of-plane shape contour plots. These plots were used to define initial imperfections into the finite element models to predict the failure of the specimens. Note, the program used to create these contour plots could only work with rectangular data
H-2
sets, and would interpolate data where there was none. Therefore, the data is only valid in the places the gusset plate exists. In some plots white or black lines are shown to provide reference of where the plate boundary is.
2. “ Pretest planar alignments”. These plots show the relative alignment of the members to each other. They were developed by fitting a best-fit line through the three targets applied to the members. Three plots are presented for each of the three orthogonal views.
3. “ Amplified displacement (x50) of member targets”. These three plots show the relative movement of the members (based on the three targets applied to each) from the pretest location, to the step in the failure loading sequence when the last FARO data was collected. This is presented in terms of an applied load fraction (ALF). The displacement has been multiplied by 50 times, such that the relative motion of the targets using the axis scale must be divided by 50 to get the real displacement.
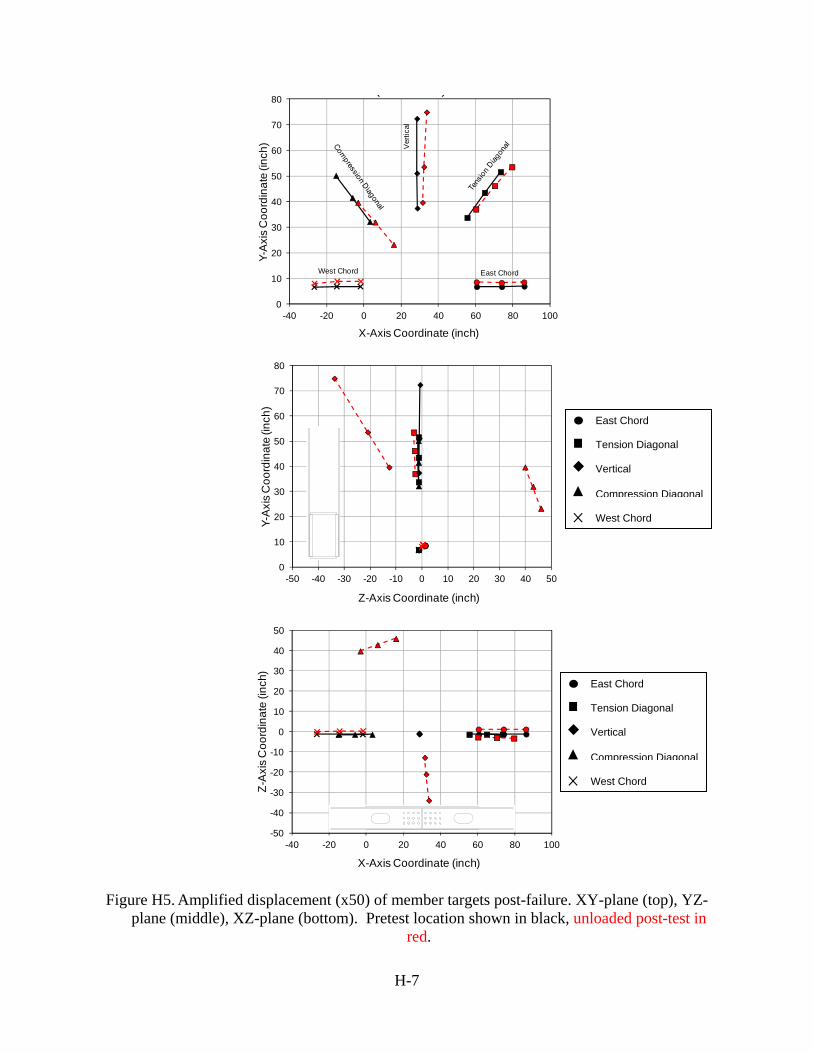
4. “Amplified displacement (x50) of member targets, post-failure” Like the plots described in #3, these show the relative movement of the members from the pretest unloaded state, to the post-test unloaded state.
5. “ Vector motions of gusset plate targets”. The vector plots show the relative motion of the gusset plate targets from the pretest, unloaded position to the post-test, unloaded position. Generally these give an indication of the gusset plate deformation. The tail of the vector is the pretest location, the head of the vector is the post-test location. These plots were very helpful in distinguishing between shear and buckling failures.
6. “ Post-test out-of-plane shape contour plots”. After the gusset plate had failed, the SMR was swept over the surface of the plates and data points were collected roughly every square inch. This data was used to develop out-of-plane deformation contour plots of the deformed shape.
At the end of the experimental study, the real shape of the five members was measured with the FARO and compared to the three target points on each member. This was done to establish the accuracy of the “best-fit” lines through the three target data points assumed in many of the plots within this appendix.

H-3
Eas
t She
ar
Wal
l
Wes
t She
ar W
all
1
2
3 6
5
4 7
8
9 12
11
10 13
14
15 18
17
16 19
20
21 24
23
22
25
26
27
29
28
30
31
32
3436
35 33
37
38
39
42
41
40
57 56 55
54
53
52
4443
49
50
51
Compr
essio
n Diag
onalV
ertic
al
Tension Diagonal
+Y
+X
Right-hand rule to define +Z direction
Figure H1. Locations of FARO targets.
SPECIMEN 307SS3 .................................................................................................................. H-4
SPECIMEN 490SS3 ................................................................................................................ H-10
SPECIMEN 490LS3................................................................................................................ H-15
SPECIMEN 490LS3-1 ............................................................................................................ H-22
SPECIMEN 307LS3................................................................................................................ H-29
SPECIMEN 307SL3................................................................................................................ H-36
SPECIMEN 307SL4................................................................................................................ H-42
SPECIMEN 490LS3-2 ............................................................................................................ H-49
SPECIMEN 490SS3-1 ............................................................................................................. H-55
SPECIMEN 307SS3-1 ............................................................................................................. H-62
SPECIMEN 307SS3-2 ............................................................................................................. H-68
SPECIMEN 307SS3-3 ............................................................................................................. H-74
SPECIMEN 307SS3-4 ............................................................................................................. H-80
MEMBER SHAPE .................................................................................................................. H-85

H-4
SPECIMEN 307SS3
NO DATA COLLECTED FOR SOUTH PLATE
Figure H2. Pretest out-of-plane shape contour plots. North plate (top), South plate (bottom).
X-Coordinate (inch)
0 10 20 30 40 50 60
Y-C
oord
inat
e (in
ch)
0
5
10
15
20
25
30
35
-0.03 -0.02 -0.01 0.00 0.01 0.02 0.03 0.04 0.05 0.06 0.07 0.08 0.09 0.10 0.11 0.12

H-5
Figure H3. Pretest planar alignments. XY-plane (top), YZ-plane (middle), XZ-plane (bottom).
0
10
20
30
40
50
60
70
80
-40 -20 0 20 40 60 80 100
Y-A
xis
Co
ord
ina
te (i
nch
)
X-Axis Coordinate (inch)
East Chord
Tension Diagonal
Vertical
Compression Diagonal
West Chord
0
10
20
30
40
50
60
70
80
-2.00 -1.75 -1.50 -1.25 -1.00 -0.75 -0.50 -0.25 0.00
Y-A
xis
Co
ord
ina
te (i
nch
)
Z-Axis Coordinate (inch)
East Chord
Tension Diagonal
Vertical
Compresion Diagonal
West Chord
-2.00
-1.75
-1.50
-1.25
-1.00
-0.75
-0.50
-0.25
0.00
-40 -20 0 20 40 60 80 100
Z-A
xis
Co
ord
ina
te (
inch
)
X-Axis Coordinate (inch)
East Chord
Tension Diagonal
Vertical
Compression Diagonal
West Chord

H-6
Figure H4. Amplified displacement (x50) of member targets at an ALF of 0.62. XY-plane (top), YZ-plane (middle), XZ-plane (bottom). Pretest location shown in black, under load in red.
0
10
20
30
40
50
60
70
80
-40 -20 0 20 40 60 80 100
Y-A
xis
Co
ord
ina
te (i
nch
)
X-Axis Coordinate (inch)
( )
Ver
tical
East ChordWest Chord
0
10
20
30
40
50
60
70
80
-40 -30 -20 -10 0 10 20 30 40
Y-A
xis
Co
ord
ina
te (i
nch
)
Z-Axis Coordinate (inch)
-40
-30
-20
-10
0
10
20
30
40
-40 -20 0 20 40 60 80 100
Z-A
xis
Co
ord
ina
te (
inch
)
X-Axis Coordinate (inch)
H-7
Figure H5. Amplified displacement (x50) of member targets post-failure. XY-plane (top), YZ-plane (middle), XZ-plane (bottom). Pretest location shown in black, unloaded post-test in
red.
0
10
20
30
40
50
60
70
80
-40 -20 0 20 40 60 80 100
Y-A
xis
Co
ord
ina
te (i
nch
)
X-Axis Coordinate (inch)
( )
Ver
tical
East ChordWest Chord
0
10
20
30
40
50
60
70
80
-50 -40 -30 -20 -10 0 10 20 30 40 50
Y-A
xis
Co
ord
ina
te (i
nch
)
Z-Axis Coordinate (inch)
-50
-40
-30
-20
-10
0
10
20
30
40
50
-40 -20 0 20 40 60 80 100
Z-A
xis
Co
ord
ina
te (
inch
)
X-Axis Coordinate (inch)
East Chord
Tension Diagonal
Vertical
Compression Diagonal
West Chord
East Chord
Tension Diagonal
Vertical
Compression Diagonal
West Chord

H-8
Figure H6. Vector motions of gusset plate targets amplified 50 times.
-10
0
10
20
30
40
-10 0 10 20 30 40 50 60 70
Y-A
xis
Coo
rdin
ate
(inch
)
X-Axis Coordinate (inch)

H-9
Figure H7. Post-test out-of-plane shape contour plots. North plate (top), South plate (bottom).
X-Coordinate (inch)
0 10 20 30 40 50 60
Y-C
oord
inat
e (
inch
)
0
5
10
15
20
25
30
35
-12.750 -12.625 -12.500 -12.375 -12.250 -12.125 -12.000 -11.875 -11.750 -11.625 -11.500 -11.375 -11.250
X-Coordinate (inch)
0 10 20 30 40 50 60
Y-C
oord
inat
e (in
ch)
0
5
10
15
20
25
30
35
-0.875 -0.750 -0.625 -0.500 -0.375 -0.250 -0.125 0.000 0.125 0.250 0.375

H-10
SPECIMEN 490SS3
Figure H8. Pretest out-of-plane shape contour plots. North plate (top), South plate (bottom).
X-Coordinate (inch)
0 10 20 30 40 50
Y-C
oord
inat
e (in
ch)
0
5
10
15
20
25
30
35
-0.150 -0.135 -0.120 -0.105 -0.090 -0.075 -0.060 -0.045 -0.030 -0.015 0.000 0.015 0.030 0.045
X-Coordinate (inch)
0 10 20 30 40 50
Y-C
oord
inat
e (
inch
)
0
5
10
15
20
25
30
35
11.655 11.670 11.685 11.700 11.715 11.730 11.745 11.760 11.775 11.790 11.805 11.820 11.835

H-11
Figure H9. Pretest planar alignments. XY-plane (top), YZ-plane (middle), XZ-plane (bottom).
0
10
20
30
40
50
60
70
80
-40 -20 0 20 40 60 80 100
Y-A
xis
Co
ord
ina
te (i
nch
)
X-Axis Coordinate (inch)
West Chord East Chord
Ve
rtic
al
0
10
20
30
40
50
60
70
80
-2.00 -1.75 -1.50 -1.25 -1.00 -0.75 -0.50 -0.25 0.00
Y-A
xis
Co
ord
ina
te (i
nch
)
Z-Axis Coordinate (inch)
-2.00
-1.75
-1.50
-1.25
-1.00
-0.75
-0.50
-0.25
0.00
-40 -20 0 20 40 60 80 100
Z-A
xis
Co
ord
ina
te (
inch
)
X-Axis Coordinate (inch)

H-12
Figure H10. Amplified displacement (x50) of member targets at an ALF of 0.54. XY-plane (top), YZ-plane (middle), XZ-plane (bottom). Pretest location shown in black, under load in red.
0
10
20
30
40
50
60
70
80
-40 -20 0 20 40 60 80 100
Y-A
xis
Co
ord
ina
te (i
nch
)
X-Axis Coordinate (inch)
Ver
tical
East ChordWest Chord
0
10
20
30
40
50
60
70
80
-40 -30 -20 -10 0 10 20 30 40
Y-A
xis
Co
ord
ina
te (i
nch
)
Z-Axis Coordinate (inch)
-40
-30
-20
-10
0
10
20
30
40
-40 -20 0 20 40 60 80 100
Z-A
xis
Co
ord
ina
te (
inch
)
X-Axis Coordinate (inch)

H-13
MEASUREMENTS NOT COLLECTED
Figure H11. Amplified displacement (x50) of member targets post-failure. XY-plane (top), YZ-plane (middle), XZ-plane (bottom). Pretest location shown in black, unloaded post-test in
red.
MEASUREMENTS NOT COLLECTED
Figure H12. Vector motions of gusset plate targets amplified 50 times.

H-14
Figure H13. Post-test out-of-plane shape contour plots. North plate (top), South plate (bottom).
X-Coordinate (inch)
0 10 20 30 40 50
Y-C
oo
rdin
ate
(in
ch)
0
5
10
15
20
25
30
35
-0.2 -0.1 0.0 0.1 0.2 0.3 0.4 0.5 0.6 0.7 0.8 0.9 1.0 1.1 1.2
X-Coordinate (inch)
0 10 20 30 40 50
Y-C
oord
inat
e (i
nch
)
0
5
10
15
20
25
30
35
11.5 11.6 11.7 11.8 11.9 12.0 12.1 12.2 12.3 12.4 12.5 12.6 12.7 12.8 12.9 13.0

H-15
SPECIMEN 490LS3
Figure H14. Pretest out-of-plane shape contour plots. North plate (top), South plate (bottom).
X-Coordinate (inch)
0 10 20 30 40 50 60
Y-C
oord
inat
e (
inch
)
0
5
10
15
20
25
30
35
-0.16 -0.14 -0.12 -0.10 -0.08 -0.06 -0.04 -0.02 0.00 0.02 0.04 0.06 0.08
X-Coordinate (inch)
0 10 20 30 40 50
Y-C
oord
inat
e (in
ch)
0
5
10
15
20
25
30
35
11.58 11.60 11.62 11.64 11.66 11.68 11.70 11.72 11.74 11.76 11.78 11.80 11.82 11.84

H-16
Figure H15. Pretest planar alignments. XY-plane (top), YZ-plane (middle), XZ-plane (bottom).
0
10
20
30
40
50
60
70
80
-40 -20 0 20 40 60 80 100
Y-A
xis
Co
ord
ina
te (i
nch
)
X-Axis Coordinate (inch)
West Chord East Chord
Ve
rtica
l
0
10
20
30
40
50
60
70
80
-1.50 -1.25 -1.00 -0.75 -0.50 -0.25 0.00 0.25 0.50
Y-A
xis
Co
ord
ina
te (i
nch
)
Z-Axis Coordinate (inch)
-1.50
-1.25
-1.00
-0.75
-0.50
-0.25
0.00
0.25
0.50
-40 -20 0 20 40 60 80 100
Z-A
xis
Co
ord
ina
te (
inch
)
X-Axis Coordinate (inch)

H-17
Figure H16. Amplified displacement (x50) of member targets at an ALF of (STEP 10). XY-plane (top), YZ-plane (middle), XZ-plane (bottom). Pretest location shown in black, under load in
red.
0
10
20
30
40
50
60
70
80
90
-40 -20 0 20 40 60 80 100
Y-A
xis
Co
ord
ina
te (i
nch
)
X-Axis Coordinate (inch)
( )
Ver
tical
East ChordWest Chord
0
10
20
30
40
50
60
70
80
90
-40 -30 -20 -10 0 10 20 30 40
Y-A
xis
Co
ord
ina
te (i
nch
)
Z-Axis Coordinate (inch)
-40
-30
-20
-10
0
10
20
30
40
-40 -20 0 20 40 60 80 100
Z-A
xis
Co
ord
ina
te (
inch
)
X-Axis Coordinate (inch)

H-18
Figure H17. Amplified displacement (x50) of member targets post-failure. XY-plane (top), YZ-plane (middle), XZ-plane (bottom). Pretest location shown in black, unloaded post-test in
red.
0
10
20
30
40
50
60
70
80
-40 -20 0 20 40 60 80 100
Y-A
xis
Co
ord
ina
te (i
nch
)
X-Axis Coordinate (inch)
( )
Ver
tical
East ChordWest Chord
0
10
20
30
40
50
60
70
80
-40 -30 -20 -10 0 10 20 30 40
Y-A
xis
Co
ord
ina
te (i
nch
)
Z-Axis Coordinate (inch)
-40
-30
-20
-10
0
10
20
30
40
-40 -20 0 20 40 60 80 100
Z-A
xis
Co
ord
ina
te (
inch
)
X-Axis Coordinate (inch)

H-19
Figure H18. Vector motions of gusset plate targets amplified 50 times.
-10
0
10
20
30
40
-10 0 10 20 30 40 50 60 70
Y-A
xis
Coo
rdin
ate
(inch
)
X-Axis Coordinate (inch)

H-20
X-Coordinate (inch)
0 10 20 30 40 50 60
Y-C
oor
din
ate
(in
ch)
0
5
10
15
20
25
30
35
-0.25 0.00 0.25 0.50 0.75 1.00 1.25 1.50 1.75 2.00 2.25 2.50 2.75 3.00
X-Coordinate (inch)
0 10 20 30 40 50
Y-C
oord
inat
e (in
ch)
0
5
10
15
20
25
30
35
11.6 11.8 12.0 12.2 12.4 12.6 12.8 13.0 13.2 13.4 13.6 13.8 14.0 14.2 14.4 14.6 14.8

H-21
Figure H19. Post-test out-of-plane shape contour plots. North plate (top), South plate (bottom).

H-22
SPECIMEN 490LS3-1
Figure H20. Pretest out-of-plane shape contour plots. North plate (top), South plate (bottom).
X-Coordinate (inch)
0 10 20 30 40 50 60
Y-C
oord
inat
e (
inch
)
0
5
10
15
20
25
30
35
-0.16 -0.14 -0.12 -0.10 -0.08 -0.06 -0.04 -0.02 0.00 0.02 0.04 0.06 0.08 0.10 0.12
X-Coordinate (inch)
0 10 20 30 40 50 60
Y-C
oord
inat
e (
inch
)
0
5
10
15
20
25
30
35
11.68 11.70 11.72 11.74 11.76 11.78 11.80 11.82 11.84 11.86 11.88 11.90 11.92 11.94 11.96 11.98 12.00

H-23
Figure H21. Pretest planar alignments. XY-plane (top), YZ-plane (middle), XZ-plane (bottom).
0
10
20
30
40
50
60
70
80
-40 -20 0 20 40 60 80 100
Y-A
xis
Co
ord
ina
te (i
nch
)
X-Axis Coordinate (inch)
West Chord East Chord
Ve
rtic
al
0
10
20
30
40
50
60
70
80
-1.25 -1.00 -0.75 -0.50 -0.25 0.00 0.25 0.50 0.75
Y-A
xis
Co
ord
ina
te (i
nch
)
Z-Axis Coordinate (inch)
-1.25
-1.00
-0.75
-0.50
-0.25
0.00
0.25
0.50
0.75
-40 -20 0 20 40 60 80 100
Z-A
xis
Co
ord
ina
te (
inch
)
X-Axis Coordinate (inch)

H-24
Figure H22. Amplified displacement (x50) of member targets at an ALF of 0.74. XY-plane (top), YZ-plane (middle), XZ-plane (bottom). Pretest location shown in black, under load in red.
-10
0
10
20
30
40
50
60
70
80
-40 -20 0 20 40 60 80 100
Y-A
xis
Co
ord
ina
te (i
nch
)
X-Axis Coordinate (inch)
( )
-10
0
10
20
30
40
50
60
70
80
-40 -30 -20 -10 0 10 20 30 40
Y-A
xis
Co
ord
ina
te (i
nch
)
Z-Axis Coordinate (inch)
-40
-30
-20
-10
0
10
20
30
40
-40 -20 0 20 40 60 80 100
Z-A
xis
Co
ord
ina
te (
inch
)
X-Axis Coordinate (inch)

H-25
Figure H23. Amplified displacement (x50) of member targets post-failure. XY-plane (top), YZ-plane (middle), XZ-plane (bottom). Pretest location shown in black, unloaded post-test in
red.
0
10
20
30
40
50
60
70
80
-40 -20 0 20 40 60 80 100
Y-A
xis
Co
ord
ina
te (i
nch
)
X-Axis Coordinate (inch)
( )
Ver
tical
East ChordWest Chord
0
10
20
30
40
50
60
70
80
-250 -200 -150 -100 -50 0 50 100 150 200 250
Y-A
xis
Co
ord
ina
te (i
nch
)
Z-Axis Coordinate (inch)
-250
-200
-150
-100
-50
0
50
100
150
200
250
-40 -20 0 20 40 60 80 100
Z-A
xis
Co
ord
ina
te (
inch
)
X-Axis Coordinate (inch)

H-26
Figure H24. Vector motions of gusset plate targets amplified 50 times.
-10
0
10
20
30
40
-10 0 10 20 30 40 50 60 70
Y-A
xis
Coo
rdin
ate
(inch
)
X-Axis Coordinate (inch)
H-27
X-Coordinate (inch)
0 10 20 30 40 50 60
Y-C
oord
inat
e (i
nch)
0
5
10
15
20
25
30
35
-0.30 -0.15 0.00 0.15 0.30 0.45 0.60 0.75 0.90 1.05 1.20 1.35 1.50 1.65 1.80 1.95 2.10 2.25 2.40 2.55

H-28
Figure H25. Post-test out-of-plane shape contour plots. North plate (top), South plate (bottom).
X-Coordinate (inch)
0 10 20 30 40 50 60
Y-C
oord
inat
e (i
nch)
0
5
10
15
20
25
30
35
12.90 13.05 13.20 13.35 13.50 13.65 13.80 13.95 14.10 14.25 14.40 14.55 14.70 14.85 15.00 15.15 15.30 15.45 15.60 15.75

H-29
SPECIMEN 307LS3
Figure H26. Pretest out-of-plane shape contour plots. North plate (top), South plate (bottom).
X-Coordinate (inch)
0 10 20 30 40 50 60
Y-C
oord
inat
e (in
ch)
0
5
10
15
20
25
30
35
40
-0.04 -0.02 0.00 0.02 0.04 0.06 0.08 0.10 0.12 0.14 0.16 0.18
X-Coordinate (inch)
0 10 20 30 40 50 60
Y-C
oord
inat
e (
inch
)
0
5
10
15
20
25
30
35
40
11.56 11.58 11.60 11.62 11.64 11.66 11.68 11.70 11.72 11.74 11.76 11.78 11.80 11.82 11.84 11.86 11.88 11.90 11.92 11.94 11.96

H-30
Figure H27. Pretest planar alignments. XY-plane (top), YZ-plane (middle), XZ-plane (bottom).
0
10
20
30
40
50
60
70
80
-40 -20 0 20 40 60 80 100
Y-A
xis
Co
ord
ina
te (i
nch
)
X-Axis Coordinate (inch)
West Chord East Chord
Ve
rtica
l
0
10
20
30
40
50
60
70
80
-1.25 -1.00 -0.75 -0.50 -0.25 0.00 0.25 0.50 0.75
Y-A
xis
Co
ord
ina
te (i
nch
)
Z-Axis Coordinate (inch)
-1.25
-1.00
-0.75
-0.50
-0.25
0.00
0.25
0.50
0.75
-40 -20 0 20 40 60 80 100
Z-A
xis
Co
ord
ina
te (
inch
)
X-Axis Coordinate (inch)

H-31
Figure H28. Amplified displacement (x50) of member targets at an ALF of 1.00. XY-plane (top), YZ-plane (middle), XZ-plane (bottom). Pretest location shown in black, under load in red.
0
10
20
30
40
50
60
70
80
-40 -20 0 20 40 60 80 100 120
Y-A
xis
Co
ord
ina
te (i
nch
)
X-Axis Coordinate (inch)
( )
Ver
tical
East ChordWest Chord
0
10
20
30
40
50
60
70
80
-40 -30 -20 -10 0 10 20 30 40
Y-A
xis
Co
ord
ina
te (i
nch
)
Z-Axis Coordinate (inch)
-40
-30
-20
-10
0
10
20
30
40
-40 -20 0 20 40 60 80 100 120
Z-A
xis
Co
ord
ina
te (
inch
)
X-Axis Coordinate (inch)

H-32
Figure H29. Amplified displacement (x50) of member targets post-failure. XY-plane (top), YZ-plane (middle), XZ-plane (bottom). Pretest location shown in black, unloaded post-test in
red.
0
10
20
30
40
50
60
70
80
-40 -20 0 20 40 60 80 100
Y-A
xis
Co
ord
ina
te (i
nch
)
X-Axis Coordinate (inch)
( )
Ver
tical
East ChordWest Chord
0
10
20
30
40
50
60
70
80
-100 -75 -50 -25 0 25 50 75 100
Y-A
xis
Co
ord
ina
te (i
nch
)
Z-Axis Coordinate (inch)
-100
-75
-50
-25
0
25
50
75
100
-40 -20 0 20 40 60 80 100
Z-A
xis
Co
ord
ina
te (
inch
)
X-Axis Coordinate (inch)
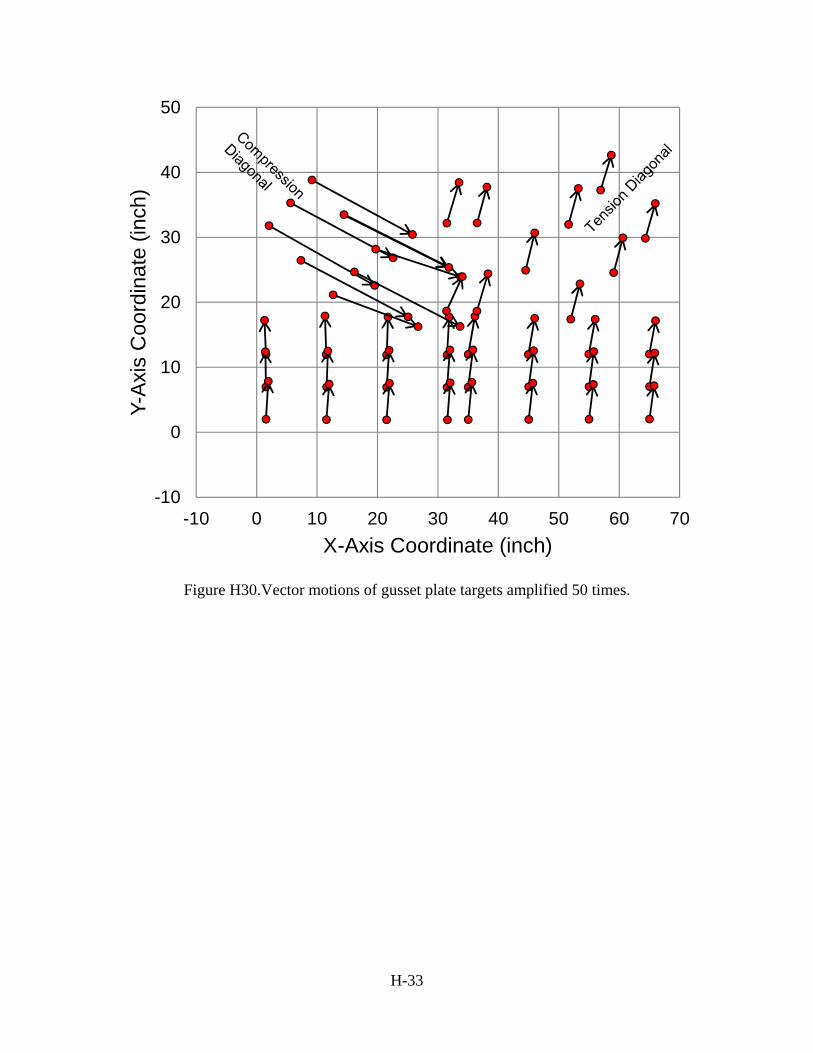
H-33
Figure H30. Vector motions of gusset plate targets amplified 50 times.
-10
0
10
20
30
40
50
-10 0 10 20 30 40 50 60 70
Y-A
xis
Coo
rdin
ate
(inch
)
X-Axis Coordinate (inch)

H-34
X-Coordinate (inch)
0 10 20 30 40 50 60
Y-C
oord
inat
e (i
nch)
0
5
10
15
20
25
30
35
40
-0.2 0.0 0.2 0.4 0.6 0.8 1.0 1.2 1.4 1.6 1.8 2.0 2.2

H-35
Figure H31. Post-test out-of-plane shape contour plots. North plate (top), South plate (bottom).
X-Coordinate (inch)
0 10 20 30 40 50 60
Y-C
oord
inat
e (i
nch)
0
5
10
15
20
25
30
35
40
11.6 11.8 12.0 12.2 12.4 12.6 12.8 13.0 13.2 13.4 13.6 13.8
H-36
SPECIMEN 307SL3
Figure H32. Pretest out-of-plane shape contour plots. North plate (top), South plate (bottom).
X-Coordinate (inch)
0 10 20 30 40 50 60
Y-C
oord
inat
e (
inch
)
0
5
10
15
20
25
30
35
40
-0.0750 -0.0625 -0.0500 -0.0375 -0.0250 -0.0125 0.0000 0.0125 0.0250 0.0375 0.0500 0.0625 0.0750
X-Coordinate (inch)
0 10 20 30 40 50 60
Y-C
oord
inat
e (i
nch)
0
5
10
15
20
25
30
35
40
11.500 11.525 11.550 11.575 11.600 11.625 11.650 11.675 11.700 11.725 11.750 11.775 11.800 11.825

H-37
Figure H33. Pretest planar alignments. XY-plane (top), YZ-plane (middle), XZ-plane (bottom).
0
10
20
30
40
50
60
70
80
-40 -20 0 20 40 60 80 100
Y-A
xis
Co
ord
ina
te (i
nch
)
X-Axis Coordinate (inch)
West Chord East Chord
Ve
rtic
al
0
10
20
30
40
50
60
70
80
-1.25 -1.00 -0.75 -0.50 -0.25 0.00 0.25 0.50 0.75
Y-A
xis
Co
ord
ina
te (i
nch
)
Z-Axis Coordinate (inch)
-1.25
-1.00
-0.75
-0.50
-0.25
0.00
0.25
0.50
0.75
-40 -20 0 20 40 60 80 100
Z-A
xis
Co
ord
ina
te (
inch
)
X-Axis Coordinate (inch)

H-38
Figure H34. Amplified displacement (x50) of member targets at an ALF of 0.77. XY-plane (top), YZ-plane (middle), XZ-plane (bottom). Pretest location shown in black, under load in red.
0
10
20
30
40
50
60
70
80
-40 -20 0 20 40 60 80 100
Y-A
xis
Co
ord
ina
te (i
nch
)
X-Axis Coordinate (inch)
( )
Ver
tical
East ChordWest Chord
0
10
20
30
40
50
60
70
80
-40 -30 -20 -10 0 10 20 30 40
Y-A
xis
Co
ord
ina
te (i
nch
)
Z-Axis Coordinate (inch)
-40
-30
-20
-10
0
10
20
30
40
-40 -20 0 20 40 60 80 100
Z-A
xis
Co
ord
ina
te (
inch
)
X-Axis Coordinate (inch)

H-39
Figure H35. Amplified displacement (x50) of member targets post-failure. XY-plane (top), YZ-plane (middle), XZ-plane (bottom). Pretest location shown in black, unloaded post-test in
red.
0
10
20
30
40
50
60
70
80
-40 -20 0 20 40 60 80 100 120
Y-A
xis
Co
ord
ina
te (i
nch
)
X-Axis Coordinate (inch)
Ver
tical
East ChordWest Chord
0
10
20
30
40
50
60
70
80
-200 -150 -100 -50 0 50 100 150 200
Y-A
xis
Co
ord
ina
te (i
nch
)
Z-Axis Coordinate (inch)
-200
-150
-100
-50
0
50
100
150
200
-40 -20 0 20 40 60 80 100 120
Z-A
xis
Co
ord
ina
te (
inch
)
X-Axis Coordinate (inch)

H-40
Figure H36. Vector motions of gusset plate targets amplified 50 times.
-10
0
10
20
30
40
-10 0 10 20 30 40 50 60 70 80
Y-A
xis
Coo
rdin
ate
(inch
)
X-Axis Coordinate (inch)

H-41
Figure H37. Post-test out-of-plane shape contour plots. North plate (top), South plate (bottom).
X-Coordinate (inch)
0 10 20 30 40 50 60
Y-C
oord
inat
e (i
nch)
0
5
10
15
20
25
30
35
40
-1.500 -1.375 -1.250 -1.125 -1.000 -0.875 -0.750 -0.625 -0.500 -0.375 -0.250 -0.125 0.000 0.125 0.250 0.375 0.500 0.625 0.750 0.875 1.000
X-Coordinate (inch)
0 10 20 30 40 50 60
Y-C
oord
inat
e (in
ch)
0
5
10
15
20
25
30
35
40
10.500 10.625 10.750 10.875 11.000 11.125 11.250 11.375 11.500 11.625 11.750 11.875 12.000 12.125 12.250 12.375 12.500 12.625 12.750
H-42
SPECIMEN 307SL4
Figure H38. Pretest out-of-plane shape contour plots. North plate (top), South plate (bottom).
X-Coordinate (inch)
0 10 20 30 40 50 60
Y-C
oord
inat
e (
inch
)
0
5
10
15
20
25
30
35
40
-0.09 -0.08 -0.07 -0.06 -0.05 -0.04 -0.03 -0.02 -0.01 0.00 0.01 0.02 0.03 0.04 0.05 0.06 0.07 0.08 0.09 0.10
X-Coordinate (inch)
0 10 20 30 40 50 60
Y-C
oo
rdin
ate
(in
ch)
0
5
10
15
20
25
30
35
40
11.550 11.575 11.600 11.625 11.650 11.675 11.700 11.725 11.750 11.775 11.800 11.825 11.850 11.875

H-43
Figure H39. Pretest planar alignments. XY-plane (top), YZ-plane (middle), XZ-plane (bottom).
0
10
20
30
40
50
60
70
80
-40 -20 0 20 40 60 80 100
Y-A
xis
Co
ord
ina
te (i
nch
)
X-Axis Coordinate (inch)
West Chord East Chord
Ve
rtica
l
0
10
20
30
40
50
60
70
80
-1.00 -0.75 -0.50 -0.25 0.00 0.25 0.50 0.75 1.00
Y-A
xis
Co
ord
ina
te (i
nch
)
Z-Axis Coordinate (inch)
-1.00
-0.75
-0.50
-0.25
0.00
0.25
0.50
0.75
1.00
-40 -20 0 20 40 60 80 100
Z-A
xis
Co
ord
ina
te (
inch
)
X-Axis Coordinate (inch)

H-44
Figure H40. Amplified displacement (x50) of member targets at an ALF of 0.78. XY-plane (top), YZ-plane (middle), XZ-plane (bottom). Pretest location shown in black, under load in red.
-10
0
10
20
30
40
50
60
70
80
-40 -20 0 20 40 60 80 100
Y-A
xis
Co
ord
ina
te (i
nch
)
X-Axis Coordinate (inch)
( )
Ver
tical
East ChordWest Chord
-10
0
10
20
30
40
50
60
70
80
-40 -30 -20 -10 0 10 20 30 40
Y-A
xis
Co
ord
ina
te (i
nch
)
Z-Axis Coordinate (inch)
-40
-30
-20
-10
0
10
20
30
40
-40 -20 0 20 40 60 80 100
Z-A
xis
Co
ord
ina
te (
inch
)
X-Axis Coordinate (inch)

H-45
Figure H41. Amplified displacement (x50) of member targets post-failure. XY-plane (top), YZ-plane (middle), XZ-plane (bottom). Pretest location shown in black, unloaded post-test in
red.
0
10
20
30
40
50
60
70
80
-40 -20 0 20 40 60 80 100 120
Y-A
xis
Co
ord
ina
te (i
nch
)
X-Axis Coordinate (inch)
( )
Ver
tical
East ChordWest Chord
0
10
20
30
40
50
60
70
80
-100 -75 -50 -25 0 25 50 75 100
Y-A
xis
Co
ord
ina
te (i
nch
)
Z-Axis Coordinate (inch)
-100
-75
-50
-25
0
25
50
75
100
-40 -20 0 20 40 60 80 100 120
Z-A
xis
Co
ord
ina
te (
inch
)
X-Axis Coordinate (inch)

H-46
Figure H42. Vector motions of gusset plate targets amplified 25 times.
-10
0
10
20
30
40
-10 0 10 20 30 40 50 60 70
Y-A
xis
Coo
rdin
ate
(inch
)
X-Axis Coordinate (inch)

H-47
X-Coordinate (inch)
0 10 20 30 40 50 60
Y-C
oor
dina
te (
inch
)
0
5
10
15
20
25
30
35
40
0.0 0.1 0.2 0.3 0.4 0.5 0.6 0.7 0.8 0.9 1.0 1.1 1.2 1.3 1.4 1.5
X-Coordinate (inch)
0 10 20 30 40 50 60
Y-C
oor
dina
te (
inch
)
0
5
10
15
20
25
30
35
40
11.70 11.85 12.00 12.15 12.30 12.45 12.60 12.75 12.90 13.05 13.20

H-48
Figure H43. Post-test out-of-plane shape contour plots. North plate (top), South plate (bottom).

H-49
SPECIMEN 490LS3-2
Figure H44. Pretest out-of-plane shape contour plots. North plate (top), South plate (bottom).
X-Coordinate (inch)
0 10 20 30 40 50 60
Y-C
oord
inat
e (i
nch)
0
5
10
15
20
25
30
35
40
-0.07 -0.06 -0.05 -0.04 -0.03 -0.02 -0.01 0.00 0.01 0.02 0.03 0.04 0.05 0.06 0.07
X-Coordinate (inch)
0 10 20 30 40 50 60
Y-C
oor
din
ate
(inch
)
0
5
10
15
20
25
30
35
40
11.65 11.66 11.67 11.68 11.69 11.70 11.71 11.72 11.73 11.74 11.75 11.76 11.77 11.78 11.79 11.80 11.81 11.82 11.83 11.84 11.85

H-50
Figure H45. Pretest planar alignments. XY-plane (top), YZ-plane (middle), XZ-plane (bottom).
0
10
20
30
40
50
60
70
80
-40 -20 0 20 40 60 80 100
Y-A
xis
Co
ord
ina
te (i
nch
)
X-Axis Coordinate (inch)
West Chord East Chord
Ve
rtic
al
0
10
20
30
40
50
60
70
80
-1.50 -1.25 -1.00 -0.75 -0.50 -0.25 0.00 0.25 0.50
Y-A
xis
Co
ord
ina
te (i
nch
)
Z-Axis Coordinate (inch)
-1.50
-1.25
-1.00
-0.75
-0.50
-0.25
0.00
0.25
0.50
-40 -20 0 20 40 60 80 100
Z-A
xis
Co
ord
ina
te (
inch
)
X-Axis Coordinate (inch)

H-51
Figure H46. Amplified displacement (x50) of member targets at an ALF of 0.77. XY-plane (top), YZ-plane (middle), XZ-plane (bottom). Pretest location shown in black, under load in red.
0
10
20
30
40
50
60
70
80
-40 -20 0 20 40 60 80 100
Y-A
xis
Co
ord
ina
te (i
nch
)
X-Axis Coordinate (inch)
( )
Ver
tical
East ChordWest Chord
0
10
20
30
40
50
60
70
80
-40 -30 -20 -10 0 10 20 30 40
Y-A
xis
Co
ord
ina
te (i
nch
)
Z-Axis Coordinate (inch)
-40
-30
-20
-10
0
10
20
30
40
-40 -20 0 20 40 60 80 100
Z-A
xis
Co
ord
ina
te (
inch
)
X-Axis Coordinate (inch)

H-52
Figure H47. Amplified displacement (x50) of member targets post-failure. XY-plane (top), YZ-plane (middle), XZ-plane (bottom). Pretest location shown in black, unloaded post-test in
red.
0
10
20
30
40
50
60
70
80
-40 -20 0 20 40 60 80 100
Y-A
xis
Co
ord
ina
te (i
nch
)
X-Axis Coordinate (inch)
( )
Ver
tical
East ChordWest Chord
0
10
20
30
40
50
60
70
80
-50 -40 -30 -20 -10 0 10 20 30 40 50
Y-A
xis
Co
ord
ina
te (i
nch
)
Z-Axis Coordinate (inch)
-50
-40
-30
-20
-10
0
10
20
30
40
50
-40 -20 0 20 40 60 80 100 120
Z-A
xis
Co
ord
ina
te (
inch
)
X-Axis Coordinate (inch)

H-53
Figure H48. Vector motions of gusset plate targets amplified 50 times.
-10
0
10
20
30
40
50
-10 0 10 20 30 40 50 60 70 80
Y-A
xis
Co
ord
ina
te (i
nch
)
X-Axis Coordinate (inch)

H-54
Figure H49. Post-test out-of-plane shape contour plots. North plate (top), South plate (bottom).
X-Coordinate (inch)
0 10 20 30 40 50 60
Y-C
oord
inat
e (i
nch)
0
5
10
15
20
25
30
35
40
-0.450 -0.375 -0.300 -0.225 -0.150 -0.075 0.000 0.075 0.150 0.225 0.300 0.375 0.450 0.525 0.600 0.675
X-Coordinate (inch)
0 10 20 30 40 50 60
Y-C
oord
inat
e (i
nch)
0
5
10
15
20
25
30
35
40
11.6 11.7 11.8 11.9 12.0 12.1 12.2 12.3 12.4 12.5 12.6 12.7

H-55
SPECIMEN 490SS3-1
Figure H50. Pretest out-of-plane shape contour plots. North plate (top), South plate (bottom).
X-Coordinate (inch)
0 10 20 30 40 50
Y-C
oord
inat
e (i
nch)
0
5
10
15
20
25
30
35
-0.02 0.00 0.02 0.04 0.06 0.08 0.10 0.12 0.14 0.16 0.18 0.20
X-Coordinate (inch)
0 10 20 30 40 50
Y-C
oord
inat
e (in
ch)
0
5
10
15
20
25
30
35
11.66 11.68 11.70 11.72 11.74 11.76 11.78 11.80 11.82 11.84 11.86 11.88 11.90 11.92 11.94 11.96 11.98 12.00 12.02 12.04

H-56
Figure H51. Pretest planar alignments. XY-plane (top), YZ-plane (middle), XZ-plane (bottom).
0
10
20
30
40
50
60
70
80
-40 -20 0 20 40 60 80 100
Y-A
xis
Co
ord
ina
te (i
nch
)
X-Axis Coordinate (inch)
West Chord East Chord
Ve
rtic
al
0
10
20
30
40
50
60
70
80
-1.25 -1.00 -0.75 -0.50 -0.25 0.00 0.25 0.50 0.75
Y-A
xis
Co
ord
ina
te (i
nch
)
Z-Axis Coordinate (inch)
-1.25
-1.00
-0.75
-0.50
-0.25
0.00
0.25
0.50
0.75
-40 -20 0 20 40 60 80 100
Z-A
xis
Co
ord
ina
te (
inch
)
X-Axis Coordinate (inch)

H-57
Figure H52. Amplified displacement (x50) of member targets at an ALF of 0.79. XY-plane (top), YZ-plane (middle), XZ-plane (bottom). Pretest location shown in black, under load in red.
-10
0
10
20
30
40
50
60
70
80
-40 -20 0 20 40 60 80 100
Y-A
xis
Co
ord
ina
te (i
nch
)
X-Axis Coordinate (inch)
( )
Ver
tical
East ChordWest Chord
-10
0
10
20
30
40
50
60
70
80
-40 -30 -20 -10 0 10 20 30 40
Y-A
xis
Co
ord
ina
te (i
nch
)
Z-Axis Coordinate (inch)
-40
-30
-20
-10
0
10
20
30
40
-40 -20 0 20 40 60 80 100
Z-A
xis
Co
ord
ina
te (
inch
)
X-Axis Coordinate (inch)
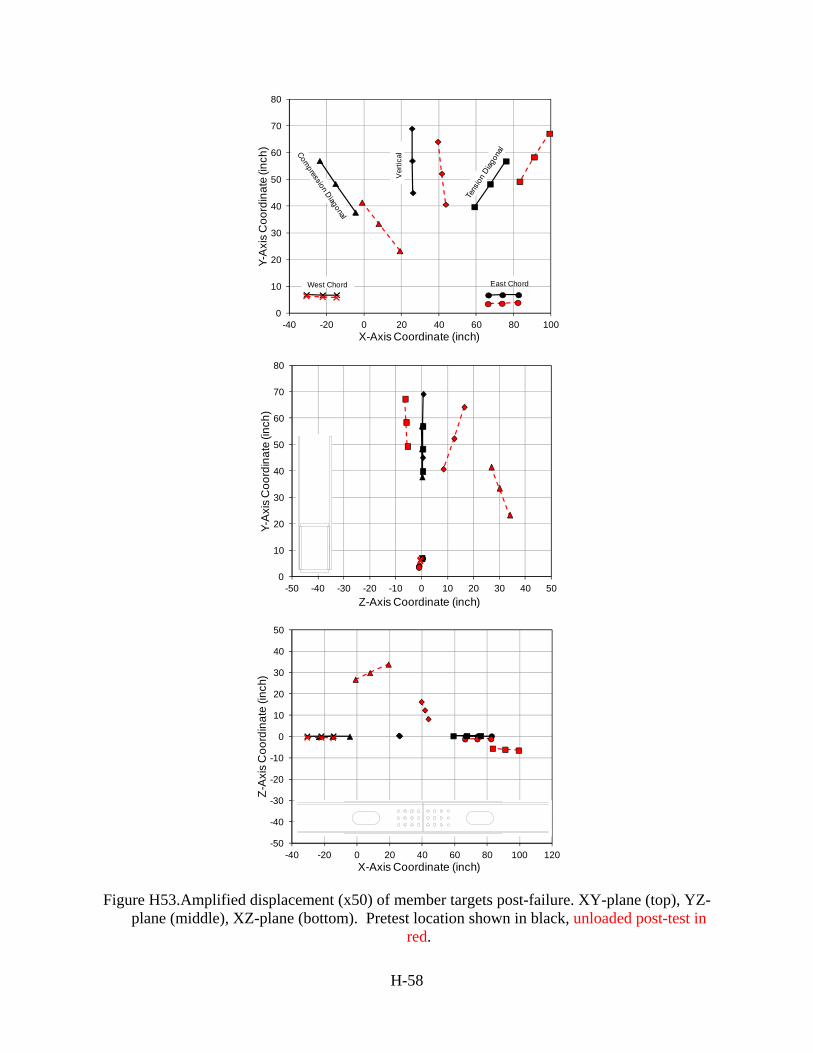
H-58
Figure H53. Amplified displacement (x50) of member targets post-failure. XY-plane (top), YZ-plane (middle), XZ-plane (bottom). Pretest location shown in black, unloaded post-test in
red.
0
10
20
30
40
50
60
70
80
-40 -20 0 20 40 60 80 100
Y-A
xis
Co
ord
ina
te (i
nch
)
X-Axis Coordinate (inch)
Ver
tical
East ChordWest Chord
0
10
20
30
40
50
60
70
80
-50 -40 -30 -20 -10 0 10 20 30 40 50
Y-A
xis
Co
ord
ina
te (i
nch
)
Z-Axis Coordinate (inch)
-50
-40
-30
-20
-10
0
10
20
30
40
50
-40 -20 0 20 40 60 80 100 120
Z-A
xis
Co
ord
ina
te (
inch
)
X-Axis Coordinate (inch)
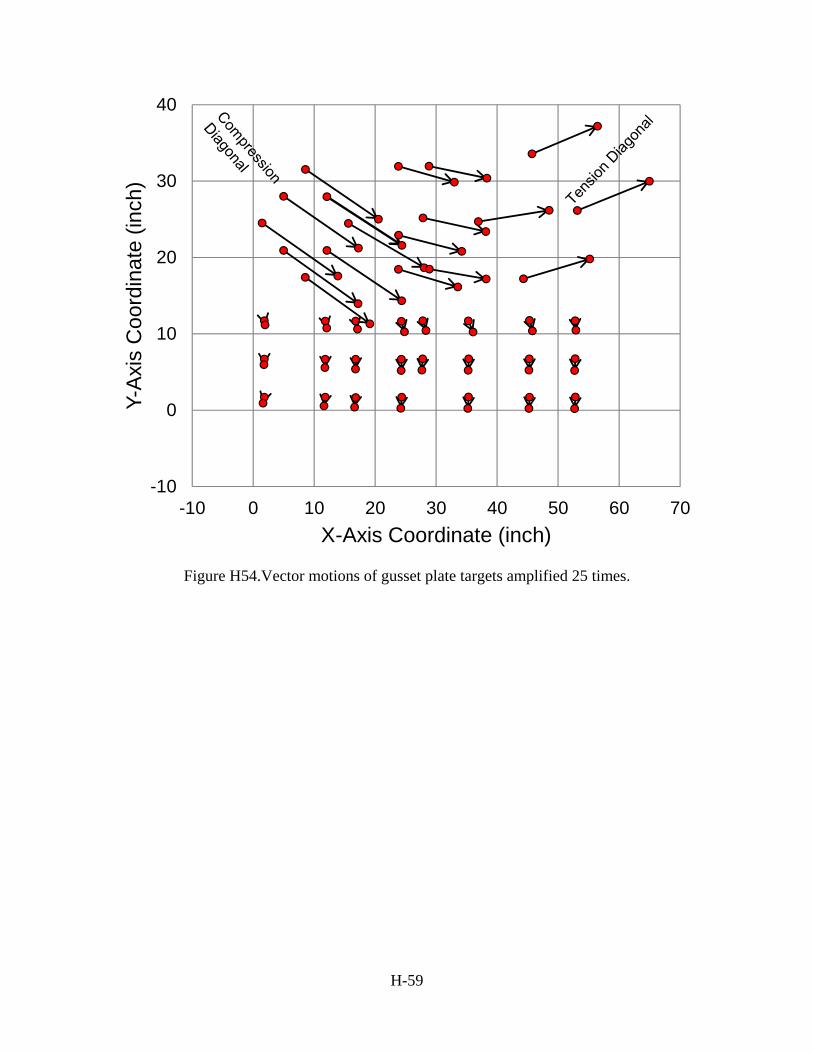
H-59
Figure H54. Vector motions of gusset plate targets amplified 25 times.
-10
0
10
20
30
40
-10 0 10 20 30 40 50 60 70
Y-A
xis
Coo
rdin
ate
(inch
)
X-Axis Coordinate (inch)

H-60
X-Coordinate (inch)
0 10 20 30 40 50
Y-C
oor
din
ate
(inch
)
0
5
10
15
20
25
30
35
-0.150 -0.075 0.000 0.075 0.150 0.225 0.300 0.375 0.450 0.525 0.600 0.675 0.750 0.825 0.900 0.975
X-Coordinate (inch)
0 10 20 30 40 50
Y-C
oor
din
ate
(in
ch)
0
5
10
15
20
25
30
35
11.700 11.775 11.850 11.925 12.000 12.075 12.150 12.225 12.300 12.375 12.450 12.525 12.600 12.675

H-61
Figure H55. Post-test out-of-plane shape contour plots. North plate (top), South plate (bottom).

H-62
SPECIMEN 307SS3-1
Figure H56. Pretest out-of-plane shape contour plots. North plate (top), South plate (bottom).
X-Coordinate (inch)
0 10 20 30 40 50 60
Y-C
oord
inat
e (i
nch)
0
5
10
15
20
25
30
35
-0.02 -0.01 0.00 0.01 0.02 0.03 0.04 0.05 0.06 0.07 0.08
X-Coordinate (inch)
0 10 20 30 40 50 60
Y-C
oord
inat
e (
inch
)
0
5
10
15
20
25
30
35
11.66 11.68 11.70 11.72 11.74 11.76 11.78 11.80 11.82 11.84 11.86 11.88 11.90
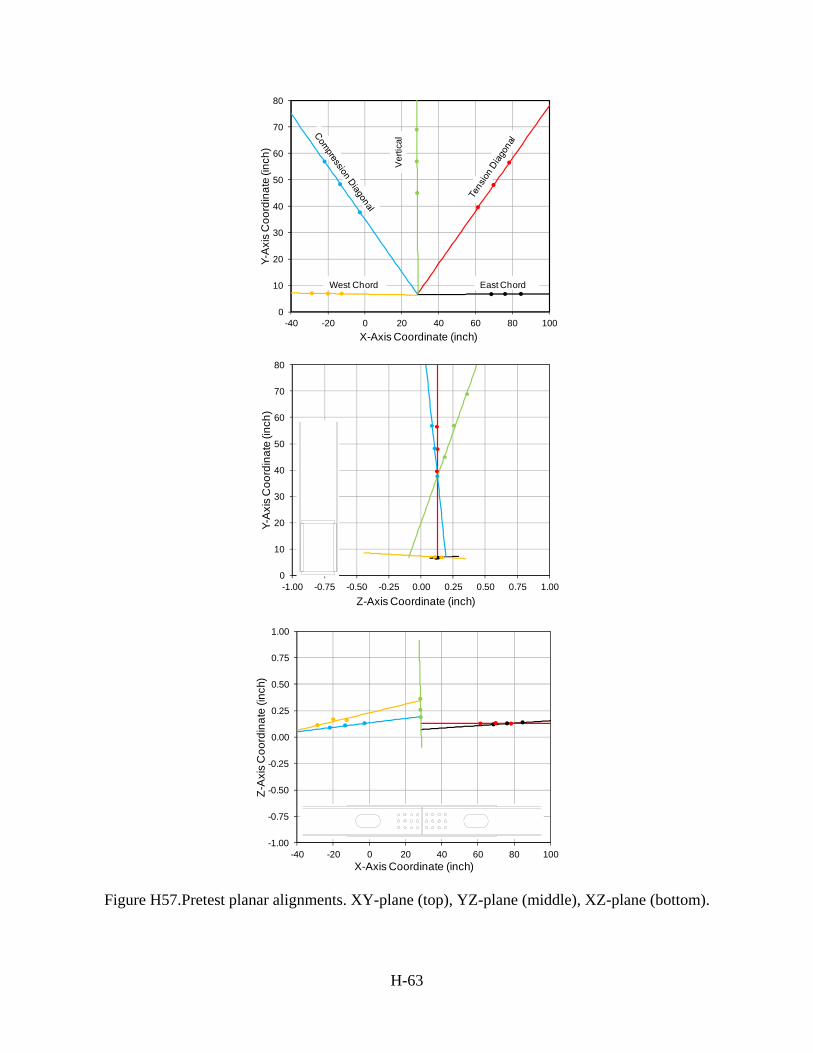
H-63
Figure H57. Pretest planar alignments. XY-plane (top), YZ-plane (middle), XZ-plane (bottom).
0
10
20
30
40
50
60
70
80
-40 -20 0 20 40 60 80 100
Y-A
xis
Co
ord
ina
te (i
nch
)
X-Axis Coordinate (inch)
West Chord East Chord
Ve
rtic
al
0
10
20
30
40
50
60
70
80
-1.00 -0.75 -0.50 -0.25 0.00 0.25 0.50 0.75 1.00
Y-A
xis
Co
ord
ina
te (i
nch
)
Z-Axis Coordinate (inch)
-1.00
-0.75
-0.50
-0.25
0.00
0.25
0.50
0.75
1.00
-40 -20 0 20 40 60 80 100
Z-A
xis
Co
ord
ina
te (
inch
)
X-Axis Coordinate (inch)

H-64
Figure H58. Amplified displacement (x50) of member targets at an ALF of 0.40. XY-plane (top), YZ-plane (middle), XZ-plane (bottom). Pretest location shown in black, under load in red.
0
10
20
30
40
50
60
70
80
-40 -20 0 20 40 60 80 100
Y-A
xis
Co
ord
ina
te (i
nch
)
X-Axis Coordinate (inch)
Ver
tical
East ChordWest Chord
0
10
20
30
40
50
60
70
80
-40 -30 -20 -10 0 10 20 30 40
Y-A
xis
Co
ord
ina
te (i
nch
)
Z-Axis Coordinate (inch)
-40
-30
-20
-10
0
10
20
30
40
-40 -20 0 20 40 60 80 100
Z-A
xis
Co
ord
ina
te (
inch
)
X-Axis Coordinate (inch)

H-65
Figure H59. Amplified displacement (x50) of member targets post-failure. XY-plane (top), YZ-plane (middle), XZ-plane (bottom). Pretest location shown in black, unloaded post-test in
red.
0
10
20
30
40
50
60
70
80
-40 -20 0 20 40 60 80 100
Y-A
xis
Co
ord
ina
te (i
nch
)
X-Axis Coordinate (inch)
( )
Ver
tical
East ChordWest Chord
0
10
20
30
40
50
60
70
80
-50 -40 -30 -20 -10 0 10 20 30 40 50
Y-A
xis
Co
ord
ina
te (i
nch
)
Z-Axis Coordinate (inch)
-50
-40
-30
-20
-10
0
10
20
30
40
50
-40 -20 0 20 40 60 80 100 120
Z-A
xis
Co
ord
ina
te (
inch
)
X-Axis Coordinate (inch)

H-66
Figure H60. Vector motions of gusset plate targets amplified 50 times.
-10
0
10
20
30
40
50
-10 0 10 20 30 40 50 60 70 80
Y-A
xis
Co
ord
ina
te (i
nch
)
X-Axis Coordinate (inch)

H-67
Figure H61. Post-test out-of-plane shape contour plots. North plate (top), South plate (bottom).
X-Coordinate (inch)
0 10 20 30 40 50 60
Y-C
oord
inat
e (i
nch)
0
5
10
15
20
25
30
35
0.0 0.1 0.2 0.3 0.4 0.5 0.6 0.7 0.8 0.9 1.0 1.1 1.2
X-Coordinate (inch)
0 10 20 30 40 50 60
Y-C
oord
inat
e (in
ch)
0
5
10
15
20
25
30
35
11.6 11.7 11.8 11.9 12.0 12.1 12.2 12.3 12.4 12.5 12.6 12.7

H-68
SPECIMEN 307SS3-2
Figure H62. Pretest out-of-plane shape contour plots. North plate (top), South plate (bottom).
X-Coordinate (inch)
0 10 20 30 40 50 60
Y-C
oord
inat
e (i
nch)
0
5
10
15
20
25
30
35
-0.07 -0.06 -0.05 -0.04 -0.03 -0.02 -0.01 0.00 0.01 0.02 0.03 0.04 0.05 0.06 0.07
X-Coordinate (inch)
0 10 20 30 40 50 60
Y-C
oord
inat
e (
inch
)
0
5
10
15
20
25
30
35
11.66 11.68 11.70 11.72 11.74 11.76 11.78 11.80 11.82 11.84 11.86 11.88 11.90

H-69
Figure H63. Pretest planar alignments. XY-plane (top), YZ-plane (middle), XZ-plane (bottom).
0
10
20
30
40
50
60
70
80
-40 -20 0 20 40 60 80 100
Y-A
xis
Co
ord
ina
te (i
nch
)
X-Axis Coordinate (inch)
West Chord East Chord
Ve
rtic
al
0
10
20
30
40
50
60
70
80
-1.00 -0.75 -0.50 -0.25 0.00 0.25 0.50 0.75 1.00
Y-A
xis
Co
ord
ina
te (i
nch
)
Z-Axis Coordinate (inch)
-1.00
-0.75
-0.50
-0.25
0.00
0.25
0.50
0.75
1.00
-40 -20 0 20 40 60 80 100
Z-A
xis
Co
ord
ina
te (
inch
)
X-Axis Coordinate (inch)
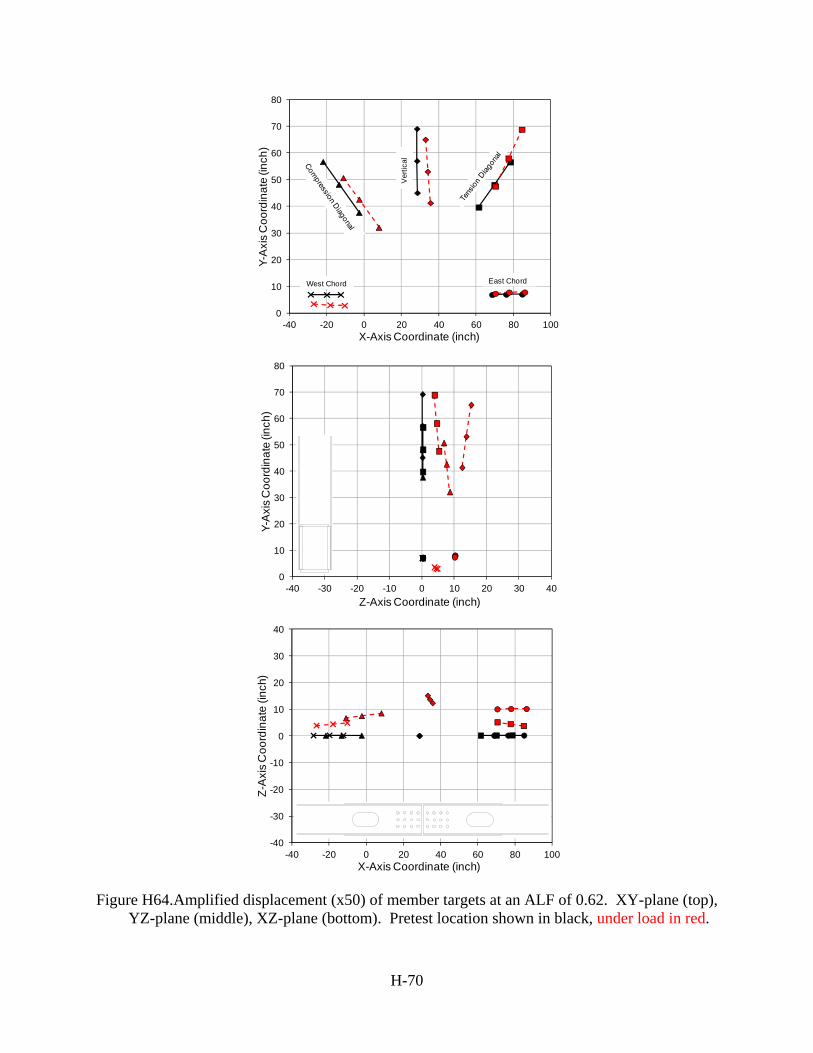
H-70
Figure H64. Amplified displacement (x50) of member targets at an ALF of 0.62. XY-plane (top), YZ-plane (middle), XZ-plane (bottom). Pretest location shown in black, under load in red.
0
10
20
30
40
50
60
70
80
-40 -20 0 20 40 60 80 100
Y-A
xis
Co
ord
ina
te (i
nch
)
X-Axis Coordinate (inch)
( )
Ver
tical
East ChordWest Chord
0
10
20
30
40
50
60
70
80
-40 -30 -20 -10 0 10 20 30 40
Y-A
xis
Co
ord
ina
te (i
nch
)
Z-Axis Coordinate (inch)
-40
-30
-20
-10
0
10
20
30
40
-40 -20 0 20 40 60 80 100
Z-A
xis
Co
ord
ina
te (
inch
)
X-Axis Coordinate (inch)

H-71
Figure H65. Amplified displacement (x50) of member targets post-failure. XY-plane (top), YZ-plane (middle), XZ-plane (bottom). Pretest location shown in black, unloaded post-test in
red.
0
10
20
30
40
50
60
70
80
-40 -20 0 20 40 60 80 100
Y-A
xis
Coo
rdin
ate
(inch
)
X-Axis Coordinate (inch)
0
10
20
30
40
50
60
70
80
-40 -30 -20 -10 0 10 20 30 40
Y-A
xis
Coo
rdin
ate
(in
ch)
Z-Axis Coordinate (inch)
-40
-30
-20
-10
0
10
20
30
40
-40 -20 0 20 40 60 80 100
Z-A
xis
Coo
rdin
ate
(inch
)
X-Axis Coordinate (inch)
( )

H-72
Figure H66. Vector motions of gusset plate targets amplified 50 times.
-10
0
10
20
30
40
-10 0 10 20 30 40 50 60 70
Y-A
xis
Coo
rdin
ate
(inch
)
X-Axis Coordinate (inch)

H-73
Figure H67. Post-test out-of-plane shape contour plots. North plate (top), South plate (bottom).
X-Coordinate (inch)
0 10 20 30 40 50 60
Y-C
oord
inat
e (i
nch)
0
5
10
15
20
25
30
35
-0.150 -0.075 0.000 0.075 0.150 0.225 0.300 0.375 0.450 0.525 0.600 0.675 0.750 0.825 0.900
X-Coordinate (inch)
0 10 20 30 40 50 60
Y-C
oord
inat
e (i
nch)
0
5
10
15
20
25
30
35
11.550 11.625 11.700 11.775 11.850 11.925 12.000 12.075 12.150 12.225 12.300 12.375 12.450 12.525
H-74
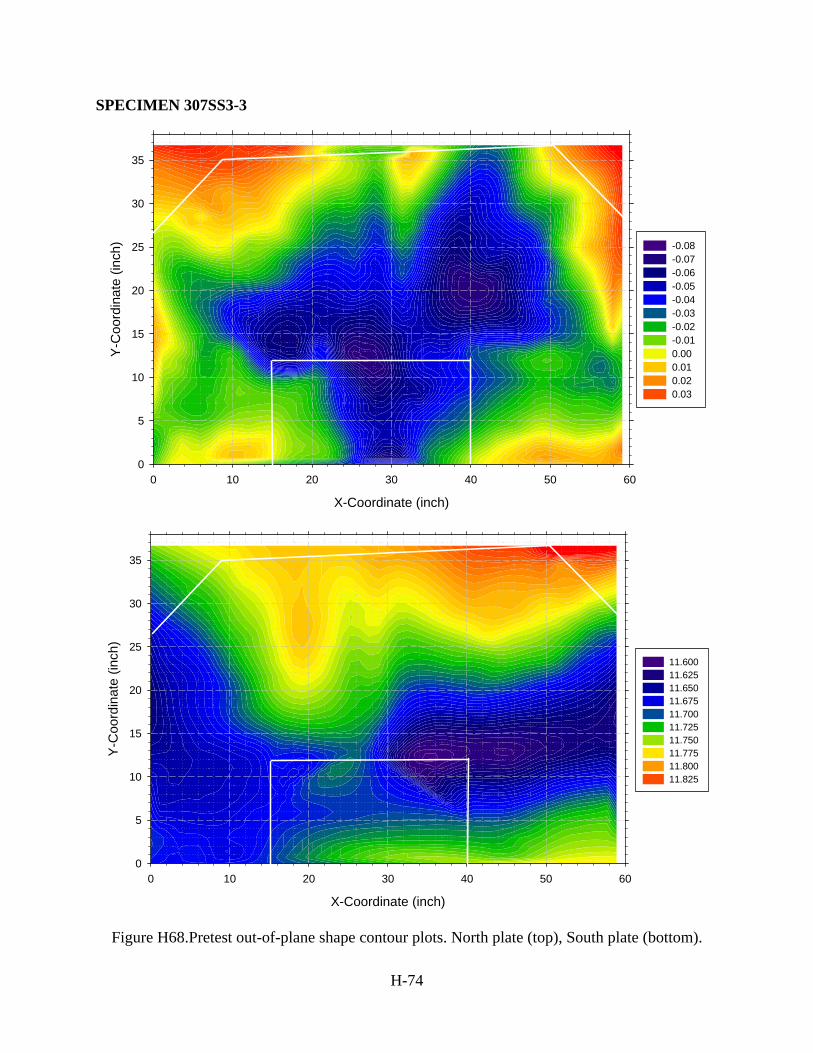
SPECIMEN 307SS3-3
Figure H68. Pretest out-of-plane shape contour plots. North plate (top), South plate (bottom).
X-Coordinate (inch)
0 10 20 30 40 50 60
Y-C
oord
ina
te (
inch
)
0
5
10
15
20
25
30
35
-0.08 -0.07 -0.06 -0.05 -0.04 -0.03 -0.02 -0.01 0.00 0.01 0.02 0.03
X-Coordinate (inch)
0 10 20 30 40 50 60
Y-C
oord
ina
te (
inch
)
0
5
10
15
20
25
30
35
11.600 11.625 11.650 11.675 11.700 11.725 11.750 11.775 11.800 11.825

H-75
Figure H69. Pretest planar alignments. XY-plane (top), YZ-plane (middle), XZ-plane (bottom).
0
10
20
30
40
50
60
70
80
-40 -20 0 20 40 60 80 100
Y-A
xis
Co
ord
ina
te (i
nch
)
X-Axis Coordinate (inch)
West Chord East Chord
Ve
rtic
al
0
10
20
30
40
50
60
70
80
-1.00 -0.75 -0.50 -0.25 0.00 0.25 0.50 0.75 1.00
Y-A
xis
Co
ord
ina
te (i
nch
)
Z-Axis Coordinate (inch)
-1.00
-0.75
-0.50
-0.25
0.00
0.25
0.50
0.75
1.00
-40 -20 0 20 40 60 80 100
Z-A
xis
Co
ord
ina
te (
inch
)
X-Axis Coordinate (inch)

H-76
Figure H70. Amplified displacement (x50) of member targets at an ALF of 0.45. XY-plane (top), YZ-plane (middle), XZ-plane (bottom). Pretest location shown in black, under load in red.
0
10
20
30
40
50
60
70
80
-40 -20 0 20 40 60 80 100
Y-A
xis
Co
ord
ina
te (i
nch
)
X-Axis Coordinate (inch)
( )
Ver
tical
East ChordWest Chord
0
10
20
30
40
50
60
70
80
-40 -30 -20 -10 0 10 20 30 40
Y-A
xis
Co
ord
ina
te (i
nch
)
Z-Axis Coordinate (inch)
-40
-30
-20
-10
0
10
20
30
40
-40 -20 0 20 40 60 80 100
Z-A
xis
Co
ord
ina
te (
inch
)
X-Axis Coordinate (inch)

H-77
Figure H71. Amplified displacement (x50) of member targets post-failure. XY-plane (top), YZ-plane (middle), XZ-plane (bottom). Pretest location shown in black, unloaded post-test in
red.
0
10
20
30
40
50
60
70
80
-40 -20 0 20 40 60 80 100
Y-A
xis
Co
ordi
nate
(in
ch)
X-Axis Coordinate (inch)
( )
Ver
tical
East ChordWest Chord
0
10
20
30
40
50
60
70
80
-50 -40 -30 -20 -10 0 10 20 30 40 50
Y-A
xis
Coo
rdin
ate
(inch
)
Z-Axis Coordinate (inch)
( )East Chord
Tension Diagonal
Vertical
Compression Diagonal
West Chord
-50
-40
-30
-20
-10
0
10
20
30
40
50
-40 -20 0 20 40 60 80 100
Z-A
xis
Coo
rdin
ate
(inch
)
X-Axis Coordinate (inch)
( )
East Chord
Tension Diagonal
Vertical
Compression Diagonal
West Chord

H-78
Figure H72. Vector motions of gusset plate targets amplified 50 times.
-10
0
10
20
30
40
-10 0 10 20 30 40 50 60 70
Y-A
xis
Coo
rdin
ate
(inch
)
X-Axis Coordinate (inch)

H-79
Figure H73. Post-test out-of-plane shape contour plots. North plate (top), South plate (bottom).
X-Coordinate (inch)
0 10 20 30 40 50 60
Y-C
oor
dina
te (
inch
)
0
5
10
15
20
25
30
35
-0.2 -0.1 0.0 0.1 0.2 0.3 0.4 0.5 0.6 0.7 0.8 0.9 1.0 1.1 1.2 1.3
X-Coordinate (inch)
0 10 20 30 40 50 60
Y-C
oo
rdin
ate
(in
ch)
0
5
10
15
20
25
30
35
11.6 11.7 11.8 11.9 12.0 12.1 12.2 12.3 12.4 12.5 12.6 12.7 12.8

H-80
SPECIMEN 307SS3-4
Figure H74. Pretest out-of-plane shape contour plots. North plate (top), South plate (bottom).
X-Coordinate (inch)
0 10 20 30 40 50 60
Y-C
oor
dina
te (
inch
)
0
5
10
15
20
25
30
35
-0.250 -0.225 -0.200 -0.175 -0.150 -0.125 -0.100 -0.075 -0.050 -0.025 0.000 0.025 0.050 0.075 0.100
X-Coordinate (inch)
0 10 20 30 40 50 60
Y-C
oord
ina
te (
inch
)
0
5
10
15
20
25
30
35
11.56 11.58 11.60 11.62 11.64 11.66 11.68 11.70 11.72 11.74 11.76 11.78

H-81
Figure H75. Pretest planar alignments. XY-plane (top), YZ-plane (middle), XZ-plane (bottom).
0
10
20
30
40
50
60
70
80
-40 -20 0 20 40 60 80 100
Y-A
xis
Co
ord
ina
te (i
nch
)
X-Axis Coordinate (inch)
West Chord East Chord
Ve
rtic
al
0
10
20
30
40
50
60
70
80
-1.00 -0.75 -0.50 -0.25 0.00 0.25 0.50 0.75 1.00
Y-A
xis
Co
ord
ina
te (i
nch
)
Z-Axis Coordinate (inch)
-1.00
-0.75
-0.50
-0.25
0.00
0.25
0.50
0.75
1.00
-40 -20 0 20 40 60 80 100
Z-A
xis
Co
ord
ina
te (
inch
)
X-Axis Coordinate (inch)

H-82
Figure H76. Amplified displacement (x50) of member targets at an ALF of 0.56. XY-plane (top), YZ-plane (middle), XZ-plane (bottom). Pretest location shown in black, under load in red.
0
10
20
30
40
50
60
70
80
-40 -20 0 20 40 60 80 100
Y-A
xis
Co
ord
ina
te (i
nch
)
X-Axis Coordinate (inch)
( )
Ver
tical
East ChordWest Chord
0
10
20
30
40
50
60
70
80
-40 -30 -20 -10 0 10 20 30 40
Y-A
xis
Co
ord
ina
te (i
nch
)
Z-Axis Coordinate (inch)
-40
-30
-20
-10
0
10
20
30
40
-40 -20 0 20 40 60 80 100
Z-A
xis
Co
ord
ina
te (
inch
)
X-Axis Coordinate (inch)

H-83
DATA NOT COLLECTED
Figure H77. Amplified displacement (x50) of member targets post-failure. XY-plane (top), YZ-plane (middle), XZ-plane (bottom). Pretest location shown in black, unloaded post-test in
red.
DATA NOT COLLECTED
Figure H78. Vector motions of gusset plate targets amplified 50 times.

H-84
Figure H79. Post-test out-of-plane shape contour plots. North plate (top), South plate (bottom).
X-Coordinate (inch)
0 10 20 30 40 50 60
Y-C
oord
ina
te (
inch
)
0
5
10
15
20
25
30
35
-0.15 -0.10 -0.05 0.00 0.05 0.10 0.15 0.20 0.25 0.30
X-Coordinate (inch)
0 10 20 30 40 50 60
Y-C
oord
inat
e (in
ch)
0
5
10
15
20
25
30
35
11.550 11.575 11.600 11.625 11.650 11.675 11.700 11.725 11.750 11.775 11.800 11.825 11.850 11.875

H-85
MEMBER SHAPE
Figure H80. East chord member shape. X-Y plane (top). X-Z plane (bottom).
0
1
2
3
4
5
6
0 20 40 60 80 100 120 140 160
Y-A
xis
(inch
)
X-Axis (inch)
Three Points
End Plate Center
Member Centerline Basedon Top Face Data
-1
0
1
2
3
4
5
6
7
0 20 40 60 80 100 120 140 160
Z-A
xis
(inch
)
X-Axis (inch)
Three Points
End Plate Center
Member Centerline Basedon Sideplate Data

H-86
Figure H81. West chord member shape. X-Y plane (top). X-Z plane (bottom).
0
1
2
3
4
5
6
0 20 40 60 80 100 120 140 160
Y-A
xis
(inch
)
X-Axis (inch)
Three Points
End Plate Center
Member Centerline Basedon Top Face Data
-7
-6
-5
-4
-3
-2
-1
0
1
0 20 40 60 80 100 120 140 160
Z-A
xis
(inch
)
X-Axis (inch)
Three Points
End Plate Center
Member Centerline Basedon Sideplate Data
H-87
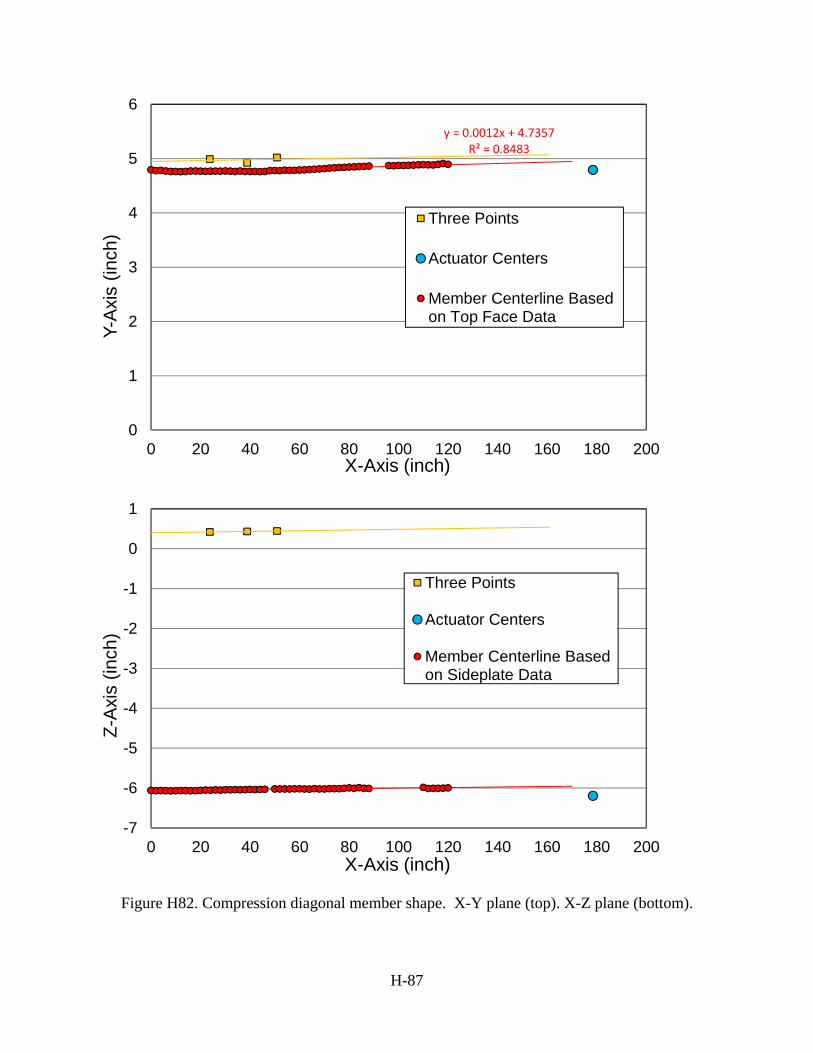
Figure H82. Compression diagonal member shape. X-Y plane (top). X-Z plane (bottom).
y = 0.0012x + 4.7357R² = 0.8483
0
1
2
3
4
5
6
0 20 40 60 80 100 120 140 160 180 200
Y-A
xis
(inch
)
X-Axis (inch)
Three Points
Actuator Centers
Member Centerline Basedon Top Face Data
-7
-6
-5
-4
-3
-2
-1
0
1
0 20 40 60 80 100 120 140 160 180 200
Z-A
xis
(inch
)
X-Axis (inch)
Three Points
Actuator Centers
Member Centerline Basedon Sideplate Data

H-88
Figure H83. Tension diagonal member shape. X-Y plane (top). X-Z plane (bottom).
0
1
2
3
4
5
6
7
0 20 40 60 80 100 120 140 160 180 200 220 240 260
Y-A
xis
(inch
)
X-Axis (inch)
Three Points
Actuator Centers
Member CenterlineBased on Web Data
-1
0
1
2
3
4
5
6
7
0 20 40 60 80 100 120 140 160 180 200 220 240 260
Z-A
xis
(in
ch
)
X-Axis (inch)
Three Points
Actuator Centers
Member Centerline Based onFlange Data

H-89
Figure H84. Vertical member shape. X-Y plane (top). X-Z plane (bottom).
0
1
2
3
4
5
6
7
0 20 40 60 80 100 120 140
Y-A
xis
(inch
)
X-Axis (inch)
Three Points
Actuator Centers
Member Centerline Based onTop Face Data
0
1
2
3
4
5
6
7
8
9
10
11
12
13
14
0 20 40 60 80 100 120 140
Z-A
xis
(inch
)
X-Axis (inch)
Three Points
Actuator Centers
Member Centerline Based onSideplate Data