appendix g traffic impact study for south … 2... · south bay salt pond restoration project phase...
TRANSCRIPT

APPENDIX G
South Bay Salt Pond Restoration Project Phase II May 2015 Draft Environmental Impact Statement/Report
TRAFFIC IMPACT STUDY FOR
SOUTH BAY SALT POND RESTORATION PROJECT – PHASE 2

Traffic Impact Study for
South Bay Salt Ponds Restoration - Phase 2 Project
Prepared by:
100 West San Fernando Street, Suite 200
San Jose, CA 95113
December 22, 2014

TABLE OF CONTENTS
I PROJECT DESCRIPTION ........................................................................................................................ 3
II TRAFFIC IMPACT STUDY AREA ......................................................................................................... 3
III EVALUATION ANALYSIS ..................................................................................................................... 4
IV EXISTING CONDITIONS ........................................................................................................................ 9
V PROJECT CONDITION IMPACT ANALYSIS ..................................................................................... 11
VII MITIGATION MEASURES .................................................................................................................... 15
VIII CONCLUSION ......................................................................................................................................... 16
FIGURES
FIGURE 1: PROJECT AREA BOUNDARY………………………………………………………………… 5
FIGURE 2-1: ALVISO - A8 PONDS CONSTRUCTION ACCESS ROUTES………………………………... 6
FIGURE 2-2: ALVISO – MOUNTAIN VIEW PONDS CONSTRUCTION ACCESS ROUTES………......... 7
FIGURE 2-3: RAVENSWOOD PONDS CONSTRUCTION ACCESS ROUTES ………………………..….. 8
FIGURE 3-1: ALVISO - A8 PONDS EXISTING LANE GEOMETRIES…………………………….….…… 9
FIGURE 3-2: ALVISO – MOUNTAIN VIEW PONDS EXISTING LANE GEOMETRIES……………...….. 9
FIGURE 3-3: RAVENSWOOD PONDS EXISTING LANE GEOMETRIES………………........................... 9
FIGURE 4-1: ALVISO - A8 PONDS EXISTING PEAK HOUR TURNING MOVEMENT
VOLUMES…………………………………………………………………………………………………….. 10
FIGURE 4-2: ALVISO – MOUNTAIN VIEW PONDS EXISTING PEAK HOUR TURNING MOVEMENT
VOLUMES…………………………………………………………………………………………………… 10
FIGURE 4-3: RAVENSWOOD PONDS EXISTING PEAK HOUR TURNING MOVEMENT
VOLUMES………………………………………………………………………………………………....... 11
FIGURE 5-1: ALVISO - A8 PONDS PROJECT TRIPS……………………………………………………. 12
FIGURE 5-2: ALVISO – MOUNTAIN VIEW PONDS PROJECT TRIPS………………………………… 12
FIGURE 5-3: RAVENSWOOD PONDS PROJECT TRIPS……………………………………………....... 13
TABLES
TABLE 1 – SIGNALIZED INTERSECTION LOS THRESHOLDS .................................................................................... 4
TABLE 2 – LOS AND DELAY FOR EXISTING CONDITIONS AND PROJECT CONDITIONS ......................................... 15
TABLE 3 – LOS AND DELAY FOR EXISTING CONDITIONS AND MITIGATED PROJECT CONDITIONS ...................... 16
APPENDIX
APPENDIX A – DETAILED INTERSECTION TURNING MOVEMENT VOLUMES
APPENDIX B – LEVEL OF SERVICE CALCULATION SHEETS

Traffic Impact Study for South Bay Salt Pond Restoration - Phase 2 Project
3
I PROJECT DESCRIPTION
The purpose of this traffic analysis is to evaluate the potential traffic impacts resulting from
the truck trips which are required for bringing fill to the project areas shown in Figure 1.
Three of the project areas will require truck trips for bringing fill to the site and are located
near Caltrans facilities. For the purposes of this study, a conservative approach was adopted
by assigning outbound trips from the project site equal to the inbound trips to the project site
during AM and PM peak hours. The project is a restoration project, so the only real traffic
would be generated during construction period.
II TRAFFIC IMPACT STUDY AREA
The following are the three project areas which are being analyzed:
Alviso - A8 Ponds: are located near SR 237 in the City of Santa Clara. The construction
access routes for this project area are shown in Figure 2-1. The following intersections are
analyzed to evaluate the impacts caused by additional truck traffic generated during the
construction in this project area.
1. 237 WB Ramps/Great America Pkwy
2. 237 EB Ramps/Great America Pkwy
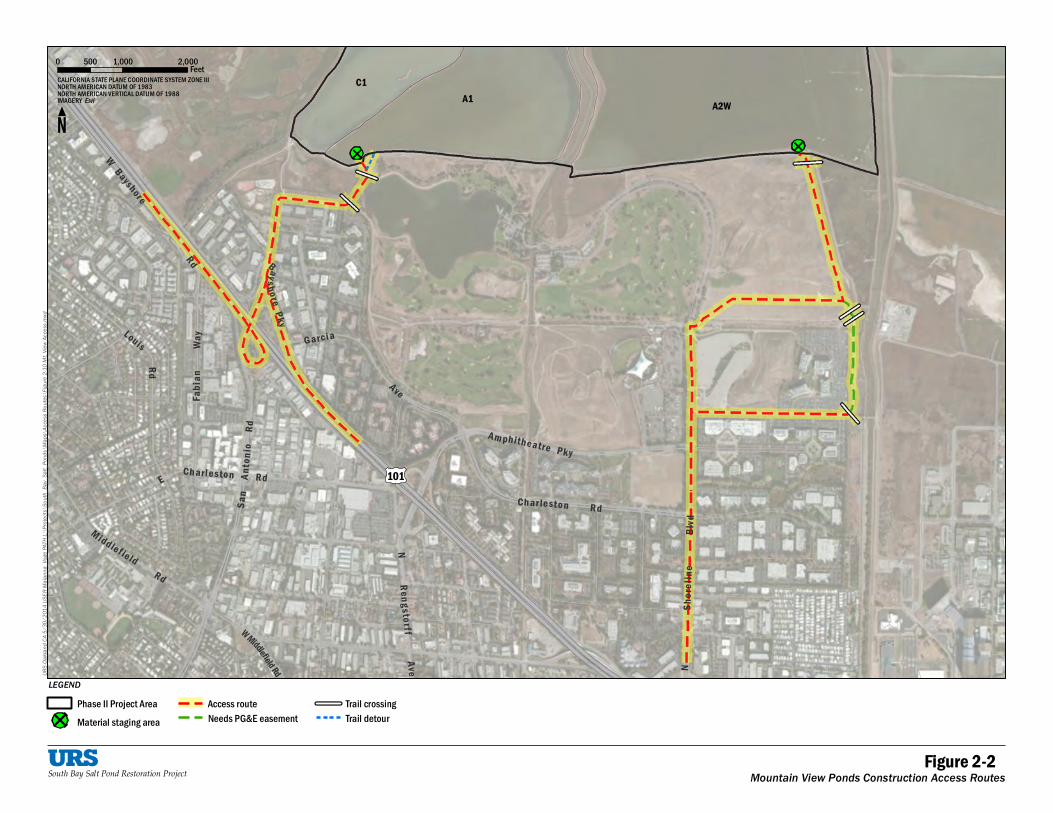
Alviso - Mountain View Ponds: are located near 101/Shoreline Boulevard and 101/Bay
Shore Road in the City of Mountain View. The construction access routes for this project
area are shown in Figure 2-2. The following intersections are analyzed to evaluate the
impacts caused by additional truck traffic generated during the construction in this project
area.
3. 101 NB Ramps/Shoreline Blvd
4. 101 SB Ramps/Shoreline Blvd
5. 101 NB Ramps/San Antonio Rd
Ravenswood Ponds: are located near the Facebook campus at SR 84 and Marsh Road in the
City of Menlo Park. The construction access routes for this project area are shown in
Figure 2-3. The following intersections are analyzed to evaluate the impacts caused by
additional truck traffic generated during the construction in this project area.
6. 101 NB Ramps/Marsh Rd-Rte 84
7. 101 SB Ramps/Marsh Rd-Rte 84
Intersection turning movement volumes were collected in October 2014 during the
following time periods:
• 7:00 a.m. to 9:00 a.m. for the AM peak hour
• 4:00 p.m. to 6:00 p.m. for the PM peak hour
Traffic volumes were projected and impacts were assessed for the following conditions
during the AM and PM peak hours:
Traffic Impact Study for South Bay Salt Pond Restoration - Phase 2 Project
4
1. Existing Conditions – Evaluate traffic conditions based on existing lane geometries,
traffic controls and traffic volumes; and
2. Existing plus Project Conditions – Evaluates traffic conditions with proposed project
trips added to existing traffic volumes.
III EVALUATION ANALYSIS
Evaluation Criteria
This section summarizes the methodologies used to perform peak hour intersection capacity
analysis at signalized intersections. Level of service analysis was conducted based on the
traffic data collected by URS and by utilizing the Synchro 9.0 software package, and based
on the methodologies outlined in the Highway Capacity Manual (HCM 2000).
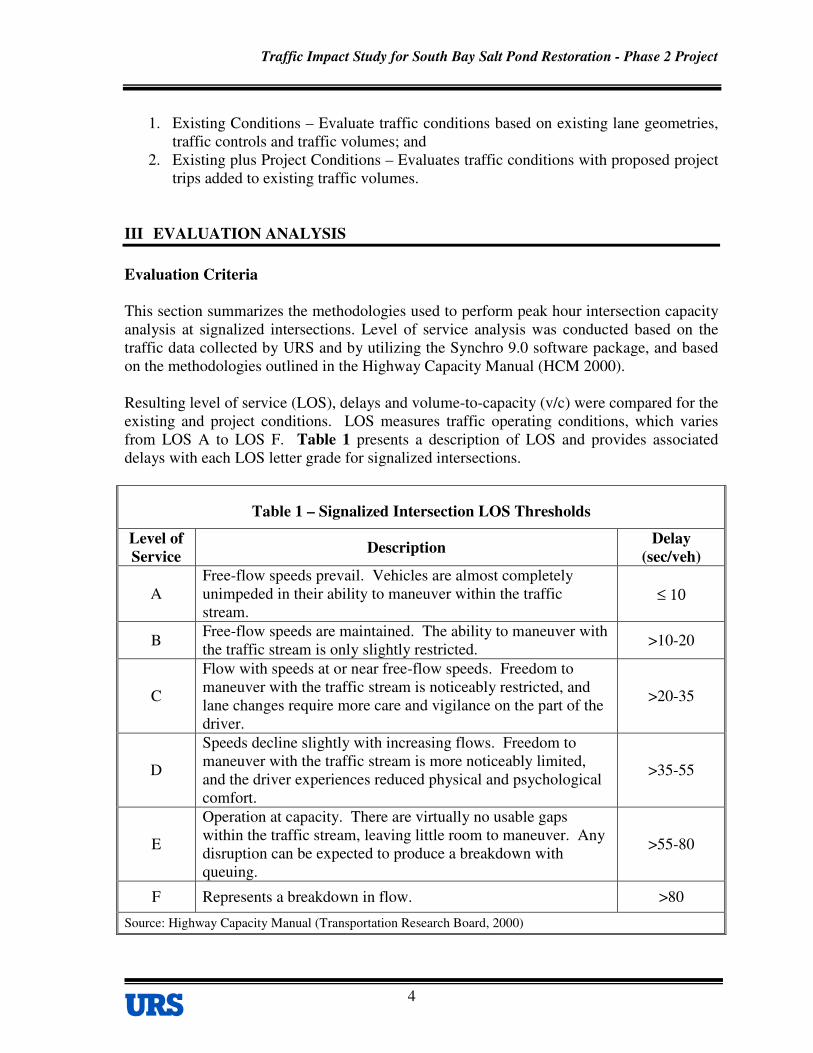
Resulting level of service (LOS), delays and volume-to-capacity (v/c) were compared for the
existing and project conditions. LOS measures traffic operating conditions, which varies
from LOS A to LOS F. Table 1 presents a description of LOS and provides associated
delays with each LOS letter grade for signalized intersections.
Table 1 – Signalized Intersection LOS Thresholds
Level of
Service Description
Delay
(sec/veh)
A
Free-flow speeds prevail. Vehicles are almost completely
unimpeded in their ability to maneuver within the traffic
stream. ≤ 10
B Free-flow speeds are maintained. The ability to maneuver with
the traffic stream is only slightly restricted. >10-20
C
Flow with speeds at or near free-flow speeds. Freedom to
maneuver with the traffic stream is noticeably restricted, and
lane changes require more care and vigilance on the part of the
driver.
>20-35
D
Speeds decline slightly with increasing flows. Freedom to
maneuver with the traffic stream is more noticeably limited,
and the driver experiences reduced physical and psychological
comfort.
>35-55
E
Operation at capacity. There are virtually no usable gaps
within the traffic stream, leaving little room to maneuver. Any
disruption can be expected to produce a breakdown with
queuing.
>55-80
F Represents a breakdown in flow. >80
Source: Highway Capacity Manual (Transportation Research Board, 2000)

Ravenswood
AlvisoMOUNTAIN VIEW PONDS
AlvisoISLAND PONDS
101
237
880
AlvisoA8 PONDSC1
R4
A19A21
A2WA1
A20
S5
R5
280
680
880
101
237
85
114
109
84
82
R3
A8S
A8
B. G
reer
| L:\
Proje
cts\S
outh_
Bay_
Salt_
Pond
s\Map
s\Pha
se II\
Figure
2-2 P
hase
2 Pr
oject
Area
.mxd
Figure 1SBSP Phase 2 Project Area Boundary
0 1 20.5 MilesCALIFORNIA STATE PLANE COORDINATE SYSTEM ZONE III
NORTH AMERICAN DATUM OF 1983IMAGERY Esri

Elizabeth St
Hope
St
C a t h e r i n e S t
Wi l s o n Wa y
M o u n t a i nV i e w A l v i s o R d
Sleep
y Hol l
ow
E Moffett Park Dr Moffett Park Ct
E P e r s i a n D r
G r a nd
B l vd
Chesa
p e ak eT
er
A r c he r S t
Disk Dr
Wa ba s h S t
H o p p e
Birchw
ood Dr Re
amwo
od
A ve
Alderw
ood Av
e
M i c h i g a n
A v e
Bets
y Ro
s s
D r
Trinity ParkDr
Anvil
wood
A v
e
Archangel Dr
Hamm
erw o
od
A ve
For g
ewoo
d A v
e
O rl e a
n s
D r
M o f f e t tP a r k
D r
C A L L E D e l M u n d o
B u n k e r H i l l L n
Ye r b a
B uena
W a y
S u n R i s e Dr
Scho
olS t
O l d M o u n t a i n V i e w A l v i s o R d
C A L L E D e L u n a
M o f f a t S t
S t a r sA n d
S t r i p e s
Dr
Lafayette St
N 1St St
LawrenceExpy
E
CaribbeanDr
E Taylor St
Gre a
tA m
erica
P ky
237
A8S
A8
LEGEND
0 1,000 2,000500 FeetCALIFORNIA STATE PLANE COORDINATE SYSTEM ZONE IIINORTH AMERICAN DATUM OF 1983NORTH AMERICAN VERTICAL DATUM OF 1988IMAGERY Esri
South Bay Salt Pond Restoration Project Figure 2-1A8 Ponds Construction Access Routes
Phase II Project AreasAccess Route
URS O
aklan
d CA 5
/30/
2014
USER
Maia
nna_
Voge
PATH
L:\P
rojec
ts\So
uth_B
ay_S
alt_P
onds
\Map
s\Ac
cess
Route
s\Fig
ure 2-
13 Al
viso A
8 Acc
ess.m
xd
Ch arleston R d
Am phitheatre P ky
E Ch arl eston R d
M iddlef ieldRd
G arci a
Ave
NSh
o reli n
eB l
v d
San
Anto n
ioRd
W Middlefield Rd
BayshorePky
Louis
Rd
WBayshore
Rd
NRen gs to rf f
Ave
Fabia
n Wa
y
101
A2WA1C1
LEGEND
0 1,000 2,000500 FeetCALIFORNIA STATE PLANE COORDINATE SYSTEM ZONE IIINORTH AMERICAN DATUM OF 1983NORTH AMERICAN VERTICAL DATUM OF 1988IMAGERY Esri
South Bay Salt Pond Restoration Project Figure 2-2Mountain View Ponds Construction Access Routes
Phase II Project AreaMaterial staging area
Access routeNeeds PG&E easement
Trail crossingTrail detour
URS O
aklan
d CA 5
/30/
2014
USER
Maia
nna_
Voge
PATH
L:\P
rojec
ts\So
uth_B
ay_S
alt_P
onds
\Map
s\Ac
cess
Route
s\Fig
ure 2-
10 M
t. View
Acce
ss.m
xd

J ef f e r s on C t
I r i s L n
Ma r sh
Rd
S p r i n g S t
A thlone Way
Made r
a A v
e14Th
A v e
Chr ys
le rDr
I r vi n g
A ve
E B a y s h o r e R d
15Th
Ave
Ba y
R dP i e r ce
R d
H o o v e r S t
Mar s
hR d
Annette
Ave
17Th
A ve
R o l is o n
R d
Odessa Ct
Friendly Ct
L o r e l e i L n
N e w b r i d g e S t
Jones Ct
Almanor Ave
Secluded AveHi l l
A v e
Greenwood Pl
J a me s
Av e
Bieber Ave
Wayne Ct
J e f f e r s o n D r
12T h
Av e
Theres
a Ct
C a l l i e L n
Yarn
all
P l
G r e e n o a k s D r
D u n s m u i r Wa y
Rose
Ave
16Th
A v
e
Co m mo nw ea l t h
D r C h i l c o S t
I v y D r
H e d g e R d
Del N
orte Ave
Mod ocAv e
I n d e p e n d e n c e D r
Oa k h ur s t P l
T imo t
h y L
n
Campb
el lA v
e
Hol l y
bur n
e A v
e
W i nde rm
er eA v
e
18ThAv
e
H aven
Ave
S c o t t D r
I v y D r
Flor ence St
Marsh
Rd
Bay Rd
15Th
Ave
Hamilton Av e
Deodor
a Dr
84
101
R4
R3
S5
R5
LEGEND
0 1,000 2,000500 FeetCALIFORNIA STATE PLANE COORDINATE SYSTEM ZONE IIINORTH AMERICAN DATUM OF 1983NORTH AMERICAN VERTICAL DATUM OF 1988IMAGERY Esri
South Bay Salt Pond Restoration Project Figure 2-3Ravenswood Ponds Construction Access Routes
Access RoutePhase II Project Areas
URS O
aklan
d CA 5
/30/
2014
USER
Maia
nna_
Voge
PATH
L:\P
rojec
ts\So
uth_B
ay_S
alt_P
onds
\Map
s\Ac
cess
Route
s\Fig
ure 2-
19 R
aven
swoo
d Acc
ess.m
xd
Traffic Impact Study for South Bay Salt Pond Restoration - Phase 2 Project
9
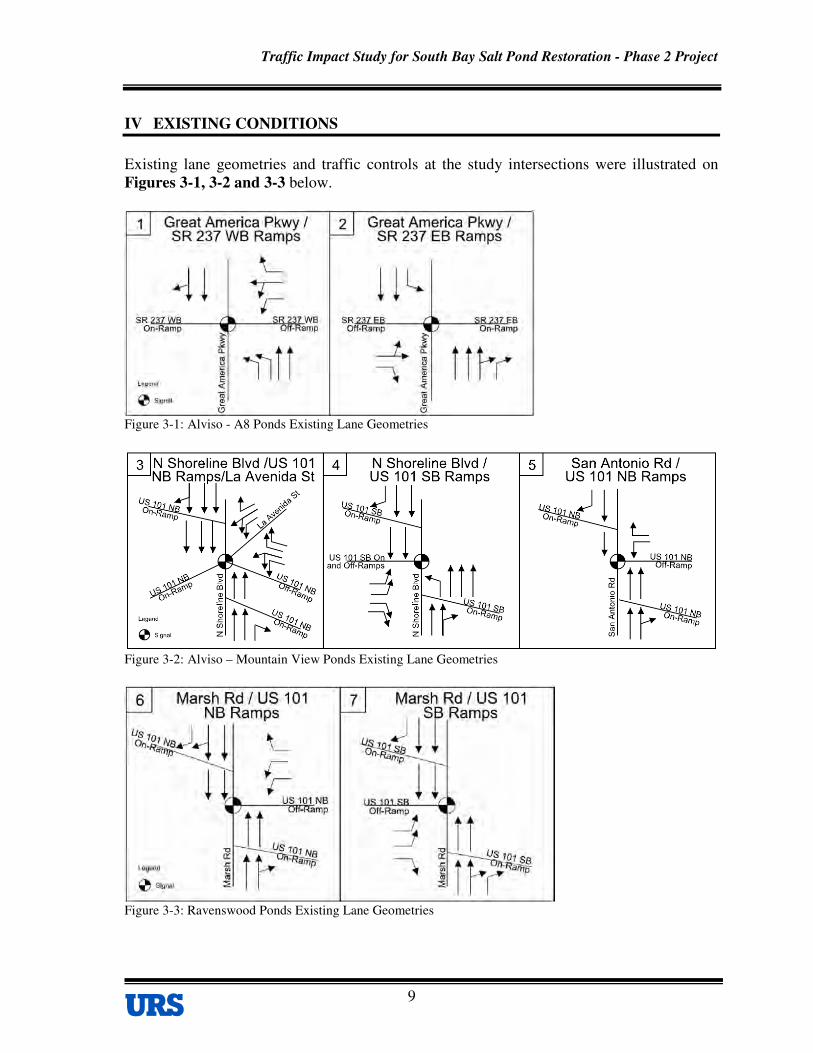
IV EXISTING CONDITIONS
Existing lane geometries and traffic controls at the study intersections were illustrated on
Figures 3-1, 3-2 and 3-3 below.
Figure 3-1: Alviso - A8 Ponds Existing Lane Geometries
Figure 3-2: Alviso – Mountain View Ponds Existing Lane Geometries
Figure 3-3: Ravenswood Ponds Existing Lane Geometries

Traffic Impact Study for South Bay Salt Pond Restoration - Phase 2 Project
10
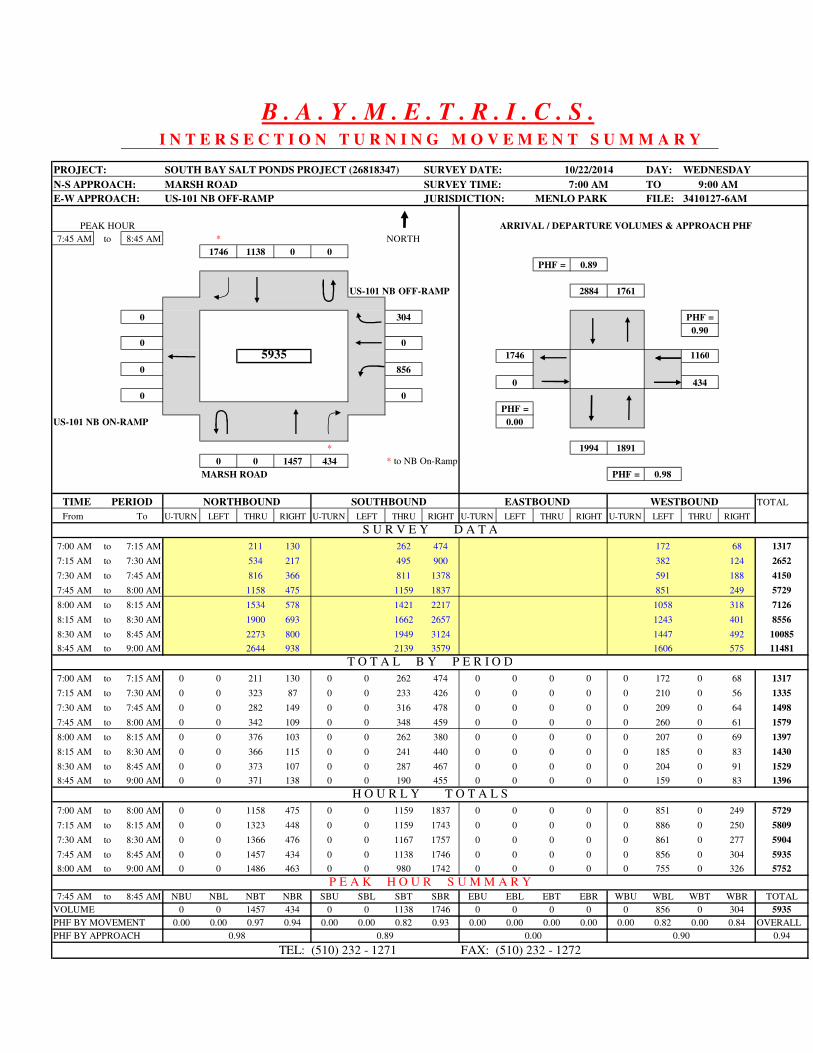
Existing intersection turning movement volumes at the study intersections are illustrated on
Figures 4-1, 4-2, and 4-3 below. Detailed counts in AM and PM peak periods collected in
15 minute intervals were provided in Appendix A.
Figure 4-1: Alviso - A8 Ponds Existing Peak Hour Turning Movement Volumes
Figure 4-2: Alviso – Mountain View Ponds Existing Peak Hour Turning Movement Volumes

Traffic Impact Study for South Bay Salt Pond Restoration - Phase 2 Project
11
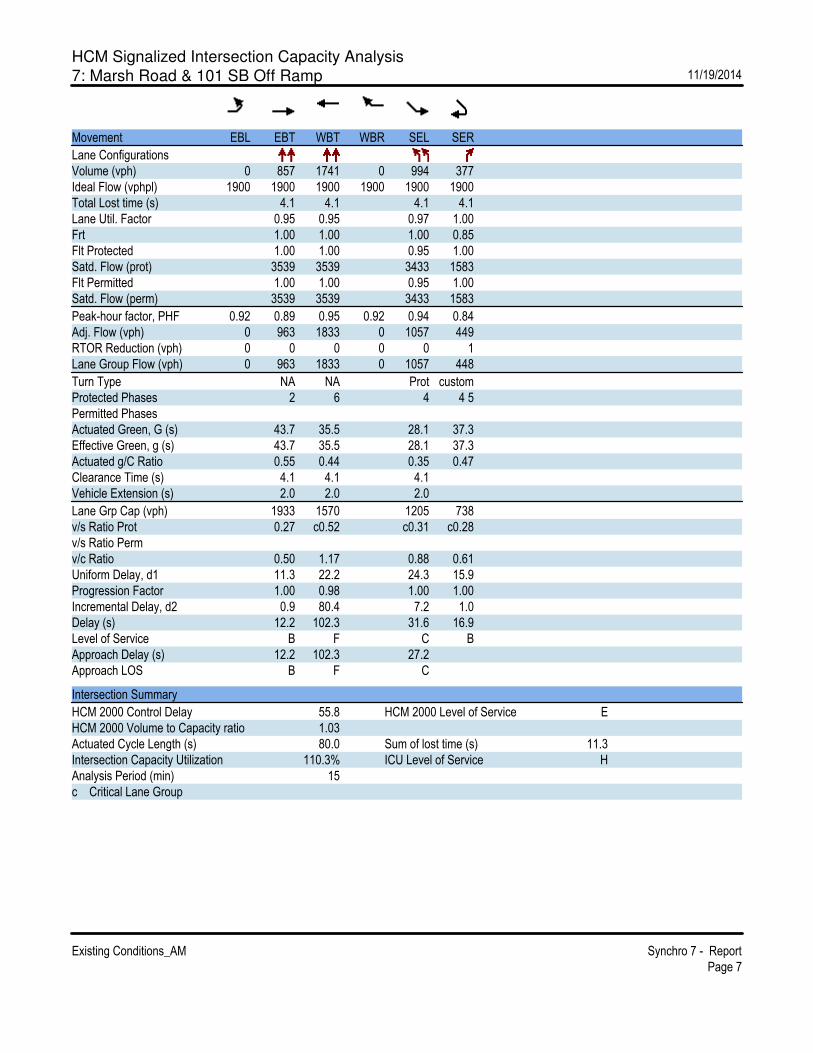
Figure 4-3: Ravenswood Ponds Existing Peak Hour Turning Movement Volumes
V PROJECT CONDITION IMPACT ANALYSIS
Trip generation
The Projects estimated trip generation is shown in the table below.
Project Area - Alternative Net Import
(CY)
Max Trips
Per Day Hours/Day
Trips per
Hour
Alviso - Mountain View B 296400 200 10 20.0
Alviso - Mountain View C 369600 200 10 20.0
Alviso - A8 B 48600 180 10 18.0
Ravenswood B 37900 150 10 15.0
Ravenswood C 210400 150 10 15.0
It is projected that Alviso - A8 Ponds, Alviso - Mountain View Ponds, Ravenswood Ponds
generate 18, 20 and 15 peak hour trips respectively in both the AM and PM Peak Hours.
Figures 5-1, 5-2 and 5-3 illustrate the proposed project trips.

Traffic Impact Study for South Bay Salt Pond Restoration - Phase 2 Project
12
Figure 5-1: Alviso - A8 Ponds Project Trips
Figure 5-2: Alviso – Mountain View Ponds Project Trips

Traffic Impact Study for South Bay Salt Pond Restoration - Phase 2 Project
13
Figure 5-3: Ravenswood Ponds Project Trips
Significant Impact Thresholds
Though the study intersections are operated and maintained by Caltrans, Caltrans
recommend using the corresponding City significant impact threshold criteria.
For Alviso - A8 Ponds study intersections (Great America Pkwy/237 WB Ramps and Great
America Pkwy/237 EB Ramps) City of Santa Clara thresholds have been considered.
For Alviso – Mountain View Ponds study intersections (N Shoreline Blvd/US 101 NB
Ramps, N Shoreline Blvd/US 101 SB Ramps and San Antonio Rd/US 101 NB Ramps) City
of Mountain View thresholds have been considered.
According to these two guidelines,
• LOS D is treated as acceptable LOS. If the project causes an intersection operating at
LOS D or better to fall below LOS D, then the project is projected to be causing a
significant impact.
• For intersections already operating at unacceptable LOS (E or F), if the project
increases average control delay of a critical movement at a signalized study
intersection by more than four (4) seconds, and the volume-to-capacity ratio (v/c) by
more than 0.01, then the project is projected to be causing a significant impact.

Traffic Impact Study for South Bay Salt Pond Restoration - Phase 2 Project
14
For Ravenswood Ponds study intersections (Marsh Rd/US 101 NB Ramps and Marsh
Rd/US 101 SB Ramps) City of Menlo Park thresholds have been considered.
According to this guideline,
• LOS D is treated as acceptable LOS. If the project causes an intersection operating at
LOS D or better to fall below LOS D, then the project is projected to be causing a
significant impact.
• For intersections already operating at unacceptable LOS (E or F), if the project
increases average control delay of a critical movement at a signalized study
intersection by more than 0.8 seconds, then the project is projected to be causing a
significant impact.
Impact Analysis
Analysis was conducted by comparing the Existing and Existing plus Project delay and LOS
to determine if the project causes a significant impact. Table 2 presents the analysis results
for Existing and Existing plus Project Conditions.
Intersections 101 NB off ramp/Shoreline Blvd and 101 SB off ramp/Marsh Rd-Route 84
operate at LOS E in the AM peak hour in existing and existing plus project conditions. The
delay and v/c comparison for the intersection 101 NB off ramp/Shoreline Blvd indicate that
the project doesn’t cause any significant impact, since the increase in delay is only 3.9sec (<
4sec) even though the change in v/c is 0.01. The intersection 101 SB off ramp/Marsh Rd-
Route 84 is projected to be impacted by the project, as the delay increases by 2.9 sec (> 0.8
sec).
Detailed level of service calculation sheets are provided in Appendix B.

Traffic Impact Study for South Bay Salt Pond Restoration - Phase 2 Project
15
Table 2 – LOS and Delay for Existing Conditions and Project Conditions
Intersection
Peak
Hour
Existing Project
Delay1
(sec) LOS
Delay1
(sec) LOS
∆ in
critical
delay2
(sec)
∆ in
critical
v/c3
237 WB off ramp/Great
America Pkwy
AM 14.6 B 15.0 B
PM 9.8 A 9.9 A
237 EB off ramp/Great
America Pkwy
AM 11.6 B 11.8 B
PM 18.7 B 19.5 B
101 NB off ramp/Shoreline
Blvd
AM 73.3 E 75.3 E 3.9 0.01
PM 54.0 D 54.0 D
101 SB off ramp/Shoreline
Blvd
AM 19.6 B 19.7 B
PM 16.6 B 16.8 B
101 NB off ramp/San
Antonio Rd
AM 10.6 B 10.7 B
PM 10.8 B 10.9 B
101 NB off ramp/Marsh
Rd-Route 84
AM 20.8 C 20.9 C
PM 26.9 C 27.3 C
101 SB off ramp/Marsh
Rd-Route 84
AM 55.8 E 57.0 E 2.9
PM 44.4 D 45.8 D Source: URS
Notes:
Bold indicates LOS worse than D.
Red indicates Impact.
1. Intersection Control Delay per HCM methodology
2. Change in critical movement delay between existing and project conditions.
3. Change in critical volume to capacity (v/c) between existing and project conditions.
VII MITIGATION MEASURES
No mitigations measures are necessary for the study intersections except for 101 SB off
ramp/Marsh Rd-Route 84 intersection. The landowner (USFWS) shall coordinate with
Caltrans and/or the City of Menlo Park to modify this intersection signal timing in the AM
to reduce project related delay (seconds).
Table below shows the LOS and delay after the mitigation compared to existing condition
LOS and Delay. Since the change in critical delay is 0.3 sec (less than the significant impact
threshold of 0.8 sec), it is identified that this mitigation help bring the intersection to operate
the same as existing condition with addition of project traffic.
The project mitigation condition LOS analysis from synchro is provided in Appendix B.

Traffic Impact Study for South Bay Salt Pond Restoration - Phase 2 Project
16
Table 3 – LOS and Delay for Existing Conditions and Mitigated Project Conditions
Intersection
Peak
Hour
Existing Mitigated Project
Delay1
(sec) LOS
Delay1
(sec) LOS
∆ in
critical
delay2
(sec)
101 SB off ramp/Marsh Rd-
Route 84 AM 55.8 E 55.8 E 0.3 Source: URS
Notes:
Bold indicates LOS worse than D.
1. Intersection Control Delay per HCM methodology
2. Change in critical movement delay between existing and project conditions.
VIII CONCLUSION
It is determined from the analysis that, with the incorporation of mitigation measures, the
project doesn’t cause any significant impact to the study intersections.
Traffic Impact Study for South Bay Salt Pond Restoration - Phase 2 Project
i
APPENDIX A
DETAILED INTERSECTION TURNING
MOVEMENT VOLUMES

PROJECT: SOUTH BAY SALT PONDS PROJECT (26818347) SURVEY DATE: DAY: WEDNESDAY
N-S APPROACH: GREAT AMERICA PARKWAY SURVEY TIME: TO
E-W APPROACH: SR-237 WB OFF-RAMP JURISDICTION: SUNNYVALE FILE: 3410127-4AM
PEAK HOUR
8:00 AM to 9:00 AM NORTH
413 58 0 0
PHF = 0.67
SR-237 WB OFF-RAMP 471 418
0 182 PHF =
0.90
0 21
594 1032
0 829
0 0
0 0
PHF =
SR-237 WB ON-RAMP 0.00
888 397
1 160 236 0
GREAT AMERICA PARKWAY PHF = 0.78
NORTHBOUND SOUTHBOUND EASTBOUND WESTBOUND TOTAL
From To U-TURN LEFT THRU RIGHT U-TURN LEFT THRU RIGHT U-TURN LEFT THRU RIGHT U-TURN LEFT THRU RIGHT
7:00 AM to 7:15 AM 1 19 26 15 66 119 1 15 262
7:15 AM to 7:30 AM 1 43 63 19 162 260 2 40 590
7:30 AM to 7:45 AM 1 78 103 28 266 428 20 67 991
7:45 AM to 8:00 AM 1 111 155 45 366 613 34 105 1430
8:00 AM to 8:15 AM 1 142 206 60 422 774 41 159 1805
8:15 AM to 8:30 AM 1 184 264 76 582 976 45 197 2325
8:30 AM to 8:45 AM 1 221 315 90 683 1213 48 237 2808
8:45 AM to 9:00 AM 2 271 391 103 779 1442 55 287 3330
7:00 AM to 7:15 AM 1 19 26 0 0 0 15 66 0 0 0 0 0 119 1 15 262
7:15 AM to 7:30 AM 0 24 37 0 0 0 4 96 0 0 0 0 0 141 1 25 328
7:30 AM to 7:45 AM 0 35 40 0 0 0 9 104 0 0 0 0 0 168 18 27 401
7:45 AM to 8:00 AM 0 33 52 0 0 0 17 100 0 0 0 0 0 185 14 38 439
8:00 AM to 8:15 AM 0 31 51 0 0 0 15 56 0 0 0 0 0 161 7 54 375
8:15 AM to 8:30 AM 0 42 58 0 0 0 16 160 0 0 0 0 0 202 4 38 520
8:30 AM to 8:45 AM 0 37 51 0 0 0 14 101 0 0 0 0 0 237 3 40 483
8:45 AM to 9:00 AM 1 50 76 0 0 0 13 96 0 0 0 0 0 229 7 50 522
7:00 AM to 8:00 AM 1 111 155 0 0 0 45 366 0 0 0 0 0 613 34 105 1430
7:15 AM to 8:15 AM 0 123 180 0 0 0 45 356 0 0 0 0 0 655 40 144 1543
7:30 AM to 8:30 AM 0 141 201 0 0 0 57 420 0 0 0 0 0 716 43 157 1735
7:45 AM to 8:45 AM 0 143 212 0 0 0 62 417 0 0 0 0 0 785 28 170 1817
8:00 AM to 9:00 AM 1 160 236 0 0 0 58 413 0 0 0 0 0 829 21 182 1900
8:00 AM to 9:00 AM NBU NBL NBT NBR SBU SBL SBT SBR EBU EBL EBT EBR WBU WBL WBT WBR TOTAL
1 160 236 0 0 0 58 413 0 0 0 0 0 829 21 182 1900
0.25 0.80 0.78 0.00 0.00 0.00 0.91 0.65 0.00 0.00 0.00 0.00 0.00 0.87 0.75 0.84 OVERALL
0.91
B . A . Y . M . E . T . R . I . C . S .I N T E R S E C T I O N T U R N I N G M O V E M E N T S U M M A R Y
10/22/2014
7:00 AM
1900
TEL: (510) 232 - 1271 FAX: (510) 232 - 1272
9:00 AM
TIME PERIOD
ARRIVAL / DEPARTURE VOLUMES & APPROACH PHF
P E A K H O U R S U M M A R Y
VOLUME
S U R V E Y D A T A
T O T A L B Y P E R I O D
H O U R L Y T O T A L S
PHF BY MOVEMENT
PHF BY APPROACH 0.78 0.67 0.900.00

PROJECT: SOUTH BAY SALT PONDS PROJECT (26818347) SURVEY DATE: DAY: WEDNESDAY
N-S APPROACH: GREAT AMERICA PARKWAY SURVEY TIME: TO
E-W APPROACH: SR-237 WB OFF-RAMP JURISDICTION: SUNNYVALE FILE: 3410127-4PM
PEAK HOUR
5:00 PM to 6:00 PM NORTH
639 510 0 0
PHF = 0.96
SR-237 WB OFF-RAMP 1149 721
0 208 PHF =
0.96
0 5
695 327
0 114
0 0
0 0
PHF =
SR-237 WB ON-RAMP 0.00
624 564
0 51 513 0
GREAT AMERICA PARKWAY PHF = 0.93
NORTHBOUND SOUTHBOUND EASTBOUND WESTBOUND TOTAL
From To U-TURN LEFT THRU RIGHT U-TURN LEFT THRU RIGHT U-TURN LEFT THRU RIGHT U-TURN LEFT THRU RIGHT
4:00 PM to 4:15 PM 16 113 83 163 43 1 64 483
4:15 PM to 4:30 PM 30 215 168 317 74 1 129 934
4:30 PM to 4:45 PM 57 318 287 473 114 1 196 1446
4:45 PM to 5:00 PM 84 440 405 603 145 1 237 1915
5:00 PM to 5:15 PM 99 576 528 771 168 2 296 2440
5:15 PM to 5:30 PM 107 708 657 926 201 2 348 2949
5:30 PM to 5:45 PM 124 817 792 1090 235 3 397 3458
5:45 PM to 6:00 PM 135 953 915 1242 259 6 445 3955
4:00 PM to 4:15 PM 0 16 113 0 0 0 83 163 0 0 0 0 0 43 1 64 483
4:15 PM to 4:30 PM 0 14 102 0 0 0 85 154 0 0 0 0 0 31 0 65 451
4:30 PM to 4:45 PM 0 27 103 0 0 0 119 156 0 0 0 0 0 40 0 67 512
4:45 PM to 5:00 PM 0 27 122 0 0 0 118 130 0 0 0 0 0 31 0 41 469
5:00 PM to 5:15 PM 0 15 136 0 0 0 123 168 0 0 0 0 0 23 1 59 525
5:15 PM to 5:30 PM 0 8 132 0 0 0 129 155 0 0 0 0 0 33 0 52 509
5:30 PM to 5:45 PM 0 17 109 0 0 0 135 164 0 0 0 0 0 34 1 49 509
5:45 PM to 6:00 PM 0 11 136 0 0 0 123 152 0 0 0 0 0 24 3 48 497
4:00 PM to 5:00 PM 0 84 440 0 0 0 405 603 0 0 0 0 0 145 1 237 1915
4:15 PM to 5:15 PM 0 83 463 0 0 0 445 608 0 0 0 0 0 125 1 232 1957
4:30 PM to 5:30 PM 0 77 493 0 0 0 489 609 0 0 0 0 0 127 1 219 2015
4:45 PM to 5:45 PM 0 67 499 0 0 0 505 617 0 0 0 0 0 121 2 201 2012
5:00 PM to 6:00 PM 0 51 513 0 0 0 510 639 0 0 0 0 0 114 5 208 2040
5:00 PM to 6:00 PM NBU NBL NBT NBR SBU SBL SBT SBR EBU EBL EBT EBR WBU WBL WBT WBR TOTAL
0 51 513 0 0 0 510 639 0 0 0 0 0 114 5 208 2040
0.00 0.75 0.94 0.00 0.00 0.00 0.94 0.95 0.00 0.00 0.00 0.00 0.00 0.84 0.42 0.88 OVERALL
0.970.00 0.96
TEL: (510) 232 - 1271 FAX: (510) 232 - 1272
VOLUME
PHF BY MOVEMENT
PHF BY APPROACH 0.93 0.96
P E A K H O U R S U M M A R Y
B . A . Y . M . E . T . R . I . C . S .I N T E R S E C T I O N T U R N I N G M O V E M E N T S U M M A R Y
10/22/2014
4:00 PM 6:00 PM
ARRIVAL / DEPARTURE VOLUMES & APPROACH PHF
2040
TIME PERIOD
S U R V E Y D A T A
T O T A L B Y P E R I O D
H O U R L Y T O T A L S

PROJECT: SOUTH BAY SALT PONDS PROJECT (26818347) SURVEY DATE: DAY: WEDNESDAY
N-S APPROACH: GREAT AMERICA PARKWAY SURVEY TIME: TO
E-W APPROACH: SR-237 EB OFF-RAMP JURISDICTION: SUNNYVALE FILE: 3410127-5AM
PEAK HOUR
8:00 AM to 9:00 AM NORTH
0 857 21 1
PHF = 0.89
SR-237 EB ON-RAMP 879 386
0 0 PHF =
0.00
162 0
0 0
2 0
599 359
435 0
PHF =
SR-237 EB OFF-RAMP 0.94
1292 559
0 0 223 336
GREAT AMERICA PARKWAY PHF = 0.88
NORTHBOUND SOUTHBOUND EASTBOUND WESTBOUND TOTAL
From To U-TURN LEFT THRU RIGHT U-TURN LEFT THRU RIGHT U-TURN LEFT THRU RIGHT U-TURN LEFT THRU RIGHT
7:00 AM to 7:15 AM 27 57 0 9 113 20 0 40 266
7:15 AM to 7:30 AM 70 99 0 15 267 35 0 98 584
7:30 AM to 7:45 AM 127 208 0 25 435 59 1 171 1026
7:45 AM to 8:00 AM 182 284 1 37 619 96 1 246 1466
8:00 AM to 8:15 AM 221 352 1 43 782 132 1 349 1881
8:15 AM to 8:30 AM 277 454 1 48 1005 173 1 464 2423
8:30 AM to 8:45 AM 335 553 2 54 1234 218 1 578 2975
8:45 AM to 9:00 AM 405 620 2 58 1476 258 3 681 3503
7:00 AM to 7:15 AM 0 0 27 57 0 9 113 0 0 20 0 40 0 0 0 0 266
7:15 AM to 7:30 AM 0 0 43 42 0 6 154 0 0 15 0 58 0 0 0 0 318
7:30 AM to 7:45 AM 0 0 57 109 0 10 168 0 0 24 1 73 0 0 0 0 442
7:45 AM to 8:00 AM 0 0 55 76 1 12 184 0 0 37 0 75 0 0 0 0 440
8:00 AM to 8:15 AM 0 0 39 68 0 6 163 0 0 36 0 103 0 0 0 0 415
8:15 AM to 8:30 AM 0 0 56 102 0 5 223 0 0 41 0 115 0 0 0 0 542
8:30 AM to 8:45 AM 0 0 58 99 1 6 229 0 0 45 0 114 0 0 0 0 552
8:45 AM to 9:00 AM 0 0 70 67 0 4 242 0 0 40 2 103 0 0 0 0 528
7:00 AM to 8:00 AM 0 0 182 284 1 37 619 0 0 96 1 246 0 0 0 0 1466
7:15 AM to 8:15 AM 0 0 194 295 1 34 669 0 0 112 1 309 0 0 0 0 1615
7:30 AM to 8:30 AM 0 0 207 355 1 33 738 0 0 138 1 366 0 0 0 0 1839
7:45 AM to 8:45 AM 0 0 208 345 2 29 799 0 0 159 0 407 0 0 0 0 1949
8:00 AM to 9:00 AM 0 0 223 336 1 21 857 0 0 162 2 435 0 0 0 0 2037
8:00 AM to 9:00 AM NBU NBL NBT NBR SBU SBL SBT SBR EBU EBL EBT EBR WBU WBL WBT WBR TOTAL
0 0 223 336 1 21 857 0 0 162 2 435 0 0 0 0 2037
0.00 0.00 0.80 0.82 0.25 0.88 0.89 0.00 0.00 0.90 0.25 0.95 0.00 0.00 0.00 0.00 OVERALL
0.92
TEL: (510) 232 - 1271 FAX: (510) 232 - 1272
9:00 AM
TIME PERIOD
ARRIVAL / DEPARTURE VOLUMES & APPROACH PHF
P E A K H O U R S U M M A R Y
VOLUME
S U R V E Y D A T A
T O T A L B Y P E R I O D
H O U R L Y T O T A L S
PHF BY MOVEMENT
PHF BY APPROACH 0.88 0.89 0.000.94
B . A . Y . M . E . T . R . I . C . S .I N T E R S E C T I O N T U R N I N G M O V E M E N T S U M M A R Y
10/22/2014
7:00 AM
2037

PROJECT: SOUTH BAY SALT PONDS PROJECT (26818347) SURVEY DATE: DAY: WEDNESDAY
N-S APPROACH: GREAT AMERICA PARKWAY SURVEY TIME: TO
E-W APPROACH: SR-237 EB OFF-RAMP JURISDICTION: SUNNYVALE FILE: 3410127-5PM
PEAK HOUR
4:30 PM to 5:30 PM NORTH
0 313 306 0
PHF = 0.95
SR-237 EB ON-RAMP 619 572
0 0 PHF =
0.00
420 0
0 0
8 0
607 534
179 0
PHF =
SR-237 EB OFF-RAMP 0.89
492 372
0 0 152 220
GREAT AMERICA PARKWAY PHF = 0.88
NORTHBOUND SOUTHBOUND EASTBOUND WESTBOUND TOTAL
From To U-TURN LEFT THRU RIGHT U-TURN LEFT THRU RIGHT U-TURN LEFT THRU RIGHT U-TURN LEFT THRU RIGHT
4:00 PM to 4:15 PM 35 51 56 70 96 0 33 341
4:15 PM to 4:30 PM 59 72 109 129 186 0 73 628
4:30 PM to 4:45 PM 101 131 181 218 274 2 113 1020
4:45 PM to 5:00 PM 139 199 259 288 386 5 160 1436
5:00 PM to 5:15 PM 165 257 335 359 510 7 204 1837
5:15 PM to 5:30 PM 211 292 415 442 606 8 252 2226
5:30 PM to 5:45 PM 239 352 482 545 701 8 275 2602
5:45 PM to 6:00 PM 271 392 542 628 819 10 309 2971
4:00 PM to 4:15 PM 0 0 35 51 0 56 70 0 0 96 0 33 0 0 0 0 341
4:15 PM to 4:30 PM 0 0 24 21 0 53 59 0 0 90 0 40 0 0 0 0 287
4:30 PM to 4:45 PM 0 0 42 59 0 72 89 0 0 88 2 40 0 0 0 0 392
4:45 PM to 5:00 PM 0 0 38 68 0 78 70 0 0 112 3 47 0 0 0 0 416
5:00 PM to 5:15 PM 0 0 26 58 0 76 71 0 0 124 2 44 0 0 0 0 401
5:15 PM to 5:30 PM 0 0 46 35 0 80 83 0 0 96 1 48 0 0 0 0 389
5:30 PM to 5:45 PM 0 0 28 60 0 67 103 0 0 95 0 23 0 0 0 0 376
5:45 PM to 6:00 PM 0 0 32 40 0 60 83 0 0 118 2 34 0 0 0 0 369
4:00 PM to 5:00 PM 0 0 139 199 0 259 288 0 0 386 5 160 0 0 0 0 1436
4:15 PM to 5:15 PM 0 0 130 206 0 279 289 0 0 414 7 171 0 0 0 0 1496
4:30 PM to 5:30 PM 0 0 152 220 0 306 313 0 0 420 8 179 0 0 0 0 1598
4:45 PM to 5:45 PM 0 0 138 221 0 301 327 0 0 427 6 162 0 0 0 0 1582
5:00 PM to 6:00 PM 0 0 132 193 0 283 340 0 0 433 5 149 0 0 0 0 1535
4:30 PM to 5:30 PM NBU NBL NBT NBR SBU SBL SBT SBR EBU EBL EBT EBR WBU WBL WBT WBR TOTAL
0 0 152 220 0 306 313 0 0 420 8 179 0 0 0 0 1598
0.00 0.00 0.83 0.81 0.00 0.96 0.88 0.00 0.00 0.85 0.67 0.93 0.00 0.00 0.00 0.00 OVERALL
0.96
P E A K H O U R S U M M A R Y
B . A . Y . M . E . T . R . I . C . S .I N T E R S E C T I O N T U R N I N G M O V E M E N T S U M M A R Y
10/22/2014
4:00 PM 6:00 PM
ARRIVAL / DEPARTURE VOLUMES & APPROACH PHF
1598
TIME PERIOD
S U R V E Y D A T A
T O T A L B Y P E R I O D
H O U R L Y T O T A L S
0.89 0.00
TEL: (510) 232 - 1271 FAX: (510) 232 - 1272
VOLUME
PHF BY MOVEMENT
PHF BY APPROACH 0.88 0.95

PROJECT: SOUTH BAY SALT PONDS PROJECT (26818347) SURVEY DATE: DAY: WEDNESDAY
N-S APPROACH: SHORELINE BOULEVARD SURVEY TIME: TO
E-W APPROACH:US-101 NB RAMPS - LA AVENIDA STREET JURISDICTION: MOUNTAIN VIEW FILE: 3410127-2AM
* ARRIVAL / DEPARTURE VOLUMES
PEAK HOUR 49 325 0
8:00 AM TO 9:00 AM NORTH PHF = 0.92
LA AVENIDA STREET 374 2407
13 PHF =
0.73
30 *
151
108
US-101 NB 0
ON-RAMP 3797 427
1213 1748
5 * 0
530 PHF =
0.87
US-101 NB RAMPS
* to NB ON-RAMP 963 1524
0 1181 343 * PHF = 0.89
SHORELINE BOULEVARD
NORTHBOUND SOUTHBOUND WB (LA AVENIDA ST) WB (101 NB OFFRAMPS) TOTAL
From To LEFT THRU ONRAMP LEFT THRU ONRAMP LEFT ONRAMP RIGHT LEFT ONRAMP RIGHT
7:00 AM to 7:15 AM 99 59 54 14 7 13 0 66 0 216 528
7:15 AM to 7:30 AM 213 122 102 24 34 35 3 122 0 495 1150
7:30 AM to 7:45 AM 368 235 163 32 55 50 4 202 2 797 1908
7:45 AM to 8:00 AM 540 316 240 46 88 57 6 277 2 1159 2731
8:00 AM to 8:15 AM 782 433 314 63 127 66 10 413 6 1520 3734
8:15 AM to 8:30 AM 1092 551 395 73 141 77 11 510 6 1822 4678
8:30 AM to 8:45 AM 1403 624 474 84 166 81 16 654 7 2075 5584
8:45 AM to 9:00 AM 1721 659 565 95 196 87 19 807 7 2372 6528
7:00 AM to 7:15 AM 0 99 59 0 54 14 7 13 0 66 0 216 528
7:15 AM to 7:30 AM 0 114 63 0 48 10 27 22 3 56 0 279 622
7:30 AM to 7:45 AM 0 155 113 0 61 8 21 15 1 80 2 302 758
7:45 AM to 8:00 AM 0 172 81 0 77 14 33 7 2 75 0 362 823
8:00 AM to 8:15 AM 0 242 117 0 74 17 39 9 4 136 4 361 1003
8:15 AM to 8:30 AM 0 310 118 0 81 10 14 11 1 97 0 302 944
8:30 AM to 8:45 AM 0 311 73 0 79 11 25 4 5 144 1 253 906
8:45 AM to 9:00 AM 0 318 35 0 91 11 30 6 3 153 0 297 944
7:00 AM to 8:00 AM 0 540 316 0 240 46 88 57 6 277 2 1159 2731
7:15 AM to 8:15 AM 0 683 374 0 260 49 120 53 10 347 6 1304 3206
7:30 AM to 8:30 AM 0 879 429 0 293 49 107 42 8 388 6 1327 3528
7:45 AM to 8:45 AM 0 1035 389 0 311 52 111 31 12 452 5 1278 3676
8:00 AM to 9:00 AM 0 1181 343 0 325 49 108 30 13 530 5 1213 3797
8:00 AM to 9:00 AM NORTHBOUND SOUTHBOUND WB (LA AVENIDA ST) WB (101 NB OFFRAMPS) TOTAL
LEFT THRU ONRAMP LEFT THRU ONRAMP LEFT ONRAMP RIGHT LEFT ONRAMP RIGHT
0 1181 343 0 325 49 108 30 13 530 5 1213 3797
#DIV/0! 0.93 0.73 #DIV/0! 0.89 0.72 0.69 0.68 0.65 0.87 0.31 0.84 OVERALL
0.95
TEL: (510) 232 - 1271 FAX: (510) 232 - 1272
VOLUME
P E A K H O U R S U M M A R Y
PHF BY MOVEMENT
PHF BY APPROACH 0.89 0.92 0.73
H O U R L Y T O T A L S
7:00 AM 9:00 AM
TIME PERIOD
0.87
B . A . Y . M . E . T . R . I . C . S .I N T E R S E C T I O N T U R N I N G M O V E M E N T S U M M A R Y
10/22/2014
S U R V E Y D A T A
T O T A L B Y P E R I O D

PROJECT: SOUTH BAY SALT PONDS PROJECT (26818347) SURVEY DATE: DAY: WEDNESDAY
N-S APPROACH: SHORELINE BOULEVARD SURVEY TIME: TO
E-W APPROACH:US-101 NB RAMPS - LA AVENIDA STREET JURISDICTION: MOUNTAIN VIEW FILE: 3410127-2PM
* ARRIVAL / DEPARTURE VOLUMES
PEAK HOUR 157 2079 0
5:00 PM TO 6:00 PM NORTH PHF = 0.94
LA AVENIDA STREET 2236 919
5 PHF =
0.88
132 *
467
330
US-101 NB 0
ON-RAMP 4394 634
474 910
4 * 0
432 PHF =
0.92
US-101 NB RAMPS
* to NB ON-RAMP 2841 781
0 440 341 * PHF = 0.89
SHORELINE BOULEVARD
NORTHBOUND SOUTHBOUND WB (LA AVENIDA ST) WB (101 NB OFFRAMPS) TOTAL
From To LEFT THRU ONRAMP LEFT THRU ONRAMP LEFT ONRAMP RIGHT LEFT ONRAMP RIGHT
4:00 PM to 4:15 PM 99 71 410 58 56 19 0 90 4 67 874
4:15 PM to 4:30 PM 178 144 840 102 116 37 1 206 5 203 1832
4:30 PM to 4:45 PM 280 209 1270 159 190 59 4 287 6 331 2795
4:45 PM to 5:00 PM 352 300 1718 203 258 84 5 386 6 423 3735
5:00 PM to 5:15 PM 447 383 2265 252 350 123 6 502 6 543 4877
5:15 PM to 5:30 PM 572 478 2770 293 443 146 8 605 7 664 5986
5:30 PM to 5:45 PM 673 570 3309 326 526 181 10 700 9 770 7074
5:45 PM to 6:00 PM 792 641 3797 360 588 216 10 818 10 897 8129
4:00 PM to 4:15 PM 0 99 71 0 410 58 56 19 0 90 4 67 874
4:15 PM to 4:30 PM 0 79 73 0 430 44 60 18 1 116 1 136 958
4:30 PM to 4:45 PM 0 102 65 0 430 57 74 22 3 81 1 128 963
4:45 PM to 5:00 PM 0 72 91 0 448 44 68 25 1 99 0 92 940
5:00 PM to 5:15 PM 0 95 83 0 547 49 92 39 1 116 0 120 1142
5:15 PM to 5:30 PM 0 125 95 0 505 41 93 23 2 103 1 121 1109
5:30 PM to 5:45 PM 0 101 92 0 539 33 83 35 2 95 2 106 1088
5:45 PM to 6:00 PM 0 119 71 0 488 34 62 35 0 118 1 127 1055
4:00 PM to 5:00 PM 0 352 300 0 1718 203 258 84 5 386 6 423 3735
4:15 PM to 5:15 PM 0 348 312 0 1855 194 294 104 6 412 2 476 4003
4:30 PM to 5:30 PM 0 394 334 0 1930 191 327 109 7 399 2 461 4154
4:45 PM to 5:45 PM 0 393 361 0 2039 167 336 122 6 413 3 439 4279
5:00 PM to 6:00 PM 0 440 341 0 2079 157 330 132 5 432 4 474 4394
5:00 PM to 6:00 PM NORTHBOUND SOUTHBOUND WB (LA AVENIDA ST) WB (101 NB OFFRAMPS) TOTAL
LEFT THRU ONRAMP LEFT THRU ONRAMP LEFT ONRAMP RIGHT LEFT ONRAMP RIGHT
0 440 341 0 2079 157 330 132 5 432 4 474 4394
#DIV/0! 0.88 0.90 #DIV/0! 0.95 0.80 0.89 0.85 0.63 0.92 0.50 0.93 OVERALL
0.96
TEL: (510) 232 - 1271 FAX: (510) 232 - 1272
PHF BY MOVEMENT
PHF BY APPROACH 0.89 0.94 0.88 0.92
VOLUME
B . A . Y . M . E . T . R . I . C . S .I N T E R S E C T I O N T U R N I N G M O V E M E N T S U M M A R Y
10/22/2014
4:00 PM 6:00 PM
TIME PERIOD
S U R V E Y D A T A
T O T A L B Y P E R I O D
H O U R L Y T O T A L S
P E A K H O U R S U M M A R Y

PROJECT: SOUTH BAY SALT PONDS PROJECT (26818347) SURVEY DATE: DAY: WEDNESDAY
N-S APPROACH: N. SHORELINE BOULEVARD SURVEY TIME: TO
E-W APPROACH: US-101 SB OFF-RAMP JURISDICTION: MOUNTAIN VIEW FILE: 3410127-3AM
PEAK HOUR
8:00 AM to 9:00 AM * NORTH
312 653 0 0
PHF = 0.91
US-101 SB ON-RAMP 965 1522
0 0 PHF =
0.00
299 0
365 0
0 0
671 216
372 0
PHF =
US-101 SB OFF-RAMP 0.69
* * 1025 1492
0 53 1223 216 * to SB On-Ramp
N. SHORELINE BOULEVARD PHF = 0.88
NORTHBOUND SOUTHBOUND EASTBOUND WESTBOUND TOTAL
From To U-TURN LEFT THRU RIGHT U-TURN LEFT THRU RIGHT U-TURN LEFT THRU RIGHT U-TURN LEFT THRU RIGHT
7:00 AM to 7:15 AM 17 106 53 85 47 48 56 412
7:15 AM to 7:30 AM 40 236 126 160 102 93 124 881
7:30 AM to 7:45 AM 62 441 212 271 157 159 209 1511
7:45 AM to 8:00 AM 82 650 299 396 217 200 301 2145
8:00 AM to 8:15 AM 95 936 363 557 296 275 410 2932
8:15 AM to 8:30 AM 108 1293 417 709 349 347 497 3720
8:30 AM to 8:45 AM 122 1601 488 880 432 424 506 4453
8:45 AM to 9:00 AM 135 1873 515 1049 529 499 673 5273
7:00 AM to 7:15 AM 0 17 106 53 0 0 85 47 0 48 0 56 0 0 0 0 412
7:15 AM to 7:30 AM 0 23 130 73 0 0 75 55 0 45 0 68 0 0 0 0 469
7:30 AM to 7:45 AM 0 22 205 86 0 0 111 55 0 66 0 85 0 0 0 0 630
7:45 AM to 8:00 AM 0 20 209 87 0 0 125 60 0 41 0 92 0 0 0 0 634
8:00 AM to 8:15 AM 0 13 286 64 0 0 161 79 0 75 0 109 0 0 0 0 787
8:15 AM to 8:30 AM 0 13 357 54 0 0 152 53 0 72 0 87 0 0 0 0 788
8:30 AM to 8:45 AM 0 14 308 71 0 0 171 83 0 77 0 9 0 0 0 0 733
8:45 AM to 9:00 AM 0 13 272 27 0 0 169 97 0 75 0 167 0 0 0 0 820
7:00 AM to 8:00 AM 0 82 650 299 0 0 396 217 0 200 0 301 0 0 0 0 2145
7:15 AM to 8:15 AM 0 78 830 310 0 0 472 249 0 227 0 354 0 0 0 0 2520
7:30 AM to 8:30 AM 0 68 1057 291 0 0 549 247 0 254 0 373 0 0 0 0 2839
7:45 AM to 8:45 AM 0 60 1160 276 0 0 609 275 0 265 0 297 0 0 0 0 2942
8:00 AM to 9:00 AM 0 53 1223 216 0 0 653 312 0 299 0 372 0 0 0 0 3128
8:00 AM to 9:00 AM NBU NBL NBT NBR SBU SBL SBT SBR EBU EBL EBT EBR WBU WBL WBT WBR TOTAL
0 53 1223 216 0 0 653 312 0 299 0 372 0 0 0 0 3128
0.00 0.95 0.86 0.76 0.00 0.00 0.95 0.80 0.00 0.97 0.00 0.56 0.00 0.00 0.00 0.00 OVERALL
0.95
B . A . Y . M . E . T . R . I . C . S .I N T E R S E C T I O N T U R N I N G M O V E M E N T S U M M A R Y
10/22/2014
7:00 AM
3128
TEL: (510) 232 - 1271 FAX: (510) 232 - 1272
9:00 AM
TIME PERIOD
ARRIVAL / DEPARTURE VOLUMES & APPROACH PHF
P E A K H O U R S U M M A R Y
VOLUME
S U R V E Y D A T A
T O T A L B Y P E R I O D
H O U R L Y T O T A L S
PHF BY MOVEMENT
PHF BY APPROACH 0.88 0.91 0.000.69

PROJECT: SOUTH BAY SALT PONDS PROJECT (26818347) SURVEY DATE: DAY: WEDNESDAY
N-S APPROACH: N. SHORELINE BOULEVARD SURVEY TIME: TO
E-W APPROACH: US-101 SB OFF-RAMP JURISDICTION: MOUNTAIN VIEW FILE: 3410127-3PM
PEAK HOUR
5:00 PM to 6:00 PM * NORTH
1556 1277 0 0
PHF = 0.94
US-101 SB ON-RAMP 2833 776
0 0 PHF =
0.00
96 0
1679 0
0 0
372 314
276 0
PHF =
US-101 SB OFF-RAMP 0.91
* * 1553 1117
0 123 680 314 * to SB On-Ramp
N. SHORELINE BOULEVARD PHF = 0.87
NORTHBOUND SOUTHBOUND EASTBOUND WESTBOUND TOTAL
From To U-TURN LEFT THRU RIGHT U-TURN LEFT THRU RIGHT U-TURN LEFT THRU RIGHT U-TURN LEFT THRU RIGHT
4:00 PM to 4:15 PM 28 143 79 222 336 29 49 886
4:15 PM to 4:30 PM 46 277 151 461 715 44 98 1792
4:30 PM to 4:45 PM 84 421 235 696 1046 65 146 2693
4:45 PM to 5:00 PM 115 567 307 949 1409 87 208 3642
5:00 PM to 5:15 PM 154 719 405 1274 1835 112 264 4763
5:15 PM to 5:30 PM 185 919 495 1612 2198 135 331 5875
5:30 PM to 5:45 PM 213 1086 560 1948 2580 161 407 6955
5:45 PM to 6:00 PM 238 1247 621 2226 2965 183 484 7964
4:00 PM to 4:15 PM 0 28 143 79 0 0 222 336 0 29 0 49 0 0 0 0 886
4:15 PM to 4:30 PM 0 18 134 72 0 0 239 379 0 15 0 49 0 0 0 0 906
4:30 PM to 4:45 PM 0 38 144 84 0 0 235 331 0 21 0 48 0 0 0 0 901
4:45 PM to 5:00 PM 0 31 146 72 0 0 253 363 0 22 0 62 0 0 0 0 949
5:00 PM to 5:15 PM 0 39 152 98 0 0 325 426 0 25 0 56 0 0 0 0 1121
5:15 PM to 5:30 PM 0 31 200 90 0 0 338 363 0 23 0 67 0 0 0 0 1112
5:30 PM to 5:45 PM 0 28 167 65 0 0 336 382 0 26 0 76 0 0 0 0 1080
5:45 PM to 6:00 PM 0 25 161 61 0 0 278 385 0 22 0 77 0 0 0 0 1009
4:00 PM to 5:00 PM 0 115 567 307 0 0 949 1409 0 87 0 208 0 0 0 0 3642
4:15 PM to 5:15 PM 0 126 576 326 0 0 1052 1499 0 83 0 215 0 0 0 0 3877
4:30 PM to 5:30 PM 0 139 642 344 0 0 1151 1483 0 91 0 233 0 0 0 0 4083
4:45 PM to 5:45 PM 0 129 665 325 0 0 1252 1534 0 96 0 261 0 0 0 0 4262
5:00 PM to 6:00 PM 0 123 680 314 0 0 1277 1556 0 96 0 276 0 0 0 0 4322
5:00 PM to 6:00 PM NBU NBL NBT NBR SBU SBL SBT SBR EBU EBL EBT EBR WBU WBL WBT WBR TOTAL
0 123 680 314 0 0 1277 1556 0 96 0 276 0 0 0 0 4322
0.00 0.79 0.85 0.80 0.00 0.00 0.94 0.91 0.00 0.92 0.00 0.90 0.00 0.00 0.00 0.00 OVERALL
0.960.91 0.00
TEL: (510) 232 - 1271 FAX: (510) 232 - 1272
VOLUME
PHF BY MOVEMENT
PHF BY APPROACH 0.87 0.94
P E A K H O U R S U M M A R Y
B . A . Y . M . E . T . R . I . C . S .I N T E R S E C T I O N T U R N I N G M O V E M E N T S U M M A R Y
10/22/2014
4:00 PM 6:00 PM
ARRIVAL / DEPARTURE VOLUMES & APPROACH PHF
4322
TIME PERIOD
S U R V E Y D A T A
T O T A L B Y P E R I O D
H O U R L Y T O T A L S

PROJECT: SOUTH BAY SALT PONDS PROJECT (26818347) SURVEY DATE: DAY: WEDNESDAY
N-S APPROACH: SAN ANTONIO ROAD SURVEY TIME: TO
E-W APPROACH: US-101 NB OFF-RAMP JURISDICTION: MOUNTAIN VIEW FILE: 3410127-1AM
PEAK HOUR
8:00 AM to 9:00 AM NORTH
43 213 0 0
PHF = 0.78
US-101 NB OFF-RAMP 256 897
0 355 PHF =
0.90
0 0
43 900
0 545
0 775
0 0
PHF =
US-101 NB ON-RAMP 0.00
* to US-101 NB ON-RAMP 758 1317
0 0 542 775
SAN ANTONIO ROAD PHF = 0.91
NORTHBOUND SOUTHBOUND EASTBOUND WESTBOUND TOTAL
From To U-TURN LEFT THRU RIGHT U-TURN LEFT THRU RIGHT U-TURN LEFT THRU RIGHT U-TURN LEFT THRU RIGHT
7:00 AM to 7:15 AM 58 93 22 4 105 32 314
7:15 AM to 7:30 AM 118 237 46 11 224 71 707
7:30 AM to 7:45 AM 187 393 80 14 326 111 1111
7:45 AM to 8:00 AM 286 566 124 19 484 172 1651
8:00 AM to 8:15 AM 397 765 162 29 642 254 2249
8:15 AM to 8:30 AM 507 953 227 41 779 317 2824
8:30 AM to 8:45 AM 656 1151 263 54 899 407 3430
8:45 AM to 9:00 AM 828 1341 337 62 1029 527 4124
7:00 AM to 7:15 AM 0 0 58 93 0 0 22 4 0 0 0 0 0 105 0 32 314
7:15 AM to 7:30 AM 0 0 60 144 0 0 24 7 0 0 0 0 0 119 0 39 393
7:30 AM to 7:45 AM 0 0 69 156 0 0 34 3 0 0 0 0 0 102 0 40 404
7:45 AM to 8:00 AM 0 0 99 173 0 0 44 5 0 0 0 0 0 158 0 61 540
8:00 AM to 8:15 AM 0 0 111 199 0 0 38 10 0 0 0 0 0 158 0 82 598
8:15 AM to 8:30 AM 0 0 110 188 0 0 65 12 0 0 0 0 0 137 0 63 575
8:30 AM to 8:45 AM 0 0 149 198 0 0 36 13 0 0 0 0 0 120 0 90 606
8:45 AM to 9:00 AM 0 0 172 190 0 0 74 8 0 0 0 0 0 130 0 120 694
7:00 AM to 8:00 AM 0 0 286 566 0 0 124 19 0 0 0 0 0 484 0 172 1651
7:15 AM to 8:15 AM 0 0 339 672 0 0 140 25 0 0 0 0 0 537 0 222 1935
7:30 AM to 8:30 AM 0 0 389 716 0 0 181 30 0 0 0 0 0 555 0 246 2117
7:45 AM to 8:45 AM 0 0 469 758 0 0 183 40 0 0 0 0 0 573 0 296 2319
8:00 AM to 9:00 AM 0 0 542 775 0 0 213 43 0 0 0 0 0 545 0 355 2473
8:00 AM to 9:00 AM NBU NBL NBT NBR SBU SBL SBT SBR EBU EBL EBT EBR WBU WBL WBT WBR TOTAL
0 0 542 775 0 0 213 43 0 0 0 0 0 545 0 355 2473
0.00 0.00 0.79 0.97 0.00 0.00 0.72 0.83 0.00 0.00 0.00 0.00 0.00 0.86 0.00 0.74 OVERALL
0.89
TEL: (510) 232 - 1271 FAX: (510) 232 - 1272
9:00 AM
TIME PERIOD
ARRIVAL / DEPARTURE VOLUMES & APPROACH PHF
P E A K H O U R S U M M A R Y
VOLUME
S U R V E Y D A T A
T O T A L B Y P E R I O D
H O U R L Y T O T A L S
PHF BY MOVEMENT
PHF BY APPROACH 0.91 0.78 0.900.00
B . A . Y . M . E . T . R . I . C . S .I N T E R S E C T I O N T U R N I N G M O V E M E N T S U M M A R Y
10/22/2014
7:00 AM
2473

PROJECT: SOUTH BAY SALT PONDS PROJECT (26818347) SURVEY DATE: DAY: WEDNESDAY
N-S APPROACH: SAN ANTONIO ROAD SURVEY TIME: TO
E-W APPROACH: US-101 NB OFF-RAMP JURISDICTION: MOUNTAIN VIEW FILE: 3410127-1PM
PEAK HOUR
5:00 PM to 6:00 PM NORTH
331 704 0 0
PHF = 0.89
US-101 NB OFF-RAMP 1035 486
0 160 PHF =
0.89
0 0
331 461
0 301
0 738
0 0
PHF =
US-101 NB ON-RAMP 0.00
* to US-101 NB ON-RAMP 1005 1064
0 0 326 738
SAN ANTONIO ROAD PHF = 0.90
NORTHBOUND SOUTHBOUND EASTBOUND WESTBOUND TOTAL
From To U-TURN LEFT THRU RIGHT U-TURN LEFT THRU RIGHT U-TURN LEFT THRU RIGHT U-TURN LEFT THRU RIGHT
4:00 PM to 4:15 PM 69 253 113 71 62 27 595
4:15 PM to 4:30 PM 145 456 236 141 129 64 1171
4:30 PM to 4:45 PM 216 661 374 191 182 98 1722
4:45 PM to 5:00 PM 293 846 510 248 258 134 2289
5:00 PM to 5:15 PM 382 1050 716 315 340 172 2975
5:15 PM to 5:30 PM 449 1252 867 370 405 207 3550
5:30 PM to 5:45 PM 550 1446 1067 460 485 256 4264
5:45 PM to 6:00 PM 619 1584 1214 579 559 294 4849
4:00 PM to 4:15 PM 0 0 69 253 0 0 113 71 0 0 0 0 0 62 0 27 595
4:15 PM to 4:30 PM 0 0 76 203 0 0 123 70 0 0 0 0 0 67 0 37 576
4:30 PM to 4:45 PM 0 0 71 205 0 0 138 50 0 0 0 0 0 53 0 34 551
4:45 PM to 5:00 PM 0 0 77 185 0 0 136 57 0 0 0 0 0 76 0 36 567
5:00 PM to 5:15 PM 0 0 89 204 0 0 206 67 0 0 0 0 0 82 0 38 686
5:15 PM to 5:30 PM 0 0 67 202 0 0 151 55 0 0 0 0 0 65 0 35 575
5:30 PM to 5:45 PM 0 0 101 194 0 0 200 90 0 0 0 0 0 80 0 49 714
5:45 PM to 6:00 PM 0 0 69 138 0 0 147 119 0 0 0 0 0 74 0 38 585
4:00 PM to 5:00 PM 0 0 293 846 0 0 510 248 0 0 0 0 0 258 0 134 2289
4:15 PM to 5:15 PM 0 0 313 797 0 0 603 244 0 0 0 0 0 278 0 145 2380
4:30 PM to 5:30 PM 0 0 304 796 0 0 631 229 0 0 0 0 0 276 0 143 2379
4:45 PM to 5:45 PM 0 0 334 785 0 0 693 269 0 0 0 0 0 303 0 158 2542
5:00 PM to 6:00 PM 0 0 326 738 0 0 704 331 0 0 0 0 0 301 0 160 2560
5:00 PM to 6:00 PM NBU NBL NBT NBR SBU SBL SBT SBR EBU EBL EBT EBR WBU WBL WBT WBR TOTAL
0 0 326 738 0 0 704 331 0 0 0 0 0 301 0 160 2560
0.00 0.00 0.81 0.90 0.00 0.00 0.85 0.70 0.00 0.00 0.00 0.00 0.00 0.92 0.00 0.82 OVERALL
0.90
P E A K H O U R S U M M A R Y
B . A . Y . M . E . T . R . I . C . S .I N T E R S E C T I O N T U R N I N G M O V E M E N T S U M M A R Y
10/22/2014
4:00 PM 6:00 PM
ARRIVAL / DEPARTURE VOLUMES & APPROACH PHF
2560
TIME PERIOD
S U R V E Y D A T A
T O T A L B Y P E R I O D
H O U R L Y T O T A L S
0.00 0.89
TEL: (510) 232 - 1271 FAX: (510) 232 - 1272
VOLUME
PHF BY MOVEMENT
PHF BY APPROACH 0.90 0.89
PROJECT: SOUTH BAY SALT PONDS PROJECT (26818347) SURVEY DATE: DAY: WEDNESDAY
N-S APPROACH: MARSH ROAD SURVEY TIME: TO
E-W APPROACH: US-101 NB OFF-RAMP JURISDICTION: MENLO PARK FILE: 3410127-6AM
PEAK HOUR
7:45 AM to 8:45 AM * NORTH
1746 1138 0 0
PHF = 0.89
US-101 NB OFF-RAMP 2884 1761
0 304 PHF =
0.90
0 0
1746 1160
0 856
0 434
0 0
PHF =
US-101 NB ON-RAMP 0.00
* 1994 1891
0 0 1457 434 * to NB On-Ramp
MARSH ROAD PHF = 0.98
NORTHBOUND SOUTHBOUND EASTBOUND WESTBOUND TOTAL
From To U-TURN LEFT THRU RIGHT U-TURN LEFT THRU RIGHT U-TURN LEFT THRU RIGHT U-TURN LEFT THRU RIGHT
7:00 AM to 7:15 AM 211 130 262 474 172 68 1317
7:15 AM to 7:30 AM 534 217 495 900 382 124 2652
7:30 AM to 7:45 AM 816 366 811 1378 591 188 4150
7:45 AM to 8:00 AM 1158 475 1159 1837 851 249 5729
8:00 AM to 8:15 AM 1534 578 1421 2217 1058 318 7126
8:15 AM to 8:30 AM 1900 693 1662 2657 1243 401 8556
8:30 AM to 8:45 AM 2273 800 1949 3124 1447 492 10085
8:45 AM to 9:00 AM 2644 938 2139 3579 1606 575 11481
7:00 AM to 7:15 AM 0 0 211 130 0 0 262 474 0 0 0 0 0 172 0 68 1317
7:15 AM to 7:30 AM 0 0 323 87 0 0 233 426 0 0 0 0 0 210 0 56 1335
7:30 AM to 7:45 AM 0 0 282 149 0 0 316 478 0 0 0 0 0 209 0 64 1498
7:45 AM to 8:00 AM 0 0 342 109 0 0 348 459 0 0 0 0 0 260 0 61 1579
8:00 AM to 8:15 AM 0 0 376 103 0 0 262 380 0 0 0 0 0 207 0 69 1397
8:15 AM to 8:30 AM 0 0 366 115 0 0 241 440 0 0 0 0 0 185 0 83 1430
8:30 AM to 8:45 AM 0 0 373 107 0 0 287 467 0 0 0 0 0 204 0 91 1529
8:45 AM to 9:00 AM 0 0 371 138 0 0 190 455 0 0 0 0 0 159 0 83 1396
7:00 AM to 8:00 AM 0 0 1158 475 0 0 1159 1837 0 0 0 0 0 851 0 249 5729
7:15 AM to 8:15 AM 0 0 1323 448 0 0 1159 1743 0 0 0 0 0 886 0 250 5809
7:30 AM to 8:30 AM 0 0 1366 476 0 0 1167 1757 0 0 0 0 0 861 0 277 5904
7:45 AM to 8:45 AM 0 0 1457 434 0 0 1138 1746 0 0 0 0 0 856 0 304 5935
8:00 AM to 9:00 AM 0 0 1486 463 0 0 980 1742 0 0 0 0 0 755 0 326 5752
7:45 AM to 8:45 AM NBU NBL NBT NBR SBU SBL SBT SBR EBU EBL EBT EBR WBU WBL WBT WBR TOTAL
0 0 1457 434 0 0 1138 1746 0 0 0 0 0 856 0 304 5935
0.00 0.00 0.97 0.94 0.00 0.00 0.82 0.93 0.00 0.00 0.00 0.00 0.00 0.82 0.00 0.84 OVERALL
0.94
B . A . Y . M . E . T . R . I . C . S .I N T E R S E C T I O N T U R N I N G M O V E M E N T S U M M A R Y
10/22/2014
7:00 AM
5935
TEL: (510) 232 - 1271 FAX: (510) 232 - 1272
9:00 AM
TIME PERIOD
ARRIVAL / DEPARTURE VOLUMES & APPROACH PHF
P E A K H O U R S U M M A R Y
VOLUME
S U R V E Y D A T A
T O T A L B Y P E R I O D
H O U R L Y T O T A L S
PHF BY MOVEMENT
PHF BY APPROACH 0.98 0.89 0.900.00
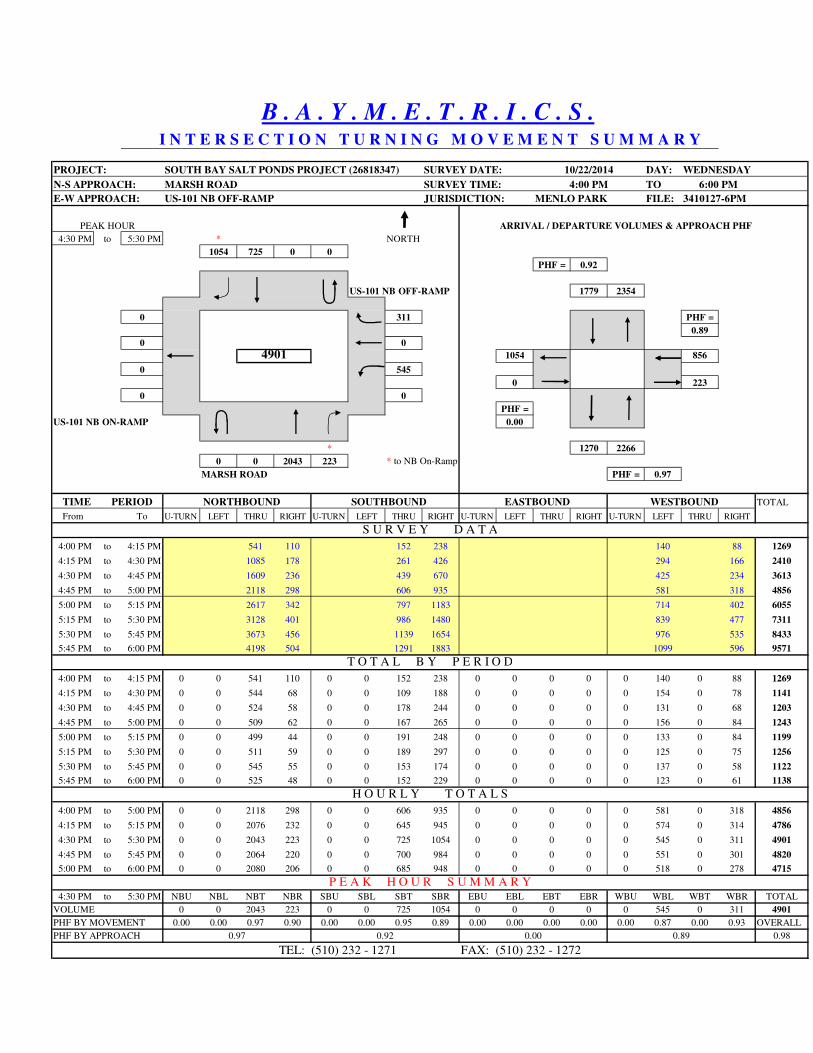
PROJECT: SOUTH BAY SALT PONDS PROJECT (26818347) SURVEY DATE: DAY: WEDNESDAY
N-S APPROACH: MARSH ROAD SURVEY TIME: TO
E-W APPROACH: US-101 NB OFF-RAMP JURISDICTION: MENLO PARK FILE: 3410127-6PM
PEAK HOUR
4:30 PM to 5:30 PM * NORTH
1054 725 0 0
PHF = 0.92
US-101 NB OFF-RAMP 1779 2354
0 311 PHF =
0.89
0 0
1054 856
0 545
0 223
0 0
PHF =
US-101 NB ON-RAMP 0.00
* 1270 2266
0 0 2043 223 * to NB On-Ramp
MARSH ROAD PHF = 0.97
NORTHBOUND SOUTHBOUND EASTBOUND WESTBOUND TOTAL
From To U-TURN LEFT THRU RIGHT U-TURN LEFT THRU RIGHT U-TURN LEFT THRU RIGHT U-TURN LEFT THRU RIGHT
4:00 PM to 4:15 PM 541 110 152 238 140 88 1269
4:15 PM to 4:30 PM 1085 178 261 426 294 166 2410
4:30 PM to 4:45 PM 1609 236 439 670 425 234 3613
4:45 PM to 5:00 PM 2118 298 606 935 581 318 4856
5:00 PM to 5:15 PM 2617 342 797 1183 714 402 6055
5:15 PM to 5:30 PM 3128 401 986 1480 839 477 7311
5:30 PM to 5:45 PM 3673 456 1139 1654 976 535 8433
5:45 PM to 6:00 PM 4198 504 1291 1883 1099 596 9571
4:00 PM to 4:15 PM 0 0 541 110 0 0 152 238 0 0 0 0 0 140 0 88 1269
4:15 PM to 4:30 PM 0 0 544 68 0 0 109 188 0 0 0 0 0 154 0 78 1141
4:30 PM to 4:45 PM 0 0 524 58 0 0 178 244 0 0 0 0 0 131 0 68 1203
4:45 PM to 5:00 PM 0 0 509 62 0 0 167 265 0 0 0 0 0 156 0 84 1243
5:00 PM to 5:15 PM 0 0 499 44 0 0 191 248 0 0 0 0 0 133 0 84 1199
5:15 PM to 5:30 PM 0 0 511 59 0 0 189 297 0 0 0 0 0 125 0 75 1256
5:30 PM to 5:45 PM 0 0 545 55 0 0 153 174 0 0 0 0 0 137 0 58 1122
5:45 PM to 6:00 PM 0 0 525 48 0 0 152 229 0 0 0 0 0 123 0 61 1138
4:00 PM to 5:00 PM 0 0 2118 298 0 0 606 935 0 0 0 0 0 581 0 318 4856
4:15 PM to 5:15 PM 0 0 2076 232 0 0 645 945 0 0 0 0 0 574 0 314 4786
4:30 PM to 5:30 PM 0 0 2043 223 0 0 725 1054 0 0 0 0 0 545 0 311 4901
4:45 PM to 5:45 PM 0 0 2064 220 0 0 700 984 0 0 0 0 0 551 0 301 4820
5:00 PM to 6:00 PM 0 0 2080 206 0 0 685 948 0 0 0 0 0 518 0 278 4715
4:30 PM to 5:30 PM NBU NBL NBT NBR SBU SBL SBT SBR EBU EBL EBT EBR WBU WBL WBT WBR TOTAL
0 0 2043 223 0 0 725 1054 0 0 0 0 0 545 0 311 4901
0.00 0.00 0.97 0.90 0.00 0.00 0.95 0.89 0.00 0.00 0.00 0.00 0.00 0.87 0.00 0.93 OVERALL
0.980.00 0.89
TEL: (510) 232 - 1271 FAX: (510) 232 - 1272
VOLUME
PHF BY MOVEMENT
PHF BY APPROACH 0.97 0.92
P E A K H O U R S U M M A R Y
B . A . Y . M . E . T . R . I . C . S .I N T E R S E C T I O N T U R N I N G M O V E M E N T S U M M A R Y
10/22/2014
4:00 PM 6:00 PM
ARRIVAL / DEPARTURE VOLUMES & APPROACH PHF
4901
TIME PERIOD
S U R V E Y D A T A
T O T A L B Y P E R I O D
H O U R L Y T O T A L S
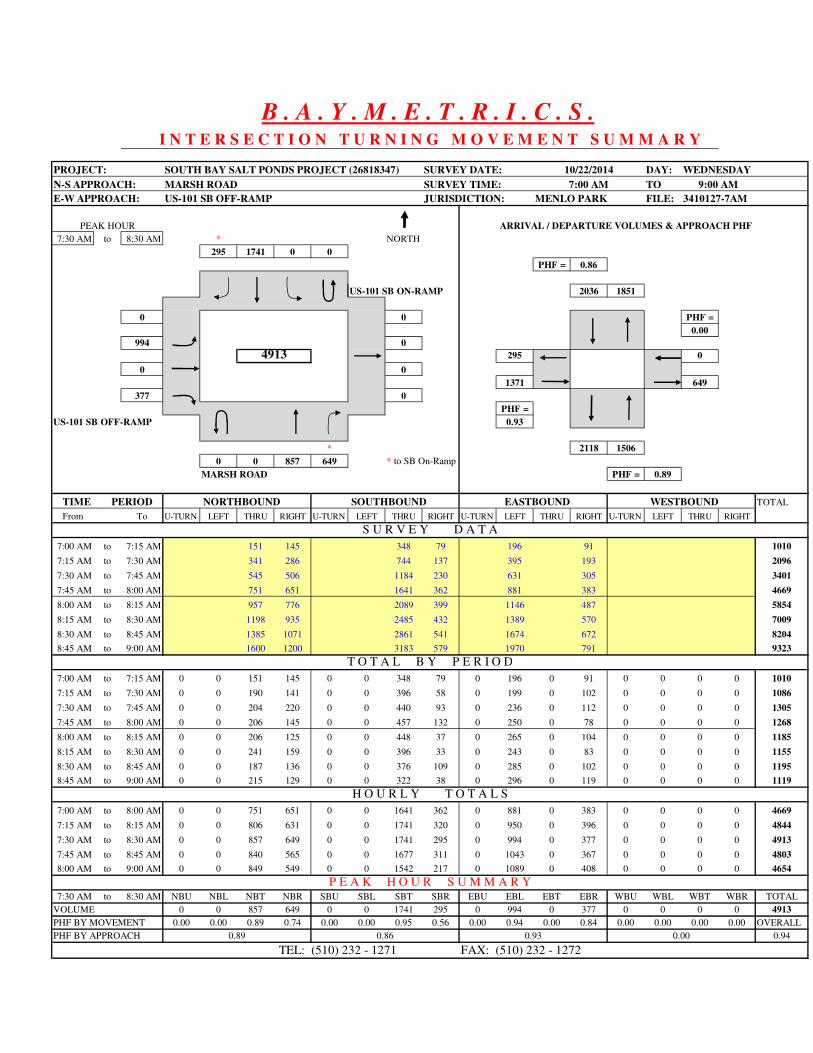
PROJECT: SOUTH BAY SALT PONDS PROJECT (26818347) SURVEY DATE: DAY: WEDNESDAY
N-S APPROACH: MARSH ROAD SURVEY TIME: TO
E-W APPROACH: US-101 SB OFF-RAMP JURISDICTION: MENLO PARK FILE: 3410127-7AM
PEAK HOUR
7:30 AM to 8:30 AM * NORTH
295 1741 0 0
PHF = 0.86
US-101 SB ON-RAMP 2036 1851
0 0 PHF =
0.00
994 0
295 0
0 0
1371 649
377 0
PHF =
US-101 SB OFF-RAMP 0.93
* 2118 1506
0 0 857 649 * to SB On-Ramp
MARSH ROAD PHF = 0.89
NORTHBOUND SOUTHBOUND EASTBOUND WESTBOUND TOTAL
From To U-TURN LEFT THRU RIGHT U-TURN LEFT THRU RIGHT U-TURN LEFT THRU RIGHT U-TURN LEFT THRU RIGHT
7:00 AM to 7:15 AM 151 145 348 79 196 91 1010
7:15 AM to 7:30 AM 341 286 744 137 395 193 2096
7:30 AM to 7:45 AM 545 506 1184 230 631 305 3401
7:45 AM to 8:00 AM 751 651 1641 362 881 383 4669
8:00 AM to 8:15 AM 957 776 2089 399 1146 487 5854
8:15 AM to 8:30 AM 1198 935 2485 432 1389 570 7009
8:30 AM to 8:45 AM 1385 1071 2861 541 1674 672 8204
8:45 AM to 9:00 AM 1600 1200 3183 579 1970 791 9323
7:00 AM to 7:15 AM 0 0 151 145 0 0 348 79 0 196 0 91 0 0 0 0 1010
7:15 AM to 7:30 AM 0 0 190 141 0 0 396 58 0 199 0 102 0 0 0 0 1086
7:30 AM to 7:45 AM 0 0 204 220 0 0 440 93 0 236 0 112 0 0 0 0 1305
7:45 AM to 8:00 AM 0 0 206 145 0 0 457 132 0 250 0 78 0 0 0 0 1268
8:00 AM to 8:15 AM 0 0 206 125 0 0 448 37 0 265 0 104 0 0 0 0 1185
8:15 AM to 8:30 AM 0 0 241 159 0 0 396 33 0 243 0 83 0 0 0 0 1155
8:30 AM to 8:45 AM 0 0 187 136 0 0 376 109 0 285 0 102 0 0 0 0 1195
8:45 AM to 9:00 AM 0 0 215 129 0 0 322 38 0 296 0 119 0 0 0 0 1119
7:00 AM to 8:00 AM 0 0 751 651 0 0 1641 362 0 881 0 383 0 0 0 0 4669
7:15 AM to 8:15 AM 0 0 806 631 0 0 1741 320 0 950 0 396 0 0 0 0 4844
7:30 AM to 8:30 AM 0 0 857 649 0 0 1741 295 0 994 0 377 0 0 0 0 4913
7:45 AM to 8:45 AM 0 0 840 565 0 0 1677 311 0 1043 0 367 0 0 0 0 4803
8:00 AM to 9:00 AM 0 0 849 549 0 0 1542 217 0 1089 0 408 0 0 0 0 4654
7:30 AM to 8:30 AM NBU NBL NBT NBR SBU SBL SBT SBR EBU EBL EBT EBR WBU WBL WBT WBR TOTAL
0 0 857 649 0 0 1741 295 0 994 0 377 0 0 0 0 4913
0.00 0.00 0.89 0.74 0.00 0.00 0.95 0.56 0.00 0.94 0.00 0.84 0.00 0.00 0.00 0.00 OVERALL
0.94
TEL: (510) 232 - 1271 FAX: (510) 232 - 1272
9:00 AM
TIME PERIOD
ARRIVAL / DEPARTURE VOLUMES & APPROACH PHF
P E A K H O U R S U M M A R Y
VOLUME
S U R V E Y D A T A
T O T A L B Y P E R I O D
H O U R L Y T O T A L S
PHF BY MOVEMENT
PHF BY APPROACH 0.89 0.86 0.000.93
B . A . Y . M . E . T . R . I . C . S .I N T E R S E C T I O N T U R N I N G M O V E M E N T S U M M A R Y
10/22/2014
7:00 AM
4913
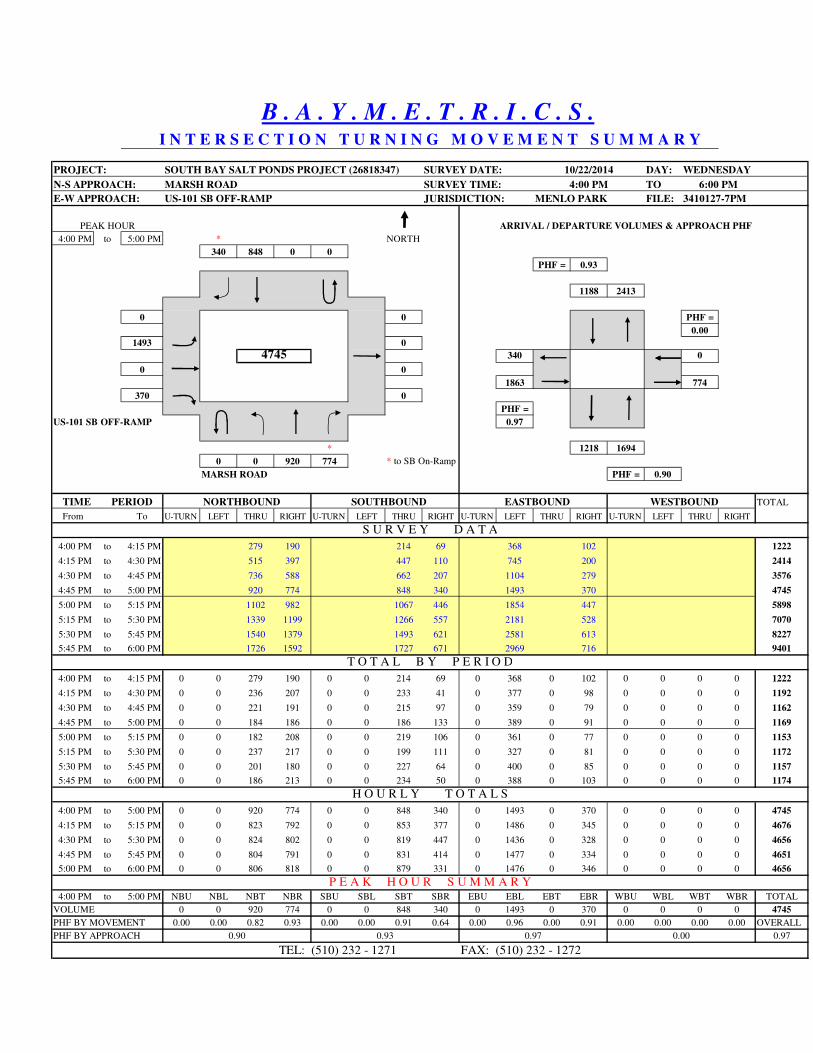
PROJECT: SOUTH BAY SALT PONDS PROJECT (26818347) SURVEY DATE: DAY: WEDNESDAY
N-S APPROACH: MARSH ROAD SURVEY TIME: TO
E-W APPROACH: US-101 SB OFF-RAMP JURISDICTION: MENLO PARK FILE: 3410127-7PM
PEAK HOUR
4:00 PM to 5:00 PM * NORTH
340 848 0 0
PHF = 0.93
1188 2413
0 0 PHF =
0.00
1493 0
340 0
0 0
1863 774
370 0
PHF =
US-101 SB OFF-RAMP 0.97
* 1218 1694
0 0 920 774 * to SB On-Ramp
MARSH ROAD PHF = 0.90
NORTHBOUND SOUTHBOUND EASTBOUND WESTBOUND TOTAL
From To U-TURN LEFT THRU RIGHT U-TURN LEFT THRU RIGHT U-TURN LEFT THRU RIGHT U-TURN LEFT THRU RIGHT
4:00 PM to 4:15 PM 279 190 214 69 368 102 1222
4:15 PM to 4:30 PM 515 397 447 110 745 200 2414
4:30 PM to 4:45 PM 736 588 662 207 1104 279 3576
4:45 PM to 5:00 PM 920 774 848 340 1493 370 4745
5:00 PM to 5:15 PM 1102 982 1067 446 1854 447 5898
5:15 PM to 5:30 PM 1339 1199 1266 557 2181 528 7070
5:30 PM to 5:45 PM 1540 1379 1493 621 2581 613 8227
5:45 PM to 6:00 PM 1726 1592 1727 671 2969 716 9401
4:00 PM to 4:15 PM 0 0 279 190 0 0 214 69 0 368 0 102 0 0 0 0 1222
4:15 PM to 4:30 PM 0 0 236 207 0 0 233 41 0 377 0 98 0 0 0 0 1192
4:30 PM to 4:45 PM 0 0 221 191 0 0 215 97 0 359 0 79 0 0 0 0 1162
4:45 PM to 5:00 PM 0 0 184 186 0 0 186 133 0 389 0 91 0 0 0 0 1169
5:00 PM to 5:15 PM 0 0 182 208 0 0 219 106 0 361 0 77 0 0 0 0 1153
5:15 PM to 5:30 PM 0 0 237 217 0 0 199 111 0 327 0 81 0 0 0 0 1172
5:30 PM to 5:45 PM 0 0 201 180 0 0 227 64 0 400 0 85 0 0 0 0 1157
5:45 PM to 6:00 PM 0 0 186 213 0 0 234 50 0 388 0 103 0 0 0 0 1174
4:00 PM to 5:00 PM 0 0 920 774 0 0 848 340 0 1493 0 370 0 0 0 0 4745
4:15 PM to 5:15 PM 0 0 823 792 0 0 853 377 0 1486 0 345 0 0 0 0 4676
4:30 PM to 5:30 PM 0 0 824 802 0 0 819 447 0 1436 0 328 0 0 0 0 4656
4:45 PM to 5:45 PM 0 0 804 791 0 0 831 414 0 1477 0 334 0 0 0 0 4651
5:00 PM to 6:00 PM 0 0 806 818 0 0 879 331 0 1476 0 346 0 0 0 0 4656
4:00 PM to 5:00 PM NBU NBL NBT NBR SBU SBL SBT SBR EBU EBL EBT EBR WBU WBL WBT WBR TOTAL
0 0 920 774 0 0 848 340 0 1493 0 370 0 0 0 0 4745
0.00 0.00 0.82 0.93 0.00 0.00 0.91 0.64 0.00 0.96 0.00 0.91 0.00 0.00 0.00 0.00 OVERALL
0.97
P E A K H O U R S U M M A R Y
B . A . Y . M . E . T . R . I . C . S .I N T E R S E C T I O N T U R N I N G M O V E M E N T S U M M A R Y
10/22/2014
4:00 PM 6:00 PM
ARRIVAL / DEPARTURE VOLUMES & APPROACH PHF
4745
TIME PERIOD
S U R V E Y D A T A
T O T A L B Y P E R I O D
H O U R L Y T O T A L S
0.97 0.00
TEL: (510) 232 - 1271 FAX: (510) 232 - 1272
VOLUME
PHF BY MOVEMENT
PHF BY APPROACH 0.90 0.93

Traffic Impact Study for South Bay Salt Pond Restoration - Phase 2 Project
ii
APPENDIX B
LEVEL OF SERVICE CALCULATION SHEETS

HCM Signalized Intersection Capacity Analysis
1: SR 237 WB Ramps & Great America Parkway 11/19/2014
Existing Conditions_AM Synchro 7 - Report
Page 1
Movement EBL EBT EBR WBL WBT WBR NBL NBT NBR SBL SBT SBR
Lane Configurations
Volume (vph) 0 0 0 829 21 182 161 236 0 0 58 413
Ideal Flow (vphpl) 1900 1900 1900 1900 1900 1900 1900 1900 1900 1900 1900 1900
Total Lost time (s) 4.5 4.5 4.5 3.5 5.0 3.2
Lane Util. Factor 0.95 0.95 1.00 0.97 0.95 0.95
Frt 1.00 1.00 0.85 1.00 1.00 0.86
Flt Protected 0.95 0.95 1.00 0.95 1.00 1.00
Satd. Flow (prot) 1681 1690 1583 3433 3539 3057
Flt Permitted 0.95 0.95 1.00 0.95 1.00 1.00
Satd. Flow (perm) 1681 1690 1583 3433 3539 3057
Peak-hour factor, PHF 0.92 0.92 0.92 0.87 0.75 0.84 0.80 0.78 0.92 0.92 0.91 0.65
Adj. Flow (vph) 0 0 0 953 28 217 201 303 0 0 64 635
RTOR Reduction (vph) 0 0 0 0 0 111 0 0 0 0 547 0
Lane Group Flow (vph) 0 0 0 486 495 106 201 303 0 0 152 0
Turn Type Split NA Prot Prot NA NA
Protected Phases 4 4 4 5 2 6
Permitted Phases
Actuated Green, G (s) 26.5 26.5 26.5 9.0 18.2 7.5
Effective Green, g (s) 26.5 26.5 26.5 9.0 18.2 7.5
Actuated g/C Ratio 0.49 0.49 0.49 0.17 0.34 0.14
Clearance Time (s) 4.5 4.5 4.5 3.5 5.0 3.2
Vehicle Extension (s) 2.0 2.0 2.0 2.0 2.0 2.0
Lane Grp Cap (vph) 821 826 773 570 1188 423
v/s Ratio Prot 0.29 c0.29 0.07 c0.06 0.09 c0.05
v/s Ratio Perm
v/c Ratio 0.59 0.60 0.14 0.35 0.26 0.36
Uniform Delay, d1 10.0 10.0 7.6 20.0 13.1 21.2
Progression Factor 1.00 1.00 1.00 1.00 1.00 1.00
Incremental Delay, d2 0.8 0.8 0.0 0.1 0.0 0.2
Delay (s) 10.7 10.8 7.6 20.2 13.1 21.4
Level of Service B B A C B C
Approach Delay (s) 0.0 10.2 15.9 21.4
Approach LOS A B B C
Intersection Summary
HCM 2000 Control Delay 14.6 HCM 2000 Level of Service B
HCM 2000 Volume to Capacity ratio 0.51
Actuated Cycle Length (s) 54.2 Sum of lost time (s) 11.2
Intersection Capacity Utilization 79.4% ICU Level of Service D
Analysis Period (min) 15
c Critical Lane Group

HCM Signalized Intersection Capacity Analysis
2: Great America Parkway & SR 237 EB Ramps 11/19/2014
Existing Conditions_AM Synchro 7 - Report
Page 2
Movement EBL EBT EBR WBL WBT WBR NBL NBT NBR SBL SBT SBR
Lane Configurations
Volume (vph) 162 2 435 0 0 0 0 223 336 22 857 0
Ideal Flow (vphpl) 1900 1900 1900 1900 1900 1900 1900 1900 1900 1900 1900 1900
Total Lost time (s) 4.0 4.0 4.0 4.0 3.5 4.0
Lane Util. Factor 1.00 1.00 0.86 0.86 1.00 0.95
Frt 1.00 0.85 0.94 0.85 1.00 1.00
Flt Protected 0.95 1.00 1.00 1.00 0.95 1.00
Satd. Flow (prot) 1778 1583 4501 1362 1770 3539
Flt Permitted 0.95 1.00 1.00 1.00 0.95 1.00
Satd. Flow (perm) 1778 1583 4501 1362 1770 3539
Peak-hour factor, PHF 0.90 0.25 0.95 0.92 0.92 0.92 0.92 0.80 0.82 0.88 0.89 0.92
Adj. Flow (vph) 180 8 458 0 0 0 0 279 410 25 963 0
RTOR Reduction (vph) 0 0 94 0 0 0 0 122 124 0 0 0
Lane Group Flow (vph) 0 188 364 0 0 0 0 362 81 25 963 0
Turn Type Split NA Prot NA Perm Prot NA
Protected Phases 4 4 4 2 1 6
Permitted Phases 2
Actuated Green, G (s) 18.2 18.2 20.9 20.9 2.0 26.4
Effective Green, g (s) 18.2 18.2 20.9 20.9 2.0 26.4
Actuated g/C Ratio 0.35 0.35 0.40 0.40 0.04 0.50
Clearance Time (s) 4.0 4.0 4.0 4.0 3.5 4.0
Vehicle Extension (s) 2.0 2.0 4.0 4.0 2.0 4.0
Lane Grp Cap (vph) 615 547 1788 541 67 1776
v/s Ratio Prot 0.11 c0.23 0.08 0.01 c0.27
v/s Ratio Perm 0.06
v/c Ratio 0.31 0.67 0.20 0.15 0.37 0.54
Uniform Delay, d1 12.6 14.6 10.4 10.2 24.7 9.0
Progression Factor 1.00 1.00 1.00 1.00 1.00 1.00
Incremental Delay, d2 0.1 2.4 0.1 0.2 1.3 0.4
Delay (s) 12.7 17.0 10.5 10.3 26.0 9.4
Level of Service B B B B C A
Approach Delay (s) 15.7 0.0 10.4 9.8
Approach LOS B A B A
Intersection Summary
HCM 2000 Control Delay 11.6 HCM 2000 Level of Service B
HCM 2000 Volume to Capacity ratio 0.64
Actuated Cycle Length (s) 52.6 Sum of lost time (s) 11.5
Intersection Capacity Utilization 79.4% ICU Level of Service D
Analysis Period (min) 15
c Critical Lane Group

HCM Signalized Intersection Capacity Analysis
3: N Shoreline Boulevard & 101 NB Off Ramp & La Avenida Street 11/19/2014
Existing Conditions_AM Synchro 7 - Report
Page 3
Movement WBL2 WBL WBR NBT SBT NWL2 NWL NWR
Lane Configurations
Volume (vph) 108 30 13 1181 325 530 5 1213
Ideal Flow (vphpl) 1900 1900 1900 1900 1900 1900 1900 1900
Total Lost time (s) 3.5 3.5 3.5 6.2 5.0 3.5 3.5 3.5
Lane Util. Factor 0.95 0.95 1.00 0.95 0.91 0.95 0.95 0.88
Frt 1.00 1.00 0.85 1.00 1.00 1.00 1.00 0.85
Flt Protected 0.95 0.95 1.00 1.00 1.00 0.95 0.95 1.00
Satd. Flow (prot) 1681 1681 1583 3539 5085 1681 1681 2787
Flt Permitted 0.95 0.95 1.00 1.00 1.00 0.95 0.95 1.00
Satd. Flow (perm) 1681 1681 1583 3539 5085 1681 1681 2787
Peak-hour factor, PHF 0.69 0.68 0.65 0.93 0.89 0.87 0.31 0.84
Adj. Flow (vph) 157 44 20 1270 365 609 16 1444
RTOR Reduction (vph) 0 0 18 0 0 0 0 0
Lane Group Flow (vph) 100 101 2 1270 365 311 314 1444
Turn Type Prot Prot Prot NA NA Prot Prot Prot
Protected Phases 7 7 7 2 6 8 8 8
Permitted Phases
Actuated Green, G (s) 11.8 11.8 11.8 51.8 53.0 63.2 63.2 63.2
Effective Green, g (s) 11.8 11.8 11.8 51.8 53.0 63.2 63.2 63.2
Actuated g/C Ratio 0.08 0.08 0.08 0.37 0.38 0.45 0.45 0.45
Clearance Time (s) 3.5 3.5 3.5 6.2 5.0 3.5 3.5 3.5
Vehicle Extension (s) 1.5 1.5 1.5 1.5 1.5 1.5 1.5 1.5
Lane Grp Cap (vph) 141 141 133 1309 1925 758 758 1258
v/s Ratio Prot 0.06 c0.06 0.00 c0.36 0.07 0.18 0.19 c0.52
v/s Ratio Perm
v/c Ratio 0.71 0.72 0.01 0.97 0.19 0.41 0.41 1.15
Uniform Delay, d1 62.4 62.5 58.8 43.3 29.1 25.9 25.9 38.4
Progression Factor 1.00 1.00 1.00 1.00 1.00 1.00 1.00 1.00
Incremental Delay, d2 12.5 13.4 0.0 18.7 0.2 0.1 0.1 76.2
Delay (s) 74.9 75.9 58.8 62.0 29.3 26.0 26.0 114.6
Level of Service E E E E C C C F
Approach Delay (s) 73.9 62.0 29.3 87.9
Approach LOS E E C F
Intersection Summary
HCM 2000 Control Delay 73.3 HCM 2000 Level of Service E
HCM 2000 Volume to Capacity ratio 1.03
Actuated Cycle Length (s) 140.0 Sum of lost time (s) 13.2
Intersection Capacity Utilization 91.9% ICU Level of Service F
Analysis Period (min) 15
c Critical Lane Group

HCM Signalized Intersection Capacity Analysis
4: 101 SB Ramps & N Shoreline Boulevard 11/19/2014
Existing Conditions_AM Synchro 7 - Report
Page 4
Movement EBL EBR NBL NBT SBT SBR
Lane Configurations
Volume (vph) 299 372 53 1223 653 0
Ideal Flow (vphpl) 1900 1900 1900 1900 1900 1900
Total Lost time (s) 3.5 3.5 3.0 4.0 4.0
Lane Util. Factor 0.97 0.88 1.00 0.91 0.95
Frt 1.00 0.85 1.00 1.00 1.00
Flt Protected 0.95 1.00 0.95 1.00 1.00
Satd. Flow (prot) 3433 2787 1770 5085 3539
Flt Permitted 0.95 1.00 0.95 1.00 1.00
Satd. Flow (perm) 3433 2787 1770 5085 3539
Peak-hour factor, PHF 0.97 0.56 0.95 0.86 0.95 0.92
Adj. Flow (vph) 308 664 56 1422 687 0
RTOR Reduction (vph) 0 580 0 0 0 0
Lane Group Flow (vph) 308 84 56 1422 687 0
Turn Type Prot Prot Prot NA NA
Protected Phases 4 4 5 2 6
Permitted Phases
Actuated Green, G (s) 15.1 15.1 13.6 97.4 80.8
Effective Green, g (s) 15.1 15.1 13.6 97.4 80.8
Actuated g/C Ratio 0.13 0.13 0.11 0.81 0.67
Clearance Time (s) 3.5 3.5 3.0 4.0 4.0
Vehicle Extension (s) 2.0 2.0 2.0 4.0 4.0
Lane Grp Cap (vph) 431 350 200 4127 2382
v/s Ratio Prot c0.09 0.03 0.03 c0.28 0.19
v/s Ratio Perm
v/c Ratio 0.71 0.24 0.28 0.34 0.29
Uniform Delay, d1 50.4 47.3 48.7 3.0 7.9
Progression Factor 1.00 1.00 1.00 1.00 1.00
Incremental Delay, d2 4.6 0.1 0.3 0.2 0.3
Delay (s) 55.0 47.4 49.0 3.2 8.3
Level of Service E D D A A
Approach Delay (s) 49.8 4.9 8.3
Approach LOS D A A
Intersection Summary
HCM 2000 Control Delay 19.6 HCM 2000 Level of Service B
HCM 2000 Volume to Capacity ratio 0.40
Actuated Cycle Length (s) 120.0 Sum of lost time (s) 10.5
Intersection Capacity Utilization 39.9% ICU Level of Service A
Analysis Period (min) 15
c Critical Lane Group

HCM Signalized Intersection Capacity Analysis
5: San Antonio Rd & 101 NB Off Ramp 11/19/2014
Existing Conditions_AM Synchro 7 - Report
Page 5
Movement NBT NBR SBL SBT NWL NWR
Lane Configurations
Volume (vph) 542 0 0 213 545 355
Ideal Flow (vphpl) 1900 1900 1900 1900 1900 1900
Total Lost time (s) 4.5 3.5 3.0 3.0
Lane Util. Factor 0.95 1.00 1.00 1.00
Frt 1.00 1.00 1.00 0.85
Flt Protected 1.00 1.00 0.95 1.00
Satd. Flow (prot) 3539 1863 1770 1583
Flt Permitted 1.00 1.00 0.95 1.00
Satd. Flow (perm) 3539 1863 1770 1583
Peak-hour factor, PHF 0.79 0.92 0.92 0.72 0.86 0.74
Adj. Flow (vph) 686 0 0 296 634 480
RTOR Reduction (vph) 0 0 0 0 0 74
Lane Group Flow (vph) 686 0 0 296 634 406
Turn Type NA NA Prot Prot
Protected Phases 2 6 4 4
Permitted Phases
Actuated Green, G (s) 13.8 14.8 19.7 19.7
Effective Green, g (s) 13.8 14.8 19.7 19.7
Actuated g/C Ratio 0.34 0.36 0.48 0.48
Clearance Time (s) 4.5 3.5 3.0 3.0
Vehicle Extension (s) 2.0 2.0 2.0 2.0
Lane Grp Cap (vph) 1191 672 850 760
v/s Ratio Prot c0.19 0.16 c0.36 0.26
v/s Ratio Perm
v/c Ratio 0.58 0.44 0.75 0.53
Uniform Delay, d1 11.2 10.0 8.6 7.4
Progression Factor 1.00 1.00 1.00 1.00
Incremental Delay, d2 0.4 0.2 3.1 0.4
Delay (s) 11.6 10.1 11.8 7.8
Level of Service B B B A
Approach Delay (s) 11.6 10.1 10.1
Approach LOS B B B
Intersection Summary
HCM 2000 Control Delay 10.6 HCM 2000 Level of Service B
HCM 2000 Volume to Capacity ratio 0.68
Actuated Cycle Length (s) 41.0 Sum of lost time (s) 7.5
Intersection Capacity Utilization 91.3% ICU Level of Service F
Analysis Period (min) 15
c Critical Lane Group

HCM Signalized Intersection Capacity Analysis
6: 101 NB Off Ramp & Marsh Road 11/19/2014
Existing Conditions_AM Synchro 7 - Report
Page 6
Movement WBL WBR NBT NBR SBL SBT
Lane Configurations
Volume (vph) 856 304 1457 0 0 1138
Ideal Flow (vphpl) 1900 1900 1900 1900 1900 1900
Total Lost time (s) 4.2 4.2 4.1 4.1
Lane Util. Factor 0.97 1.00 0.95 0.95
Frt 1.00 0.85 1.00 1.00
Flt Protected 0.95 1.00 1.00 1.00
Satd. Flow (prot) 3433 1583 3539 3539
Flt Permitted 0.95 1.00 1.00 1.00
Satd. Flow (perm) 3433 1583 3539 3539
Peak-hour factor, PHF 0.82 0.84 0.97 0.92 0.92 0.82
Adj. Flow (vph) 1044 362 1502 0 0 1388
RTOR Reduction (vph) 0 21 0 0 0 0
Lane Group Flow (vph) 1044 341 1502 0 0 1388
Turn Type Prot Perm NA NA
Protected Phases 8 2 6
Permitted Phases 8
Actuated Green, G (s) 25.6 25.6 46.1 46.1
Effective Green, g (s) 25.6 25.6 46.1 46.1
Actuated g/C Ratio 0.32 0.32 0.58 0.58
Clearance Time (s) 4.2 4.2 4.1 4.1
Vehicle Extension (s) 2.0 2.0 3.0 3.0
Lane Grp Cap (vph) 1098 506 2039 2039
v/s Ratio Prot c0.30 c0.42 0.39
v/s Ratio Perm 0.22
v/c Ratio 0.95 0.67 0.74 0.68
Uniform Delay, d1 26.6 23.6 12.5 11.8
Progression Factor 1.00 1.00 0.69 1.00
Incremental Delay, d2 16.5 2.8 1.8 1.9
Delay (s) 43.1 26.4 10.5 13.7
Level of Service D C B B
Approach Delay (s) 38.8 10.5 13.7
Approach LOS D B B
Intersection Summary
HCM 2000 Control Delay 20.8 HCM 2000 Level of Service C
HCM 2000 Volume to Capacity ratio 0.81
Actuated Cycle Length (s) 80.0 Sum of lost time (s) 8.3
Intersection Capacity Utilization 120.3% ICU Level of Service H
Analysis Period (min) 15
c Critical Lane Group
HCM Signalized Intersection Capacity Analysis
7: Marsh Road & 101 SB Off Ramp 11/19/2014
Existing Conditions_AM Synchro 7 - Report
Page 7
Movement EBL EBT WBT WBR SEL SER
Lane Configurations
Volume (vph) 0 857 1741 0 994 377
Ideal Flow (vphpl) 1900 1900 1900 1900 1900 1900
Total Lost time (s) 4.1 4.1 4.1 4.1
Lane Util. Factor 0.95 0.95 0.97 1.00
Frt 1.00 1.00 1.00 0.85
Flt Protected 1.00 1.00 0.95 1.00
Satd. Flow (prot) 3539 3539 3433 1583
Flt Permitted 1.00 1.00 0.95 1.00
Satd. Flow (perm) 3539 3539 3433 1583
Peak-hour factor, PHF 0.92 0.89 0.95 0.92 0.94 0.84
Adj. Flow (vph) 0 963 1833 0 1057 449
RTOR Reduction (vph) 0 0 0 0 0 1
Lane Group Flow (vph) 0 963 1833 0 1057 448
Turn Type NA NA Prot custom
Protected Phases 2 6 4 4 5
Permitted Phases
Actuated Green, G (s) 43.7 35.5 28.1 37.3
Effective Green, g (s) 43.7 35.5 28.1 37.3
Actuated g/C Ratio 0.55 0.44 0.35 0.47
Clearance Time (s) 4.1 4.1 4.1
Vehicle Extension (s) 2.0 2.0 2.0
Lane Grp Cap (vph) 1933 1570 1205 738
v/s Ratio Prot 0.27 c0.52 c0.31 c0.28
v/s Ratio Perm
v/c Ratio 0.50 1.17 0.88 0.61
Uniform Delay, d1 11.3 22.2 24.3 15.9
Progression Factor 1.00 0.98 1.00 1.00
Incremental Delay, d2 0.9 80.4 7.2 1.0
Delay (s) 12.2 102.3 31.6 16.9
Level of Service B F C B
Approach Delay (s) 12.2 102.3 27.2
Approach LOS B F C
Intersection Summary
HCM 2000 Control Delay 55.8 HCM 2000 Level of Service E
HCM 2000 Volume to Capacity ratio 1.03
Actuated Cycle Length (s) 80.0 Sum of lost time (s) 11.3
Intersection Capacity Utilization 110.3% ICU Level of Service H
Analysis Period (min) 15
c Critical Lane Group

HCM Signalized Intersection Capacity Analysis
1: SR 237 WB Ramps & Great America Parkway 11/19/2014
Existing Conditions_PM Synchro 9 Report
Page 1
Movement EBL EBT EBR WBL WBT WBR NBL NBT NBR SBL SBT SBR
Lane Configurations
Volume (vph) 0 0 0 114 5 208 51 513 0 0 510 639
Ideal Flow (vphpl) 1900 1900 1900 1900 1900 1900 1900 1900 1900 1900 1900 1900
Total Lost time (s) 4.5 4.5 4.5 3.5 5.0 3.2
Lane Util. Factor 0.95 0.95 1.00 0.97 0.95 0.95
Frt 1.00 1.00 0.85 1.00 1.00 0.92
Flt Protected 0.95 0.96 1.00 0.95 1.00 1.00
Satd. Flow (prot) 1681 1698 1583 3433 3539 3245
Flt Permitted 0.95 0.96 1.00 0.95 1.00 1.00
Satd. Flow (perm) 1681 1698 1583 3433 3539 3245
Peak-hour factor, PHF 0.92 0.92 0.92 0.84 0.42 0.88 0.75 0.94 0.92 0.92 0.94 0.95
Adj. Flow (vph) 0 0 0 136 12 236 68 546 0 0 543 673
RTOR Reduction (vph) 0 0 0 0 0 205 0 0 0 0 80 0
Lane Group Flow (vph) 0 0 0 73 75 31 68 546 0 0 1136 0
Turn Type Split NA Prot Prot NA NA
Protected Phases 4 4 4 5 2 6
Permitted Phases
Actuated Green, G (s) 7.8 7.8 7.8 5.0 43.0 36.3
Effective Green, g (s) 7.8 7.8 7.8 5.0 43.0 36.3
Actuated g/C Ratio 0.13 0.13 0.13 0.08 0.71 0.60
Clearance Time (s) 4.5 4.5 4.5 3.5 5.0 3.2
Vehicle Extension (s) 2.0 2.0 2.0 2.0 2.0 2.0
Lane Grp Cap (vph) 217 219 204 284 2523 1953
v/s Ratio Prot 0.04 c0.04 0.02 0.02 c0.15 c0.35
v/s Ratio Perm
v/c Ratio 0.34 0.34 0.15 0.24 0.22 0.58
Uniform Delay, d1 23.9 23.9 23.3 25.9 2.9 7.3
Progression Factor 1.00 1.00 1.00 1.00 1.00 1.00
Incremental Delay, d2 0.3 0.3 0.1 0.2 0.0 0.3
Delay (s) 24.2 24.3 23.4 26.0 3.0 7.6
Level of Service C C C C A A
Approach Delay (s) 0.0 23.7 5.5 7.6
Approach LOS A C A A
Intersection Summary
HCM 2000 Control Delay 9.8 HCM 2000 Level of Service A
HCM 2000 Volume to Capacity ratio 0.51
Actuated Cycle Length (s) 60.3 Sum of lost time (s) 11.2
Intersection Capacity Utilization 59.7% ICU Level of Service B
Analysis Period (min) 15
c Critical Lane Group

HCM Signalized Intersection Capacity Analysis
2: Great America Parkway & SR 237 EB Ramps 11/19/2014
Existing Conditions_PM Synchro 9 Report
Page 2
Movement EBL EBT EBR WBL WBT WBR NBL NBT NBR SBL SBT SBR
Lane Configurations
Volume (vph) 420 8 179 0 0 0 0 152 220 306 313 0
Ideal Flow (vphpl) 1900 1900 1900 1900 1900 1900 1900 1900 1900 1900 1900 1900
Total Lost time (s) 4.0 4.0 4.0 4.0 3.5 4.0
Lane Util. Factor 1.00 1.00 0.86 0.86 1.00 0.95
Frt 1.00 0.85 0.94 0.85 1.00 1.00
Flt Protected 0.95 1.00 1.00 1.00 0.95 1.00
Satd. Flow (prot) 1776 1583 4499 1362 1770 3539
Flt Permitted 0.95 1.00 1.00 1.00 0.95 1.00
Satd. Flow (perm) 1776 1583 4499 1362 1770 3539
Peak-hour factor, PHF 0.85 0.67 0.93 0.92 0.92 0.92 0.92 0.83 0.81 0.96 0.88 0.92
Adj. Flow (vph) 494 12 192 0 0 0 0 183 272 319 356 0
RTOR Reduction (vph) 0 0 113 0 0 0 0 115 115 0 0 0
Lane Group Flow (vph) 0 506 79 0 0 0 0 204 21 319 356 0
Turn Type Split NA Perm NA Perm Prot NA
Protected Phases 4 4 2 1 6
Permitted Phases 4 2
Actuated Green, G (s) 26.4 26.4 10.0 10.0 16.5 30.0
Effective Green, g (s) 26.4 26.4 10.0 10.0 16.5 30.0
Actuated g/C Ratio 0.41 0.41 0.16 0.16 0.26 0.47
Clearance Time (s) 4.0 4.0 4.0 4.0 3.5 4.0
Vehicle Extension (s) 2.0 2.0 4.0 4.0 2.0 4.0
Lane Grp Cap (vph) 728 648 698 211 453 1648
v/s Ratio Prot c0.28 c0.05 c0.18 0.10
v/s Ratio Perm 0.05 0.02
v/c Ratio 0.70 0.12 0.29 0.10 0.70 0.22
Uniform Delay, d1 15.7 11.8 24.1 23.3 21.7 10.2
Progression Factor 1.00 1.00 1.00 1.00 1.00 1.00
Incremental Delay, d2 2.3 0.0 0.3 0.3 4.0 0.1
Delay (s) 18.0 11.8 24.4 23.6 25.8 10.3
Level of Service B B C C C B
Approach Delay (s) 16.3 0.0 24.2 17.6
Approach LOS B A C B
Intersection Summary
HCM 2000 Control Delay 18.7 HCM 2000 Level of Service B
HCM 2000 Volume to Capacity ratio 0.62
Actuated Cycle Length (s) 64.4 Sum of lost time (s) 11.5
Intersection Capacity Utilization 59.7% ICU Level of Service B
Analysis Period (min) 15
c Critical Lane Group

HCM Signalized Intersection Capacity Analysis
3: N Shoreline Boulevard & 101 NB Off Ramp & La Avenida Street 11/19/2014
Existing Conditions_PM Synchro 9 Report
Page 3
Movement WBL2 WBL WBR NBT SBT NWL2 NWL NWR
Lane Configurations
Volume (vph) 330 132 5 440 2079 432 4 474
Ideal Flow (vphpl) 1900 1900 1900 1900 1900 1900 1900 1900
Total Lost time (s) 3.5 3.5 3.5 6.2 5.0 3.5 3.5 3.5
Lane Util. Factor 0.95 0.95 1.00 0.95 0.91 0.95 0.95 0.88
Frt 1.00 1.00 0.85 1.00 1.00 1.00 1.00 0.85
Flt Protected 0.95 0.95 1.00 1.00 1.00 0.95 0.95 1.00
Satd. Flow (prot) 1681 1681 1583 3539 5085 1681 1681 2787
Flt Permitted 0.95 0.95 1.00 1.00 1.00 0.95 0.95 1.00
Satd. Flow (perm) 1681 1681 1583 3539 5085 1681 1681 2787
Peak-hour factor, PHF 0.89 0.85 0.63 0.88 0.95 0.92 0.50 0.93
Adj. Flow (vph) 371 155 8 500 2188 470 8 510
RTOR Reduction (vph) 0 0 7 0 0 0 0 0
Lane Group Flow (vph) 263 263 1 500 2188 240 238 510
Turn Type Prot Prot Prot NA NA Prot Prot Prot
Protected Phases 7 7 7 2 6 8 8 8
Permitted Phases
Actuated Green, G (s) 15.0 15.0 15.0 69.9 71.1 26.9 26.9 26.9
Effective Green, g (s) 15.0 15.0 15.0 69.9 71.1 26.9 26.9 26.9
Actuated g/C Ratio 0.12 0.12 0.12 0.56 0.57 0.22 0.22 0.22
Clearance Time (s) 3.5 3.5 3.5 6.2 5.0 3.5 3.5 3.5
Vehicle Extension (s) 1.5 1.5 1.5 1.5 1.5 1.5 1.5 1.5
Lane Grp Cap (vph) 201 201 189 1979 2892 361 361 599
v/s Ratio Prot c0.16 0.16 0.00 0.14 c0.43 0.14 0.14 c0.18
v/s Ratio Perm
v/c Ratio 1.31 1.31 0.01 0.25 0.76 0.66 0.66 0.85
Uniform Delay, d1 55.0 55.0 48.4 14.1 20.4 44.9 44.9 47.1
Progression Factor 1.00 1.00 1.00 1.00 1.00 1.00 1.00 1.00
Incremental Delay, d2 169.9 169.9 0.0 0.3 1.9 3.6 3.3 10.8
Delay (s) 224.9 224.9 48.4 14.4 22.3 48.5 48.2 57.9
Level of Service F F D B C D D E
Approach Delay (s) 222.2 14.4 22.3 53.3
Approach LOS F B C D
Intersection Summary
HCM 2000 Control Delay 54.0 HCM 2000 Level of Service D
HCM 2000 Volume to Capacity ratio 0.86
Actuated Cycle Length (s) 125.0 Sum of lost time (s) 13.2
Intersection Capacity Utilization 75.9% ICU Level of Service D
Analysis Period (min) 15
c Critical Lane Group

HCM Signalized Intersection Capacity Analysis
4: 101 SB Ramps & N Shoreline Boulevard 11/19/2014
Existing Conditions_PM Synchro 9 Report
Page 4
Movement EBL EBR NBL NBT SBT SBR
Lane Configurations
Volume (vph) 96 276 123 680 1277 0
Ideal Flow (vphpl) 1900 1900 1900 1900 1900 1900
Total Lost time (s) 3.5 3.5 3.0 4.0 4.0
Lane Util. Factor 0.97 0.88 1.00 0.91 0.95
Frt 1.00 0.85 1.00 1.00 1.00
Flt Protected 0.95 1.00 0.95 1.00 1.00
Satd. Flow (prot) 3433 2787 1770 5085 3539
Flt Permitted 0.95 1.00 0.95 1.00 1.00
Satd. Flow (perm) 3433 2787 1770 5085 3539
Peak-hour factor, PHF 0.92 0.90 0.79 0.85 0.94 0.92
Adj. Flow (vph) 104 307 156 800 1359 0
RTOR Reduction (vph) 0 287 0 0 0 0
Lane Group Flow (vph) 104 20 156 800 1359 0
Turn Type Prot Prot Prot NA NA
Protected Phases 4 4 5 2 6
Permitted Phases
Actuated Green, G (s) 8.2 8.2 17.0 110.3 90.3
Effective Green, g (s) 8.2 8.2 17.0 110.3 90.3
Actuated g/C Ratio 0.07 0.07 0.13 0.88 0.72
Clearance Time (s) 3.5 3.5 3.0 4.0 4.0
Vehicle Extension (s) 2.0 2.0 2.0 4.0 4.0
Lane Grp Cap (vph) 223 181 238 4451 2536
v/s Ratio Prot c0.03 0.01 c0.09 0.16 c0.38
v/s Ratio Perm
v/c Ratio 0.47 0.11 0.66 0.18 0.54
Uniform Delay, d1 56.8 55.5 51.7 1.2 8.2
Progression Factor 1.00 1.00 1.00 1.00 1.00
Incremental Delay, d2 0.6 0.1 4.9 0.1 0.8
Delay (s) 57.4 55.6 56.6 1.2 9.0
Level of Service E E E A A
Approach Delay (s) 56.0 10.3 9.0
Approach LOS E B A
Intersection Summary
HCM 2000 Control Delay 16.6 HCM 2000 Level of Service B
HCM 2000 Volume to Capacity ratio 0.55
Actuated Cycle Length (s) 126.0 Sum of lost time (s) 10.5
Intersection Capacity Utilization 55.4% ICU Level of Service B
Analysis Period (min) 15
c Critical Lane Group

HCM Signalized Intersection Capacity Analysis
5: San Antonio Rd & 101 NB Off Ramp 11/19/2014
Existing Conditions_PM Synchro 9 Report
Page 5
Movement NBT NBR SBL SBT NWL NWR
Lane Configurations
Volume (vph) 326 0 0 704 301 160
Ideal Flow (vphpl) 1900 1900 1900 1900 1900 1900
Total Lost time (s) 4.5 3.5 3.0 3.0
Lane Util. Factor 0.95 1.00 1.00 1.00
Frt 1.00 1.00 1.00 0.85
Flt Protected 1.00 1.00 0.95 1.00
Satd. Flow (prot) 3539 1863 1770 1583
Flt Permitted 1.00 1.00 0.95 1.00
Satd. Flow (perm) 3539 1863 1770 1583
Peak-hour factor, PHF 0.81 0.92 0.92 0.85 0.92 0.82
Adj. Flow (vph) 402 0 0 828 327 195
RTOR Reduction (vph) 0 0 0 0 0 140
Lane Group Flow (vph) 402 0 0 828 327 55
Turn Type NA NA Prot Prot
Protected Phases 2 6 4 4
Permitted Phases
Actuated Green, G (s) 26.9 27.9 13.4 13.4
Effective Green, g (s) 26.9 27.9 13.4 13.4
Actuated g/C Ratio 0.56 0.58 0.28 0.28
Clearance Time (s) 4.5 3.5 3.0 3.0
Vehicle Extension (s) 2.0 2.0 2.0 2.0
Lane Grp Cap (vph) 1991 1087 496 443
v/s Ratio Prot 0.11 c0.44 c0.18 0.03
v/s Ratio Perm
v/c Ratio 0.20 0.76 0.66 0.12
Uniform Delay, d1 5.2 7.5 15.2 12.8
Progression Factor 1.00 1.00 1.00 1.00
Incremental Delay, d2 0.0 2.9 2.4 0.0
Delay (s) 5.2 10.3 17.6 12.9
Level of Service A B B B
Approach Delay (s) 5.2 10.3 15.8
Approach LOS A B B
Intersection Summary
HCM 2000 Control Delay 10.8 HCM 2000 Level of Service B
HCM 2000 Volume to Capacity ratio 0.75
Actuated Cycle Length (s) 47.8 Sum of lost time (s) 7.5
Intersection Capacity Utilization 96.6% ICU Level of Service F
Analysis Period (min) 15
c Critical Lane Group
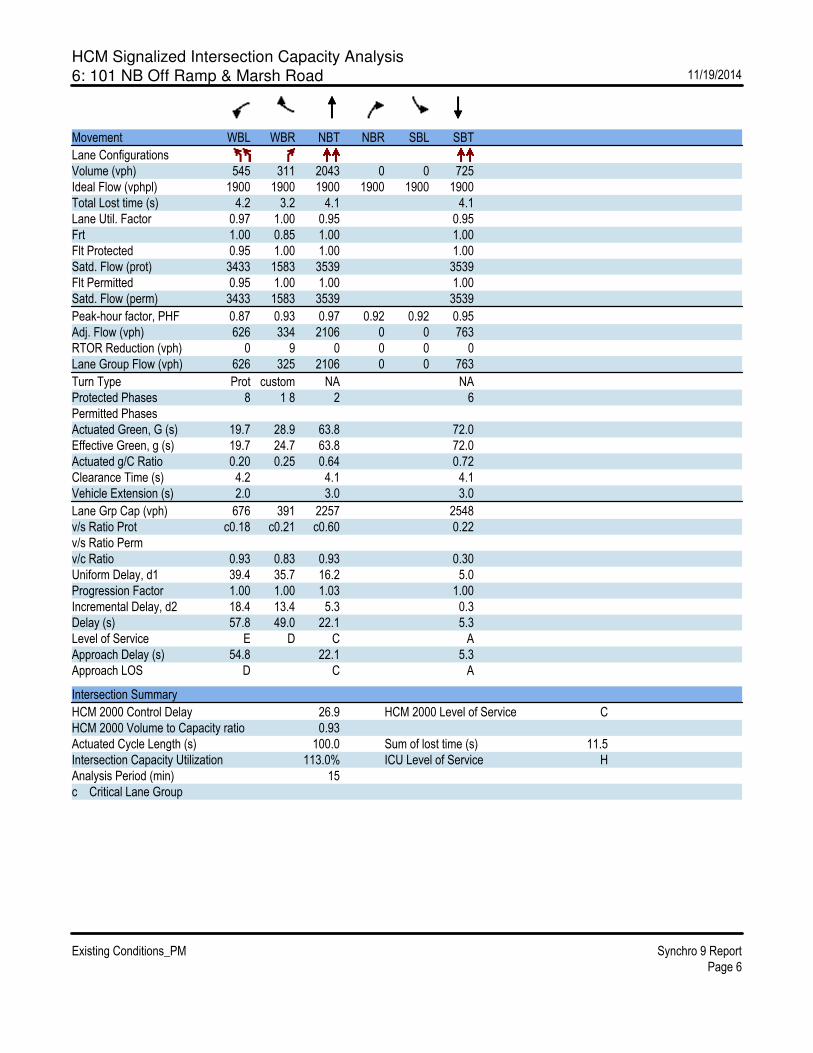
HCM Signalized Intersection Capacity Analysis
6: 101 NB Off Ramp & Marsh Road 11/19/2014
Existing Conditions_PM Synchro 9 Report
Page 6
Movement WBL WBR NBT NBR SBL SBT
Lane Configurations
Volume (vph) 545 311 2043 0 0 725
Ideal Flow (vphpl) 1900 1900 1900 1900 1900 1900
Total Lost time (s) 4.2 3.2 4.1 4.1
Lane Util. Factor 0.97 1.00 0.95 0.95
Frt 1.00 0.85 1.00 1.00
Flt Protected 0.95 1.00 1.00 1.00
Satd. Flow (prot) 3433 1583 3539 3539
Flt Permitted 0.95 1.00 1.00 1.00
Satd. Flow (perm) 3433 1583 3539 3539
Peak-hour factor, PHF 0.87 0.93 0.97 0.92 0.92 0.95
Adj. Flow (vph) 626 334 2106 0 0 763
RTOR Reduction (vph) 0 9 0 0 0 0
Lane Group Flow (vph) 626 325 2106 0 0 763
Turn Type Prot custom NA NA
Protected Phases 8 1 8 2 6
Permitted Phases
Actuated Green, G (s) 19.7 28.9 63.8 72.0
Effective Green, g (s) 19.7 24.7 63.8 72.0
Actuated g/C Ratio 0.20 0.25 0.64 0.72
Clearance Time (s) 4.2 4.1 4.1
Vehicle Extension (s) 2.0 3.0 3.0
Lane Grp Cap (vph) 676 391 2257 2548
v/s Ratio Prot c0.18 c0.21 c0.60 0.22
v/s Ratio Perm
v/c Ratio 0.93 0.83 0.93 0.30
Uniform Delay, d1 39.4 35.7 16.2 5.0
Progression Factor 1.00 1.00 1.03 1.00
Incremental Delay, d2 18.4 13.4 5.3 0.3
Delay (s) 57.8 49.0 22.1 5.3
Level of Service E D C A
Approach Delay (s) 54.8 22.1 5.3
Approach LOS D C A
Intersection Summary
HCM 2000 Control Delay 26.9 HCM 2000 Level of Service C
HCM 2000 Volume to Capacity ratio 0.93
Actuated Cycle Length (s) 100.0 Sum of lost time (s) 11.5
Intersection Capacity Utilization 113.0% ICU Level of Service H
Analysis Period (min) 15
c Critical Lane Group

HCM Signalized Intersection Capacity Analysis
7: Marsh Road & 101 SB Off Ramp 11/19/2014
Existing Conditions_PM Synchro 9 Report
Page 7
Movement EBL EBT WBT WBR SBL SBR
Lane Configurations
Volume (vph) 0 920 848 0 1493 370
Ideal Flow (vphpl) 1900 1900 1900 1900 1900 1900
Total Lost time (s) 4.1 4.1 4.1 4.1
Lane Util. Factor 0.95 0.95 0.97 1.00
Frt 1.00 1.00 1.00 0.85
Flt Protected 1.00 1.00 0.95 1.00
Satd. Flow (prot) 3539 3539 3433 1583
Flt Permitted 1.00 1.00 0.95 1.00
Satd. Flow (perm) 3539 3539 3433 1583
Peak-hour factor, PHF 0.92 0.82 0.91 0.92 0.96 0.91
Adj. Flow (vph) 0 1122 932 0 1555 407
RTOR Reduction (vph) 0 0 0 0 0 0
Lane Group Flow (vph) 0 1122 932 0 1555 407
Turn Type NA NA Prot custom
Protected Phases 2 6 4 4 5
Permitted Phases
Actuated Green, G (s) 33.2 24.9 58.6 67.9
Effective Green, g (s) 33.2 24.9 58.6 67.9
Actuated g/C Ratio 0.33 0.25 0.59 0.68
Clearance Time (s) 4.1 4.1 4.1
Vehicle Extension (s) 2.0 2.0 2.0
Lane Grp Cap (vph) 1174 881 2011 1074
v/s Ratio Prot c0.32 c0.26 c0.45 0.26
v/s Ratio Perm
v/c Ratio 0.96 1.06 0.77 0.38
Uniform Delay, d1 32.7 37.5 15.7 6.9
Progression Factor 1.00 1.44 1.00 1.00
Incremental Delay, d2 17.6 44.6 1.7 0.1
Delay (s) 50.3 98.6 17.4 7.0
Level of Service D F B A
Approach Delay (s) 50.3 98.6 15.3
Approach LOS D F B
Intersection Summary
HCM 2000 Control Delay 44.4 HCM 2000 Level of Service D
HCM 2000 Volume to Capacity ratio 0.87
Actuated Cycle Length (s) 100.0 Sum of lost time (s) 11.3
Intersection Capacity Utilization 101.6% ICU Level of Service G
Analysis Period (min) 15
c Critical Lane Group

HCM Signalized Intersection Capacity Analysis
1: SR 237 WB Ramps & Great America Parkway 11/19/2014
Existing Conditions_AM with Project Synchro 9 Report
Page 1
Movement EBL EBT EBR WBL WBT WBR NBL NBT NBR SBL SBT SBR
Lane Configurations
Volume (vph) 0 0 0 829 21 191 170 236 0 0 67 422
Ideal Flow (vphpl) 1900 1900 1900 1900 1900 1900 1900 1900 1900 1900 1900 1900
Total Lost time (s) 4.5 4.5 4.5 3.5 5.0 3.2
Lane Util. Factor 0.95 0.95 1.00 0.97 0.95 0.95
Frt 1.00 1.00 0.85 1.00 1.00 0.87
Flt Protected 0.95 0.95 1.00 0.95 1.00 1.00
Satd. Flow (prot) 1681 1690 1583 3433 3539 3063
Flt Permitted 0.95 0.95 1.00 0.95 1.00 1.00
Satd. Flow (perm) 1681 1690 1583 3433 3539 3063
Peak-hour factor, PHF 0.92 0.92 0.92 0.87 0.75 0.84 0.80 0.78 0.92 0.92 0.91 0.65
Adj. Flow (vph) 0 0 0 953 28 227 212 303 0 0 74 649
RTOR Reduction (vph) 0 0 0 0 0 116 0 0 0 0 559 0
Lane Group Flow (vph) 0 0 0 486 495 111 212 303 0 0 164 0
Turn Type Split NA Prot Prot NA NA
Protected Phases 4 4 4 5 2 6
Permitted Phases
Actuated Green, G (s) 27.0 27.0 27.0 9.4 18.8 7.7
Effective Green, g (s) 27.0 27.0 27.0 9.4 18.8 7.7
Actuated g/C Ratio 0.49 0.49 0.49 0.17 0.34 0.14
Clearance Time (s) 4.5 4.5 4.5 3.5 5.0 3.2
Vehicle Extension (s) 2.0 2.0 2.0 2.0 2.0 2.0
Lane Grp Cap (vph) 820 825 772 583 1203 426
v/s Ratio Prot 0.29 c0.29 0.07 c0.06 0.09 c0.05
v/s Ratio Perm
v/c Ratio 0.59 0.60 0.14 0.36 0.25 0.39
Uniform Delay, d1 10.2 10.2 7.8 20.3 13.2 21.6
Progression Factor 1.00 1.00 1.00 1.00 1.00 1.00
Incremental Delay, d2 0.8 0.8 0.0 0.1 0.0 0.2
Delay (s) 11.0 11.0 7.8 20.4 13.2 21.9
Level of Service B B A C B C
Approach Delay (s) 0.0 10.4 16.2 21.9
Approach LOS A B B C
Intersection Summary
HCM 2000 Control Delay 15.0 HCM 2000 Level of Service B
HCM 2000 Volume to Capacity ratio 0.51
Actuated Cycle Length (s) 55.3 Sum of lost time (s) 11.2
Intersection Capacity Utilization 79.9% ICU Level of Service D
Analysis Period (min) 15
c Critical Lane Group

HCM Signalized Intersection Capacity Analysis
2: Great America Parkway & SR 237 EB Ramps 11/19/2014
Existing Conditions_AM with Project Synchro 9 Report
Page 2
Movement EBL EBT EBR WBL WBT WBR NBL NBT NBR SBL SBT SBR
Lane Configurations
Volume (vph) 171 2 435 0 0 0 0 223 336 31 857 0
Ideal Flow (vphpl) 1900 1900 1900 1900 1900 1900 1900 1900 1900 1900 1900 1900
Total Lost time (s) 4.0 4.0 4.0 4.0 3.5 4.0
Lane Util. Factor 1.00 1.00 0.86 0.86 1.00 0.95
Frt 1.00 0.85 0.94 0.85 1.00 1.00
Flt Protected 0.95 1.00 1.00 1.00 0.95 1.00
Satd. Flow (prot) 1777 1583 4501 1362 1770 3539
Flt Permitted 0.95 1.00 1.00 1.00 0.95 1.00
Satd. Flow (perm) 1777 1583 4501 1362 1770 3539
Peak-hour factor, PHF 0.90 0.25 0.95 0.92 0.92 0.92 0.92 0.80 0.82 0.88 0.89 0.92
Adj. Flow (vph) 190 8 458 0 0 0 0 279 410 35 963 0
RTOR Reduction (vph) 0 0 94 0 0 0 0 123 124 0 0 0
Lane Group Flow (vph) 0 198 364 0 0 0 0 361 81 35 963 0
Turn Type Split NA Prot NA Perm Prot NA
Protected Phases 4 4 4 2 1 6
Permitted Phases 2
Actuated Green, G (s) 18.2 18.2 20.7 20.7 2.2 26.4
Effective Green, g (s) 18.2 18.2 20.7 20.7 2.2 26.4
Actuated g/C Ratio 0.35 0.35 0.39 0.39 0.04 0.50
Clearance Time (s) 4.0 4.0 4.0 4.0 3.5 4.0
Vehicle Extension (s) 2.0 2.0 4.0 4.0 2.0 4.0
Lane Grp Cap (vph) 614 547 1771 535 74 1776
v/s Ratio Prot 0.11 c0.23 0.08 0.02 c0.27
v/s Ratio Perm 0.06
v/c Ratio 0.32 0.67 0.20 0.15 0.47 0.54
Uniform Delay, d1 12.7 14.6 10.5 10.3 24.6 9.0
Progression Factor 1.00 1.00 1.00 1.00 1.00 1.00
Incremental Delay, d2 0.1 2.4 0.1 0.2 1.7 0.4
Delay (s) 12.8 17.0 10.6 10.5 26.4 9.4
Level of Service B B B B C A
Approach Delay (s) 15.7 0.0 10.6 10.0
Approach LOS B A B A
Intersection Summary
HCM 2000 Control Delay 11.8 HCM 2000 Level of Service B
HCM 2000 Volume to Capacity ratio 0.64
Actuated Cycle Length (s) 52.6 Sum of lost time (s) 11.5
Intersection Capacity Utilization 79.9% ICU Level of Service D
Analysis Period (min) 15
c Critical Lane Group

HCM Signalized Intersection Capacity Analysis
3: N Shoreline Boulevard & 101 NB Off Ramp & La Avenida Street 11/19/2014
Existing Conditions_AM with Project Synchro 9 Report
Page 3
Movement WBL2 WBL WBR NBT SBT NWL2 NWL NWR
Lane Configurations
Volume (vph) 108 30 13 1191 335 530 5 1223
Ideal Flow (vphpl) 1900 1900 1900 1900 1900 1900 1900 1900
Total Lost time (s) 3.5 3.5 3.5 6.2 5.0 3.5 3.5 3.5
Lane Util. Factor 0.95 0.95 1.00 0.95 0.91 0.95 0.95 0.88
Frt 1.00 1.00 0.85 1.00 1.00 1.00 1.00 0.85
Flt Protected 0.95 0.95 1.00 1.00 1.00 0.95 0.95 1.00
Satd. Flow (prot) 1681 1681 1583 3539 5085 1681 1681 2787
Flt Permitted 0.95 0.95 1.00 1.00 1.00 0.95 0.95 1.00
Satd. Flow (perm) 1681 1681 1583 3539 5085 1681 1681 2787
Peak-hour factor, PHF 0.69 0.68 0.65 0.93 0.89 0.87 0.31 0.84
Adj. Flow (vph) 157 44 20 1281 376 609 16 1456
RTOR Reduction (vph) 0 0 18 0 0 0 0 0
Lane Group Flow (vph) 100 101 2 1281 376 311 314 1456
Turn Type Prot Prot Prot NA NA Prot Prot Prot
Protected Phases 7 7 7 2 6 8 8 8
Permitted Phases
Actuated Green, G (s) 11.8 11.8 11.8 51.8 53.0 63.2 63.2 63.2
Effective Green, g (s) 11.8 11.8 11.8 51.8 53.0 63.2 63.2 63.2
Actuated g/C Ratio 0.08 0.08 0.08 0.37 0.38 0.45 0.45 0.45
Clearance Time (s) 3.5 3.5 3.5 6.2 5.0 3.5 3.5 3.5
Vehicle Extension (s) 1.5 1.5 1.5 1.5 1.5 1.5 1.5 1.5
Lane Grp Cap (vph) 141 141 133 1309 1925 758 758 1258
v/s Ratio Prot 0.06 c0.06 0.00 c0.36 0.07 0.18 0.19 c0.52
v/s Ratio Perm
v/c Ratio 0.71 0.72 0.01 0.98 0.20 0.41 0.41 1.16
Uniform Delay, d1 62.4 62.5 58.8 43.6 29.2 25.9 25.9 38.4
Progression Factor 1.00 1.00 1.00 1.00 1.00 1.00 1.00 1.00
Incremental Delay, d2 12.5 13.4 0.0 20.3 0.2 0.1 0.1 80.1
Delay (s) 74.9 75.9 58.8 63.8 29.4 26.0 26.0 118.5
Level of Service E E E E C C C F
Approach Delay (s) 73.9 63.8 29.4 90.7
Approach LOS E E C F
Intersection Summary
HCM 2000 Control Delay 75.3 HCM 2000 Level of Service E
HCM 2000 Volume to Capacity ratio 1.04
Actuated Cycle Length (s) 140.0 Sum of lost time (s) 13.2
Intersection Capacity Utilization 92.5% ICU Level of Service F
Analysis Period (min) 15
c Critical Lane Group

HCM Signalized Intersection Capacity Analysis
4: 101 SB Ramps & N Shoreline Boulevard 11/19/2014
Existing Conditions_AM with Project Synchro 9 Report
Page 4
Movement EBL EBR NBL NBT SBT SBR
Lane Configurations
Volume (vph) 309 372 53 1223 653 0
Ideal Flow (vphpl) 1900 1900 1900 1900 1900 1900
Total Lost time (s) 3.5 3.5 3.0 4.0 4.0
Lane Util. Factor 0.97 0.88 1.00 0.91 0.95
Frt 1.00 0.85 1.00 1.00 1.00
Flt Protected 0.95 1.00 0.95 1.00 1.00
Satd. Flow (prot) 3433 2787 1770 5085 3539
Flt Permitted 0.95 1.00 0.95 1.00 1.00
Satd. Flow (perm) 3433 2787 1770 5085 3539
Peak-hour factor, PHF 0.97 0.56 0.95 0.86 0.95 0.92
Adj. Flow (vph) 319 664 56 1422 687 0
RTOR Reduction (vph) 0 578 0 0 0 0
Lane Group Flow (vph) 319 86 56 1422 687 0
Turn Type Prot Prot Prot NA NA
Protected Phases 4 4 5 2 6
Permitted Phases
Actuated Green, G (s) 15.5 15.5 13.6 97.0 80.4
Effective Green, g (s) 15.5 15.5 13.6 97.0 80.4
Actuated g/C Ratio 0.13 0.13 0.11 0.81 0.67
Clearance Time (s) 3.5 3.5 3.0 4.0 4.0
Vehicle Extension (s) 2.0 2.0 2.0 4.0 4.0
Lane Grp Cap (vph) 443 359 200 4110 2371
v/s Ratio Prot c0.09 0.03 0.03 c0.28 0.19
v/s Ratio Perm
v/c Ratio 0.72 0.24 0.28 0.35 0.29
Uniform Delay, d1 50.2 46.9 48.7 3.1 8.1
Progression Factor 1.00 1.00 1.00 1.00 1.00
Incremental Delay, d2 4.8 0.1 0.3 0.2 0.3
Delay (s) 55.0 47.1 49.0 3.3 8.4
Level of Service D D D A A
Approach Delay (s) 49.6 5.0 8.4
Approach LOS D A A
Intersection Summary
HCM 2000 Control Delay 19.7 HCM 2000 Level of Service B
HCM 2000 Volume to Capacity ratio 0.41
Actuated Cycle Length (s) 120.0 Sum of lost time (s) 10.5
Intersection Capacity Utilization 40.2% ICU Level of Service A
Analysis Period (min) 15
c Critical Lane Group

HCM Signalized Intersection Capacity Analysis
5: San Antonio Rd & 101 NB Off Ramp 11/19/2014
Existing Conditions_AM with Project Synchro 9 Report
Page 5
Movement NBT NBR SBL SBT NWL NWR
Lane Configurations
Volume (vph) 552 0 0 223 545 365
Ideal Flow (vphpl) 1900 1900 1900 1900 1900 1900
Total Lost time (s) 4.5 3.5 3.0 3.0
Lane Util. Factor 0.95 1.00 1.00 1.00
Frt 1.00 1.00 1.00 0.85
Flt Protected 1.00 1.00 0.95 1.00
Satd. Flow (prot) 3539 1863 1770 1583
Flt Permitted 1.00 1.00 0.95 1.00
Satd. Flow (perm) 3539 1863 1770 1583
Peak-hour factor, PHF 0.79 0.92 0.92 0.72 0.86 0.74
Adj. Flow (vph) 699 0 0 310 634 493
RTOR Reduction (vph) 0 0 0 0 0 71
Lane Group Flow (vph) 699 0 0 310 634 422
Turn Type NA NA Prot Prot
Protected Phases 2 6 4 4
Permitted Phases
Actuated Green, G (s) 14.0 15.0 19.8 19.8
Effective Green, g (s) 14.0 15.0 19.8 19.8
Actuated g/C Ratio 0.34 0.36 0.48 0.48
Clearance Time (s) 4.5 3.5 3.0 3.0
Vehicle Extension (s) 2.0 2.0 2.0 2.0
Lane Grp Cap (vph) 1199 676 848 758
v/s Ratio Prot c0.20 0.17 c0.36 0.27
v/s Ratio Perm
v/c Ratio 0.58 0.46 0.75 0.56
Uniform Delay, d1 11.2 10.0 8.7 7.6
Progression Factor 1.00 1.00 1.00 1.00
Incremental Delay, d2 0.5 0.2 3.2 0.5
Delay (s) 11.7 10.2 11.9 8.1
Level of Service B B B A
Approach Delay (s) 11.7 10.2 10.3
Approach LOS B B B
Intersection Summary
HCM 2000 Control Delay 10.7 HCM 2000 Level of Service B
HCM 2000 Volume to Capacity ratio 0.68
Actuated Cycle Length (s) 41.3 Sum of lost time (s) 7.5
Intersection Capacity Utilization 92.1% ICU Level of Service F
Analysis Period (min) 15
c Critical Lane Group

HCM Signalized Intersection Capacity Analysis
6: 101 NB Off Ramp & Marsh Road 11/19/2014
Existing Conditions_AM with Project Synchro 9 Report
Page 6
Movement WBL WBR NBT NBR SBL SBT
Lane Configurations
Volume (vph) 856 312 1465 0 0 1146
Ideal Flow (vphpl) 1900 1900 1900 1900 1900 1900
Total Lost time (s) 4.2 4.2 4.1 4.1
Lane Util. Factor 0.97 1.00 0.95 0.95
Frt 1.00 0.85 1.00 1.00
Flt Protected 0.95 1.00 1.00 1.00
Satd. Flow (prot) 3433 1583 3539 3539
Flt Permitted 0.95 1.00 1.00 1.00
Satd. Flow (perm) 3433 1583 3539 3539
Peak-hour factor, PHF 0.82 0.84 0.97 0.92 0.92 0.82
Adj. Flow (vph) 1044 371 1510 0 0 1398
RTOR Reduction (vph) 0 21 0 0 0 0
Lane Group Flow (vph) 1044 350 1510 0 0 1398
Turn Type Prot Perm NA NA
Protected Phases 8 2 6
Permitted Phases 8
Actuated Green, G (s) 25.6 25.6 46.1 46.1
Effective Green, g (s) 25.6 25.6 46.1 46.1
Actuated g/C Ratio 0.32 0.32 0.58 0.58
Clearance Time (s) 4.2 4.2 4.1 4.1
Vehicle Extension (s) 2.0 2.0 3.0 3.0
Lane Grp Cap (vph) 1098 506 2039 2039
v/s Ratio Prot c0.30 c0.43 0.40
v/s Ratio Perm 0.22
v/c Ratio 0.95 0.69 0.74 0.69
Uniform Delay, d1 26.6 23.8 12.5 11.9
Progression Factor 1.00 1.00 0.69 1.00
Incremental Delay, d2 16.5 3.3 1.9 1.9
Delay (s) 43.1 27.0 10.5 13.8
Level of Service D C B B
Approach Delay (s) 38.9 10.5 13.8
Approach LOS D B B
Intersection Summary
HCM 2000 Control Delay 20.9 HCM 2000 Level of Service C
HCM 2000 Volume to Capacity ratio 0.82
Actuated Cycle Length (s) 80.0 Sum of lost time (s) 8.3
Intersection Capacity Utilization 120.7% ICU Level of Service H
Analysis Period (min) 15
c Critical Lane Group

HCM Signalized Intersection Capacity Analysis
7: Marsh Road & 101 SB Off Ramp 11/19/2014
Existing Conditions_AM with Project Synchro 9 Report
Page 7
Movement EBL EBT WBT WBR SEL SER
Lane Configurations
Volume (vph) 0 857 1741 0 1002 377
Ideal Flow (vphpl) 1900 1900 1900 1900 1900 1900
Total Lost time (s) 4.1 4.1 4.1 4.1
Lane Util. Factor 0.95 0.95 0.97 1.00
Frt 1.00 1.00 1.00 0.85
Flt Protected 1.00 1.00 0.95 1.00
Satd. Flow (prot) 3539 3539 3433 1583
Flt Permitted 1.00 1.00 0.95 1.00
Satd. Flow (perm) 3539 3539 3433 1583
Peak-hour factor, PHF 0.92 0.89 0.95 0.92 0.94 0.84
Adj. Flow (vph) 0 963 1833 0 1066 449
RTOR Reduction (vph) 0 0 0 0 0 1
Lane Group Flow (vph) 0 963 1833 0 1066 448
Turn Type NA NA Prot custom
Protected Phases 2 6 4 4 5
Permitted Phases
Actuated Green, G (s) 43.5 35.3 28.3 37.5
Effective Green, g (s) 43.5 35.3 28.3 37.5
Actuated g/C Ratio 0.54 0.44 0.35 0.47
Clearance Time (s) 4.1 4.1 4.1
Vehicle Extension (s) 2.0 2.0 2.0
Lane Grp Cap (vph) 1924 1561 1214 742
v/s Ratio Prot 0.27 c0.52 c0.31 c0.28
v/s Ratio Perm
v/c Ratio 0.50 1.17 0.88 0.60
Uniform Delay, d1 11.4 22.4 24.2 15.7
Progression Factor 1.00 0.98 1.00 1.00
Incremental Delay, d2 0.9 83.3 7.2 1.0
Delay (s) 12.4 105.2 31.5 16.7
Level of Service B F C B
Approach Delay (s) 12.4 105.2 27.1
Approach LOS B F C
Intersection Summary
HCM 2000 Control Delay 57.0 HCM 2000 Level of Service E
HCM 2000 Volume to Capacity ratio 1.03
Actuated Cycle Length (s) 80.0 Sum of lost time (s) 11.3
Intersection Capacity Utilization 110.6% ICU Level of Service H
Analysis Period (min) 15
c Critical Lane Group

HCM Signalized Intersection Capacity Analysis
1: SR 237 WB Ramps & Great America Parkway 11/19/2014
Existing Conditions_PM with Project Synchro 9 Report
Page 1
Movement EBL EBT EBR WBL WBT WBR NBL NBT NBR SBL SBT SBR
Lane Configurations
Volume (vph) 0 0 0 114 5 217 51 522 0 0 519 648
Ideal Flow (vphpl) 1900 1900 1900 1900 1900 1900 1900 1900 1900 1900 1900 1900
Total Lost time (s) 4.5 4.5 4.5 3.5 5.0 3.2
Lane Util. Factor 0.95 0.95 1.00 0.97 0.95 0.95
Frt 1.00 1.00 0.85 1.00 1.00 0.92
Flt Protected 0.95 0.96 1.00 0.95 1.00 1.00
Satd. Flow (prot) 1681 1698 1583 3433 3539 3246
Flt Permitted 0.95 0.96 1.00 0.95 1.00 1.00
Satd. Flow (perm) 1681 1698 1583 3433 3539 3246
Peak-hour factor, PHF 0.92 0.92 0.92 0.84 0.42 0.88 0.75 0.94 0.92 0.92 0.94 0.95
Adj. Flow (vph) 0 0 0 136 12 247 68 555 0 0 552 682
RTOR Reduction (vph) 0 0 0 0 0 216 0 0 0 0 78 0
Lane Group Flow (vph) 0 0 0 73 75 31 68 555 0 0 1156 0
Turn Type Split NA Prot Prot NA NA
Protected Phases 4 4 4 5 2 6
Permitted Phases
Actuated Green, G (s) 7.8 7.8 7.8 5.0 44.7 38.0
Effective Green, g (s) 7.8 7.8 7.8 5.0 44.7 38.0
Actuated g/C Ratio 0.13 0.13 0.13 0.08 0.72 0.61
Clearance Time (s) 4.5 4.5 4.5 3.5 5.0 3.2
Vehicle Extension (s) 2.0 2.0 2.0 2.0 2.0 2.0
Lane Grp Cap (vph) 211 213 199 276 2551 1989
v/s Ratio Prot 0.04 c0.04 0.02 0.02 c0.16 c0.36
v/s Ratio Perm
v/c Ratio 0.35 0.35 0.16 0.25 0.22 0.58
Uniform Delay, d1 24.8 24.8 24.2 26.7 2.9 7.2
Progression Factor 1.00 1.00 1.00 1.00 1.00 1.00
Incremental Delay, d2 0.4 0.4 0.1 0.2 0.0 0.3
Delay (s) 25.1 25.2 24.3 26.9 2.9 7.5
Level of Service C C C C A A
Approach Delay (s) 0.0 24.6 5.5 7.5
Approach LOS A C A A
Intersection Summary
HCM 2000 Control Delay 9.9 HCM 2000 Level of Service A
HCM 2000 Volume to Capacity ratio 0.51
Actuated Cycle Length (s) 62.0 Sum of lost time (s) 11.2
Intersection Capacity Utilization 60.7% ICU Level of Service B
Analysis Period (min) 15
c Critical Lane Group

HCM Signalized Intersection Capacity Analysis
2: Great America Parkway & SR 237 EB Ramps 11/19/2014
Existing Conditions_PM with Project Synchro 9 Report
Page 2
Movement EBL EBT EBR WBL WBT WBR NBL NBT NBR SBL SBT SBR
Lane Configurations
Volume (vph) 429 8 179 0 0 0 0 152 220 315 313 0
Ideal Flow (vphpl) 1900 1900 1900 1900 1900 1900 1900 1900 1900 1900 1900 1900
Total Lost time (s) 4.0 4.0 4.0 4.0 3.5 4.0
Lane Util. Factor 1.00 1.00 0.86 0.86 1.00 0.95
Frt 1.00 0.85 0.94 0.85 1.00 1.00
Flt Protected 0.95 1.00 1.00 1.00 0.95 1.00
Satd. Flow (prot) 1776 1583 4499 1362 1770 3539
Flt Permitted 0.95 1.00 1.00 1.00 0.95 1.00
Satd. Flow (perm) 1776 1583 4499 1362 1770 3539
Peak-hour factor, PHF 0.85 0.67 0.93 0.92 0.92 0.92 0.92 0.83 0.81 0.96 0.88 0.92
Adj. Flow (vph) 505 12 192 0 0 0 0 183 272 328 356 0
RTOR Reduction (vph) 0 0 111 0 0 0 0 116 116 0 0 0
Lane Group Flow (vph) 0 517 81 0 0 0 0 203 20 328 356 0
Turn Type Split NA Perm NA Perm Prot NA
Protected Phases 4 4 2 1 6
Permitted Phases 4 2
Actuated Green, G (s) 28.0 28.0 10.0 10.0 17.1 30.6
Effective Green, g (s) 28.0 28.0 10.0 10.0 17.1 30.6
Actuated g/C Ratio 0.42 0.42 0.15 0.15 0.26 0.46
Clearance Time (s) 4.0 4.0 4.0 4.0 3.5 4.0
Vehicle Extension (s) 2.0 2.0 4.0 4.0 2.0 4.0
Lane Grp Cap (vph) 746 665 675 204 454 1626
v/s Ratio Prot c0.29 c0.05 c0.19 0.10
v/s Ratio Perm 0.05 0.01
v/c Ratio 0.69 0.12 0.30 0.10 0.72 0.22
Uniform Delay, d1 15.8 11.8 25.2 24.4 22.6 10.8
Progression Factor 1.00 1.00 1.00 1.00 1.00 1.00
Incremental Delay, d2 2.3 0.0 0.3 0.3 4.8 0.1
Delay (s) 18.0 11.8 25.5 24.7 27.4 10.9
Level of Service B B C C C B
Approach Delay (s) 16.4 0.0 25.3 18.8
Approach LOS B A C B
Intersection Summary
HCM 2000 Control Delay 19.5 HCM 2000 Level of Service B
HCM 2000 Volume to Capacity ratio 0.63
Actuated Cycle Length (s) 66.6 Sum of lost time (s) 11.5
Intersection Capacity Utilization 60.7% ICU Level of Service B
Analysis Period (min) 15
c Critical Lane Group

HCM Signalized Intersection Capacity Analysis
3: N Shoreline Boulevard & 101 NB Off Ramp & La Avenida Street 11/19/2014
Existing Conditions_PM with Project Synchro 9 Report
Page 3
Movement WBL2 WBL WBR NBT SBT NWL2 NWL NWR
Lane Configurations
Volume (vph) 330 132 5 450 2089 432 4 484
Ideal Flow (vphpl) 1900 1900 1900 1900 1900 1900 1900 1900
Total Lost time (s) 3.5 3.5 3.5 6.2 5.0 3.5 3.5 3.5
Lane Util. Factor 0.95 0.95 1.00 0.95 0.91 0.95 0.95 0.88
Frt 1.00 1.00 0.85 1.00 1.00 1.00 1.00 0.85
Flt Protected 0.95 0.95 1.00 1.00 1.00 0.95 0.95 1.00
Satd. Flow (prot) 1681 1681 1583 3539 5085 1681 1681 2787
Flt Permitted 0.95 0.95 1.00 1.00 1.00 0.95 0.95 1.00
Satd. Flow (perm) 1681 1681 1583 3539 5085 1681 1681 2787
Peak-hour factor, PHF 0.89 0.85 0.63 0.88 0.95 0.92 0.50 0.93
Adj. Flow (vph) 371 155 8 511 2199 470 8 520
RTOR Reduction (vph) 0 0 7 0 0 0 0 0
Lane Group Flow (vph) 263 263 1 511 2199 240 238 520
Turn Type Prot Prot Prot NA NA Prot Prot Prot
Protected Phases 7 7 7 2 6 8 8 8
Permitted Phases
Actuated Green, G (s) 15.0 15.0 15.0 69.4 70.6 27.4 27.4 27.4
Effective Green, g (s) 15.0 15.0 15.0 69.4 70.6 27.4 27.4 27.4
Actuated g/C Ratio 0.12 0.12 0.12 0.56 0.56 0.22 0.22 0.22
Clearance Time (s) 3.5 3.5 3.5 6.2 5.0 3.5 3.5 3.5
Vehicle Extension (s) 1.5 1.5 1.5 1.5 1.5 1.5 1.5 1.5
Lane Grp Cap (vph) 201 201 189 1964 2872 368 368 610
v/s Ratio Prot c0.16 0.16 0.00 0.14 c0.43 0.14 0.14 c0.19
v/s Ratio Perm
v/c Ratio 1.31 1.31 0.01 0.26 0.77 0.65 0.65 0.85
Uniform Delay, d1 55.0 55.0 48.4 14.5 20.9 44.5 44.4 46.9
Progression Factor 1.00 1.00 1.00 1.00 1.00 1.00 1.00 1.00
Incremental Delay, d2 169.9 169.9 0.0 0.3 2.0 3.1 2.9 10.7
Delay (s) 224.9 224.9 48.4 14.8 22.9 47.6 47.3 57.6
Level of Service F F D B C D D E
Approach Delay (s) 222.2 14.8 22.9 52.7
Approach LOS F B C D
Intersection Summary
HCM 2000 Control Delay 54.0 HCM 2000 Level of Service D
HCM 2000 Volume to Capacity ratio 0.87
Actuated Cycle Length (s) 125.0 Sum of lost time (s) 13.2
Intersection Capacity Utilization 76.1% ICU Level of Service D
Analysis Period (min) 15
c Critical Lane Group

HCM Signalized Intersection Capacity Analysis
4: 101 SB Ramps & N Shoreline Boulevard 11/19/2014
Existing Conditions_PM with Project Synchro 9 Report
Page 4
Movement EBL EBR NBL NBT SBT SBR
Lane Configurations
Volume (vph) 106 276 123 680 1277 0
Ideal Flow (vphpl) 1900 1900 1900 1900 1900 1900
Total Lost time (s) 3.5 3.5 3.0 4.0 4.0
Lane Util. Factor 0.97 0.88 1.00 0.91 0.95
Frt 1.00 0.85 1.00 1.00 1.00
Flt Protected 0.95 1.00 0.95 1.00 1.00
Satd. Flow (prot) 3433 2787 1770 5085 3539
Flt Permitted 0.95 1.00 0.95 1.00 1.00
Satd. Flow (perm) 3433 2787 1770 5085 3539
Peak-hour factor, PHF 0.92 0.90 0.79 0.85 0.94 0.92
Adj. Flow (vph) 115 307 156 800 1359 0
RTOR Reduction (vph) 0 286 0 0 0 0
Lane Group Flow (vph) 115 21 156 800 1359 0
Turn Type Prot Prot Prot NA NA
Protected Phases 4 4 5 2 6
Permitted Phases
Actuated Green, G (s) 8.6 8.6 17.0 109.9 89.9
Effective Green, g (s) 8.6 8.6 17.0 109.9 89.9
Actuated g/C Ratio 0.07 0.07 0.13 0.87 0.71
Clearance Time (s) 3.5 3.5 3.0 4.0 4.0
Vehicle Extension (s) 2.0 2.0 2.0 4.0 4.0
Lane Grp Cap (vph) 234 190 238 4435 2525
v/s Ratio Prot c0.03 0.01 c0.09 0.16 c0.38
v/s Ratio Perm
v/c Ratio 0.49 0.11 0.66 0.18 0.54
Uniform Delay, d1 56.6 55.1 51.7 1.2 8.4
Progression Factor 1.00 1.00 1.00 1.00 1.00
Incremental Delay, d2 0.6 0.1 4.9 0.1 0.8
Delay (s) 57.2 55.2 56.6 1.3 9.2
Level of Service E E E A A
Approach Delay (s) 55.7 10.3 9.2
Approach LOS E B A
Intersection Summary
HCM 2000 Control Delay 16.8 HCM 2000 Level of Service B
HCM 2000 Volume to Capacity ratio 0.55
Actuated Cycle Length (s) 126.0 Sum of lost time (s) 10.5
Intersection Capacity Utilization 55.4% ICU Level of Service B
Analysis Period (min) 15
c Critical Lane Group
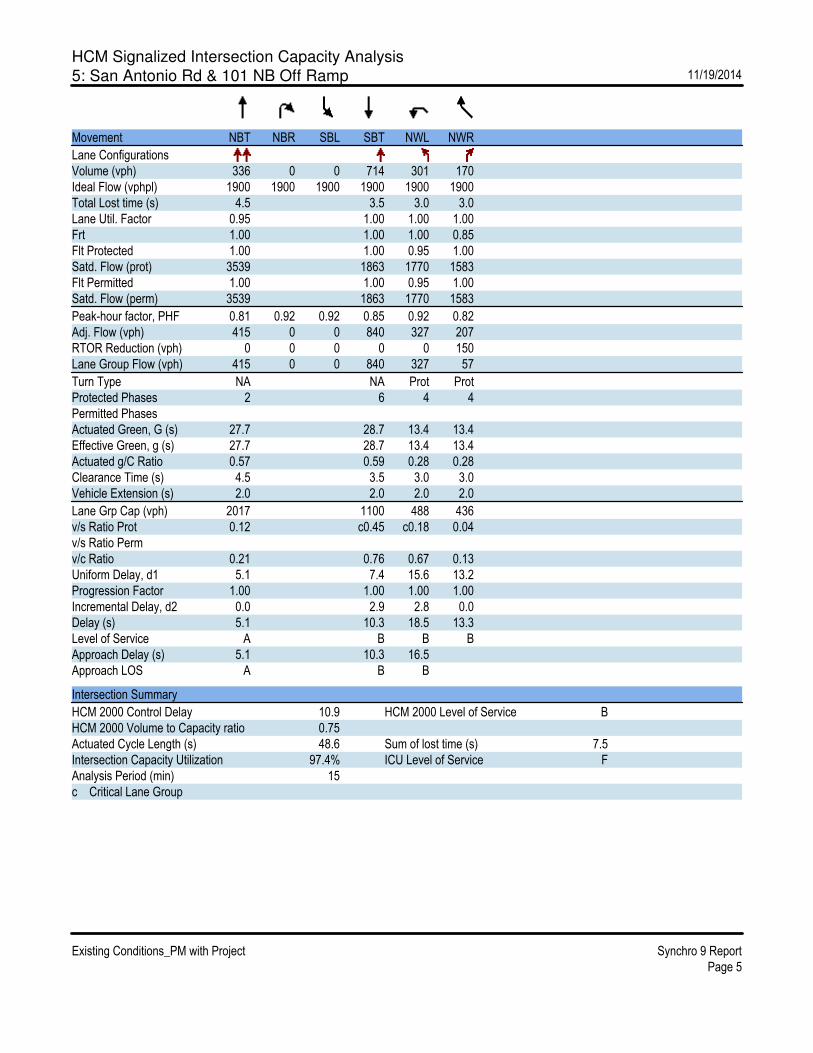
HCM Signalized Intersection Capacity Analysis
5: San Antonio Rd & 101 NB Off Ramp 11/19/2014
Existing Conditions_PM with Project Synchro 9 Report
Page 5
Movement NBT NBR SBL SBT NWL NWR
Lane Configurations
Volume (vph) 336 0 0 714 301 170
Ideal Flow (vphpl) 1900 1900 1900 1900 1900 1900
Total Lost time (s) 4.5 3.5 3.0 3.0
Lane Util. Factor 0.95 1.00 1.00 1.00
Frt 1.00 1.00 1.00 0.85
Flt Protected 1.00 1.00 0.95 1.00
Satd. Flow (prot) 3539 1863 1770 1583
Flt Permitted 1.00 1.00 0.95 1.00
Satd. Flow (perm) 3539 1863 1770 1583
Peak-hour factor, PHF 0.81 0.92 0.92 0.85 0.92 0.82
Adj. Flow (vph) 415 0 0 840 327 207
RTOR Reduction (vph) 0 0 0 0 0 150
Lane Group Flow (vph) 415 0 0 840 327 57
Turn Type NA NA Prot Prot
Protected Phases 2 6 4 4
Permitted Phases
Actuated Green, G (s) 27.7 28.7 13.4 13.4
Effective Green, g (s) 27.7 28.7 13.4 13.4
Actuated g/C Ratio 0.57 0.59 0.28 0.28
Clearance Time (s) 4.5 3.5 3.0 3.0
Vehicle Extension (s) 2.0 2.0 2.0 2.0
Lane Grp Cap (vph) 2017 1100 488 436
v/s Ratio Prot 0.12 c0.45 c0.18 0.04
v/s Ratio Perm
v/c Ratio 0.21 0.76 0.67 0.13
Uniform Delay, d1 5.1 7.4 15.6 13.2
Progression Factor 1.00 1.00 1.00 1.00
Incremental Delay, d2 0.0 2.9 2.8 0.0
Delay (s) 5.1 10.3 18.5 13.3
Level of Service A B B B
Approach Delay (s) 5.1 10.3 16.5
Approach LOS A B B
Intersection Summary
HCM 2000 Control Delay 10.9 HCM 2000 Level of Service B
HCM 2000 Volume to Capacity ratio 0.75
Actuated Cycle Length (s) 48.6 Sum of lost time (s) 7.5
Intersection Capacity Utilization 97.4% ICU Level of Service F
Analysis Period (min) 15
c Critical Lane Group

HCM Signalized Intersection Capacity Analysis
6: 101 NB Off Ramp & Marsh Road 11/19/2014
Existing Conditions_PM with Project Synchro 9 Report
Page 6
Movement WBL WBR NBT NBR SBL SBT
Lane Configurations
Volume (vph) 545 319 2051 0 0 733
Ideal Flow (vphpl) 1900 1900 1900 1900 1900 1900
Total Lost time (s) 4.2 3.2 4.1 4.1
Lane Util. Factor 0.97 1.00 0.95 0.95
Frt 1.00 0.85 1.00 1.00
Flt Protected 0.95 1.00 1.00 1.00
Satd. Flow (prot) 3433 1583 3539 3539
Flt Permitted 0.95 1.00 1.00 1.00
Satd. Flow (perm) 3433 1583 3539 3539
Peak-hour factor, PHF 0.87 0.93 0.97 0.92 0.92 0.95
Adj. Flow (vph) 626 343 2114 0 0 772
RTOR Reduction (vph) 0 8 0 0 0 0
Lane Group Flow (vph) 626 335 2114 0 0 772
Turn Type Prot custom NA NA
Protected Phases 8 1 8 2 6
Permitted Phases
Actuated Green, G (s) 19.7 28.9 63.8 72.0
Effective Green, g (s) 19.7 24.7 63.8 72.0
Actuated g/C Ratio 0.20 0.25 0.64 0.72
Clearance Time (s) 4.2 4.1 4.1
Vehicle Extension (s) 2.0 3.0 3.0
Lane Grp Cap (vph) 676 391 2257 2548
v/s Ratio Prot c0.18 c0.21 c0.60 0.22
v/s Ratio Perm
v/c Ratio 0.93 0.86 0.94 0.30
Uniform Delay, d1 39.4 36.0 16.3 5.0
Progression Factor 1.00 1.00 1.03 1.00
Incremental Delay, d2 18.4 16.0 5.5 0.3
Delay (s) 57.8 52.0 22.3 5.3
Level of Service E D C A
Approach Delay (s) 55.7 22.3 5.3
Approach LOS E C A
Intersection Summary
HCM 2000 Control Delay 27.3 HCM 2000 Level of Service C
HCM 2000 Volume to Capacity ratio 0.93
Actuated Cycle Length (s) 100.0 Sum of lost time (s) 11.5
Intersection Capacity Utilization 113.9% ICU Level of Service H
Analysis Period (min) 15
c Critical Lane Group
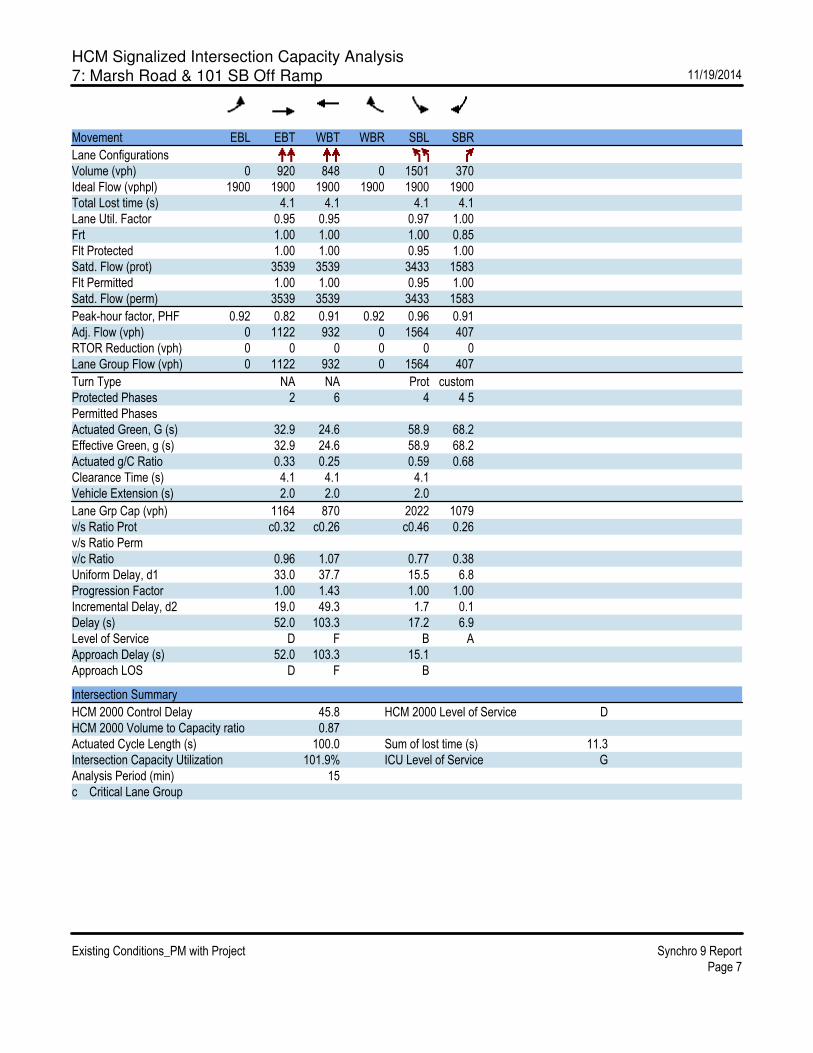
HCM Signalized Intersection Capacity Analysis
7: Marsh Road & 101 SB Off Ramp 11/19/2014
Existing Conditions_PM with Project Synchro 9 Report
Page 7
Movement EBL EBT WBT WBR SBL SBR
Lane Configurations
Volume (vph) 0 920 848 0 1501 370
Ideal Flow (vphpl) 1900 1900 1900 1900 1900 1900
Total Lost time (s) 4.1 4.1 4.1 4.1
Lane Util. Factor 0.95 0.95 0.97 1.00
Frt 1.00 1.00 1.00 0.85
Flt Protected 1.00 1.00 0.95 1.00
Satd. Flow (prot) 3539 3539 3433 1583
Flt Permitted 1.00 1.00 0.95 1.00
Satd. Flow (perm) 3539 3539 3433 1583
Peak-hour factor, PHF 0.92 0.82 0.91 0.92 0.96 0.91
Adj. Flow (vph) 0 1122 932 0 1564 407
RTOR Reduction (vph) 0 0 0 0 0 0
Lane Group Flow (vph) 0 1122 932 0 1564 407
Turn Type NA NA Prot custom
Protected Phases 2 6 4 4 5
Permitted Phases
Actuated Green, G (s) 32.9 24.6 58.9 68.2
Effective Green, g (s) 32.9 24.6 58.9 68.2
Actuated g/C Ratio 0.33 0.25 0.59 0.68
Clearance Time (s) 4.1 4.1 4.1
Vehicle Extension (s) 2.0 2.0 2.0
Lane Grp Cap (vph) 1164 870 2022 1079
v/s Ratio Prot c0.32 c0.26 c0.46 0.26
v/s Ratio Perm
v/c Ratio 0.96 1.07 0.77 0.38
Uniform Delay, d1 33.0 37.7 15.5 6.8
Progression Factor 1.00 1.43 1.00 1.00
Incremental Delay, d2 19.0 49.3 1.7 0.1
Delay (s) 52.0 103.3 17.2 6.9
Level of Service D F B A
Approach Delay (s) 52.0 103.3 15.1
Approach LOS D F B
Intersection Summary
HCM 2000 Control Delay 45.8 HCM 2000 Level of Service D
HCM 2000 Volume to Capacity ratio 0.87
Actuated Cycle Length (s) 100.0 Sum of lost time (s) 11.3
Intersection Capacity Utilization 101.9% ICU Level of Service G
Analysis Period (min) 15
c Critical Lane Group

HCM Signalized Intersection Capacity Analysis
7: Marsh Road & 101 SB Off Ramp 12/22/2014
Existing Conditions_AM with Project Mitigation Synchro 9 Report
Page 1
Movement EBL EBT WBT WBR SEL SER
Lane Configurations
Volume (vph) 0 857 1741 0 1002 377
Ideal Flow (vphpl) 1900 1900 1900 1900 1900 1900
Total Lost time (s) 4.1 4.1 4.1 4.1
Lane Util. Factor 0.95 0.95 0.97 1.00
Frt 1.00 1.00 1.00 0.85
Flt Protected 1.00 1.00 0.95 1.00
Satd. Flow (prot) 3539 3539 3433 1583
Flt Permitted 1.00 1.00 0.95 1.00
Satd. Flow (perm) 3539 3539 3433 1583
Peak-hour factor, PHF 0.92 0.89 0.95 0.92 0.94 0.84
Adj. Flow (vph) 0 963 1833 0 1066 449
RTOR Reduction (vph) 0 0 0 0 0 1
Lane Group Flow (vph) 0 963 1833 0 1066 448
Turn Type NA NA Prot custom
Protected Phases 2 6 4 4 5
Permitted Phases
Actuated Green, G (s) 43.6 35.5 28.2 37.3
Effective Green, g (s) 43.6 35.5 28.2 37.3
Actuated g/C Ratio 0.55 0.44 0.35 0.47
Clearance Time (s) 4.1 4.1 4.1
Vehicle Extension (s) 2.0 2.0 2.0
Lane Grp Cap (vph) 1928 1570 1210 738
v/s Ratio Prot 0.27 c0.52 c0.31 c0.28
v/s Ratio Perm
v/c Ratio 0.50 1.17 0.88 0.61
Uniform Delay, d1 11.4 22.2 24.3 15.9
Progression Factor 1.00 0.98 1.00 1.00
Incremental Delay, d2 0.9 80.4 7.6 1.0
Delay (s) 12.3 102.2 31.9 16.9
Level of Service B F C B
Approach Delay (s) 12.3 102.2 27.4
Approach LOS B F C
Intersection Summary
HCM 2000 Control Delay 55.8 HCM 2000 Level of Service E
HCM 2000 Volume to Capacity ratio 1.03
Actuated Cycle Length (s) 80.0 Sum of lost time (s) 11.3
Intersection Capacity Utilization 110.6% ICU Level of Service H
Analysis Period (min) 15
c Critical Lane Group