appendix f - maine
TRANSCRIPT
Appendix F (Hydrology/Hydraulic Report - 2014)
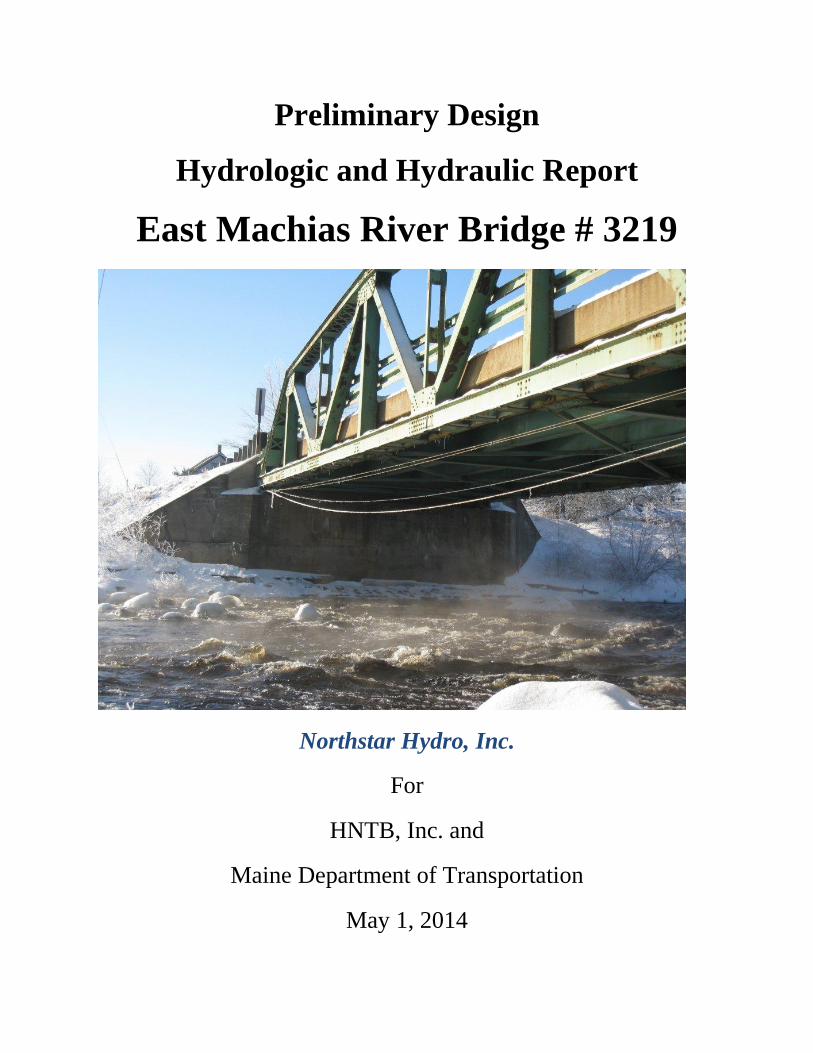
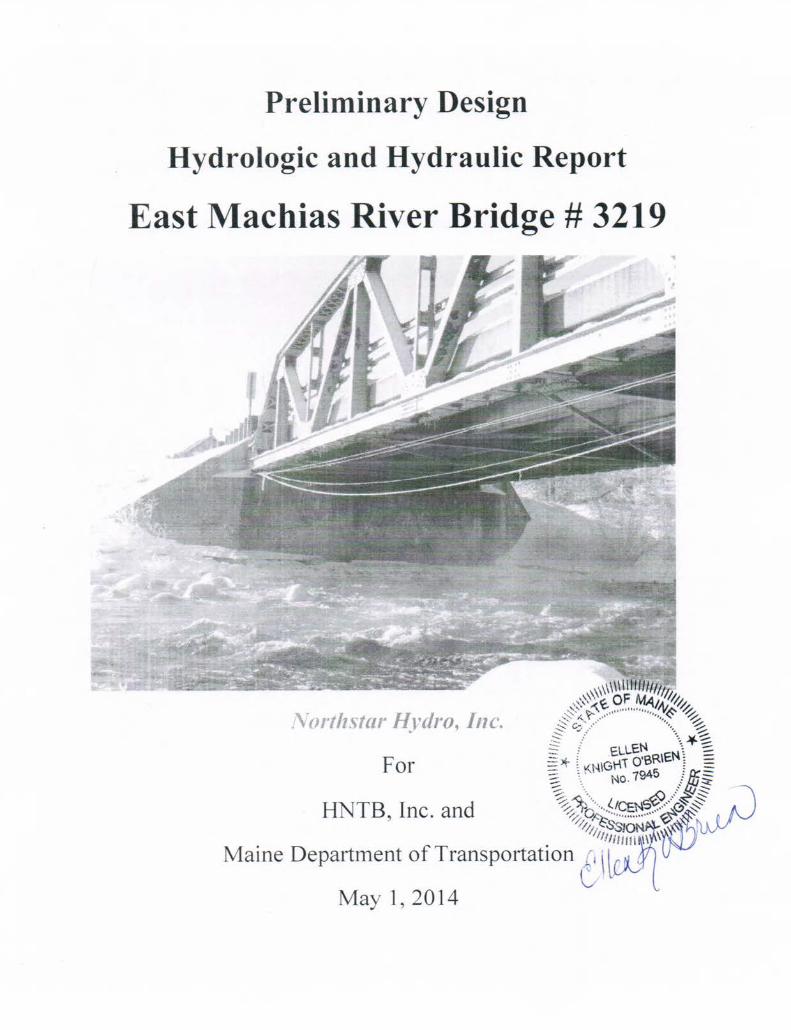
Preliminary Design
Hydrologic and Hydraulic Report
East Machias River Bridge # 3219
Northstar Hydro, Inc.
For
HNTB, Inc. and
Maine Department of Transportation
May 1, 2014
1 | E a s t M a c h i a s B r i d g e H y d r o l o g y / H y d r a u l i c s R e p o r t
Hydrologic and Hydraulic Report on East Machias River Bridge # 3219
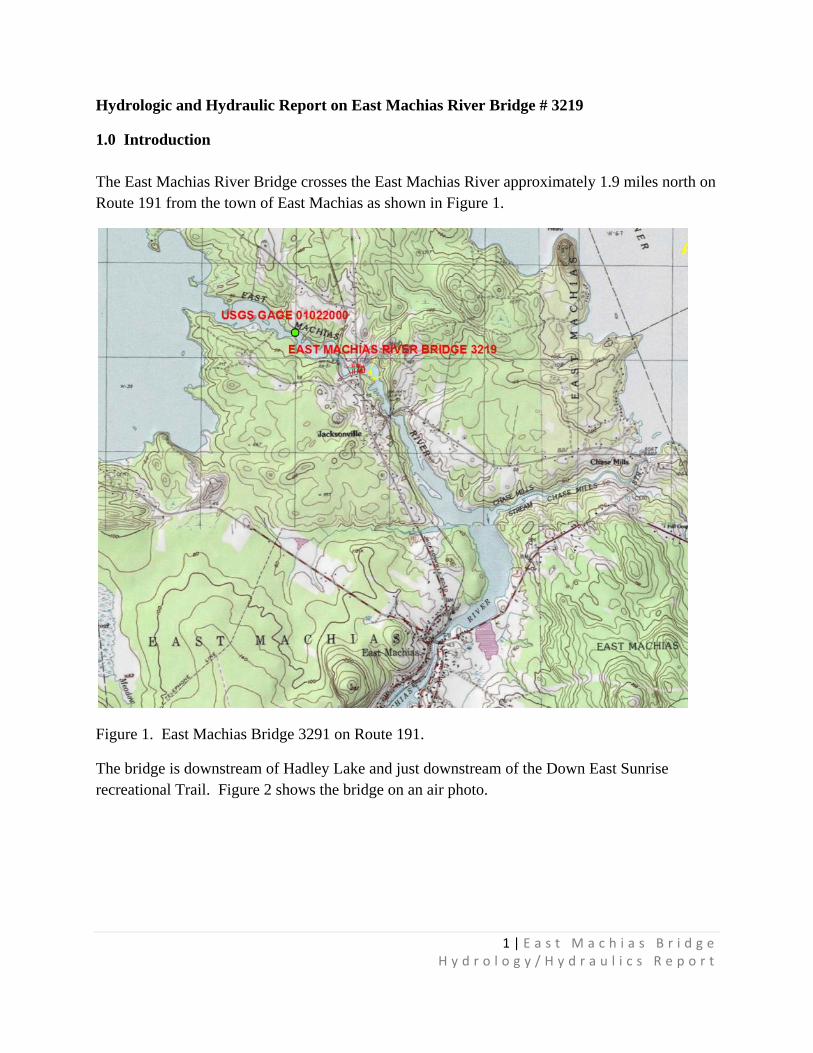
1.0 Introduction The East Machias River Bridge crosses the East Machias River approximately 1.9 miles north on Route 191 from the town of East Machias as shown in Figure 1.
Figure 1. East Machias Bridge 3291 on Route 191.
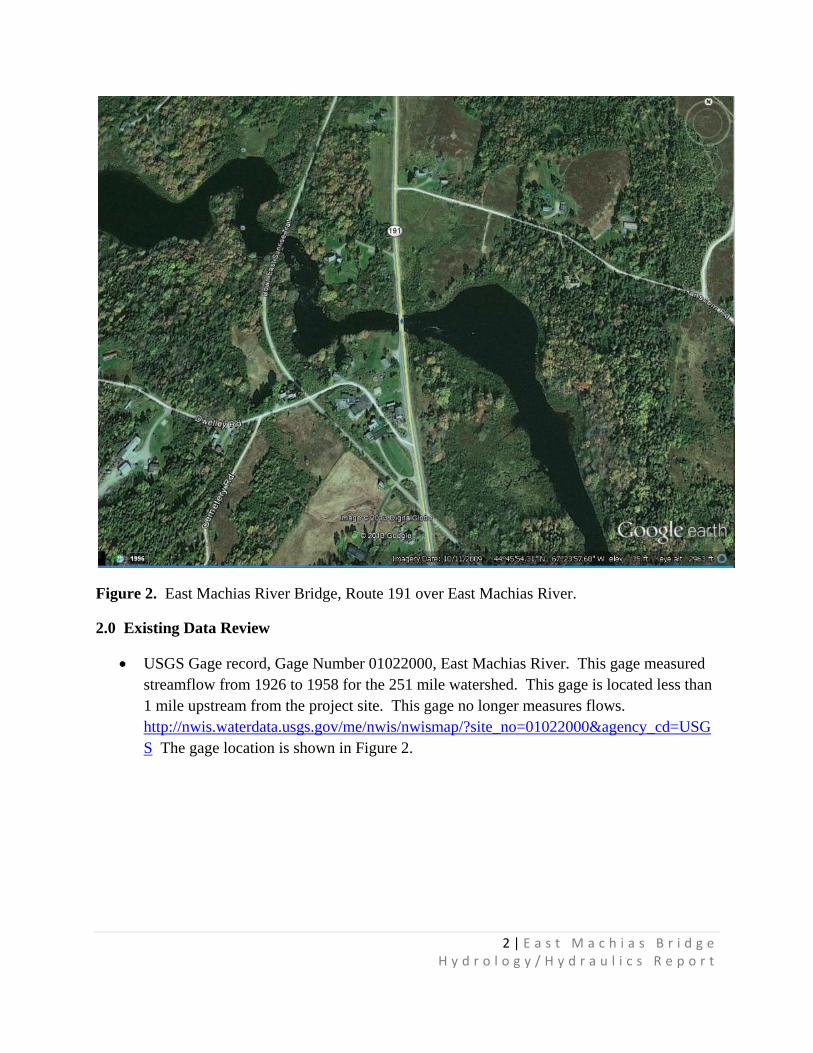
The bridge is downstream of Hadley Lake and just downstream of the Down East Sunrise recreational Trail. Figure 2 shows the bridge on an air photo.
2 | E a s t M a c h i a s B r i d g e H y d r o l o g y / H y d r a u l i c s R e p o r t
Figure 2. East Machias River Bridge, Route 191 over East Machias River.
2.0 Existing Data Review
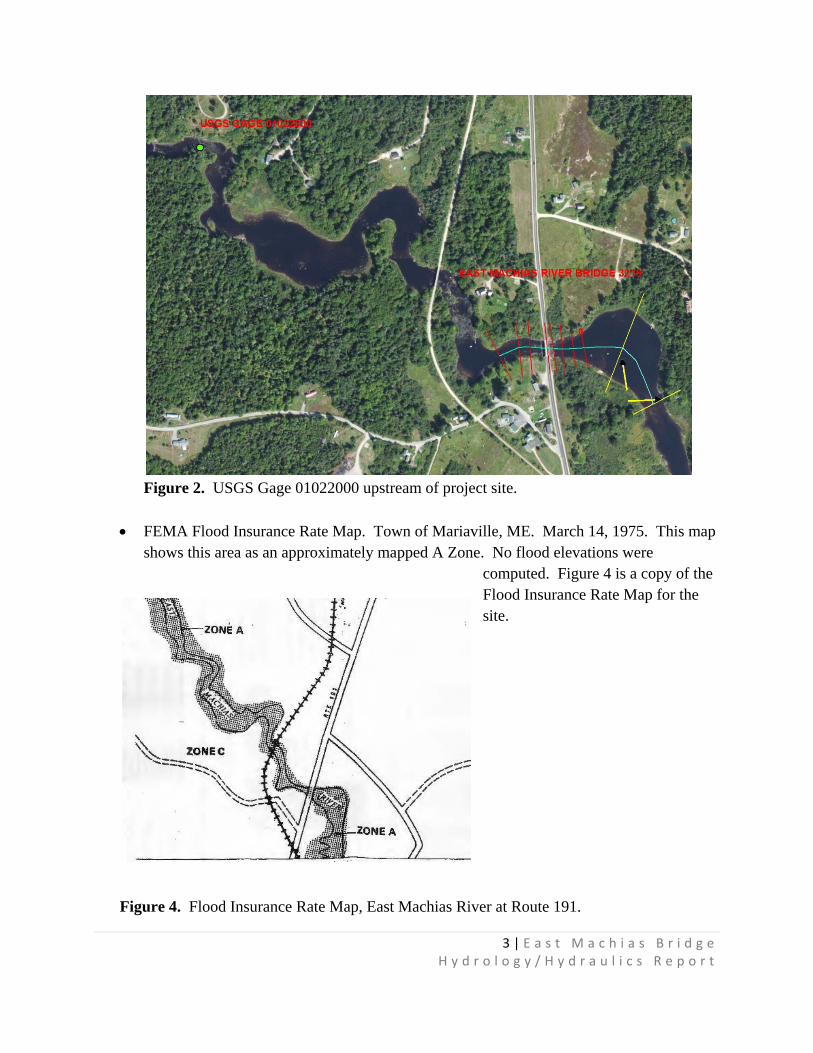
USGS Gage record, Gage Number 01022000, East Machias River. This gage measured streamflow from 1926 to 1958 for the 251 mile watershed. This gage is located less than 1 mile upstream from the project site. This gage no longer measures flows. http://nwis.waterdata.usgs.gov/me/nwis/nwismap/?site_no=01022000&agency_cd=USGS The gage location is shown in Figure 2.
3 | E a s t M a c h i a s B r i d g e H y d r o l o g y / H y d r a u l i c s R e p o r t
Figure 2. USGS Gage 01022000 upstream of project site.
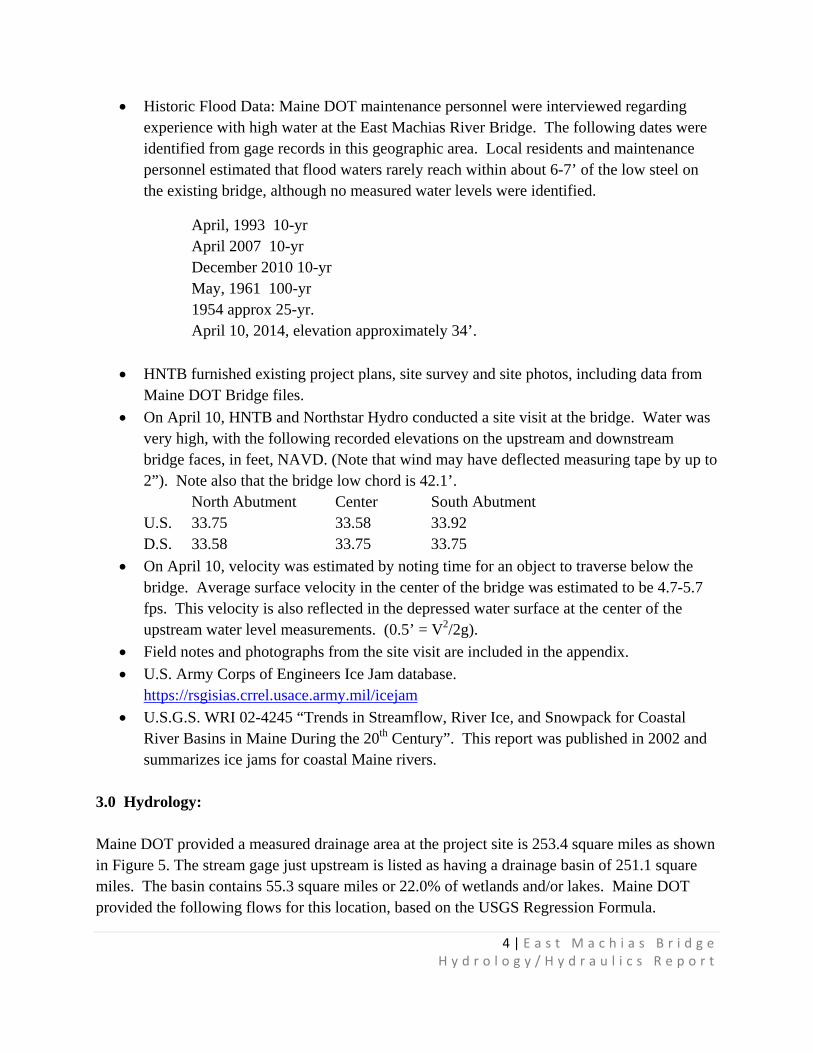
FEMA Flood Insurance Rate Map. Town of Mariaville, ME. March 14, 1975. This map shows this area as an approximately mapped A Zone. No flood elevations were
computed. Figure 4 is a copy of the Flood Insurance Rate Map for the site.
Figure 4. Flood Insurance Rate Map, East Machias River at Route 191.
4 | E a s t M a c h i a s B r i d g e H y d r o l o g y / H y d r a u l i c s R e p o r t
Historic Flood Data: Maine DOT maintenance personnel were interviewed regarding experience with high water at the East Machias River Bridge. The following dates were identified from gage records in this geographic area. Local residents and maintenance personnel estimated that flood waters rarely reach within about 6-7’ of the low steel on the existing bridge, although no measured water levels were identified.
April, 1993 10-yr April 2007 10-yr December 2010 10-yr May, 1961 100-yr 1954 approx 25-yr. April 10, 2014, elevation approximately 34’.
HNTB furnished existing project plans, site survey and site photos, including data from Maine DOT Bridge files.
On April 10, HNTB and Northstar Hydro conducted a site visit at the bridge. Water was very high, with the following recorded elevations on the upstream and downstream bridge faces, in feet, NAVD. (Note that wind may have deflected measuring tape by up to 2”). Note also that the bridge low chord is 42.1’.
North Abutment Center South Abutment U.S. 33.75 33.58 33.92 D.S. 33.58 33.75 33.75
On April 10, velocity was estimated by noting time for an object to traverse below the bridge. Average surface velocity in the center of the bridge was estimated to be 4.7-5.7 fps. This velocity is also reflected in the depressed water surface at the center of the upstream water level measurements. (0.5’ = V2/2g).
Field notes and photographs from the site visit are included in the appendix. U.S. Army Corps of Engineers Ice Jam database.
https://rsgisias.crrel.usace.army.mil/icejam U.S.G.S. WRI 02-4245 “Trends in Streamflow, River Ice, and Snowpack for Coastal
River Basins in Maine During the 20th Century”. This report was published in 2002 and summarizes ice jams for coastal Maine rivers.
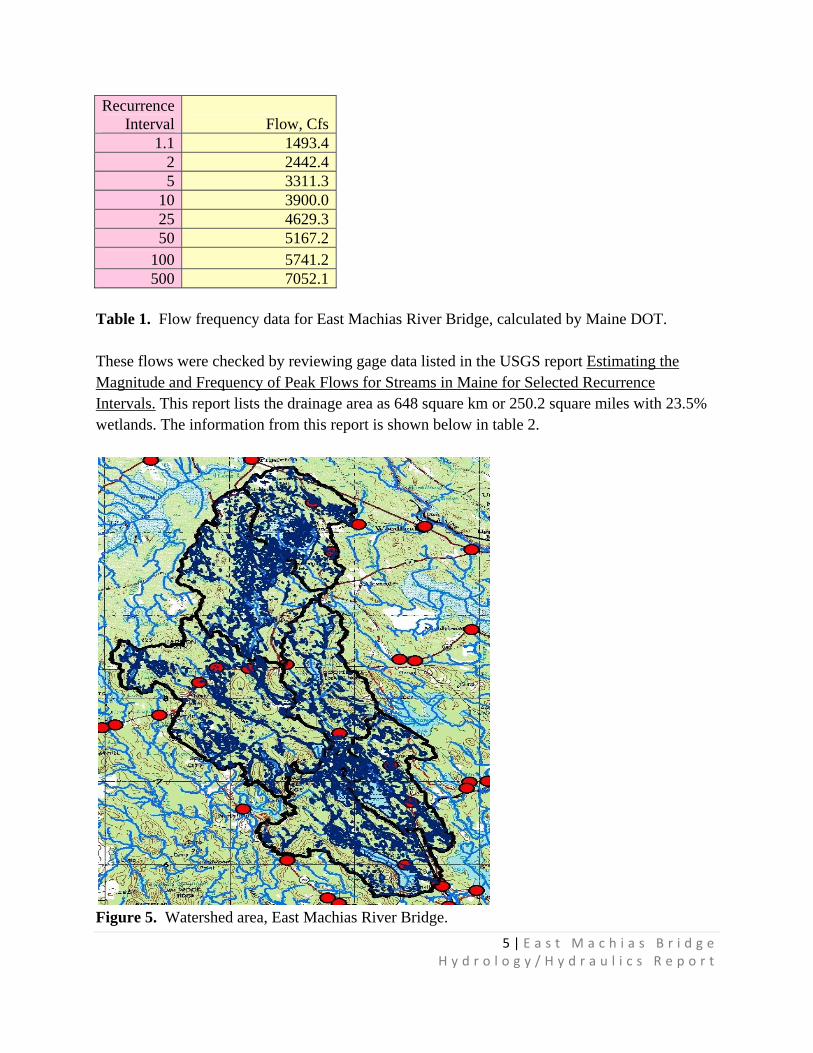
3.0 Hydrology: Maine DOT provided a measured drainage area at the project site is 253.4 square miles as shown in Figure 5. The stream gage just upstream is listed as having a drainage basin of 251.1 square miles. The basin contains 55.3 square miles or 22.0% of wetlands and/or lakes. Maine DOT provided the following flows for this location, based on the USGS Regression Formula.
5 | E a s t M a c h i a s B r i d g e H y d r o l o g y / H y d r a u l i c s R e p o r t
Recurrence Interval Flow, Cfs
1.1 1493.42 2442.45 3311.3
10 3900.025 4629.350 5167.2
100 5741.2500 7052.1
Table 1. Flow frequency data for East Machias River Bridge, calculated by Maine DOT. These flows were checked by reviewing gage data listed in the USGS report Estimating the Magnitude and Frequency of Peak Flows for Streams in Maine for Selected Recurrence Intervals. This report lists the drainage area as 648 square km or 250.2 square miles with 23.5% wetlands. The information from this report is shown below in table 2.
Figure 5. Watershed area, East Machias River Bridge.

6 | E a s t M a c h i a s B r i d g e H y d r o l o g y / H y d r a u l i c s R e p o r t
Return Interval,
Years Regression, Flow, cfs
Gage Statistics, Flow, cfs
Weighted Regression and Gage Statistics, flow, cfs
5-yr 2933.43 2587 2612.2 10-yr 3434.69 2923 2968.7 25-yr 4059.5 3332 3417 50-yr 4553.7 3636 3741.8
100-yr 5012.6 3918 4059.5 500-yr 6142.2 4554 4836.1
Table 2. Flows at East Machias River Gage, Drainage Basin 250.2, as listed in USGS publication, Estimating Magnitude of Peak Flows for Streams in Maine for Selected Recurrence Intervals. Because the Maine DOT computed flows are conservative compared to the USGS publication, the Maine DOT flows will be used for design purposes. Drainage Area, Sq. mi.
253.4 square miles
Q25 4629 cfs Design Discharge (Q50) 5170cfs Check Discharge (Q100) 5740 cfs Scour Check Discharge (Q500) 7050 cfs Ordinary High Water (Q1.1) 1493 cfs Flood of Record (>Q100) May, 1961 approx 100-yr, discharge not listed in
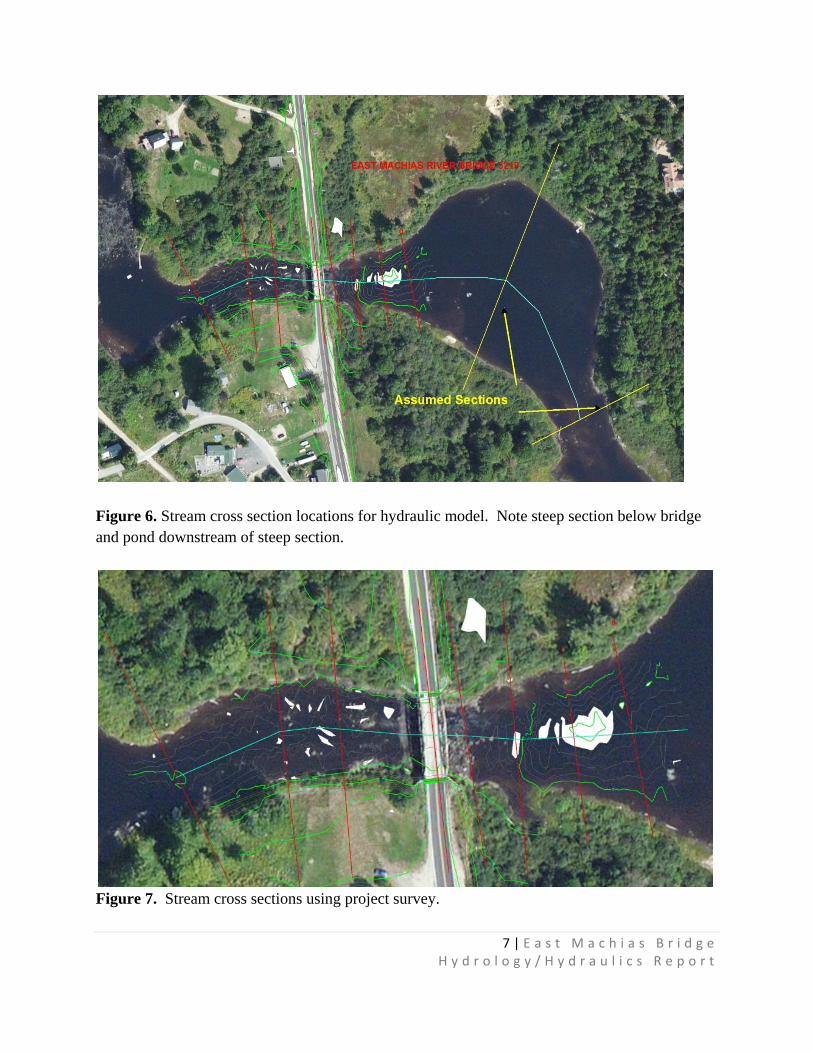
historic record. 12-15-1950, 3670 cfs Table 3. Hydrologic Data Summary, East Machias Bridge 3219 Hydraulic Analysis: Potential ice jam impacts were researched for the site. The CRREL database has no records of ice jams at this location. The 2002 U.S.G.S. Report on Streamflow, Ice and Snowpack for Coastal Maine River basins indicated the following: “No ice data were available for the Dennys and East Machias River stations because of the proximity of these stations to upstream regulation that kept the gaged river reach free of ice”. Gage number 01022000 is just upstream of the bridge. Therefore, hydraulic analyses did not assume ice jams at this location. Flood elevations and flow velocities were analyzed at the bridge using U.S. Army Corps of Engineers model HECRAS. Project survey was used to plot stream cross sections. Overbank elevations were also taken from the U.S.G. S. topographic map of the project site. Figures 6 and 7 show model cross sections. Sections in red are based primarily on project survey. Sections in yellow are assumed elevations based on best judgment. Project contours are shown in each figure. Where no project survey was available, model data is based on best judgment.
7 | E a s t M a c h i a s B r i d g e H y d r o l o g y / H y d r a u l i c s R e p o r t
Figure 6. Stream cross section locations for hydraulic model. Note steep section below bridge and pond downstream of steep section.
Figure 7. Stream cross sections using project survey.
8 | E a s t M a c h i a s B r i d g e H y d r o l o g y / H y d r a u l i c s R e p o r t
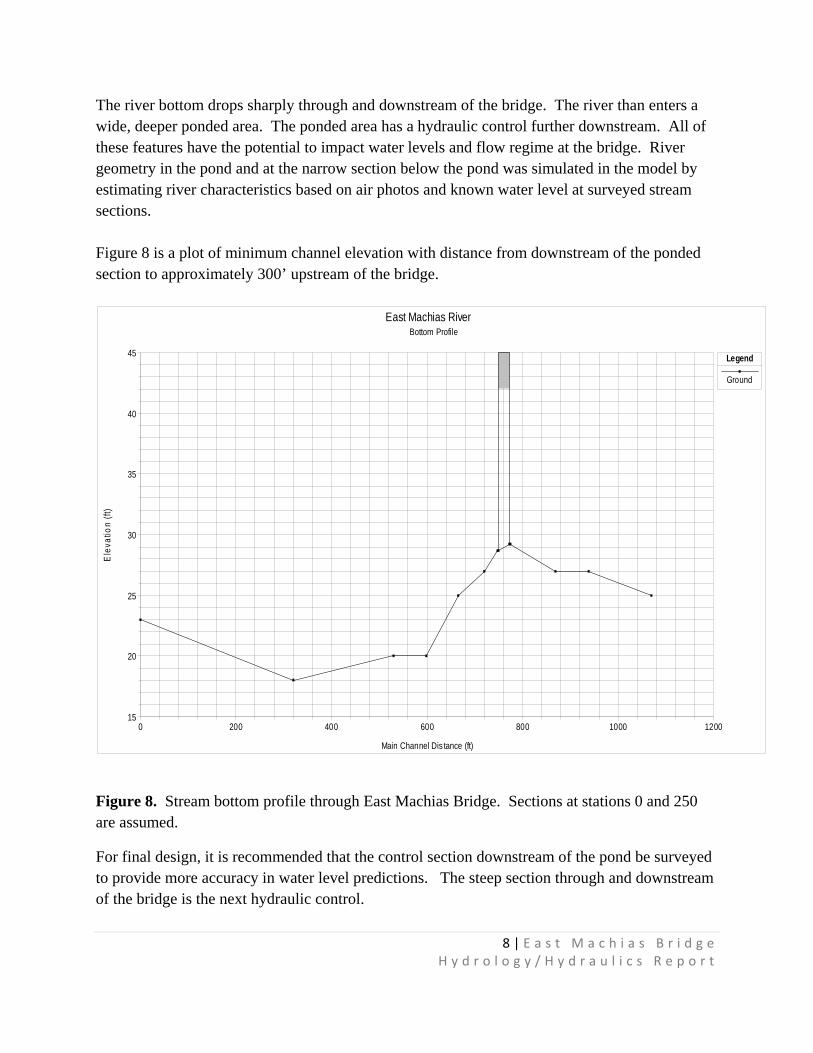
The river bottom drops sharply through and downstream of the bridge. The river than enters a wide, deeper ponded area. The ponded area has a hydraulic control further downstream. All of these features have the potential to impact water levels and flow regime at the bridge. River geometry in the pond and at the narrow section below the pond was simulated in the model by estimating river characteristics based on air photos and known water level at surveyed stream sections. Figure 8 is a plot of minimum channel elevation with distance from downstream of the ponded section to approximately 300’ upstream of the bridge.
Figure 8. Stream bottom profile through East Machias Bridge. Sections at stations 0 and 250 are assumed.
For final design, it is recommended that the control section downstream of the pond be surveyed to provide more accuracy in water level predictions. The steep section through and downstream of the bridge is the next hydraulic control.
0 200 400 600 800 1000 120015
20
25
30
35
40
45
East Machias River Bottom Profile
Main Channel Dis tance (ft)
Ele
vatio
n (ft
)
Legend
Ground

9 | E a s t M a c h i a s B r i d g e H y d r o l o g y / H y d r a u l i c s R e p o r t
The HECRAS model was run in “mixed flow” mode, allowing calculation of water surface elevations for both sub-critical and super-critical flow. The model was started downstream at the section below the pond, with an assumed energy grade line based on estimated channel profile. Because the controlling sections downstream have not been surveyed, a sensitivity analysis was run to assist in selecting an energy slope for calculation of “normal depth” at the control section at the outlet to the pond. Estimating a drop of 0.25’ to 1.5’ in 500’ or slopes of 0.0005-0.003, results in the hydraulic control being at this steep section. If the energy slope is found to be less than 0.0005, then hydraulic control occurs below the pond and flood levels at the bridge are calculated higher.
For the preliminary design hydraulic model, a slope of 0.0005 was assumed for the section at the pond outlet.
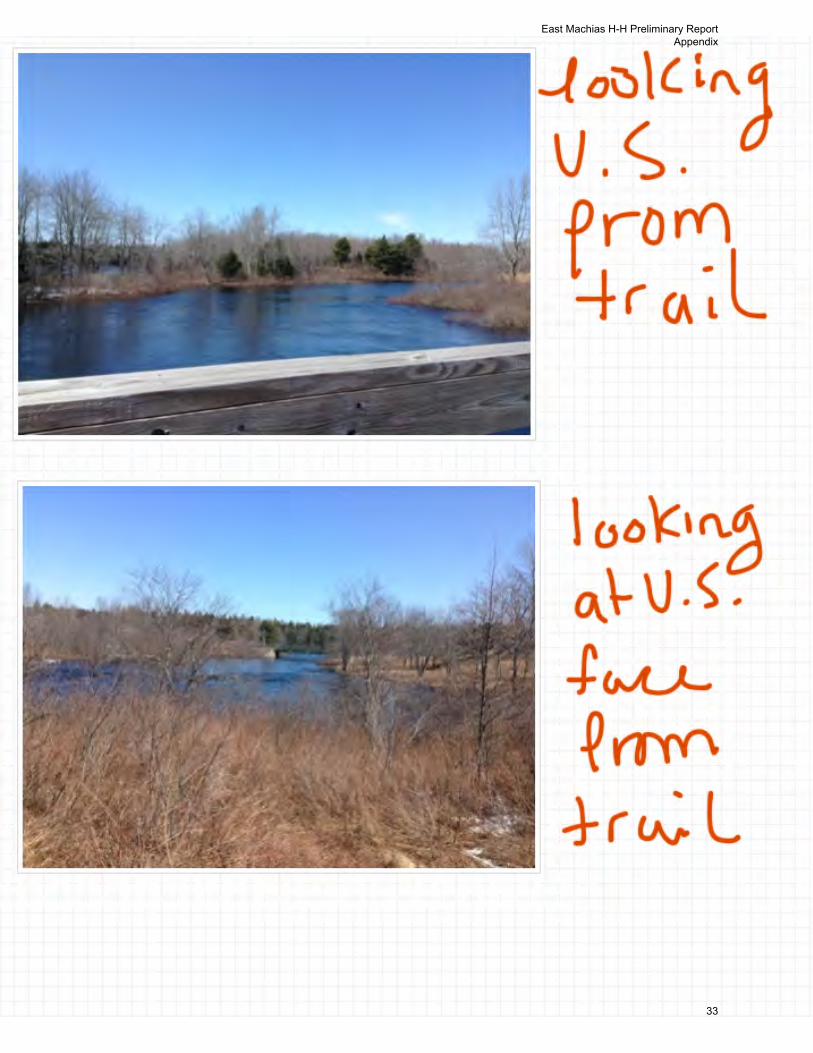
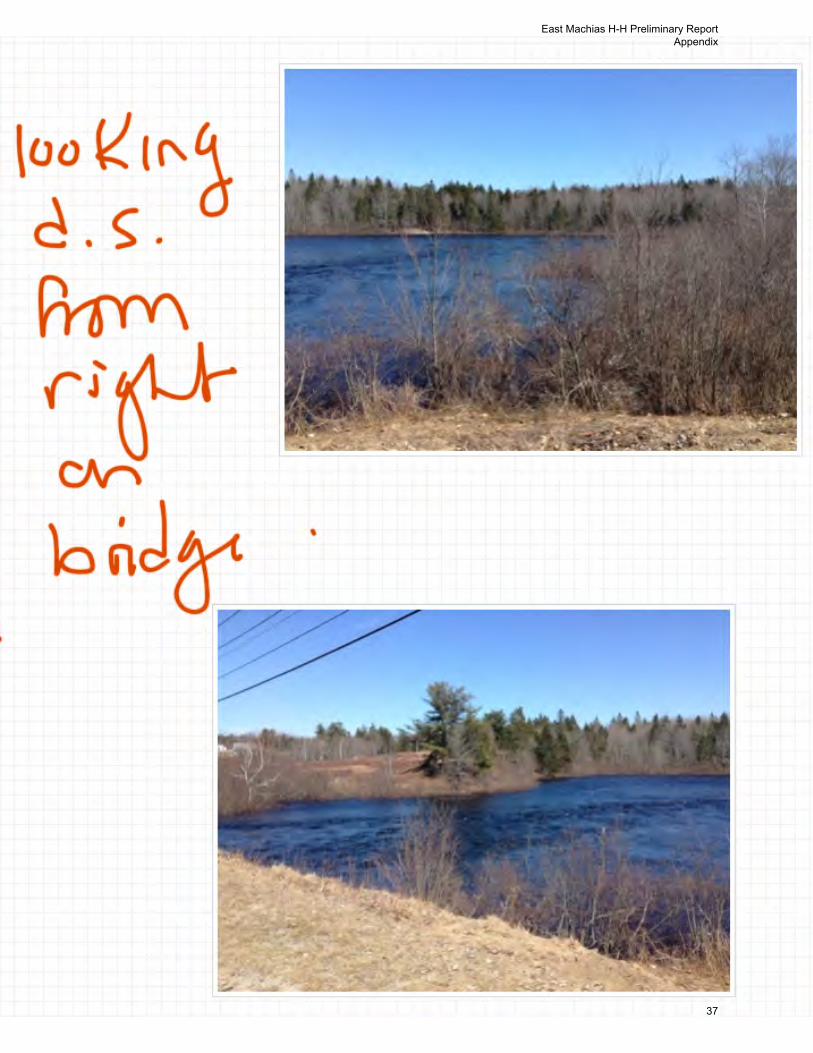
Site visits were conducted in February and April of 2014. The February visit (by HNTB) allowed observation of low-flows, whereas the April visit was conducted during very high snowmelt runoff. Site visits verified the surveyed contours showing a steep section downstream of the bridge that flows into the ponded area.
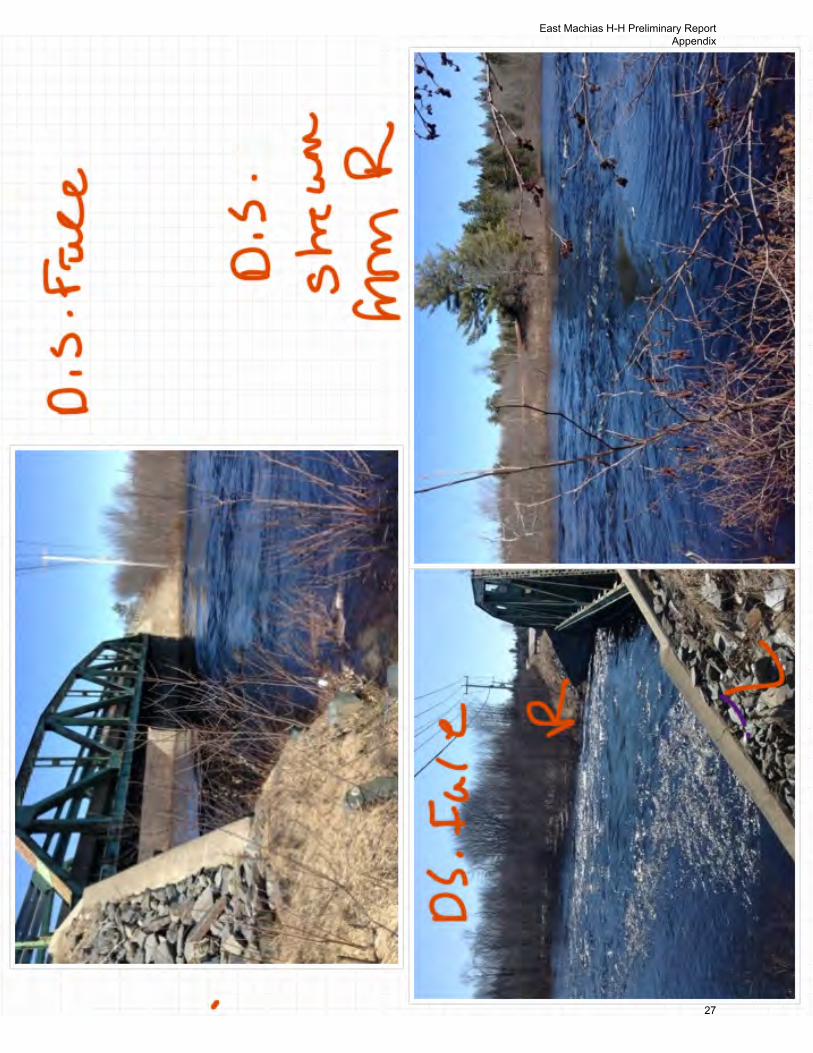
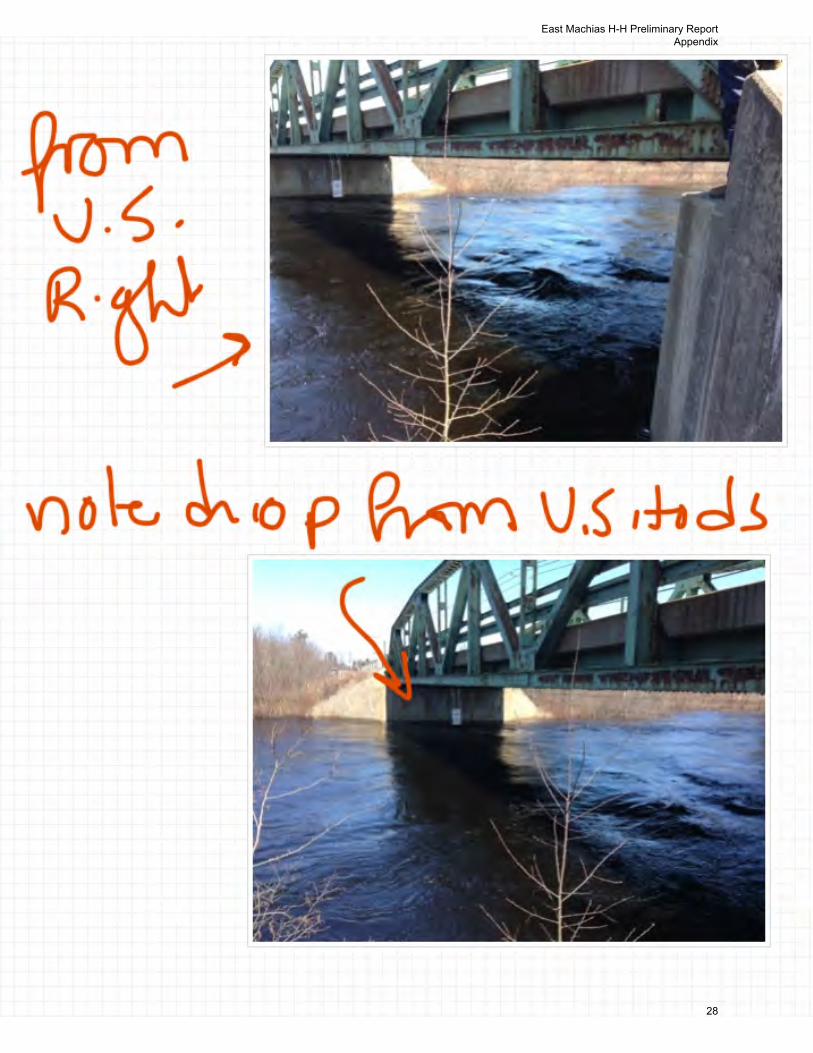
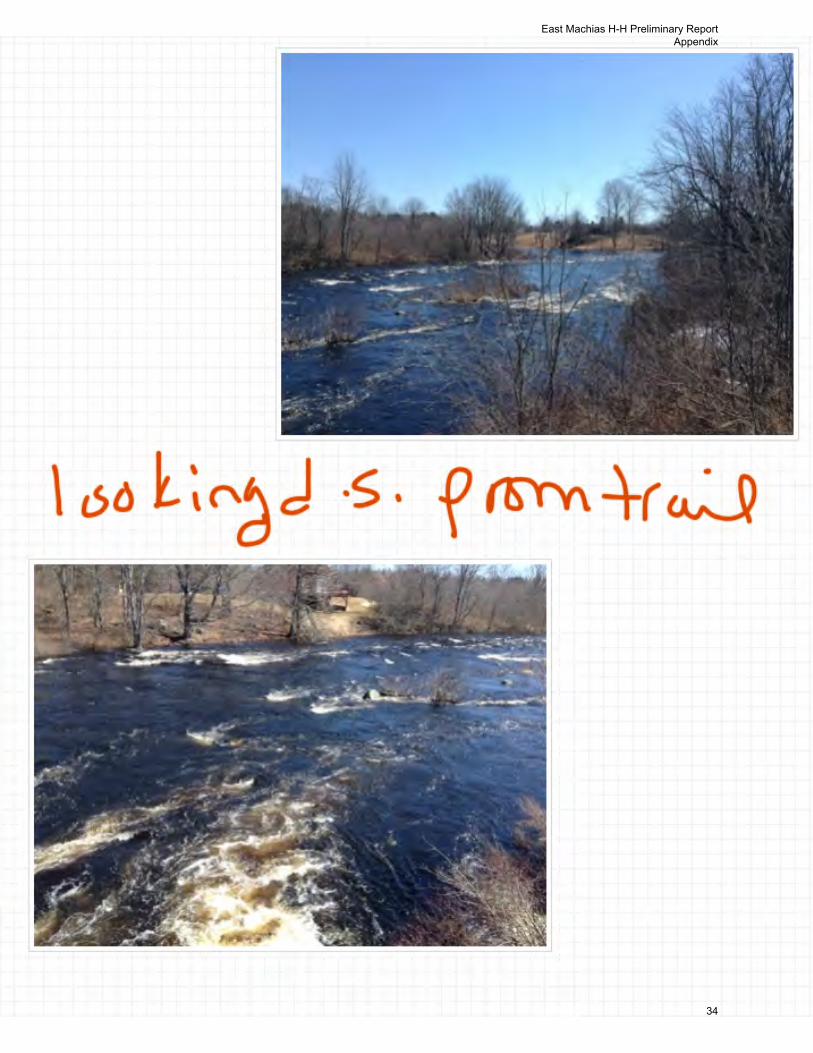
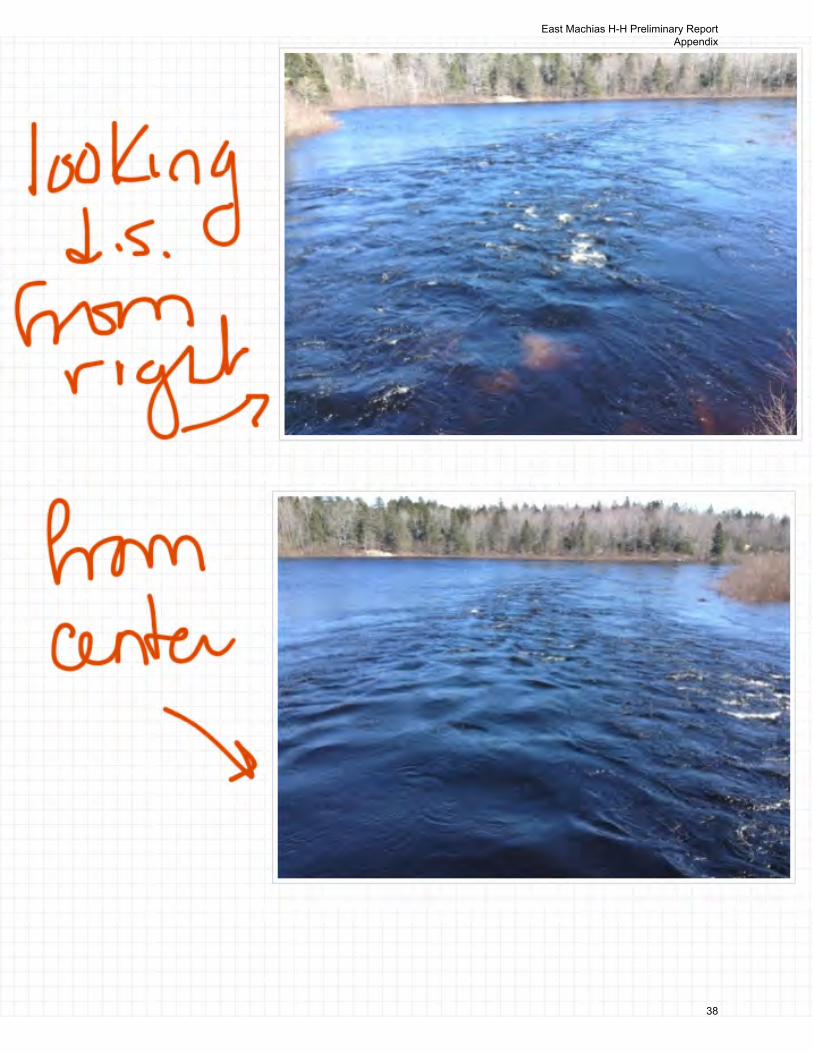
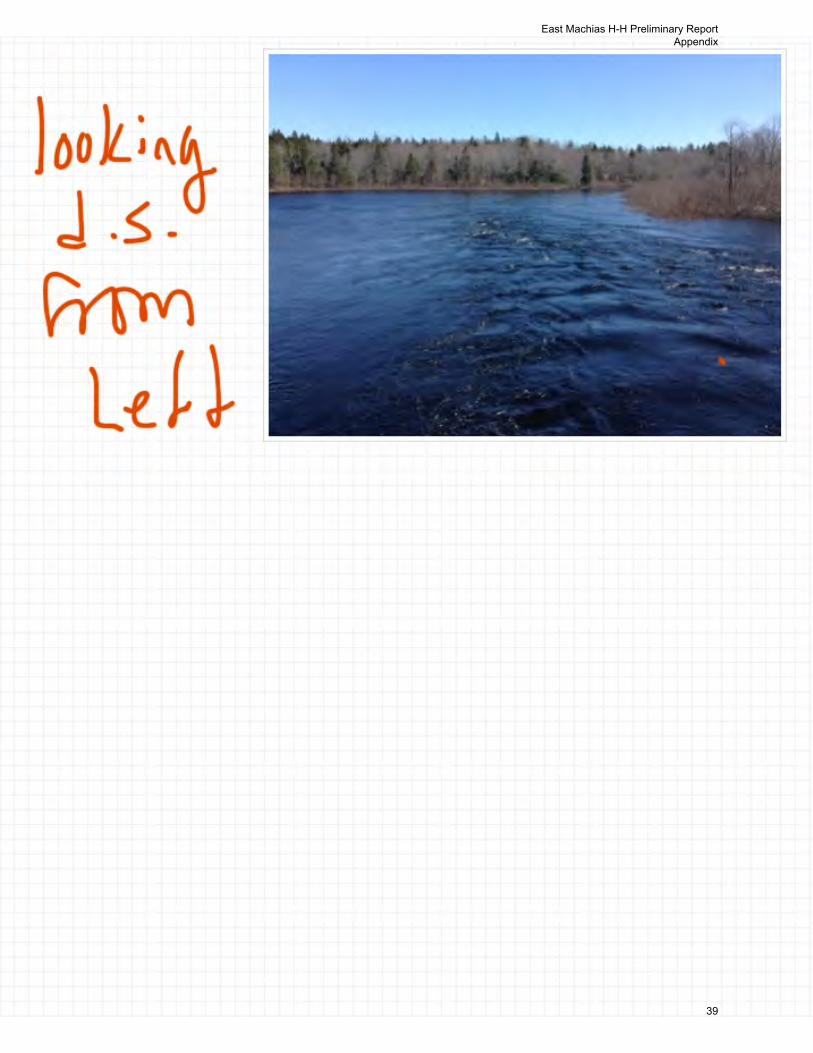
Calculated water surface profiles (see appendix) show that flow likely enters a super-critical flow segment below or near the bridge, and passes through a hydraulic jump back to sub-critical as it enters the pond. The bridge section is shallow compared with much of the river channel and the bottom profile is steep through and below the bridge resulting in the flow transition. A great deal of energy is released at the site of a hydraulic jump and ongoing channel erosion can be expected where it occurs. The pond at the base is typical of a scour hole below such a flow transition. Note that this transition is not necessarily caused by the bridge contraction, but rather by the steep natural channel at and below the bridge.
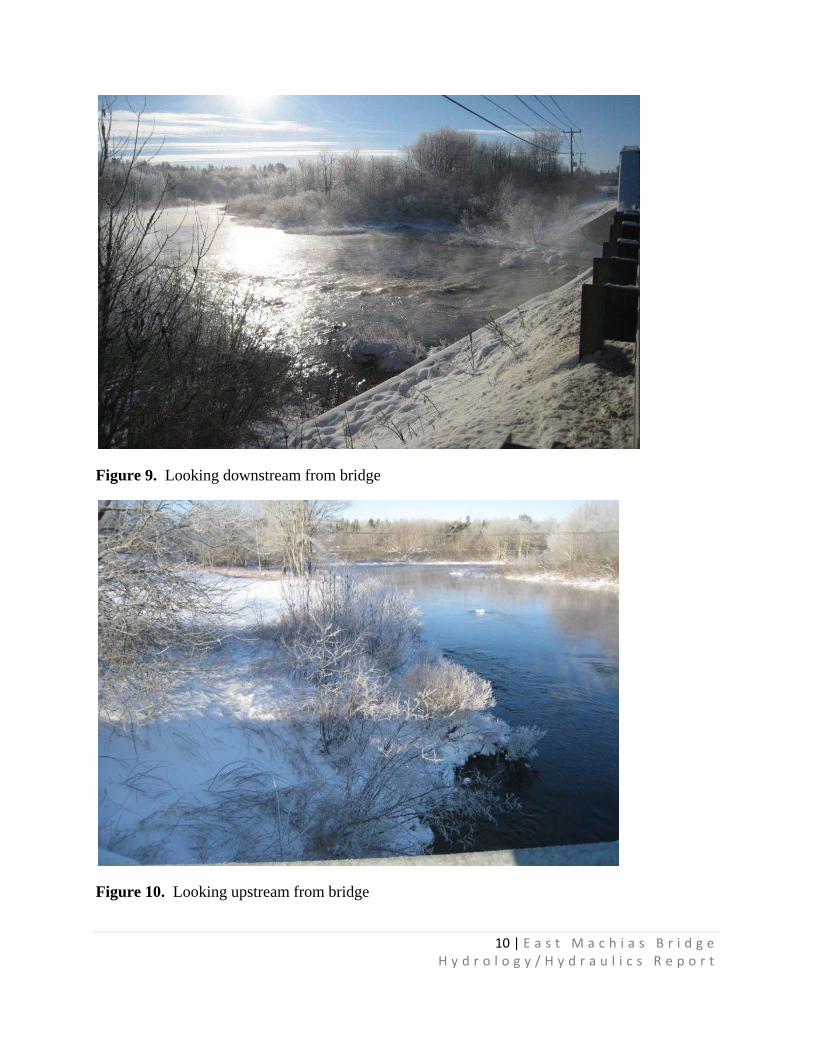
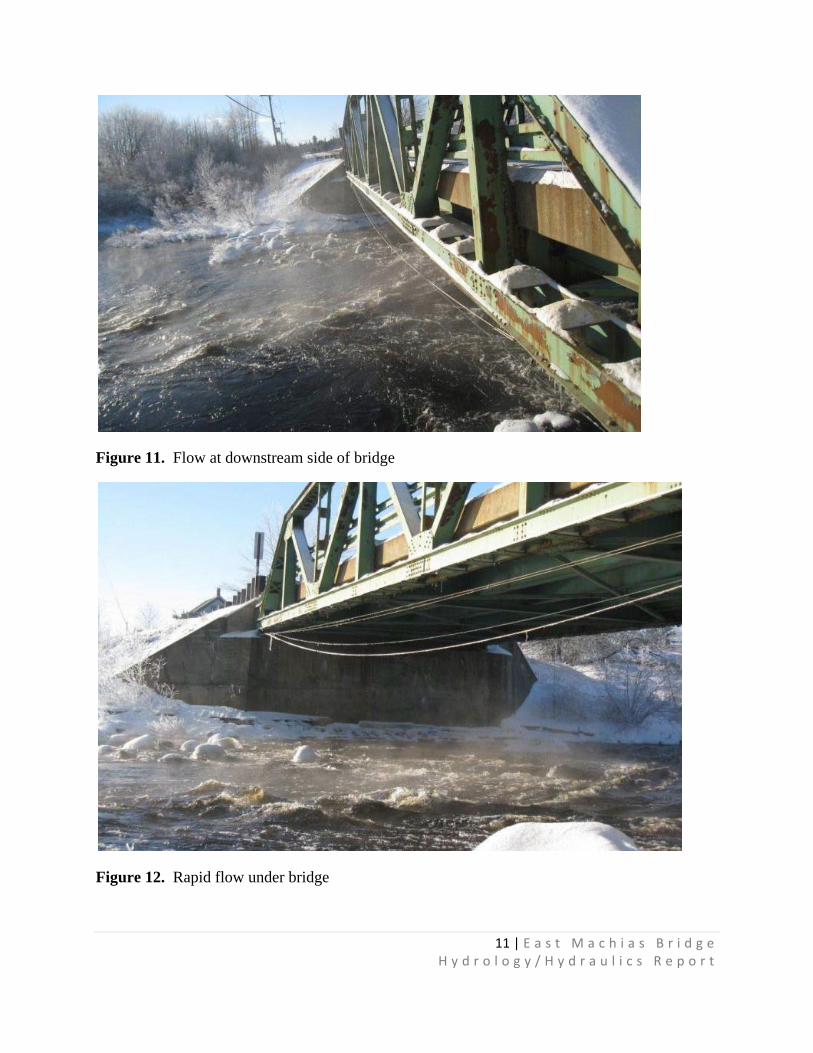
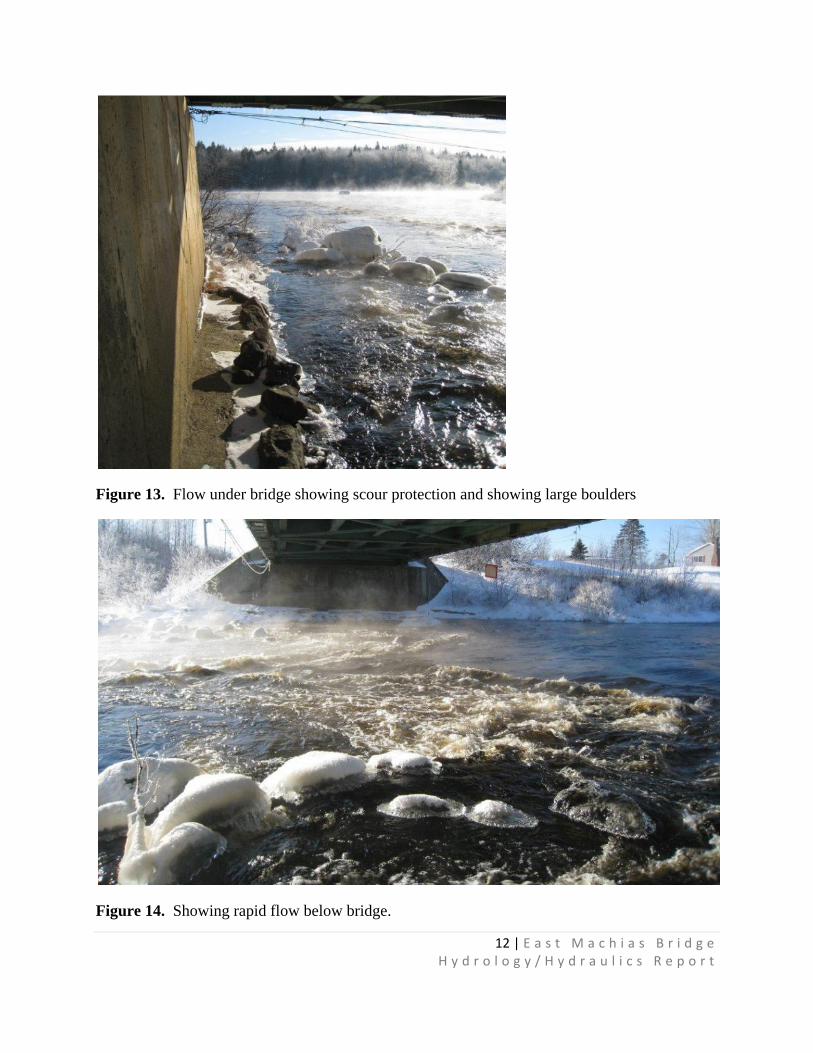
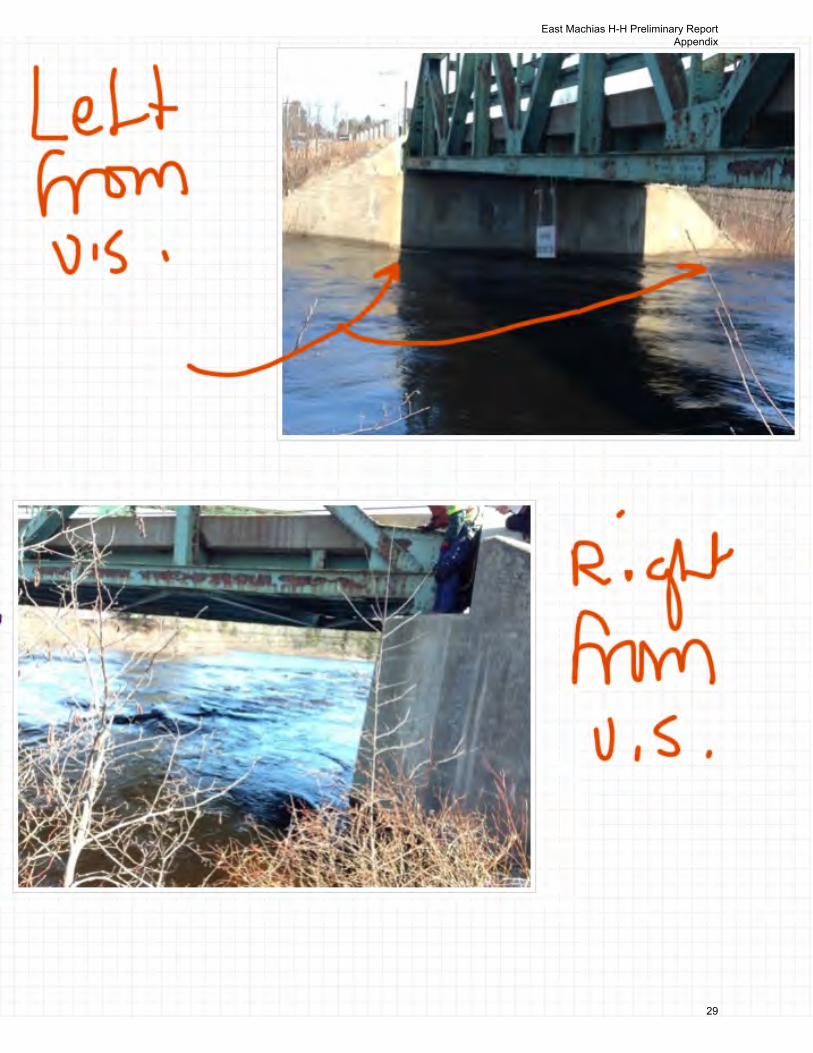
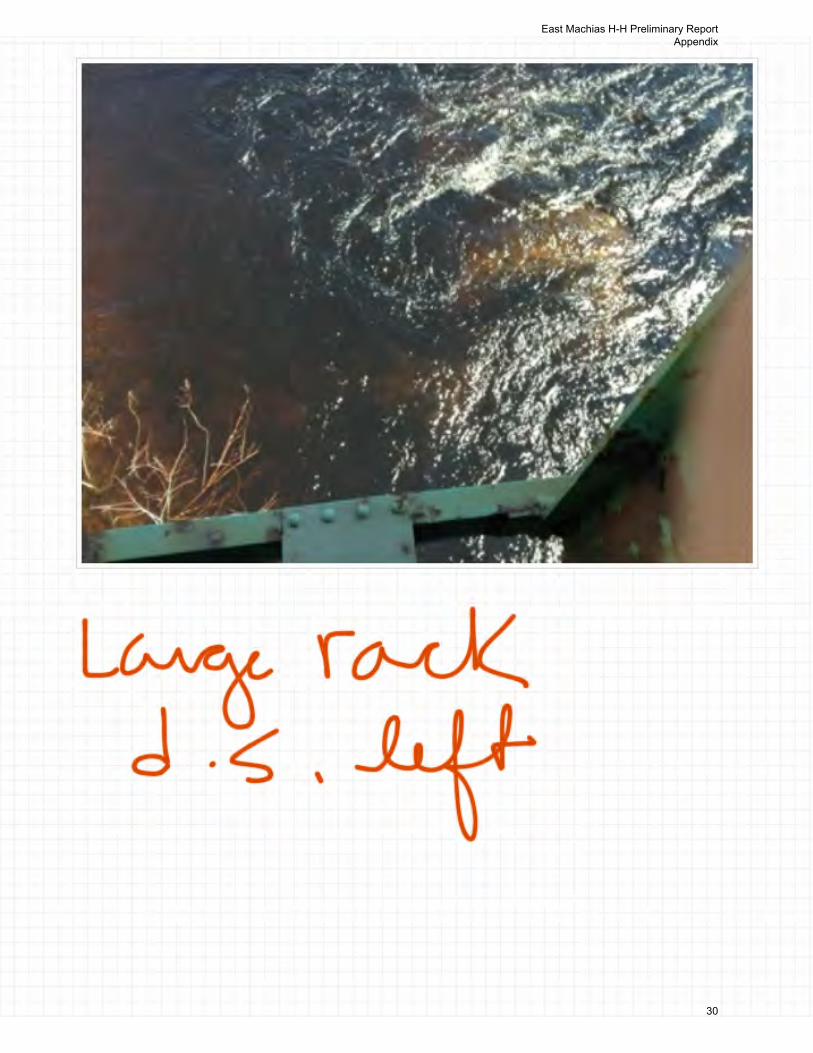
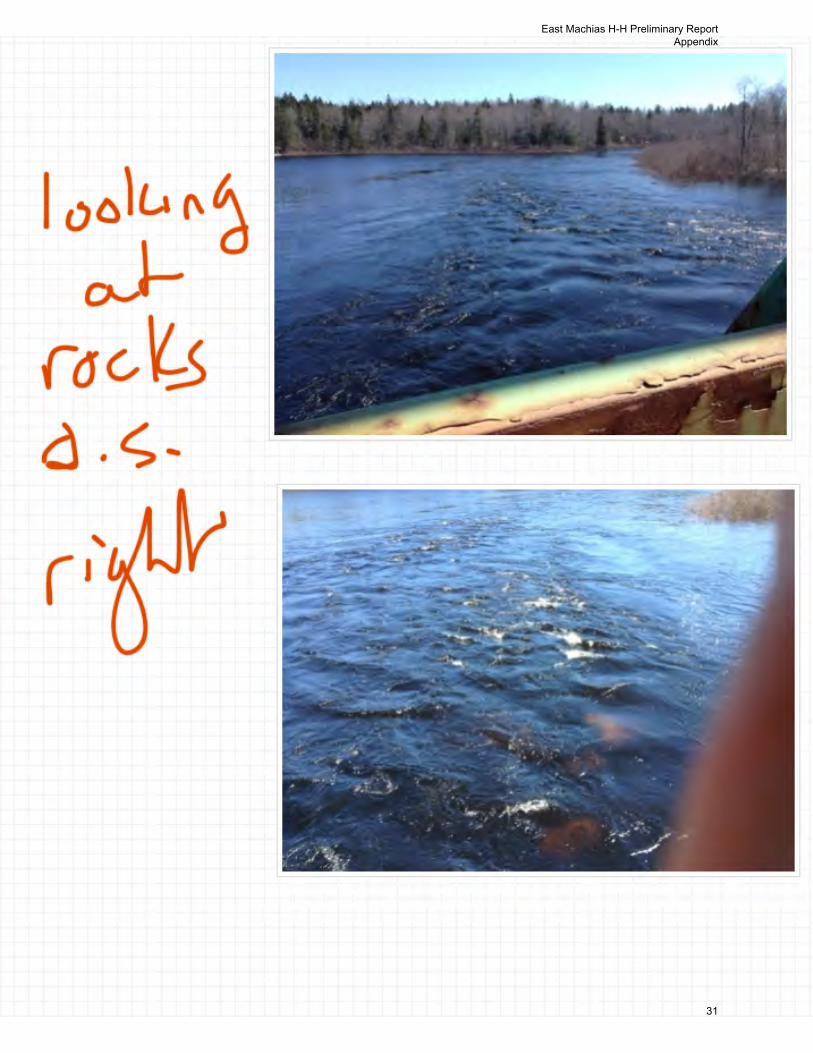
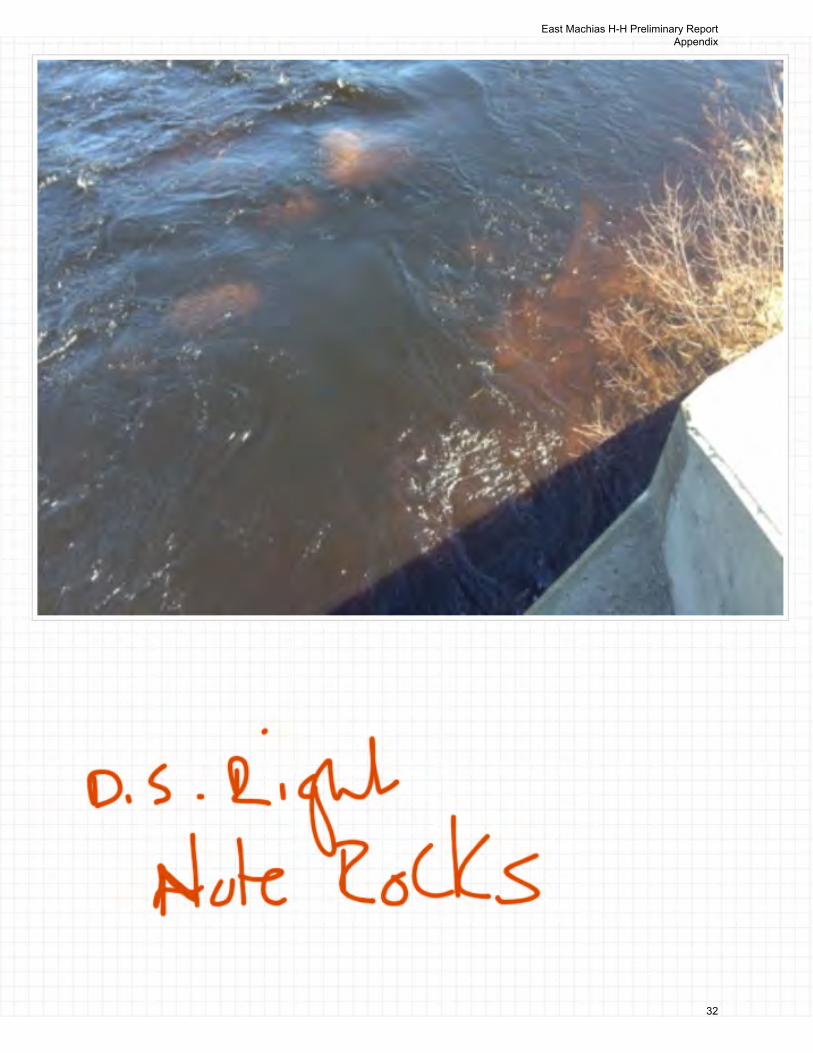
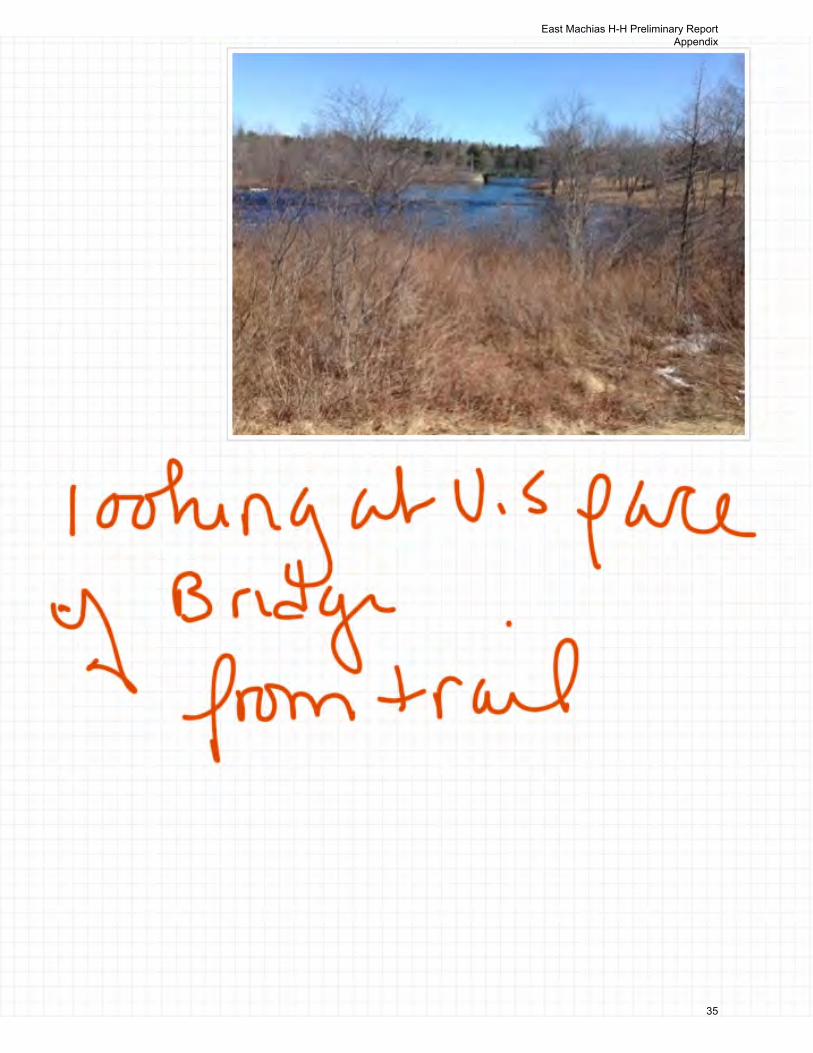
Site photos verify rapid flow during normal flow conditions as shown in the following photos.
10 | E a s t M a c h i a s B r i d g e H y d r o l o g y / H y d r a u l i c s R e p o r t
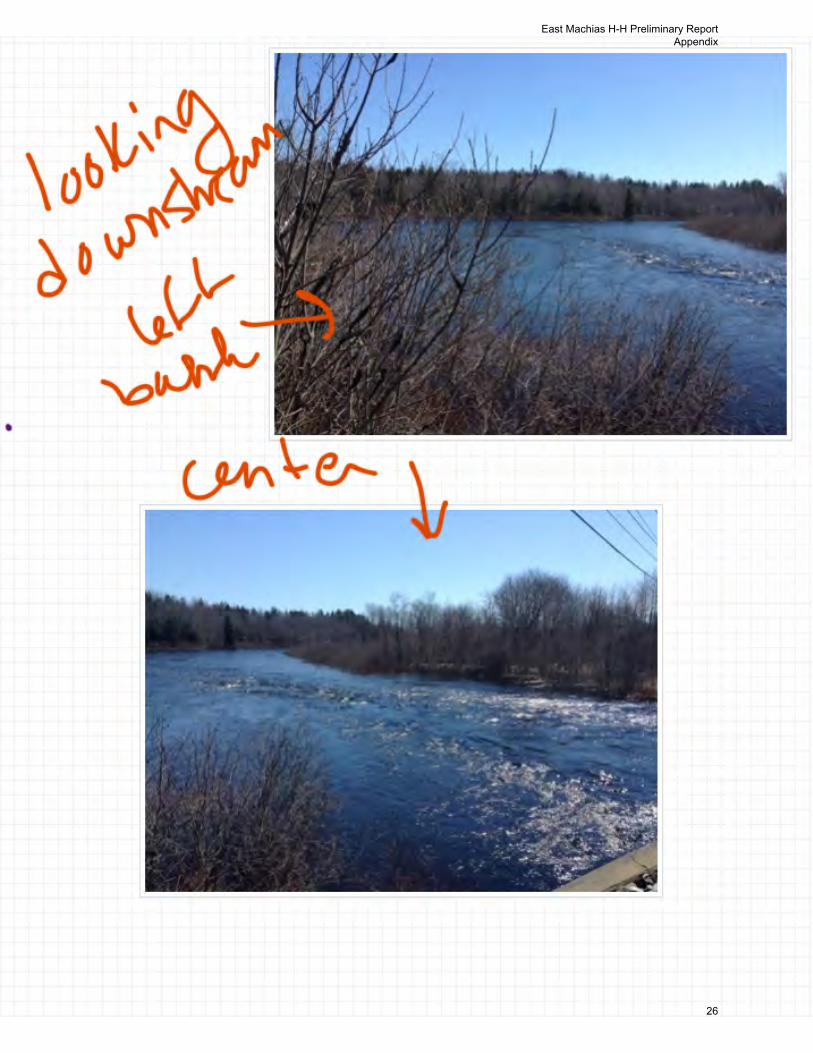
Figure 9. Looking downstream from bridge
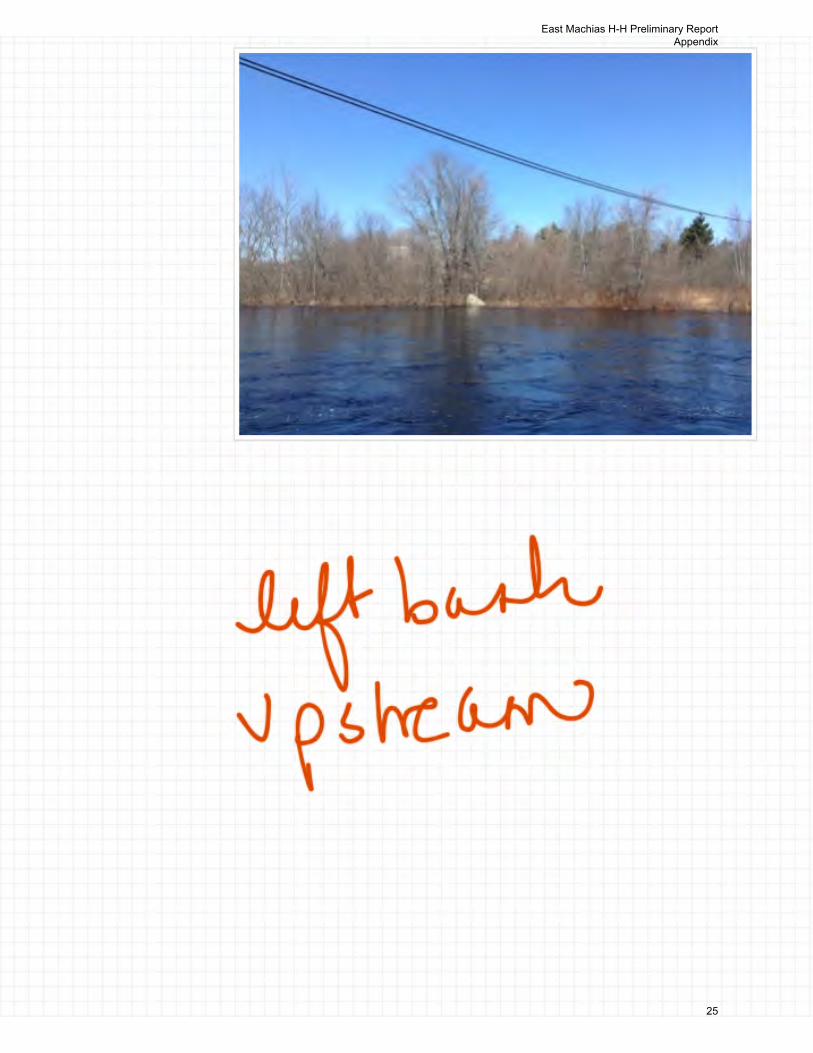
Figure 10. Looking upstream from bridge
11 | E a s t M a c h i a s B r i d g e H y d r o l o g y / H y d r a u l i c s R e p o r t
Figure 11. Flow at downstream side of bridge
Figure 12. Rapid flow under bridge
12 | E a s t M a c h i a s B r i d g e H y d r o l o g y / H y d r a u l i c s R e p o r t
Figure 13. Flow under bridge showing scour protection and showing large boulders
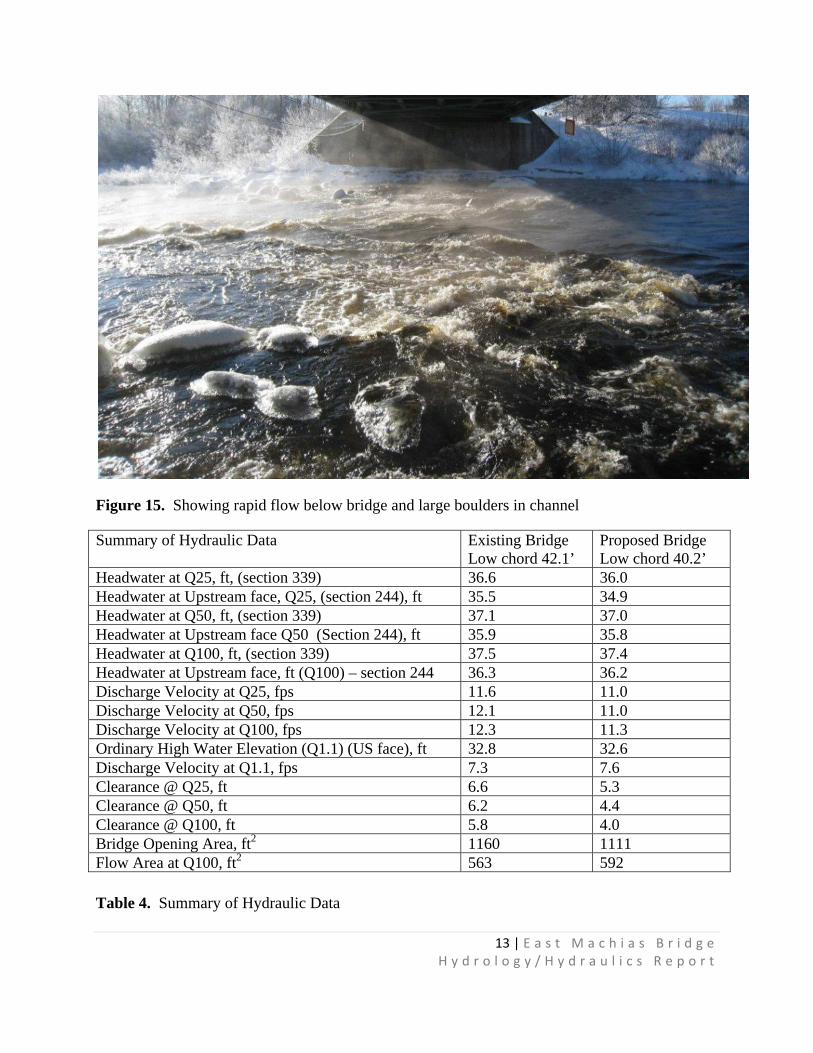
Figure 14. Showing rapid flow below bridge.
13 | E a s t M a c h i a s B r i d g e H y d r o l o g y / H y d r a u l i c s R e p o r t
Figure 15. Showing rapid flow below bridge and large boulders in channel
Summary of Hydraulic Data Existing Bridge Low chord 42.1’
Proposed Bridge Low chord 40.2’
Headwater at Q25, ft, (section 339) 36.6 36.0 Headwater at Upstream face, Q25, (section 244), ft 35.5 34.9 Headwater at Q50, ft, (section 339) 37.1 37.0 Headwater at Upstream face Q50 (Section 244), ft 35.9 35.8 Headwater at Q100, ft, (section 339) 37.5 37.4 Headwater at Upstream face, ft (Q100) – section 244 36.3 36.2 Discharge Velocity at Q25, fps 11.6 11.0 Discharge Velocity at Q50, fps 12.1 11.0 Discharge Velocity at Q100, fps 12.3 11.3 Ordinary High Water Elevation (Q1.1) (US face), ft 32.8 32.6 Discharge Velocity at Q1.1, fps 7.3 7.6 Clearance @ Q25, ft 6.6 5.3 Clearance @ Q50, ft 6.2 4.4 Clearance @ Q100, ft 5.8 4.0 Bridge Opening Area, ft2 1160 1111 Flow Area at Q100, ft2 563 592 Table 4. Summary of Hydraulic Data

14 | E a s t M a c h i a s B r i d g e H y d r o l o g y / H y d r a u l i c s R e p o r t
4.0 Scour Analysis
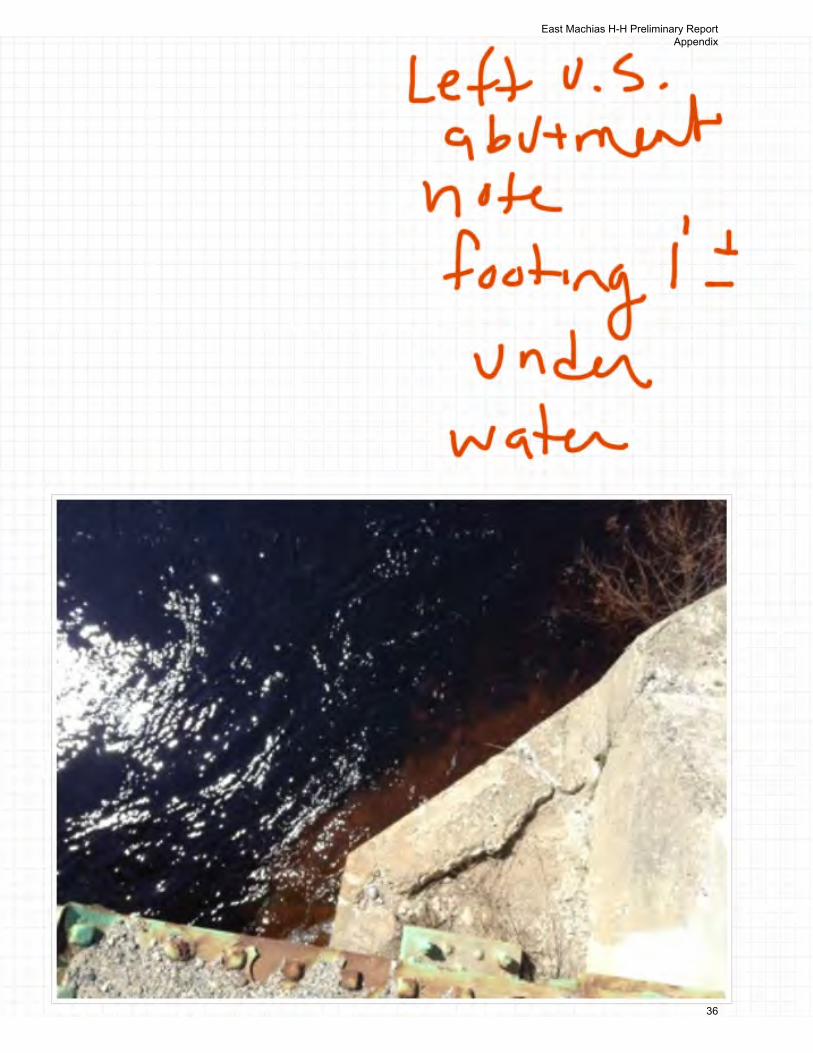
The East Machias Bridge was evaluated for potential scour. No detailed scour reports were found in Maine DOT Bridge files. The only references to scour that were found include a photo showing “scour repair to footing” and the bridge rating for item 113 of 8, “stable above footing”. Site conditions indicate the following relative to scour:
The bridge is located in a narrow segment of the river and causes a slight contraction in the channel
The bridge appears to be located on a high point in the bottom profile, causing higher velocities and possibly indicating high bedrock
The bridge may have a “scour hole” downstream, but this appears to be a result of the natural stream profile rather than the bridge
The channel appears to have quite a bit of natural armoring with large rocks and boulders covering much of the stream bottom through the bridge
The steep slope below the bridge indicates the potential for a hydraulic jump and associated energy losses below the bridge and above the ponded area.
No field data was collected relative to scour holes, footing elevations relative to bottom elevations or other field data that may indicate local scour.
The original bridge plans do not show bed elevations at the bridge. No data was located to evaluate long term potential for aggredation/degradation.
The bridge segment of channel appears to be well-incised and stable with vegetated banks and no recent bank scarring observed. The scour POA did not discuss potential for channel migration as an issue.
No data was found relative to long term aggradation/degradation of the river bed. The bed at the bridge is higher than either up- or down-stream bed elevations, indicating an armored or bedrock base at the bridge . The bed is armored with large boulders. According to original bridge plans and surveyed bed elevations, abutment footings are still covered by approximately 3’ of overburden. For these reasons, no long term bed degradation was considered for this site. Research should continue for final design.
Based on data gathered for the bridge replacement study, bed elevation is 32-33’ at both abutments, and appears to drop to 28.5-29’ in the center of the channel. Potential scour was computed for the new bridge. Geotechnical data for the bridge was not provided, so D50 was assumed. Abutment and contraction scour were computed. Note that abutment scour computations do not take scour protection into account, so these values are conservative. Abutments are assumed to be vertical and aligned with flow for purposes of scour computations.
15 | E a s t M a c h i a s B r i d g e H y d r o l o g y / H y d r a u l i c s R e p o r t
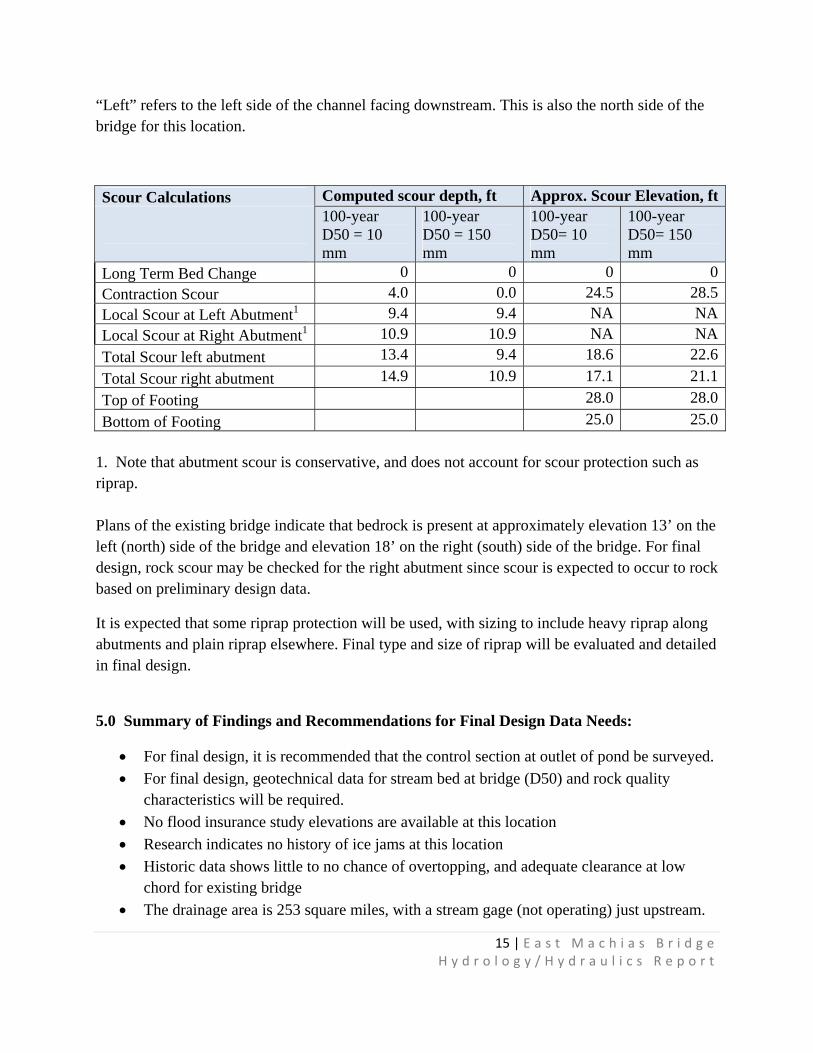
“Left” refers to the left side of the channel facing downstream. This is also the north side of the bridge for this location.
Scour Calculations Computed scour depth, ft Approx. Scour Elevation, ft
100-year D50 = 10 mm
100-year D50 = 150 mm
100-year D50= 10 mm
100-year D50= 150 mm
Long Term Bed Change 0 0 0 0Contraction Scour 4.0 0.0 24.5 28.5Local Scour at Left Abutment1 9.4 9.4 NA NALocal Scour at Right Abutment1 10.9 10.9 NA NATotal Scour left abutment 13.4 9.4 18.6 22.6Total Scour right abutment 14.9 10.9 17.1 21.1Top of Footing 28.0 28.0Bottom of Footing 25.0 25.0
1. Note that abutment scour is conservative, and does not account for scour protection such as riprap. Plans of the existing bridge indicate that bedrock is present at approximately elevation 13’ on the left (north) side of the bridge and elevation 18’ on the right (south) side of the bridge. For final design, rock scour may be checked for the right abutment since scour is expected to occur to rock based on preliminary design data.
It is expected that some riprap protection will be used, with sizing to include heavy riprap along abutments and plain riprap elsewhere. Final type and size of riprap will be evaluated and detailed in final design.
5.0 Summary of Findings and Recommendations for Final Design Data Needs:
For final design, it is recommended that the control section at outlet of pond be surveyed. For final design, geotechnical data for stream bed at bridge (D50) and rock quality
characteristics will be required. No flood insurance study elevations are available at this location Research indicates no history of ice jams at this location Historic data shows little to no chance of overtopping, and adequate clearance at low
chord for existing bridge The drainage area is 253 square miles, with a stream gage (not operating) just upstream.

16 | E a s t M a c h i a s B r i d g e H y d r o l o g y / H y d r a u l i c s R e p o r t
The hydraulic characteristics of the bridge site indicate rapid flow through and downstream of the bridge into the pool below. This steep section may cause a hydraulic jump near or slightly downstream of the bridge, resulting in rapid energy loss at that section.
The hydraulic analysis requires additional data at the next downstream control point, at the outlet to the pond. Assumed energy grade slope was used for preliminary design using a sensitivity analysis to estimate best fit slope.
The existing bridge clearance above the 50-year storm is 6.2’, and above the 100-year storm is 5.8’.
For the proposed bridge, 50-year clearance is 4.4’, and 100-year clearance is 4.0’ according to the hydraulic model.
Potential scour at abutments (at existing abutments) varies according to D50 of channel material. Assuming D50 of 150 mm results in 100-year scour of 9.4’ on north abutment, 0.0’ center channel and 10.9’ at south abutment. Smaller D50 would result in more scour, higher D50 may give less potential scour. No information was found related to long term bed changes. Further research should be considered for final design.
Scour protection will be designed during the final design phase. It is expected that riprap protection will be added at abutments. The existing abutments will be left in place but cut off, and will provide some scour protection for the new abutments.

17 | E a s t M a c h i a s B r i d g e H y d r o l o g y / H y d r a u l i c s R e p o r t
6.0 References
Federal Emergency Management Agency. Flood Hazard Boundary Map, Town of East Machias. March 14, 1975
U. S. Dept. of the Interior, Geological Survey, with Maine Dept. of Transportation. Estimating the Magnitude and Frequency of Peak Flows for Streams in Maine for Selected Recurrence Intervals. Water Resources Investigations Report 99-4008.
U.S. Army Corps of Engineers, Hydrologic Engineering Center. HEC-RAS River Analysis System. Version 4.1.0. January, 2010. Davis, CA
U.S. Department of Transportation. Federal Highway Administration. Evaluating Scour at Bridges, 5th edition. HEC-18. April 2012 , Publication No. FHWA-HIF-12-003
U.S. Department of Transportation. Federal Highway Administration. Bridge Scour and Stream Instability Countermeasures. HEC-23. Volume 2. September, 2009. FHWA-NHI-09-112 . DG 14, Rock Riprap at Bridge Abutments and DG 4, Riprap Revetment
Maine Dept. of Transportation. Bridge Design Manual. August 2003
U.S. Dept. of Transportation. Design of Riprap Revetment. HEC No. 11. FHWA IP-89-016, March 1989
ESRI ArcMap, ArcGIS Desktop, Version 9.3.1, 2009. Arcview license. Data added from MEGIS website, project plans and ESRI
U.S. Geological Survey. “Trends in Streamflow, River Ice, and Snowpack for Coastal River Basins in Maine During the 20th Century. WRIR 02-4245
U.S. Army Corps of Engineers. Cold Regions Research Engineering Lab, CRREL. On-line ice jam database. https://rsgisias.crrel.usaace.arum.mil/icejam/
18 | E a s t M a c h i a s B r i d g e H y d r o l o g y / H y d r a u l i c s R e p o r t
East Machias Bridge Hydrology and Hydraulics Report
Preliminary Design
Appendix
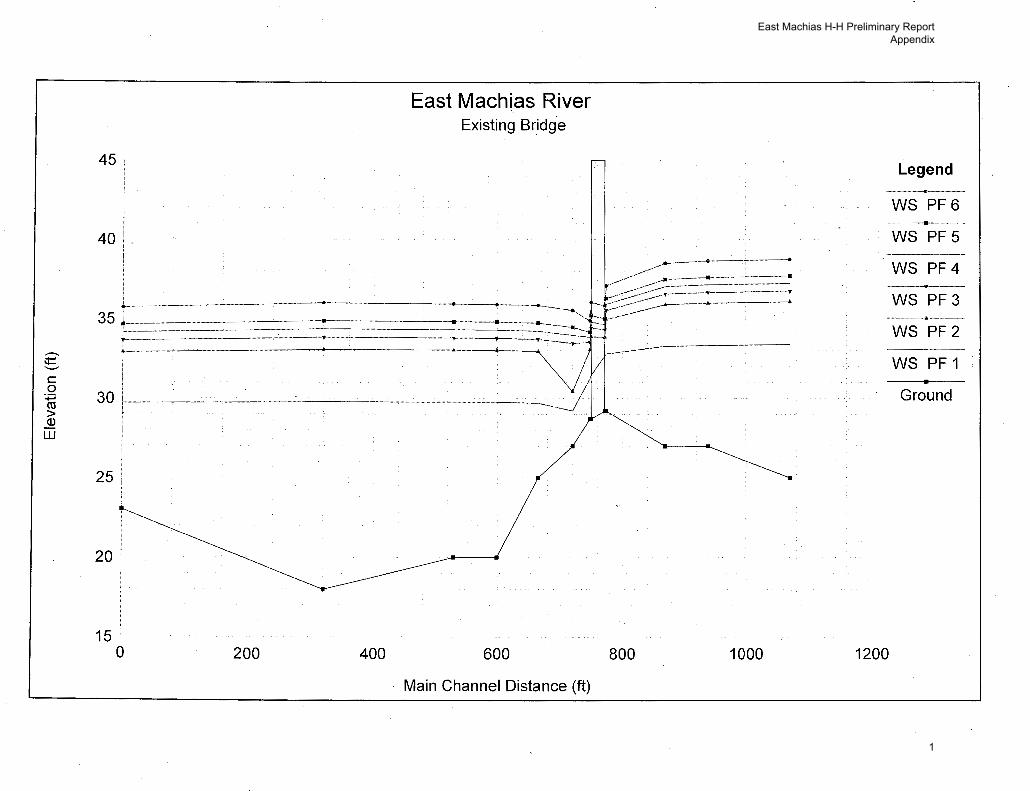
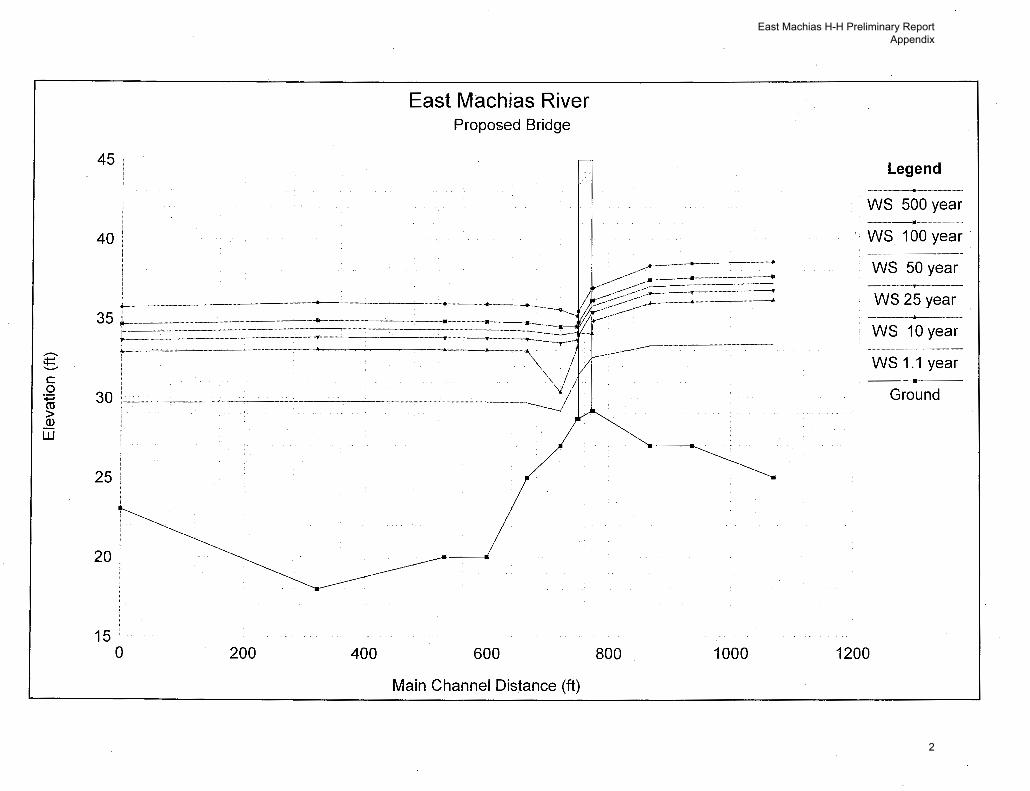
Water Surface Elevations and River Profiles Pages 1 and 2
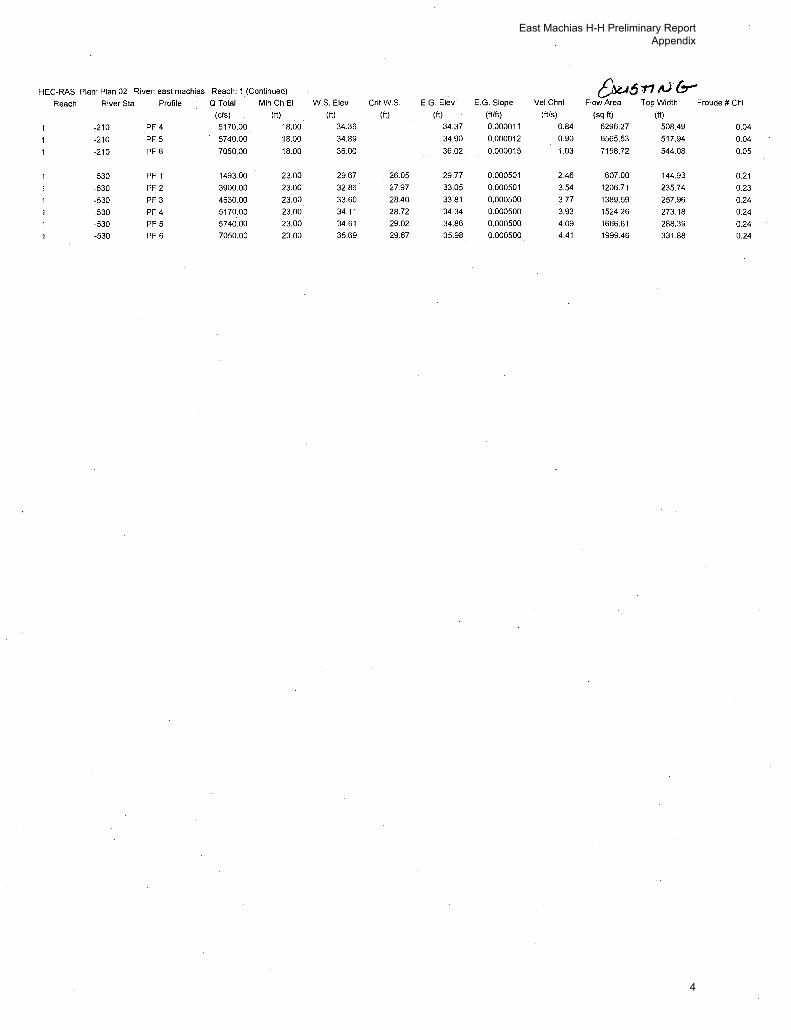
HECRAS tables
Existing Bridge Pages 3-6
Proposed Bridge Pages 7-10
Cross Section Plots Pages 11-18
Scour Analysis Pages 19-22
Field Notes and Additional Photos, April, 2014 Pages 23-39
2 ----c 0
:;::::; ro > Q)
w
45;
40 .
i
25!
20 i
15 0 200 400
East Machias River Existing Bridge
600
Main Channel Distance (ft)
_.......A--·--··-···_. .... ,,. ____ ...... ___.
800 1000
Legend --··-··---·-------···--
WS PF6 ·---···---·•-·-·-··-·-·---
WS PF5
WS PF4 _____ ____, ___ _
1200
WS PF3
WS PF2 --··---
ws PF 1 •
Ground
East Machias H-H Preliminary Report Appendix
1
2 "--'
c 0
:;::::; ctl > Q)
w
45
40
East Machias River Proposed Bridge
··········-··+----··--·• .. ··--·····--..-------•. -----
35L ~-~-~:~~~~~=~-~-30 -. . .... ·- -···········-··
25
20
15 i
0 200 400 600
Main Channel Distance (ft)
...... -~-At-··-··-·-·----······-. ---······--·
-------~;§!~1~~:: ~~-= ::- ~-==
800 1000
Legend -·--·------.···--·····-----·-·
WS 500 year ---------·-·-···-··---··-···-·
WS 100 year ---------·-····
WS 50 year ______ _..,... ________ _ WS 25 year -----·-~-----
1200
WS 10 year
WS 1.1 year
Ground
East Machias H-H Preliminary Report Appendix
2
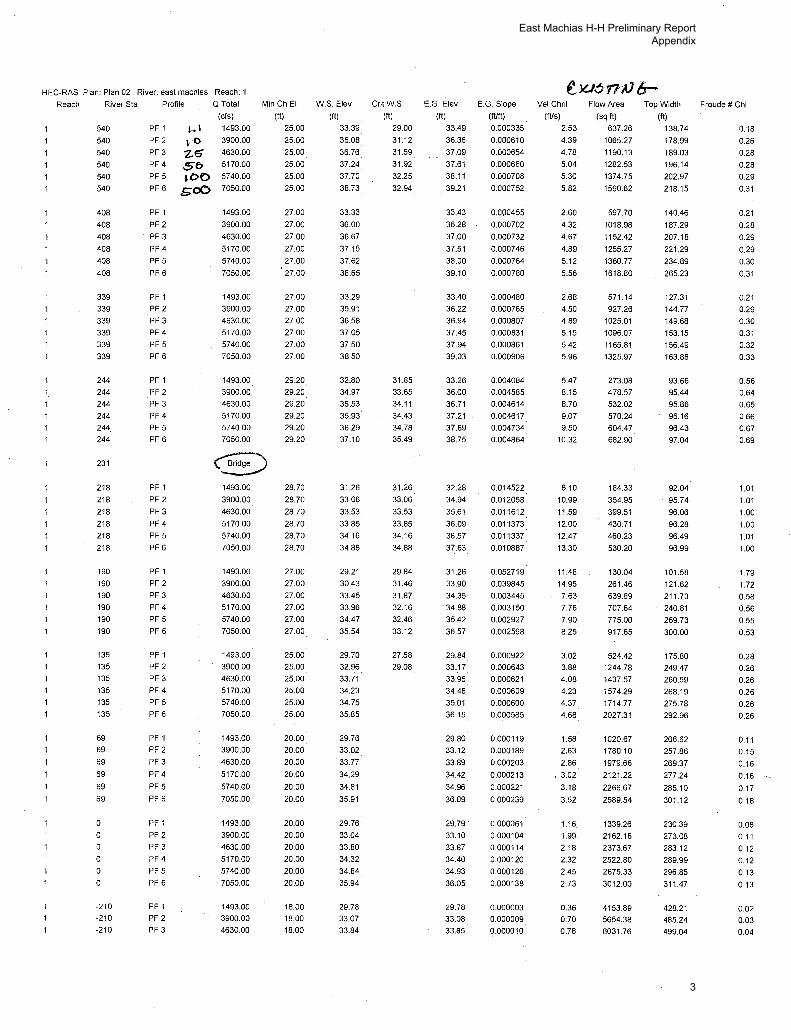
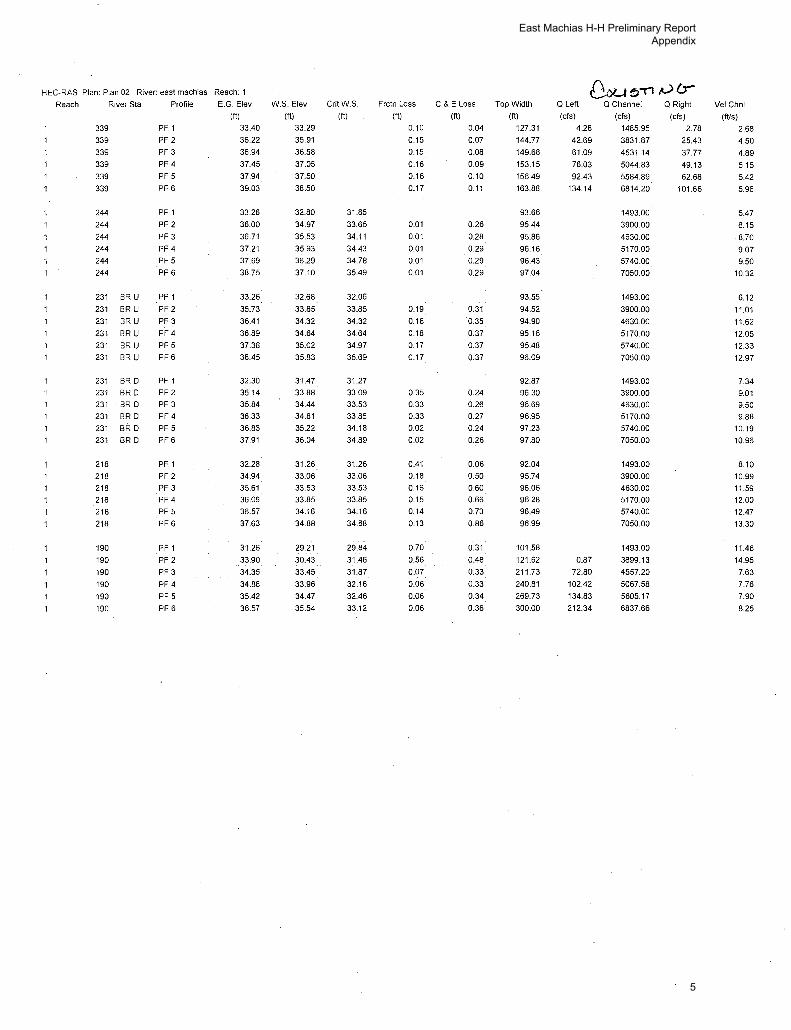
HEC-RAS Plan: Plan 02 River: east machias Reach: 1
Reach River Sta Profile Q Total
540
540
540
540
540
540
408
408
408
408
408
408
339
339
339
339
339
339
244
244
244
244 244
244
PF 1
PF 2
PF 3 PF 4
PF 5 PF 6
PF 1
PF 2
PF 3
PF 4
PF 5
PF 6
PF 1
PF 2
PF 3
PF 4
PF 5
PF 6
PF 1
PF 2
PF 3
PF 4
PF 5
PF 6
I~' vo Z5 5b lDO soO
(cfs)
1493.00
3900.00
4630.00
5170.00
5740.00
7050.00
1493.00
3900.00
4630.00
5170.00
5740.00
7050.00
1493.00
3900.00
4630.00
5170.00
5740.00
7050.00
1493.00
3900.00
4630.00
5170.00
5740.00
7050.00
MinCh El
(It)
25.00
25.00
25.00
25.00
25.00
25.00
27.00
27.00
27.00
27.00
27.00
27.00
27.00
27.00
27.00
27.00
27.00
27.00
29.20
29.20
29.20
29.20
29.20
29.20
231 (§0 218
218
218
218
218
218
190
190
190
190
190
190
135
135
135
135
135
135
69
69
69
69
69
69
0
0
0
0
0
0
-210 -210
-210
PF 1
PF 2
PF 3 PF 4
PF 5
PF 6
PF 1
PF 2
PF 3
PF 4
PF 5
PF 6
PF 1
PF 2
PF 3 PF 4
PF 5
PF 6
PF 1
PF 2 PF 3
PF 4
PF 5
PF 6
PF 1
PF 2
PF 3
PF 4
PF 5
PF 6
PF 1
PF 2
PF 3
1493.00
3900.00
4630.00
5170.00
5740.00
7050.00
1493.00
3900.00
4630.00
5170.00
5740.00
7050.00
1493.00
3900.00
4630.00
5170.00
5740.00
7050.00
1493.00
3900.00
4630.00
5170.00
5740.00
7050.00
1493.00
3900.00
4630.00
5170.00
5740.00
7050.00
1493.00
3900.00
4630.00
28.70
28.70
28.70
28.70
28.70
28.70
27.00
27.00
27.00
27.00
27.00
27.00
25.00
25.00
25.00
25.00
25.00
25.00
20.00
20.00
20.00
20.00
20.00
20.00
20.00
20.00
20.00
20.00
20.00
20.00
18.00
18.00
18.00
W.S. Elev
(ft)
33.39
36.08
36.76
37.24
37.70
38.73
33.33
36.00
36.67
37.15
37.62
38.65
33.29
35.91
36.58
37.05
37.50
38.50
32.80
34.97
35.53
35.93
36.29
37.10
31.26
33.06
33.53
33.85
34.16
34.88
29.21
30.43
33.45
33.96
34.47
35.54
29.70
32.96
33.71
34.23
34.75
35.85
29.76
33.02
33.77
34.29
34.81
35.91
29.76
33.04
33.80
34.32
34.84
35.94
29.78 33.07
33.84
CritW.S.
(It)
29.00
31.12
31.59
31.92
32.25
32.94
31.85 33.65
34.11
34.43
34.78
35.49
31.26
33.06
33.53
33.85
34.16
34.88
29.84
31.46
31.87
32.16
32.46
33.12
27.58
29.08
E.G. Elev
(It)
33.49
36.36
37.09
37.61
38.11
39.21
33.43
36.28
37.00
37.51
38.00
39.10
33.40
36.22
36.94
37.45
37.94
39.03
33.26
36.00
36.71
37.21 37.69
38.75
32.28
34.94
35.61
36.09
36.57
37.63
31.26
33.90
34.35
34.88
35.42
36.57
29.84
33.17
33.95
34.48
35.01
36.15
29.80
33.12
33.89
34.42
34.96
36.09
29.79.
33.10
33.87
34.40
34.93
36.05
29.78 33.08
33.85
E.G. Slope
(ft/ft)
0.000335
0.000610
0.000654
0.000680
0.000708
0.000752
0.000455
0.000702
0.000732
0.000746
0.000764
0.000780
0.000480
0.000765
0.000807
0.000831
0.000861
0.000906
0.004084
0.004585
0.004614
0.004617
0.004734
0.004864
0.014522
0.012058
0.011612
0.011373
0.011337
0.010887
0.052719
0.039845
0.003445
0.003150
0.002927
0.002598
0.000922
0.000643
0.000621
0.000609
0.000600
0.000585
0.000119
0.000189
0.000203
0.000213
0.000221
0.000239
0.000061
0.000104
0.000114
0.000120
0.000126
0.000138
0.000003
0.000009
0.000010
Vel Chnl
(ft/s)
2.53
4.39
4.78
5.04
5.30
5.82
2.60
4.32
4.67
4.89
5.12
5.56
2.68
4.50
4.89
5.15
5.42
5.96
5.47
8.15
8.70
9.07
9.50
10.32
8.10
10.99
11.59
12.00
12.47
13.30
11.48
14.95
7.63
7.76
7.90
8.25
3.02 3.88
4.08
4.23
4.37
4.68
1.58
2.63
2.86
'3.02
3.18
3.52
1.16.
1.99
2.18
2.32
2.45
2.73
0.36
0.70 0.78
Flow Area
(sqft)
637.26
1065.27
1190.13
1282.53
1374.75
1590.62
597.70
1018.98
1152.42
1255.27
1360.77
1618.80
571.14
927.26
1025.01
1096.07
1165.81
1325.97
273.08
478.57
532.02
570.24
604.47 682.90
184.33
354.95
399.51
430.71
460.23
530.20
130.04
261.46
639.89
707.64
775.00
917.65
524.42
1244.78
1437.57
1574.29
1714.77
2027.31
1020.67
1780.10
1979.66
2121.22
2266.67
2589.54
1339.26
2162.16
2373.67
2522.80
2675.33
3012.00
4153.89 5654.38
6031.76
Top Width
(ft)
138.74
178.99
189.03
196.14
202.97
218.15
140.46
187.29
207.18
221.29
234.89
265.23
127.31
144.77
149.68
153.15
156.49
163.88
93.66 95.44
95.86
96.16
96.43
97.04
92.04
95.74
96.06
96.28
96.49
96.99
101.58
121.62
211.73
240.81
269.73
300.00
175.80
249.47
260.59
268.19
275.78
292.96
206.62 257.86
269.37
277.24
285.10
301.12
230.39
273.08
283.12
289.99
296.85
311.47
428.21
485.24
499.04
Froude #Chi
0.18
0.26
0.28
0.28
0.29
0.31
0.21
0.28
0.29
0.29
0.30
0.31
0.21
0.29
0.30
0.31
0.32
0.33
0.56 0.64
0.65
0.66
0.67
0.69
1.01
1.01
1.00
1.00
1.01
1.00
1.79
1.72
0.58
0.56
0.55
0.53
0.28
0.26
0.26
0.26
0.26
0.26
0.11 0.15
0.16
0.16
0.17
0.18
0.08
0.11
0.12
0.12
0.13
0.13
0.02 0.03
0.04
East Machias H-H Preliminary Report Appendix
3
HEC-RAS Plan: Plan 02 River: east machias Reach: 1 (Continued) ~6T7/1Jb-Reach River Sta Profile QTotal MinCh Ei W.S. Elev CritW.S. E.G. Elev E.G. Slope Vel Chnl Flow Area Top Width Froude #Chi
(cts) (ft) (ft) (ft) (It) (ft/ft) (ftis) (sq ft) (It)
-210 PF 4 5170.00 18.00 34.36 34.37 0.000011 0.84 6296.27 508.49 0.04
-210 PF 5 5740.00 18.00 34.89 34.90 0.000012 0.90 6565.53 517.94 0.04
-210 PF 6 7050.00 18.00 36.00 36.02 0.000015 1.03 7158.72 544.08 0.05
-530 PF 1 1493.00 23.00 29.67 26.05 29.77 0.000501 2.46 607.00 144.93 0.21
-530 PF 2 3900.00 23.00 32.86. 27.97 33.05 0.000501 3.54 1206.71 235.74 0.23
-530 PF 3 4630.00 23.00 33.60 28.40 33.81 0.000500 3.77 1389.59 257.96 0.24
-530 PF 4 5170.00 23.00 34.11 28.72 34.34 0.000500 3.93 1524.26 273.18 0.24
-530 PF 5 5740.00 23.00 34.61 29.02 34.86 0.000500 4.09 1666.61 288.39 0.24
-530 PF 6 7050.00 23.00 35.69 29.67 35.98 0.000500 4.41 1999.46 331.88 0.24
East Machias H-H Preliminary Report Appendix
4
HEC-RAS Plan: Plan 02 River: east machias Reach: 1 Reach River Sta Profile E. G. Elev
339 339
339
339
339
339
244
244
244
244 244
244
231 BR U
231 BR U
231 BR U
231 BR U
231 BR U
231 BR U
231 BR 0 231 BR 0 231 · BR 0
231 BR 0
231 BR 0 231 BR 0
218 218 218 218 218
218
190
190
190
190
190
190
PF 1
PF 2
PF 3
PF 4
PF 5
PF 6
PF 1
PF 2
PF 3
PF 4 PF 5
PF 6
PF 1
PF 2
PF 3
PF 4 PF 5
PF 6
PF 1
PF 2
PF 3
PF 4
PF 5 PF 6
PF 1
PF 2
PF 3
PF 4
PF 5
PF 6
PF 1
PF 2
PF 3
PF 4
PF 5 PF 6
(It)
33.40
36.22
36.94 37.45
37.94
39.03
33.26 36.00
36.71
37.21 37.69 38.75
33.26
35.73
36.41 36.89
37.38 38.45
32.30 35.14 35.84 36.33
36.83 37.91
32.28
34.94 35.61 36.09
36.57 37.63
31.26
33.90
34.35 34.88
35.42
36.57
W.S. Elev (It)
33.29
35.91 36.58
37.05 37.50
38.50
32.80 34.97
35.53
35.93
36.29 37.10
32.68
33.85
34.32 34.64
35.02
35.83
31.47 33.88 34.44 34.81
35.22 36.04
31.26
33.06 33.53 33.85
34.16 34.88
29.21
30.43
33.45
33.96
34.47
35.54
CritW.S. (It)
31.85
33.65
34.11 34.43
34.78 35.49
32.06
33.85
34.32 34.64
34.97 35.69
31.27 33.09 33.53 33.85
34.18 34.89
31.26
33.06 33.53 33.85
34.16 34.88
29.84
31.46
31.87
32.16
32.46
33.12
Frctn Loss
(It)
0.10
0.15 0.15
0.16 0.16
0.17
0.01
0.01
0.01
0.01
0.01
0.19
0.18
0.18 0.17
0.17
0.35 0.33 0.33 0.02
0.02
0.41 0.18 0.16 0.15 0.14
0.13
0.70
0.56
0.07
0.06
0.06 0.06
C&ELoss (ft)
0.04
0.07
0.08
0.09
0.10 0.11
0.26
0.28 0.29
0.29 0.29
0.31
0.35
0.37 0.37
0.37
0.24 0.26 0.27 0.24
0.26
0.06 0.50 0.60 0.66 0.73
0.86
0.31
0.48
0.33
0.33
0.34 0.36
Top Width
(It)
127.31
144.77
149.68
153.15
156.49 163.88
93.66
95.44
95.86
96.16 96.43
97.04
93.55
94.52
94.90 95.16
95.48
96.09
92.87 96.30 96.69 96.95 97.23
97.80
92.04 95.74 96.06 96.28 96.49
96.99
101.58
121.62
211.73
240.81 269.73
300.00
Q Left
(cfs)
4.28
42.69
61.09
76.03 92.43
134.14
0.87
72.80
102.42
134.83 212.34
Q Channel
(cis)
1485.95
3831.87
4531.14
5044.83
5584.89 6814.20
1493.00
3900.00
4630.00
5170.00 5740.00
7050.00
1493.00
3900.00 4630.00
5170.00
5740.00 7050.00
1493.00 3900.00 4630.00 5170.00 5740.00 7050.00
1493.00 3900.00 4630.00 5170.00 5740.00 7050.00
1493.00
3899.13 4557.20
5067.58
5605.17 6837.66
Q Right
(cfs)
2.78
25.43
37.77
49.13
62.68 101.66
Vel Chnl
(ft/s)
2.68
4.50
4.89
5.15
5.42 5.96
5.47
8.15
8.70 9.07
9.50 10.32
6.12
11.01 11.62
12.05 12.33
12.97
7.34 9.01 9.50 9.88
10.19 10.96
8.10
10.99 11.59 12.00 12.47 13.30
11.48
14.95 7.63
7.76
7.90
8.25
East Machias H-H Preliminary Report Appendix
5
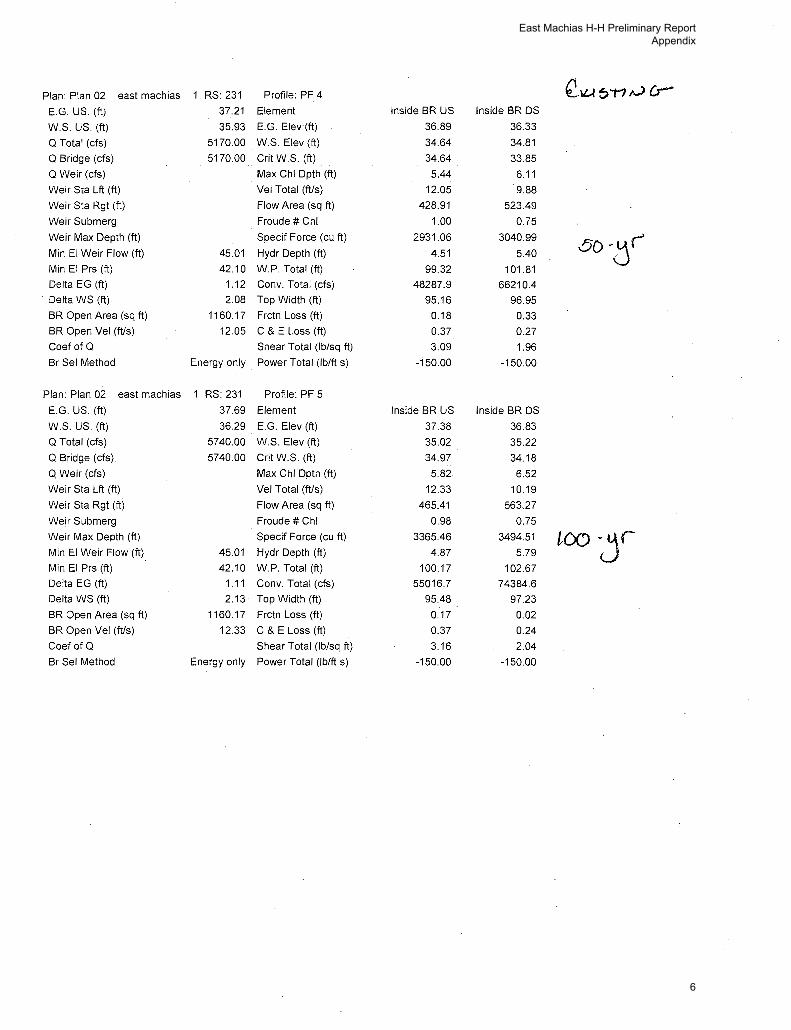
Plan: Plan 02 east machias 1 RS: 231 Profile: PF 4 r\U ~ "t'1 ,..; u--E.G. US. (ft) 37.21 Element Inside BR US Inside BROS
W.S. US. (ft) 35.93 E.G. Elev (ft) 36.89 36.33
Q Total (cfs) 5170.00 W.S. Elev (ft) 34.64 34.81
Q Bridge (cfs) 5170.00 Grit W.S. (ft) 34.64 33.85
Q Weir (cfs) Max Chi Dpth (ft) 5.44 6.11
Weir Sta Lft (ft) Vel Total (ft/s) 12.05 9.88
Weir Sta Rgt (ft) Flow Area (sq ft) 428.91 523.49
Weir Submerg Froude #Chi 1.00 0.75
Weir Max Depth (ft) Specif Force (cu ft) 2931.06 3040.99 oo -0r Min El Weir Flow (ft) 45.01 Hydr Depth (ft) 4.51 5.40
Min El Prs (ft) 42.10 W.P. Total (ft) 99.32 101.81 Delta EG (ft) 1.12 Conv. Total (cfs) 48287.9 66210.4
Delta WS (ft) 2.08 Top Width (ft) 95.16 96.95
BR Open Area (sq ft) 1160.17 F rctn Loss (ft) 0.18 0.33
BR Open Vel (ft/s) 12.05 C & E Loss (ft) 0.37 0.27
Coef of Q Shear Total (lb/sq ft) 3.09 1.96
Br Sel Method Energy only Power Total (lb/ft s) -150.00 -150.00
Plan: Plan 02 east machias RS: 231 Profile: PF 5
E.G. US. (ft) 37.69 Element Inside BR US Inside BROS
w.s. us. (ft) 36.29 E.G. Elev (ft) 37.38 36.83
Q Total (cfs) 5740.00 W.S. Elev (ft) 35.02 35.22
Q Bridge (cfs) 5740.00 Grit W.S. (ft) 34.97 34.18
Q Weir (cfs) Max Chi Dpth (ft) 5.82 6.52
Weir Sta Lft (ft) Vel Total (ft/s) 12.33 10.19
Weir Sta Rgt (ft) Flow Area (sq ft) 465.41 563.27
Weir Submerg Froude #Chi 0.98 0.75
Weir Max Depth (ft) Specif Force (cu ft) 3365.46 3494.51 LOOjr Min El Weir Flow (ft) 45.01 Hydr Depth (ft) 4.87 5.79
Min El Prs (ft) 42.10 W.P. Total (ft) 100.17 102.67
Delta EG (ft) 1.11 Conv. Total (cfs) 55016.7 74384.6
Delta WS (ft) 2.13 Top Width (ft) 95.48 97.23
BR Open Area (sq ft) 1160.17 Frctn Loss (ft) 0.1.7 0.02
BR Open Vel (ft/s) 12.33 C & E Loss (ft) 0.37 0.24
Coef of Q Shear Total (lb/sq ft) 3.16 2.04
Br Sel Method Energy only Power Total (lb/ft s) -150.00 -150.00
East Machias H-H Preliminary Report Appendix
6
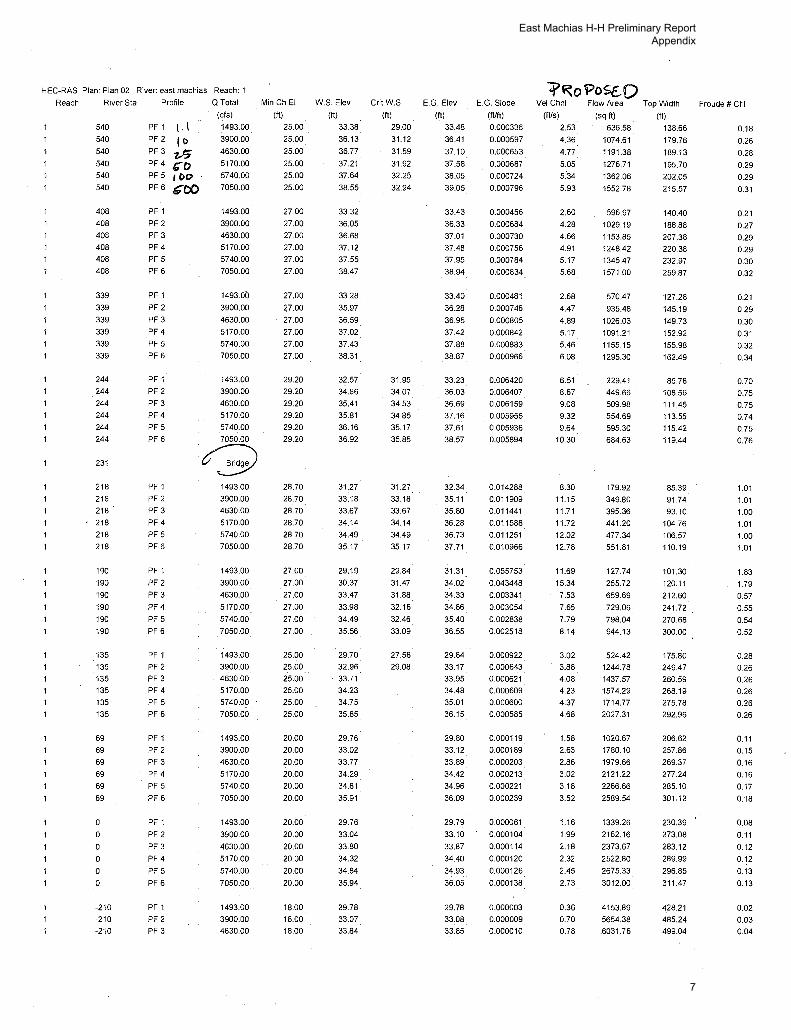
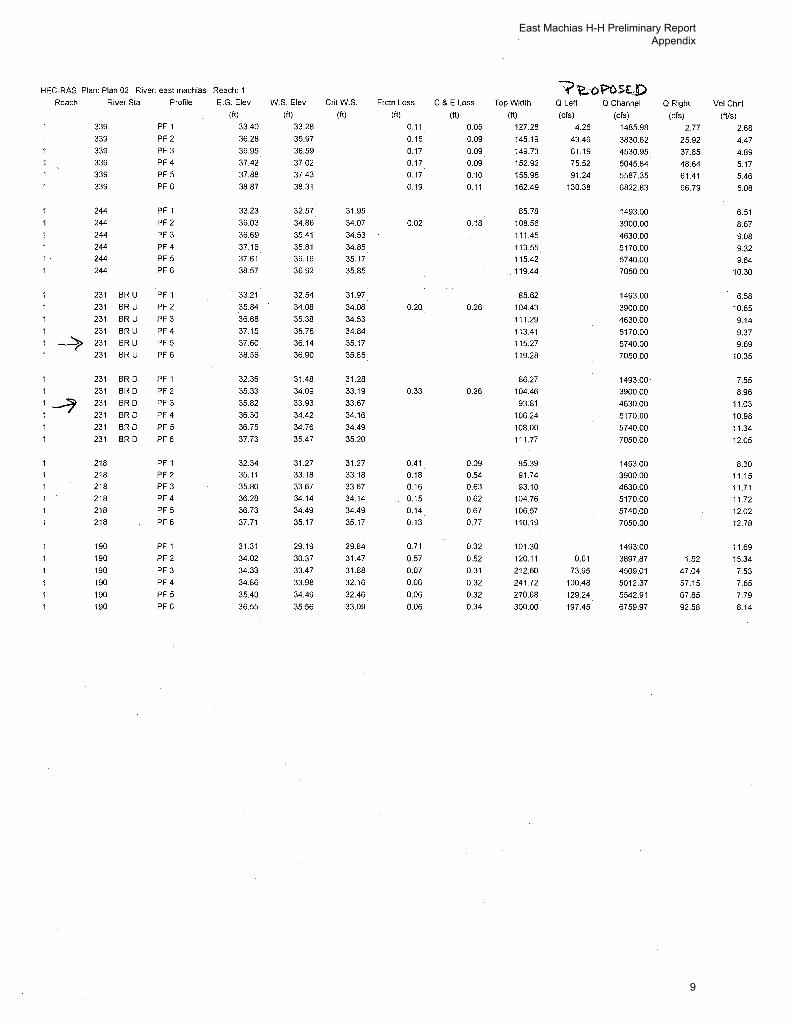
HEC-RAS Plan: Plan 02 River: east machias Reach: 1
Reach River Sta Profile Q Total
540
540
540
540
540
540
408
408
408
408
408
408
339
339
339
339
339
339
244
244
244
244
244
244
231
218
218 218 .
218
218
218
190
190
190
190
190
190
135
135 135
135 135
135
69
69
69
69
69
69
0
0
0
0
0
-210
-210
-210
PF 1 l- \ PF 2 I b
PF3 z...~ PF 4 (;()
PF 5 1 ~D PF6 600
PF 1
PF 2
PF 3
PF 4
PF 5
PF 6
PF 1
PF 2
PF 3
PF 4
PF 5
PF 6
PF 1
PF 2 PF 3 PF 4
PF 5
PF 6
PF 1
PF 2
PF 3
PF 4
PF 5
PF 6
PF 1
PF 2
PF 3
PF 4
PF 5
PF 6
PF 1
PF 2 PF 3 PF 4
PF 5
PF 6
PF 1
PF 2
PF 3
PF 4
PF 5
PF 6
PF 1
PF 2
PF 3
PF 4
PF 5
PF 6
PF 1
PF 2 PF 3
(cis)
1493.00
3900.00
4630.00
5170.00
5740.00
7050.00
1493.00
3900.00
4630.00
5170.00
5740.00
7050.00
1493.00
3900.00
4630.00
5170.00
5740.00
7050.00
1493.00
3900.00
4630.00
5170.00
5740.00
7050.00 g 1493.00
3900.00
4630.00
5170.00
5740.00
7050.00
1493.00
3900.00
4630.00
5170.00
5740.00
7050.00
1493.00
3900.00 4630.00
5170.00
5740.00
7050.00
1493.00
3900.00
4630.00
5170.00
5740.00
7050.00
1493.00
3900.00
4630.00
5170.00
5740.00
7050.00
1493.00
3900.00 4630.00
MinCh El
(It)
25.00
25.00
25.00
25.00
25.00
25.00
27.00
27.00
27.00
27.00
27.00
27.00
27.00
27.00
27.00
27.00
27.00
27.00
29.20
29.20
29.20
29.20
29.20
29.20
28.70
28.70
28.70
28.70
28.70
28.70
27.00
27.00
27.00
27.00
27.00
27.00
25.00
25.00 25.00
25.00
25.00
25.00
20.00
20.00
20.00
20.00
20.00
20.00
20.00
20.00
20.00
20.00
20.00
20.00
18.00
18.00
18.00
W.S. Elev
(It)
33.38
36.13
36.77
37.21
37.64
38.55
33.32
36.05
36.68
37.12
37.55
38.47
33.28
35.97
36.59
37.02
37.43
38.31
32.57
34.86
35.41
35.81
36.16
36.92
31.27
33.18
33.67
34.14
34.49
35.17
29.19
30.37
33.47
33.98
34.49
35.56
29.70
32.96
33.71
34.23
34.75
35.85
29.76
33.02
33.77
34.29
34.81
35.91
29.76
33.04
33.80
34.32
34.84
35.94
29.78
33.07
33.84
CritW.S.
(It)
29.00
31.12
31.59
31.92
32.25
32.94
31.95
34.07
34.53
34.85
35.17
35.85
31.27
33.18
33.67
34.14
34.49
35.17
29.84
31.47
31.88
32.16
32.46
33.09
27.58
29.08
E.G. Elev
(It)
33.48
36.41
37.10
37.58
38.05
39.05
33.43
36.33
37.01
37.48
37.95
38.94
33.40
36.28
36.95
37.42
37.88
38.87
33.23
36.03
36.69
37.16
37.61
38.57
32.34
35.11
35.80
36.28
36.73
37.71
31.31
34.02
34.33
34.86
35.40
36.55
29.84
33.17
33.95
34.48
35.01
36.15
29.80
33.12
33.89
34.42
34.96
36.09
29.79
33.10
33.87
34.40
34.93
36.05
29.78
33.08
33.85
E.G. Slope
(It/It)
0.000336
0.000597
0.000653
0.000687
0.000724
0.000796
0.000456
0.000684
0.000730
0.000756
0.000784
0.000834
0.000481
0.000746
0.000805
0.000842
0.000883
0.000966
0.006420
0.006407
0.006159
0.005956
0.005936
0.005894
0.014288
0.011909
0.011441
0.011588
0.011251
0.010966
0.055753
0.043448
0.003341
0.003054
0.002838
0.002518
0.000922
0.000643
0.000621
0.000609
0.000600
0.000585
0.000119
0.000189
0.000203
0.000213
0.000221
0.000239
0.000061
0.000104
0.000114
0.000120
0.000126
0.000138
0.000003
0.000009
0.000010
"?~o?osc.o Vel Chnl Flow Area Top Width
(ft/s) (sq It) (It)
2.53 636.58 138.66
4.36
4.77
5.05
5.34
5.93
2.60
4.28
4.66
4.91
5.17
5.68
2.68
4.47
4.89
5.17
5.46
6.08
6.51
8.67
9.08
9.32
9.64
10.30
8.30
11.15
11.71
11.72
12.02
12.78
11.69
15.34
7.53
7.65
7.79
8.14
3.02
3.88
4.08 4.23
4.37
4.68
1.58
2.63
2.86
3.02
3.18
3.52
1.16
1.99
2.18
2.32
2.45
2.73
0.36
0.70 0.78
1074.61
1191.38
1276.71
1362.06
1552.78
596.97
1029.19
1153.85
1248.42
1345.47
1571.00
570.47
935.48
1026.03
1091.21
1155.15
1295.30
229.41
449.66
509.98
554.69
595.30
684.63
179.92
349.80
395.36
441.20
477.34
551.81
127.74
255.72
659.69
729.06
798.04
944.13
524.42
1244.78
1437.57
1574.29
1714.77
2027.31
1020.67
1780.10
1979.66
2121.22
2266.66
2589.54
1339.26
2162.16
2373.67
2522.80
2675.33
3012.00
4153.89
5654.38
6031.76
179.76
189.13
195.70
202.05
215.57
140.40
188.88
207.38
220.38
232.97
259.87
127.28
145.19
149.73
152.92
155.98
162.49
85.78
108.56
111.45
113.55
115.42 119.44
85.39
91.74
93.10
104.76
106.57
110.19
101.30
120.11
212.60
241.72 . 270.68
300.00
175.80
249.47
260.59 268.19
275.78
292.96
206.62
257.86
269.37
277.24
285.10
301.12
230.39
273.08
283.12
289.99
296.85
311.47
428.21
485.24
499.04
Froude #Chi
0.18
0.26
0.28
0.29
0.29
0.31
0.21
0.27
0.29
0.29
0.30
0.32
0.21
0.29
0.30
0.31
0.32
0.34
0.70
0.75 0.75
0.74
0.75
0.76
1.01
1.01
1.00
1.01 1.00
1.01
1.83
1.79
0.57
0.55
0.54
0.52
0.28
0.26
0.26 0.26
0.26
0.26
0.11
0.15
0.16
0.16
0.17
0.18
0.08
0.11
0.12
0.12
0.13
0.13
0.02
0.03
0.04
East Machias H-H Preliminary Report Appendix
7
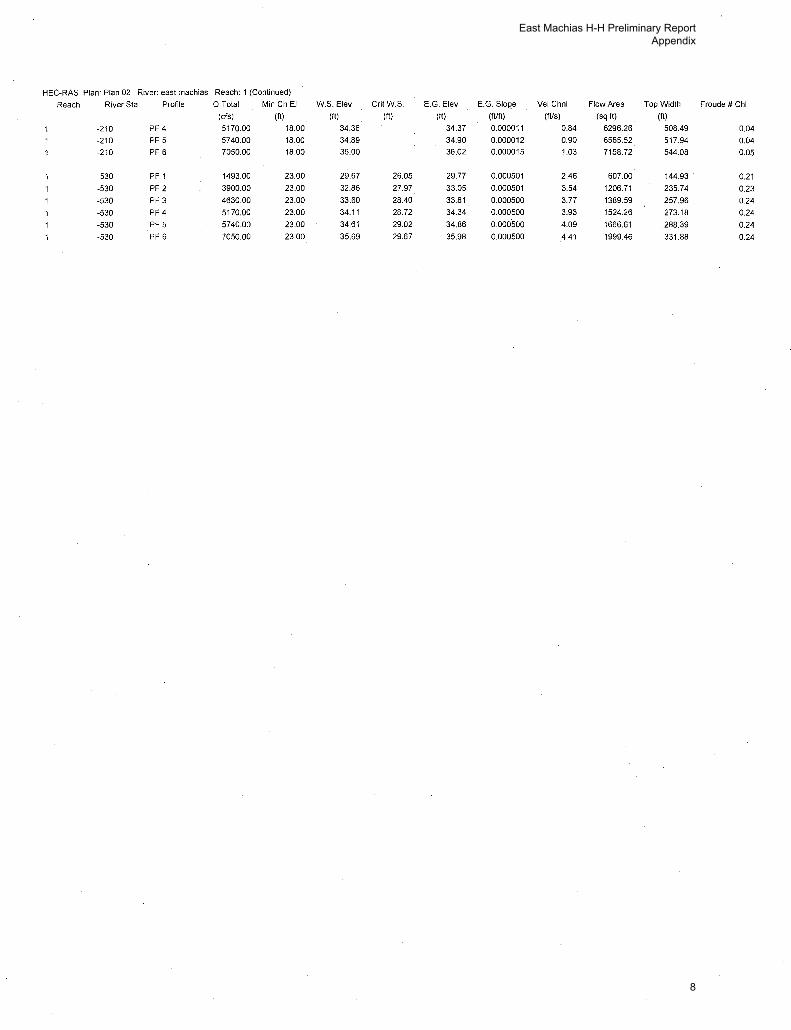
HEC-RAS Plan: Plan 02 River: east machias Reach: 1 (Continued)
Reach River Sta Profile Q Total MinCh El W.S. Elev CritW.S. E.G. Elev E.G. Slope Vel Chnl Flow Area Top Width Froude #Chi
(cfs) (ft) (ft) (ft) (ft) (Wft) (Ws) (sq ft) (ft)
-210 PF 4 5170.00 18.00 34.36 34.37 0.000011 0.84 6296.26 508.49 0.04
-210 PF 5 5740.00 18.00 34.89 34.90 0.000012 0.90 6565.52 517.94 0.04 -210 PF 6 7050.00 18.00 36.00 36.02 0.000015 1.03 7158.72 544.08 0.05
-530 PF 1 1493.00 23.00 29.67 26.05 29.77 0.000501 2.46 607.00 144.93 0.21
-530 PF 2 3900.00 23.00 32.86 27.97 33.05 0.000501 3.54 1206.71 235.74 0.23
-530 PF 3 4630.00 23.00 33.60 28.40 33.81 0.000500 3.77 1389.59 257.96 024
-530 PF 4 5170.00 23.00 34.11 28.72 34.34 0.000500 3.93 1524.26 273.18 0.24
-530 PF 5 5740.00 23.00 34.61 29.02 34.86 o.ooo5oo 4.09 1666.61 288.39 0.24
-530 PF 6 7050.00 23.00 35.69 29.67 35.98 0.000500 4.41 1999.46 331.88 0.24
East Machias H-H Preliminary Report Appendix
8
HEC-RAS Plan: Plan 02 River: east machias Reach: 1
1'
Reach River Sta Profile E.G. Elev
339
339
339
339
339
339
244
244
244
244
244
244
231 BR U
231 BR U
231 BR U
231 BR U
~ 231 BRU
231 BR U
231 BR D
231 BR D
231 BR D
231 BR D
231 BR D
231 BR D
218
218
218
218
218
218
190
190
190
190
190
190
PF 1
PF 2
PF 3
PF 4 PF 5
PF 6
PF 1
PF 2
PF 3 PF 4
PF 5
PF 6
PF 1
PF 2
PF 3 PF 4
PF 5
PF 6
PF 1
PF 2
PF 3
PF 4
PF 5
PF 6
PF 1
PF 2
PF 3
PF 4
PF 5
PF 6
PF 1
PF 2
PF 3
PF 4
PF 5 PF 6
(It)
33.40
36.28
36.95
37.42
37.88
38.87
33.23
36.03
36.69
37.16
37.61
38.57
33.21
35.84
36.68
37.15
37.60
38.56
32.36
35.33
35.82
36.30
36.75
37.73
32.34
35.11
35.80
36.28
36.73
37.71
31.31
34.02
34.33
34.86
35.40
36.55
W.S. Elev
(It)
33.28
35.97
36.59
37.02
37.43
38.31
32.57
34.86
35.41
35.81
36.16
36.92
32.54
34.08
35.38
35.78
36.14
36.90
31.48
34.09
33.93
34.42
34.76
35.47
31.27
33.18
33.67
34.14
34.49
35.17
29.19
30.37
33.47
33.98
34.49
35.56
CritW.S.
(It)
31.95
34.07
34.53
34.85 35.17
35.85
31.97
34.08
34.53
34.84
35.17
35.86
31.28
33.19
33.67
34.16
34.49
35.20
31.27 33.18
33.67
34.14
34.49
35.17
29.84
31.47
31.88
32.16
32.46
33.09
Frctn Loss
(It)
0.11
0.16
0.17
0.17
0.17
0.19
0.02
0.20
0.33
0.41
0.18 0.16
0.15
0.14
0.13
0.71
0.57
0.07
0.06
0.06
0.06
C&ELoss
(It)
0.05
0.09
0.09
0.09
0.10
0.11
0.18
0.26
0.26
0.09
0.54
0.63
0.62
0.67
0.77
0.32
0.52
0.31
0.32
0.32
0.34
Top Width
(It)
127.28
145.19
149.73
152.92
155.98
162.49
85.78
108.56
111.45
113.55
115.42
. 119.44
85.62
104.43
111.29
113.41
115.27
119.28
86.27
104.46
93.81
106.24
108.00
111.77
85.39
91.74
93.10
104.76
106.57
110.19
101.30
120.11
212.60
241.72
270.68
300.00
Q Left
(cfs)
4.26
43.46
61.19
75.52
91.24
130.38
0.61
73.95
100.48
129.24
197.45
Q Channel
(cfs)
1485.98
3830.62
4530.95
5045.84
5587.35
6822.83
1493.00
3900.00
4630.00
5170.00
5740.00
7050.00
1493.00
3900.00
4630.00
5170.00
5740.00
7050.00
1493.00
3900.00
4630.00
5170.00
5740.00
7050.00
1493.00
3900.00
4630.00
5170.00
5740.00
7050.00
1493:00
3897.87
4509.01
5012.37
5542.91
6759.97
Q Right
(cfs)
2.77
25.92
37.85
48.64
61.41
96.79
1.52
47.04
57.15
07.85
92.58
Vel Chnl
(fUs)
2.68
4.47
4.89
5.17
5.46
6.08
6.51
8.67
9.08
9.32
9.64
10.30
6.58
10.65
9.14
9.37
9.69
10.35
7.55
8.96
11.03
10.98
11.34
12.05
8.30
11.15 11.71
11.72
12.02
12.78
11.69
15.34
7.53
7.65
7.79
8.14
East Machias H-H Preliminary Report Appendix
9
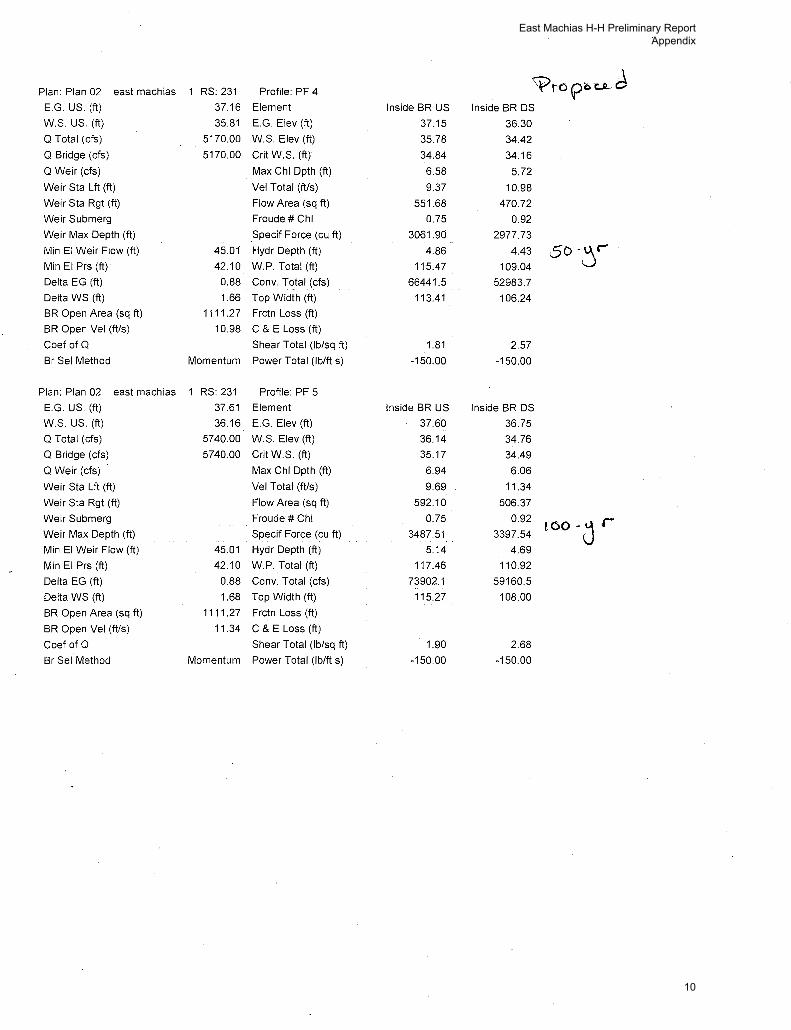
Plan: Plan 02 east machias 1 RS: 231 Profile: PF 4 ~r-c~ou..d E.G. US. (ft) 37.16 Element Inside BR US Inside BROS
W.S. US. (ft) 35.81 E.G. Elev (ft) 37.15 36.30 Q Total (cfs) 5170.00 W.S. Elev (ft) 35.78 34.42
Q Bridge (cfs) 5170.00 Grit W.S. (ft) 34.84 34.16
Q Weir (cfs) Max Chi Dpth (ft) 6.58 5.72
Weir Sta Lft (ft) Vel Total (ft/s) 9.37 10.98
Weir Sta Rgt (ft) Flow Area (sq ft) 551.68 470.72
Weir Submerg Froude #Chi 0.75 0.92
Weir Max Depth (ft) Specif Force (cu ft) 3061.90 2977.73
Min El Weir Flow (ft) 45.01 Hydr Depth (ft) 4.86 4.43 50 •jc-Min El Prs (ft) 42.10 W.P. Total (ft) 115.47 109.04
Delta EG (ft) 0.88 Conv. Total (cfs) 66441.5 52983.7
Delta WS (ft) 1.66 Top Width (ft) 113.41 106.24
BR Open Area (sq ft) 1111.27 Frctn Loss (ft)
BR Open Vel (ft/s) 10.98 C & E Loss (ft)
Coef of Q Shear Total (lb/sq ft) 1.81 2.57
Br Sel Method Momentum Power Total (lb/ft s) -150.00 -150.00
Plan: Plan 02 east machias RS: 231 Profile: PF 5
E.G. US. (ft) 37.61 Element Inside BR US Inside BROS
W.S. US. (ft) 36.16 E.G. Elev (ft) 37.60 36.75
Q Total (cfs) 5740.00 W.S. Elev (ft) 36.14 34.76
Q Bridge (cfs) 5740.00 Grit W.S. (ft) 35.17 34.49
Q Weir (cfs) Max Chi Dpth (ft) 6.94 6.06
Weir Sta Lft (ft) Vel Total (ft!s) 9.69 11.34
Weir Sta Rgt (ft) Flow Area (sq ft) 592.10 506.37
Weir Submerg Froude #Chi 0.75 0.92 tOO~ j r
Weir Max Depth (ft) Specif Force (cu ft) 3487.51 3397.54
Min El Weir Flow (ft) 45.01 Hydr Depth (ft) 5.14 4.69
Min El Prs (ft) 42.10 W.P. Total (ft) 117.46 110.92
Delta EG (ft) 0.88 Conv. Total (cfs) 73902.1 59160.5
Delta WS (ft) 1.68 Top Width (ft) 115.27 108.00
BR Open Area (sq ft) 1111.27 Frctn Loss (ft)
BR Open Vel (ft/s) 11.34 C & E Loss (ft)
Coef of Q Shear Total (lb/sq ft) 1.90 2.68
Br Sel Method Momentum Power Total (lb/ft s) -150.00 -150.00
East Machias H-H Preliminary Report Appendix
10
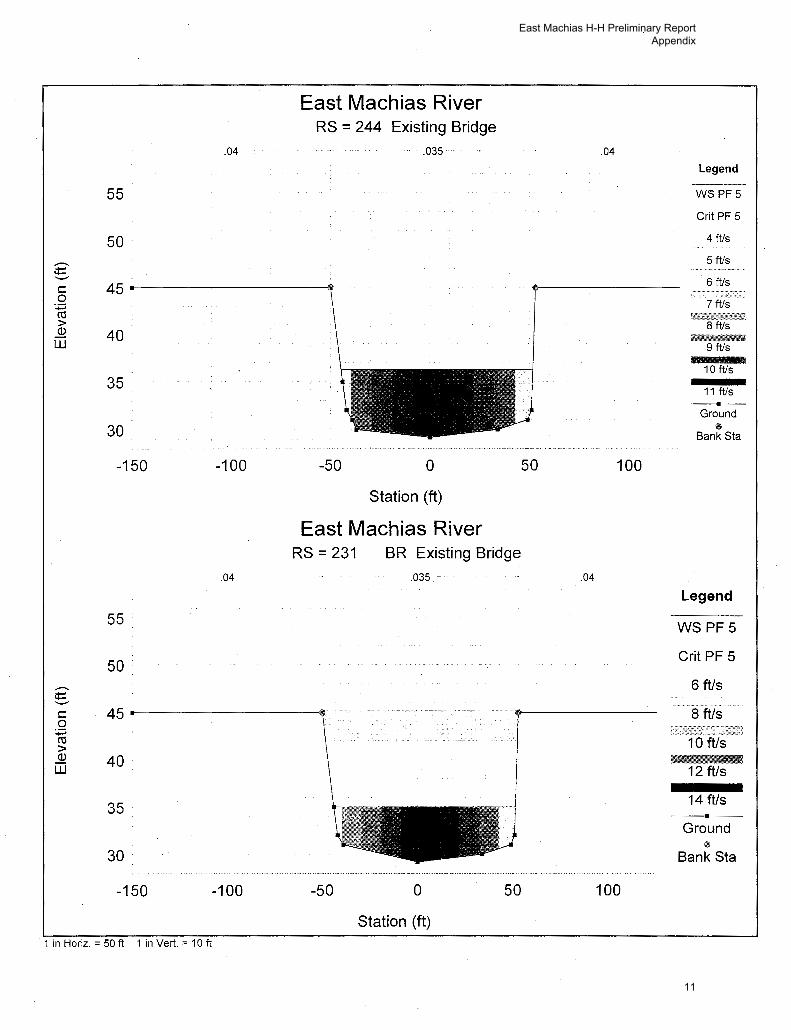
East Machias River RS = 244 Existing Bridge
.04 .035
55
50 .--... ¢: .._ c 45 0
:;:::; ro > ()) 40 w
35
30 -----------------···----- ·----------- -·· - --------- -- -------~---· ----
-150 -100
.04
55
50 .--... ¢: .._ c 45 0
:;:::; ro > ()) 40 w
35.
30
-150 -100
1 in Horiz. = 50ft 1 in Vert. = 10ft
-50 0
Station (ft)
East Machias River RS = 231
-50
BR Existing Bridge .035 ..
0
Station (ft)
50
.04
50 100
.04
100
Legend -----· WSPFS
Grit PF 5
4 ft/s
5 ftls
6 ft/s
7 ft/s
••t"" 9 ft/s
10 ft/s
11 ft/s
Ground ®
Bank Sta
Legend
WSPF5
Crit PF 5
6 ft/s
a fils ·· 10 ft/s
12 ft/s
14 ft/s
Ground &
Bank Sta
East Machias H-H Preliminary Report Appendix
11
.04
55
50
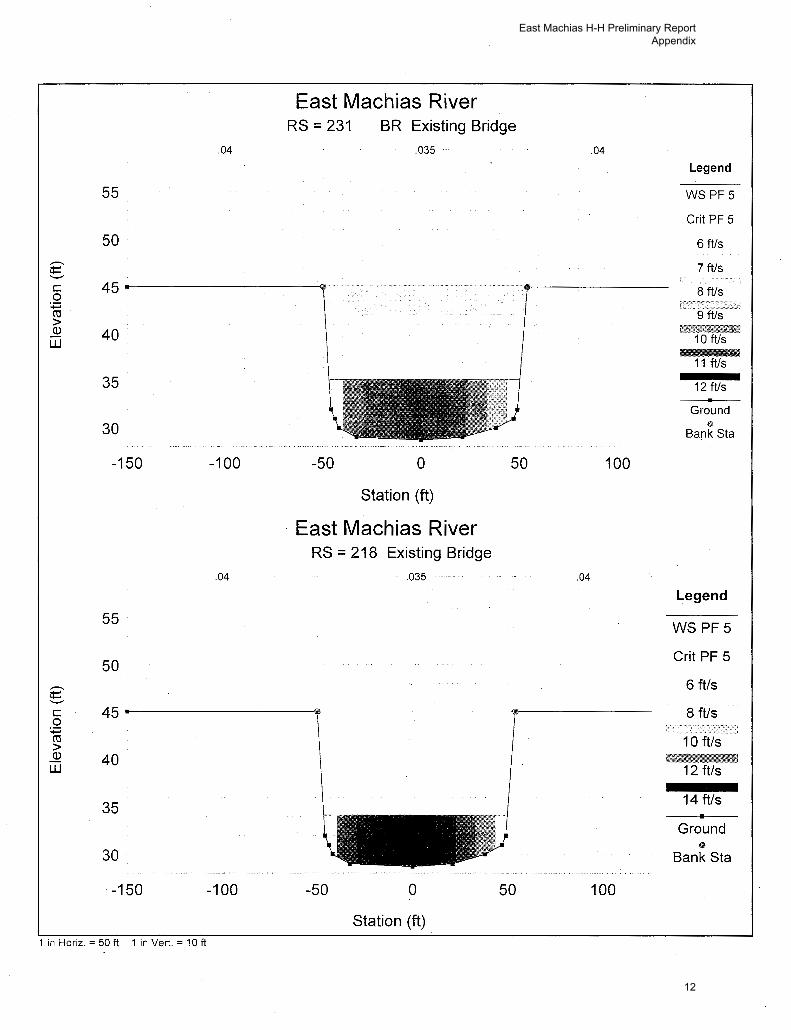
East Machias River RS = 231 BR Existing Bridge
.035
c 0 ~ co > Q)
45------------------~···
I.1J
c 0 ~ co > Q)
I.1J
40
35
30
-150
55
50
40
35
30
. -150
1 in Horiz. = 50ft 1 in Vert. = 10ft
-100
. 04
-100
-50 0
Station (ft)
East Machias River RS = 218 Existing Bridge
-50
.035 - ..
0
Station (ft)
50
50
.04
100
.04
100
Legend
WS PF5
Crit PF 5
6 ft/s
7ft/s
8 ft!s ,, ....... , ............................. ,.,. ·············gw;;
11 ft/s
12 ft!s
Ground $
Bank Sta
Legend
WSPF5
Crit PF 5
6 ft/s
8 ftls
10 ftls
12 ftls
14 ft/s
Ground e
Bank Sta
East Machias H-H Preliminary Report Appendix
12
.08 .. .035
55
50
,.-.._ 45 ¢::: .........-c 0
40 :.;::; Ctl > Q)
UJ 35
30
25. 0
.08
55
50
,.-.._ 45 ¢::: .........-c 0
40. :.;::; Ctl > Q)
UJ 35
30
25 -200
1 in Horiz. = 150 ft 1 in Vert. = 1 0 ft
.08
.. 035
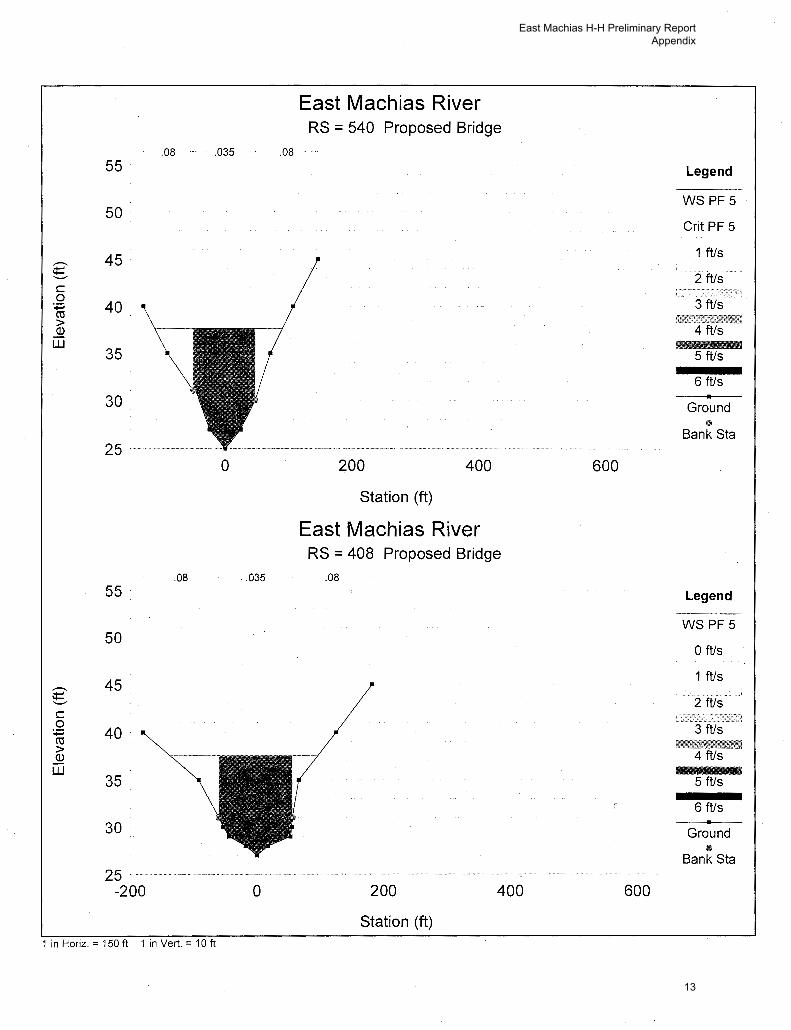
0
East Machias River RS = 540 Proposed Bridge
200 400
Station (ft)
East Machias River RS = 408 Proposed Bridge
.08
200
Station (ft)
400
600
600
Legend
WS PF5
Grit PF 5
1 ft/s
2 ft/s
3 ft/s
5 ft/s
6 ft/s
Ground 11!
Bank Sta
Legend
WS PF5
0 ft/s
1 ft/s
2 ft/s
3 ft/s
5 ft/s
6 ft/s
Ground ®
Bank Sta
East Machias H-H Preliminary Report Appendix
13
.035 .08 55. 0
8
50
..--.. 45 ¢= .__., c 0
:.;::::; 40 rn > (])
w 35
30
25 0
.04 .035
55
50 ..--.. ¢= .__., c 0
45 :.;::::; rn > (]) 40 w
35
30
0
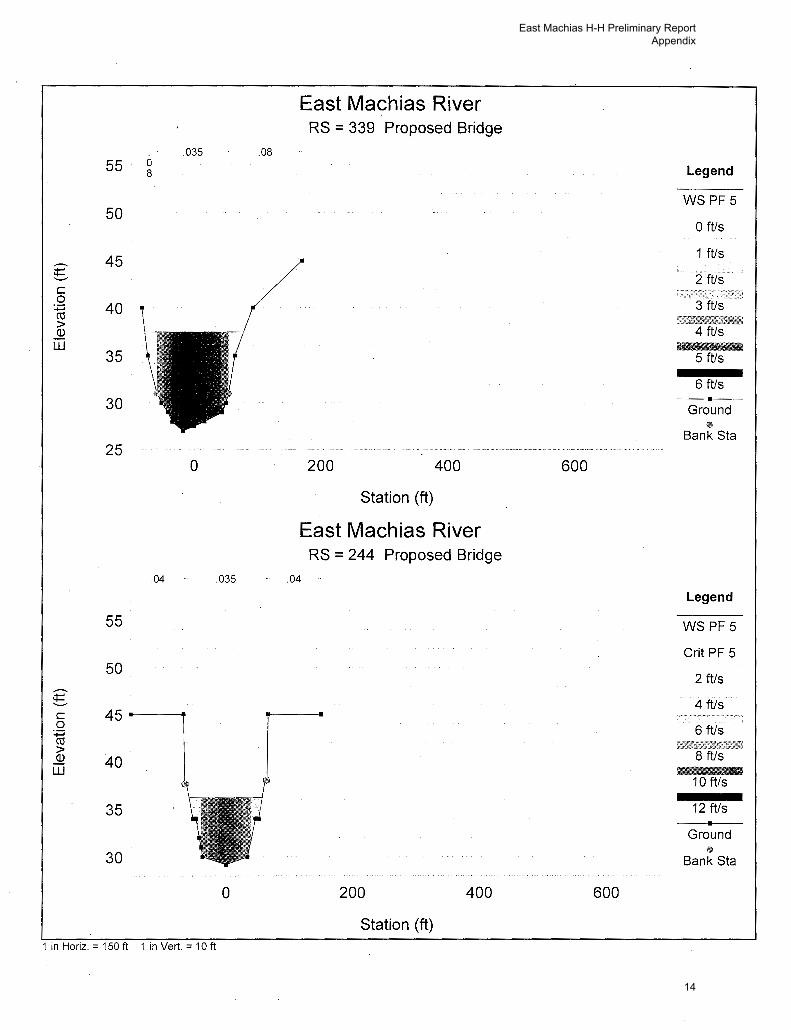
1 in Horiz. = 150 ft 1 in Vert. = 1 0 ft
East Machias River RS = 339 Proposed Bridge
200 400
Station (ft)
East Machias River RS = 244 Proposed Bridge
.04
200 400
Station (ft)
600
600
Legend
WS PF5
0 ftls
1 ftls
·· · ·· ·:Zttls···· ..... , .. , ............ , ..
· 3tus '
®flf'"1441t" 5 ftls
6 ftls
Ground @
Bank Sta
Legend
WS PF5
Grit PF 5
2 ftls
4 ftls
6Ws
10 ftls
12 ftls
Ground @)
Bank Sta
East Machias H-H Preliminary Report Appendix
14
c 0
:.;::::; ro > Q)
w
c 0
:.;::::; ro > Q)
w
55
50
25
55
50
.04
.04
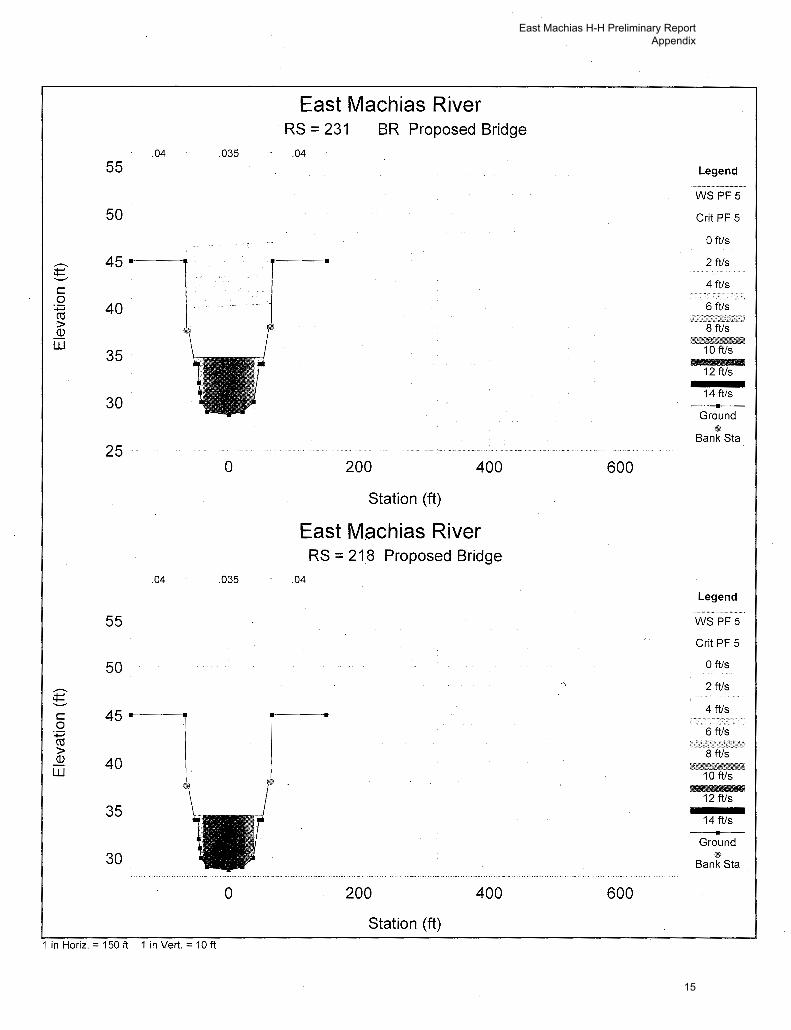
1 in Horiz. =150ft 1 in Vert.= 10ft
.035
0
.035
0
East Machias River RS = 231 BR Proposed Bridge
.04
200 400
Station (ft)
East Machias River RS = 218 Proposed Bridge
.04
200 400
Station (ft)
600
600
Legend
WS PF5
Crit PF 5
0 fVs
2 fVs
4 fVs
6 fVs
Ground €1
Bank Sta
Legend
WSPF5
Crit PF 5
0 fVs
2 fVs
4 fVs
6 fVs : .. : ........ 8 ftf~·>.: .. ::.·: .. ~
llill I 12 fVs
14 fVs
Ground @
Bank Sta
East Machias H-H Preliminary Report Appendix
15
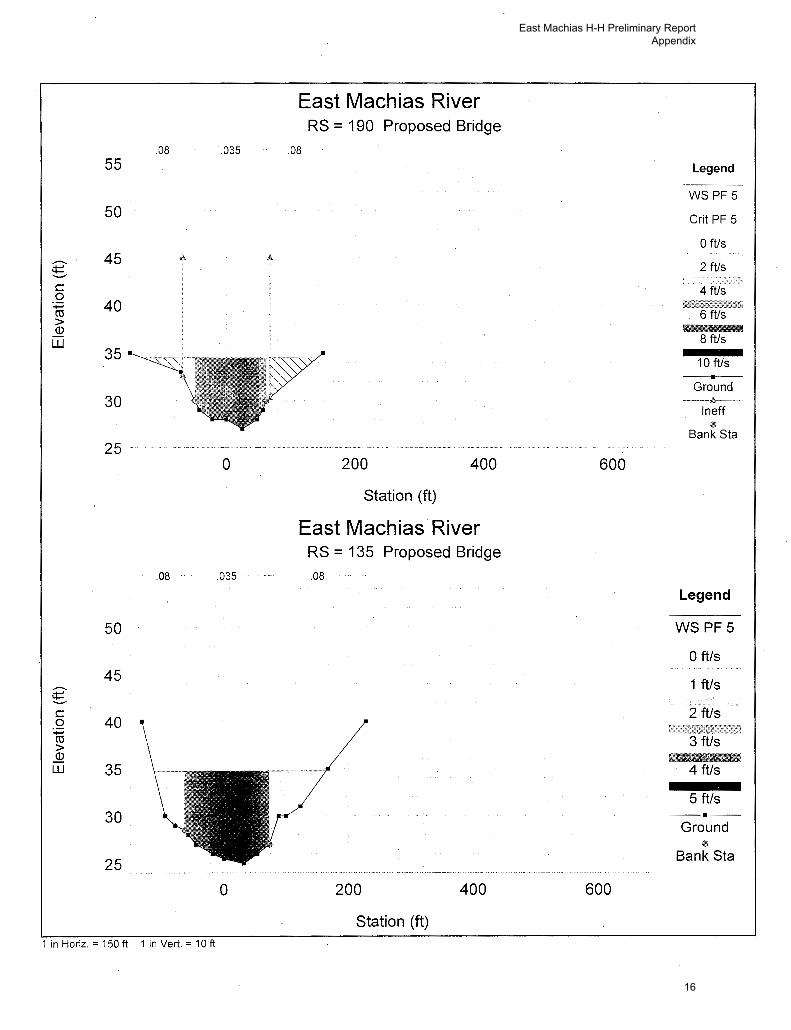
East Machias River RS = 190 Proposed Bridge
.08 .035 .08
55 Legend
WSPF5
50 Crit PF 5
0 ftls - 45 2 ftls ¢:: ._
c 4 ft/s 0 40 :.;::;
ro > Q)
8 ftls LLl 35
10 ftls
Ground 30 ·-6-----
I neff @
Bank Sta 25
0 200 400 600
Station (ft)
East Machias River RS = 135 Proposed Bridge
.08 .035 .08
Legend
50 WSPF5
0 ft/s 45
1 ftls -¢:: ._
c 2 ftls 0 40 ,. . . ::/:::~:rr:·~·:· .. ::;,_:j :.;::; ro 3 ftls > Q) IMii\*tMMW
LLl 35 4 ftls
5 ftls 30
Ground @
25 Bank Sta
-············--·· ·······-----~----· ..................
0 200 400 600
Station (ft) 1 in Horiz. = 150ft 1 in Vert. = 1 0 ft
East Machias H-H Preliminary Report Appendix
16
.08 . 50.
45
- 40 .:::: -c 0
:.;:::; 35 ct:l > Q)
w 30
25
20 ...
.08
50
45
- 40 .:::: -c 0
35 :.;:::; ct:l > Q)
w 30
25
20
.035
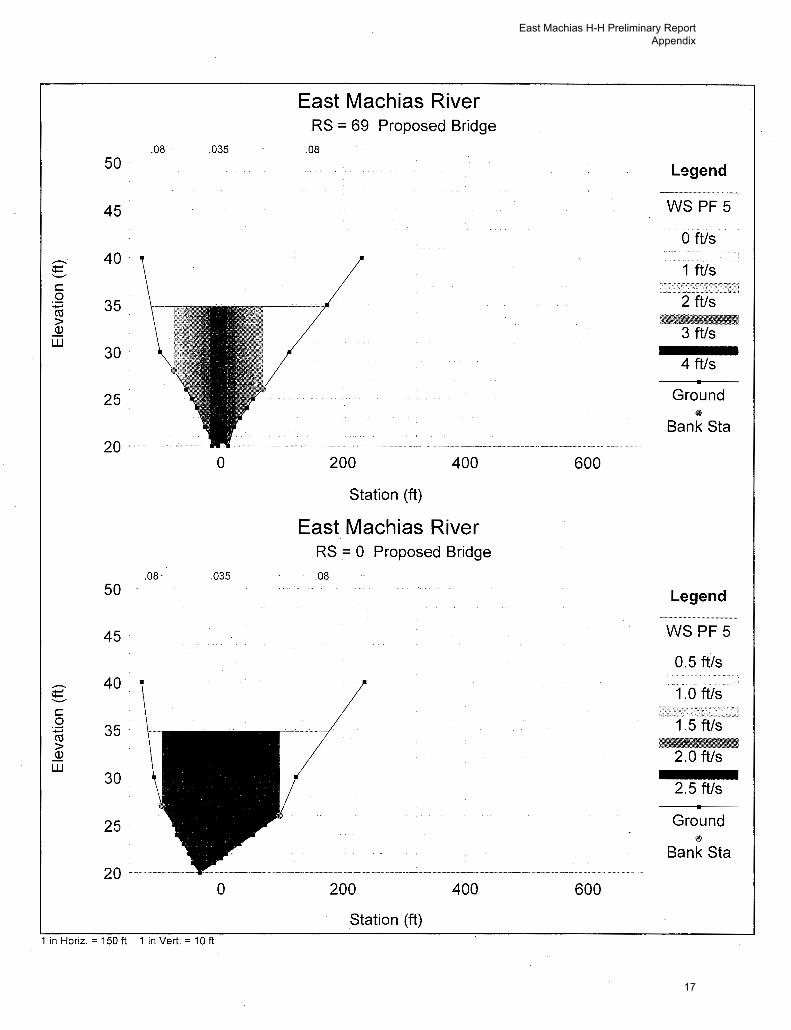
East Machias River RS = 69 Proposed Bridge
.08
4·······-················-·-···-········ ....... ······--·····-········· ·········-··--·~·····-·········· ···············-···· ... .
0
.035
0
200 400
Station (ft)
East Machias River RS = 0 Proposed Bridge
.08
600
200 400 600
Station (ft) 1 in Horiz. = 150 ft 1 in Vert. = 1 0 ft
Legend
WS PF 5
0 ft/s
1 ft/s ....................... : ..... :.,.: .. : ...... ,:: . .,;;
2 ft/s
3 ftls
4 ftls
Ground <»
Bank Sta
Legend
WSPF5
0.5 ft/s
1.0 ft/s ........ ~ .. '·•"•"'· .. 1.5 ftls
@ • mr
2.0 ft/s
2.5 ftls
Ground ®
Bank Sta
East Machias H-H Preliminary Report Appendix
17
.......... ¢::: ........-c 0 ·.o::; ro > Q)
w
.c 0
:;:::; ro > Q)
w
45
40
35
30
25
20
15 -400
50
45
40
35
30
25
.08
-200
.08
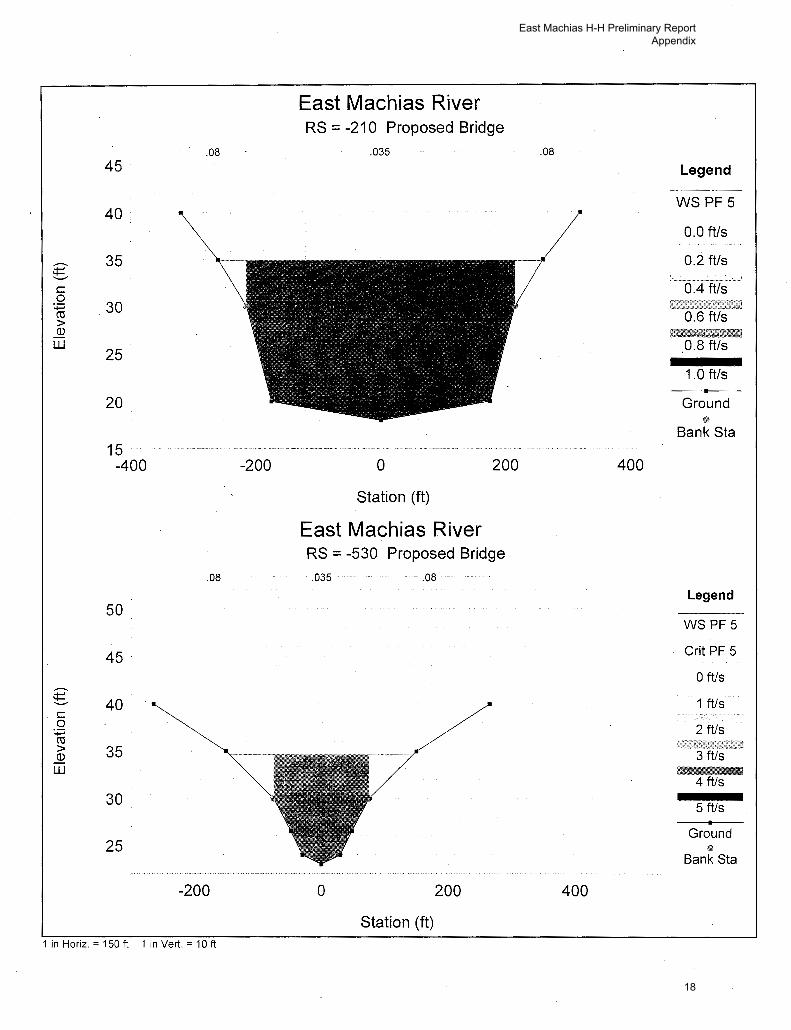
East Machias River RS = -210 Proposed Bridge
.035
0
Station (ft)
200
East Machias River RS = -530 Proposed Bridge .. 035 .. 08
-200 0 200
Station (ft) 1 in Horiz. =150ft 1 in Vert.= 10ft
.08
400
400
Legend
WSPF5
0.0 ft/s
0.2 ft/s
o.4ms··· 0.6 ft/s ~~4
0.8 ft!s
1.0 ft/s
Ground @
Bank Sta
Legend
WSPF5
Crit PF 5
0 ft/s
1 ft/s
2 ft/s ....• , ...... ., .... ,.;<'{""'"'!~;·;···;···1
' ; . ;- L .. ·.~/-,_,;<;;,,.~- .p,(,,_,, _:
3 ft/s
4 ftls
5 ft/s
Ground ®
Bank Sta
East Machias H-H Preliminary Report Appendix
18
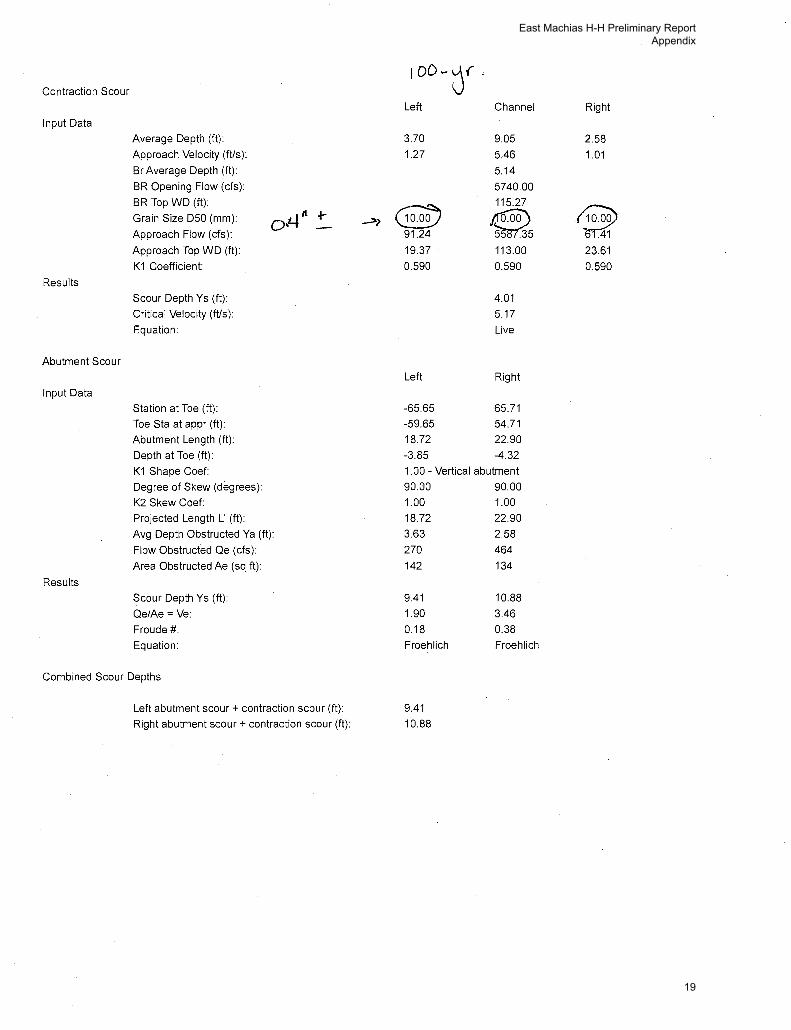
Contraction Scour
1 oo- j', Left Channel Right
Input Data
Average Depth (ft): 3.70 9.05 2.58
Approach Velocity (ftls): 1.27 5A6 1.01
Br Average Depth (ft): 5.14
BR Opening Flow (cfs): 5740.00
BR Top WD (ft):
~ 115.27
~ Grain Size D50 (mm): tl .r ~ o,LJ ~ Approach Flow (cfs): 91.24 5 6
Approach Top WD (ft): 19.37 113.00 23.61
K1 Coefficient: 0.590 0.590 0.590
Results
Scour Depth Ys (ft): 4.01
Critical Velocity (ftls): 5.17
Equation: Live
Abutment Scour
Left Right
Input Data
Station at Toe (ft): -65.65 65.71
Toe Sta at appr (ft): -59.65 54.71
Abutment Length (ft): 18.72 22.90
Depth at Toe (ft): -3.85 -4.32
K1 Shape Coef: 1.00 -Vertical abutment
Degree of Skew (degrees): 90.00 90.00
K2 Skew Coef: 1.00 1.00
Projected Length L' (ft): 18.72 22.90
Avg Depth Obstructed Ya (ft): 3.63 2.58
Flow Obstructed Qe (cfs): 270 464
Area Obstructed Ae (sq ft): 142 134
Results
Scour Depth Ys (ft): 9.41 10.88
Qe/Ae = Ve: 1.90 3.46
Froude #: 0.18 0.38
Equation: Froehlich Froehlich
Combined Scour Depths
Left abutment scour+ contraction scour (ft): 9.41
Right abutment scour+ contraction scour (ft): 10.88
East Machias H-H Preliminary Report Appendix
19
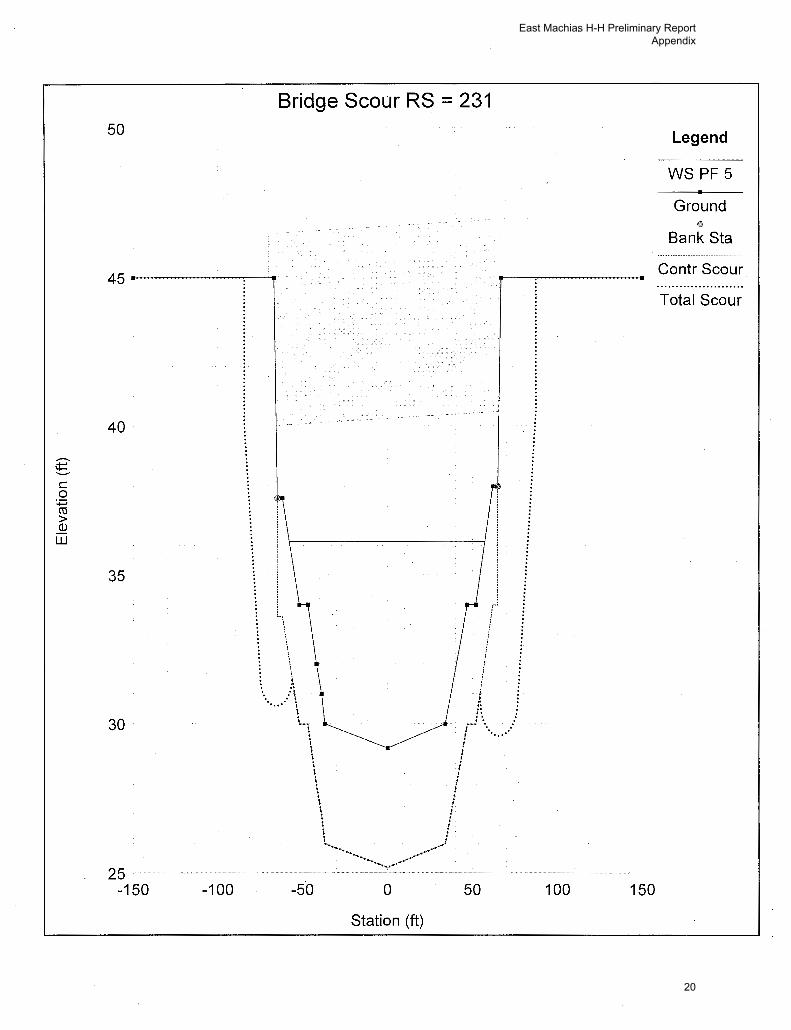
Bridge Scour RS = 231 50 Legend
WSPF5
Ground $)
Bank Sta
Contr Scour
Total Scour
40
----. ¢::: --c 0
:;:::; ro > Q)
w
35
i :\
·. : \ i • •••• • \ t•
30 \ ;: L, ;·.
t i_. .. ·· ...... · \ ! I I t ! \ ! \ ! \ ! \ ! \ I \ ; \ i 1 I \ ! \ I
t_ _..i -....... ... ...... ..., ..... '·-·---.......... -.....
2 5 --····- - ·················---· ---·-·----··--····--···----·-·-·----·-··-·-··--··-·-··---···- ----··-·--·---------··--··--··--·-----···----150 -1 00 -50 0 50 1 00 150
Station (ft)
East Machias H-H Preliminary Report Appendix
20
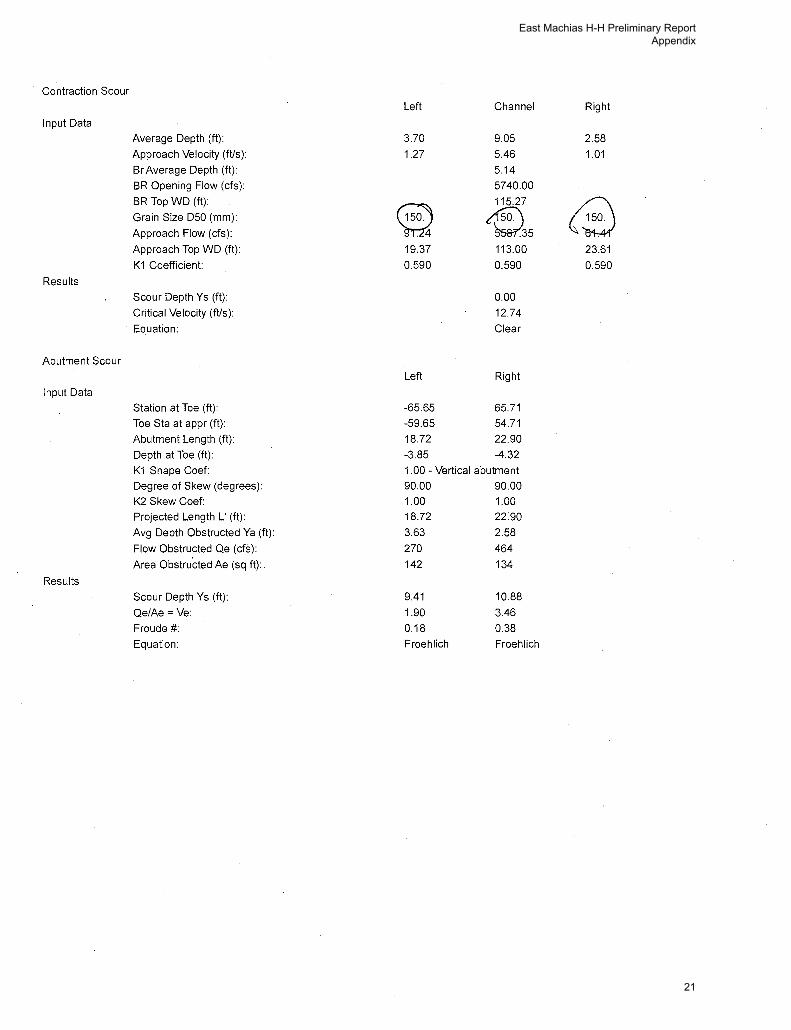
Contraction Scour
Left Channel Right
Input Data
Average Depth (ft): 3.70 9.05 2.58
Approach Velocity (ft!s): 1.27 5.46 1.01
Br Average Depth (ft): 5.14
BR Opening Flow (cfs): 5740.00
BR Top WD (ft):
~ 115.27 (@ Grain Size D50 (mm): ~ Approach Flow (cfs): 4 35
Approach Top WD (ft): 19.37 113.00 23.61
K1 Coefficient: 0.590 0.590 0.590
Results
Scour Depth Ys (ft): 0.00
Critical Velocity (ftls): 12.74
Equation: Clear
Abutment Scour
Left Right
Input Data
Station at Toe (ft): -65.65 65.71
Toe Sta at appr (ft): -59.65 54.71
Abutment Length (ft): 18.72 22.90
Depth at Toe (ft): -3.85 -4.32
K1 Shape Coef: 1.00 -Vertical abutment
Degree of Skew (degrees): 90.00 90.00
K2 Skew Coef: 1.00 1.00
Projected Length L' (ft): 18.72 22:90
Avg Depth Obstructed Ya (ft): 3.63 2.58
Flow Obstructed Qe (cfs): 270 464
Area Obstru.cted Ae (sq ft):. 142 134
Results
Scour Depth Ys (ft): 9.41 10.88
Qe/Ae = Ve: 1.90 3.46
Froude #: 0.18 0.38
Equation: Froehlich Froehlich
East Machias H-H Preliminary Report Appendix
21
50
30
25 .. -150
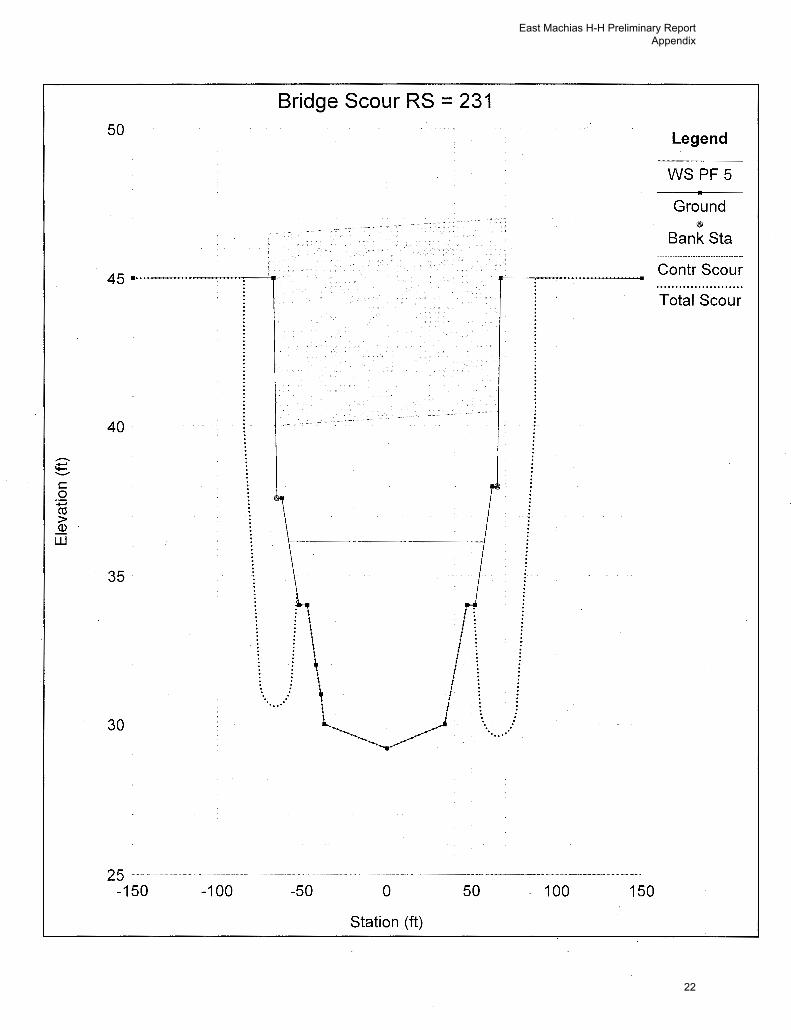
Bridge Scour RS = 231
-100 -50 0
Station (ft)
50 100 150
Legend
WS PF 5
Ground fij
Bank Sta
Contr Scour
Total Scour
East Machias H-H Preliminary Report Appendix
22
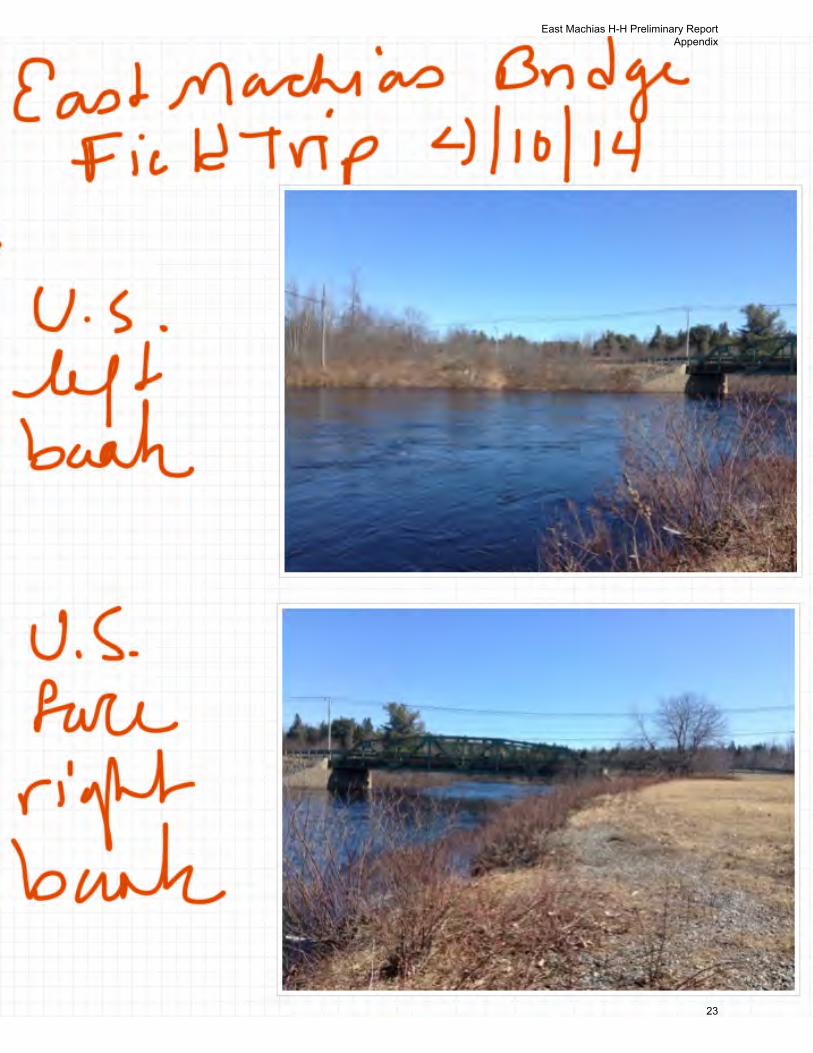
East Machias H-H Preliminary Report Appendix
23
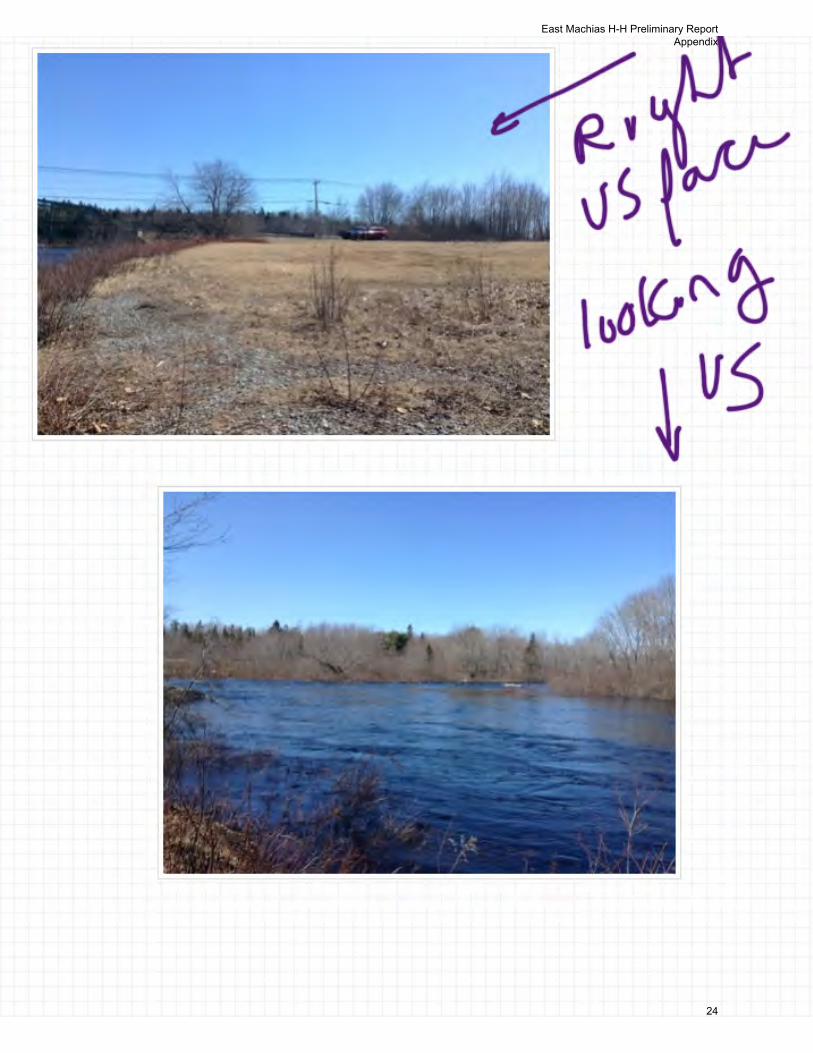
East Machias H-H Preliminary Report Appendix
24
East Machias H-H Preliminary Report Appendix
25
East Machias H-H Preliminary Report Appendix
26
East Machias H-H Preliminary Report Appendix
27
East Machias H-H Preliminary Report Appendix
28
East Machias H-H Preliminary Report Appendix
29
East Machias H-H Preliminary Report Appendix
30
East Machias H-H Preliminary Report Appendix
31
East Machias H-H Preliminary Report Appendix
32
East Machias H-H Preliminary Report Appendix
33
East Machias H-H Preliminary Report Appendix
34
East Machias H-H Preliminary Report Appendix
35
East Machias H-H Preliminary Report Appendix
36
East Machias H-H Preliminary Report Appendix
37
East Machias H-H Preliminary Report Appendix
38
East Machias H-H Preliminary Report Appendix
39