appendix f disposal area monitoring system damos: … · 1.6 2014 survey objectives ... nef nikon...
TRANSCRIPT

Supplemental Environmental Impact Statement for the Designation of Dredged Material Disposal Site(s) in
Eastern Long Island Sound, Connecticut and New York
APPENDIX F
Disposal Area Monitoring System – DAMOS: Data Summary Report of the New London
Disposal Site and Vicinity Sediment Profile and Plan-View Imaging Survey
Prepared for: United States Army Corps of Engineers
Prepared by: DAMOS Vision
March 2015

[This page intentionally left blank.]

Data Summary Report: New London Disposal Site and Vicinity Sediment-Profile and Plan-View Imaging Survey September 2014
Disposal Area Monitoring System DAMOS
Data Summary Report 2015-01 March 2015

This report should be cited as:
Carey, D. A.; Bellagamba Fucile, E. 2015. Data Summary Report of the New London Disposal Site and Vicinity Sediment-Profile and Plan-View Imaging Survey, September 2014. U.S. Army Corps of Engineers, New England District, Concord, MA, 45 pp.
Note on units of this report: As a scientific data summary, information and data are presented in the metric system. However, given the prevalence of English units in the dredging industry of the United States, conversions to English units are provided for general information in Section 1. A table of common conversions can be found in Appendix A.

i
DAMOS Data Summary Report – New London Disposal Site and Vicinity Sediment-Profile and Plan-View Imaging Survey, September 2014
TABLE OF CONTENTS
Page
1.0 INTRODUCTION .......................................................................................................... 1
1.1 Overview of the DAMOS Program ................................................................................ 1
1.2 Overview of EPA’s Preparation of an SEIS for ELIS .................................................... 2
1.3 Introduction to the New London Disposal Site, Historic Niantic Bay Disposal Site, and the General Survey Area .................................................................................. 2
1.4 Previous NLDS Monitoring Surveys .............................................................................. 2
1.5 Recent Dredged Material Disposal Activity at NLDS .................................................... 3
1.6 2014 Survey Objectives .................................................................................................. 3
2.0 METHODS ..................................................................................................................... 5
2.1 Navigation and On-Board Data Acquisition ................................................................... 5
2.2 Sediment-Profile and Plan-View Imaging Survey .......................................................... 5 2.2.1 Sediment-Profile Imaging ........................................................................................... 5 2.2.2 Plan-View Imaging ..................................................................................................... 6 2.2.3 SPI and PV Survey Planning ...................................................................................... 7 2.2.4 SPI and PV Data Collection ........................................................................................ 7 2.2.5 SPI and PV Data Analysis .......................................................................................... 8
2.3 NLDS Substrata Characteristics ..................................................................................... 9
3.0 RESULTS ..................................................................................................................... 19
3.1 Sediment-Profile and Plan-View Imaging .................................................................... 19 3.1.1 Eastern Reference Areas (NE-REF, and NLON-REF) ............................................. 19 3.1.2 New London Disposal Site Stations ......................................................................... 20 3.1.3 Northern and Southern Transect Stations, Including the Central Reference
Areas (NLON-ALT, and WREF) ............................................................................. 20 3.1.4 Niantic Bay Disposal Site Stations ........................................................................... 21
4.0 SUMMARY .................................................................................................................. 39
5.0 REFERENCES ............................................................................................................. 44
6.0 DATA TRANSMITTAL .............................................................................................. 45
ii
DAMOS Data Summary Report – New London Disposal Site and Vicinity Sediment-Profile and Plan-View Imaging Survey, September 2014
APPENDICES
A Table of Common Conversions
B NLDS/NBDS 2014 Survey Actual SPI/PV Replicate Locations
C Sediment-Profile and Plan-View Image Analysis Results for NLDS/NBDS Survey, September 2014
D Grain Size Scale for Sediments

iii
DAMOS Data Summary Report – New London Disposal Site and Vicinity Sediment-Profile and Plan-View Imaging Survey, September 2014
LIST OF TABLES Page
Table 2-1. NLDS Target SPI/PV Station IDs/Locations ........................................................ 10
Table 2-2. Substrata Habitat Types ........................................................................................ 13
Table 3-1. Summary of Substratum and Grain Size Major Mode (averaged across replicates) .............................................................................................................. 22
Table 4-1. Cross-walk of Substrata to LISS Habitats (Auster et al. 2009) ............................ 40

iv
DAMOS Data Summary Report – New London Disposal Site and Vicinity Sediment-Profile and Plan-View Imaging Survey, September 2014
LIST OF FIGURES Page
Figure 1-1. Location of NLDS and NBDS ................................................................................ 4
Figure 2-1. Schematic diagram of the SPI/PV camera deployment ........................................ 14
Figure 2-3. Actual SPI/PV station locations and names at NBDS and the western section of the transects .......................................................................................... 16
Figure 2-4. Actual SPI/PV station locations and names at NLDS, the eastern section of the transects, and the central reference areas ........................................................ 17
Figure 2-5. Actual SPI/PV station locations at the eastern-most reference areas ................... 18
Figure 3-1. Sediment grain size major mode (phi units) at the eastern-most reference areas ...................................................................................................................... 24
Figure 3-2. Substrata characteristics at the eastern-most reference areas ............................... 25
Figure 3-3. Camera penetration depths at the eastern-most reference areas ........................... 26
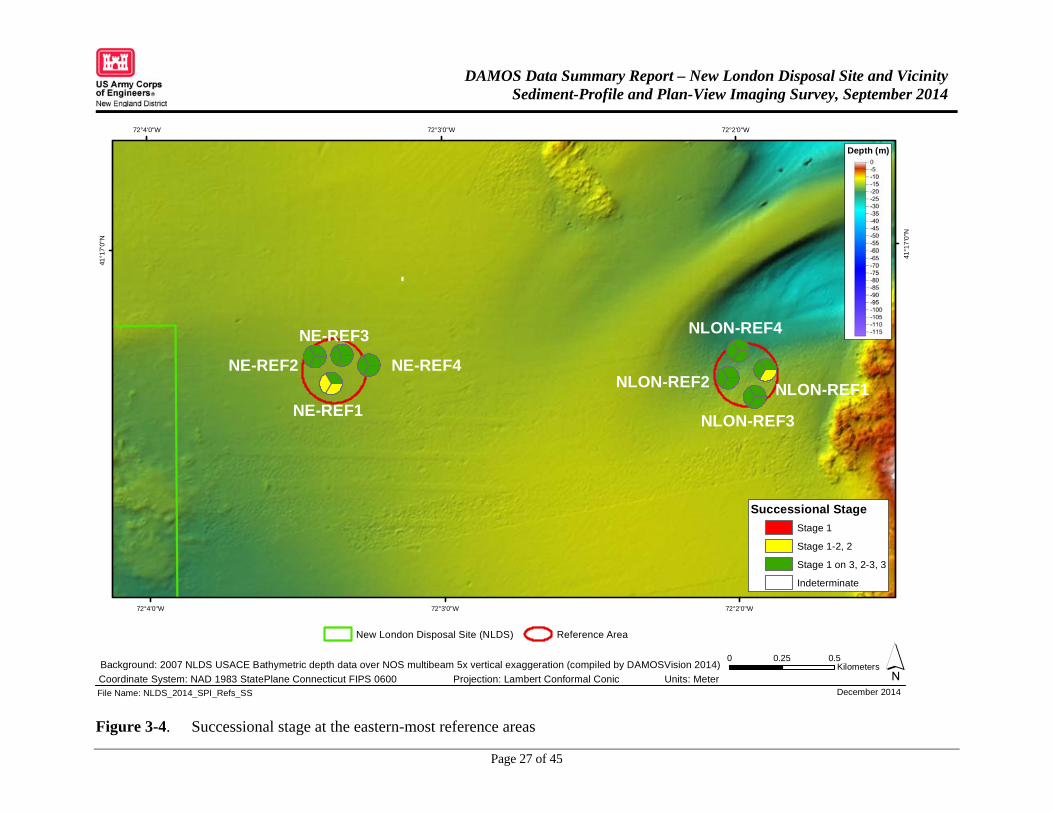
Figure 3-4. Successional stage at the eastern-most reference areas ........................................ 27
Figure 3-5. Apparent Redox Potential Discontinuity (aRPD) at the eastern-most reference areas ...................................................................................................... 28
Figure 3-6. Sediment grain size major mode (phi units) within NLDS, the eastern transect stations, and the central reference areas .................................................. 29
Figure 3-7. Substrata characteristics within NLDS, the eastern transect stations, and the central reference areas ..................................................................................... 30
Figure 3-8. Camera penetration depths within NLDS, the eastern transect stations, and the central reference areas ..................................................................................... 31
Figure 3-9. Successional stage within NLDS, the eastern transect stations, and the central reference areas ........................................................................................... 32
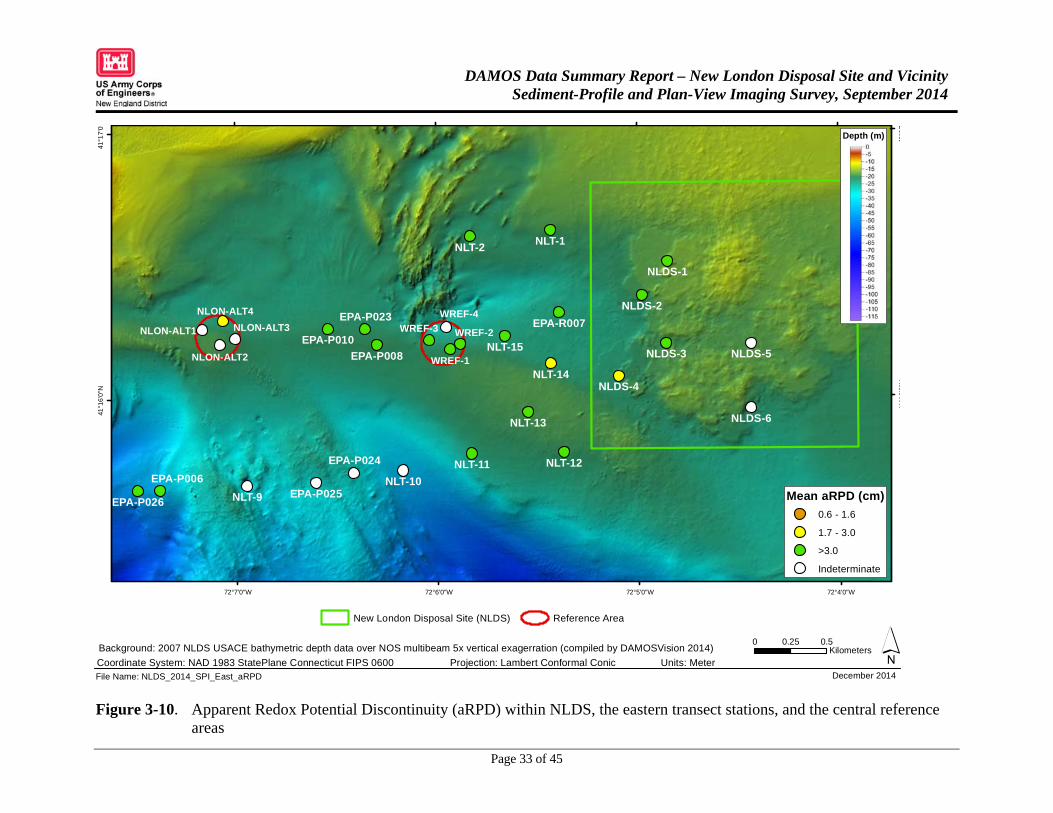
Figure 3-10. Apparent Redox Potential Discontinuity (aRPD) within NLDS, the eastern transect stations, and the central reference areas .................................................. 33
Figure 3-11. Sediment grain size major mode (phi units) at stations within NBDS and the western transect stations.................................................................................. 34
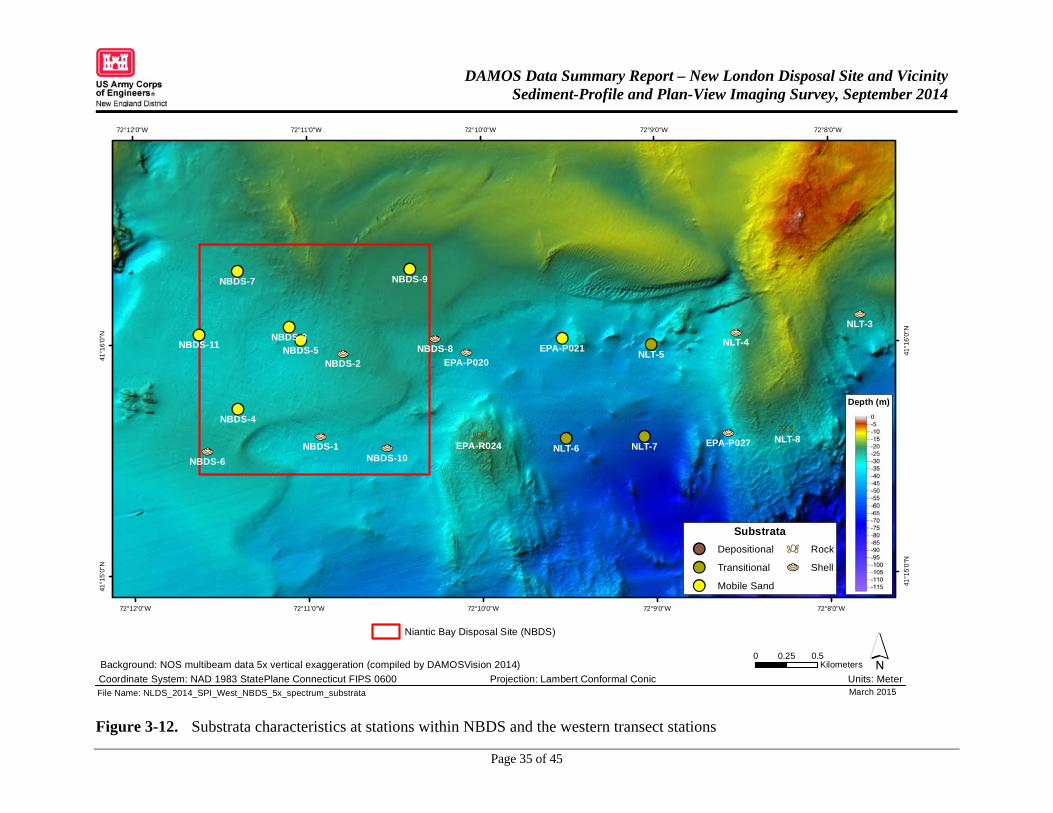
Figure 3-12. Substrata characteristics at stations within NBDS and the western transect stations .................................................................................................................. 35

v
DAMOS Data Summary Report – New London Disposal Site and Vicinity Sediment-Profile and Plan-View Imaging Survey, September 2014
Figure 3-13. Camera penetration depths at stations within NBDS and the western transect stations ..................................................................................................... 36
Figure 3-14. Apparent Redox Potential Discontinuity (aRPD) at stations within NBDS and the western transect stations ........................................................................... 37
Figure 3-15. Successional stage at stations within NBDS and the western transect stations areas ......................................................................................................... 38
Figure 4-1. Representative images from western part of the study area ................................. 41
Figure 4-2. Representative images from eastern part of the study area ................................... 42
Figure 4-3. Representative images from eastern-most reference areas ................................... 43

vi
DAMOS Data Summary Report – New London Disposal Site and Vicinity Sediment-Profile and Plan-View Imaging Survey, September 2014
LIST OF ACRONYMS
aRPD apparent redox potential discontinuity
CAD confined aquatic disposal
CLDS Central Long Island Sound
CSDS Cornfield Shoals
DAMOS Disposal Area Monitoring System
DGPS differential global positioning system
ELIS Eastern Long Island Sound
EPA Environmental Protection Agency
GIS graphic information system
GPS global positioning system
JPEG Joint Photographic Experts Group
NBDS Niantic Bay Disposal Site
NLDS New London Disposal Site
NAE New England District
NEF Nikon Electronic Format
ODMDS Ocean Dredged Material Disposal Sites
PV plan-view
RGB red green blue (file format)
SBAS satellite-based differential corrections
SEIS Supplemental Environmental Impact Statement
SHP shapefile or geospatial data file
SOP Standard Operating Procedures
SPI sediment-profile imaging
TIF tagged image file
USACE U.S. Army Corps of Engineers
USCG U.S. Coast Guard
WLDS Western Long Island Sound

Page 1 of 45
DAMOS Data Summary Report – New London Disposal Site and Vicinity Sediment-Profile and Plan-View Imaging Survey, September 2014
1.0 INTRODUCTION
A sediment-profile (SPI) and plan-view (PV) imaging survey was conducted at the New London Disposal Site (NLDS) and within an area extending west of NLDS to, and including, the historic Niantic Bay Disposal Site (NBDS). This SPI/PV survey took place in September 2014 as part of the U.S. Army Corps of Engineers (USACE) New England District (NAE) Disposal Area Monitoring System (DAMOS) Program. DAMOS is a comprehensive monitoring and management program designed and conducted to address environmental concerns surrounding the placement of dredged material at aquatic disposal sites throughout the New England region. An introduction to the DAMOS Program, NLDS, and NBDS, including brief descriptions of previous dredged material disposal and site monitoring activities, is provided below.
1.1 Overview of the DAMOS Program
The DAMOS Program features a tiered management protocol designed to ensure that any potential adverse environmental impacts associated with dredged material disposal are promptly identified and addressed (Germano et al. 1994). For over 35 years, the DAMOS Program has collected and evaluated disposal site data throughout New England. Based on these data, patterns of physical, chemical, and biological responses of seafloor environments to dredged material disposal activity have been documented (Fredette and French 2004).
DAMOS monitoring surveys fall into two general categories: confirmatory studies and focused studies. Confirmatory studies are designed to test hypotheses related to expected physical and ecological response patterns following placement of dredged material on the seafloor at established, active disposal sites. The data collected and evaluated during these studies provide answers to strategic management questions in determining the next step in the disposal site management process. Focused studies are periodically undertaken within the DAMOS Program to evaluate inactive or historical disposal sites and contribute to the development of dredged material placement and capping techniques. The resulting information from DAMOS surveys is used to guide the management of disposal activities at existing sites, plan for use of future sites, and evaluate the long term status of historic sites. The 2014 NLDS/NBDS investigation was a focused study designed as a reconnaissance survey in support of the Environmental Protection Agency’s (EPA) Supplemental Environmental Impact Statement (SEIS) for designating one or more regional dredged material disposal sites in Eastern Long Island Sound (ELIS).
Two primary goals of DAMOS confirmatory monitoring surveys are to document the physical location and stability of dredged material placed into the aquatic environment and to evaluate the biological recovery of the benthic community following placement of dredged material. Several survey techniques are employed in order to characterize these responses to dredged material placement. Sequential acoustic monitoring surveys (including bathymetric, acoustic backscatter, and side-scan sonar data collection) are performed to characterize the height and spread of discrete dredged material deposits or mounds created at open water sites as well as the accumulation/consolidation of dredged material into confined aquatic disposal (CAD) cells. Sediment-profile imaging (SPI) and plan-view underwater camera photography, referred to as plan-view (PV) imaging, surveys are performed to provide further physical characterization of the material and to support evaluation of seafloor (benthic) habitat conditions and recovery over

Page 2 of 45
DAMOS Data Summary Report – New London Disposal Site and Vicinity Sediment-Profile and Plan-View Imaging Survey, September 2014
time. Each type of data collection activity is conducted periodically at disposal sites, and the conditions found after a defined period of disposal activity are compared with the long-term data set at a specific site to determine the next step in the disposal site management process (Germano et al. 1994). Focused DAMOS monitoring surveys may also feature additional types of data collection activities as deemed appropriate to achieve specific survey objectives, such as sub-bottom profiling, towed video, sediment coring, or grab sampling.
1.2 Overview of EPA’s Preparation of an SEIS for ELIS
Currently there are four dredged material disposal sites in Long Island Sound: Western Long Island Sound (WLDS), Central Long Island Sound (CLDS), Cornfield Shoals (CSDS), and New London (NLDS). WLDS and CLDS were designated for long-term use by the Environmental Protection Agency (EPA) as Ocean Dredged Material Disposal Sites (ODMDSs) on June 5, 2005. CSDS and NLDS sites were selected by USACE for short-term use and are due to close on December 16, 2016. As these two eastern sites are slated to close, the EPA posted a Notice of Intent on 4 October 2012 to prepare a Supplemental Environmental Impact Statement (SEIS) to evaluate the potential designation of one or more new ODMDSs to serve the eastern Long Island Sound region.
1.3 Introduction to the New London Disposal Site, Historic Niantic Bay Disposal Site, and the General Survey Area
NLDS is an active open-water dredged material disposal site located 5.4 km (3.1 nmi) south of Eastern Point, Groton, Connecticut (Figure 1-1) centered at 41º16.306´ N, 72º 04.571´ W (NAD 83). Water depths range from 13.4 m (43 ft) to 24.3 m (79 ft) at its deepest point (AECOM 2009).
NBDS is an inactive historical disposal site that has not been used since likely 1972 (per notes from 1990 from Dr. Thomas Fredette, former DAMOS Program Manager). The center of the site is located approximately 2.6 km (1.4 nmi) southeast of Black Point, Niantic, Connecticut, and is being examined as a potential location for disposal site alternatives (Figure 1-1).
The area surveyed between these two disposal sites includes a wide range of depths and zones of apparent active sediment transport. The SEIS is considering sites deeper than 18 m in the vicinity of major shipping corridors and lanes and may consider sites shallower than 18 m that are more remote from transportation corridors. The areas surveyed were selected to represent water depths at, or deeper than, the water depths of NLDS.
1.4 Previous NLDS Monitoring Surveys
The most recent survey at NLDS was conducted in July/August 2007 (AECOM 2009). Historic and previous dredged material disposal activity and monitoring events are summarized in AECOM (2009).

Page 3 of 45
DAMOS Data Summary Report – New London Disposal Site and Vicinity Sediment-Profile and Plan-View Imaging Survey, September 2014
1.5 Recent Dredged Material Disposal Activity at NLDS
Since the July/August 2007 survey approximately 20,000 cy (15,290 m³) of dredged material has been disposed of at NLDS.
1.6 2014 Survey Objectives
The objective of this survey was to use SPI/PV imaging to define the physical characteristics of surficial sediment and to assess the benthic community status of selected areas within NLDS and over an area extending 7 km west up to and including the historic NBDS.

Page 4 of 45
DAMOS Data Summary Report – New London Disposal Site and Vicinity Sediment-Profile and Plan-View Imaging Survey, September 2014
Figure 1-1. Location of NLDS and NBDS
72°2'0"W
72°2'0"W
72°3'0"W
72°3'0"W
72°4'0"W
72°4'0"W
72°5'0"W
72°5'0"W
72°6'0"W
72°6'0"W
72°7'0"W
72°7'0"W
72°8'0"W
72°8'0"W
72°9'0"W
72°9'0"W
72°10'0"W
72°10'0"W
72°11'0"W
72°11'0"W
72°12'0"W
72°12'0"W
41°1
9'0
"N
41°1
9'0"
N
41°1
8'0"
N
41°1
8'0
"N
41°1
7'0
"N
41°1
7'0
"N
41°1
6'0
"N
41°1
6'0
"N
41°1
5'0
"N
41°1
5'0
"N
December 2014
Coordinate System: NAD 1983 StatePlane Connecticut FIPS 0600 Projection: Lambert Conformal Conic Units: Meter
Background: 2007 USACE NLDS Bathymetric depth data over NOS multibeam 5x vertical exaggeration (compiled by DAMOSVision 2014)
New LondonNiantic
5.3
8 k
m
Eastern Point
CTRI
´File: NLDS_2014_Overview
0 21Kilometers
New London Disposal Site (NLDS) Niantic Bay Disposal Site (NBDS)NY
NLDS
NBDS
2.9 km
Black Point
Depth (m)

Page 5 of 45
DAMOS Data Summary Report – New London Disposal Site and Vicinity Sediment-Profile and Plan-View Imaging Survey, September 2014
2.0 METHODS
The September 2014 survey at NLDS, NBDS and the area between the two sites was conducted by a team of investigators from DAMOSVision (CR Environmental and Germano & Associates) aboard the 45-foot F/V Florence. The SPI/PV survey was conducted on 16-17 September 2014. An overview of the methods used to collect, process, and analyze the survey data is provided below. Detailed Standard Operating Procedures (SOPs) for data collection and processing are available in Carey et al. (2013).
2.1 Navigation and On-Board Data Acquisition
Navigation for the survey was accomplished using a Trimble AG132 Differential Global Positioning System (DGPS) capable of receiving satellite-based differential corrections (SBAS) and U.S. Coast Guard (USCG) Beacon corrections. The DGPS system was interfaced to a laptop computer running HYPACK® hydrographic survey software.
The focus was to accurately occupy pre-established SPI survey target locations. HYPACK® continually recorded vessel position and DGPS satellite quality and provided a steering display for the vessel captain to navigate to the pre-established targets.
Station target locations were entered into HYPACK® and viewed with a heads up display by the ship’s captain. When the vessel approached the center of the target location, the winch operator began the process of lowering the camera to the seafloor. The camera was lifted over the starboard side using a Pullmaster winch and boom, and then transferred to a stern gallows frame and trawl winch. The trawl winch lowered the camera to the seafloor. When the winch wire went slack, the deck hand signaled the winch operator and navigator to stop the winch and electronically record the vessel’s position. Each replicate camera position was electronically recorded and linked to the SPI log by station number and replicate with a time stamp and position.
2.2 Sediment-Profile and Plan-View Imaging Survey
Sediment-profile imaging (SPI) and plan-view (PV) imaging are monitoring techniques used to provide data on the physical characteristics of the seafloor and the status of the benthic biological community.
2.2.1 Sediment-Profile Imaging
Sediment-profile imaging (SPI) involves deploying an underwater camera system to photograph a cross section of the sediment-water interface. In the 2014 survey at NLDS/NBDS, high-resolution SPI images were acquired using a Nikon® D7100 digital single-lens reflex camera mounted inside an Ocean Imaging® Model 3731 pressure housing system. The pressure housing sat atop a wedge-shaped prism with a front faceplate and a back mirror. The mirror was mounted at a 45° angle to reflect the profile of the sediment-water interface. As the prism penetrated the seafloor, a trigger activated a time-delay circuit that fired an internal strobe to obtain a cross-sectional image of the upper 15–20 cm of the sediment column (Figure 2-1).

Page 6 of 45
DAMOS Data Summary Report – New London Disposal Site and Vicinity Sediment-Profile and Plan-View Imaging Survey, September 2014
The camera remained on the seafloor for approximately 20 seconds to ensure that a successful image had been obtained. Details of the camera settings for each digital image are available in the associated parameters file embedded in each electronic image file. For this survey, the ISO-equivalent was set at 640, shutter speed was 1/250, f-stop was f9, and storage was in compressed raw Nikon Electronic Format (NEF) files (approximately 20 MB each). Electronic files were converted to high-resolution JPEG (8-bit) format files (3264 × 4928 pixels) using Nikon Capture® NX2 software (Version 2.2.7).
Test exposures of the Kodak® Color Separation Guide (Publication No. Q-13) were made on deck at the beginning and end of the survey to verify that all internal electronic systems were working to design specifications and to provide a color standard against which final images could be checked for proper color balance. After deployment of the camera at each station, the frame counter was checked to ensure that the requisite number of replicates had been obtained. In addition, a prism penetration depth indicator on the camera frame was checked to verify that the optical prism had actually penetrated the bottom to a sufficient depth. If images were missed or the penetration depth was insufficient, the camera frame stop collars were adjusted and/or weights were added or removed, and additional replicate images were taken. Changes in prism weight amounts, the presence or absence of mud doors, and frame stop collar positions were recorded for each replicate image.
Each image was assigned a unique time stamp in the digital file attributes by the camera’s data logger and cross-checked with the time stamp in the navigational system’s computer data file. In addition, the field crew kept redundant written sample logs. Images were downloaded periodically to verify successful sample acquisition and/or to assess what type of sediment/depositional layer was present at a particular station. Digital image files were renamed with the appropriate station names immediately after downloading as a further quality assurance step.
2.2.2 Plan-View Imaging
An Ocean Imaging® Model DSC16000 plan-view underwater camera (PV) system with two Ocean Imaging® Model 400-37 Deep Sea Scaling lasers mounted to the DSC16000 was attached to the sediment-profile camera frame and used to collect plan-view photographs of the seafloor surface; both SPI and PV images were collected during each “drop” of the system. The PV system consisted of a Nikon D-7000 encased in an aluminum housing, a 24 VDC autonomous power pack, a 500 W strobe, and a bounce trigger. A weight was attached to the bounce trigger with a stainless steel cable so that the weight hung below the camera frame; the scaling lasers projected two red dots that are separated by a constant distance (26 cm) regardless of the field-of-view of the PV system, which can be varied by increasing or decreasing the length of the trigger wire. As the camera apparatus was lowered to the seafloor, the weight attached to the bounce trigger contacted the seafloor prior to the camera frame hitting the bottom and triggered the PV camera (Figure 2-1). Details of the camera settings for each digital image are available in the associated parameters file embedded in each electronic image file; for this survey, the ISO-equivalent was set at 640 on the first survey day and then changed to 400 on the second survey day due to overexposure because of shell hash. The additional camera settings used were as follows: shutter speed 1/20, f14, white balance set to flash, color mode set to

Page 7 of 45
DAMOS Data Summary Report – New London Disposal Site and Vicinity Sediment-Profile and Plan-View Imaging Survey, September 2014
Adobe RGB, sharpening set to none, noise reduction off, and storage in compressed raw NEF files (approximately 20 MB each). Electronic files were converted to high-resolution JPEG (8-bit) format files (3264 × 4928 pixels) using Nikon Capture® NX2 software.
Prior to field operations, the internal clock in the digital PV system was synchronized with the GPS navigation system and the SPI camera. Each PV image acquired was assigned a time stamp in the digital file and redundant notations in the field and navigation logs. Throughout the survey, PV images were downloaded at the same time as the SPI images after collection and evaluated for successful image acquisition and image clarity.
The ability of the PV system to collect usable images was dependent on the clarity of the water column. Water conditions at NLDS allowed a trigger wire length of 45 to 53 cm, resulting in an area of bottom visualization approximately 60 cm × 40 cm in size.
2.2.3 SPI and PV Survey Planning
For the NLDS/NBDS survey, a total of 60 SPI/PV stations were planned; 6 stations within NLDS, 11 stations within NBDS, 27 transect stations in the area between the two sites, and 4 stations in each of four reference areas (Figure 2-2).
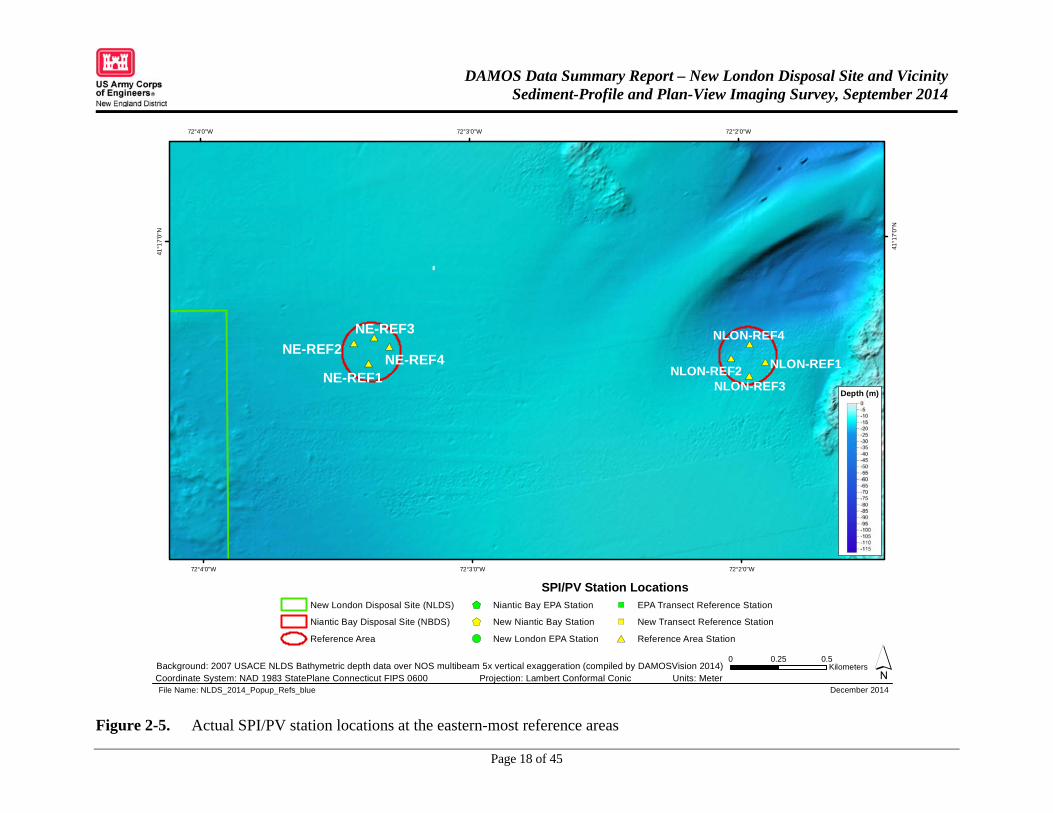
Survey planning included stations at which prior EPA monitoring was performed. All 6 of the NLDS stations were original EPA stations; 8 of the 11 NBDS stations were original EPA stations and 12 of the 26 transect stations were also originally EPA stations. The reference stations and the newly added stations at NBDS and the transect area were chosen by consultation with EPA, the DAMOS Program Manager, Steve Wolf and senior scientist Drew Carey of DAMOSVision (Figures 2-3, 2-4, and 2-5).
The eastern reference stations (NLON-REF and E-REF) and WREF stations were randomly located within standard reference areas utilized by DAMOS (AECOM 2009). NLON-ALT stations were randomly selected within a reference area chosen as a potential future reference area. The northern and southern transects were selected to provide a profile of conditions between the two disposal sites (Figure 2-2).
Table 2-1 provides the original EPA Site Station ID numbers paired with the 2014 survey’s Station ID numbers and target locations.
2.2.4 SPI and PV Data Collection
The SPI/PV survey was conducted at NLDS/NBDS on 16-17 September 2014 aboard the F/V Florence. At each station, the vessel was positioned at the target coordinates and the camera was deployed within a defined station tolerance of 10 m. Four replicate SPI and PV images were collected at each of the stations (Figures 2-3, 2-4, and 2-5; Appendix B). The three replicates with the best quality images from each station were chosen for analysis (Appendix C).
The DGPS described above was interfaced to HYPACK® software via laptop serial ports to provide a method to locate and record target sampling locations. Throughout the survey, the HYPACK® data acquisition system received DGPS data. The incoming data stream was
Page 8 of 45
DAMOS Data Summary Report – New London Disposal Site and Vicinity Sediment-Profile and Plan-View Imaging Survey, September 2014
digitally integrated and stored on the PC’s hard drive. Actual SPI/PV sampling locations were recorded as target files using this system.
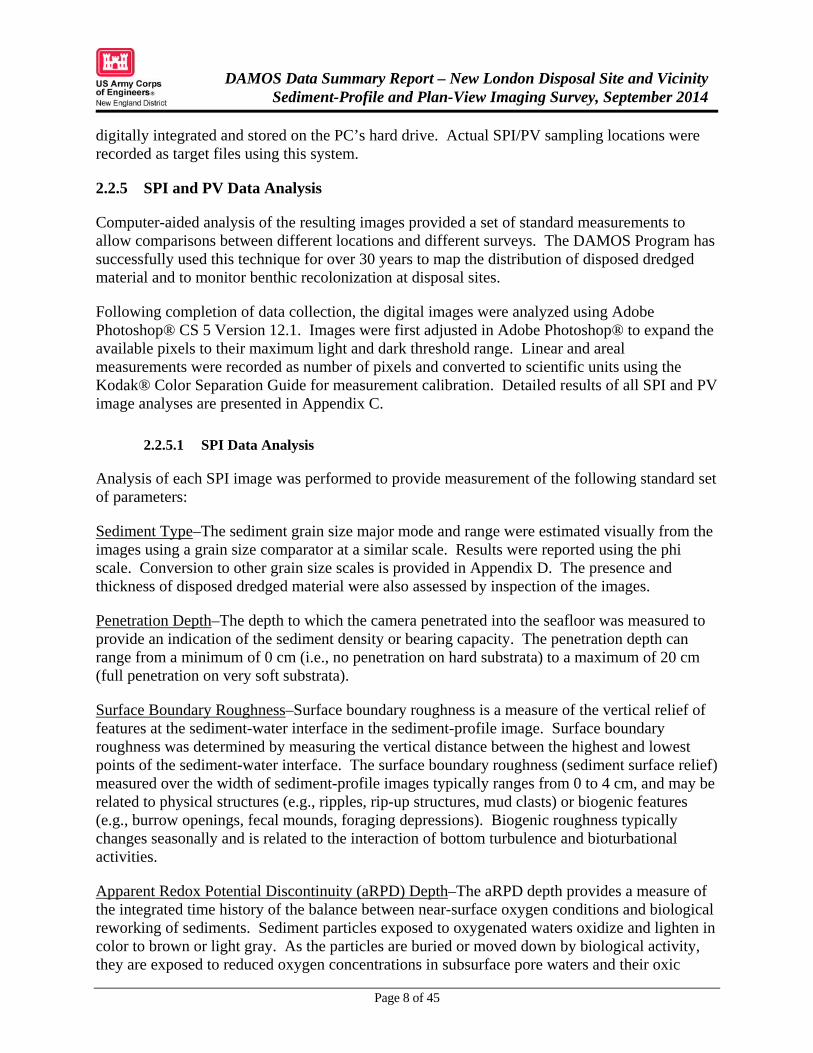
2.2.5 SPI and PV Data Analysis
Computer-aided analysis of the resulting images provided a set of standard measurements to allow comparisons between different locations and different surveys. The DAMOS Program has successfully used this technique for over 30 years to map the distribution of disposed dredged material and to monitor benthic recolonization at disposal sites.
Following completion of data collection, the digital images were analyzed using Adobe Photoshop® CS 5 Version 12.1. Images were first adjusted in Adobe Photoshop® to expand the available pixels to their maximum light and dark threshold range. Linear and areal measurements were recorded as number of pixels and converted to scientific units using the Kodak® Color Separation Guide for measurement calibration. Detailed results of all SPI and PV image analyses are presented in Appendix C.
2.2.5.1 SPI Data Analysis
Analysis of each SPI image was performed to provide measurement of the following standard set of parameters:
Sediment Type–The sediment grain size major mode and range were estimated visually from the images using a grain size comparator at a similar scale. Results were reported using the phi scale. Conversion to other grain size scales is provided in Appendix D. The presence and thickness of disposed dredged material were also assessed by inspection of the images.
Penetration Depth–The depth to which the camera penetrated into the seafloor was measured to provide an indication of the sediment density or bearing capacity. The penetration depth can range from a minimum of 0 cm (i.e., no penetration on hard substrata) to a maximum of 20 cm (full penetration on very soft substrata).
Surface Boundary Roughness–Surface boundary roughness is a measure of the vertical relief of features at the sediment-water interface in the sediment-profile image. Surface boundary roughness was determined by measuring the vertical distance between the highest and lowest points of the sediment-water interface. The surface boundary roughness (sediment surface relief) measured over the width of sediment-profile images typically ranges from 0 to 4 cm, and may be related to physical structures (e.g., ripples, rip-up structures, mud clasts) or biogenic features (e.g., burrow openings, fecal mounds, foraging depressions). Biogenic roughness typically changes seasonally and is related to the interaction of bottom turbulence and bioturbational activities.
Apparent Redox Potential Discontinuity (aRPD) Depth–The aRPD depth provides a measure of the integrated time history of the balance between near-surface oxygen conditions and biological reworking of sediments. Sediment particles exposed to oxygenated waters oxidize and lighten in color to brown or light gray. As the particles are buried or moved down by biological activity, they are exposed to reduced oxygen concentrations in subsurface pore waters and their oxic

Page 9 of 45
DAMOS Data Summary Report – New London Disposal Site and Vicinity Sediment-Profile and Plan-View Imaging Survey, September 2014
coating slowly reduces, changing color to dark gray or black. When biological activity is high, the aRPD depth increases; when it is low or absent, the aRPD depth decreases. The aRPD depth was measured by assessing color and reflectance boundaries within the images.
Infaunal Successional Stage–Infaunal successional stage is a measure of the biological community inhabiting the seafloor. Current theory holds that organism-sediment interactions in fine-grained sediments follow a predictable sequence of development after a major disturbance (such as dredged material disposal), and this sequence has been divided subjectively into three stages (Rhoads and Germano 1982, 1986). Successional stage was assigned by assessing which types of species or organism-related activities were apparent in the images.
Additional components of the SPI analysis included calculation of means and ranges for the parameters listed above and mapping of means of replicate values from each station. Station means were calculated from three replicates from each station and used in statistical analysis.
2.2.5.2 PV Data Analysis
The PV images provided a much larger field-of-view than the SPI images and provided valuable information about the landscape ecology and sediment topography in the area where the pinpoint “optical core” of the sediment profile was taken. Unusual surface sediment layers, textures, or structures detected in any of the sediment-profile images can be interpreted in light of the larger context of surface sediment features; i.e., is a surface layer or topographic feature a regularly occurring feature and typical of the bottom in this general vicinity or just an isolated anomaly? The scale information provided by the underwater lasers allows for accurate density counts (number per square meter) of attached epifaunal colonies, sediment burrow openings, or larger macrofauna or fish which may have been missed in the sediment-profile cross section. Information on sediment transport dynamics and bedform wavelength were also available from PV image analysis. Analysts calculated the image size and field-of-view and noted sediment type; recorded the presence of bedforms, burrows, tubes, tracks, trails, epifauna, mud clasts, and debris; and included descriptive comments (Appendix C).
2.3 NLDS Substrata Characteristics
In order to provide an integrated characterization of the seafloor substrata in the vicinity of the New London Disposal Site and Niantic Bay Disposal Site the results of SPI and PV imagery was used to define five broad habitat types (Table 2-2).
Page 10 of 45
DAMOS Data Summary Report – New London Disposal Site and Vicinity Sediment-Profile and Plan-View Imaging Survey, September 2014
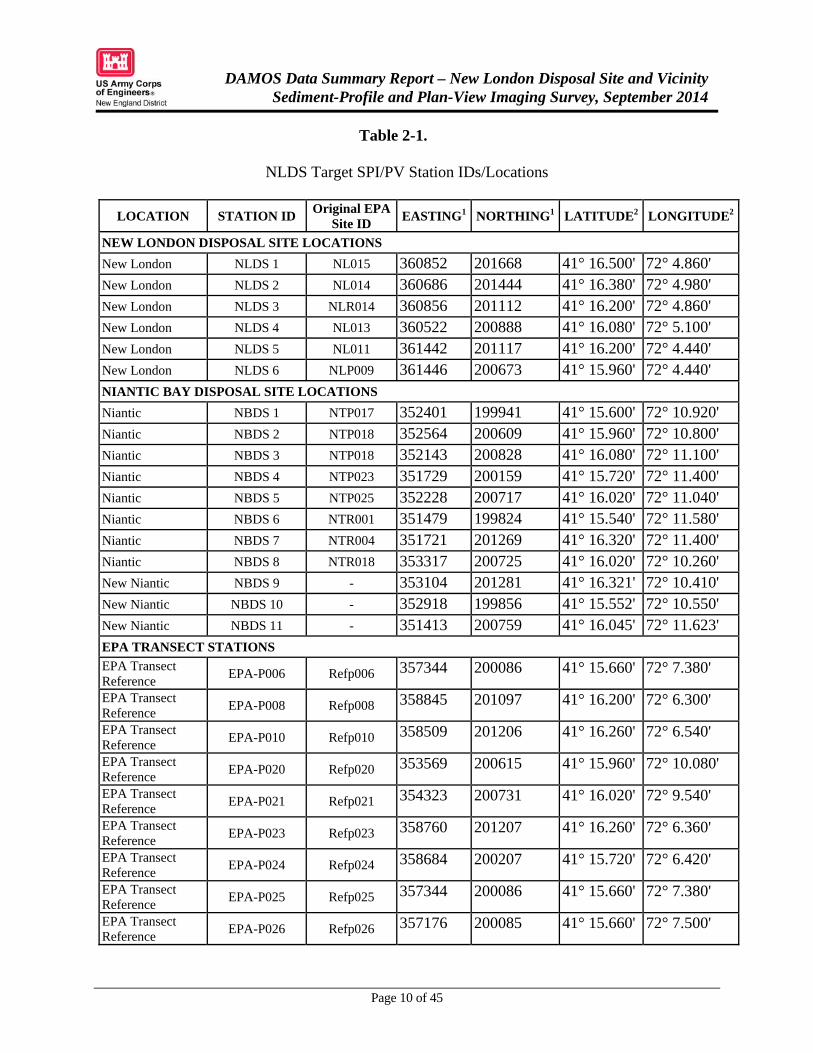
Table 2-1.
NLDS Target SPI/PV Station IDs/Locations
LOCATION STATION ID Original EPA
Site ID EASTING1 NORTHING1 LATITUDE2 LONGITUDE2
NEW LONDON DISPOSAL SITE LOCATIONS
New London NLDS 1 NL015 360852 201668 41° 16.500' 72° 4.860' New London NLDS 2 NL014 360686 201444 41° 16.380' 72° 4.980' New London NLDS 3 NLR014 360856 201112 41° 16.200' 72° 4.860' New London NLDS 4 NL013 360522 200888 41° 16.080' 72° 5.100' New London NLDS 5 NL011 361442 201117 41° 16.200' 72° 4.440' New London NLDS 6 NLP009 361446 200673 41° 15.960' 72° 4.440' NIANTIC BAY DISPOSAL SITE LOCATIONS
Niantic NBDS 1 NTP017 352401 199941 41° 15.600' 72° 10.920' Niantic NBDS 2 NTP018 352564 200609 41° 15.960' 72° 10.800' Niantic NBDS 3 NTP018 352143 200828 41° 16.080' 72° 11.100' Niantic NBDS 4 NTP023 351729 200159 41° 15.720' 72° 11.400' Niantic NBDS 5 NTP025 352228 200717 41° 16.020' 72° 11.040' Niantic NBDS 6 NTR001 351479 199824 41° 15.540' 72° 11.580' Niantic NBDS 7 NTR004 351721 201269 41° 16.320' 72° 11.400' Niantic NBDS 8 NTR018 353317 200725 41° 16.020' 72° 10.260' New Niantic NBDS 9 - 353104 201281 41° 16.321' 72° 10.410' New Niantic NBDS 10 - 352918 199856 41° 15.552' 72° 10.550' New Niantic NBDS 11 - 351413 200759 41° 16.045' 72° 11.623' EPA TRANSECT STATIONS
EPA Transect Reference
EPA-P006 Refp006 357344 200086 41° 15.660' 72° 7.380'
EPA Transect Reference
EPA-P008 Refp008 358845 201097 41° 16.200' 72° 6.300'
EPA Transect Reference
EPA-P010 Refp010 358509 201206 41° 16.260' 72° 6.540'
EPA Transect Reference
EPA-P020 Refp020 353569 200615 41° 15.960' 72° 10.080'
EPA Transect Reference
EPA-P021 Refp021 354323 200731 41° 16.020' 72° 9.540'
EPA Transect Reference
EPA-P023 Refp023 358760 201207 41° 16.260' 72° 6.360'
EPA Transect Reference
EPA-P024 Refp024 358684 200207 41° 15.720' 72° 6.420'
EPA Transect Reference
EPA-P025 Refp025 357344 200086 41° 15.660' 72° 7.380'
EPA Transect Reference
EPA-P026 Refp026 357176 200085 41° 15.660' 72° 7.500'

Page 11 of 45
DAMOS Data Summary Report – New London Disposal Site and Vicinity Sediment-Profile and Plan-View Imaging Survey, September 2014
LOCATION STATION ID Original EPA
Site ID EASTING1 NORTHING1 LATITUDE2 LONGITUDE2
EPA Transect Reference
EPA-P027 Refp027 355669 199963 41° 15.600' 72° 8.580'
EPA Transect Reference
EPA-R007 Refr007 360100 201329 41° 16.320' 72° 5.400'
EPA Transect Reference
EPA-R024 Refr024 353658 199950 41° 15.600' 72° 10.020'
NEW TRANSECT STATIONS
New Transect Reference
NLT 1 - 360052 201892 41° 16.624' 72° 5.431'
New Transect Reference
NLT 2 - 359488 201848 41° 16.603' 72° 5.835'
New Transect Reference
NLT 3 - 356723 200925 41° 16.115' 72° 7.821'
New Transect Reference
NLT 4 - 356022 200792 41° 16.047' 72° 8.323'
New Transect Reference
NLT 5 - 355046 200683 41° 15.991' 72° 9.022'
New Transect Reference
NLT 6 - 354363 199922 41° 15.583' 72° 9.515'
New Transect Reference
NLT 7 - 354994 199941 41° 15.590' 72° 9.063'
New Transect Reference
NLT 8 - 356142 200002 41° 15.619' 72° 8.241'
New Transect Reference
NLT 9 - 357942 200125 41° 15.679' 72° 6.952'
New Transect Reference
NLT 10 - 359030 200225 41° 15.728' 72° 6.172'
New Transect Reference
NLT 11 - 359499 200342 41° 15.790' 72° 5.836'
New Transect Reference
NLT 12 - 360144 200354 41° 15.794' 72° 5.374'
New Transect Reference
NLT 13 - 359895 200635 41° 15.946' 72° 5.550'
New Transect Reference
NLT 14 - 360050 200972 41° 16.128' 72° 5.438'
New Transect Reference
NLT 15 - 359738 201161 41° 16.231' 72° 5.660'
NLDS REFERENCE AREA STATIONS
NE-REF NE-REF 1 - 362910 201970 41° 16.654' 72° 3.384'
NE-REF NE-REF 2 - 362832 202080 41° 16.714' 72° 3.440'
NE-REF NE-REF 3 - 362939 202098 41° 16.724' 72° 3.363'
NE-REF NE-REF 4 - 363006 202060 41° 16.703' 72° 3.315'
NLON REF NLON REF 1 - 364970 201976 41° 16.649' 72° 1.909'
NLON REF NLON REF 2 - 364787 201997 41° 16.661' 72° 2.040'
NLON REF NLON REF 3 - 364889 201907 41° 16.612' 72° 1.967'
NLON REF NLON REF 4 - 364893 202073 41° 16.702' 72° 1.963'
NLON-ALT EPA NLON-ALT 1 - 357631 201201 41° 16.261' 72° 7.168'

Page 12 of 45
DAMOS Data Summary Report – New London Disposal Site and Vicinity Sediment-Profile and Plan-View Imaging Survey, September 2014
LOCATION STATION ID Original EPA
Site ID EASTING1 NORTHING1 LATITUDE2 LONGITUDE2
NLON-ALT EPA NLON-ALT 2 - 357753 201102 41° 16.207' 72° 7.082'
NLON-ALT EPA NLON-ALT 3 - 357860 201138 41° 16.226' 72° 7.005'
NLON-ALT EPA NLON-ALT 4 - 357776 201262 41° 16.294' 72° 7.064'
WREF WREF 1 - 359347 201065 41° 16.181' 72° 5.941'
WREF WREF 2 - 359425 201108 41° 16.204' 72° 5.884'
WREF WREF 3 - 359202 201132 41° 16.218' 72° 6.044'
WREF WREF 4 - 359326 201227 41° 16.268' 72° 5.955'
Notes 1. Grid coordinates are Connecticut State Plane FIPS 0600 (NAD83), in meters 2. Geographic coordinates are WGS84 degrees decimal minutes

Page 13 of 45
DAMOS Data Summary Report – New London Disposal Site and Vicinity Sediment-Profile and Plan-View Imaging Survey, September 2014
Table 2-2.
Substrata Habitat Types Substratum Characteristics Habitat Sediment transport
Rock Hard bottom, boulders or large cobbles.
Dominated by encrusting organisms: sponges, hydroids, algae, anemones and mobile epifauna
Assumed to be eroded ridges of glacial till or drift. Some periodic settlement of fines as drape over rock surfaces.
Shell Layer of disarticulated shells: common mussel (Mytilus), slipper shell (Crepidula), cockles (Cerastoderma) and clams (Ensis, Spisula, Mercenaria ).
Surface layer of clean shells and pebbles on coarse to fine sand. Infauna in layer of coarse shell hash overlying fine sand and silt. Some encrusting organisms on pebbles.
Assumed to be area of active strong near-bed currents moving shells (absence of epifaunal growth).
Mobile sand Fine sand with bedforms, isolated shells and pebbles.
Active infauna including acorn worms (Saccoglossus), deep burrowing polychaetes. Some resistant epifauna on shells or isolated pebbles.
Assumed to be area of moderate near-bed currents sufficient to periodically move sand in bedload.
Transitional Surface with shell layer and mud drape.
Epifauna on shell layer and infaunal burrowing organisms.
Episodic transport of shell alternating with deposition.
Depositional Very fine sand or silt with no bedforms. Some isolated shells and pebbles
Dominated by deep burrowing infauna and some encrusting organisms (hydroids, bryozoans, anemones) on hard surfaces
Assumed to be low near-bed currents with very infrequent storm transport of surface sediment.

Page 14 of 45
DAMOS Data Summary Report – New London Disposal Site and Vicinity Sediment-Profile and Plan-View Imaging Survey, September 2014
Figure 2-1. Schematic diagram of the SPI/PV camera deployment

Page 15 of 45
DAMOS Data Summary Report – New London Disposal Site and Vicinity Sediment-Profile and Plan-View Imaging Survey, September 2014
Figure 2-2. Actual SPI/PV station locations at NLDS, NBDS, transects, and reference areas
!(!(
")
")
")#*#*#*#*
")")
")")")
$+$+
$+$+$+
$+ $+
$+
$+$+ $+
")
#*#*#*#*
#*#*#*#*#*#*#*#*
!(
!(
!(!(
")
")")")")
")")")")")")")
") ")")
")
")
")
WREF
NE-REF NLON-REF
NLON-ALT EPA
72°2'0"W
72°2'0"W
72°3'0"W
72°3'0"W
72°4'0"W
72°4'0"W
72°5'0"W
72°5'0"W
72°6'0"W
72°6'0"W
72°7'0"W
72°7'0"W
72°8'0"W
72°8'0"W
72°9'0"W
72°9'0"W
72°10'0"W
72°10'0"W
72°11'0"W
72°11'0"W
72°12'0"W
72°12'0"W
41°1
9'0
"N
41°1
9'0
"N
41°1
8'0
"N
41°1
8'0
"N
41°1
7'0
"N
41°1
7'0
"N
41°1
6'0
"N
41°1
6'0
"N
41°1
5'0
"N
41°1
5'0
"N
December 2014
Coordinate System: NAD 1983 StatePlane Connecticut FIPS 0600 Projection: Lambert Conformal Conic Units: Meter
Background: 2007 USACE NLDS Bathymetric depth data over NOS multibeam 5x vertical exaggeration (compiled by DAMOSVision 2014)
New LondonNiantic
5.3
8 km
Eastern Point
CTRI
´File: NLDS_2014_Overview_SPI
0 21Kilometers
New London Disposal Site (NLDS)
Niantic Bay Disposal Site (NBDS)
Reference Area
NY
NLDS
NBDS
2.9 km
Black Point
Northern Transect
Southern Transect
Depth (m)
SPI/PV Station Locations$+ Niantic Bay EPA Station
$+ New Niantic Bay Station
!( New London EPA Station
") EPA Transect Reference Station
") New Transect Reference Station
#* Reference Area Station
Bar
tlet
t R
eef

Page 16 of 45
DAMOS Data Summary Report – New London Disposal Site and Vicinity Sediment-Profile and Plan-View Imaging Survey, September 2014
Figure 2-3. Actual SPI/PV station locations and names at NBDS and the western section of the transects
")
")
")")
")
$+
$+$+
$+$+
$+ $+
$+
$+
$+$+
")")")")")
NLT-6 NLT-7NLT-8
NLT-5NLT-4
NLT-3
NBDS-1NBDS-6
NBDS-4
NBDS-9NBDS-7
NBDS-3
NBDS-5NBDS-2
NBDS-8
NBDS-10
NBDS-11
EPA-P027EPA-R024
EPA-P021EPA-P020
72°8'0"W
72°8'0"W
72°9'0"W
72°9'0"W
72°10'0"W
72°10'0"W
72°11'0"W
72°11'0"W
72°12'0"W
72°12'0"W
41°1
6'0
"N
41°1
6'0
"N
41°1
5'0
"N
41°1
5'0
"N
December 2014
Coordinate System: NAD 1983 StatePlane Connecticut FIPS 0600 Projection: Lambert Conformal Conic Units: Meter
Background: NOS Multibeam data 5x vertical exaggeration (compiled by DAMOSVision 2014)0 0.50.25
Kilometers ´File Name: NLDS_2014_Popup_West_blue
Depth (m)
New London Disposal Site (NLDS)
Niantic Bay Disposal Site (NBDS)
Reference Area
$+ Niantic Bay EPA Station
$+ New Niantic Bay Station
!( New London EPA Station
") EPA Transect Reference Station
") New Transect Reference Station
#* Reference Area Station
SPI/PV Station Locations

Page 17 of 45
DAMOS Data Summary Report – New London Disposal Site and Vicinity Sediment-Profile and Plan-View Imaging Survey, September 2014
Figure 2-4. Actual SPI/PV station locations and names at NLDS, the eastern section of the transects, and the central reference areas
!(
!(
")
")
")#*
#*#*
#*#*#*
#*#* !(
!(
!(
!(
")
")")
")")
")")")
") ")
")
")
")
")
NLT-1NLT-2
NLT-9NLT-10
NLT-11 NLT-12
NLT-13
NLDS-4
NLDS-3
NLDS-6
NLDS-5
WREF-4
WREF-3
NLT-15
NLT-14
NLDS-2
NLDS-1
EPA-P025
EPA-P008
EPA-P023
EPA-P026
EPA-R007NLON-ALT3
NLON-ALT4
WREF-1
WREF-2EPA-P010
EPA-P006 EPA-P024
NLON-ALT2
NLON-ALT1
72°4'0"W
72°4'0"W
72°5'0"W
72°5'0"W
72°6'0"W
72°6'0"W
72°7'0"W
72°7'0"W
41°1
7'0
"N
41°1
7'0
"N
41°1
6'0
"N
41°1
6'0
"N
December 2014
Coordinate System: NAD 1983 StatePlane Connecticut FIPS 0600 Projection: Lambert Conformal Conic Units: MeterBackground: 2007 USACE NLDS Bathymetric depth data over NOS multibeam 5x vertical exaggeration (compiled by DAMOSVision 2014)
0 0.50.25Kilometers
New London Disposal Site (NLDS)
Niantic Bay Disposal Site (NBDS)
Reference Area
$+ Niantic Bay EPA Station
$+ New Niantic Bay Station
!( New London EPA Station
") EPA Transect Reference Station
") New Transect Reference Station
#* Reference Area Station
´
SPI/PV Station Locations
File Name: NLDS_2014_Popup_East_blue
Depth (m)
Page 18 of 45
DAMOS Data Summary Report – New London Disposal Site and Vicinity Sediment-Profile and Plan-View Imaging Survey, September 2014
Figure 2-5. Actual SPI/PV station locations at the eastern-most reference areas
#*
#*
#*
#*#*
#*#*
#*
NE-REF1
NE-REF2
NE-REF3
NE-REF4NLON-REF2
NLON-REF3
NLON-REF4
NLON-REF1
72°2'0"W
72°2'0"W
72°3'0"W
72°3'0"W
72°4'0"W
72°4'0"W
41°1
7'0
"N
41°1
7'0"
N
December 2014
Coordinate System: NAD 1983 StatePlane Connecticut FIPS 0600 Projection: Lambert Conformal Conic Units: MeterBackground: 2007 USACE NLDS Bathymetric depth data over NOS multibeam 5x vertical exaggeration (compiled by DAMOSVision 2014)
0 0.50.25Kilometers
New London Disposal Site (NLDS)
Niantic Bay Disposal Site (NBDS)
Reference Area
$+ Niantic Bay EPA Station
$+ New Niantic Bay Station
!( New London EPA Station
") EPA Transect Reference Station
") New Transect Reference Station
#* Reference Area Station
´
SPI/PV Station Locations
Depth (m)
File Name: NLDS_2014_Popup_Refs_blue

Page 19 of 45
DAMOS Data Summary Report – New London Disposal Site and Vicinity Sediment-Profile and Plan-View Imaging Survey, September 2014
3.0 RESULTS
3.1 Sediment-Profile and Plan-View Imaging
The primary purpose of the SPI/PV survey at NLDS/NBDS was to characterize the physical features of the surface sediment throughout the study area and to assess the status of benthic recolonization within the disposal site. A total of 60 SPI/PV stations were occupied; 6 stations within NLDS, 11 stations within NBDS, 27 transect stations in the area between the two sites, and 4 stations in each of four reference areas (NLON-ALT, WREF, NE-REF, and NLON-REF).
A station summary of some measured parameters can be found in Table 3-1 with a complete set of results in Appendix C.
3.1.1 Eastern Reference Areas (NE-REF, and NLON-REF)
Physical Sediment Characteristics The eastern reference areas were primarily very fine sand (4 to 3 phi) but some replicates had evidence of silt layers beneath the surface (Figure 3-1 and Appendix C). NE-REF had fine (3 to 2 phi) and very fine sand with no evidence of sediment transport, which was classified as a depositional substratum (Figure 3-2). NLON-REF had very fine sand with evidence of sediment transport, which was classified as mobile sand substratum (fine sand with bedforms, isolated shells and pebbles; assumed to be area of moderate near-bed currents sufficient to periodically move sand in bedload). However, several replicates had silt (>4 phi) below the very fine sand and clearly had experienced periods of deposition (Appendix C). The difference between the reference areas was illustrated by the relative penetration depths of the camera (Figure 3-3; NLON-REF mean 5.3 cm and NE-REF mean of 9.1 cm). Biological Conditions The eastern reference areas had typical shallow water estuarine infaunal characteristics (burrows, bioturbation, and deep aRPDs) and numerous epifaunal scavenging organisms (Appendix C). Common infaunal deposit feeders in fine sand habitats of eastern Long Island Sound include numerous polychaetes and Saccoglossus kowalewskyi, an enteropneust that deposits a distinctive fecal coil on the surface. Saccoglossus is typically found in mobile sand habitats in eastern Long Island Sound and more quiescent habitats in the Gulf of Maine. Another typical infaunal organism, Chaetopterus variopedatus forms a thick parchment tube in the sediment and pumps water through the tube. Both Saccoglossus coils and Chaetopterus tubes were found at NLON-REF but not at NE-REF (Appendix C). NE-REF had large burrow openings and polychaetes visible below the sediment-water interface. All stations at the eastern reference areas had at least one replicate with evidence of Stage 3 equilibrium conditions (Saccoglossus coils are one type of such evidence, Figure 3-4). The mean aRPD for all stations at NLON-REF was 3.6 cm and for NE-REF, 4.6 cm (Figure 3-5).

Page 20 of 45
DAMOS Data Summary Report – New London Disposal Site and Vicinity Sediment-Profile and Plan-View Imaging Survey, September 2014
3.1.2 New London Disposal Site Stations
Physical Sediment Characteristics The NLDS stations were located in areas that received dredged material over many years and are typical of conditions seen there (AECOM 2009, Carey et al. 2013). The surface sediments consisted of fine to medium sand overlying silt (Figure 3-6). In one case, there was a large rock that prevented grain size assessment with SPI but the PV images clearly showed a surface layer of sand (Appendix C). The surface layer had clear evidence of sediment transport and lag deposits (shells and pebbles) but the shells were covered with a thin layer of silt (‘mud drape’). As a result, the substrate was classified as transitional (Figure 3-7). In this case, the presence of consolidated silt underneath a surface layer of fine to medium sand, shells and silt layers, indicated periodic sediment transport sufficient to move unconsolidated fine sand but not enough to move shells and silt. The camera penetration depth was a clear indicator of the presence of soft dredged material below the surface of fine sand; penetration depths ranged from 0 (rock) to 18.8 cm (Figure 3-8). Biological Conditions The sediments at NLDS were heavily bioturbated with numerous burrows and evidence of subsurface feeding (Appendix C). The shell lag and pebbles had encrusting and attached epifauna, further evidence that the shells do not move frequently. All of the stations that could be measured had evidence of Stage 3 equilibrium conditions (feeding voids and burrows, Figure 3-9). The mean aRPD for all stations at NLDS was 3.1 cm (Figure 3-10).
3.1.3 Northern and Southern Transect Stations, Including the Central Reference Areas (NLON-ALT, and WREF)
Physical Sediment Characteristics The northern and southern transects were selected to provide a profile of conditions between the two disposal sites. As such, the physical conditions along the transects covered a wide range. Both transects crossed north-south oriented boulder ridges and a southeast-northwest oriented sand ridge (Figure 2-2). One of the ridges is an extension of Bartlett Reef and these ridges are likely part of a complex of glaciolacustrine systems in Long Island Sound representing deltaic and ice-marginal deposits (Figure 2-2 and Stone et al. 2005). Between the ridges the seafloor deepens and forms small erosional basins. The two central reference areas had four random stations each and conditions were quite similar within them. WREF has been used routinely for assessment of NLDS disposal activities, NLON-ALT has not. WREF had consistent shelly fine sand over silt (3 to 2/ >4 phi) while NLON-ALT was primarily shelly fine sand with some underlying silt and a visible mud drape over the shells (Figure 3-6). WREF had clear evidence of sediment transport features and was classified as mobile sand while NLON-ALT appeared to be more transitional with mud deposits and epifauna (Figure 3-7). These results suggested that the two reference areas are similar to NLDS: experiencing periodic bottom stress capable of moving sand or shell particles, but also periods of quiescent conditions that allow deposition of

Page 21 of 45
DAMOS Data Summary Report – New London Disposal Site and Vicinity Sediment-Profile and Plan-View Imaging Survey, September 2014
silt. The camera penetration depth measurements indicated that WREF was softer than NLON-ALT with a mean penetration depth of 7.6 cm compared to 4.8 cm (Figure 3-8). The northern transect included stations previously sampled by EPA and newly selected stations to provide a characterization of a corridor connecting the central reference stations to the two disposal sites (Figure 2-2). Station grain sizes ranged from fine sand to medium sand over silt, with several indeterminate stations due to hard bottom or shells (Figures 3-6 and 3-11). The southern transect stations were chosen to link the existing EPA stations to a corridor between the two disposal sites (Figure 2-2). Station grain sizes ranged from very fine sand to gravel over silt (Figures 3-6 and 3-11). The northern transect stations in the east (near NLDS) were all mobile sand or transitional substrata, consistent with the two reference areas (Figure 3-7). The northern transect stations in the west (near NBDS) were a mix of coarse shells on the margins of ridges; mobile sand and transitional in the deeper basin (Figure 3-12). The southern transect stations in the east were mobile sand or transitional up to a resistant hard ridge with rock and shells (Figure 3-7). The southern transect stations in the west were rock and shells over another hard ridge and then transitional in the basin to rock on another hard ridge at the eastern edge of NBDS (Figure 3-12). Camera penetration depths varied widely along the northern transect from 0 to 9.2 cm and along the southern transect from 0 to 10.9 cm (Figure 3-8 and 3-13). Biological Conditions The sediments at WREF and NLON-ALT were bioturbated with some evidence of subsurface feeding (Appendix C). The shell lag and pebbles had encrusting and attached epifauna, further evidence that the shells do not move frequently. All of the stations that could be measured had evidence of Stage 3 equilibrium conditions at WREF, and evidence of mostly Stage 2 at NLON-ALT (Figure 3-9). The mean aRPD for all stations at WREF was 3.6 cm and at NLON-ALT only one station had a measurable aRPD due to layers of shell on the surface (Figure 3-10). Along both transects the presence of shells (Mytilus and Crepidula) and rock surfaces provided substrata for many epifaunal organisms (sponges, anemones, bryozoans, hydroids, and barnacles). In the softer sediments within the basins, there was evidence of burrowing organisms and, in places, large numbers of Crepidula shells. The aRPD values in the northern transect ranged from 2.9 to 6.5 cm and in the southern transect ranged from 2.0 to 4.7 cm (Figures 3-10 and 3-14).
3.1.4 Niantic Bay Disposal Site Stations
Physical Sediment Characteristics The NBDS stations were located in an area that had not received dredged material in many years; despite the history of the site, no dredged material was detected in the stations sampled. The southeast triangular portion of the site (Stations 1, 2, 6, 8 and 10) had a surface layer of coarse shells overlying fine and very fine sand (Figure 3-11). The presence of the shell layer appears to be a lag deposit overlying sand and was classified as shell substratum (Figure 3-12). In the northwest triangular portion of the site (Stations 3, 4, 5, 7, 9 and 11) the surface layer had fewer shells and fine sand (Figure 3-11). In this area the surface layer had clear evidence of sediment

Page 22 of 45
DAMOS Data Summary Report – New London Disposal Site and Vicinity Sediment-Profile and Plan-View Imaging Survey, September 2014
transport; as a result, the substrate was classified as mobile sand (Figure 3-12). In both cases, there was evidence of active bedload transport sufficient to move unconsolidated fine sand and periodically enough to move shells (shells had some evidence of epifauna but appeared to be fairly clean). The camera penetration depth was a clear indicator of the relative distribution of compacted sand and shells; mean penetration depths were 5.1 cm in the southeast and 6.5 cm in the northwest (Figure 3-13). Stations 1 and 10 in the southeast had more fine sand and silt below the surface and deeper penetration; Station 5 had compacted sand and very limited penetration (Figure 3-13). Biological Conditions The mobile sand and shelly substrata had relatively little evidence of biological activity: some signs of bioturbation and epifaunal organisms on shells. These substrata are typically inhabited by highly mobile epifauna, and some infauna that are adapted to moving surface layers (but without fine sediment content there was little evidence of burrows or aRPDs). Only one replicate had evidence of Stage 3 (Station 4B); again a typical result in coarse sediments where Stage 2 evidence (shallow burrowing, lack of anoxic subsurface sediments) is most common (Figure 3-15). The aRPDs were indeterminate in six of the eleven stations; the mean aRPD was 3.1 cm (Figure 3-14).
Table 3-1.
Summary of Substratum and Grain Size Major Mode (averaged across replicates)
Location Station Substratum Grain Size Major Mode NLDS NLDS 1 Transitional 3 to 2/ >4
NLDS 2 Transitional 3 to 2/ >4 NLDS 3 Transitional 2 to 1/ >4 NLDS 4 Transitional 3 to 2/ >4 NLDS 5 Transitional 3 to 2/ >4 NLDS 6 Transitional ind
EPA P006 Shell 3 to 2/ >4 EPA P008 Transitional 3 to 2/ >4 EPA P010 Transitional 3 to 2/ >4 EPA P020 Shell 3 to 2/ >4 EPA P021 Mobile Sand 2 to 1/ >4 EPA P023 Transitional 3 to 2/ >4 EPA P024 Rock < 1 / >4 EPA P025 Shell 1 to 0 EPA P026 Shell 3 to 2/ >4 EPA P027 Shell 1 to 0 EPA R007 Mobile Sand 3 to 2 EPA R024 Rock ind
NBDS NBDS 1 Shell 2 to 1/ >4 NBDS 2 Shell 2 to 1

Page 23 of 45
DAMOS Data Summary Report – New London Disposal Site and Vicinity Sediment-Profile and Plan-View Imaging Survey, September 2014
Location Station Substratum Grain Size Major Mode NBDS 3 Mobile Sand 3 to 2 NBDS 4 Mobile Sand 3 to 2 NBDS 5 Mobile Sand 3 to 2 NBDS 6 Shell 3 to 2 NBDS 7 Mobile Sand 3 to 2 NBDS 8 Shell 3 to 2 NBDS 9 Mobile Sand 3 to 2
NBDS 10 Shell 3 to 2 NBDS 11 Mobile Sand 3 to 2
New Transect NLT 1 Transitional 3 to 2/ >4 NLT 2 Mobile Sand 3 to 2/ >4 NLT 3 Shell ind NLT 4 Shell ind NLT 5 Transitional 2 to 1/ >4 NLT 6 Transitional 2 to 1/ >4 NLT 7 Transitional 3 to 2 NLT 8 Rock ind NLT 9 Shell 2 to 1/ >4
NLT 10 Mobile Sand 1 to 2 NLT 11 Mobile Sand 3 to 2/ >4 NLT 12 Mobile Sand 3 to 2/ >4 NLT 13 Mobile Sand 3 to 2/ >4 NLT 14 Transitional 3 to 2/ >4 NLT 15 Mobile Sand 3 to 2/ >4
Reference Areas WREF 1 Mobile Sand 3 to 2/ >4 WREF 2 Mobile Sand 3 to 2/ >4 WREF 3 Mobile Sand 3 to 2/ >4 WREF 4 Mobile Sand 3 to 2/ >4
NLON ALT1 Transitional 3 to 2 NLON ALT2 Transitional 3 to 2 NLON ALT3 Transitional 3 to 2 NLON ALT4 Transitional 3 to 2/ >4 NLON REF1 Mobile Sand 4 to 3 NLON REF2 Mobile Sand 4 to 3 NLON REF3 Mobile Sand 4 to 3 NLON REF4 Mobile Sand 4 to 3/ >4
NE REF1 Depositional 3 to 2 NE REF2 Depositional 4 to 3 NE REF3 Depositional 4 to 3 NE REF4 Depositional 4 to 3

Page 24 of 45
DAMOS Data Summary Report – New London Disposal Site and Vicinity Sediment-Profile and Plan-View Imaging Survey, September 2014
Figure 3-1. Sediment grain size major mode (phi units) at the eastern-most reference areas
!<
!
!
!
!!
!
!
NE-REF1
NE-REF2NLON-REF2
NLON-REF3
NE-REF3
NE-REF4NLON-REF1
NLON-REF4
72°2'0"W
72°2'0"W
72°3'0"W
72°3'0"W
72°4'0"W
72°4'0"W
41°1
7'0
"N
41°1
7'0
"N
December 2014
Coordinate System: NAD 1983 StatePlane Connecticut FIPS 0600 Projection: Lambert Conformal Conic Units: Meter
Background: 2007 NLDS USACE Bathymetric depth data over NOS multibeam 5x vertical exaggeration (compiled by DAMOSVision 2014)0 0.50.25
Kilometers
New London Disposal Site (NLDS) Reference Area
´File Name: NLDS_2014_SPI_Refs_NLDS_GrainSize
Grain Size Major Mode (phi)
!< gravel over silt/clay (<-1 / >4)
! coarse sand (1 to 0)
! medium sand (2 to 1)
!< medium sand over silt/clay (2 to 1 / >4)
! fine sand (3 to 2)
!< fine sand over silt/clay (3 to 2 / >4)
!< very fine sand over silt/clay (4 to 3 / >4)
! very fine sand (4 to 3)
indeterminate
Depth (m)

Page 25 of 45
DAMOS Data Summary Report – New London Disposal Site and Vicinity Sediment-Profile and Plan-View Imaging Survey, September 2014
Figure 3-2. Substrata characteristics at the eastern-most reference areas
!!
!!!!
!!!!
!!!!
!!NE-REF1
NE-REF2NLON-REF2
NLON-REF3
NE-REF3
NE-REF4NLON-REF1
NLON-REF4
72°2'0"W
72°2'0"W
72°3'0"W
72°3'0"W
72°4'0"W
72°4'0"W
41°1
7'0
"N
41°1
7'0
"N
March 2015
Coordinate System: NAD 1983 StatePlane Connecticut FIPS 0600 Projection: Lambert Conformal Conic Units: Meter
0 0.50.25KilometersNew London Disposal Site (NLDS) Reference Area ´
File Name: NLDS_2014_SPI_REfs_NBDS_5x_spectrum_substrata
Background: 2007 NLDS USACE Bathymetric depth data over NOS multibeam 5x vertical exaggeration (compiled by DAMOSVision 2014)
Substrata
!! Depositional
!! Transitional
!! Mobile Sand
û Rock
ts Shell
Depth (m)

Page 26 of 45
DAMOS Data Summary Report – New London Disposal Site and Vicinity Sediment-Profile and Plan-View Imaging Survey, September 2014
Figure 3-3. Camera penetration depths at the eastern-most reference areas
¶ ¶¶
¶ ¶¶
¶¶
NE-REF1
NE-REF2NLON-REF2
NLON-REF3
NE-REF3
NE-REF4NLON-REF1
NLON-REF4
72°2'0"W72°3'0"W72°4'0"W
41°1
7'0
"N
41°1
7'0
"N
December 2014
Coordinate System: NAD 1983 StatePlane Connecticut FIPS 0600 Projection: Lambert Conformal Conic Units: Meter
Background: 2007 NLDS USACE Bathymetric depth data over NOS multibeam 5x vertical exaggeration (compiled by DAMOSVision 2014)0 0.50.25
Kilometers
New London Disposal Site (NLDS) Reference Area
´File Name: NLDS_2014_SPI_Refs_Pen
Depth (m)
Mean Camera Penetration (cm)
¶ 0.0
2.5 - 4.9
5.0 - 9.9
10.0 - 14.9
15.0 - 20.4
Page 27 of 45
DAMOS Data Summary Report – New London Disposal Site and Vicinity Sediment-Profile and Plan-View Imaging Survey, September 2014
Figure 3-4. Successional stage at the eastern-most reference areas
NE-REF1
NE-REF2NLON-REF2
NLON-REF3
NE-REF3
NE-REF4
NLON-REF1
NLON-REF4
72°2'0"W
72°2'0"W
72°3'0"W
72°3'0"W
72°4'0"W
72°4'0"W
41°1
7'0
"N
41°1
7'0
"N
December 2014
Coordinate System: NAD 1983 StatePlane Connecticut FIPS 0600 Projection: Lambert Conformal Conic Units: Meter
Background: 2007 NLDS USACE Bathymetric depth data over NOS multibeam 5x vertical exaggeration (compiled by DAMOSVision 2014)0 0.50.25
Kilometers
New London Disposal Site (NLDS) Reference Area
´File Name: NLDS_2014_SPI_Refs_SS
Depth (m)
Successional Stage
Stage 1
Stage 1-2, 2
Stage 1 on 3, 2-3, 3
Indeterminate

Page 28 of 45
DAMOS Data Summary Report – New London Disposal Site and Vicinity Sediment-Profile and Plan-View Imaging Survey, September 2014
Figure 3-5. Apparent Redox Potential Discontinuity (aRPD) at the eastern-most reference areas
NE-REF1
NE-REF2NLON-REF2
NLON-REF3
NE-REF3
NE-REF4NLON-REF1
NLON-REF4
72°2'0"W
72°2'0"W
72°3'0"W
72°3'0"W
72°4'0"W
72°4'0"W
41°1
7'0
"N
41°1
7'0
"N
December 2014
Coordinate System: NAD 1983 StatePlane Connecticut FIPS 0600 Projection: Lambert Conformal Conic Units: Meter
Background: 2007 NLDS USACE Bathymetric depth data over NOS multibeam 5x vertical exaggeration (compiled by DAMOSVision 2014)0 0.50.25
Kilometers
New London Disposal Site (NLDS) Reference Area
´File Name: NLDS_2014_SPI_Refs_aRPD
Depth (m)
Mean aRPD (cm)
0.6 - 1.6
1.7 - 3.0
>3.0
Indeterminate

Page 29 of 45
DAMOS Data Summary Report – New London Disposal Site and Vicinity Sediment-Profile and Plan-View Imaging Survey, September 2014
Figure 3-6. Sediment grain size major mode (phi units) within NLDS, the eastern transect stations, and the central reference areas
!<
!<
!
!<
!<
!<!<
!<
!<!
!<
!! !<!<
!<
!<
!<!<!!<
!<!<!<
!< !<!<
!<
!
!<
NLT-1NLT-2
NLT-9
NLT-10
NLT-11 NLT-12
NLT-13
NLDS-4
NLDS-3
NLDS-6
NLDS-5
WREF-4
WREF-3
NLT-15
NLT-14
NLDS-2
NLDS-1
EPA-P025
EPA-P008
EPA-P023
EPA-P026
EPA-R007NLON-ALT3
NLON-ALT4
WREF-1
WREF-2EPA-P010
EPA-P006
EPA-P024
NLON-ALT2
NLON-ALT1
72°4'0"W72°5'0"W72°6'0"W72°7'0"W
41°1
7'0
"
41°1
7
41°1
6'0
"N
41°1
6'0
"N
December 2014
Coordinate System: NAD 1983 StatePlane Connecticut FIPS 0600 Projection: Lambert Conformal Conic Units: Meter
Background: 2007 NLDS USACE bathymetric depth data over NOS multibeam 5x vertical exagerration (compiled by DAMOSVision 2014)0 0.50.25
Kilometers
New London Disposal Site (NLDS) Reference Area
´File Name: NLDS_2014_SPI_East_NLDS_GrainSize
Grain Size Major Mode (phi)
!< gravel over silt/clay (<-1 / >4)
! coarse sand (1 to 0)
! medium sand (2 to 1)
!< medium sand over silt/clay (2 to 1 / >4)
! fine sand (3 to 2)
!< fine sand over silt/clay (3 to 2 / >4)
!< very fine sand over silt/clay (4 to 3 / >4)
! very fine sand (4 to 3)
indeterminate
Depth (m)

Page 30 of 45
DAMOS Data Summary Report – New London Disposal Site and Vicinity Sediment-Profile and Plan-View Imaging Survey, September 2014
Figure 3-7. Substrata characteristics within NLDS, the eastern transect stations, and the central reference areas
!!
!!!!
!!
!!!!!!!!!!!!
!!
!!!! !!
!!
!!
!!
!!
!!!!!!ûtststs
!! !!!!
!!
ts
!!NLT-1
NLT-2
NLT-9
NLT-10
NLT-11 NLT-12
NLT-13
NLDS-4
NLDS-3
NLDS-6
NLDS-5
WREF-4
WREF-3
NLT-15
NLT-14
NLDS-2
NLDS-1
EPA-P025
EPA-P008
EPA-P023
EPA-P026
EPA-R007NLON-ALT3
NLON-ALT4
WREF-1
WREF-2
EPA-P010
EPA-P006 EPA-P024
NLON-ALT2
NLON-ALT1
72°4'0"W
72°4'0"W
72°5'0"W
72°5'0"W
72°6'0"W
72°6'0"W
72°7'0"W
72°7'0"W
41°1
7'0
"N
41°1
7'0"
N
41°1
6'0
"N
41°1
6'0"
N
March 2015
Coordinate System: NAD 1983 StatePlane Connecticut FIPS 0600 Projection: Lambert Conformal Conic Units: Meter
Background: 2007 NLDS USACE Bathymetric depth data over NOS multibeam 5x vertical exaggeration (compiled by DAMOSVision 2014)0 0.50.25
Kilometers
New London Disposal Site (NLDS) Reference Area
´File Name: NLDS_2014_SPI_East_NBDS_5x_spectrum_substrata
Depth (m)
Substrata
!! Depositional
!! Transitional
!! Mobile Sand
û Rock
ts Shell

Page 31 of 45
DAMOS Data Summary Report – New London Disposal Site and Vicinity Sediment-Profile and Plan-View Imaging Survey, September 2014
Figure 3-8. Camera penetration depths within NLDS, the eastern transect stations, and the central reference areas
¶ 
¶ ¶¶
¶¶
¶¶
NLT-1NLT-2
NLT-9
NLT-10
NLT-11 NLT-12
NLT-13
NLDS-4
NLDS-3
NLDS-6
NLDS-5
WREF-4
WREF-3
NLT-15
NLT-14
NLDS-2
NLDS-1
EPA-P025
EPA-P008
EPA-P023
EPA-P026
EPA-R007NLON-ALT3
NLON-ALT4
WREF-1
WREF-2EPA-P010
EPA-P006
EPA-P024
NLON-ALT2
NLON-ALT1
72°4'0"W
72°4'0"W
72°5'0"W
72°5'0"W
72°6'0"W
72°6'0"W
72°7'0"W
72°7'0"W
41°1
7'0
"N
41°1
7'0
"N
41°1
6'0
"N
41°1
6'0
"N
December 2014
Coordinate System: NAD 1983 StatePlane Connecticut FIPS 0600 Projection: Lambert Conformal Conic Units: Meter
Background: 2007 NLDS USACE bathymetric depth data over NOS multibeam 5x vertical exagerration (compiled by DAMOSVision 2014)0 0.50.25
Kilometers
New London Disposal Site (NLDS) Reference Area
´File Name: NLDS_2014_SPI_East_Pen
Depth (m)
Mean Camera Penetration (cm)
0.0
2.5 - 4.9
5.0 - 9.9
10.0 - 14.9
15.0 - 20.4

Page 32 of 45
DAMOS Data Summary Report – New London Disposal Site and Vicinity Sediment-Profile and Plan-View Imaging Survey, September 2014
Figure 3-9. Successional stage within NLDS, the eastern transect stations, and the central reference areas
NLT-1NLT-2
NLT-9
NLT-10NLT-11 NLT-12
NLT-13
NLDS-4
NLDS-3
NLDS-6
NLDS-5
WREF-4
WREF-3
NLT-15
NLT-14
NLDS-2
NLDS-1
EPA-P025
EPA-P008
EPA-P023
EPA-P026
EPA-R007NLON-ALT3
NLON-ALT4
WREF-1
WREF-2
EPA-P010
EPA-P006
EPA-P024
NLON-ALT2
NLON-ALT1
72°4'0"W72°5'0"W72°6'0"W72°7'0"W
41°1
7'0
"
41°1
7
41°1
6'0
"N
41°1
6'0
"N
December 2014
Coordinate System: NAD 1983 StatePlane Connecticut FIPS 0600 Projection: Lambert Conformal Conic Units: Meter
Background: 2007 NLDS USACE bathymetric depth data over NOS multibeam 5x vertical exagerration (compiled by DAMOSVision 2014)0 0.50.25
Kilometers
New London Disposal Site (NLDS) Reference Area
´File Name: NLDS_2014_SPI_East_SS
Depth (m)
Successional Stage
Stage 1
Stage 1-2, 2
Stage 1 on 3, 2-3, 3
Indeterminate
Page 33 of 45
DAMOS Data Summary Report – New London Disposal Site and Vicinity Sediment-Profile and Plan-View Imaging Survey, September 2014
Figure 3-10. Apparent Redox Potential Discontinuity (aRPD) within NLDS, the eastern transect stations, and the central reference
areas
NLT-1NLT-2
NLT-9
NLT-10
NLT-11 NLT-12
NLT-13
NLDS-4
NLDS-3
NLDS-6
NLDS-5
WREF-4
WREF-3
NLT-15
NLT-14
NLDS-2
NLDS-1
EPA-P025
EPA-P008
EPA-P023
EPA-P026
EPA-R007NLON-ALT3
NLON-ALT4
WREF-1
WREF-2EPA-P010
EPA-P006
EPA-P024
NLON-ALT2
NLON-ALT1
72°4'0"W72°5'0"W72°6'0"W72°7'0"W
41°1
7'0
"
41°1
7
41°1
6'0
"N
41°1
6'0"
N
December 2014
Coordinate System: NAD 1983 StatePlane Connecticut FIPS 0600 Projection: Lambert Conformal Conic Units: Meter
Background: 2007 NLDS USACE bathymetric depth data over NOS multibeam 5x vertical exagerration (compiled by DAMOSVision 2014)0 0.50.25
Kilometers
New London Disposal Site (NLDS) Reference Area
´File Name: NLDS_2014_SPI_East_aRPD
Depth (m)
Mean aRPD (cm)
0.6 - 1.6
1.7 - 3.0
>3.0
Indeterminate

Page 34 of 45
DAMOS Data Summary Report – New London Disposal Site and Vicinity Sediment-Profile and Plan-View Imaging Survey, September 2014
Figure 3-11. Sediment grain size major mode (phi units) at stations within NBDS and the western transect stations
!<
!<
!<
!
!
!
!!
! !
!
!
!<
!
!!!<
NLT-6 NLT-7NLT-8
NLT-5NLT-4
NLT-3
NBDS-1NBDS-6
NBDS-4
NBDS-9NBDS-7
NBDS-3
NBDS-5NBDS-2
NBDS-8
NBDS-10
NBDS-11
EPA-P027EPA-R024
EPA-P020EPA-P021
72°8'0"W
72°8'0"W
72°9'0"W
72°9'0"W
72°10'0"W
72°10'0"W
72°11'0"W
72°11'0"W
72°12'0"W
72°12'0"W
41°1
6'0
"N
41°1
6'0
"N
41°1
5'0
"N
41°1
5'0
"N
December 2014
Coordinate System: NAD 1983 StatePlane Connecticut FIPS 0600 Projection: Lambert Conformal Conic Units: Meter
Background: NOS multibeam data 5x vertical exaggeration (compiled by DAMOSVision 2014)0 0.50.25
Kilometers ´File Name: NLDS_2014_SPI_West_NBDS_GrainSize
Grain Size Major Mode (phi)
!< gravel over silt/clay (<-1 / >4)
! coarse sand (1 to 0)
! medium sand (2 to 1)
!< medium sand over silt/clay (2 to 1 / >4)
! fine sand (3 to 2)
!< fine sand over silt/clay (3 to 2 / >4)
!< very fine sand over silt/clay (4 to 3 / >4)
! very fine sand (4 to 3)
indeterminate
Niantic Bay Disposal Site (NBDS)
Depth (m)
Page 35 of 45
DAMOS Data Summary Report – New London Disposal Site and Vicinity Sediment-Profile and Plan-View Imaging Survey, September 2014
Figure 3-12. Substrata characteristics at stations within NBDS and the western transect stations
tsts
!!!!ts
tsts
!!!!
!!
!! !!
!!
tsts ts û ûts!!!!
NLT-6 NLT-7NLT-8
NLT-5NLT-4
NLT-3
NBDS-1
NBDS-6
NBDS-4
NBDS-9NBDS-7
NBDS-3
NBDS-5NBDS-2
NBDS-8
NBDS-10
NBDS-11
EPA-P027EPA-R024
EPA-P020
EPA-P021
72°8'0"W
72°8'0"W
72°9'0"W
72°9'0"W
72°10'0"W
72°10'0"W
72°11'0"W
72°11'0"W
72°12'0"W
72°12'0"W
41°1
6'0"
N
41°1
6'0
"N
41°1
5'0
"N
41°1
5'0
"N
March 2015
Coordinate System: NAD 1983 StatePlane Connecticut FIPS 0600 Projection: Lambert Conformal Conic Units: Meter
0 0.50.25Kilometers ´
File Name: NLDS_2014_SPI_West_NBDS_5x_spectrum_substrata
Depth (m)
Background: NOS multibeam data 5x vertical exaggeration (compiled by DAMOSVision 2014)
Substrata
!! Depositional
!! Transitional
!! Mobile Sand
û Rock
ts Shell
Niantic Bay Disposal Site (NBDS)

Page 36 of 45
DAMOS Data Summary Report – New London Disposal Site and Vicinity Sediment-Profile and Plan-View Imaging Survey, September 2014
Figure 3-13. Camera penetration depths at stations within NBDS and the western transect stations
¶¶
¶ 
¶¶
NLT-6 NLT-7NLT-8
NLT-5NLT-4
NLT-3
NBDS-1NBDS-6
NBDS-4
NBDS-9NBDS-7
NBDS-3
NBDS-5NBDS-2
NBDS-8
NBDS-10
NBDS-11
EPA-P027EPA-R024
EPA-P020EPA-P021
72°8'0"W
72°8'0"W
72°9'0"W
72°9'0"W
72°10'0"W
72°10'0"W
72°11'0"W
72°11'0"W
72°12'0"W
72°12'0"W
41°1
6'0"
N
41°1
6'0"
N
41°1
5'0"
N
41°1
5'0"
N
December 2014
Coordinate System: NAD 1983 StatePlane Connecticut FIPS 0600 Projection: Lambert Conformal Conic Units: Meter
Background: NOS multibeam data 5x vertical exaggeration (compiled by DAMOSVision 2014)0 0.50.25
Kilometers ´File Name: NLDS_2014_SPI_West_Pen
Niantic Bay Disposal Site (NBDS)
Depth (m)
Mean Camera Penetration (cm)
¶ 0.0
2.5 - 4.9
5.0 - 9.9
10.0 - 14.9
15.0 - 20.4

Page 37 of 45
DAMOS Data Summary Report – New London Disposal Site and Vicinity Sediment-Profile and Plan-View Imaging Survey, September 2014
Figure 3-14. Apparent Redox Potential Discontinuity (aRPD) at stations within NBDS and the western transect stations
NLT-6 NLT-7NLT-8
NLT-5NLT-4
NLT-3
NBDS-1NBDS-6
NBDS-4
NBDS-9NBDS-7
NBDS-3
NBDS-5NBDS-2
NBDS-8
NBDS-10
NBDS-11
EPA-P027EPA-R024
EPA-P020EPA-P021
72°8'0"W
72°8'0"W
72°9'0"W
72°9'0"W
72°10'0"W
72°10'0"W
72°11'0"W
72°11'0"W
72°12'0"W
72°12'0"W
41°1
6'0"
N
41°1
6'0"
N
41°1
5'0"
N
41°1
5'0"
N
December 2014
Coordinate System: NAD 1983 StatePlane Connecticut FIPS 0600 Projection: Lambert Conformal Conic Units: Meter
Background: NOS multibeam data 5x vertical exaggeration (compiled by DAMOSVision 2014)0 0.50.25
Kilometers ´File Name: NLDS_2014_SPI_West_aRPD
Niantic Bay Disposal Site (NBDS)
Depth (m)
Mean aRPD (cm)
0.6 - 1.6
1.7 - 3.0
>3.0
Indeterminate

Page 38 of 45
DAMOS Data Summary Report – New London Disposal Site and Vicinity Sediment-Profile and Plan-View Imaging Survey, September 2014
Figure 3-15. Successional stage at stations within NBDS and the western transect stations areas
NLT-6 NLT-7NLT-8
NLT-5NLT-4
NLT-3
NBDS-1NBDS-6
NBDS-4
NBDS-9NBDS-7
NBDS-3
NBDS-5 NBDS-2
NBDS-8
NBDS-10
NBDS-11
EPA-P027EPA-R024
EPA-P020EPA-P021
72°8'0"W
72°8'0"W
72°9'0"W
72°9'0"W
72°10'0"W
72°10'0"W
72°11'0"W
72°11'0"W
72°12'0"W
72°12'0"W
41°1
6'0"
N
41°1
6'0"
N
41°1
5'0"
N
41°1
5'0"
N
December 2014
Coordinate System: NAD 1983 StatePlane Connecticut FIPS 0600 Projection: Lambert Conformal Conic Units: Meter
Background: NOS multibeam data 5x vertical exaggeration (compiled by DAMOSVision 2014)0 0.50.25
Kilometers ´File Name: NLDS_2014_SPI_West_SS
Niantic Bay Disposal Site (NBDS)
Depth (m)
Successional Stage
Stage 1
Stage 1-2, 2
Stage 1 on 3, 2-3, 3
Indeterminate

Page 39 of 45
DAMOS Data Summary Report – New London Disposal Site and Vicinity Sediment-Profile and Plan-View Imaging Survey, September 2014
4.0 SUMMARY
The SPI/PV survey obtained images of cross-sections of the sediment-water interface and plan-view images of the seafloor surface. The results included estimated grain-size information, evidence of sediment transport conditions, biological characteristics, and the effects of biological activity. SPI and PV can detect some conspicuous species but are primarily used to infer process from patterns of sedimentological and biological processes (Germano et al. 2011, Carey et al. 2014). The observed textures and patterns in the seafloor surface and subsurface provided evidence of the recent history of physical and biological processes that is relevant to management decisions (i.e., dredged material placement).
The SPI/PV survey characterized the physical characteristics of selected stations by measuring properties visible in SPI images (grain size major mode, penetration depth, boundary roughness, mud clasts), and observations from both SPI and PV images (sediment layers, sediment transport features). The biological assessment utilized the standard SPI biological assessment (Germano et al. 2011) to generate measured parameters (aRPD, feeding voids, methane, successional stage) and included additional observations from SPI and PV images on infauna, epifauna and traces of biological activity). Representative images for each reference area, transect, and disposal site illustrated the range of sediment conditions sampled during the survey (Figures 4-1, 4-2, 4-3).
In order to provide an integrated characterization of the seafloor, the results of physical and biological characterization from SPI and PV imagery was used to define five broad habitat types (Table 2-2). Seafloor habitats can be defined for many different scales but for this study represented distinctive bottom types of substrata and associated organisms within eastern Long Island Sound. These were defined based on visual characteristics and are not intended to correlate one to one with national standards or Long Island Sound Study (LISS) habitat mapping schemes (Auster et al. 2009, Shumchenia et al. 2014). The purpose was to allow specific areas of eastern Long Island Sound to be related to bottom stress modeling results. However, the general types described had a one to many relationship to the LISS approach (Table 4-1). The results could be cross-walked to the Coastal and Marine Ecological Classification Standard (CMECS) with additional analysis, but the simple habitat types are sufficient to assess suitability of areas for potential disposal sites (FGDC 2012). The habitat types: rock and shells are expected to correlate with modeled or measured bottom stress values above the critical shear stress for transport of consolidated fine materials. The mobile sand habitat is expected to correlate with modeled or measured bottom stress values above the critical shear stress for bedload transport of sand particles. The transitional and depositional habitats are expected to correlate with modeled or measured bottom stress values below the value for transport of unconsolidated fine particles. Open water disposal sites are generally placed in habitats with relatively fine sediments below the wave base that experience transitional or depositional conditions.

Page 40 of 45
DAMOS Data Summary Report – New London Disposal Site and Vicinity Sediment-Profile and Plan-View Imaging Survey, September 2014
Table 4-1.
Cross-walk of Substrata to LISS Habitats (Auster et al. 2009)
Seascape: Fishers Island Sound Subsystem: Deep Subtidal
Substratum Characteristics Habitat Sediment transport Class Subclass Secondary Subclass
and Modifiers Rock Hard bottom, boulders or
large cobbles. Dominated by encrusting organisms: sponges, hydroids, algae, anemones and mobile epifauna.
Assumed to be eroded ridges of glacial till or drift. Some periodic settlement of fines as drape over rock surfaces.
Moraine or Boulder
reef
Boulder Boulder and pebble pavements
Shell Layer of disarticulated shells: common mussel (Mytilus), slipper shell (Crepidula), cockles (Cerastoderma) and clams (Ensis, Spisula, Mercenaria).
Surface layer of clean shells and pebbles on coarse to fine sand. Infauna in layer of coarse shell hash overlying fine sand and silt. Some encrusting organisms on pebbles.
Assumed to be area of active strong near-bed currents moving shells (absence of epifaunal growth).
Moraine, Boulder reef or
Sand dunes
Pebble Biogenic deposit of coarse shells and epifauna
Mobile Sand Fine sand with bedforms, isolated shells and pebbles.
Active infauna including acorn worms (Saccoglossus), deep burrowing polychaetes. Some resistant epifauna on shells or isolated pebbles.
Assumed to be area of moderate near-bed currents sufficient to periodically move sand in bedload.
Sand dunes or Sand bar
Sand Sand dune, small asymmetrical ripples and arcuate ripples
Transitional Surface with shell layer and mud drape.
Epifauna on shell layer and infaunal burrowing organisms.
Episodic transport of shell alternating with deposition.
Basin, Sand bar or Artificial structure
Mixed sediments
Lag deposits of shell and pebbles with epifauna and mud; dredged material
Depositional Very fine sand or silt with no bedforms. Some isolated shells and pebbles.
Dominated by deep burrowing infauna and some encrusting organisms (hydroids, bryozoans, anemones) on hard surfaces.
Assumed to be low near-bed currents with very infrequent storm transport of surface sediment.
Mud fields Mud Lobster burrow; infaunal community

Page 41 of 45
DAMOS Data Summary Report – New London Disposal Site and Vicinity Sediment-Profile and Plan-View Imaging Survey, September 2014
Figure 4-1. Representative images from western part of the study area

Page 42 of 45
DAMOS Data Summary Report – New London Disposal Site and Vicinity Sediment-Profile and Plan-View Imaging Survey, September 2014
Figure 4-2. Representative images from eastern part of the study area

Page 43 of 45
DAMOS Data Summary Report – New London Disposal Site and Vicinity Sediment-Profile and Plan-View Imaging Survey, September 2014
Figure 4-3. Representative images from eastern-most reference areas

Page 44 of 45
DAMOS Data Summary Report – New London Disposal Site and Vicinity Sediment-Profile and Plan-View Imaging Survey, September 2014
5.0 REFERENCES
AECOM. 2009. Monitoring Survey at the New London Disposal Site, July/ August 2007. DAMOS Contribution No. 180. U.S. Army Corps of Engineers, New England District, Concord, MA, 80 pp.
Auster, P. J.; Heinonen, K. B.; Witharana, C.; McKee, M. 2009. A habitat classification scheme for the Long Island Sound region. Long Island Sound Study Technical Report. EPA Long Island Sound Office, Stamford, Connecticut 06904. 83 p.
Carey, D. A.; Hickey, K.; Germano, J. D.; Read, L. B.; Esten, M. E. 2013. Monitoring Survey at the Massachusetts Bay Disposal Site September/October 2012. DAMOS Contribution No. 195. U.S. Army Corps of Engineers, New England District, Concord, MA, 87 pp.
Carey, D. A.; Hahn, M.; Germano, J. D.; Little, D. I.; Bullimore, B. 2014. Marine Habitat Mapping of the Milford Haven Waterway, Wales, UK: Comparison of Facies Mapping and EUNIS Classification for Monitoring Sediment Habitats in an Industrialized Estuary. Journal of Sea Research, 2014, doi:10.1016/j.seares.2014.09.012.
FGDC (Federal Geographic Data Committee). 2012. Coastal and Marine Ecological Classification Standard version 4, 353pp.
Fredette, T. J.; French, G. T. 2004. Understanding the physical and environmental consequences of dredged material disposal: history in New England and current perspectives. Mar. Pollut. Bull. 49:93–102.
Germano, J. D.; Rhoads, D. C.; Lunz, J. D. 1994. An Integrated, Tiered Approach to Monitoring and Management of Dredged Material Disposal Sites in the New England Regions. DAMOS Contribution No. 87. U.S. Army Corps of Engineers, New England Division, Waltham, MA, 67 pp.
Germano, J. D.; Rhoads, D. C.; Valente, R. M.; Carey, D. A.; Solan, M. 2011. The use of Sediment-profile Imaging (SPI) for environmental impact assessments and monitoring studies – lessons learned from the past four decades. Oceanography and Marine Biology: An Annual Review 49: 247-310.
Rhoads, D. C.; Germano, J. D. 1982. Characterization of organism-sediment relations using sediment profile imaging: An efficient method of remote ecological monitoring of the seafloor (REMOTS System). Mar. Ecol. Prog. Ser. 8:115–128.
Rhoads, D. C.; Germano, J. D. 1986. Interpreting long-term changes in benthic community structure: A new protocol. Hydrobiologia 142:291–308.
Shumchenia, E.; Guarinello, M.; Carey, D. A.; Lipsky, A.; Greene, J.; Mayer, L.; Nixon, M.; Weber, J. 2014. Inventory and comparative evaluation of seabed mapping, classification and modeling activities in the Northwest Atlantic, USA to support regional ocean planning. Journal of Sea Research, 2014, doi:10.1016/j.seares.2014.09.010.
Stone, J. R.; Schafer, J. P.; London, E. H.; DiGiacomo-Cohen, M. L.; Lewis, R. S.; Thompson, W. B. 2005. Quaternary Geologic Map of Connecticut and Long Island Sound Basin, USGS Scientific Investigations Map 2784.

Page 45 of 45
DAMOS Data Summary Report – New London Disposal Site and Vicinity Sediment-Profile and Plan-View Imaging Survey, September 2014
6.0 DATA TRANSMITTAL
Data transmittal to support this data report will be provided as a separate deliverable for inclusion in a Technical Support Notebook. The data submittal will include:
Report figures and associated files, including an ArcGIS geo-database
Raw NEF and adjusted SPI/PV images
SPI/PV Field log, station location, and analysis tables
Pop-up and pull-out image files