appendix f detailed description of all validation scales
TRANSCRIPT

Appendix F
Detailed Description of all Validation Scales
Abt Associates Inc., Brown Univ. Appendix F and HRCA 1 of 155
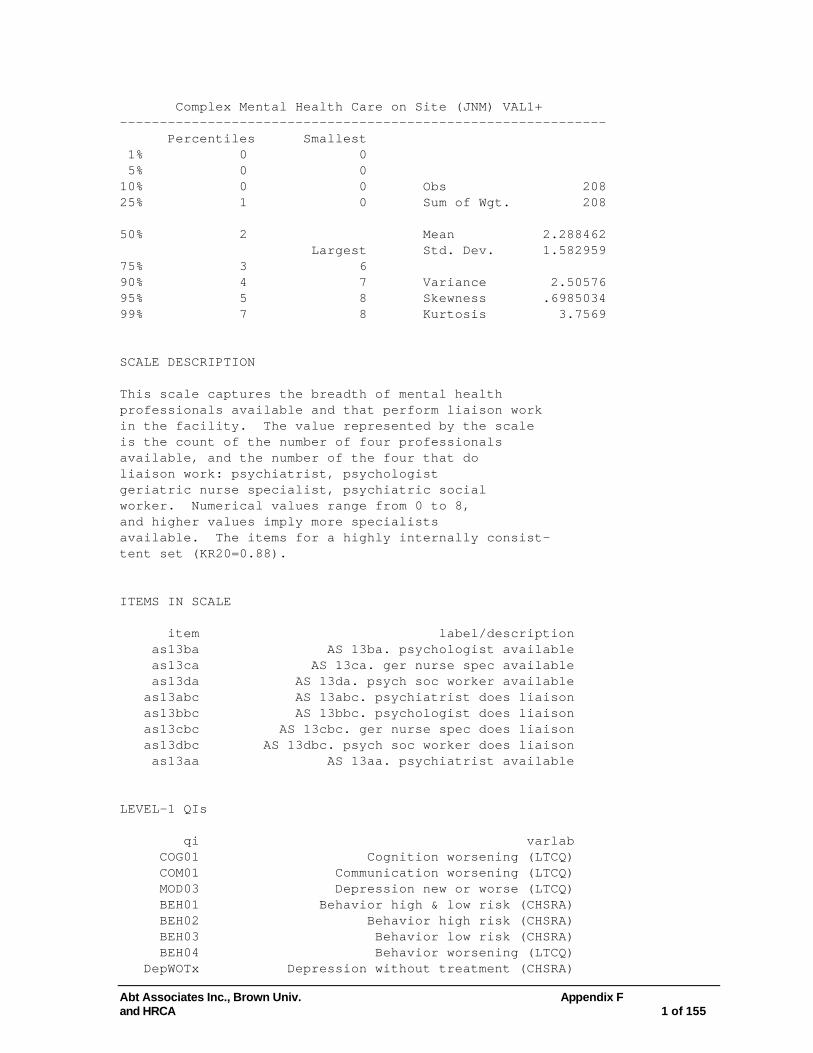
Complex Mental Health Care on Site (JNM) VAL1+ ------------------------------------------------------------- Percentiles Smallest 1% 0 0 5% 0 0 10% 0 0 Obs 208 25% 1 0 Sum of Wgt. 208 50% 2 Mean 2.288462 Largest Std. Dev. 1.582959 75% 3 6 90% 4 7 Variance 2.50576 95% 5 8 Skewness .6985034 99% 7 8 Kurtosis 3.7569 SCALE DESCRIPTION This scale captures the breadth of mental health professionals available and that perform liaison work in the facility. The value represented by the scale is the count of the number of four professionals available, and the number of the four that do liaison work: psychiatrist, psychologist geriatric nurse specialist, psychiatric social worker. Numerical values range from 0 to 8, and higher values imply more specialists available. The items for a highly internally consist- tent set (KR20=0.88). ITEMS IN SCALE item label/description as13ba AS 13ba. psychologist available as13ca AS 13ca. ger nurse spec available as13da AS 13da. psych soc worker available as13abc AS 13abc. psychiatrist does liaison as13bbc AS 13bbc. psychologist does liaison as13cbc AS 13cbc. ger nurse spec does liaison as13dbc AS 13dbc. psych soc worker does liaison as13aa AS 13aa. psychiatrist available LEVEL-1 QIs qi varlab
COG01 Cognition worsening (LTCQ) COM01 Communication worsening (LTCQ) MOD03 Depression new or worse (LTCQ) BEH01 Behavior high & low risk (CHSRA) BEH02 Behavior high risk (CHSRA) BEH03 Behavior low risk (CHSRA) BEH04 Behavior worsening (LTCQ) DepWOTx Depression without treatment (CHSRA)
Abt Associates Inc., Brown Univ. Appendix F and HRCA 2 of 155
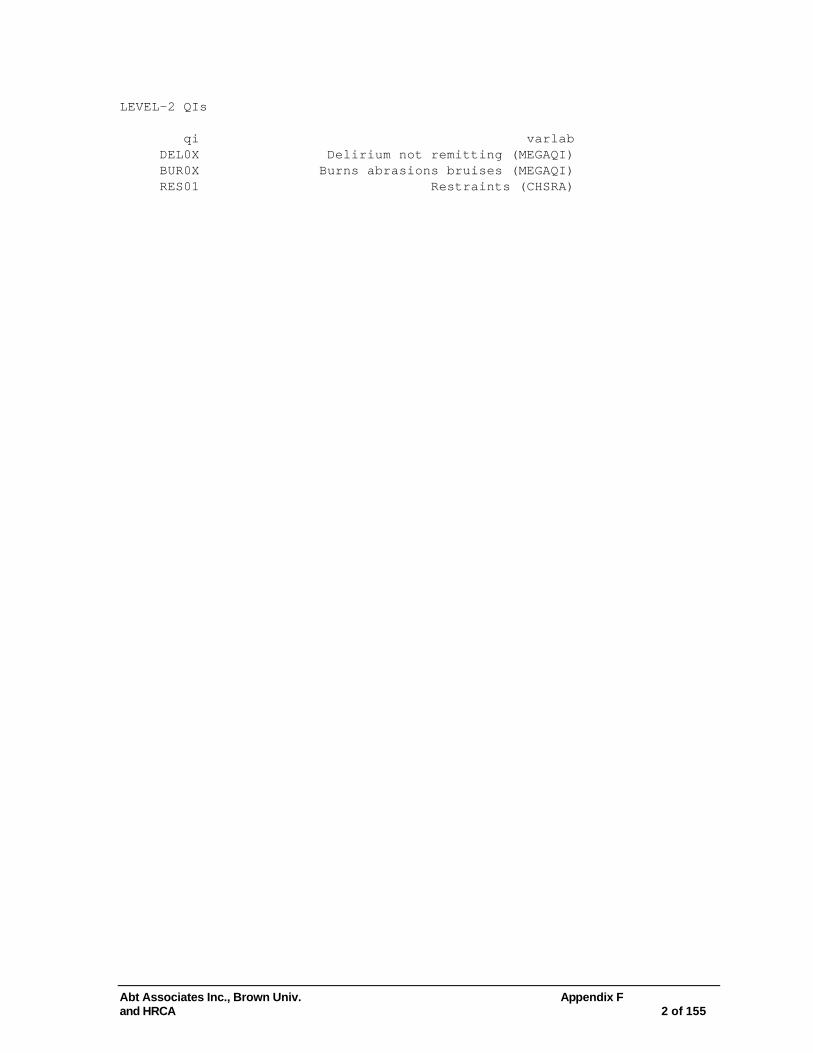
LEVEL-2 QIs qi varlab DEL0X Delirium not remitting (MEGAQI) BUR0X Burns abrasions bruises (MEGAQI) RES01 Restraints (CHSRA)

Abt Associates Inc., Brown Univ. Appendix F and HRCA 3 of 155
Monitor Change in Function/Cognitive Care (JNM) VAL2+ ------------------------------------------------------------- Percentiles Smallest 1% 3 0 5% 6 1 10% 7 3 Obs 208 25% 9 3 Sum of Wgt. 208 50% 12 Mean 11.25481 Largest Std. Dev. 3.177134 75% 14 16 90% 15 16 Variance 10.09418 95% 16 16 Skewness -.7111526 99% 16 16 Kurtosis 3.357183 SCALE DESCRIPTION This scale captures the tendency of caregivers in the facility to observe and communicate about changes in the resident's cognitive and behavioral functioning or areas related to such functioning (i.e., medications). The numerical value for this scale is the count of the number of sixteen areas where good cognitive or behavioral monitoring is occurring (see list of items.) Higher values imply greater vigilance. The KR20 internal consistency reliability for this scale is 0.77. ITEMS IN SCALE item varlab as18a AS 18a. pract-ask resid or family-cog chg? as18c AS 18c. pract-ask resid or fam-behav chg? as18d AS 18d. pract-obs med changes? as18e AS 18e. pract-obs chg in eating, sleeping? as18g AS 18g. pract-monit chgs in funct atatus? as27b1 AS 27b.1 daily repts-behav function as27d1 AS 27d.1 daily repts-commun change as27g1 AS 27g.1 daily repts-funct status chge as28fa AS 28fa. routin commun change? as28ia AS 28ia. routin functional status? as31 AS 31. look for cognitive status change? as32a AS 32a. cogn status monit?-assessments as32b AS 32b. cogn status monit?-memory check as14bb AS 14bb. num residents in reminisce grp as18b AS 18b. pract-chart behav across shifts? as28ea AS 28ea. routin behav function? LEVEL-1 QIs qi varlab

Abt Associates Inc., Brown Univ. Appendix F and HRCA 4 of 155
COG01 Cognition worsening (LTCQ) COM01 Communication worsening (LTCQ) ADL01 ADL decline (CHSRA) ADL02 ADL dec. following imprvnt (MEGAQI) LEVEL-2 QIs qi varlab none Bedfast Bedfast (CHSRA)

Abt Associates Inc., Brown Univ. Appendix F and HRCA 5 of 155
Education on Restraints (Berg) VAL4+ ------------------------------------------------------------- Percentiles Smallest 1% 0 0 5% 0 0 10% 0 0 Obs 208 25% 0 0 Sum of Wgt. 208 50% 0 Mean .1730769 Largest Std. Dev. .3792265 75% 0 1 90% 1 1 Variance .1438127 95% 1 1 Skewness 1.728317 99% 1 1 Kurtosis 3.98708 SCALE DESCRIPTION This scale captures the facility's use of educational programs for restraints for licensed and un-licensed staff. The scale is constructed as a count from 0-2 indicating the presence of educational programs regard- ing restraints from CNAs & LPN/LVN, but the two never occur in the absence of one another when weekly restraint use is present, so the value is a de facto dichotomous indicator of educational programs for restraints. The two educational items are highly correlated (cor=0.86). ITEMS IN SCALE item varlab as26ja AS 26ja. rev prog-restraints-cna? as26jb AS 26jb. rev prog-restraints-rn,lpn\lvn? as28kb3 AS 28kb.3 weekly restraints LEVEL-1 QIs qi varlab RES01 Restraints (CHSRA) LEVEL-2 QIs qi varlab FAL01 Falls increase (LTCQ)

Abt Associates Inc., Brown Univ. Appendix F and HRCA 6 of 155
Communication of Falls (BERG) VAL5+ ------------------------------------------------------------- Percentiles Smallest 1% 0 0 5% 0 0 10% 0 0 Obs 208 25% 0 0 Sum of Wgt. 208 50% 0 Mean .1394231 Largest Std. Dev. .3472232 75% 0 1 90% 1 1 Variance .1205639 95% 1 1 Skewness 2.081928 99% 1 1 Kurtosis 5.334425 SCALE DESCRIPTION This scale captures the facility's tendency to use various communication pathways regarding falls of varying level of formality (verbal informal, verbal formal, and written formal). The scale is a dichotomous indi- cator, taking on a value of 1 if all three pathways are present, 0 otherwise. Internal consistency reliability is not reported as this scale is not composed as a summary, additive index. ITEMS IN SCALE item varlab as29a1 AS 29a.1 falls-verb inform as29a2 AS 29a.2 falls-verb form as29a3 AS 29a.3 falls-written form LEVEL-1 QIs qi varlab FAL01 Falls increase (LTCQ) LEVEL-2 QIs qi varlab none

Abt Associates Inc., Brown Univ. Appendix F and HRCA 7 of 155
Licensed Nurse Involved in Care Planning (JNM) VAL6+ ------------------------------------------------------------- Percentiles Smallest 1% 0 0 5% 0 0 10% 1 0 Obs 206 25% 2 0 Sum of Wgt. 206 50% 3 Mean 2.203883 Largest Std. Dev. .9961802 75% 3 3 90% 3 3 Variance .9923751 95% 3 3 Skewness -.9209112 99% 3 3 Kurtosis 2.572049 SCALE DESCRIPTION This scale captures the tendency of staff of varying levels to participate in the care planning process. The numerical value is a sum of three indicators: whether or not the (1) charge nurse, (2) RN's, or (3) LPNs contribute to the care plan. The internal consistency reliability for this scale is (KR20) 0.70. ITEMS IN SCALE item varlab as9a AS 9a. chg nurse contrib to pat care plan as9b AS 9b. rns contrib to patient care plan as9c AS 9c. lpns contrib to patient care plan LEVEL-1 QIs qi varlab MOD03 Depression new or worse (LTCQ) DepWOTx Depression without treatment (CHSRA) LEVEL-2 QIs qi varlab COG01 Cognition worsening (LTCQ) COM01 Communication worsening (LTCQ) BEH01 Behavior high & low risk (CHSRA) BEH02 Behavior high risk (CHSRA) BEH03 Behavior low risk (CHSRA) PRU01 PU high & low risk (CHSRA) PRU02 PU high risk (CHSRA) PRU03 PU low risk (CHSRA) PRU04 PU onset or worsening (LTCQ)

Abt Associates Inc., Brown Univ. Appendix F and HRCA 8 of 155
Preventative Activities (JNM) VAL7+ ------------------------------------------------------------- Percentiles Smallest 1% 3 2 5% 3 2 10% 4 3 Obs 208 25% 5 3 Sum of Wgt. 208 50% 6 Mean 6.283654 Largest Std. Dev. 2.040963 75% 7 11 90% 9 11 Variance 4.165529 95% 10 11 Skewness .3853347 99% 11 11 Kurtosis 2.821589 SCALE DESCRIPTION This scale captures the number of areas relating to preventative activates engaged by facility caregivers. Types of activities include education, training programs for residents, goal setting with residents (see items include for complete list of areas). The numerical value for this scale is the sum of the number of preventative activates practiced by caregivers or facilitated by the institution. The items included form an scale of marginal internal consistency (KR20=0.54). ITEMS IN SCALE item varlab as14eb AS 14eb. num residents in dress training as20b AS 20b. regular education of residents as20c AS 20c. regular education for families as21d AS 21d. r\r prog-ambulation, gait train as21a AS 21a. r\r programs for eating training as40 AS 40. obs staff for good ulcer prevent? as41 AS 41. observe staff for fall prevention? qi4ca MRR 4c.a goals for prevent-cognit status qi4cb MRR 4c.b goals for prevent-communication qi4cf MRR 4c.f goals for prevent-adl improv qi4cg MRR 4c.g goals for prevent-adl decline qi4ch MRR 4c.h goals for prevent-mobility\walk LEVEL-1 QIs qi varlab COG01 Cognition worsening (LTCQ) COM01 Communication worsening (LTCQ) WAL0X Walking performance (MEGAQI)

Abt Associates Inc., Brown Univ. Appendix F and HRCA 9 of 155
LEVEL-2 QIs qi varlab SOC02 Little or no activities (CHSRA)

Abt Associates Inc., Brown Univ. Appendix F and HRCA 10 of 155
Polypharmacy Monitoring (JNM) VAL8+ ------------------------------------------------------------- Percentiles Smallest 1% 1 0 5% 2 1 10% 4 1 Obs 208 25% 6 1 Sum of Wgt. 208 50% 7 Mean 7.543269 Largest Std. Dev. 3.040476 75% 10 15 90% 12 15 Variance 9.244496 95% 12 15 Skewness .1720853 99% 15 16 Kurtosis 2.900126 SCALE DESCRIPTION This scale represents the facility's commitment to monitoring of medication, in particular psycho- active medication use and associated conditions/fea- tures. Sixteen indicators are included (see items incl- uded for complete list), including monitoring of delirium, cognitive status, level of formality of communication regarding polypharmacy and ad- verse drug reactions). The items included form an internally consistent scale (KR20=0.70). ITEMS IN SCALE item varlab as28cb3 AS 28cb.3 weekly delirium? as16 AS 16. docum policy-monitor neurolep drugs as17 AS 17. freq drug use review by med direct as18d AS 18d. pract-obs med changes? as25d AS 25d. policy rev-use of hi risk meds as26ia AS 26ia. rev prog-polypharmac-cna? as26ib AS 26ib. rev prog-polypharmac-rn,lpn\lvn? as28aa AS 28aa. routin adv drug reaction? as28ab AS 28ab.2 adm adv drug reaction as29e2 AS 29e.2 adverse drug react-verb form as32a AS 32a. cogn status monit?-assessments as32b AS 32b. cogn status monit?-memory check as28ab3 AS 28ab.3 weekly adv drug reaction as29e3 AS 29e.3 adverse drug react-written form as29e2 AS 29e.2 adverse drug react-verb form as29e3 AS 29e.3 adverse drug react-written form LEVEL-1 QIs qi varlab COG01 Cognition worsening (LTCQ) COM01 Communication worsening (LTCQ)
Abt Associates Inc., Brown Univ. Appendix F and HRCA 11 of 155
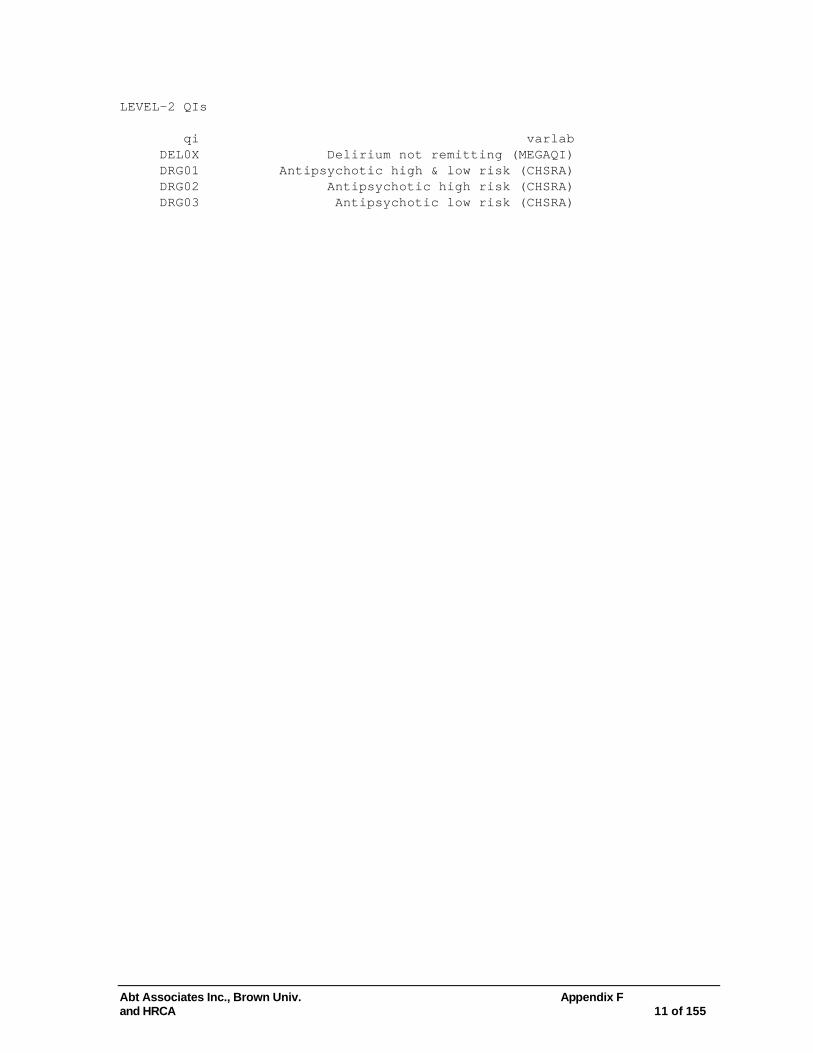
LEVEL-2 QIs qi varlab DEL0X Delirium not remitting (MEGAQI) DRG01 Antipsychotic high & low risk (CHSRA) DRG02 Antipsychotic high risk (CHSRA) DRG03 Antipsychotic low risk (CHSRA)

Abt Associates Inc., Brown Univ. Appendix F and HRCA 12 of 155
Aggressive Cog/Com Care Strategy (JNM) VAL9+ ------------------------------------------------------------- Percentiles Smallest 1% 0 0 5% 0 0 10% 0 0 Obs 208 25% 0 0 Sum of Wgt. 208 50% 1 Mean 1.778846 Largest Std. Dev. 2.137572 75% 3 6 90% 6 6 Variance 4.569212 95% 6 6 Skewness .8219366 99% 6 6 Kurtosis 2.231258 SCALE DESCRIPTION This scale represents the tendency of charts reviewed in the facility to document the presence of aggressive communication and cognitive care strategies. The scale is the additive sum of nine indicators, each signal- ing whether the facility lies in the top 30th percentile in regards to the presence of a care plan for comm- unication, recent updates to the care plan for cog- nition and communication, and the presence of goals for cognition and communication. The items included form an internally consistent scale (KR20=0.86). ITEMS IN SCALE item varlab qi4b MRR 4.b on care plan-communication qi4aa MRR 4a.a recent update-cognit status qi4ab MRR 4a.b recent update-communicat qi4ba MRR 4b.a goals for improve-cognit status qi4bb MRR 4b.b goals for improve-communication qi4ca MRR 4c.a goals for prevent-cognit status qi4cb MRR 4c.b goals for prevent-communication qi4da MRR 4d.a nurse interven-cognitive status qi4db MRR 4d.b nurse interven-communication LEVEL-1 QIs qi varlab DEL0X Delirium not remitting (MEGAQI) LEVEL-2 QIs qi varlab COG01 Cognition worsening (LTCQ)

Abt Associates Inc., Brown Univ. Appendix F and HRCA 13 of 155
COM01 Communication worsening (LTCQ) FAL01 Falls increase (LTCQ) Bedfast Bedfast (CHSRA)
Abt Associates Inc., Brown Univ. Appendix F and HRCA 14 of 155
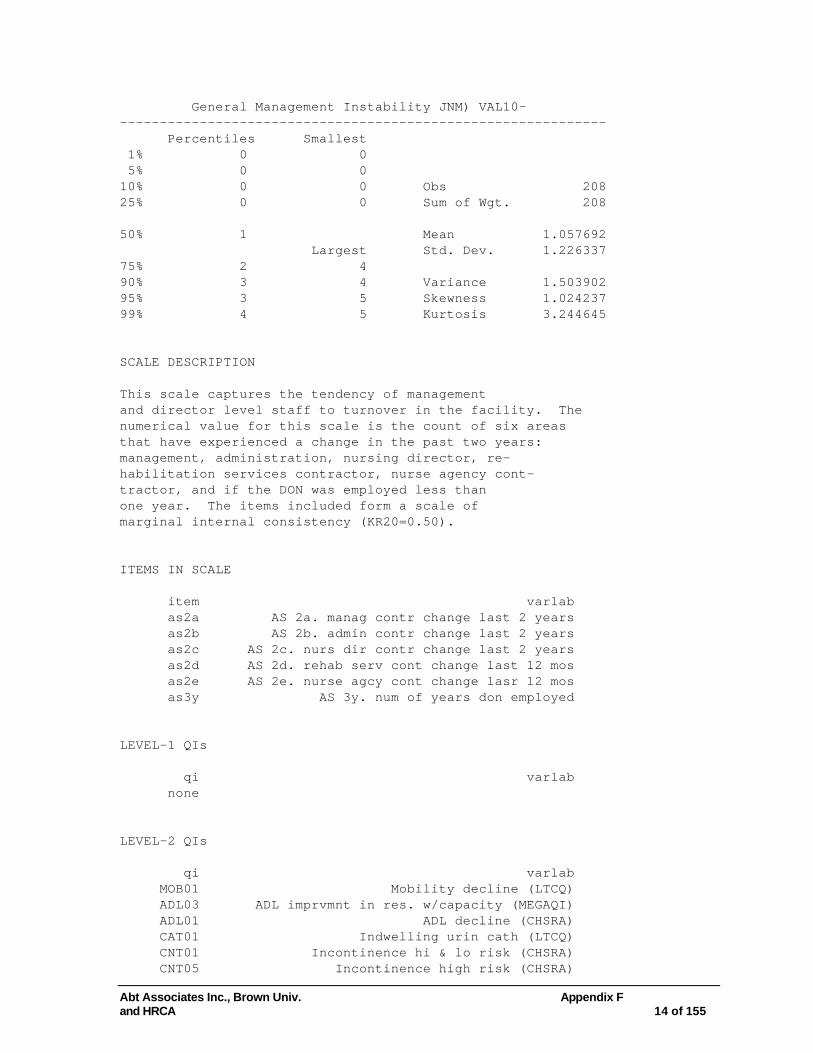
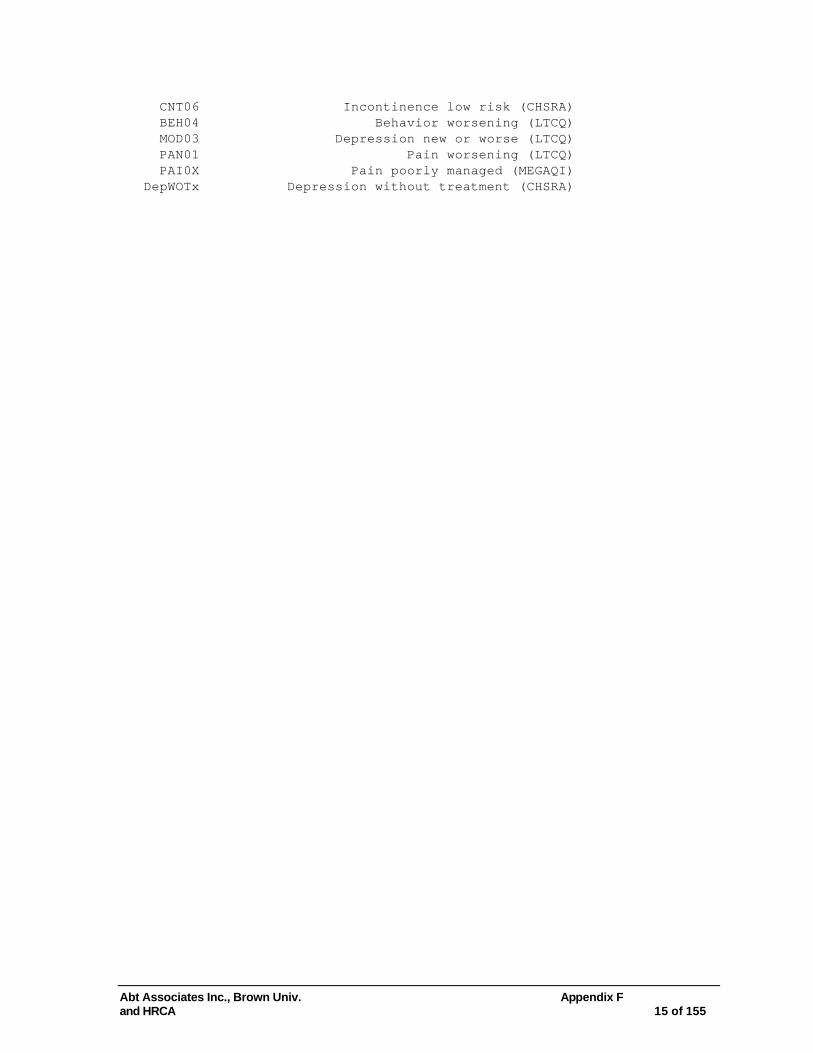
General Management Instability JNM) VAL10- ------------------------------------------------------------- Percentiles Smallest 1% 0 0 5% 0 0 10% 0 0 Obs 208 25% 0 0 Sum of Wgt. 208 50% 1 Mean 1.057692 Largest Std. Dev. 1.226337 75% 2 4 90% 3 4 Variance 1.503902 95% 3 5 Skewness 1.024237 99% 4 5 Kurtosis 3.244645 SCALE DESCRIPTION This scale captures the tendency of management and director level staff to turnover in the facility. The numerical value for this scale is the count of six areas that have experienced a change in the past two years: management, administration, nursing director, re- habilitation services contractor, nurse agency cont- tractor, and if the DON was employed less than one year. The items included form a scale of marginal internal consistency (KR20=0.50). ITEMS IN SCALE item varlab as2a AS 2a. manag contr change last 2 years as2b AS 2b. admin contr change last 2 years as2c AS 2c. nurs dir contr change last 2 years as2d AS 2d. rehab serv cont change last 12 mos as2e AS 2e. nurse agcy cont change lasr 12 mos as3y AS 3y. num of years don employed LEVEL-1 QIs qi varlab none LEVEL-2 QIs qi varlab MOB01 Mobility decline (LTCQ) ADL03 ADL imprvmnt in res. w/capacity (MEGAQI) ADL01 ADL decline (CHSRA) CAT01 Indwelling urin cath (LTCQ) CNT01 Incontinence hi & lo risk (CHSRA) CNT05 Incontinence high risk (CHSRA)
Abt Associates Inc., Brown Univ. Appendix F and HRCA 15 of 155
CNT06 Incontinence low risk (CHSRA) BEH04 Behavior worsening (LTCQ) MOD03 Depression new or worse (LTCQ) PAN01 Pain worsening (LTCQ) PAI0X Pain poorly managed (MEGAQI) DepWOTx Depression without treatment (CHSRA)

Abt Associates Inc., Brown Univ. Appendix F and HRCA 16 of 155
Facility Management contract change (YH) VAL11- ------------------------------------------------------------- Percentiles Smallest 1% 0 0 5% 0 0 10% 0 0 Obs 207 25% 0 0 Sum of Wgt. 207 50% 0 Mean .0821256 Largest Std. Dev. .2752216 75% 0 1 90% 0 1 Variance .0757469 95% 1 1 Skewness 3.044001 99% 1 1 Kurtosis 10.26594 SCALE DESCRIPTION This validation element is based on a single item, and is a dichotomous indicator as to whether the manage- ment contract has changed in the last 2 years. (Internal consistency reliability not applicable). ITEMS IN SCALE item varlab as2a AS 2a. manag contr change last 2 years LEVEL-1 QIs qi varlab MOB01 Mobility decline (LTCQ) CAT01 Indwelling urin cath (LTCQ) CAT02 Catheter (CHSRA) PRU01 PU high & low risk (CHSRA) PRU02 PU high risk (CHSRA) PRU03 PU low risk (CHSRA) PRU04 PU onset or worsening (LTCQ) INF0X Infection flare-up (MEGAQI) CNT04 UTI (CHSRA) LEVEL-2 QIs qi varlab MOD03 Depression new or worse (LTCQ) BEH01 Behavior high & low risk (CHSRA) BEH02 Behavior high risk (CHSRA) BEH03 Behavior low risk (CHSRA) BEH04 Behavior worsening (LTCQ) ADL01 ADL decline (CHSRA) RES01 Restraints (CHSRA) DepWOTx Depression without treatment (CHSRA)

Abt Associates Inc., Brown Univ. Appendix F and HRCA 17 of 155
Screening tools for infections (YH) VAL14+ ------------------------------------------------------------- Percentiles Smallest 1% 0 0 5% 0 0 10% 0 0 Obs 204 25% 0 0 Sum of Wgt. 204 50% 0 Mean .2058824 Largest Std. Dev. .4053396 75% 0 1 90% 1 1 Variance .1643002 95% 1 1 Skewness 1.454786 99% 1 1 Kurtosis 3.116402 SCALE DESCRIPTION This validation element is based on a single item, and is a dichotomous indicator as to whether the respondent to the administrator survey reported that a routine assessment is used for infections. (Internal consistency reliability not applicable). ITEMS IN SCALE item varlab as28la AS 28la. routin infections? LEVEL-1 QIs qi varlab CNT04 UTI (CHSRA) LEVEL-2 QIs qi varlab CAT01 Indwelling urin cath (LTCQ) CAT02 Catheter (CHSRA)

Abt Associates Inc., Brown Univ. Appendix F and HRCA 18 of 155
Use of QA nurse as38 (YH,VM) VAL16+ ------------------------------------------------------------- Percentiles Smallest 1% 0 0 5% 0 0 10% 0 0 Obs 208 25% 0 0 Sum of Wgt. 208 50% 0 Mean .4230769 Largest Std. Dev. .4952393 75% 1 1 90% 1 1 Variance .245262 95% 1 1 Skewness .3113996 99% 1 1 Kurtosis 1.09697 SCALE DESCRIPTION This validation element is based on a single item, and is a dichotomous indicator as to whether there is a quality assurance nurse present in the facility. (Internal consistency reliability not applicable). ITEMS IN SCALE item varlab as38 AS 38. facil has qualitry assurance nurse? LEVEL-1 QIs qi varlab INF0X Infection flare-up (MEGAQI) CNT04 UTI (CHSRA) PRU01 PU high & low risk (CHSRA) PRU02 PU high risk (CHSRA) PRU03 PU low risk (CHSRA) PRU04 PU onset or worsening (LTCQ) FAL01 Falls increase (LTCQ) BUR0X Burns abrasions bruises (MEGAQI) LEVEL-2 QIs qi varlab RES01 Restraints (CHSRA) CAT01 Indwelling urin cath (LTCQ) CAT02 Catheter (CHSRA) PAI0X Pain poorly managed (MEGAQI) PAN01 Pain worsening (LTCQ)

Abt Associates Inc., Brown Univ. Appendix F and HRCA 19 of 155
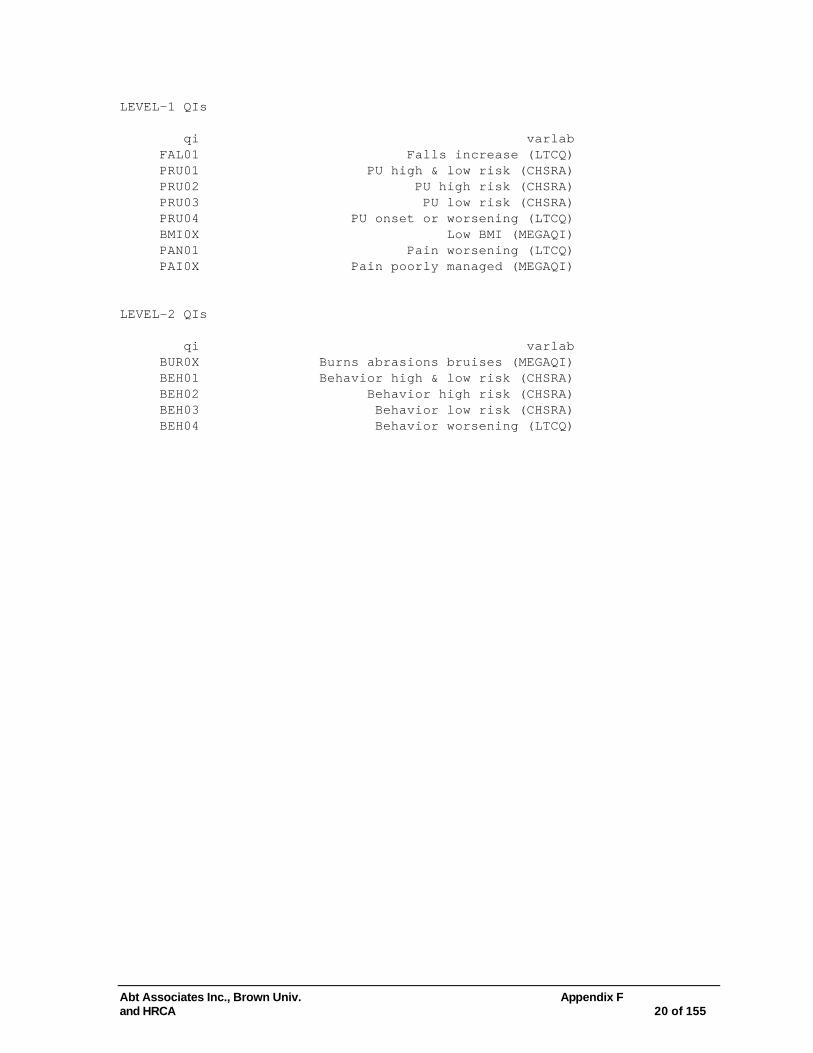
Formal Communication (BERG) VAL17+ ------------------------------------------------------------- Percentiles Smallest 1% 0 0 5% 0 0 10% 0 0 Obs 208 25% 0 0 Sum of Wgt. 208 50% 0 Mean 3.033654 Largest Std. Dev. 4.477946 75% 6 12 90% 12 12 Variance 20.052 95% 12 12 Skewness 1.106123 99% 12 12 Kurtosis 2.545205 SCALE DESCRIPTION This scale captures the breadth and intensity of formal communication pathways present in the facility. The numerical value is the sum of twelve clinical/functional areas that the facility has both formal written & verbal communication pathways (see list of included items for clinical/functional areas inclu- ded). The dichotomous indicators that go into this summary index form an internally consistent set (KR20=0.97). ITEMS IN SCALE item varlab as29a2 AS 29a.2 falls-verb form as29b2 AS 29b.2 pressure ulcers-verb form as29c2 AS 29c.2 depression, mood-verb form as29d2 AS 29d.2 delirium-verb form as29e2 AS 29e.2 adverse drug react-verb form as29f2 AS 29f.2 malnutrition-verb form as29g2 AS 29g.2 pain-verb form as29h2 AS 29h.2 bladder incontin-verb form as29i2 AS 29i.2 behav funct declin-verb form as29j2 AS 29j.2 communic change-verb form as29k2 AS 29k.2 burns, abrasions-verb form as29l2 AS 29l.2 funct state declin-verb form as29a3 AS 29a.3 falls-written form as29b3 AS 29b.3 pressure ulcers-written form as29c3 AS 29c.3 depression, mood-written form as29d3 AS 29d.3 delirium-written form as29e3 AS 29e.3 adverse drug react-written form as29f3 AS 29f.3 malnutrition-written form as29g3 AS 29g.3 pain-written form as29h3 AS 29h.3 bladder incontin-written form as29i3 AS 29i.3 behav funct declin-written form as29j3 AS 29j.3 communic change-written form as29k3 AS 29k.3 burns, abrasions-written form as29l3 AS 29l.3 funct state declin-written form
Abt Associates Inc., Brown Univ. Appendix F and HRCA 20 of 155
LEVEL-1 QIs qi varlab FAL01 Falls increase (LTCQ) PRU01 PU high & low risk (CHSRA) PRU02 PU high risk (CHSRA) PRU03 PU low risk (CHSRA) PRU04 PU onset or worsening (LTCQ) BMI0X Low BMI (MEGAQI) PAN01 Pain worsening (LTCQ) PAI0X Pain poorly managed (MEGAQI) LEVEL-2 QIs qi varlab BUR0X Burns abrasions bruises (MEGAQI) BEH01 Behavior high & low risk (CHSRA) BEH02 Behavior high risk (CHSRA) BEH03 Behavior low risk (CHSRA) BEH04 Behavior worsening (LTCQ)

Abt Associates Inc., Brown Univ. Appendix F and HRCA 21 of 155
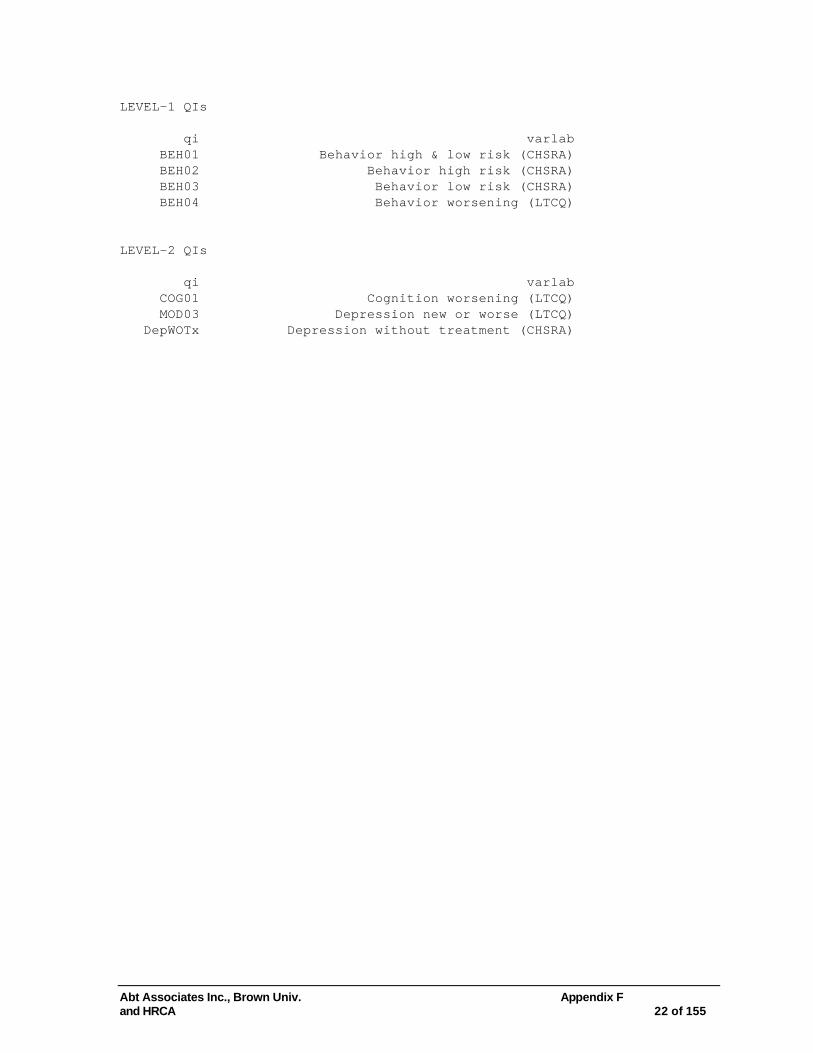
Behavioral Items (YH) VAL18+ ------------------------------------------------------------- Percentiles Smallest 1% 24.63407 14.78798 5% 31.28469 22.89582 10% 35.84116 24.63407 Obs 208 25% 44.11671 24.63407 Sum of Wgt. 208 50% 52.7043 Mean 50 Largest Std. Dev. 10 75% 57.35201 64.94381 90% 60.92919 64.94381 Variance 100 95% 63.20557 67.27316 Skewness -.7843815 99% 64.94381 67.27316 Kurtosis 3.235792 SCALE DESCRIPTION This scale captures the tendency of caregivers in the facility to provide high quality care regarding behavioral symptoms. A number of indicators are included representing the frequency of behavioral assessment, number of sources consulted for behavioral symp- tom changes, cognitive symptoms, CQI programs in-place regarding behavior, etc. (see list of included items for complete list of included areas). The numerical value for this scale is a transformed fac- tor score (mean 50, SD 10) with higher values indi- cating higher quality care (alpha=0.64). ITEMS IN SCALE item varlab as18a AS 18a. pract-ask resid or family-cog chg? as18b AS 18b. pract-chart behav across shifts? as18c AS 18c. pract-ask resid or fam-behav chg? as18d AS 18d. pract-obs med changes? as18e AS 18e. pract-obs chg in eating, sleeping? as28eb3 AS 28eb.3 weekly behavioral function as29i2 AS 29i.2 behav funct declin-verb form as29i3 AS 29i.3 behav funct declin-written form as31 AS 31. look for cognitive status change? as32a AS 32a. cogn status monit?-assessments as32b AS 32b. cogn status monit?-memory check as32c AS 32c. cogn status monit?-behav change as32d AS 32d. cogn status monit?-other as39e AS 39e. which incl in cqi-behav function as42 AS 42. obs staff for behav sympt prevention as32c AS 32c. cogn status monit?-behav change as32d AS 32d. cogn status monit?-other as39e AS 39e. which incl in cqi-behav function as42 AS 42. obs staff for behav sympt prevention
Abt Associates Inc., Brown Univ. Appendix F and HRCA 22 of 155
LEVEL-1 QIs qi varlab BEH01 Behavior high & low risk (CHSRA) BEH02 Behavior high risk (CHSRA) BEH03 Behavior low risk (CHSRA) BEH04 Behavior worsening (LTCQ) LEVEL-2 QIs qi varlab COG01 Cognition worsening (LTCQ) MOD03 Depression new or worse (LTCQ) DepWOTx Depression without treatment (CHSRA)
Abt Associates Inc., Brown Univ. Appendix F and HRCA 23 of 155
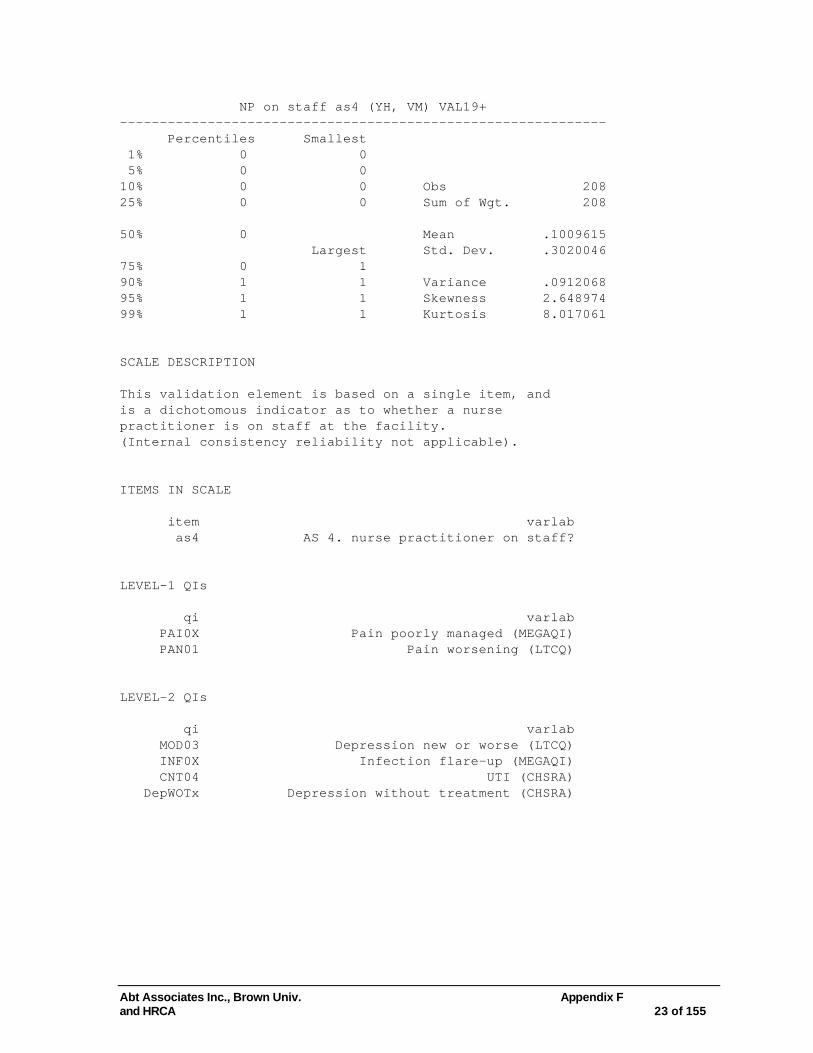
NP on staff as4 (YH, VM) VAL19+ ------------------------------------------------------------- Percentiles Smallest 1% 0 0 5% 0 0 10% 0 0 Obs 208 25% 0 0 Sum of Wgt. 208 50% 0 Mean .1009615 Largest Std. Dev. .3020046 75% 0 1 90% 1 1 Variance .0912068 95% 1 1 Skewness 2.648974 99% 1 1 Kurtosis 8.017061 SCALE DESCRIPTION This validation element is based on a single item, and is a dichotomous indicator as to whether a nurse practitioner is on staff at the facility. (Internal consistency reliability not applicable). ITEMS IN SCALE item varlab as4 AS 4. nurse practitioner on staff? LEVEL-1 QIs qi varlab PAI0X Pain poorly managed (MEGAQI) PAN01 Pain worsening (LTCQ) LEVEL-2 QIs qi varlab MOD03 Depression new or worse (LTCQ) INF0X Infection flare-up (MEGAQI) CNT04 UTI (CHSRA) DepWOTx Depression without treatment (CHSRA)
Abt Associates Inc., Brown Univ. Appendix F and HRCA 24 of 155
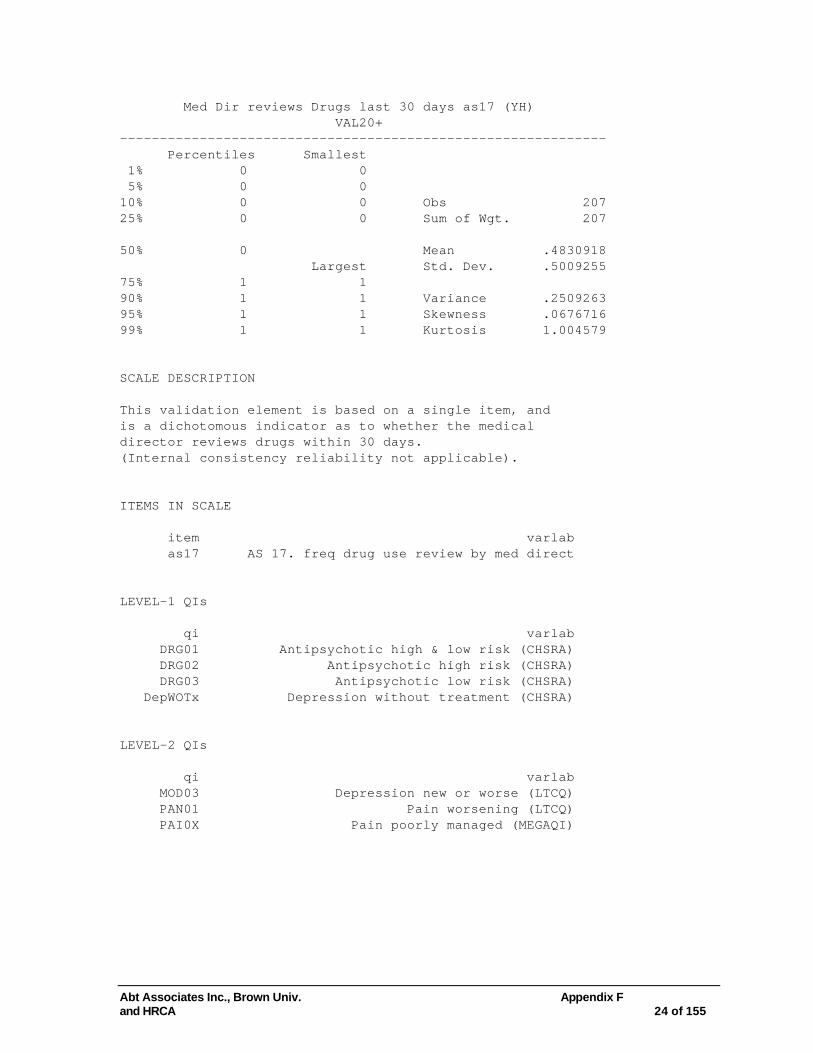
Med Dir reviews Drugs last 30 days as17 (YH) VAL20+ ------------------------------------------------------------- Percentiles Smallest 1% 0 0 5% 0 0 10% 0 0 Obs 207 25% 0 0 Sum of Wgt. 207 50% 0 Mean .4830918 Largest Std. Dev. .5009255 75% 1 1 90% 1 1 Variance .2509263 95% 1 1 Skewness .0676716 99% 1 1 Kurtosis 1.004579 SCALE DESCRIPTION This validation element is based on a single item, and is a dichotomous indicator as to whether the medical director reviews drugs within 30 days. (Internal consistency reliability not applicable). ITEMS IN SCALE item varlab as17 AS 17. freq drug use review by med direct LEVEL-1 QIs qi varlab DRG01 Antipsychotic high & low risk (CHSRA) DRG02 Antipsychotic high risk (CHSRA) DRG03 Antipsychotic low risk (CHSRA) DepWOTx Depression without treatment (CHSRA) LEVEL-2 QIs qi varlab MOD03 Depression new or worse (LTCQ) PAN01 Pain worsening (LTCQ) PAI0X Pain poorly managed (MEGAQI)
Abt Associates Inc., Brown Univ. Appendix F and HRCA 25 of 155
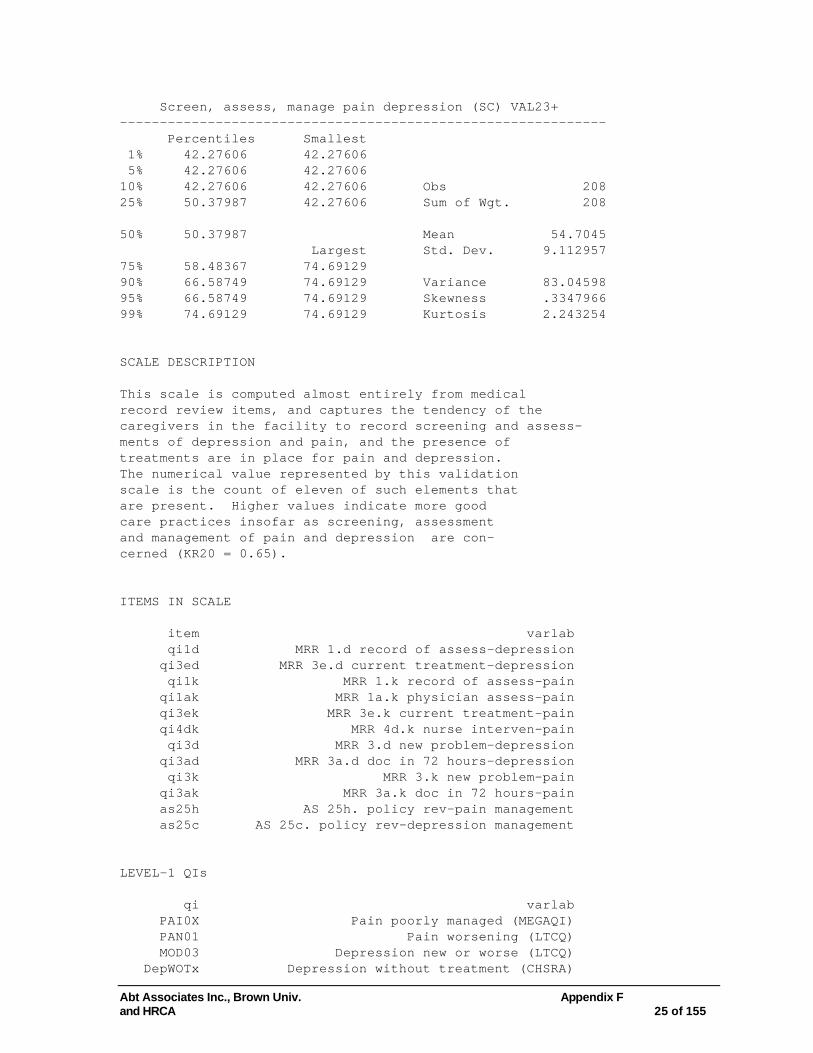
Screen, assess, manage pain depression (SC) VAL23+ ------------------------------------------------------------- Percentiles Smallest 1% 42.27606 42.27606 5% 42.27606 42.27606 10% 42.27606 42.27606 Obs 208 25% 50.37987 42.27606 Sum of Wgt. 208 50% 50.37987 Mean 54.7045 Largest Std. Dev. 9.112957 75% 58.48367 74.69129 90% 66.58749 74.69129 Variance 83.04598 95% 66.58749 74.69129 Skewness .3347966 99% 74.69129 74.69129 Kurtosis 2.243254 SCALE DESCRIPTION This scale is computed almost entirely from medical record review items, and captures the tendency of the caregivers in the facility to record screening and assess- ments of depression and pain, and the presence of treatments are in place for pain and depression. The numerical value represented by this validation scale is the count of eleven of such elements that are present. Higher values indicate more good care practices insofar as screening, assessment and management of pain and depression are con- cerned (KR20 = 0.65). ITEMS IN SCALE item varlab qi1d MRR 1.d record of assess-depression qi3ed MRR 3e.d current treatment-depression qi1k MRR 1.k record of assess-pain qi1ak MRR 1a.k physician assess-pain qi3ek MRR 3e.k current treatment-pain qi4dk MRR 4d.k nurse interven-pain qi3d MRR 3.d new problem-depression qi3ad MRR 3a.d doc in 72 hours-depression qi3k MRR 3.k new problem-pain qi3ak MRR 3a.k doc in 72 hours-pain as25h AS 25h. policy rev-pain management as25c AS 25c. policy rev-depression management LEVEL-1 QIs qi varlab PAI0X Pain poorly managed (MEGAQI) PAN01 Pain worsening (LTCQ) MOD03 Depression new or worse (LTCQ) DepWOTx Depression without treatment (CHSRA)

Abt Associates Inc., Brown Univ. Appendix F and HRCA 26 of 155
LEVEL-2 QIs qi varlab SOC02 Little or no activities (CHSRA)

Abt Associates Inc., Brown Univ. Appendix F and HRCA 27 of 155
Daily Screening of mood as27h1 (YH) VAL24+ ------------------------------------------------------------- Percentiles Smallest 1% 0 0 5% 0 0 10% 0 0 Obs 208 25% 0 0 Sum of Wgt. 208 50% 1 Mean .5865385 Largest Std. Dev. .4936422 75% 1 1 90% 1 1 Variance .2436826 95% 1 1 Skewness -.3514579 99% 1 1 Kurtosis 1.123523 SCALE DESCRIPTION This validation element is based on a single item, and is a dichotomous indicator as to whether the facility has a policy regarding the daily reporting of mood or anxious symptoms displayed by residents from CNAs. (Internal consistency reliability not applicable). ITEMS IN SCALE item varlab as27h1 AS 27h.1 daily repts-depress, anxiety LEVEL-1 QIs qi varlab DepWOTx Depression without treatment (CHSRA) LEVEL-2 QIs qi varlab MOD03 Depression new or worse (LTCQ)
Abt Associates Inc., Brown Univ. Appendix F and HRCA 28 of 155
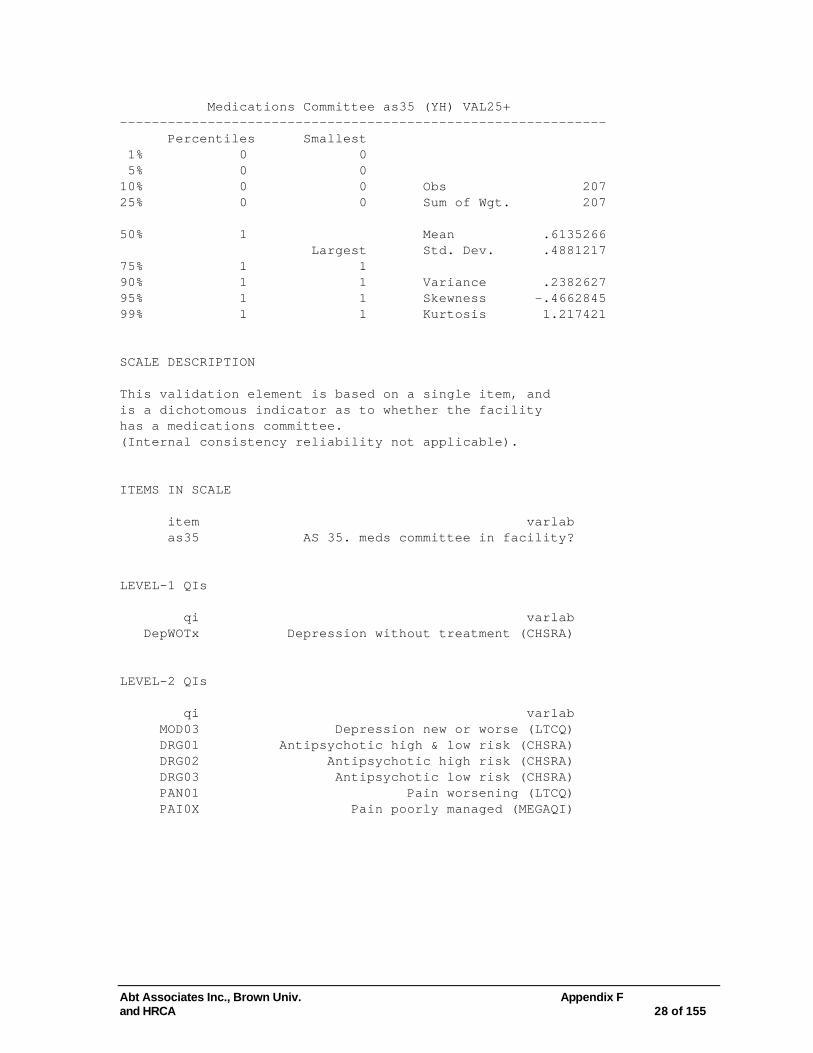
Medications Committee as35 (YH) VAL25+ ------------------------------------------------------------- Percentiles Smallest 1% 0 0 5% 0 0 10% 0 0 Obs 207 25% 0 0 Sum of Wgt. 207 50% 1 Mean .6135266 Largest Std. Dev. .4881217 75% 1 1 90% 1 1 Variance .2382627 95% 1 1 Skewness -.4662845 99% 1 1 Kurtosis 1.217421 SCALE DESCRIPTION This validation element is based on a single item, and is a dichotomous indicator as to whether the facility has a medications committee. (Internal consistency reliability not applicable). ITEMS IN SCALE item varlab as35 AS 35. meds committee in facility? LEVEL-1 QIs qi varlab DepWOTx Depression without treatment (CHSRA) LEVEL-2 QIs qi varlab MOD03 Depression new or worse (LTCQ) DRG01 Antipsychotic high & low risk (CHSRA) DRG02 Antipsychotic high risk (CHSRA) DRG03 Antipsychotic low risk (CHSRA) PAN01 Pain worsening (LTCQ) PAI0X Pain poorly managed (MEGAQI)

Abt Associates Inc., Brown Univ. Appendix F and HRCA 29 of 155
CQI for pain as39 (YH) VAL26+ ------------------------------------------------------------- Percentiles Smallest 1% 0 0 5% 0 0 10% 0 0 Obs 206 25% 0 0 Sum of Wgt. 206 50% 1 Mean .5728155 Largest Std. Dev. .4958745 75% 1 1 90% 1 1 Variance .2458915 95% 1 1 Skewness -.2944008 99% 1 1 Kurtosis 1.086672 SCALE DESCRIPTION This validation element is based on a single item, and is a dichotomous indicator as to whether the facility has a continuous quality improvement program in place for pain. (Internal consistency reliability not applicable). ITEMS IN SCALE item varlab as39 LEVEL-1 QIs qi varlab PAI0X Pain poorly managed (MEGAQI) PAN01 Pain worsening (LTCQ) LEVEL-2 QIs qi varlab BEH01 Behavior high & low risk (CHSRA) BEH02 Behavior high risk (CHSRA) BEH03 Behavior low risk (CHSRA) MOD03 Depression new or worse (LTCQ) DepWOTx Depression without treatment (CHSRA)

Abt Associates Inc., Brown Univ. Appendix F and HRCA 30 of 155
Skin Care Preventive Stratgz v1 (JNM) VAL29+ ------------------------------------------------------------- Percentiles Smallest 1% 0 0 5% 0 0 10% 0 0 Obs 205 25% 1 0 Sum of Wgt. 205 50% 1 Mean 1.121951 Largest Std. Dev. .68582 75% 1 3 90% 2 3 Variance .4703491 95% 2 4 Skewness 1.485638 99% 3 5 Kurtosis 8.969409 SCALE DESCRIPTION This scale combines walk-through observation items and reports from the respondent to the administrator survey to provide a measure of preventative strategies for skin care. Administrative survey reports of lotion or cream or whirlpool soaks, and observations of residents with safety devices, repositioning devices, and pressure relieving devices define this additive scale. The numerical value for the scale (0-6) indi- cates increasing use of skin care preventative stra- tegies. The scale has poor internal consistency reliability (KR20=0.37, but see VAL31). ITEMS IN SCALE item varlab as18j AS 18j. pract-apply lotion or cream? as18k AS 18k. pract-whirlpool soaks? wpm20 WT 20. residents with safety devices wpm22 WT 22. observe repositioning devices wpm23 WT 23. pressure reducing devices on bed wpm24 WT 24. pressure reducing devices bone on LEVEL-1 QIs qi varlab PRU01 PU high & low risk (CHSRA) PRU02 PU high risk (CHSRA) PRU03 PU low risk (CHSRA) PRU04 PU onset or worsening (LTCQ) BUR0X Burns abrasions bruises (MEGAQI) LEVEL-2 QIs qi varlab

Abt Associates Inc., Brown Univ. Appendix F and HRCA 31 of 155
CNT02 Bowel incont decline (LTCQ) CNT03 Bladder incont decline (LTCQ)
Abt Associates Inc., Brown Univ. Appendix F and HRCA 32 of 155
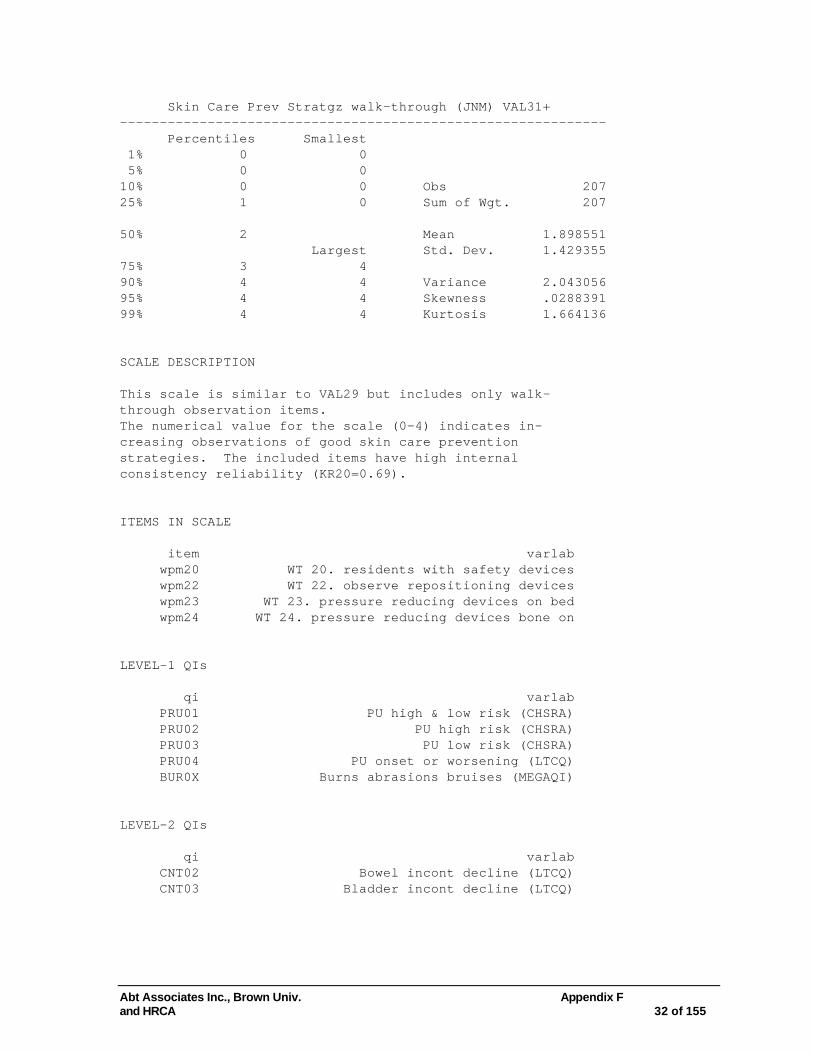
Skin Care Prev Stratgz walk-through (JNM) VAL31+ ------------------------------------------------------------- Percentiles Smallest 1% 0 0 5% 0 0 10% 0 0 Obs 207 25% 1 0 Sum of Wgt. 207 50% 2 Mean 1.898551 Largest Std. Dev. 1.429355 75% 3 4 90% 4 4 Variance 2.043056 95% 4 4 Skewness .0288391 99% 4 4 Kurtosis 1.664136 SCALE DESCRIPTION This scale is similar to VAL29 but includes only walk- through observation items. The numerical value for the scale (0-4) indicates in- creasing observations of good skin care prevention strategies. The included items have high internal consistency reliability (KR20=0.69). ITEMS IN SCALE item varlab wpm20 WT 20. residents with safety devices wpm22 WT 22. observe repositioning devices wpm23 WT 23. pressure reducing devices on bed wpm24 WT 24. pressure reducing devices bone on LEVEL-1 QIs qi varlab PRU01 PU high & low risk (CHSRA) PRU02 PU high risk (CHSRA) PRU03 PU low risk (CHSRA) PRU04 PU onset or worsening (LTCQ) BUR0X Burns abrasions bruises (MEGAQI) LEVEL-2 QIs qi varlab CNT02 Bowel incont decline (LTCQ) CNT03 Bladder incont decline (LTCQ)

Abt Associates Inc., Brown Univ. Appendix F and HRCA 33 of 155
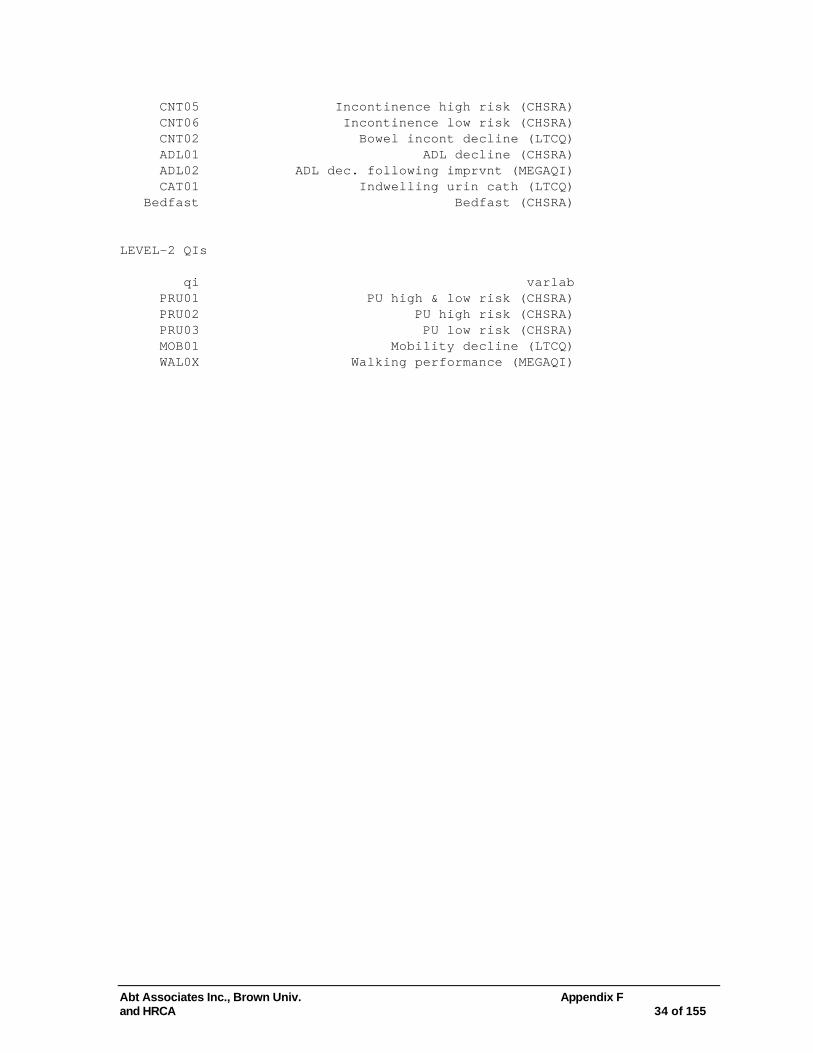
Incontinence Management (JNM) VAL32+ ------------------------------------------------------------- Percentiles Smallest 1% 1 0 5% 2 1 10% 3 1 Obs 208 25% 5 1 Sum of Wgt. 208 50% 7 Mean 6.485577 Largest Std. Dev. 2.544253 75% 8 11 90% 10 12 Variance 6.473221 95% 10 12 Skewness -.1049022 99% 12 13 Kurtosis 2.476646 SCALE DESCRIPTION This scale uses medical record review items and administrator survey items to generate a count of the number of good incontinence management items practiced. Medical record review items are converted to dichotomous facility-level indicators if the care practice is present a rate in the top 30th percentile. Please refer to list of included items for scope of care practices included. The numerical value for the scale is the count of 13 indicators of high quality incontinence care are provided. The items form an internally consistent set (KR20=0.64). ITEMS IN SCALE item varlab qi1p MRR 1.p record of assess-bladder contin qi4bp MRR 4b.p goals for improv-bladder contin qi4cp MRR 4c.p goals for prevent-bladder contin as4 AS 4. nurse practitioner on staff? as26ea AS 26ea. rev prog-incontin prev-cna? as26eb AS 26eb. rev prog-incont prev-rn,lpn\lvn? as27c1 AS 27c.1 daily repts-incontin patterns as29h2 AS 29h.2 bladder incontin-verb form as37ad AS 37ad. what cqi projs-pressure ulcers? as37ag AS 37ag. what cqi projs-urinary incont? as39d AS 39d. which incl in cqi-urinary catheter as39g AS 39g. which incl in cqi-bladder incontin as28db AS 28db.2 adm bladdr incontinence as28db3 AS 28db.3 weekly bladdr incontinence as28db4 AS 28db.4 quarterly bladdr incontinence LEVEL-1 QIs qi varlab CNT01 Incontinence hi & lo risk (CHSRA)
Abt Associates Inc., Brown Univ. Appendix F and HRCA 34 of 155
CNT05 Incontinence high risk (CHSRA) CNT06 Incontinence low risk (CHSRA) CNT02 Bowel incont decline (LTCQ) ADL01 ADL decline (CHSRA) ADL02 ADL dec. following imprvnt (MEGAQI) CAT01 Indwelling urin cath (LTCQ) Bedfast Bedfast (CHSRA) LEVEL-2 QIs qi varlab PRU01 PU high & low risk (CHSRA) PRU02 PU high risk (CHSRA) PRU03 PU low risk (CHSRA) MOB01 Mobility decline (LTCQ) WAL0X Walking performance (MEGAQI)

Abt Associates Inc., Brown Univ. Appendix F and HRCA 35 of 155
Cont Ed Fx Decline (JNM) VAL34+ ------------------------------------------------------------- Percentiles Smallest 1% 0 0 5% 0 0 10% 0 0 Obs 206 25% 0 0 Sum of Wgt. 206 50% 1 Mean 1.131068 Largest Std. Dev. .9198652 75% 2 2 90% 2 2 Variance .846152 95% 2 2 Skewness -.2617868 99% 2 2 Kurtosis 1.238557 SCALE DESCRIPTION This scale indicates the presence of continuing educ- ation for functional decline for licensed and un-licensed staff. The scale is constructed as a count from 0-2 The two items comprising the sum are highly correlated (r=0.72). ITEMS IN SCALE item varlab as26ca AS 26ca. rev prog-funct declin risk-cna? as26cb AS 26cb. rev prog-funct declin-rn,lpn\lvn? LEVEL-1 QIs qi varlab ADL01 ADL decline (CHSRA) ADL02 ADL dec. following imprvnt (MEGAQI) WAL0X Walking performance (MEGAQI) MOB01 Mobility decline (LTCQ) Bedfast Bedfast (CHSRA) LEVEL-2 QIs qi varlab BMI0X Low BMI (MEGAQI) CNT04 UTI (CHSRA) CNT03 Bladder incont decline (LTCQ)

Abt Associates Inc., Brown Univ. Appendix F and HRCA 36 of 155
Effort at Mobility Enhancement (JNM) VAL35+ ------------------------------------------------------------- Percentiles Smallest 1% 0 0 5% 0 0 10% 1 0 Obs 208 25% 2 0 Sum of Wgt. 208 50% 3 Mean 3.596154 Largest Std. Dev. 2.550056 75% 5 9 90% 7 9 Variance 6.502787 95% 8 10 Skewness .5223018 99% 9 10 Kurtosis 2.352201 SCALE DESCRIPTION This scale measures the presence of policies and care practices conducive to promoting mobility or walking performance. The scale uses items drawn from the medical record review, administrator survey, and walk- through. Please refer to list of included items for complete coverage of areas. The numerical score for the scale is the count of eleven indicators of care practices or policies supportive of good mo- ability (0-11). The items included form an internally consistent set (KR20=0.67). ITEMS IN SCALE item varlab qi1aa MRR 1a.a physician assess-cog status qi3h MRR 3.h new problem-mobolity\walking qi3ah MRR 3a.h doc in 72 hours-mobility\walk qi3eh MRR 3e.h current treatment-mobil\walking qi4bh MRR 4b.h goals for improv-mobility\walk qi4ch MRR 4c.h goals for prevent-mobility\walk qi4dh MRR 4d.h nurse interven-mobility\walking as9d AS 9d. r\r aides contrib to pat care plan as14ab AS 14ab. num residents in exerc program as14db AS 14db. num residents in mobil sessions as22 AS 22. propor of res-r\r care last 39 days as23 AS 23. frequency of r\r programs as29l2 AS 29l.2 funct state declin-verb form wpm17 WT 17. residents walking with devices wpm18 WT 18. staff help residents walking LEVEL-1 QIs qi varlab WAL0X Walking performance (MEGAQI) MOB01 Mobility decline (LTCQ)

Abt Associates Inc., Brown Univ. Appendix F and HRCA 37 of 155
Bedfast Bedfast (CHSRA) LEVEL-2 QIs qi varlab ADL01 ADL decline (CHSRA) ADL03 ADL imprvmnt in res. w/capacity (MEGAQI) CNT01 Incontinence hi & lo risk (CHSRA) CNT05 Incontinence high risk (CHSRA) CNT06 Incontinence low risk (CHSRA) CNT02 Bowel incont decline (LTCQ) CNT03 Bladder incont decline (LTCQ)

Abt Associates Inc., Brown Univ. Appendix F and HRCA 38 of 155
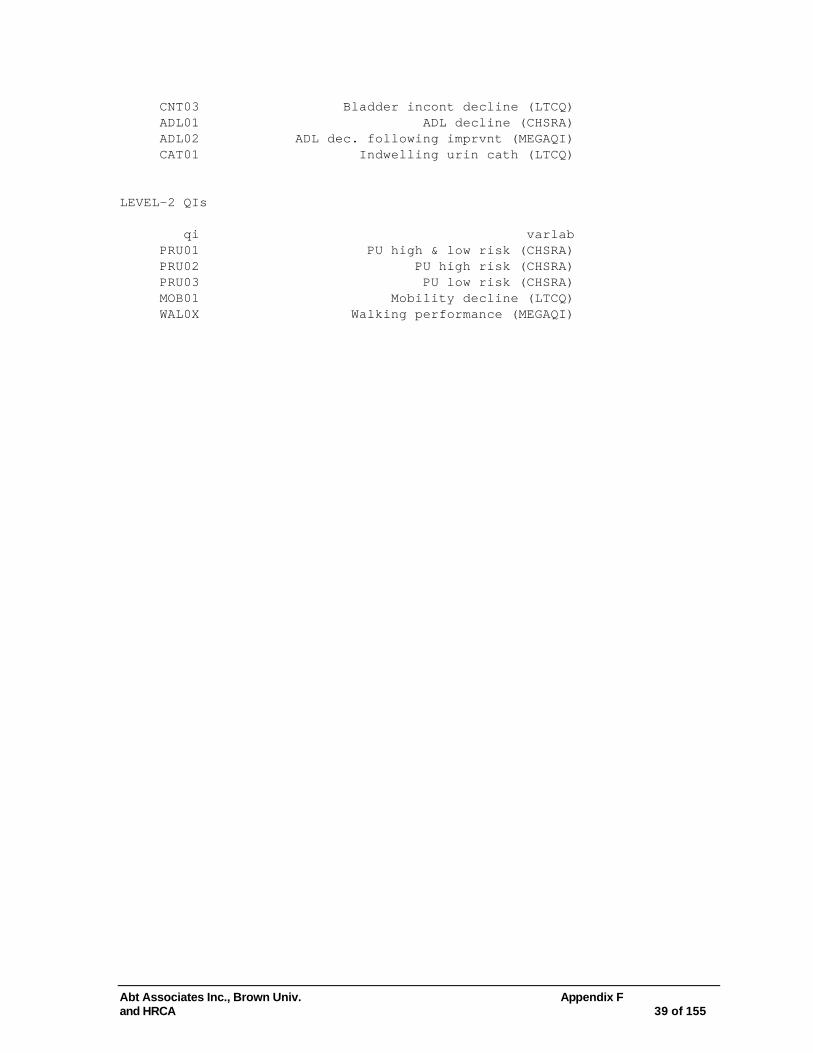
Focus on Incontinence (JNM) VAL36+ ------------------------------------------------------------- Percentiles Smallest 1% 0 0 5% 0 0 10% 1 0 Obs 208 25% 2 0 Sum of Wgt. 208 50% 4 Mean 4.389423 Largest Std. Dev. 2.646168 75% 6 10 90% 8 10 Variance 7.002206 95% 9 10 Skewness .2794782 99% 10 10 Kurtosis 2.121024 SCALE DESCRIPTION This scale measures the presence of policies and care practices conducive to promoting or improving level of continence. The scale uses items from the medical record review, administrator survey, and walk- through. Please refer to list of included items for complete coverage of areas. The numerical score for the scale is the count of eleven indicators of care practices or policies supportive of good mo- bility (0-11). The items included form an internally consistent set (KR20=0.76). ITEMS IN SCALE item varlab qi1p MRR 1.p record of assess-bladder contin qi4p MRR 4.p on care plan-bladder continence qi4ap MRR 4a.o recent update-bladder contin qi4bp MRR 4b.p goals for improv-bladder contin qi4cp MRR 4c.p goals for prevent-bladder contin qi4dp MRR 4d.p nurse interven-bladder contin wpm3 WT 3. odors of urine or feces noticeable wpm18 WT 18. staff help residents walking as14fb AS 14fb. num resid in bladder training as26ea AS 26ea. rev prog-incontin prev-cna? as26eb AS 26eb. rev prog-incont prev-rn,lpn\lvn? as37ag AS 37ag. what cqi projs-urinary incont? as39g AS 39g. which incl in cqi-bladder incontin LEVEL-1 QIs qi varlab CNT01 Incontinence hi & lo risk (CHSRA) CNT05 Incontinence high risk (CHSRA) CNT06 Incontinence low risk (CHSRA) CNT02 Bowel incont decline (LTCQ)
Abt Associates Inc., Brown Univ. Appendix F and HRCA 39 of 155
CNT03 Bladder incont decline (LTCQ) ADL01 ADL decline (CHSRA) ADL02 ADL dec. following imprvnt (MEGAQI) CAT01 Indwelling urin cath (LTCQ) LEVEL-2 QIs qi varlab PRU01 PU high & low risk (CHSRA) PRU02 PU high risk (CHSRA) PRU03 PU low risk (CHSRA) MOB01 Mobility decline (LTCQ) WAL0X Walking performance (MEGAQI)

Abt Associates Inc., Brown Univ. Appendix F and HRCA 40 of 155
CDCPI-Incontinence (JNM) VAL37+ ------------------------------------------------------------- Percentiles Smallest 1% 0 0 5% 0 0 10% 1 0 Obs 208 25% 2 0 Sum of Wgt. 208 50% 3 Mean 3.394231 Largest Std. Dev. 2.193175 75% 5 8 90% 6 9 Variance 4.810015 95% 7 9 Skewness .4469646 99% 9 9 Kurtosis 2.424392 SCALE DESCRIPTION This scale measures care processes across multiple domains. This scale includes items related to ADL functioning and the presence of care planning goals. The numerical value is the number of eleven indicators of high quality functional care are provided (0-11). The items included (listed below) form an moder- ately internally consistent set (KR20=61). ITEMS IN SCALE item varlab qi4da MRR 4d.a nurse interven-cognitive status qi4dd MRR 4d.d nurse interven-depression qi4du MRR 4d.u nurse interven-social isolation qi4bf MRR 4b.f goals for improve-adl improv qi4cf MRR 4c.f goals for prevent-adl improv qi4bg MRR 4b.g goals for improv-adl decline qi4cg MRR 4c.g goals for prevent-adl decline qi4bh MRR 4b.h goals for improv-mobility\walk qi4ch MRR 4c.h goals for prevent-mobility\walk as14eb AS 14eb. num residents in dress training as14db AS 14db. num residents in mobil sessions LEVEL-1 QIs qi varlab ADL03 ADL imprvmnt in res. w/capacity (MEGAQI) ADL01 ADL decline (CHSRA) ADL02 ADL dec. following imprvnt (MEGAQI) WAL0X Walking performance (MEGAQI) MOB01 Mobility decline (LTCQ) LEVEL-2 QIs
Abt Associates Inc., Brown Univ. Appendix F and HRCA 41 of 155
qi varlab RES01 Restraints (CHSRA)

Abt Associates Inc., Brown Univ. Appendix F and HRCA 42 of 155
CDCPI-Nutritional (JNM) VAL38+ ------------------------------------------------------------- Percentiles Smallest 1% 0 0 5% 1 0 10% 1 0 Obs 208 25% 2 1 Sum of Wgt. 208 50% 3 Mean 3.418269 Largest Std. Dev. 1.552014 75% 5 6 90% 5 7 Variance 2.408747 95% 6 7 Skewness .1530063 99% 7 8 Kurtosis 2.489535 SCALE DESCRIPTION This scale measures care processes across multiple domains. This scale includes items related to nutrition. (see list of items). The numerical score is the count of 8 items (0-8). Higher values indicate more care practices present that suggest high quality care with regards to nutrition and eating. The items included do not form an internally consistent set (KR20=0.36) and therefore the scale is considered an index of essentially randomly occurring care practices supportive of good nutrition. ITEMS IN SCALE item varlab qi4bn MRR 4b.n goals for improve-undernutrit qi4cn MRR 4c.n goals for prevent-undernutrit as14ib AS 14ib. num residents use reg snacks as28jb3 AS 28jb.3 weekly malnutrition as36 AS 36. nutrirtion committee at facility? as37ab AS 37ab. what cqi projs-nutrition? wml8 WT 8. pleasant atmosphere in facility wml9 WT 9. homelike appearance in facility LEVEL-1 QIs qi varlab need to re-review LEVEL-2 QIs qi varlab need to re-review

Abt Associates Inc., Brown Univ. Appendix F and HRCA 43 of 155
CDCPI-Psychosocial (JNM) VAL39+ ------------------------------------------------------------- Percentiles Smallest 1% 0 0 5% 0 0 10% 1 0 Obs 208 25% 2 0 Sum of Wgt. 208 50% 3 Mean 3.076923 Largest Std. Dev. 1.98882 75% 4 8 90% 6 8 Variance 3.955407 95% 7 8 Skewness .4659738 99% 8 8 Kurtosis 2.686325 SCALE DESCRIPTION This scale measures care processes across multiple domains. This scale includes items related to psycho- social functioning (see list of items). The numerical score is the count of 9 indicators (0-9). Higher scores imply greater number of high quality care practices regarding assessment of symptoms of dep- ression/anxiety, presence of care planning goals for mental health symptoms, and goals in to imp- rove social isolation. The items in this scale form an internally consistent set (KR20=0.62). ITEMS IN SCALE item varlab qi4ba MRR 4b.a goals for improve-cognit status qi4ca MRR 4c.a goals for prevent-cognit status qi4bd MRR 4b.d goals for improv-depression qi4cd MRR 4c.d goals for prevent-depression qi4bu MRR 4b.u goals for improv-soc isolation qi4cu MRR 4c.u goals for prevent-soc isolation as28bb AS 28bb.2 adm depression, anxiety as28bb3 AS 28bb.3 weekly depression, anxiety as28bb5 AS 28bb.5 annually depression, anxiety wpm11 WT 11. variety of activities avaliable wpm12 WT 12. out of bed, not for nap or bedtime LEVEL-1 QIs qi varlab COG01 Cognition worsening (LTCQ) SOC02 Little or no activities (CHSRA) LEVEL-2 QIs

Abt Associates Inc., Brown Univ. Appendix F and HRCA 44 of 155
qi varlab none
Abt Associates Inc., Brown Univ. Appendix F and HRCA 45 of 155
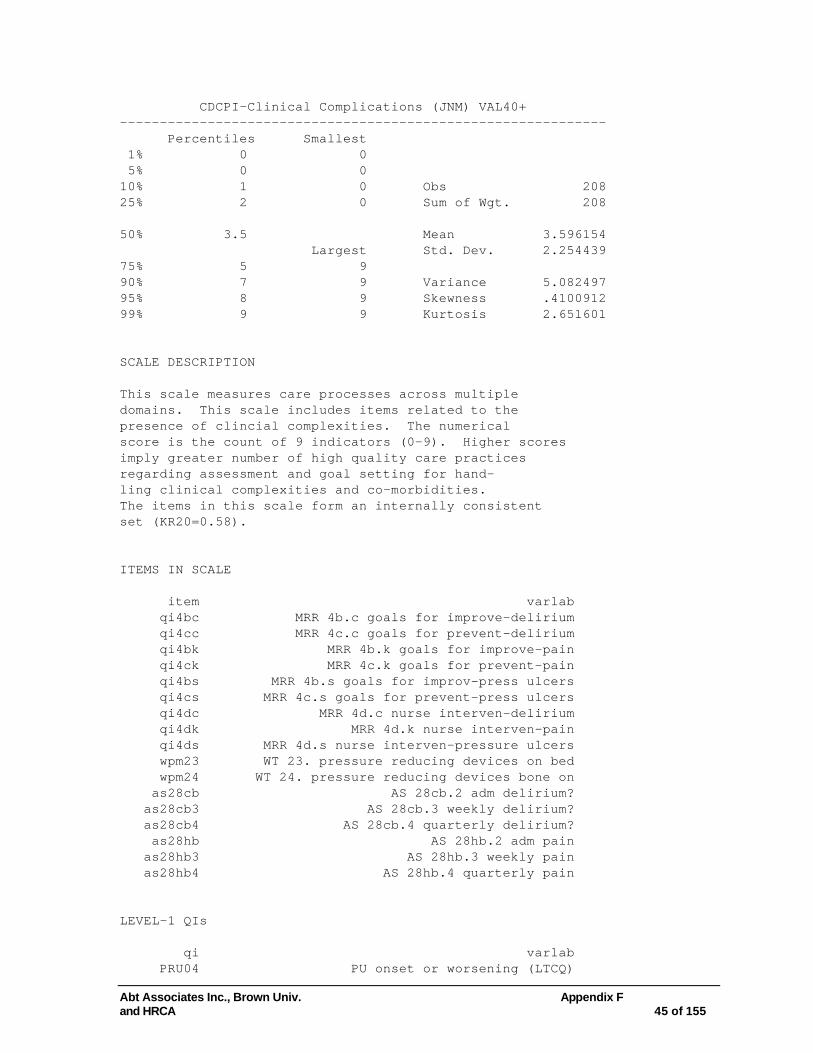
CDCPI-Clinical Complications (JNM) VAL40+ ------------------------------------------------------------- Percentiles Smallest 1% 0 0 5% 0 0 10% 1 0 Obs 208 25% 2 0 Sum of Wgt. 208 50% 3.5 Mean 3.596154 Largest Std. Dev. 2.254439 75% 5 9 90% 7 9 Variance 5.082497 95% 8 9 Skewness .4100912 99% 9 9 Kurtosis 2.651601 SCALE DESCRIPTION This scale measures care processes across multiple domains. This scale includes items related to the presence of clincial complexities. The numerical score is the count of 9 indicators (0-9). Higher scores imply greater number of high quality care practices regarding assessment and goal setting for hand- ling clinical complexities and co-morbidities. The items in this scale form an internally consistent set (KR20=0.58). ITEMS IN SCALE item varlab qi4bc MRR 4b.c goals for improve-delirium qi4cc MRR 4c.c goals for prevent-delirium qi4bk MRR 4b.k goals for improve-pain qi4ck MRR 4c.k goals for prevent-pain qi4bs MRR 4b.s goals for improv-press ulcers qi4cs MRR 4c.s goals for prevent-press ulcers qi4dc MRR 4d.c nurse interven-delirium qi4dk MRR 4d.k nurse interven-pain qi4ds MRR 4d.s nurse interven-pressure ulcers wpm23 WT 23. pressure reducing devices on bed wpm24 WT 24. pressure reducing devices bone on as28cb AS 28cb.2 adm delirium? as28cb3 AS 28cb.3 weekly delirium? as28cb4 AS 28cb.4 quarterly delirium? as28hb AS 28hb.2 adm pain as28hb3 AS 28hb.3 weekly pain as28hb4 AS 28hb.4 quarterly pain LEVEL-1 QIs qi varlab PRU04 PU onset or worsening (LTCQ)
Abt Associates Inc., Brown Univ. Appendix F and HRCA 46 of 155
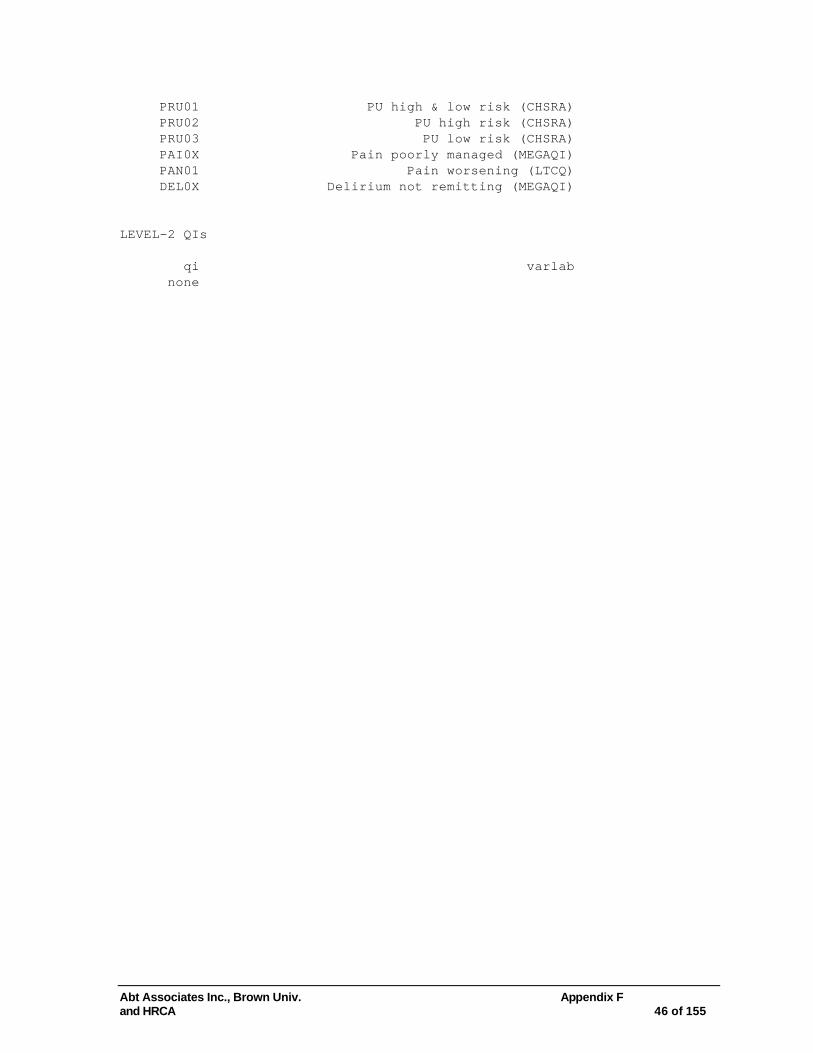
PRU01 PU high & low risk (CHSRA) PRU02 PU high risk (CHSRA) PRU03 PU low risk (CHSRA) PAI0X Pain poorly managed (MEGAQI) PAN01 Pain worsening (LTCQ) DEL0X Delirium not remitting (MEGAQI) LEVEL-2 QIs qi varlab none
Abt Associates Inc., Brown Univ. Appendix F and HRCA 47 of 155
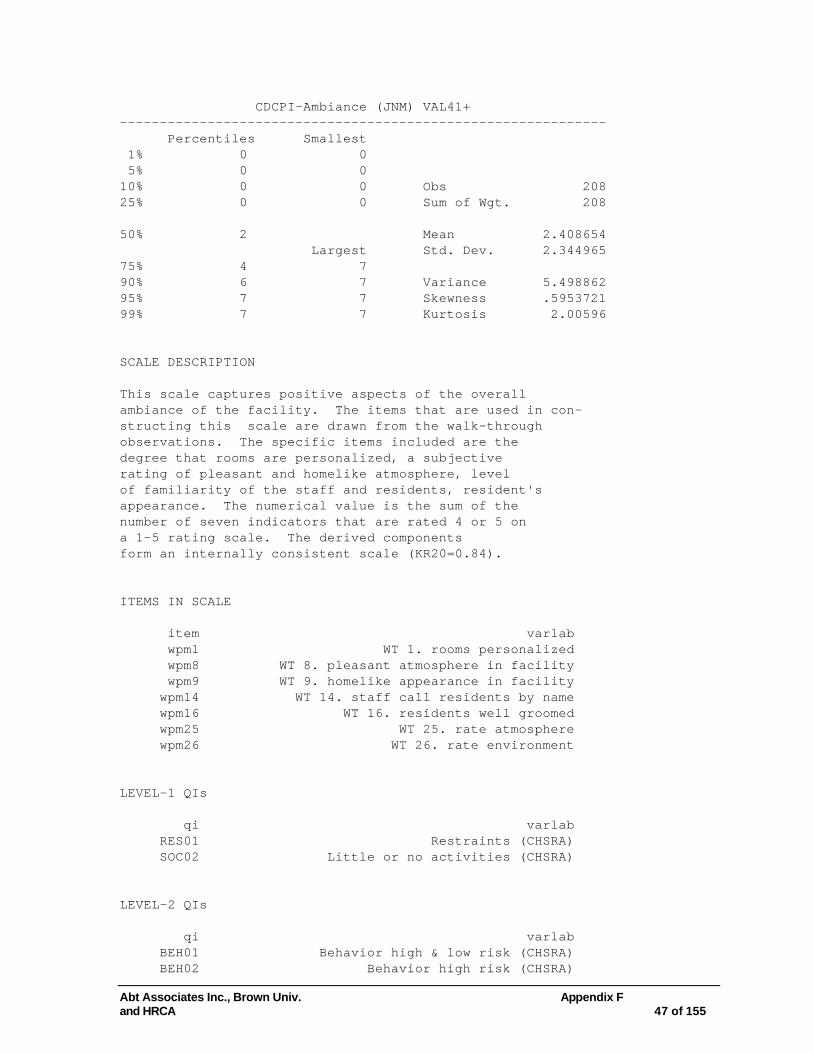
CDCPI-Ambiance (JNM) VAL41+ ------------------------------------------------------------- Percentiles Smallest 1% 0 0 5% 0 0 10% 0 0 Obs 208 25% 0 0 Sum of Wgt. 208 50% 2 Mean 2.408654 Largest Std. Dev. 2.344965 75% 4 7 90% 6 7 Variance 5.498862 95% 7 7 Skewness .5953721 99% 7 7 Kurtosis 2.00596 SCALE DESCRIPTION This scale captures positive aspects of the overall ambiance of the facility. The items that are used in con- structing this scale are drawn from the walk-through observations. The specific items included are the degree that rooms are personalized, a subjective rating of pleasant and homelike atmosphere, level of familiarity of the staff and residents, resident's appearance. The numerical value is the sum of the number of seven indicators that are rated 4 or 5 on a 1-5 rating scale. The derived components form an internally consistent scale (KR20=0.84). ITEMS IN SCALE item varlab wpm1 WT 1. rooms personalized wpm8 WT 8. pleasant atmosphere in facility wpm9 WT 9. homelike appearance in facility wpm14 WT 14. staff call residents by name wpm16 WT 16. residents well groomed wpm25 WT 25. rate atmosphere wpm26 WT 26. rate environment LEVEL-1 QIs qi varlab RES01 Restraints (CHSRA) SOC02 Little or no activities (CHSRA) LEVEL-2 QIs qi varlab BEH01 Behavior high & low risk (CHSRA) BEH02 Behavior high risk (CHSRA)

Abt Associates Inc., Brown Univ. Appendix F and HRCA 48 of 155
BEH03 Behavior low risk (CHSRA) MOD03 Depression new or worse (LTCQ) WAL0X Walking performance (MEGAQI) COG01 Cognition worsening (LTCQ) DepWOTx Depression without treatment (CHSRA)

Abt Associates Inc., Brown Univ. Appendix F and HRCA 49 of 155
CDCPI3-Cross Domain Quality Response (JNM) VAL42+ ------------------------------------------------------------- Percentiles Smallest 1% 0 0 5% 0 0 10% 1 0 Obs 208 25% 2 0 Sum of Wgt. 208 50% 3 Mean 2.961538 Largest Std. Dev. 1.361465 75% 4 5 90% 5 5 Variance 1.853586 95% 5 5 Skewness -.3678878 99% 5 5 Kurtosis 2.496652 SCALE DESCRIPTION This scale captures overall tendencies towards positive care practices over multiple domains. The numerical value is the factor score underlying the other Cross- Domain Care Process Indices (VAL #37-41). The items form an internally consistent scale (alpha=0.68). ITEMS IN SCALE item varlab val37 val38 val39 val40 val41 LEVEL-1 QIs qi varlab ADL03 ADL imprvmnt in res. w/capacity (MEGAQI) ADL01 ADL decline (CHSRA) ADL02 ADL dec. following imprvnt (MEGAQI) WAL0X Walking performance (MEGAQI) MOB01 Mobility decline (LTCQ) COG01 Cognition worsening (LTCQ) SOC02 Little or no activities (CHSRA) PRU04 PU onset or worsening (LTCQ) PRU01 PU high & low risk (CHSRA) PRU02 PU high risk (CHSRA) PRU03 PU low risk (CHSRA) PAI0X Pain poorly managed (MEGAQI) PAN01 Pain worsening (LTCQ) DEL0X Delirium not remitting (MEGAQI) RES01 Restraints (CHSRA)

Abt Associates Inc., Brown Univ. Appendix F and HRCA 50 of 155
LEVEL-2 QIs qi varlab RES01 Restraints (CHSRA) BEH01 Behavior high & low risk (CHSRA) BEH02 Behavior high risk (CHSRA) BEH03 Behavior low risk (CHSRA) MOD03 Depression new or worse (LTCQ) WAL0X Walking performance (MEGAQI) COG01 Cognition worsening (LTCQ)

Abt Associates Inc., Brown Univ. Appendix F and HRCA 51 of 155
Percent Single Bedded Rooms, Deciles (JNM) VAL44+ ------------------------------------------------------------- Percentiles Smallest 1% 1 1 5% 1 1 10% 1 1 Obs 205 25% 3 1 Sum of Wgt. 205 50% 5 Mean 5.429268 Largest Std. Dev. 2.93577 75% 8 10 90% 9 10 Variance 8.618747 95% 10 10 Skewness -.0074703 99% 10 10 Kurtosis 1.753551 SCALE DESCRIPTION This scale represents the proportion of beds in the facility that are located in rooms with no other beds. The numerical value for this scale [1-10] represents the decile in which the actual percentage fell. That is, a facil- ity with a value of 1 fell in the bottom 10% of facil- ities, and those with a score of 10 fell in the top 10% of facilities in terms of percent of beds that were in single rooms. (Internal consistency reliability not applicable) ITEMS IN SCALE item varlab ass1 AS s1. how many beds ass2 AS s2. how many single bedded rooms LEVEL-1 QIs qi varlab none LEVEL-2 QIs qi varlab MOD03 Depression new or worse (LTCQ) SOC02 Little or no activities (CHSRA) BEH01 Behavior high & low risk (CHSRA) BEH02 Behavior high risk (CHSRA) BEH03 Behavior low risk (CHSRA) BEH04 Behavior worsening (LTCQ)

Abt Associates Inc., Brown Univ. Appendix F and HRCA 52 of 155
Pain Assessment (ASSESS) (VM) VAL45+ ------------------------------------------------------------- Percentiles Smallest 1% 0 0 5% 0 0 10% .0666667 0 Obs 206 25% .1851852 0 Sum of Wgt. 206 50% .4913793 Mean .5272408 Largest Std. Dev. .3858157 75% .85 1.4 90% 1.045455 1.461538 Variance .1488537 95% 1.15 1.571429 Skewness .4901412 99% 1.461538 1.724138 Kurtosis 2.434425 SCALE DESCRIPTION This scale captures the tendency of residents in the facility with pain to get an assessment by a physician. Each chart reviewed in the medical record review is scored on a 0-2 scale: 0=default value, 1=if there is some record in the chart of pain, and 2 if there is some record of pain in the chart and is a record of an assessment by a physician. The numerical value for the validation scale is the average of this 0-2 score for each chart within the facility. Higher value implies greater tendency for folks in pain to get assessed by a physician. (Internal consistency NA). ITEMS IN SCALE item varlab qi1k MRR 1.k record of assess-pain qi1ak MRR 1a.k physician assess-pain LEVEL-1 QIs qi varlab PAI0X Pain poorly managed (MEGAQI) PAN01 Pain worsening (LTCQ) LEVEL-2 QIs qi varlab none

Abt Associates Inc., Brown Univ. Appendix F and HRCA 53 of 155
Change Response (CHNGRESP) (VM) VAL46+ ------------------------------------------------------------- Percentiles Smallest 1% 0 0 5% 0 0 10% 0 0 Obs 206 25% .0769231 0 Sum of Wgt. 206 50% .1666667 Mean .2097677 Largest Std. Dev. .178232 75% .3 .7241379 90% .4642857 .8 Variance .0317667 95% .5185185 .8275862 Skewness 1.149782 99% .8 .862069 Kurtosis 4.407319 SCALE DESCRIPTION This scale captures the tendency of caregivers in the facility to change care plan in response to pain. For all charts in the record review, the scale is initialized at 0 and is 1 if there is evidence that the resident's pain status changed, 2 if pain changed and at least 2 of the following: evidence of assessment w/in 72 hours, notification of physician, therapies notified, referral or consult ordered, or a treatment was in place. The numerical value is the average for all charts in the facility. (Internal consistency reliability not applicable). ITEMS IN SCALE item varlab qi3ak MRR 3a.k doc in 72 hours-pain qi3bk MRR 3b.k phys notified of chg-pain qi3ck MRR 3c.k ther notified of chg-pain qi3dk MRR 3d.k refer w specialist-pain qi3ek MRR 3e.k current treatment-pain qi3k MRR 3.k new problem-pain LEVEL-1 QIs qi varlab PAI0X Pain poorly managed (MEGAQI) PAN01 Pain worsening (LTCQ) LEVEL-2 QIs qi varlab none
Abt Associates Inc., Brown Univ. Appendix F and HRCA 54 of 155
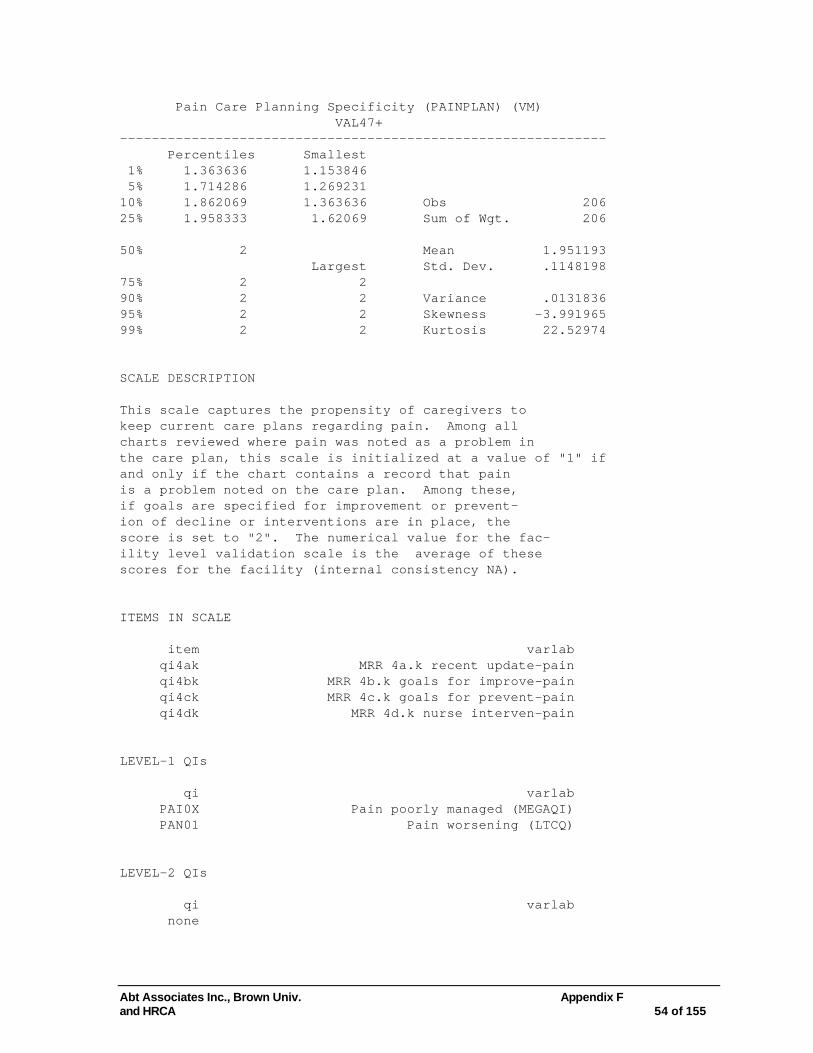
Pain Care Planning Specificity (PAINPLAN) (VM) VAL47+ ------------------------------------------------------------- Percentiles Smallest 1% 1.363636 1.153846 5% 1.714286 1.269231 10% 1.862069 1.363636 Obs 206 25% 1.958333 1.62069 Sum of Wgt. 206 50% 2 Mean 1.951193 Largest Std. Dev. .1148198 75% 2 2 90% 2 2 Variance .0131836 95% 2 2 Skewness -3.991965 99% 2 2 Kurtosis 22.52974 SCALE DESCRIPTION This scale captures the propensity of caregivers to keep current care plans regarding pain. Among all charts reviewed where pain was noted as a problem in the care plan, this scale is initialized at a value of "1" if and only if the chart contains a record that pain is a problem noted on the care plan. Among these, if goals are specified for improvement or prevent- ion of decline or interventions are in place, the score is set to "2". The numerical value for the fac- ility level validation scale is the average of these scores for the facility (internal consistency NA). ITEMS IN SCALE item varlab qi4ak MRR 4a.k recent update-pain qi4bk MRR 4b.k goals for improve-pain qi4ck MRR 4c.k goals for prevent-pain qi4dk MRR 4d.k nurse interven-pain LEVEL-1 QIs qi varlab PAI0X Pain poorly managed (MEGAQI) PAN01 Pain worsening (LTCQ) LEVEL-2 QIs qi varlab none
Abt Associates Inc., Brown Univ. Appendix F and HRCA 55 of 155
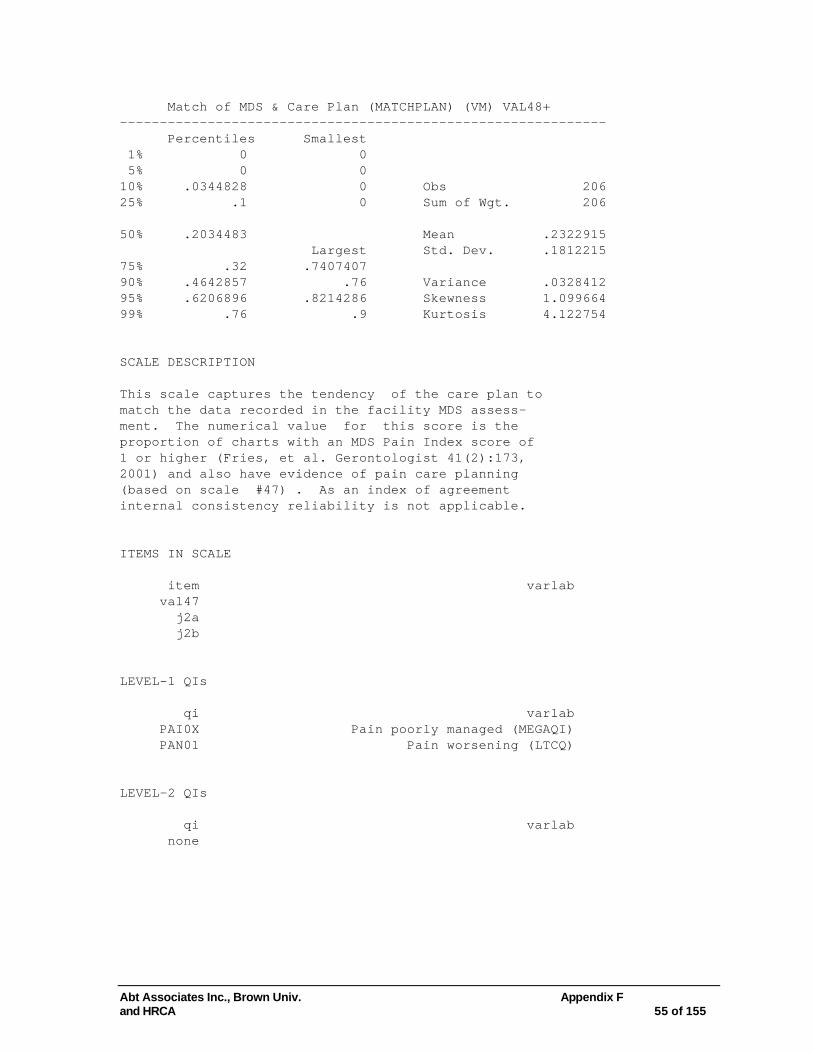
Match of MDS & Care Plan (MATCHPLAN) (VM) VAL48+ ------------------------------------------------------------- Percentiles Smallest 1% 0 0 5% 0 0 10% .0344828 0 Obs 206 25% .1 0 Sum of Wgt. 206 50% .2034483 Mean .2322915 Largest Std. Dev. .1812215 75% .32 .7407407 90% .4642857 .76 Variance .0328412 95% .6206896 .8214286 Skewness 1.099664 99% .76 .9 Kurtosis 4.122754 SCALE DESCRIPTION This scale captures the tendency of the care plan to match the data recorded in the facility MDS assess- ment. The numerical value for this score is the proportion of charts with an MDS Pain Index score of 1 or higher (Fries, et al. Gerontologist 41(2):173, 2001) and also have evidence of pain care planning (based on scale #47) . As an index of agreement internal consistency reliability is not applicable. ITEMS IN SCALE item varlab val47 j2a j2b LEVEL-1 QIs qi varlab PAI0X Pain poorly managed (MEGAQI) PAN01 Pain worsening (LTCQ) LEVEL-2 QIs qi varlab none

Abt Associates Inc., Brown Univ. Appendix F and HRCA 56 of 155
Ownership Change as1 (VM) VAL49- ------------------------------------------------------------- Percentiles Smallest 1% 0 0 5% 0 0 10% 0 0 Obs 208 25% 0 0 Sum of Wgt. 208 50% 0 Mean .1201923 Largest Std. Dev. .3259708 75% 0 1 90% 1 1 Variance .106257 95% 1 1 Skewness 2.335939 99% 1 1 Kurtosis 6.456612 SCALE DESCRIPTION This scale is based on a single item, and is a binary indicator signaling facilities that have had an ownership change in the last two years. (Internal consistency reliability not applicable). ITEMS IN SCALE item varlab as1 AS 1. ownership change last 2 years LEVEL-1 QIs qi varlab none LEVEL-2 QIs qi varlab MOB01 Mobility decline (LTCQ) ADL03 ADL imprvmnt in res. w/capacity (MEGAQI) ADL01 ADL decline (CHSRA) CAT01 Indwelling urin cath (LTCQ) CNT01 Incontinence hi & lo risk (CHSRA) CNT05 Incontinence high risk (CHSRA) CNT06 Incontinence low risk (CHSRA) BEH04 Behavior worsening (LTCQ) MOD03 Depression new or worse (LTCQ) PAN01 Pain worsening (LTCQ) PAI0X Pain poorly managed (MEGAQI)
Abt Associates Inc., Brown Univ. Appendix F and HRCA 57 of 155
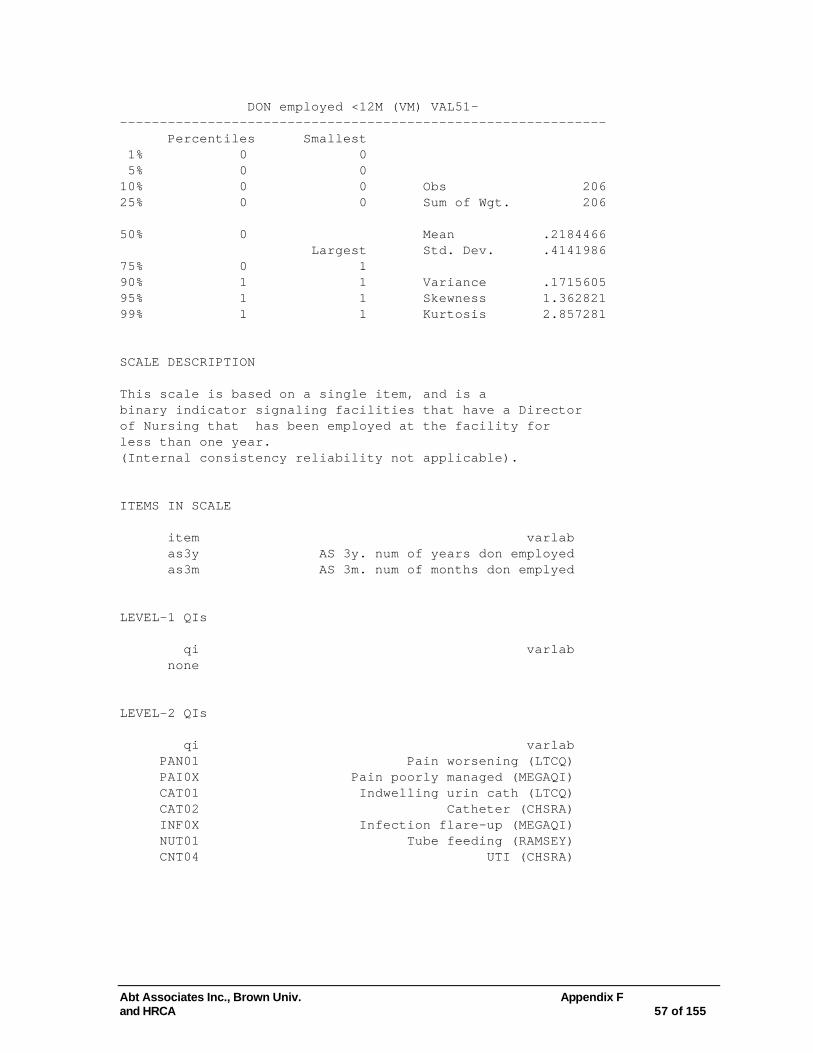
DON employed <12M (VM) VAL51- ------------------------------------------------------------- Percentiles Smallest 1% 0 0 5% 0 0 10% 0 0 Obs 206 25% 0 0 Sum of Wgt. 206 50% 0 Mean .2184466 Largest Std. Dev. .4141986 75% 0 1 90% 1 1 Variance .1715605 95% 1 1 Skewness 1.362821 99% 1 1 Kurtosis 2.857281 SCALE DESCRIPTION This scale is based on a single item, and is a binary indicator signaling facilities that have a Director of Nursing that has been employed at the facility for less than one year. (Internal consistency reliability not applicable). ITEMS IN SCALE item varlab as3y AS 3y. num of years don employed as3m AS 3m. num of months don emplyed LEVEL-1 QIs qi varlab none LEVEL-2 QIs qi varlab PAN01 Pain worsening (LTCQ) PAI0X Pain poorly managed (MEGAQI) CAT01 Indwelling urin cath (LTCQ) CAT02 Catheter (CHSRA) INF0X Infection flare-up (MEGAQI) NUT01 Tube feeding (RAMSEY) CNT04 UTI (CHSRA)

Abt Associates Inc., Brown Univ. Appendix F and HRCA 58 of 155
RN+LPN FTE/BED (VM) VAL52+ ------------------------------------------------------------- Percentiles Smallest 1% 1 1 5% 1 1 10% 2 1 Obs 202 25% 3 1 Sum of Wgt. 202 50% 5.5 Mean 5.519802 Largest Std. Dev. 2.882803 75% 8 10 90% 10 10 Variance 8.310551 95% 10 10 Skewness -.0017142 99% 10 10 Kurtosis 1.779385 SCALE DESCRIPTION This is an index of the level of staffing in the facility conditional on the average care demands of the facility's residents. The numerical value is the residual of the number of licensed staff FTE per bed regressed on the average CMI for the residents in the facility. High values imply that the facility has a higher level of staffing given case mix. (Internal consistency reliability not applicable). ITEMS IN SCALE item varlab as5aa AS 5aa. rn hours worked in pay period as5ba AS 5ba. lpn\lvn hours worked in pay period as5a AS 5a. length of pay period ass1 AS s1. how many beds CMI LEVEL-1 QIs qi varlab none LEVEL-2 QIs qi varlab PAN01 Pain worsening (LTCQ) PAI0X Pain poorly managed (MEGAQI) PRU01 PU high & low risk (CHSRA) PRU02 PU high risk (CHSRA) PRU03 PU low risk (CHSRA) PRU04 PU onset or worsening (LTCQ) INF0X Infection flare-up (MEGAQI) CNT04 UTI (CHSRA)

Abt Associates Inc., Brown Univ. Appendix F and HRCA 59 of 155
ADL01 ADL decline (CHSRA) ADL03 ADL imprvmnt in res. w/capacity (MEGAQI) WAL0X Walking performance (MEGAQI) MOB01 Mobility decline (LTCQ) Bedfast Bedfast (CHSRA)

Abt Associates Inc., Brown Univ. Appendix F and HRCA 60 of 155
5%+ RN, LPN Float, Contract (VM) VAL53- ------------------------------------------------------------- Percentiles Smallest 1% 0 0 5% 0 0 10% 0 0 Obs 201 25% 0 0 Sum of Wgt. 201 50% 0 Mean .1840796 Largest Std. Dev. .3885168 75% 0 1 90% 1 1 Variance .1509453 95% 1 1 Skewness 1.63035 99% 1 1 Kurtosis 3.658042 SCALE DESCRIPTION This scale is a binary indicator signaling facilities that use greater than 5% of their licensed staff as "floats" or contract workers as opposed to regular facility staff. Higher values imply proportionally more of the licensed caregivers are floats or contract workers. (Internal consistency reliability not applicable). ITEMS IN SCALE item varlab as5aa AS 5aa. rn hours worked in pay period as5ba AS 5ba. lpn\lvn hours worked in pay period as5ac AS 5ac. hours worked by rn floats as5bc AS 5bc. hours worked by lpn\lvn floats as5ad AS 5ad. hours worked by rn contr as5bd AS 5bd. hours worked by lpn\lvn contr LEVEL-1 QIs qi varlab none LEVEL-2 QIs qi varlab PAN01 Pain worsening (LTCQ) PAI0X Pain poorly managed (MEGAQI) BMI0X Low BMI (MEGAQI) WGT01 Weight loss (LTCQ) MOD03 Depression new or worse (LTCQ) CNT04 UTI (CHSRA) INF0X Infection flare-up (MEGAQI) PRU01 PU high & low risk (CHSRA)

Abt Associates Inc., Brown Univ. Appendix F and HRCA 61 of 155
PRU02 PU high risk (CHSRA) PRU03 PU low risk (CHSRA) PRU04 PU onset or worsening (LTCQ)
Abt Associates Inc., Brown Univ. Appendix F and HRCA 62 of 155
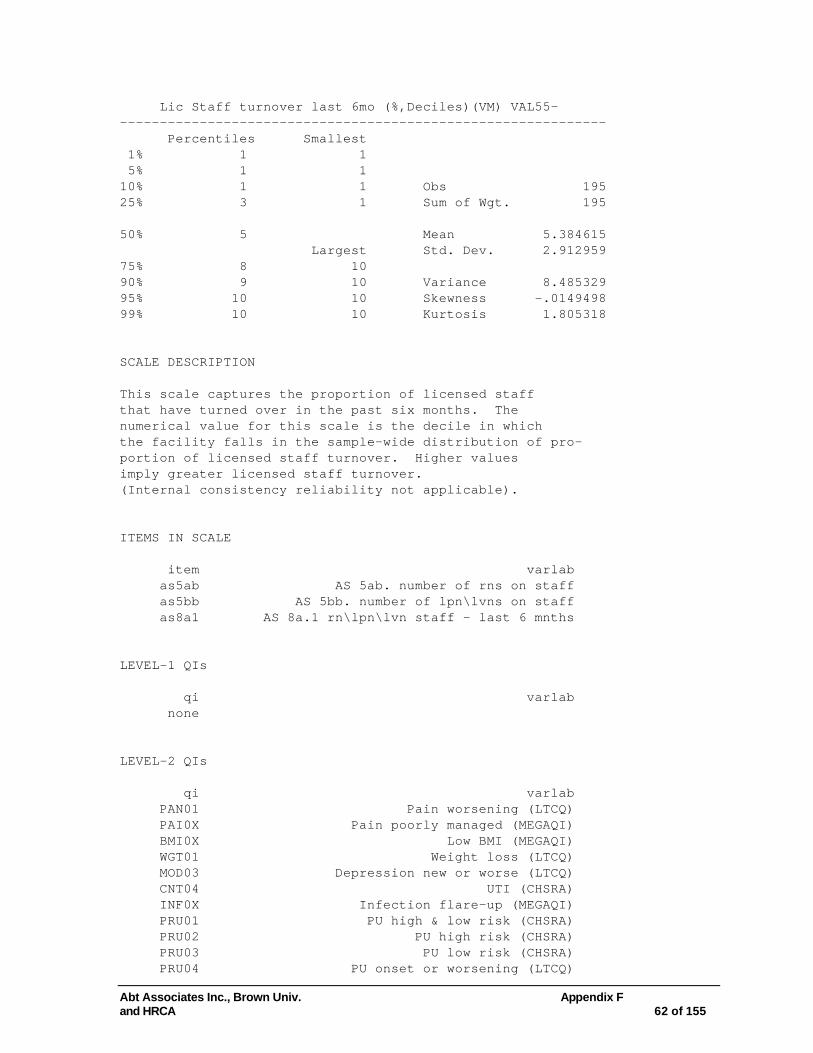
Lic Staff turnover last 6mo (%,Deciles)(VM) VAL55- ------------------------------------------------------------- Percentiles Smallest 1% 1 1 5% 1 1 10% 1 1 Obs 195 25% 3 1 Sum of Wgt. 195 50% 5 Mean 5.384615 Largest Std. Dev. 2.912959 75% 8 10 90% 9 10 Variance 8.485329 95% 10 10 Skewness -.0149498 99% 10 10 Kurtosis 1.805318 SCALE DESCRIPTION This scale captures the proportion of licensed staff that have turned over in the past six months. The numerical value for this scale is the decile in which the facility falls in the sample-wide distribution of pro- portion of licensed staff turnover. Higher values imply greater licensed staff turnover. (Internal consistency reliability not applicable). ITEMS IN SCALE item varlab as5ab AS 5ab. number of rns on staff as5bb AS 5bb. number of lpn\lvns on staff as8a1 AS 8a.1 rn\lpn\lvn staff - last 6 mnths LEVEL-1 QIs qi varlab none LEVEL-2 QIs qi varlab PAN01 Pain worsening (LTCQ) PAI0X Pain poorly managed (MEGAQI) BMI0X Low BMI (MEGAQI) WGT01 Weight loss (LTCQ) MOD03 Depression new or worse (LTCQ) CNT04 UTI (CHSRA) INF0X Infection flare-up (MEGAQI) PRU01 PU high & low risk (CHSRA) PRU02 PU high risk (CHSRA) PRU03 PU low risk (CHSRA) PRU04 PU onset or worsening (LTCQ)

Abt Associates Inc., Brown Univ. Appendix F and HRCA 63 of 155
30%+ Six Mo CNA Turnover (VM) val56- ------------------------------------------------------------- Percentiles Smallest 1% 0 0 5% 0 0 10% 0 0 Obs 159 25% 0 0 Sum of Wgt. 159 50% 1 Mean .7169811 Largest Std. Dev. .4518888 75% 1 1 90% 1 1 Variance .2042035 95% 1 1 Skewness -.963364 99% 1 1 Kurtosis 1.92807 SCALE DESCRIPTION This scale is a binary indicator signaling facilities that have had a greater than 30% turnover in CNA Staff in the past six months. (Internal consistency reliability not applicable). ITEMS IN SCALE item varlab as8b1 AS 8b.1 cna last 6 mnths as5bb AS 5bb. number of lpn\lvns on staff as5cb AS 5cb. number of na\cnas on staff LEVEL-1 QIs qi varlab CAT01 Indwelling urin cath (LTCQ) CAT02 Catheter (CHSRA) LEVEL-2 QIs qi varlab PAN01 Pain worsening (LTCQ) PAI0X Pain poorly managed (MEGAQI) WGT01 Weight loss (LTCQ) SOC02 Little or no activities (CHSRA) PRU01 PU high & low risk (CHSRA) PRU02 PU high risk (CHSRA) PRU03 PU low risk (CHSRA) PRU04 PU onset or worsening (LTCQ)

Abt Associates Inc., Brown Univ. Appendix F and HRCA 64 of 155
CNA Involved in Care Planning (VM, JT) VAL57+ ------------------------------------------------------------- Percentiles Smallest 1% 0 0 5% 0 0 10% 0 0 Obs 207 25% 1 0 Sum of Wgt. 207 50% 2 Mean 1.961353 Largest Std. Dev. 1.306613 75% 3 4 90% 4 4 Variance 1.707237 95% 4 4 Skewness .2678542 99% 4 4 Kurtosis 1.84066 SCALE DESCRIPTION This scale captures the tendency of CNA's in the facility to participate in the care planning process. The numerical value for this scale is the sum of four indi- cators of CNA participation in care planning: whether CNA's contribute to care planning, CNAs regularly attend care planning meetings, whether or not care planning meetings are scheduled into the CNA's work day, and whether care planning meetings are part of the work culture on units. The internal con- sistency relability for these items indicates that the items form a reliable scale (KR20=0.72). ITEMS IN SCALE item varlab as9f AS 9f. cnas contrib to patient care plan as10 AS 10. cna attend care planning meeting? as11a AS 11a. plan mtgs sched in cna work day as11b AS 11b. plan mtgs part of culture on units LEVEL-1 QIs qi varlab WGT01 Weight loss (LTCQ) LEVEL-2 QIs qi varlab PAN01 Pain worsening (LTCQ) PAI0X Pain poorly managed (MEGAQI) MOD03 Depression new or worse (LTCQ) COG01 Cognition worsening (LTCQ) PRU01 PU high & low risk (CHSRA) PRU02 PU high risk (CHSRA)
Abt Associates Inc., Brown Univ. Appendix F and HRCA 65 of 155
PRU03 PU low risk (CHSRA) BEH01 Behavior high & low risk (CHSRA) BEH02 Behavior high risk (CHSRA) BEH03 Behavior low risk (CHSRA)
Abt Associates Inc., Brown Univ. Appendix F and HRCA 66 of 155
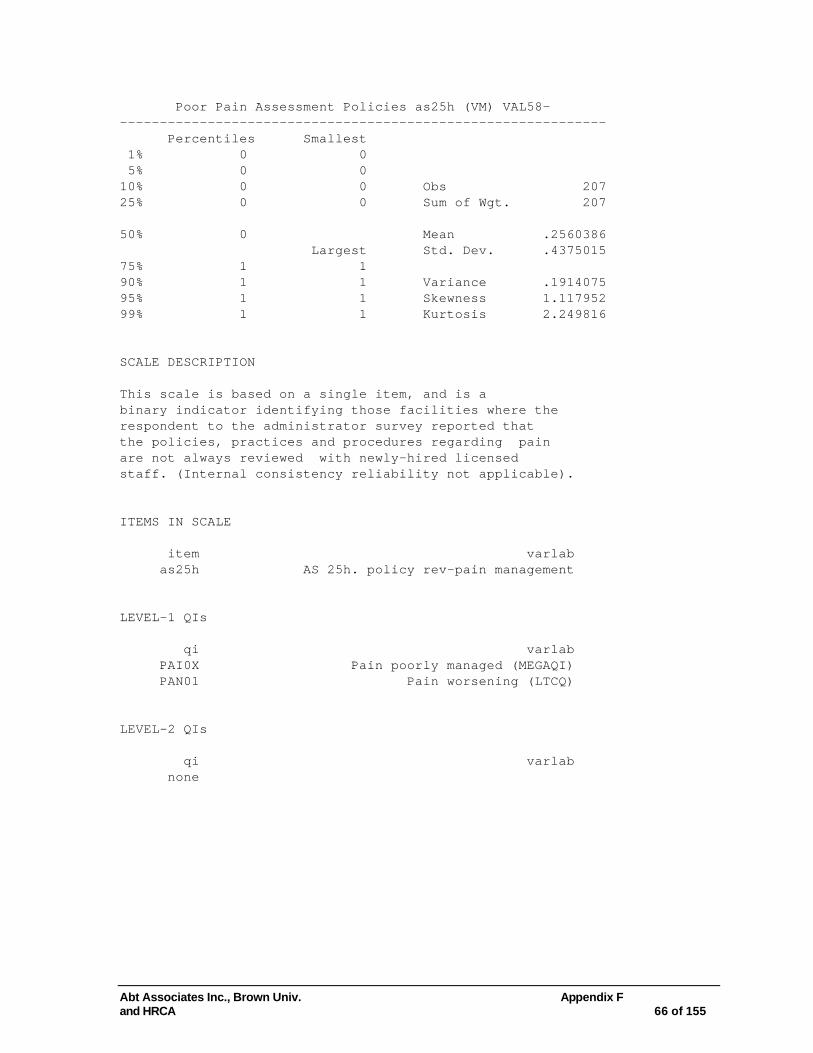
Poor Pain Assessment Policies as25h (VM) VAL58- ------------------------------------------------------------- Percentiles Smallest 1% 0 0 5% 0 0 10% 0 0 Obs 207 25% 0 0 Sum of Wgt. 207 50% 0 Mean .2560386 Largest Std. Dev. .4375015 75% 1 1 90% 1 1 Variance .1914075 95% 1 1 Skewness 1.117952 99% 1 1 Kurtosis 2.249816 SCALE DESCRIPTION This scale is based on a single item, and is a binary indicator identifying those facilities where the respondent to the administrator survey reported that the policies, practices and procedures regarding pain are not always reviewed with newly-hired licensed staff. (Internal consistency reliability not applicable). ITEMS IN SCALE item varlab as25h AS 25h. policy rev-pain management LEVEL-1 QIs qi varlab PAI0X Pain poorly managed (MEGAQI) PAN01 Pain worsening (LTCQ) LEVEL-2 QIs qi varlab none

Abt Associates Inc., Brown Univ. Appendix F and HRCA 67 of 155
Poor Pain Edcuation as26da+b (VM) VAL59- ------------------------------------------------------------- Percentiles Smallest 1% 0 0 5% 0 0 10% 0 0 Obs 208 25% 0 0 Sum of Wgt. 208 50% 0 Mean .5096154 Largest Std. Dev. .7420456 75% 1 2 90% 2 2 Variance .5506317 95% 2 2 Skewness 1.069173 99% 2 2 Kurtosis 2.633172 SCALE DESCRIPTION This additive scale identifies facilities with increas- ingly poor educational practices regarding pain. The scale value is initialized at "2", and is a "1" if training regarding pain management in the cognitively impaired is offered to licensed staff or CNAs, and a "0" if offered to both licensed staff and CNA's. (KR20=0.65). ITEMS IN SCALE item varlab as26da AS 26da. rev prog-pain manage-cna as26db AS 26db. rev prog-pain manage-rn,lpn\lvn? LEVEL-1 QIs qi varlab PAI0X Pain poorly managed (MEGAQI) PAN01 Pain worsening (LTCQ) LEVEL-2 QIs qi varlab none
Abt Associates Inc., Brown Univ. Appendix F and HRCA 68 of 155
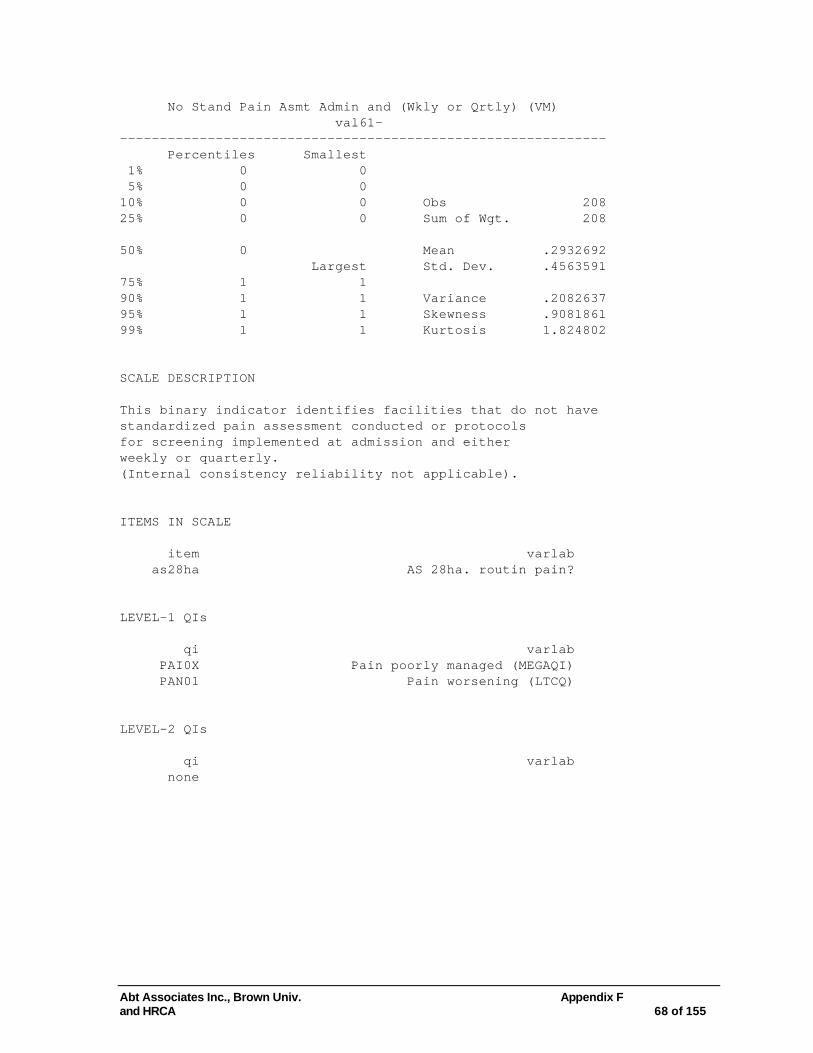
No Stand Pain Asmt Admin and (Wkly or Qrtly) (VM) val61- ------------------------------------------------------------- Percentiles Smallest 1% 0 0 5% 0 0 10% 0 0 Obs 208 25% 0 0 Sum of Wgt. 208 50% 0 Mean .2932692 Largest Std. Dev. .4563591 75% 1 1 90% 1 1 Variance .2082637 95% 1 1 Skewness .9081861 99% 1 1 Kurtosis 1.824802 SCALE DESCRIPTION This binary indicator identifies facilities that do not have standardized pain assessment conducted or protocols for screening implemented at admission and either weekly or quarterly. (Internal consistency reliability not applicable). ITEMS IN SCALE item varlab as28ha AS 28ha. routin pain? LEVEL-1 QIs qi varlab PAI0X Pain poorly managed (MEGAQI) PAN01 Pain worsening (LTCQ) LEVEL-2 QIs qi varlab none
Abt Associates Inc., Brown Univ. Appendix F and HRCA 69 of 155
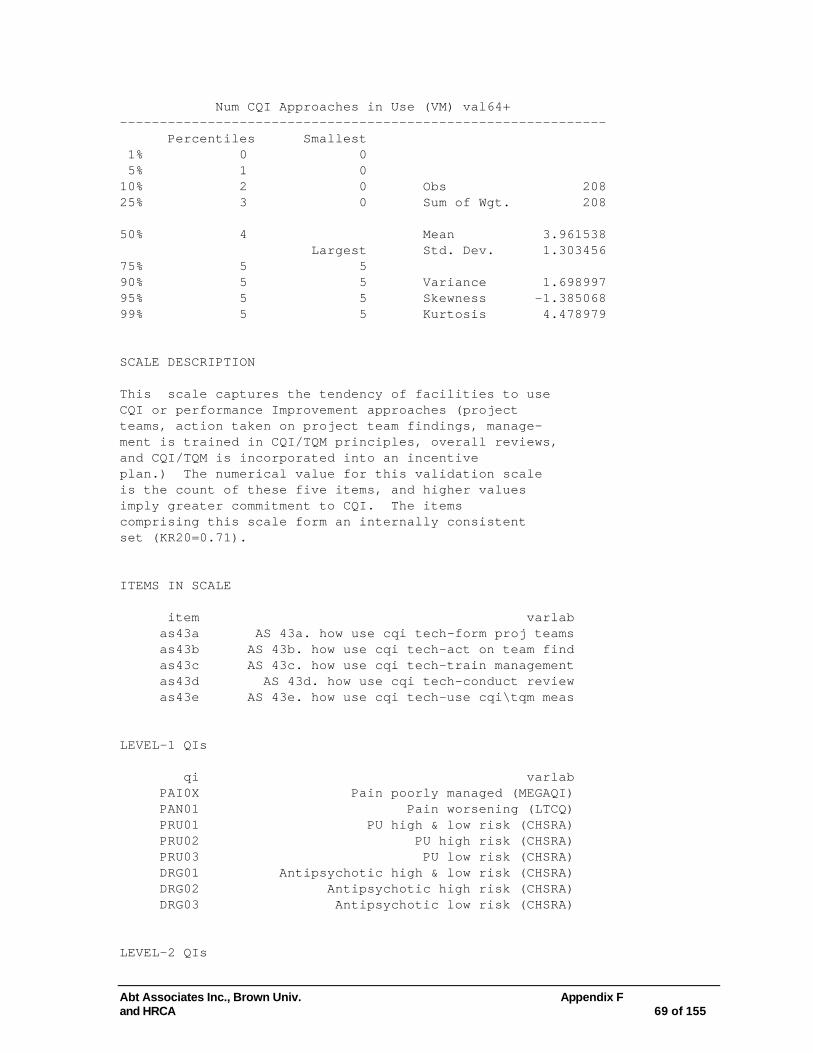
Num CQI Approaches in Use (VM) val64+ ------------------------------------------------------------- Percentiles Smallest 1% 0 0 5% 1 0 10% 2 0 Obs 208 25% 3 0 Sum of Wgt. 208 50% 4 Mean 3.961538 Largest Std. Dev. 1.303456 75% 5 5 90% 5 5 Variance 1.698997 95% 5 5 Skewness -1.385068 99% 5 5 Kurtosis 4.478979 SCALE DESCRIPTION This scale captures the tendency of facilities to use CQI or performance Improvement approaches (project teams, action taken on project team findings, manage- ment is trained in CQI/TQM principles, overall reviews, and CQI/TQM is incorporated into an incentive plan.) The numerical value for this validation scale is the count of these five items, and higher values imply greater commitment to CQI. The items comprising this scale form an internally consistent set (KR20=0.71). ITEMS IN SCALE item varlab as43a AS 43a. how use cqi tech-form proj teams as43b AS 43b. how use cqi tech-act on team find as43c AS 43c. how use cqi tech-train management as43d AS 43d. how use cqi tech-conduct review as43e AS 43e. how use cqi tech-use cqi\tqm meas LEVEL-1 QIs qi varlab PAI0X Pain poorly managed (MEGAQI) PAN01 Pain worsening (LTCQ) PRU01 PU high & low risk (CHSRA) PRU02 PU high risk (CHSRA) PRU03 PU low risk (CHSRA) DRG01 Antipsychotic high & low risk (CHSRA) DRG02 Antipsychotic high risk (CHSRA) DRG03 Antipsychotic low risk (CHSRA) LEVEL-2 QIs

Abt Associates Inc., Brown Univ. Appendix F and HRCA 70 of 155
qi varlab INF0X Infection flare-up (MEGAQI) CNT04 UTI (CHSRA) CNT01 Incontinence hi & lo risk (CHSRA) CNT05 Incontinence high risk (CHSRA) CNT06 Incontinence low risk (CHSRA) CNT02 Bowel incont decline (LTCQ) CNT03 Bladder incont decline (LTCQ) RES01 Restraints (CHSRA)
Abt Associates Inc., Brown Univ. Appendix F and HRCA 71 of 155
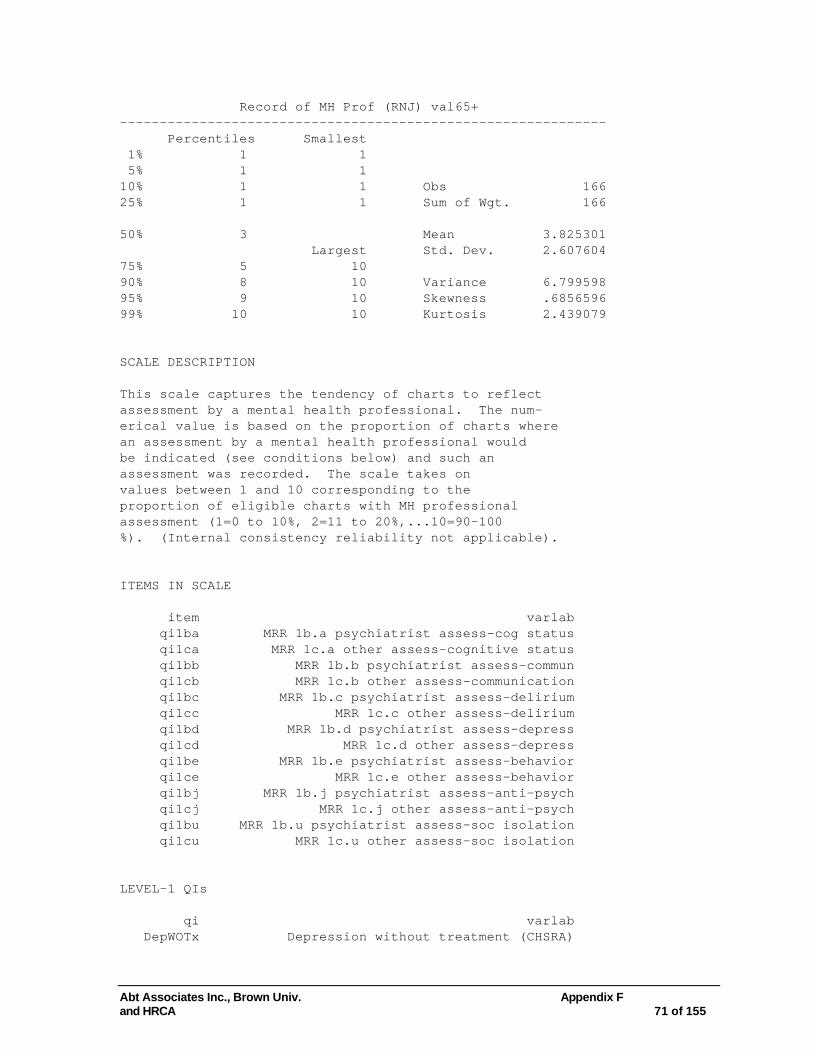
Record of MH Prof (RNJ) val65+ ------------------------------------------------------------- Percentiles Smallest 1% 1 1 5% 1 1 10% 1 1 Obs 166 25% 1 1 Sum of Wgt. 166 50% 3 Mean 3.825301 Largest Std. Dev. 2.607604 75% 5 10 90% 8 10 Variance 6.799598 95% 9 10 Skewness .6856596 99% 10 10 Kurtosis 2.439079 SCALE DESCRIPTION This scale captures the tendency of charts to reflect assessment by a mental health professional. The num- erical value is based on the proportion of charts where an assessment by a mental health professional would be indicated (see conditions below) and such an assessment was recorded. The scale takes on values between 1 and 10 corresponding to the proportion of eligible charts with MH professional assessment (1=0 to 10%, 2=11 to 20%,...10=90-100 %). (Internal consistency reliability not applicable). ITEMS IN SCALE item varlab qi1ba MRR 1b.a psychiatrist assess-cog status qi1ca MRR 1c.a other assess-cognitive status qi1bb MRR 1b.b psychiatrist assess-commun qi1cb MRR 1c.b other assess-communication qi1bc MRR 1b.c psychiatrist assess-delirium qi1cc MRR 1c.c other assess-delirium qi1bd MRR 1b.d psychiatrist assess-depress qi1cd MRR 1c.d other assess-depress qi1be MRR 1b.e psychiatrist assess-behavior qi1ce MRR 1c.e other assess-behavior qi1bj MRR 1b.j psychiatrist assess-anti-psych qi1cj MRR 1c.j other assess-anti-psych qi1bu MRR 1b.u psychiatrist assess-soc isolation qi1cu MRR 1c.u other assess-soc isolation LEVEL-1 QIs qi varlab DepWOTx Depression without treatment (CHSRA)

Abt Associates Inc., Brown Univ. Appendix F and HRCA 72 of 155
LEVEL-2 QIs qi varlab MOD03 Depression new or worse (LTCQ) BEH01 Behavior high & low risk (CHSRA) BEH02 Behavior high risk (CHSRA) BEH03 Behavior low risk (CHSRA) BEH04 Behavior worsening (LTCQ) DEL0X Delirium not remitting (MEGAQI)

Abt Associates Inc., Brown Univ. Appendix F and HRCA 73 of 155
Presence of MH prof (RNJ) VAL66+ ------------------------------------------------------------- Percentiles Smallest 1% 0 0 5% 0 0 10% 0 0 Obs 208 25% 0 0 Sum of Wgt. 208 50% 0 Mean .7259615 Largest Std. Dev. 1.010524 75% 1 4 90% 2 4 Variance 1.021158 95% 3 4 Skewness 1.440982 99% 4 4 Kurtosis 4.465093 SCALE DESCRIPTION This scale is an additive scale reflecting data collected in the administrator survey capturing reports of the presence of mental health professionals. Scale values range between 0 and 4 and reflect the count of whether or not psychiatrists, psychologists, geriatric nurse specialists, or psychiatric/clinical social workers are available in the facility. These four items form a moderately internally consistent set (KR20=0.64). ITEMS IN SCALE item varlab as13aa AS 13aa. psychiatrist available as13ba AS 13ba. psychologist available as13ca AS 13ca. ger nurse spec available as13da AS 13da. psych soc worker available LEVEL-1 QIs qi varlab DEL0X Delirium not remitting (MEGAQI) BEH04 Behavior worsening (LTCQ) DepWOTx Depression without treatment (CHSRA) LEVEL-2 QIs qi varlab MOD03 Depression new or worse (LTCQ) BEH01 Behavior high & low risk (CHSRA) BEH02 Behavior high risk (CHSRA) BEH03 Behavior low risk (CHSRA)
Abt Associates Inc., Brown Univ. Appendix F and HRCA 74 of 155
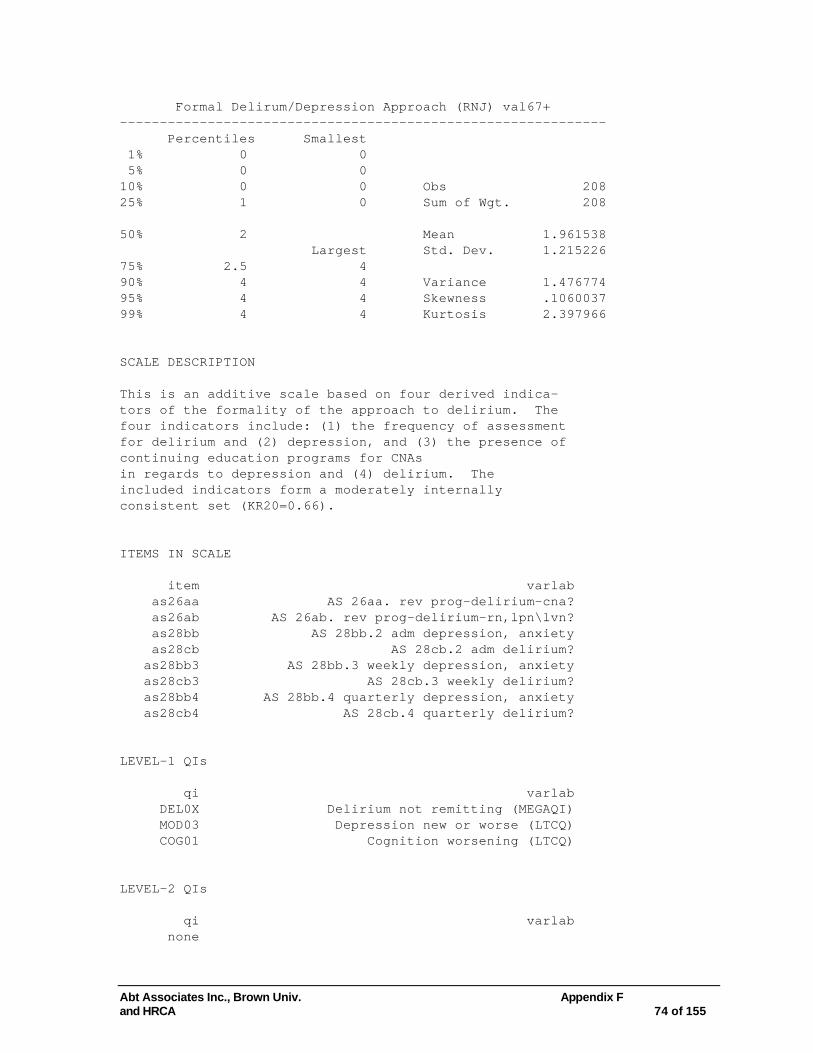
Formal Delirum/Depression Approach (RNJ) val67+ ------------------------------------------------------------- Percentiles Smallest 1% 0 0 5% 0 0 10% 0 0 Obs 208 25% 1 0 Sum of Wgt. 208 50% 2 Mean 1.961538 Largest Std. Dev. 1.215226 75% 2.5 4 90% 4 4 Variance 1.476774 95% 4 4 Skewness .1060037 99% 4 4 Kurtosis 2.397966 SCALE DESCRIPTION This is an additive scale based on four derived indica- tors of the formality of the approach to delirium. The four indicators include: (1) the frequency of assessment for delirium and (2) depression, and (3) the presence of continuing education programs for CNAs in regards to depression and (4) delirium. The included indicators form a moderately internally consistent set (KR20=0.66). ITEMS IN SCALE item varlab as26aa AS 26aa. rev prog-delirium-cna? as26ab AS 26ab. rev prog-delirium-rn,lpn\lvn? as28bb AS 28bb.2 adm depression, anxiety as28cb AS 28cb.2 adm delirium? as28bb3 AS 28bb.3 weekly depression, anxiety as28cb3 AS 28cb.3 weekly delirium? as28bb4 AS 28bb.4 quarterly depression, anxiety as28cb4 AS 28cb.4 quarterly delirium? LEVEL-1 QIs qi varlab DEL0X Delirium not remitting (MEGAQI) MOD03 Depression new or worse (LTCQ) COG01 Cognition worsening (LTCQ) LEVEL-2 QIs qi varlab none

Abt Associates Inc., Brown Univ. Appendix F and HRCA 75 of 155
Personalized Rooms (RNJ) val70+ ------------------------------------------------------------- Percentiles Smallest 1% 1 1 5% 1 1 10% 1 1 Obs 208 25% 2 1 Sum of Wgt. 208 50% 3 Mean 3.004808 Largest Std. Dev. 1.338748 75% 4 5 90% 5 5 Variance 1.792247 95% 5 5 Skewness -.2267545 99% 5 5 Kurtosis 1.833271 SCALE DESCRIPTION This scale captures the extent that observers conducting the walk-through assessment in the morn- ing, mealtime and evening find the rooms to be person- alized. The numerical score is the factor score rep- resenting the shared variance for the three times of observation. Higher scores indicate greater number of rooms felt to be personalized by the observers. The items form an internally consistent set (alpha=0.96). ITEMS IN SCALE item varlab wam1 WT 1. rooms personalized wml1 WT 1. rooms personalized wpm1 WT 1. rooms personalized LEVEL-1 QIs qi varlab none LEVEL-2 QIs qi varlab SOC02 Little or no activities (CHSRA) MOD03 Depression new or worse (LTCQ) DEL0X Delirium not remitting (MEGAQI)
Abt Associates Inc., Brown Univ. Appendix F and HRCA 76 of 155
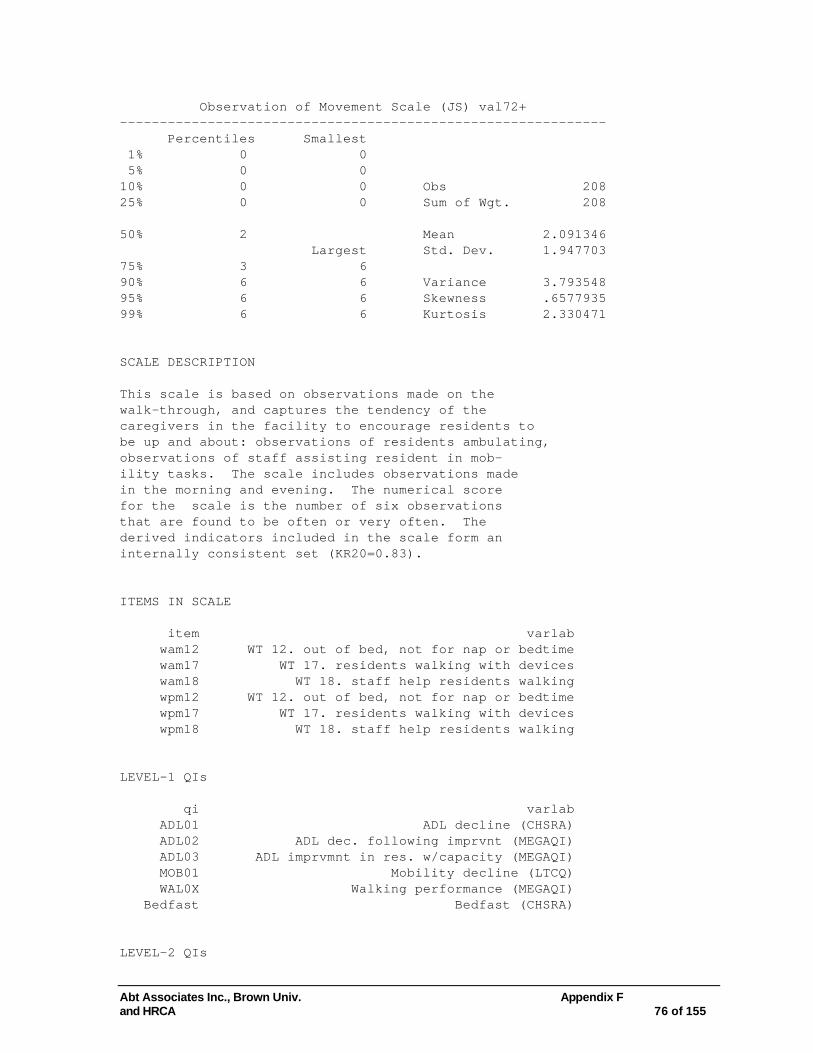
Observation of Movement Scale (JS) val72+ ------------------------------------------------------------- Percentiles Smallest 1% 0 0 5% 0 0 10% 0 0 Obs 208 25% 0 0 Sum of Wgt. 208 50% 2 Mean 2.091346 Largest Std. Dev. 1.947703 75% 3 6 90% 6 6 Variance 3.793548 95% 6 6 Skewness .6577935 99% 6 6 Kurtosis 2.330471 SCALE DESCRIPTION This scale is based on observations made on the walk-through, and captures the tendency of the caregivers in the facility to encourage residents to be up and about: observations of residents ambulating, observations of staff assisting resident in mob- ility tasks. The scale includes observations made in the morning and evening. The numerical score for the scale is the number of six observations that are found to be often or very often. The derived indicators included in the scale form an internally consistent set (KR20=0.83). ITEMS IN SCALE item varlab wam12 WT 12. out of bed, not for nap or bedtime wam17 WT 17. residents walking with devices wam18 WT 18. staff help residents walking wpm12 WT 12. out of bed, not for nap or bedtime wpm17 WT 17. residents walking with devices wpm18 WT 18. staff help residents walking LEVEL-1 QIs qi varlab ADL01 ADL decline (CHSRA) ADL02 ADL dec. following imprvnt (MEGAQI) ADL03 ADL imprvmnt in res. w/capacity (MEGAQI) MOB01 Mobility decline (LTCQ) WAL0X Walking performance (MEGAQI) Bedfast Bedfast (CHSRA) LEVEL-2 QIs
Abt Associates Inc., Brown Univ. Appendix F and HRCA 77 of 155
qi varlab none

Abt Associates Inc., Brown Univ. Appendix F and HRCA 78 of 155
Focus on Catheter (JNM) VAL74+ ------------------------------------------------------------- Percentiles Smallest 1% 0 0 5% 1 0 10% 2 0 Obs 208 25% 5 1 Sum of Wgt. 208 50% 7 Mean 6.971154 Largest Std. Dev. 3.409157 75% 9 14 90% 12 14 Variance 11.62235 95% 12 16 Skewness .1596413 99% 14 17 Kurtosis 2.601246 SCALE DESCRIPTION This scale captures the tendency of caregivers in the facility to attend to care practices and goals regarding bladder continence. See list of included items for full coverage. Medical record review items are convert- ted to facility level binary indicators of the chart- level distribution is in the top 30th percentile. The numerical value for this scale is the additive sum of 18 indicators of high quality bladder continence care. The included items form an internally consis tent set (KR20=0.71). ITEMS IN SCALE item varlab qi1p MRR 1.p record of assess-bladder contin qi4p MRR 4.p on care plan-bladder continence qi4ap MRR 4a.o recent update-bladder contin qi4bp MRR 4b.p goals for improv-bladder contin qi4cp MRR 4c.p goals for prevent-bladder contin qi4dp MRR 4d.p nurse interven-bladder contin qi4o MRR 4.o on care plan-urinary catheter qi4ao MRR 4a.o recent update-urinsry catheter qi4bo MRR 4b.o goals for improve-urinary cath qi4co MRR 4c.o goals for prevent-urinary cath qi4do MRR 4d.o nurse interven-urinary catheter as14fb AS 14fb. num resid in bladder training as26ea AS 26ea. rev prog-incontin prev-cna? as26eb AS 26eb. rev prog-incont prev-rn,lpn\lvn? as37ag AS 37ag. what cqi projs-urinary incont? as25g AS 25g. policy rev-use of catheters as39d AS 39d. which incl in cqi-urinary catheter as39g AS 39g. which incl in cqi-bladder incontin LEVEL-1 QIs

Abt Associates Inc., Brown Univ. Appendix F and HRCA 79 of 155
qi varlab CAT01 Indwelling urin cath (LTCQ) CAT02 Catheter (CHSRA) CNT03 Bladder incont decline (LTCQ) LEVEL-2 QIs qi varlab CNT01 Incontinence hi & lo risk (CHSRA) CNT05 Incontinence high risk (CHSRA) CNT06 Incontinence low risk (CHSRA)

Abt Associates Inc., Brown Univ. Appendix F and HRCA 80 of 155
Physical Restraints (JA) VAL75+ ------------------------------------------------------------- Percentiles Smallest 1% -1.234876 -1.427581 5% -.7024661 -1.253605 10% -.5750239 -1.234876 Obs 208 25% -.3197159 -1.16289 Sum of Wgt. 208 50% -.0073641 Mean -.0049683 Largest Std. Dev. .4754297 75% .3187663 .8699543 90% .6872487 .880581 Variance .2260334 95% .7893812 .9575474 Skewness -.1554418 99% .880581 1.11575 Kurtosis 2.88632 SCALE DESCRIPTION This scale captures the tendency of caregivers in the facility to attend to care practices and goals regarding the use of restraints. See list of included items for full coverage. Medical record review items are convert- ted to facility level binary indicators of the chart- level distribution is in the top 30th percentile. The numerical value for this scale is factor score under- lying the covariance of the 16 included indicators of judicious physical restraint training and policies. The items included form an internally consistent set (alpha=0.76). ITEMS IN SCALE item varlab as21b AS 21b. r\r progs-passive rantge of motion as25f AS 25f. policy rev-use of restraints as26ja AS 26ja. rev prog-restraints-cna? as26jb AS 26jb. rev prog-restraints-rn,lpn\lvn? as33 AS 33. facility has falls committee? as33c AS 33c. falls review after every fall? as37ae AS 37ae. what cqi projs-restraints? wam20 WT 20. residents with safety devices qi1l MRR 1.l record of assess-restraints qi2l MRR 2.l doc problem-restraints qi3l MRR 3.l new problem-restraints qi4l MRR 4.l on care plan-delirium qi4bl MRR 4b.l goals for improve-restraints qi4cl MRR 4c.l goals for prevent-restraints qi4dl MRR 4d.l nurse interven-restraints as28ka AS 28ka. routin restraints? as28kb AS 28kb.2 adm restraints as28kb3 AS 28kb.3 weekly restraints as28kb4 AS 28kb.4 quarterly restraints as28kb5 AS 28kb.5 annually restraints as28kb6 AS 28kb.6 other restraints

Abt Associates Inc., Brown Univ. Appendix F and HRCA 81 of 155
LEVEL-1 QIs qi varlab RES01 Restraints (CHSRA) LEVEL-2 QIs qi varlab none

Abt Associates Inc., Brown Univ. Appendix F and HRCA 82 of 155
Observed PU, Burns Tx & Prevention (JA) VAL77+ ------------------------------------------------------------- Percentiles Smallest 1% 1 1 5% 1 1 10% 1.2 1 Obs 208 25% 1.6 1 Sum of Wgt. 208 50% 2.2 Mean 2.196154 Largest Std. Dev. .8237915 75% 2.8 4 90% 3.4 4 Variance .6786325 95% 3.8 4.2 Skewness .4170715 99% 4 4.2 Kurtosis 2.338349 SCALE DESCRIPTION This scale captures the tendency of facilities to engage in activities consistent with good preventive actions for skin care. The numerical value for this scale is the factor score underlying the covariation of five markers of good preventive skin care: observations of residents with safety devices, observation of nurses repositioning, observation of repositioning devices, and observations of pressure relieving devices, and observation of 'bone-on' pressure relieving devices. The included items form an internally consistent set (alpha=0.88). ITEMS IN SCALE item varlab wam20 WT 20. residents with safety devices wam21 WT 21. nurses turn and reposition res wam22 WT 22. observe repositioning devices wam23 WT 23. pressure reducing devices on bed wam24 WT 24. pressure reducing devices bone on LEVEL-1 QIs qi varlab PRU01 PU high & low risk (CHSRA) PRU02 PU high risk (CHSRA) PRU03 PU low risk (CHSRA) PRU04 PU onset or worsening (LTCQ) BUR0X Burns abrasions bruises (MEGAQI) LEVEL-2 QIs qi varlab RES01 Restraints (CHSRA)
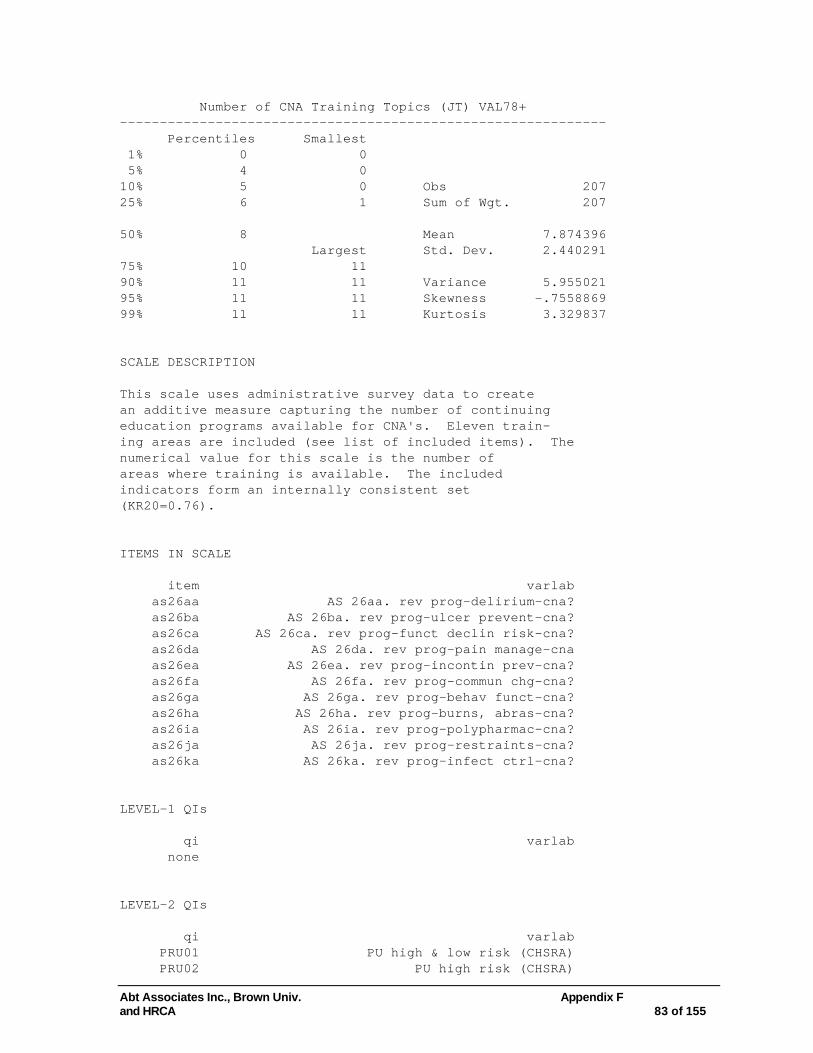
Abt Associates Inc., Brown Univ. Appendix F and HRCA 83 of 155
Number of CNA Training Topics (JT) VAL78+ ------------------------------------------------------------- Percentiles Smallest 1% 0 0 5% 4 0 10% 5 0 Obs 207 25% 6 1 Sum of Wgt. 207 50% 8 Mean 7.874396 Largest Std. Dev. 2.440291 75% 10 11 90% 11 11 Variance 5.955021 95% 11 11 Skewness -.7558869 99% 11 11 Kurtosis 3.329837 SCALE DESCRIPTION This scale uses administrative survey data to create an additive measure capturing the number of continuing education programs available for CNA's. Eleven train- ing areas are included (see list of included items). The numerical value for this scale is the number of areas where training is available. The included indicators form an internally consistent set (KR20=0.76). ITEMS IN SCALE item varlab as26aa AS 26aa. rev prog-delirium-cna? as26ba AS 26ba. rev prog-ulcer prevent-cna? as26ca AS 26ca. rev prog-funct declin risk-cna? as26da AS 26da. rev prog-pain manage-cna as26ea AS 26ea. rev prog-incontin prev-cna? as26fa AS 26fa. rev prog-commun chg-cna? as26ga AS 26ga. rev prog-behav funct-cna? as26ha AS 26ha. rev prog-burns, abras-cna? as26ia AS 26ia. rev prog-polypharmac-cna? as26ja AS 26ja. rev prog-restraints-cna? as26ka AS 26ka. rev prog-infect ctrl-cna? LEVEL-1 QIs qi varlab none LEVEL-2 QIs qi varlab PRU01 PU high & low risk (CHSRA) PRU02 PU high risk (CHSRA)

Abt Associates Inc., Brown Univ. Appendix F and HRCA 84 of 155
PRU03 PU low risk (CHSRA) PRU04 PU onset or worsening (LTCQ) INF0X Infection flare-up (MEGAQI) PAN01 Pain worsening (LTCQ) PAI0X Pain poorly managed (MEGAQI)

Abt Associates Inc., Brown Univ. Appendix F and HRCA 85 of 155
Nutrition CQI (JT) VAL79+ ------------------------------------------------------------- Percentiles Smallest 1% 0 0 5% 0 0 10% 0 0 Obs 201 25% 1 0 Sum of Wgt. 201 50% 1 Mean .7960199 Largest Std. Dev. .4039605 75% 1 1 90% 1 1 Variance .1631841 95% 1 1 Skewness -1.469248 99% 1 1 Kurtosis 3.158689 SCALE DESCRIPTION This validation element is based on a single item, and is a binary indicator that identifies facilities that have a nutrition CQI or Performance Improvement project. (Internal consistency reliability not applicable). ITEMS IN SCALE item varlab as37ab AS 37ab. what cqi projs-nutrition? LEVEL-1 QIs qi varlab WGT01 Weight loss (LTCQ) BMI0X Low BMI (MEGAQI) LEVEL-2 QIs qi varlab NUT01 Tube feeding (RAMSEY)

Abt Associates Inc., Brown Univ. Appendix F and HRCA 86 of 155
Frequency of Comprehensive Assessments (JT) VAL80+ ------------------------------------------------------------- Percentiles Smallest 1% 0 0 5% 0 0 10% 0 0 Obs 208 25% 2 0 Sum of Wgt. 208 50% 5 Mean 6.201923 Largest Std. Dev. 5.18802 75% 10 17 90% 15 17 Variance 26.91555 95% 16 18 Skewness .6223987 99% 17 19 Kurtosis 2.226198 SCALE DESCRIPTION This validation scale captures frequency of assessments by a physician in 21 care areas using medical record review items. The facility level score on this validation scale is the count of twenty one areas where the facility ranks in the top 30th percentile in terms of the number of 20 charts reviewed that had an assess- ment by a physician noted. Higher values mean more care areas where a large proportion of resi- dents receive physician assessments. The included items form an internally consistent set (KR20=0.88). ITEMS IN SCALE item varlab qi1a MRR 1.a record of assess-cognit status qi1b MRR 1.b record of assess-communication qi1c MRR 1.c record of assess-delirium qi1d MRR 1.d record of assess-depression qi1e MRR 1.e record of assess-behav problems qi1f MRR 1.f record of assess-adl improvement qi1g MRR 1.g record of assess-adl decline qi1h MRR 1.h record of assess-mobility\walking qi1i MRR 1.i record of assess-falls qi1j MRR 1.j record of assess-drugs qi1k MRR 1.k record of assess-pain qi1l MRR 1.l record of assess-restraints qi1m MRR 1.m record of assess-feed tube qi1n MRR 1.n record of assess-undernutr qi1o MRR 1.o record of assess-indwell cath qi1p MRR 1.p record of assess-bladder contin qi1q MRR 1.q record of assess-bowel contin qi1r MRR 1.r record of assess-infectiond qi1s MRR 1.s record of assess-pressure ulcers qi1t MRR 1.t record of assess-burns, abrasions qi1u MRR 1.u record of assess-soc isolation
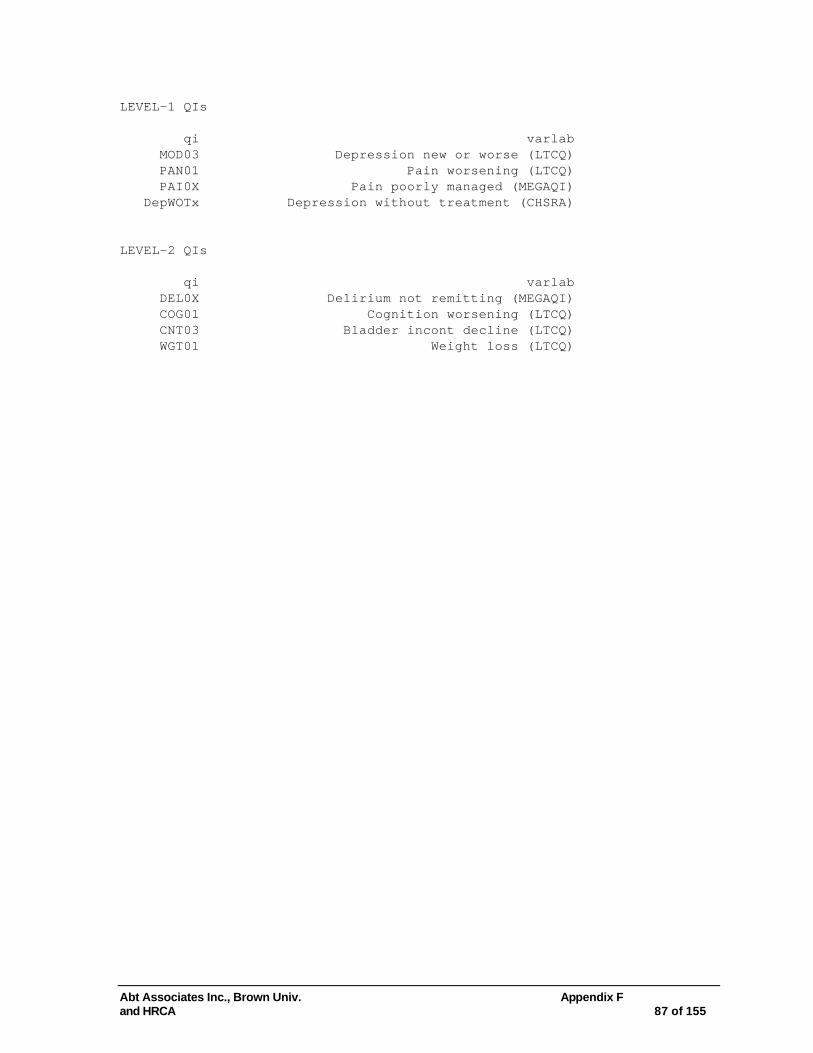
Abt Associates Inc., Brown Univ. Appendix F and HRCA 87 of 155
LEVEL-1 QIs qi varlab MOD03 Depression new or worse (LTCQ) PAN01 Pain worsening (LTCQ) PAI0X Pain poorly managed (MEGAQI) DepWOTx Depression without treatment (CHSRA) LEVEL-2 QIs qi varlab DEL0X Delirium not remitting (MEGAQI) COG01 Cognition worsening (LTCQ) CNT03 Bladder incont decline (LTCQ) WGT01 Weight loss (LTCQ)

Abt Associates Inc., Brown Univ. Appendix F and HRCA 88 of 155
% Res w/Tx Plans for Weight Loss (JT) VAL81+ ------------------------------------------------------------- Percentiles Smallest 1% 0 0 5% 0 0 10% 0 0 Obs 208 25% .033908 0 Sum of Wgt. 208 50% .070197 Mean .0864734 Largest Std. Dev. .0743268 75% .1371473 .2857143 90% .1851852 .2857143 Variance .0055245 95% .2222222 .3 Skewness .9032617 99% .2857143 .3666667 Kurtosis 3.567228 SCALE DESCRIPTION This scale captures the tendency of residents in the facility to have treatment plans for weight loss in place. The data are based on the medical record review, and the numerical value corresponds to the proportion of charts reviewed that the resident has a treat- ment plan for weight loss in place. Scale values range from 0 to 0.41 and reflect the actual propor- tion of charts reviewed where a treatment plan for weight loss is in place. (Internal consistency reliability not applicable). ITEMS IN SCALE item varlab qi3en MRR 3e.n current treatment-undernutrition LEVEL-1 QIs qi varlab WGT01 Weight loss (LTCQ) BMI0X Low BMI (MEGAQI) LEVEL-2 QIs qi varlab PRU01 PU high & low risk (CHSRA) PRU02 PU high risk (CHSRA) PRU03 PU low risk (CHSRA) PRU04 PU onset or worsening (LTCQ)
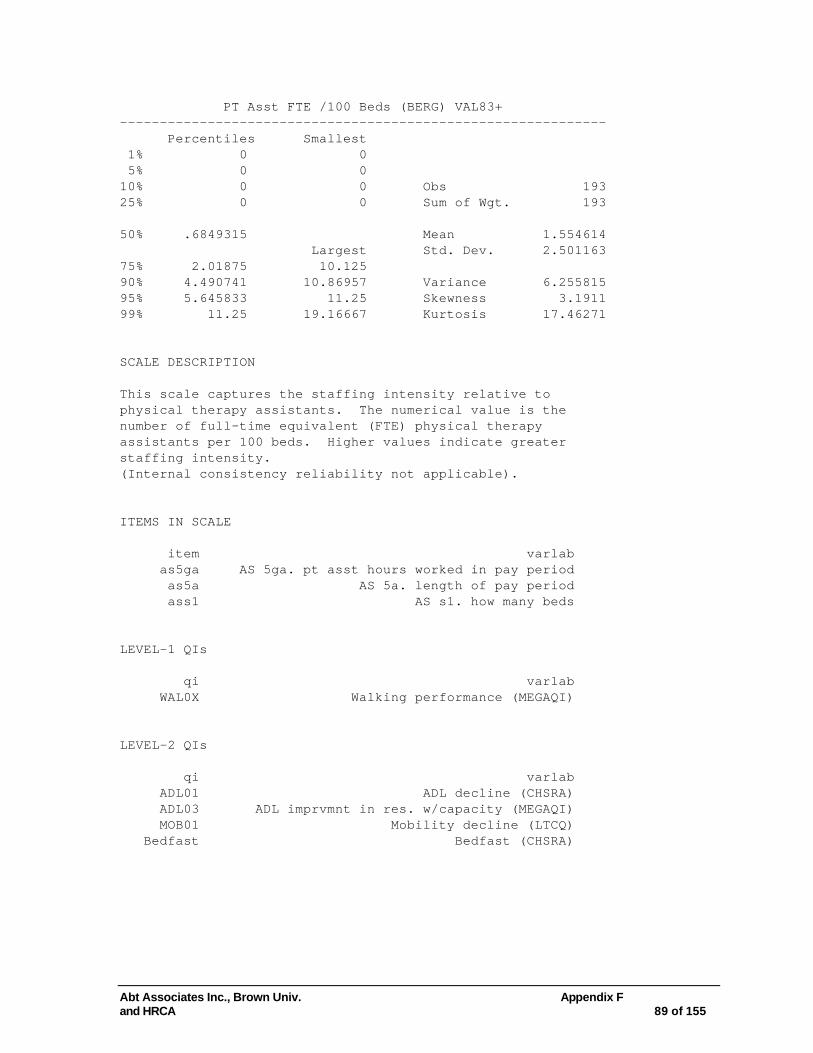
Abt Associates Inc., Brown Univ. Appendix F and HRCA 89 of 155
PT Asst FTE /100 Beds (BERG) VAL83+ ------------------------------------------------------------- Percentiles Smallest 1% 0 0 5% 0 0 10% 0 0 Obs 193 25% 0 0 Sum of Wgt. 193 50% .6849315 Mean 1.554614 Largest Std. Dev. 2.501163 75% 2.01875 10.125 90% 4.490741 10.86957 Variance 6.255815 95% 5.645833 11.25 Skewness 3.1911 99% 11.25 19.16667 Kurtosis 17.46271 SCALE DESCRIPTION This scale captures the staffing intensity relative to physical therapy assistants. The numerical value is the number of full-time equivalent (FTE) physical therapy assistants per 100 beds. Higher values indicate greater staffing intensity. (Internal consistency reliability not applicable). ITEMS IN SCALE item varlab as5ga AS 5ga. pt asst hours worked in pay period as5a AS 5a. length of pay period ass1 AS s1. how many beds LEVEL-1 QIs qi varlab WAL0X Walking performance (MEGAQI) LEVEL-2 QIs qi varlab ADL01 ADL decline (CHSRA) ADL03 ADL imprvmnt in res. w/capacity (MEGAQI) MOB01 Mobility decline (LTCQ) Bedfast Bedfast (CHSRA)

Abt Associates Inc., Brown Univ. Appendix F and HRCA 90 of 155
OT & OT Asst FTE /100 Beds (BERG) VAL86+ ------------------------------------------------------------- Percentiles Smallest 1% 0 0 5% 0 0 10% 0 0 Obs 192 25% 0 0 Sum of Wgt. 192 50% .9729799 Mean 2.180503 Largest Std. Dev. 3.247138 75% 3.081003 10.52632 90% 6.666667 10.81081 Variance 10.54391 95% 8.875 12.5 Skewness 2.981313 99% 12.5 25.83333 Kurtosis 17.3537 SCALE DESCRIPTION This scale captures the staffing intensity relative to occupational therapy (therapists & assistants). The numerical value is the number of OT and OT assist tants FTE's per 100 beds. Higher values mean greater staffing intensity. (Internal consistency reliability not applicable). ITEMS IN SCALE item varlab as5fa AS 5fa. occ thrap hours worked in period as5ha AS 5ha. ot asst hours worked in pay period ass1 AS s1. how many beds LEVEL-1 QIs qi varlab ADL03 ADL imprvmnt in res. w/capacity (MEGAQI) ADL01 ADL decline (CHSRA) ADL02 ADL dec. following imprvnt (MEGAQI) LEVEL-2 QIs qi varlab COG01 Cognition worsening (LTCQ)
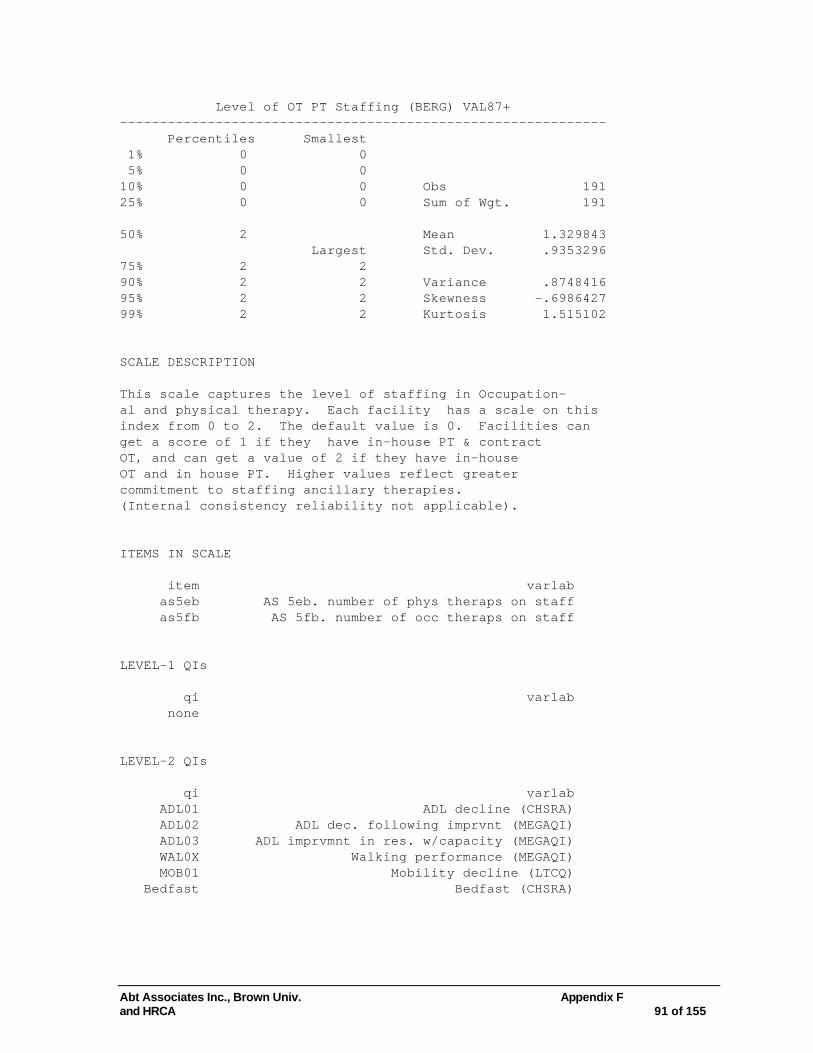
Abt Associates Inc., Brown Univ. Appendix F and HRCA 91 of 155
Level of OT PT Staffing (BERG) VAL87+ ------------------------------------------------------------- Percentiles Smallest 1% 0 0 5% 0 0 10% 0 0 Obs 191 25% 0 0 Sum of Wgt. 191 50% 2 Mean 1.329843 Largest Std. Dev. .9353296 75% 2 2 90% 2 2 Variance .8748416 95% 2 2 Skewness -.6986427 99% 2 2 Kurtosis 1.515102 SCALE DESCRIPTION This scale captures the level of staffing in Occupation- al and physical therapy. Each facility has a scale on this index from 0 to 2. The default value is 0. Facilities can get a score of 1 if they have in-house PT & contract OT, and can get a value of 2 if they have in-house OT and in house PT. Higher values reflect greater commitment to staffing ancillary therapies. (Internal consistency reliability not applicable). ITEMS IN SCALE item varlab as5eb AS 5eb. number of phys theraps on staff as5fb AS 5fb. number of occ theraps on staff LEVEL-1 QIs qi varlab none LEVEL-2 QIs qi varlab ADL01 ADL decline (CHSRA) ADL02 ADL dec. following imprvnt (MEGAQI) ADL03 ADL imprvmnt in res. w/capacity (MEGAQI) WAL0X Walking performance (MEGAQI) MOB01 Mobility decline (LTCQ) Bedfast Bedfast (CHSRA)
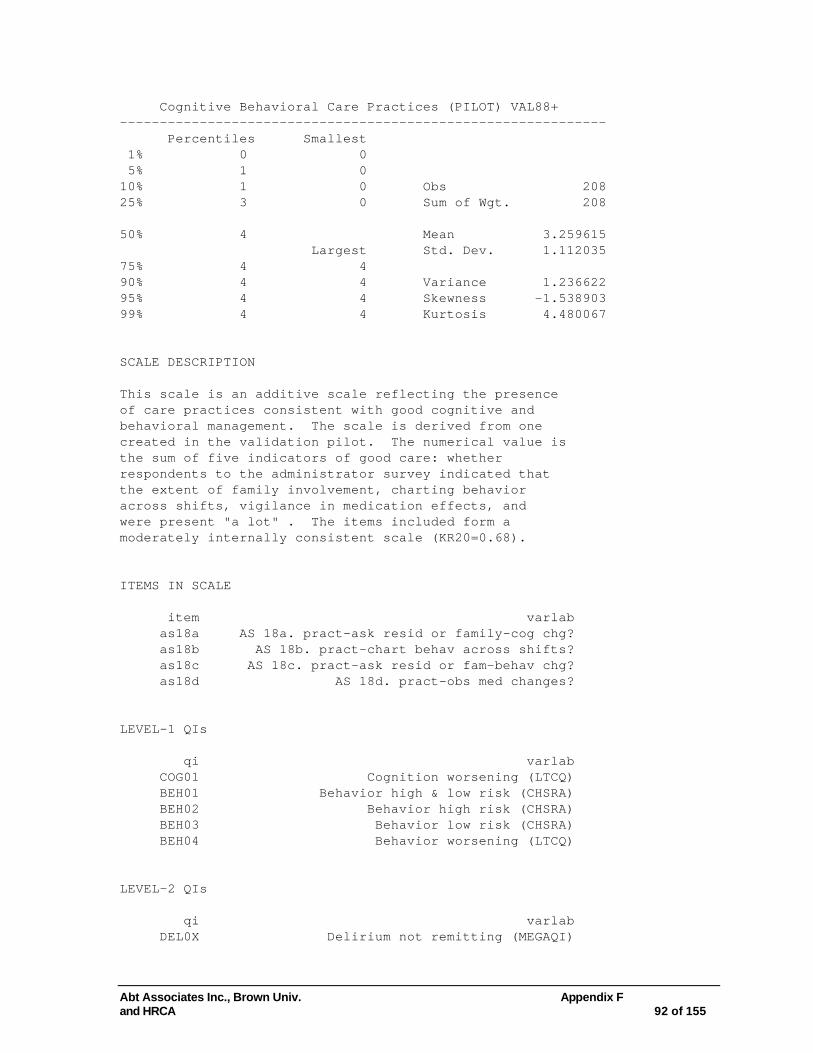
Abt Associates Inc., Brown Univ. Appendix F and HRCA 92 of 155
Cognitive Behavioral Care Practices (PILOT) VAL88+ ------------------------------------------------------------- Percentiles Smallest 1% 0 0 5% 1 0 10% 1 0 Obs 208 25% 3 0 Sum of Wgt. 208 50% 4 Mean 3.259615 Largest Std. Dev. 1.112035 75% 4 4 90% 4 4 Variance 1.236622 95% 4 4 Skewness -1.538903 99% 4 4 Kurtosis 4.480067 SCALE DESCRIPTION This scale is an additive scale reflecting the presence of care practices consistent with good cognitive and behavioral management. The scale is derived from one created in the validation pilot. The numerical value is the sum of five indicators of good care: whether respondents to the administrator survey indicated that the extent of family involvement, charting behavior across shifts, vigilance in medication effects, and were present "a lot" . The items included form a moderately internally consistent scale (KR20=0.68). ITEMS IN SCALE item varlab as18a AS 18a. pract-ask resid or family-cog chg? as18b AS 18b. pract-chart behav across shifts? as18c AS 18c. pract-ask resid or fam-behav chg? as18d AS 18d. pract-obs med changes? LEVEL-1 QIs qi varlab COG01 Cognition worsening (LTCQ) BEH01 Behavior high & low risk (CHSRA) BEH02 Behavior high risk (CHSRA) BEH03 Behavior low risk (CHSRA) BEH04 Behavior worsening (LTCQ) LEVEL-2 QIs qi varlab DEL0X Delirium not remitting (MEGAQI)

Abt Associates Inc., Brown Univ. Appendix F and HRCA 93 of 155
Emphasis on Mission (PILOT) VAL89+ ------------------------------------------------------------- Percentiles Smallest 1% 0 0 5% 0 0 10% 1 0 Obs 207 25% 1 0 Sum of Wgt. 207 50% 2 Mean 2.115942 Largest Std. Dev. .9684774 75% 3 3 90% 3 3 Variance .9379485 95% 3 3 Skewness -.7795867 99% 3 3 Kurtosis 2.505484 SCALE DESCRIPTION This scale captures the tendency of the management of the facility to disseminate the nursing Mission Statement to staff. Three indicators are included: whether or not the Mission Statement is shared with newly admitted residents & families, included in the facility brochure, and whether or not it is distributed via the facility newsletter. The items in this scale form a moderately internally consistent scale (KR20=0.60). ITEMS IN SCALE item varlab as24b AS 24b. mission statem-expl to residents as24c AS 24c. mission ststem-incl in brochure as24a AS 24a. mission statem-employee eval based LEVEL-1 QIs qi varlab none LEVEL-2 QIs qi varlab RES01 Restraints (CHSRA) PRU01 PU high & low risk (CHSRA) PRU02 PU high risk (CHSRA) PRU03 PU low risk (CHSRA) PRU04 PU onset or worsening (LTCQ)

Abt Associates Inc., Brown Univ. Appendix F and HRCA 94 of 155
Long Stay Staff deciles (PILOT) VAL90+ ------------------------------------------------------------- Percentiles Smallest 1% 1 1 5% 1 1 10% 1 1 Obs 208 25% 3 1 Sum of Wgt. 208 50% 5.5 Mean 5.480769 Largest Std. Dev. 2.875789 75% 8 10 90% 9 10 Variance 8.27016 95% 10 10 Skewness .0015813 99% 10 10 Kurtosis 1.772046 SCALE DESCRIPTION This scale captures the proportion of staff in three key areas that have been present in the facility for two or more years. The three key areas include licensed staff (RN, LPN, LVN) Certified Nursing Assistants, Certified Nursing Assistants, and Activities staff). The numerical value represented by this validation construct is the decile of the factor score underlying the co-variation of long-stay staff in these three areas. Higher values indicate greater long-stay staff. The coefficient alpha internal consistency reliability for this scale is 0.69 ITEMS IN SCALE item varlab as8a3 AS 8a.3 rn\lpn\lvn staff - 2+ years as8b3 AS 8b.3 cna 2+ years as8c3 AS 8c.3 activity staff 2+ years as5ab AS 5ab. number of rns on staff as5bb AS 5bb. number of lpn\lvns on staff as5cb AS 5cb. number of na\cnas on staff as5db AS 5db. number of actdir\aidess on staff LEVEL-1 QIs qi varlab none LEVEL-2 QIs qi varlab PAN01 Pain worsening (LTCQ) PAI0X Pain poorly managed (MEGAQI) NUT01 Tube feeding (RAMSEY)

Abt Associates Inc., Brown Univ. Appendix F and HRCA 95 of 155
INF0X Infection flare-up (MEGAQI) CNT04 UTI (CHSRA) MOD03 Depression new or worse (LTCQ) PRU01 PU high & low risk (CHSRA) PRU02 PU high risk (CHSRA) PRU03 PU low risk (CHSRA) PRU04 PU onset or worsening (LTCQ) SOC02 Little or no activities (CHSRA)

Abt Associates Inc., Brown Univ. Appendix F and HRCA 96 of 155
Restorative Eating Care Provided (PILOT) VAL92+ ------------------------------------------------------------- Percentiles Smallest 1% 0 0 5% 0 0 10% 0 0 Obs 205 25% 0 0 Sum of Wgt. 205 50% 1 Mean 1.156098 Largest Std. Dev. 1.012193 75% 2 4 90% 2 4 Variance 1.024534 95% 3 4 Skewness .792966 99% 4 4 Kurtosis 3.35464 SCALE DESCRIPTION This validation scale measures the tendency of the facility to offer different types of nutritionally oriented activities: eating/swallowing/meal training, regular use of between meal snacks, use of finger foods, and weekly or more frequent weight evaluation. This scale is based on one developed in the validation pilot, and while all indicators are positively correlated the four indicators comprise an only marginally internal- ly consistent scale (KR20=0.49). ITEMS IN SCALE item varlab as14ca AS 14ca. meal training in last week as14ia AS 14ia. regular snacks in last week as14ja AS 14ja. use finger foods in last week as14ha AS 14ha. weight eval in last week LEVEL-1 QIs qi varlab WGT01 Weight loss (LTCQ) LEVEL-2 QIs qi varlab none

Abt Associates Inc., Brown Univ. Appendix F and HRCA 97 of 155
Activities in NH (PILOT) VAL93+ ------------------------------------------------------------- Percentiles Smallest 1% 0 0 5% 1 0 10% 1 0 Obs 208 25% 1 0 Sum of Wgt. 208 50% 2 Mean 2.033654 Largest Std. Dev. .8867365 75% 3 3 90% 3 3 Variance .7863016 95% 3 3 Skewness -.3572735 99% 3 3 Kurtosis 1.984966 SCALE DESCRIPTION This validation scale measures the level of activity displayed by facility residents or encouraged of resi- dents. The scale uses walk-through and administrator survey items: whether or not residents are encouraged to engage in facility-wide activities "a lot" and if "often" or "very often" residents were observed to be out of bed and activities were available. This scale is based on one devised in the validation Pilot, and while the items are all positively correlated the items form a marginally internally consistent scale (KR20=0.41). ITEMS IN SCALE item varlab as18f AS 18f. pract-encour res to participate? wpm11 WT 11. variety of activities avaliable wpm12 WT 12. out of bed, not for nap or bedtime LEVEL-1 QIs qi varlab SOC02 Little or no activities (CHSRA) MOD03 Depression new or worse (LTCQ) LEVEL-2 QIs qi varlab PAN01 Pain worsening (LTCQ) PAI0X Pain poorly managed (MEGAQI)

Abt Associates Inc., Brown Univ. Appendix F and HRCA 98 of 155
Informal Pathways Communication (PILOT) VAL97+ ------------------------------------------------------------- Percentiles Smallest 1% 0 0 5% 0 0 10% 0 0 Obs 208 25% 0 0 Sum of Wgt. 208 50% 1 Mean 1.096154 Largest Std. Dev. .9064368 75% 2 2 90% 2 2 Variance .8216276 95% 2 2 Skewness -.1901619 99% 2 2 Kurtosis 1.249717 SCALE DESCRIPTION This scale measures the presence of informal comm- unication pathways among staff for depression and residents communication skills. The numerical value for this scale is the count of two indicators noting the presence of informal communication pathways in the two areas. The two items are highly inter- correlated (r=0.64) and the resulting additive scale is internally consistent (KR20=0.79). ITEMS IN SCALE item varlab as29c1 AS 29c.1 depression, mood-verb inform as29j1 AS 29j.1 communic change-verb inform LEVEL-1 QIs qi varlab COM01 Communication worsening (LTCQ) LEVEL-2 QIs qi varlab MOD03 Depression new or worse (LTCQ) DepWOTx Depression without treatment (CHSRA)

Abt Associates Inc., Brown Univ. Appendix F and HRCA 99 of 155
Direct Care Staff Involved for Residents who Fall (PILOT) VAL98+ ------------------------------------------------------------- Percentiles Smallest 1% 0 0 5% 0 0 10% 0 0 Obs 175 25% 3 0 Sum of Wgt. 175 50% 4 Mean 3.874286 Largest Std. Dev. 1.943504 75% 5 7 90% 6 7 Variance 3.777209 95% 7 7 Skewness -.5101593 99% 7 7 Kurtosis 2.511374 SCALE DESCRIPTION This scale captures the level of activity of the falls committee in the home, including the involvement of direct care staff, intensity of review of falls, size of falls committee, and representation of physical therapy and other therapies on the falls committee. The num- erical value for this scale is the number of indicators of an involved falls committee (0-7). The items included in the scale (and listed below) are all positively correlated with the first principal comp- onent underlying the items, but the internal consis- tency of the items is marginal (KR20=0.52). ITEMS IN SCALE item varlab as33 AS 33. facility has falls committee? as33b AS 33b. unit staff on falls committee? as33c AS 33c. falls review after every fall? as33ac AS 33ac. num falls committee members-cnas as33ad AS 33ad. num falls comm mems phys therap as33ae AS 33ae. num falls comm mems-other therap LEVEL-1 QIs qi varlab FAL01 Falls increase (LTCQ) LEVEL-2 QIs qi varlab CNT01 Incontinence hi & lo risk (CHSRA) CNT05 Incontinence high risk (CHSRA) CNT06 Incontinence low risk (CHSRA)

Abt Associates Inc., Brown Univ. Appendix F and HRCA 100 of 155
Training & Policy for Suspicious Skin (PILOT) VAL99+ ------------------------------------------------------------- Percentiles Smallest 1% 6 3 5% 8 6 10% 9 6 Obs 208 25% 11 6 Sum of Wgt. 208 50% 12 Mean 11.90385 Largest Std. Dev. 2.135593 75% 13 15 90% 14 15 Variance 4.560758 95% 15 15 Skewness -.9931256 99% 15 15 Kurtosis 4.087123 SCALE DESCRIPTION This scale measures the level of training and policy intensity for monitoring and notification of suspicious skin condition. The numerical value is the count of fifteen indicators of high intensity monitoring or invol- vement in skin condition monitoring/notification. The numerical value used is the count of these fifteen indicators - suggestive of high quality skin care - are present as indicated by the respondent to the administrator survey. The included indicators form an moderately internally consistent set (KR20=0.61). ITEMS IN SCALE item varlab as25b AS 25b. policy rev-docum methods for ulcers as25a AS 25a. policy rev-pressure relieving dev as25p AS 25p. policy rev-positioning as26ba AS 26ba. rev prog-ulcer prevent-cna? as30g AS 30g. skin policy-notify physician immed as30b AS 30b. skin policy-sched risk assessment as30f AS 30f. skin policy-notify np immediately as30c AS 30c. skin policy-frequent re-observe as30e AS 30e. skin policy-obtain consultation as30d AS 30d. skin policy-implement treatment as26ha AS 26ha. rev prog-burns, abras-cna? as26hb AS 26hb. rev prog-burns, abras-rn,lpn\lvn? as30a AS 30a. skin policy-sched freq observation as26bb AS 26bb. rev prog-ulcer preven-rn,lpn\lvn? as26ab AS 26ab. rev prog-delirium-rn,lpn\lvn? LEVEL-1 QIs qi varlab

Abt Associates Inc., Brown Univ. Appendix F and HRCA 101 of 155
BUR0X Burns abrasions bruises (MEGAQI) PRU01 PU high & low risk (CHSRA) PRU02 PU high risk (CHSRA) PRU03 PU low risk (CHSRA) PRU04 PU onset or worsening (LTCQ) LEVEL-2 QIs qi varlab none

Abt Associates Inc., Brown Univ. Appendix F and HRCA 102 of 155
Policies & Procedures Dep/Del (PILOT) VAL100+ ------------------------------------------------------------- Percentiles Smallest 1% 0 0 5% 0 0 10% 0 0 Obs 208 25% 2 0 Sum of Wgt. 208 50% 4 Mean 3.447115 Largest Std. Dev. 2.168526 75% 5 8 90% 6 8 Variance 4.702504 95% 7 9 Skewness .0706226 99% 8 9 Kurtosis 2.287594 SCALE DESCRIPTION This scale measures the level of intensity of monitor- ing, assessing and recording anxious complaints, mood symptoms, and indicators of delirium. The numerical value represented by this scale is the count of nine indicators of more frequent assessments of mood, and delirious symptoms and associated features (see list of included items below). The items comp- rising this scale form an internally consistent set (KR20=0.70). ITEMS IN SCALE item varlab qi1a MRR 1.a record of assess-cognit status qi1d MRR 1.d record of assess-depression qi1c MRR 1.c record of assess-delirium as28bb4 AS 28bb.4 quarterly depression, anxiety as28ab4 AS 28ab.4 quarterly adv drug reaction as28ba AS 28ba. routin depression, anxiety? as28bb AS 28bb.2 adm depression, anxiety as28ca AS 28ca. routin delirium? as28cb AS 28cb.2 adm delirium? LEVEL-1 QIs qi varlab DepWOTx Depression without treatment (CHSRA) LEVEL-2 QIs qi varlab MOD03 Depression new or worse (LTCQ) DEL0X Delirium not remitting (MEGAQI)
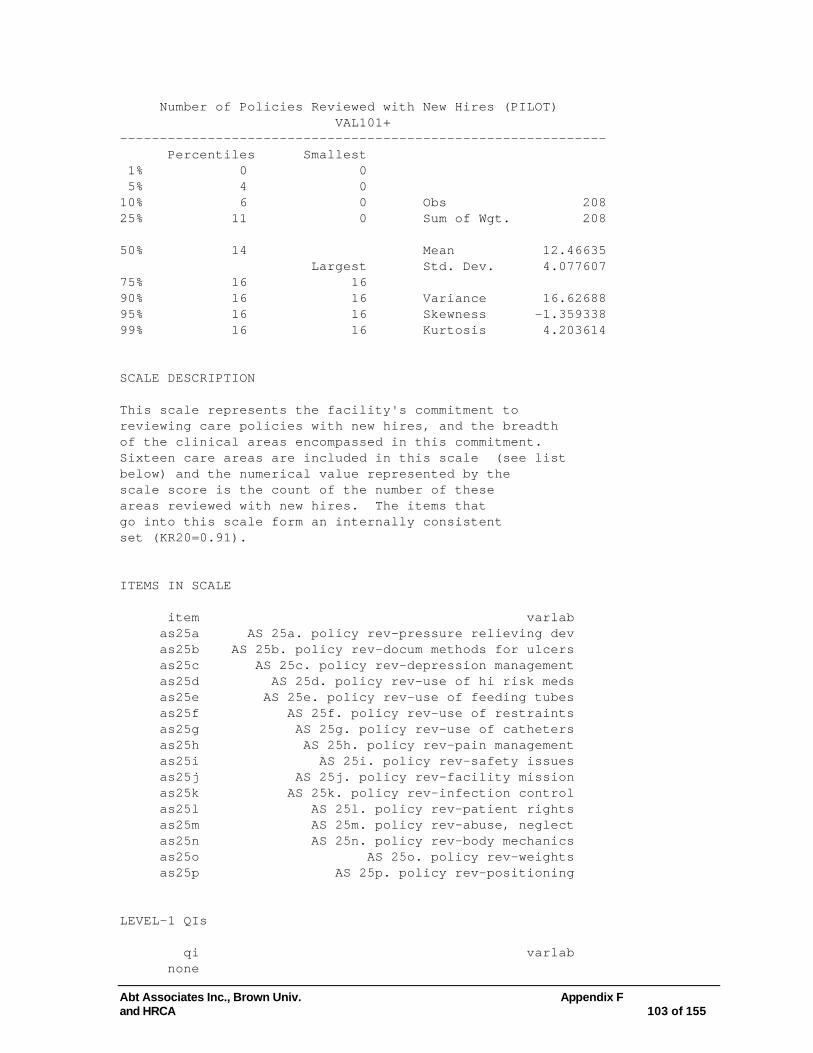
Abt Associates Inc., Brown Univ. Appendix F and HRCA 103 of 155
Number of Policies Reviewed with New Hires (PILOT) VAL101+ ------------------------------------------------------------- Percentiles Smallest 1% 0 0 5% 4 0 10% 6 0 Obs 208 25% 11 0 Sum of Wgt. 208 50% 14 Mean 12.46635 Largest Std. Dev. 4.077607 75% 16 16 90% 16 16 Variance 16.62688 95% 16 16 Skewness -1.359338 99% 16 16 Kurtosis 4.203614 SCALE DESCRIPTION This scale represents the facility's commitment to reviewing care policies with new hires, and the breadth of the clinical areas encompassed in this commitment. Sixteen care areas are included in this scale (see list below) and the numerical value represented by the scale score is the count of the number of these areas reviewed with new hires. The items that go into this scale form an internally consistent set (KR20=0.91). ITEMS IN SCALE item varlab as25a AS 25a. policy rev-pressure relieving dev as25b AS 25b. policy rev-docum methods for ulcers as25c AS 25c. policy rev-depression management as25d AS 25d. policy rev-use of hi risk meds as25e AS 25e. policy rev-use of feeding tubes as25f AS 25f. policy rev-use of restraints as25g AS 25g. policy rev-use of catheters as25h AS 25h. policy rev-pain management as25i AS 25i. policy rev-safety issues as25j AS 25j. policy rev-facility mission as25k AS 25k. policy rev-infection control as25l AS 25l. policy rev-patient rights as25m AS 25m. policy rev-abuse, neglect as25n AS 25n. policy rev-body mechanics as25o AS 25o. policy rev-weights as25p AS 25p. policy rev-positioning LEVEL-1 QIs qi varlab none

Abt Associates Inc., Brown Univ. Appendix F and HRCA 104 of 155
LEVEL-2 QIs qi varlab BMI0X Low BMI (MEGAQI) CNT04 UTI (CHSRA) BEH01 Behavior high & low risk (CHSRA) BEH02 Behavior high risk (CHSRA) BEH03 Behavior low risk (CHSRA)

Abt Associates Inc., Brown Univ. Appendix F and HRCA 105 of 155
COGimp Improvement Scale (JNM)val103+ ------------------------------------------------------------- Percentiles Smallest 1% 0 0 5% 0 0 10% 0 0 Obs 208 25% 0 0 Sum of Wgt. 208 50% 0 Mean .8798077 Largest Std. Dev. 1.067742 75% 2 3 90% 3 3 Variance 1.140073 95% 3 3 Skewness .813347 99% 3 3 Kurtosis 2.258743 SCALE DESCRIPTION This scale uses a combination of medical record review data elements (indicators defined within the top 30th percentile) and administrative survey items (see list below) to create a summative index of four items cap- turing the facility's tendency to engage in assess- ment and goal setting activities to promote cognitive functioning. The numerical value represented by the scale score is the count of the number of items present. The items included form a moderately internally consistent set (KR20=0.66). ITEMS IN SCALE item varlab qi4ba MRR 4b.a goals for improve-cognit status qi4ca MRR 4c.a goals for prevent-cognit status qi4da MRR 4d.a nurse interven-cognitive status (qi1a not included for psychometric reasons) LEVEL-1 QIs qi varlab none LEVEL-2 QIs qi varlab COG01 Cognition worsening (LTCQ)

Abt Associates Inc., Brown Univ. Appendix F and HRCA 106 of 155
Comm Improvement Scale (JNM)val104+ ------------------------------------------------------------- Percentiles Smallest 1% 0 0 5% 0 0 10% 0 0 Obs 208 25% 0 0 Sum of Wgt. 208 50% 1 Mean 1.1875 Largest Std. Dev. 1.158225 75% 2 4 90% 3 4 Variance 1.341486 95% 3 4 Skewness .6963668 99% 4 4 Kurtosis 2.456272 SCALE DESCRIPTION This scale uses a combination of medical record review data elements (indicators defined within the top 30th percentile) and administrative survey items (see list below) to create a summative index of four items cap- turing the facility's tendency to engage in assess- ment and goal setting activities to promote communicative improvement (of the resident). The numerical value represented by the scale score is the count of the number of items present. The items included form a marginal internally consistent set (KR20=0.55). ITEMS IN SCALE item varlab qi1b MRR 1.b record of assess-communication qi4bb MRR 4b.b goals for improve-communication qi4cb MRR 4c.b goals for prevent-communication qi4db MRR 4d.b nurse interven-communication LEVEL-1 QIs qi varlab none LEVEL-2 QIs qi varlab COM01 Communication worsening (LTCQ)

Abt Associates Inc., Brown Univ. Appendix F and HRCA 107 of 155
Delirium Improvement Scale (JNM)val105+ ------------------------------------------------------------- Percentiles Smallest 1% 0 0 5% 0 0 10% 0 0 Obs 208 25% 0 0 Sum of Wgt. 208 50% 0 Mean 1.120192 Largest Std. Dev. 1.431183 75% 2 4 90% 4 4 Variance 2.048286 95% 4 4 Skewness .8883324 99% 4 4 Kurtosis 2.276636 SCALE DESCRIPTION This scale uses a combination of medical record review data elements (indicators defined within the top 30th percentile) and administrative survey items (see list below) to create a summative index of four items cap- turing the facility's tendency to engage in assess- ment and goal setting activities to resolve or other- wise address symptoms of delirium. The numerical value represented by the scale score is the count of the number of items present. The items included form a highly internally consistent set (KR20=0.78). ITEMS IN SCALE item varlab qi1c MRR 1.c record of assess-delirium qi4bc MRR 4b.c goals for improve-delirium qi4cc MRR 4c.c goals for prevent-delirium qi4dc MRR 4d.c nurse interven-delirium LEVEL-1 QIs qi varlab none LEVEL-2 QIs qi varlab DEL0X Delirium not remitting (MEGAQI)
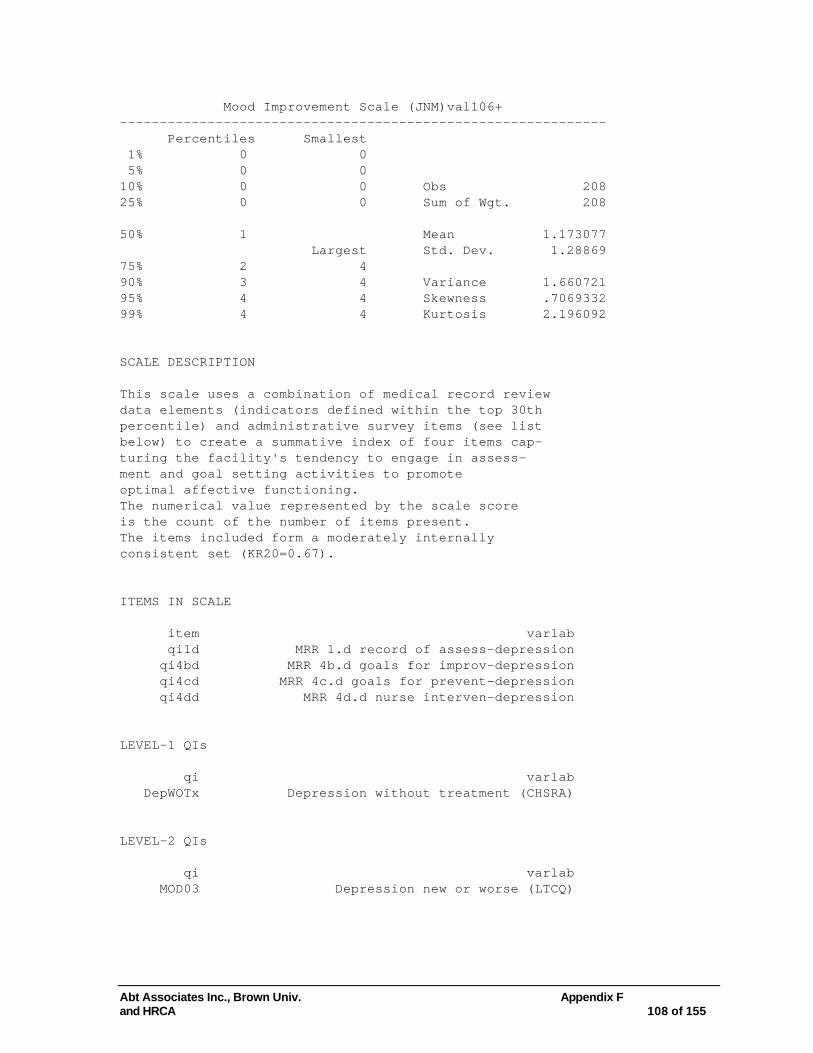
Abt Associates Inc., Brown Univ. Appendix F and HRCA 108 of 155
Mood Improvement Scale (JNM)val106+ ------------------------------------------------------------- Percentiles Smallest 1% 0 0 5% 0 0 10% 0 0 Obs 208 25% 0 0 Sum of Wgt. 208 50% 1 Mean 1.173077 Largest Std. Dev. 1.28869 75% 2 4 90% 3 4 Variance 1.660721 95% 4 4 Skewness .7069332 99% 4 4 Kurtosis 2.196092 SCALE DESCRIPTION This scale uses a combination of medical record review data elements (indicators defined within the top 30th percentile) and administrative survey items (see list below) to create a summative index of four items cap- turing the facility's tendency to engage in assess- ment and goal setting activities to promote optimal affective functioning. The numerical value represented by the scale score is the count of the number of items present. The items included form a moderately internally consistent set (KR20=0.67). ITEMS IN SCALE item varlab qi1d MRR 1.d record of assess-depression qi4bd MRR 4b.d goals for improv-depression qi4cd MRR 4c.d goals for prevent-depression qi4dd MRR 4d.d nurse interven-depression LEVEL-1 QIs qi varlab DepWOTx Depression without treatment (CHSRA) LEVEL-2 QIs qi varlab MOD03 Depression new or worse (LTCQ)

Abt Associates Inc., Brown Univ. Appendix F and HRCA 109 of 155
Behavior Improvement Scale (JNM)val107+ ------------------------------------------------------------- Percentiles Smallest 1% 0 0 5% 0 0 10% 0 0 Obs 208 25% 0 0 Sum of Wgt. 208 50% 1 Mean 1.158654 Largest Std. Dev. 1.350907 75% 2 4 90% 3 4 Variance 1.824949 95% 4 4 Skewness .8060716 99% 4 4 Kurtosis 2.281622 SCALE DESCRIPTION This scale uses a combination of medical record review data elements (indicators defined within the top 30th percentile) and administrative survey items (see list below) to create a summative index of four items cap- turing the facility's tendency to engage in assess- ment and goal setting activities to promote or manage behavioral symptoms. The numerical value represented by the scale score is the count of the number of items present. The items included form a highly internally consistent set (KR20=0.74). ITEMS IN SCALE item varlab qi1e MRR 1.e record of assess-behav problems qi4be MRR 4b.e goals for improve-behav probs qi4ce MRR 4c.e goals for prevent-behav problems qi4de MRR 4d.e nurse interven-behav problems LEVEL-1 QIs qi varlab none LEVEL-2 QIs qi varlab BEH01 Behavior high & low risk (CHSRA) BEH02 Behavior high risk (CHSRA) BEH03 Behavior low risk (CHSRA) BEH04 Behavior worsening (LTCQ)

Abt Associates Inc., Brown Univ. Appendix F and HRCA 110 of 155
ADLimp Improvement Scale (JNM)val108+ ------------------------------------------------------------- Percentiles Smallest 1% 0 0 5% 0 0 10% 0 0 Obs 208 25% 0 0 Sum of Wgt. 208 50% 0 Mean 1.177885 Largest Std. Dev. 1.636566 75% 3 4 90% 4 4 Variance 2.678349 95% 4 4 Skewness .8594757 99% 4 4 Kurtosis 1.955615 SCALE DESCRIPTION This scale uses a combination of medical record review data elements (indicators defined within the top 30th percentile) and administrative survey items (see list below) to create a summative index of four items cap- turing the facility's tendency to engage in assess- ment and goal setting activities to promote improvement in ADL functioning. The numerical value represented by the scale score is the count of the number of items present. The items included form a highly internally consistent set (KR20=0.92). ITEMS IN SCALE item varlab qi1f MRR 1.f record of assess-adl improvement qi4bf MRR 4b.f goals for improve-adl improv qi4cf MRR 4c.f goals for prevent-adl improv qi4df MRR 4d.f nurse interven-adl improvement LEVEL-1 QIs qi varlab none LEVEL-2 QIs qi varlab ADL03 ADL imprvmnt in res. w/capacity (MEGAQI)

Abt Associates Inc., Brown Univ. Appendix F and HRCA 111 of 155
ADLdec Improvement Scale (JNM)val109+ ------------------------------------------------------------- Percentiles Smallest 1% 0 0 5% 0 0 10% 0 0 Obs 208 25% 0 0 Sum of Wgt. 208 50% 1 Mean 1.163462 Largest Std. Dev. 1.355686 75% 2 4 90% 3 4 Variance 1.837886 95% 4 4 Skewness .809549 99% 4 4 Kurtosis 2.300092 SCALE DESCRIPTION This scale uses a combination of medical record review data elements (indicators defined within the top 30th percentile) and administrative survey items (see list below) to create a summative index of four items cap- turing the facility's tendency to engage in assess- ment and goal setting activities to impede or otherwise delay functional decline. The numerical value represented by the scale score is the count of the number of items present. The items included form a highly internally consistent set (KR20=0.76). ITEMS IN SCALE item varlab qi1g MRR 1.g record of assess-adl decline qi4bg MRR 4b.g goals for improv-adl decline qi4cg MRR 4c.g goals for prevent-adl decline qi4dg MRR 4d.g nurse interven-adl decline LEVEL-1 QIs qi varlab none LEVEL-2 QIs qi varlab ADL02 ADL dec. following imprvnt (MEGAQI) ADL01 ADL decline (CHSRA)
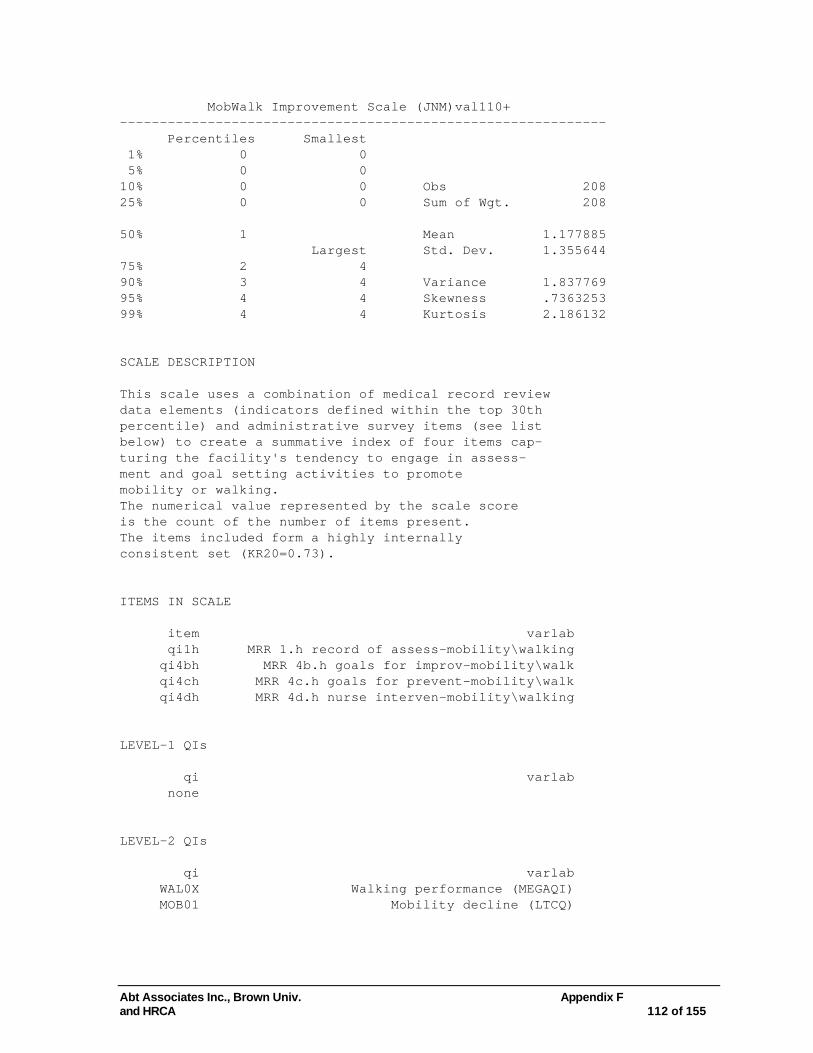
Abt Associates Inc., Brown Univ. Appendix F and HRCA 112 of 155
MobWalk Improvement Scale (JNM)val110+ ------------------------------------------------------------- Percentiles Smallest 1% 0 0 5% 0 0 10% 0 0 Obs 208 25% 0 0 Sum of Wgt. 208 50% 1 Mean 1.177885 Largest Std. Dev. 1.355644 75% 2 4 90% 3 4 Variance 1.837769 95% 4 4 Skewness .7363253 99% 4 4 Kurtosis 2.186132 SCALE DESCRIPTION This scale uses a combination of medical record review data elements (indicators defined within the top 30th percentile) and administrative survey items (see list below) to create a summative index of four items cap- turing the facility's tendency to engage in assess- ment and goal setting activities to promote mobility or walking. The numerical value represented by the scale score is the count of the number of items present. The items included form a highly internally consistent set (KR20=0.73). ITEMS IN SCALE item varlab qi1h MRR 1.h record of assess-mobility\walking qi4bh MRR 4b.h goals for improv-mobility\walk qi4ch MRR 4c.h goals for prevent-mobility\walk qi4dh MRR 4d.h nurse interven-mobility\walking LEVEL-1 QIs qi varlab none LEVEL-2 QIs qi varlab WAL0X Walking performance (MEGAQI) MOB01 Mobility decline (LTCQ)

Abt Associates Inc., Brown Univ. Appendix F and HRCA 113 of 155
DROPPED ------------------------------------------------------------- Percentiles Smallest 1% 9 9 5% 9 9 10% 9 9 Obs 208 25% 9 9 Sum of Wgt. 208 50% 9 Mean 9 Largest Std. Dev. 0 75% 9 9 90% 9 9 Variance 0 95% 9 9 Skewness . 99% 9 9 Kurtosis . SCALE DESCRIPTION This scale uses a combination of medical record review data elements (indicators defined within the top 30th percentile) and administrative survey items (see list below) to create a summative index of four items cap- turing the facility's tendency to engage in assess- ment and goal setting activities to prevent or man- age tendency for resident's to fall. The numerical value represented by the scale score is the count of the number of items present. The items included form a marginal internally consistent set (KR20=0.39). ITEMS IN SCALE item varlab qi1i MRR 1.i record of assess-falls scale dropped LEVEL-1 QIs qi varlab none LEVEL-2 QIs qi varlab FAL01 Falls increase (LTCQ)
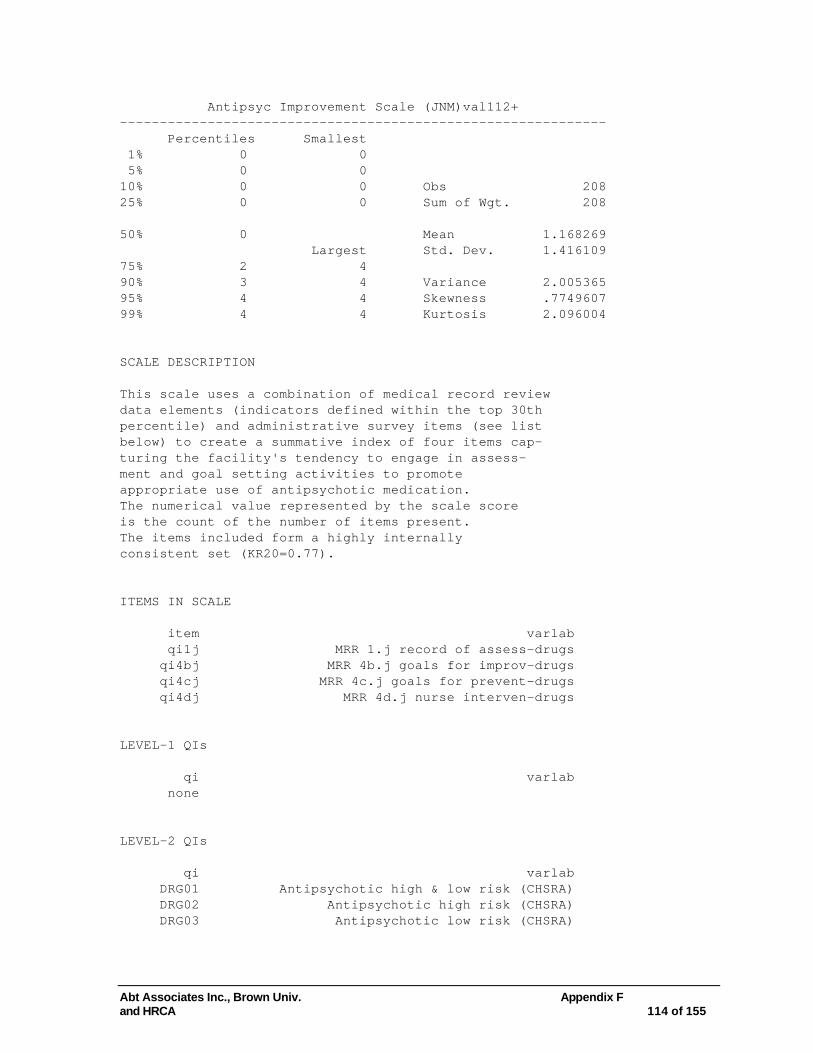
Abt Associates Inc., Brown Univ. Appendix F and HRCA 114 of 155
Antipsyc Improvement Scale (JNM)val112+ ------------------------------------------------------------- Percentiles Smallest 1% 0 0 5% 0 0 10% 0 0 Obs 208 25% 0 0 Sum of Wgt. 208 50% 0 Mean 1.168269 Largest Std. Dev. 1.416109 75% 2 4 90% 3 4 Variance 2.005365 95% 4 4 Skewness .7749607 99% 4 4 Kurtosis 2.096004 SCALE DESCRIPTION This scale uses a combination of medical record review data elements (indicators defined within the top 30th percentile) and administrative survey items (see list below) to create a summative index of four items cap- turing the facility's tendency to engage in assess- ment and goal setting activities to promote appropriate use of antipsychotic medication. The numerical value represented by the scale score is the count of the number of items present. The items included form a highly internally consistent set (KR20=0.77). ITEMS IN SCALE item varlab qi1j MRR 1.j record of assess-drugs qi4bj MRR 4b.j goals for improv-drugs qi4cj MRR 4c.j goals for prevent-drugs qi4dj MRR 4d.j nurse interven-drugs LEVEL-1 QIs qi varlab none LEVEL-2 QIs qi varlab DRG01 Antipsychotic high & low risk (CHSRA) DRG02 Antipsychotic high risk (CHSRA) DRG03 Antipsychotic low risk (CHSRA)
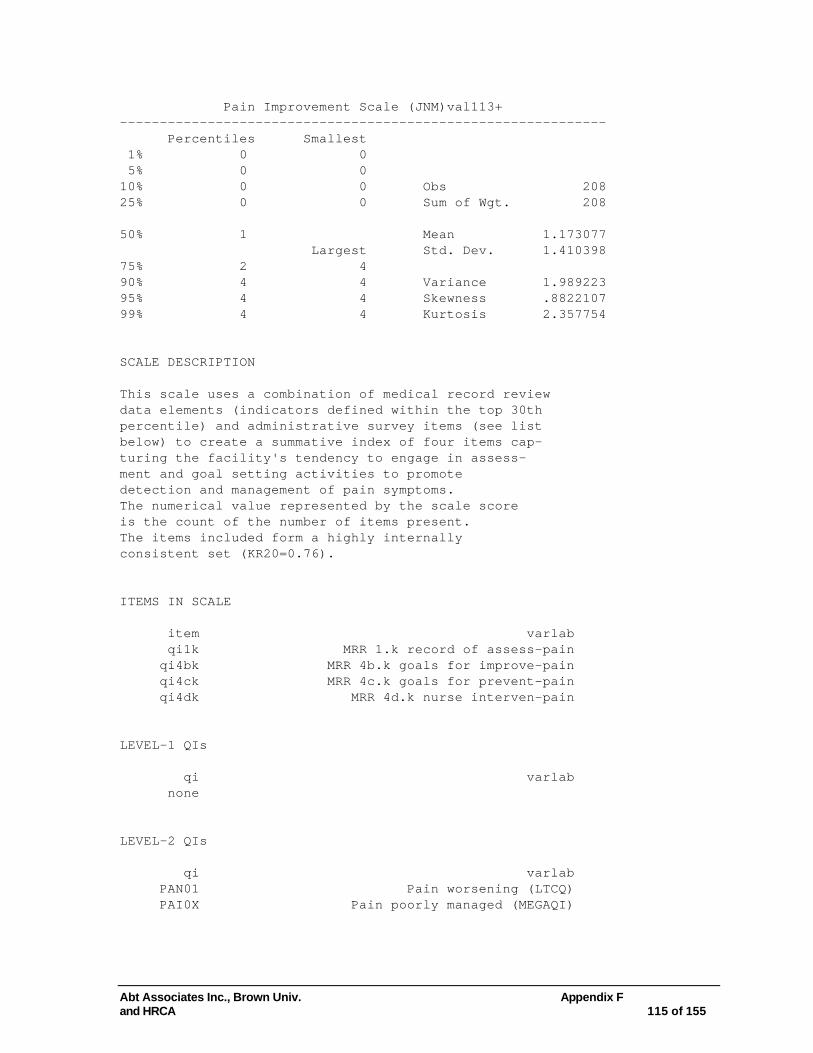
Abt Associates Inc., Brown Univ. Appendix F and HRCA 115 of 155
Pain Improvement Scale (JNM)val113+ ------------------------------------------------------------- Percentiles Smallest 1% 0 0 5% 0 0 10% 0 0 Obs 208 25% 0 0 Sum of Wgt. 208 50% 1 Mean 1.173077 Largest Std. Dev. 1.410398 75% 2 4 90% 4 4 Variance 1.989223 95% 4 4 Skewness .8822107 99% 4 4 Kurtosis 2.357754 SCALE DESCRIPTION This scale uses a combination of medical record review data elements (indicators defined within the top 30th percentile) and administrative survey items (see list below) to create a summative index of four items cap- turing the facility's tendency to engage in assess- ment and goal setting activities to promote detection and management of pain symptoms. The numerical value represented by the scale score is the count of the number of items present. The items included form a highly internally consistent set (KR20=0.76). ITEMS IN SCALE item varlab qi1k MRR 1.k record of assess-pain qi4bk MRR 4b.k goals for improve-pain qi4ck MRR 4c.k goals for prevent-pain qi4dk MRR 4d.k nurse interven-pain LEVEL-1 QIs qi varlab none LEVEL-2 QIs qi varlab PAN01 Pain worsening (LTCQ) PAI0X Pain poorly managed (MEGAQI)

Abt Associates Inc., Brown Univ. Appendix F and HRCA 116 of 155
Restrnt Improvement Scale (JNM)val114+ ------------------------------------------------------------- Percentiles Smallest 1% 0 0 5% 0 0 10% 0 0 Obs 208 25% 0 0 Sum of Wgt. 208 50% 1 Mean 1.072115 Largest Std. Dev. 1.296443 75% 2 4 90% 3 4 Variance 1.680765 95% 4 4 Skewness .9726217 99% 4 4 Kurtosis 2.694171 SCALE DESCRIPTION This scale uses a combination of medical record review data elements (indicators defined within the top 30th percentile) and administrative survey items (see list below) to create a summative index of four items cap- turing the facility's tendency to engage in assess- ment and goal setting activities to attenuate use of restraints. The numerical value represented by the scale score is the count of the number of items present. The items included form a highly internally consistent set (KR20=0.74). ITEMS IN SCALE item varlab qi1l MRR 1.l record of assess-restraints qi4bl MRR 4b.l goals for improve-restraints qi4cl MRR 4c.l goals for prevent-restraints qi4dl MRR 4d.l nurse interven-restraints LEVEL-1 QIs qi varlab none LEVEL-2 QIs qi varlab RES01 Restraints (CHSRA)

Abt Associates Inc., Brown Univ. Appendix F and HRCA 117 of 155
Feedtube Improvement Scale (JNM)val115+ ------------------------------------------------------------- Percentiles Smallest 1% 0 0 5% 0 0 10% 0 0 Obs 208 25% 0 0 Sum of Wgt. 208 50% 1 Mean 1.125 Largest Std. Dev. 1.323788 75% 2 4 90% 3 4 Variance 1.752415 95% 4 4 Skewness .8340753 99% 4 4 Kurtosis 2.428203 SCALE DESCRIPTION This scale uses a combination of medical record review data elements (indicators defined within the top 30th percentile) and administrative survey items (see list below) to create a summative index of four items cap- turing the facility's tendency to engage in assess- ment and goal setting activities to ensure appropriate use of feeding tubes. The numerical value represented by the scale score is the count of the number of items present. The items included form a highly internally consistent set (KR20=0.76). ITEMS IN SCALE item varlab qi1m MRR 1.m record of assess-feed tube qi4bm MRR 4b.m goals for improv-tube feeding qi4cm MRR 4c.m goals for prevent-tube feeding qi4dm MRR 4d.m nurse interven-tube feeding LEVEL-1 QIs qi varlab none LEVEL-2 QIs qi varlab NUT01 Tube feeding (RAMSEY)

Abt Associates Inc., Brown Univ. Appendix F and HRCA 118 of 155
LowBMI Improvement Scale (JNM)val116+ ------------------------------------------------------------- Percentiles Smallest 1% 0 0 5% 0 0 10% 0 0 Obs 208 25% 0 0 Sum of Wgt. 208 50% 1 Mean 1.192308 Largest Std. Dev. 1.341114 75% 2 4 90% 3 4 Variance 1.798588 95% 4 4 Skewness .7543137 99% 4 4 Kurtosis 2.244991 SCALE DESCRIPTION This scale uses a combination of medical record review data elements (indicators defined within the top 30th percentile) and administrative survey items (see list below) to create a summative index of four items cap- turing the facility's tendency to engage in assess- ment and goal setting activities to promote maintenance of body weight. The numerical value represented by the scale score is the count of the number of items present. The items included form a highly internally consistent set (KR20=0.73). ITEMS IN SCALE item varlab qi1n MRR 1.n record of assess-undernutr qi4bn MRR 4b.n goals for improve-undernutrit qi4cn MRR 4c.n goals for prevent-undernutrit qi4dn MRR 4d.n nurse interven-undernutrition LEVEL-1 QIs qi varlab none LEVEL-2 QIs qi varlab BMI0X Low BMI (MEGAQI) WGT01 Weight loss (LTCQ)

Abt Associates Inc., Brown Univ. Appendix F and HRCA 119 of 155
IUCath Improvement Scale (JNM)val117+ ------------------------------------------------------------- Percentiles Smallest 1% 0 0 5% 0 0 10% 0 0 Obs 208 25% 0 0 Sum of Wgt. 208 50% 1 Mean 1.163462 Largest Std. Dev. 1.297419 75% 2 4 90% 3 4 Variance 1.683296 95% 4 4 Skewness .7588252 99% 4 4 Kurtosis 2.306327 SCALE DESCRIPTION This scale uses a combination of medical record review data elements (indicators defined within the top 30th percentile) and administrative survey items (see list below) to create a summative index of four items cap- turing the facility's tendency to engage in assess- ment and goal setting activities to promote vigilance of indwelling urinary catheters. The numerical value represented by the scale score is the count of the number of items present. The items included form a highly internally consistent set (KR20=0.76). ITEMS IN SCALE item varlab qi1o MRR 1.o record of assess-indwell cath qi4bo MRR 4b.o goals for improve-urinary cath qi4co MRR 4c.o goals for prevent-urinary cath qi4do MRR 4d.o nurse interven-urinary catheter LEVEL-1 QIs qi varlab none LEVEL-2 QIs qi varlab CAT01 Indwelling urin cath (LTCQ)
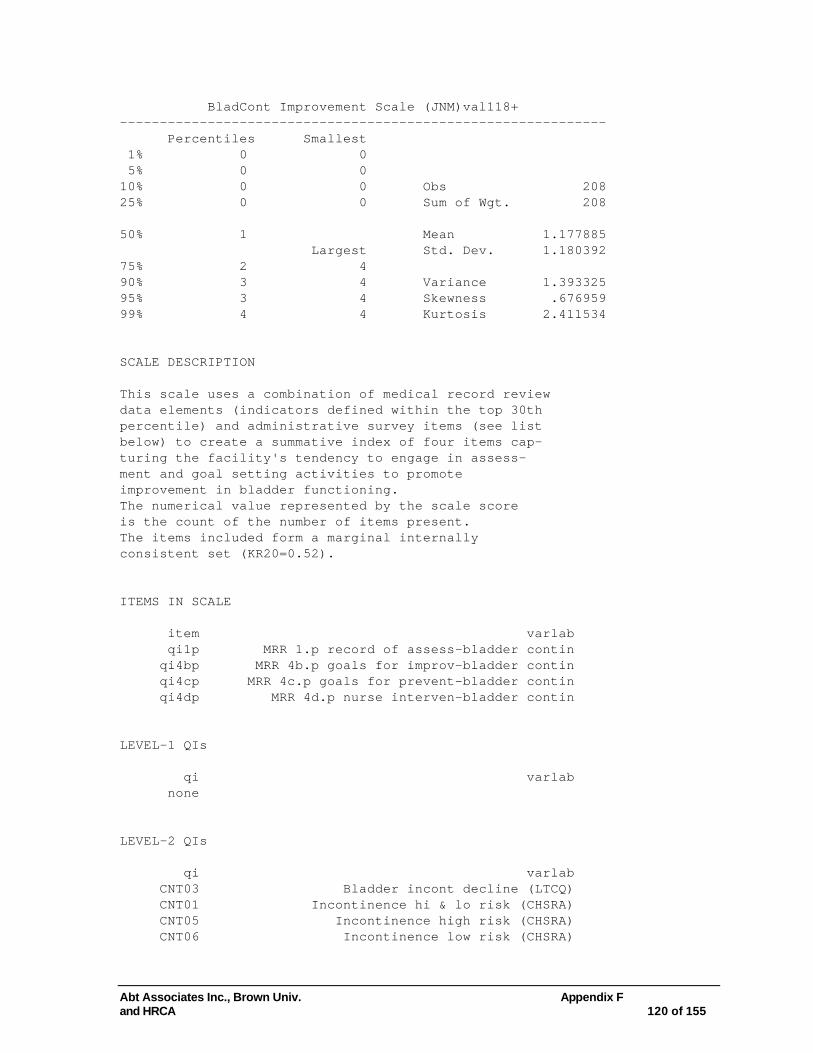
Abt Associates Inc., Brown Univ. Appendix F and HRCA 120 of 155
BladCont Improvement Scale (JNM)val118+ ------------------------------------------------------------- Percentiles Smallest 1% 0 0 5% 0 0 10% 0 0 Obs 208 25% 0 0 Sum of Wgt. 208 50% 1 Mean 1.177885 Largest Std. Dev. 1.180392 75% 2 4 90% 3 4 Variance 1.393325 95% 3 4 Skewness .676959 99% 4 4 Kurtosis 2.411534 SCALE DESCRIPTION This scale uses a combination of medical record review data elements (indicators defined within the top 30th percentile) and administrative survey items (see list below) to create a summative index of four items cap- turing the facility's tendency to engage in assess- ment and goal setting activities to promote improvement in bladder functioning. The numerical value represented by the scale score is the count of the number of items present. The items included form a marginal internally consistent set (KR20=0.52). ITEMS IN SCALE item varlab qi1p MRR 1.p record of assess-bladder contin qi4bp MRR 4b.p goals for improv-bladder contin qi4cp MRR 4c.p goals for prevent-bladder contin qi4dp MRR 4d.p nurse interven-bladder contin LEVEL-1 QIs qi varlab none LEVEL-2 QIs qi varlab CNT03 Bladder incont decline (LTCQ) CNT01 Incontinence hi & lo risk (CHSRA) CNT05 Incontinence high risk (CHSRA) CNT06 Incontinence low risk (CHSRA)
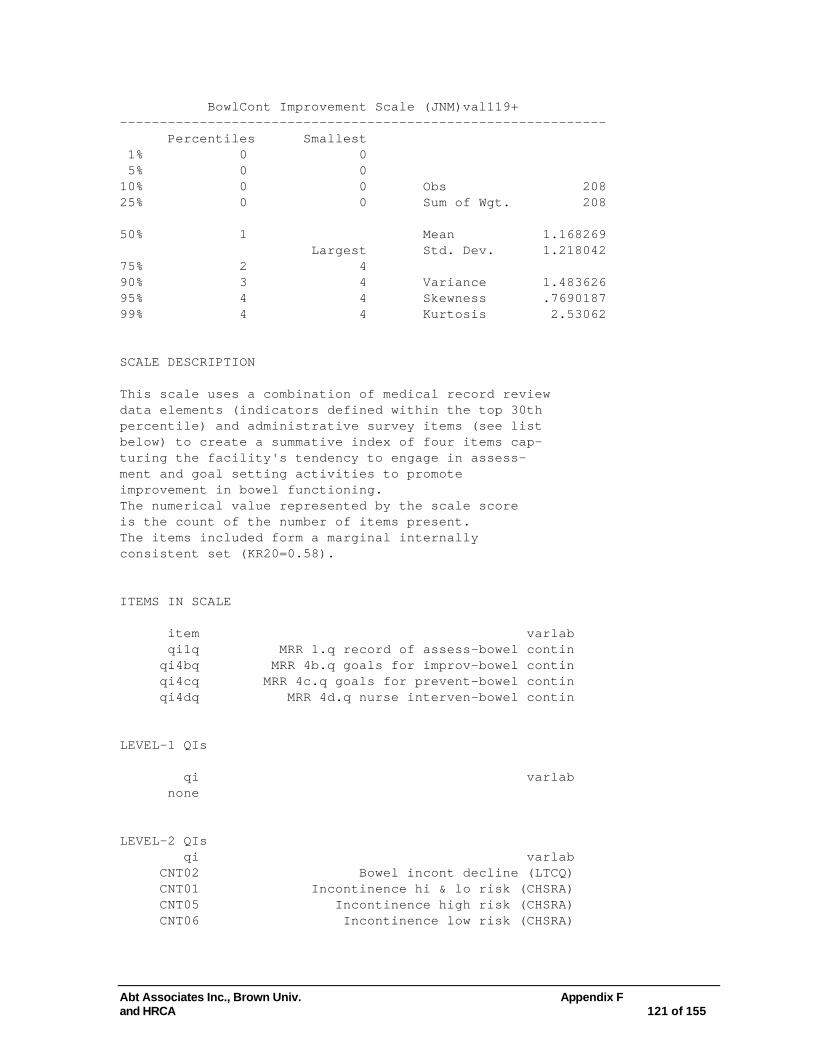
Abt Associates Inc., Brown Univ. Appendix F and HRCA 121 of 155
BowlCont Improvement Scale (JNM)val119+ ------------------------------------------------------------- Percentiles Smallest 1% 0 0 5% 0 0 10% 0 0 Obs 208 25% 0 0 Sum of Wgt. 208 50% 1 Mean 1.168269 Largest Std. Dev. 1.218042 75% 2 4 90% 3 4 Variance 1.483626 95% 4 4 Skewness .7690187 99% 4 4 Kurtosis 2.53062 SCALE DESCRIPTION This scale uses a combination of medical record review data elements (indicators defined within the top 30th percentile) and administrative survey items (see list below) to create a summative index of four items cap- turing the facility's tendency to engage in assess- ment and goal setting activities to promote improvement in bowel functioning. The numerical value represented by the scale score is the count of the number of items present. The items included form a marginal internally consistent set (KR20=0.58). ITEMS IN SCALE item varlab qi1q MRR 1.q record of assess-bowel contin qi4bq MRR 4b.q goals for improv-bowel contin qi4cq MRR 4c.q goals for prevent-bowel contin qi4dq MRR 4d.q nurse interven-bowel contin LEVEL-1 QIs qi varlab none LEVEL-2 QIs qi varlab CNT02 Bowel incont decline (LTCQ) CNT01 Incontinence hi & lo risk (CHSRA) CNT05 Incontinence high risk (CHSRA) CNT06 Incontinence low risk (CHSRA)

Abt Associates Inc., Brown Univ. Appendix F and HRCA 122 of 155
Infectns Improvement Scale (JNM)val120+ ------------------------------------------------------------- Percentiles Smallest 1% 0 0 5% 0 0 10% 0 0 Obs 208 25% 0 0 Sum of Wgt. 208 50% 1 Mean 1.177885 Largest Std. Dev. 1.387345 75% 2 4 90% 4 4 Variance 1.924726 95% 4 4 Skewness .865434 99% 4 4 Kurtosis 2.360706 SCALE DESCRIPTION This scale uses a combination of medical record review data elements (indicators defined within the top 30th percentile) and administrative survey items (see list below) to create a summative index of four items cap- turing the facility's tendency to engage in assess- ment and goal setting activities to promote good care for infections. The numerical value represented by the scale score is the count of the number of items present. The items included form a highly internally consistent set (KR20=0.80). ITEMS IN SCALE item varlab qi1r MRR 1.r record of assess-infectiond qi4br MRR 4b.r goals for improv-infections qi4cr MRR 4c.r goals for prevent-infections qi4dr MRR 4d.r nurse interven-infections LEVEL-1 QIs qi varlab none LEVEL-2 QIs qi varlab INF0X Infection flare-up (MEGAQI)
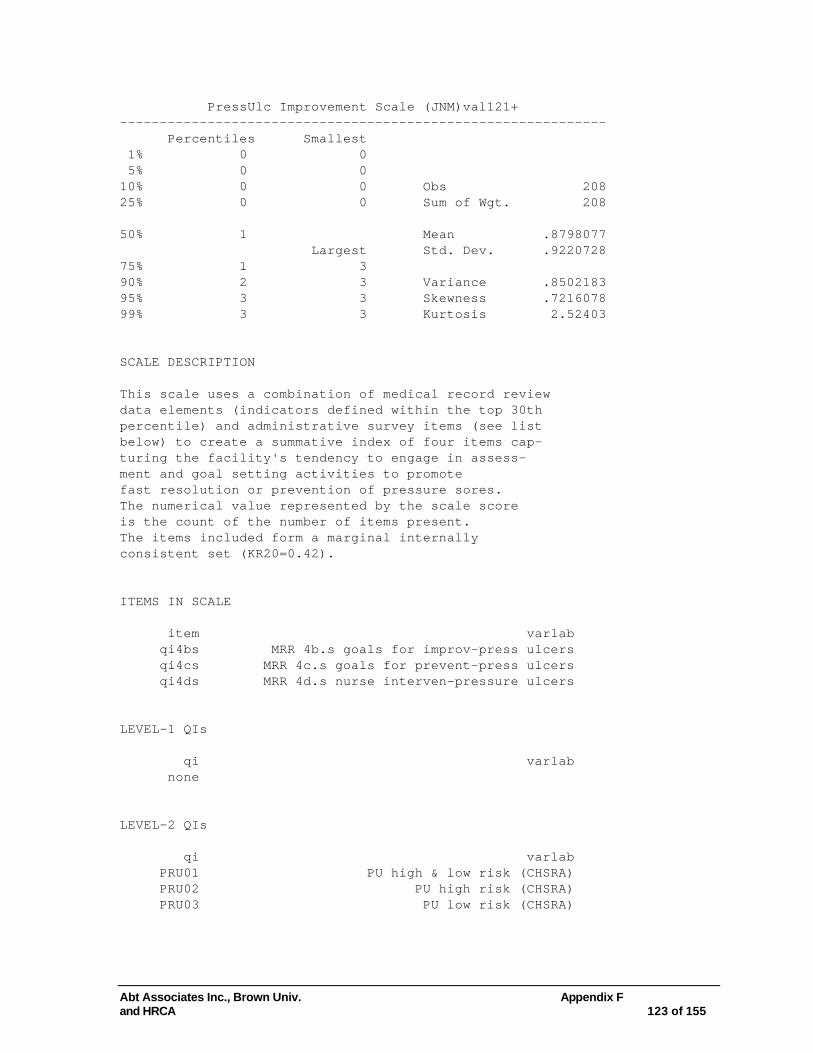
Abt Associates Inc., Brown Univ. Appendix F and HRCA 123 of 155
PressUlc Improvement Scale (JNM)val121+ ------------------------------------------------------------- Percentiles Smallest 1% 0 0 5% 0 0 10% 0 0 Obs 208 25% 0 0 Sum of Wgt. 208 50% 1 Mean .8798077 Largest Std. Dev. .9220728 75% 1 3 90% 2 3 Variance .8502183 95% 3 3 Skewness .7216078 99% 3 3 Kurtosis 2.52403 SCALE DESCRIPTION This scale uses a combination of medical record review data elements (indicators defined within the top 30th percentile) and administrative survey items (see list below) to create a summative index of four items cap- turing the facility's tendency to engage in assess- ment and goal setting activities to promote fast resolution or prevention of pressure sores. The numerical value represented by the scale score is the count of the number of items present. The items included form a marginal internally consistent set (KR20=0.42). ITEMS IN SCALE item varlab qi4bs MRR 4b.s goals for improv-press ulcers qi4cs MRR 4c.s goals for prevent-press ulcers qi4ds MRR 4d.s nurse interven-pressure ulcers LEVEL-1 QIs qi varlab none LEVEL-2 QIs qi varlab PRU01 PU high & low risk (CHSRA) PRU02 PU high risk (CHSRA) PRU03 PU low risk (CHSRA)

Abt Associates Inc., Brown Univ. Appendix F and HRCA 124 of 155
BurnTear Improvement Scale (JNM)val122+ ------------------------------------------------------------- Percentiles Smallest 1% 0 0 5% 0 0 10% 0 0 Obs 208 25% 0 0 Sum of Wgt. 208 50% 0 Mean 1.168269 Largest Std. Dev. 1.449822 75% 2 4 90% 4 4 Variance 2.101983 95% 4 4 Skewness .8109805 99% 4 4 Kurtosis 2.13514 SCALE DESCRIPTION This scale uses a combination of medical record review data elements (indicators defined within the top 30th percentile) and administrative survey items (see list below) to create a summative index of four items cap- turing the facility's tendency to engage in assess- ment and goal setting activities to promote good skin care strategies. The numerical value represented by the scale score is the count of the number of items present. The items included form a highly internally consistent set (KR20=0.84). ITEMS IN SCALE item varlab qi1t MRR 1.t record of assess-burns, abrasions qi4bt MRR 4b.t goals for improv-burns, abras qi4ct MRR 4c.t goals for prevent-burns, abras qi4dt MRR 4d.t nurse interven-burns, abrasions LEVEL-1 QIs qi varlab none LEVEL-2 QIs qi varlab BUR0X Burns abrasions bruises (MEGAQI)

Abt Associates Inc., Brown Univ. Appendix F and HRCA 125 of 155
NoActivt Improvement Scale (JNM)val123+ ------------------------------------------------------------- Percentiles Smallest 1% 0 0 5% 0 0 10% 0 0 Obs 208 25% 0 0 Sum of Wgt. 208 50% 1 Mean 1.1875 Largest Std. Dev. 1.389553 75% 2 4 90% 3 4 Variance 1.930857 95% 4 4 Skewness .7883846 99% 4 4 Kurtosis 2.211934 SCALE DESCRIPTION This scale uses a combination of medical record review data elements (indicators defined within the top 30th percentile) and administrative survey items (see list below) to create a summative index of four items cap- turing the facility's tendency to engage in assess- ment and goal setting activities to promote social engagement or activity participation. The numerical value represented by the scale score is the count of the number of items present. The items included form a highly internally consistent set (KR20=0.80). ITEMS IN SCALE item varlab qi1u MRR 1.u record of assess-soc isolation qi4bu MRR 4b.u goals for improv-soc isolation qi4cu MRR 4c.u goals for prevent-soc isolation qi4du MRR 4d.u nurse interven-social isolation LEVEL-1 QIs qi varlab none LEVEL-2 QIs qi varlab SOC02 Little or no activities (CHSRA)

Abt Associates Inc., Brown Univ. Appendix F and HRCA 126 of 155
PT FTE /100 Beds (BERG) VAL146+ ------------------------------------------------------------- Percentiles Smallest 1% 0 0 5% 0 0 10% 0 0 Obs 193 25% 0 0 Sum of Wgt. 193 50% .7407407 Mean 1.771261 Largest Std. Dev. 2.60463 75% 2.33125 9.129465 90% 5.55147 10.22727 Variance 6.784097 95% 7.85 12.5 Skewness 1.965342 99% 12.5 13.51351 Kurtosis 6.769558 SCALE DESCRIPTION This scale measures the facility's level of physical therapist staffing, providing the number of full-time equivalents (FTE) per 100 beds. Higher values imply a greater number of PTs are available per resident. (Internal consistency reliability not applicable). ITEMS IN SCALE item varlab as5ea AS 5ea. phys therap hours worked in period as5a AS 5a. length of pay period ass1 AS s1. how many beds LEVEL-1 QIs qi varlab WAL0X Walking performance (MEGAQI) LEVEL-2 QIs qi varlab ADL01 ADL decline (CHSRA) ADL02 ADL dec. following imprvnt (MEGAQI) ADL03 ADL imprvmnt in res. w/capacity (MEGAQI) MOB01 Mobility decline (LTCQ)

Abt Associates Inc., Brown Univ. Appendix F and HRCA 127 of 155
Total Involvement in Care Planning (SC) val147+ ------------------------------------------------------------- Percentiles Smallest 1% 0 0 5% 1 0 10% 2 0 Obs 206 25% 3 0 Sum of Wgt. 206 50% 4 Mean 3.859223 Largest Std. Dev. 1.547488 75% 5 6 90% 6 6 Variance 2.394719 95% 6 6 Skewness -.2785486 99% 6 6 Kurtosis 2.312735 SCALE DESCRIPTION This scale captures the representation of six different clinical and ancillary caregivers on the care planning team. The six areas are listed below. The numerical value represented by this scale is the count of the six professionals represented on the care planning team. Higher values imply greater breadth and in- clusion in the care planning process. The items included in this scale form a moderately internally consistent set (KR20=0.62). ITEMS IN SCALE item varlab as9a AS 9a. chg nurse contrib to pat care plan as9b AS 9b. rns contrib to patient care plan as9c AS 9c. lpns contrib to patient care plan as9d AS 9d. r\r aides contrib to pat care plan as9e AS 9e. therap contrib to patient care plan as9f AS 9f. cnas contrib to patient care plan LEVEL-1 QIs qi varlab ADL01 ADL decline (CHSRA) ADL02 ADL dec. following imprvnt (MEGAQI) ADL03 ADL imprvmnt in res. w/capacity (MEGAQI) FAL01 Falls increase (LTCQ) MOB01 Mobility decline (LTCQ) WGT01 Weight loss (LTCQ) WAL0X Walking performance (MEGAQI) LEVEL-2 QIs qi varlab
Abt Associates Inc., Brown Univ. Appendix F and HRCA 128 of 155
MOD03 Depression new or worse (LTCQ) BEH01 Behavior high & low risk (CHSRA) BEH02 Behavior high risk (CHSRA) BEH03 Behavior low risk (CHSRA) COG01 Cognition worsening (LTCQ) COM01 Communication worsening (LTCQ) PRU01 PU high & low risk (CHSRA) PRU02 PU high risk (CHSRA) PRU03 PU low risk (CHSRA) PRU04 PU onset or worsening (LTCQ) DepWOTx Depression without treatment (CHSRA)
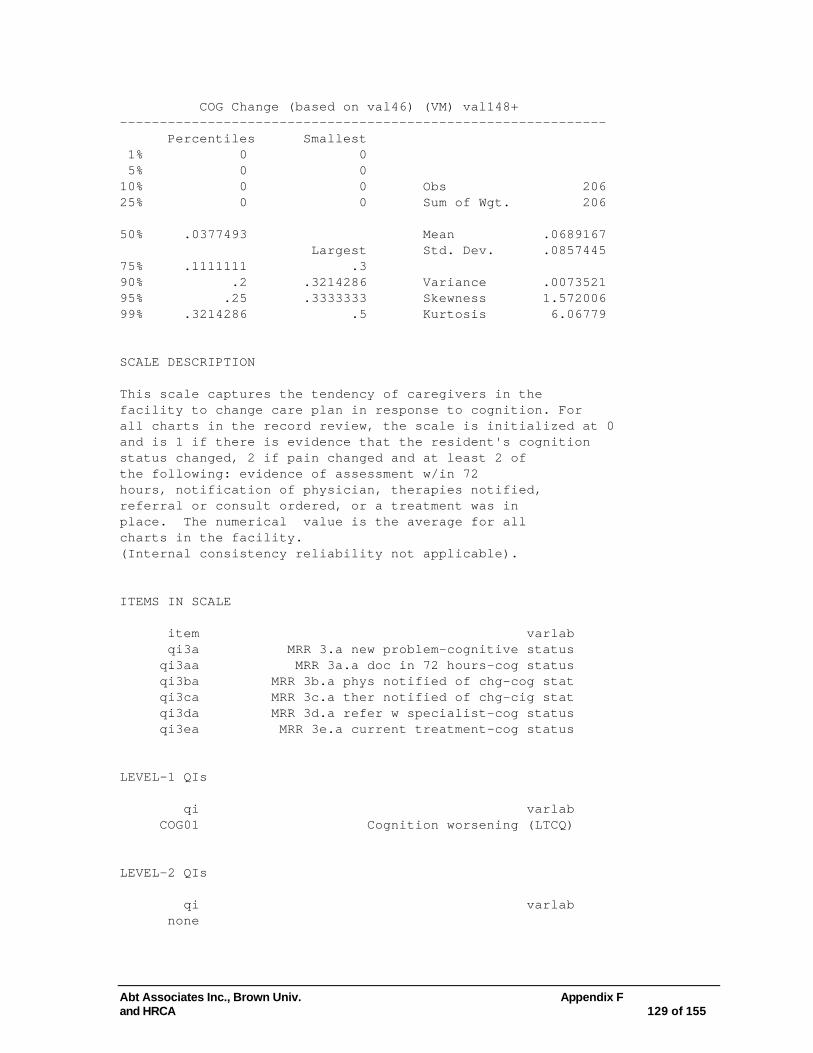
Abt Associates Inc., Brown Univ. Appendix F and HRCA 129 of 155
COG Change (based on val46) (VM) val148+ ------------------------------------------------------------- Percentiles Smallest 1% 0 0 5% 0 0 10% 0 0 Obs 206 25% 0 0 Sum of Wgt. 206 50% .0377493 Mean .0689167 Largest Std. Dev. .0857445 75% .1111111 .3 90% .2 .3214286 Variance .0073521 95% .25 .3333333 Skewness 1.572006 99% .3214286 .5 Kurtosis 6.06779 SCALE DESCRIPTION This scale captures the tendency of caregivers in the facility to change care plan in response to cognition. For all charts in the record review, the scale is initialized at 0 and is 1 if there is evidence that the resident's cognition status changed, 2 if pain changed and at least 2 of the following: evidence of assessment w/in 72 hours, notification of physician, therapies notified, referral or consult ordered, or a treatment was in place. The numerical value is the average for all charts in the facility. (Internal consistency reliability not applicable). ITEMS IN SCALE item varlab qi3a MRR 3.a new problem-cognitive status qi3aa MRR 3a.a doc in 72 hours-cog status qi3ba MRR 3b.a phys notified of chg-cog stat qi3ca MRR 3c.a ther notified of chg-cig stat qi3da MRR 3d.a refer w specialist-cog status qi3ea MRR 3e.a current treatment-cog status LEVEL-1 QIs qi varlab COG01 Cognition worsening (LTCQ) LEVEL-2 QIs qi varlab none

Abt Associates Inc., Brown Univ. Appendix F and HRCA 130 of 155
COM Change (based on val46) (VM) val149+ ------------------------------------------------------------- Percentiles Smallest 1% 0 0 5% 0 0 10% 0 0 Obs 206 25% 0 0 Sum of Wgt. 206 50% 0 Mean .0193978 Largest Std. Dev. .0398052 75% .0333333 .1785714 90% .0689655 .2 Variance .0015845 95% .0909091 .2 Skewness 2.588993 99% .2 .2222222 Kurtosis 10.55169 SCALE DESCRIPTION This scale captures the tendency of caregivers in the facility to change care plan in response to changes in the resident's communicative skills. For all charts in the record review, the scale is initialized at 0 and is 1 if there is evidence that the resident's status changed, 2 if changed and at least 2 of the following: evidence of assessment w/in 72 hours, notification of physician, therapies notified, referral or consult ordered, or a treatment was in place. The numerical value is the average for all charts in the facility. (Internal consistency NA). ITEMS IN SCALE item varlab qi3b MRR 3.b new problem-communicatiion qi3ab MRR 3a.b doc in 72 hours-communication qi3bb MRR 3b.b phys notified of chg-communic qi3cb MRR 3c.b ther notified of chg-commun qi3db MRR 3d.b refer w specialist-commun qi3eb MRR 3e.b current treatment-communicatn LEVEL-1 QIs qi varlab COM01 Communication worsening (LTCQ) LEVEL-2 QIs qi varlab none

Abt Associates Inc., Brown Univ. Appendix F and HRCA 131 of 155
DEL Change (based on val46) (VM) val150+ ------------------------------------------------------------- Percentiles Smallest 1% 0 0 5% 0 0 10% 0 0 Obs 206 25% 0 0 Sum of Wgt. 206 50% 0 Mean .047219 Largest Std. Dev. .069094 75% .0740741 .2758621 90% .1333333 .28 Variance .004774 95% .1818182 .3333333 Skewness 2.313143 99% .28 .4666667 Kurtosis 10.85788 SCALE DESCRIPTION This scale captures the tendency of caregivers in the facility to change care plan in response to changes in the resident's delirium symptoms. For all charts in the record review, the scale is initialized at 0 and is 1 if there is evidence that the resident's status changed, 2 if changed and at least 2 of the following: evidence of assessment w/in 72 hours, notification of physician, therapies notified, referral or consult ordered, or a treatment was in place. The numerical value is the average for all charts in the facility. (Internal consistency NA). ITEMS IN SCALE item varlab qi3c MRR 3.c new problem-delirium qi3ac MRR 3a.c doc in 72 hours-delirium qi3bc MRR 3b.c phys notified of chg-delirium qi3cc MRR 3c.c ther notified of chg-delirium qi3dc MRR 3d.c refer w specialist-delirium qi3ec MRR 3e.c current treatment-delirium LEVEL-1 QIs qi varlab DEL0X Delirium not remitting (MEGAQI) LEVEL-2 QIs qi varlab none

Abt Associates Inc., Brown Univ. Appendix F and HRCA 132 of 155
MOD Change (based on val46) (VM) val151+ ------------------------------------------------------------- Percentiles Smallest 1% 0 0 5% 0 0 10% 0 0 Obs 206 25% 0 0 Sum of Wgt. 206 50% .0666667 Mean .0889105 Largest Std. Dev. .1020762 75% .137931 .3793103 90% .2413793 .4137931 Variance .0104195 95% .2962963 .44 Skewness 1.433355 99% .4137931 .5333334 Kurtosis 4.993957 SCALE DESCRIPTION This scale captures the tendency of caregivers in the facility to change care plan in response to changes in the resident's affective functioning. For all charts in the record review, the scale is initialized at 0 and is 1 if there is evidence that the resident's status changed, 2 if changed and at least 2 of the following: evidence of assessment w/in 72 hours, notification of physician, therapies notified, referral or consult ordered, or a treatment was in place. The numerical value is the average for all charts in the facility. (Internal consistency NA). ITEMS IN SCALE item varlab qi3d MRR 3.d new problem-depression qi3ad MRR 3a.d doc in 72 hours-depression qi3bd MRR 3b.d phys notified of chg-depression qi3cd MRR 3c.d ther notified of chg-depression qi3dd MRR 3d.d refer w specialist-depression qi3ed MRR 3e.d current treatment-depression LEVEL-1 QIs qi varlab MOD03 Depression new or worse (LTCQ) DepWOTx Depression without treatment (CHSRA) LEVEL-2 QIs qi varlab none

Abt Associates Inc., Brown Univ. Appendix F and HRCA 133 of 155
BEH Change (based on val46) (VM) val152+ ------------------------------------------------------------- Percentiles Smallest 1% 0 0 5% 0 0 10% 0 0 Obs 206 25% 0 0 Sum of Wgt. 206 50% .0714286 Mean .0932223 Largest Std. Dev. .1013801 75% .137931 .3928571 90% .2413793 .4 Variance .0102779 95% .3 .4666667 Skewness 1.325648 99% .4 .5185185 Kurtosis 4.802193 SCALE DESCRIPTION This scale captures the tendency of caregivers in the facility to change care plan in response to changes in the resident's behavioral functioning. For all charts in the record review, the scale is initialized at 0 and is 1 if there is evidence that the resident's status changed, 2 if changed and at least 2 of the following: evidence of assessment w/in 72 hours, notification of physician, therapies notified, referral or consult ordered, or a treatment was in place. The numerical value is the average for all charts in the facility. (Internal consistency NA). ITEMS IN SCALE item varlab qi3e MRR 3.e new problem-behav problems qi3ae MRR 3a.e doc in 72 hours-behav problems qi3be MRR 3b.e phys notified of chg-behav probs qi3ce MRR 3c.e ther notified of chg-behav probs qi3de MRR 3d.e refer w specialist-behav probs qi3ee MRR 3e.e current treatment-behav prob LEVEL-1 QIs qi varlab BEH01 Behavior high & low risk (CHSRA) BEH02 Behavior high risk (CHSRA) BEH03 Behavior low risk (CHSRA) BEH04 Behavior worsening (LTCQ) LEVEL-2 QIs qi varlab none

Abt Associates Inc., Brown Univ. Appendix F and HRCA 134 of 155
ADI Change (based on val46) (VM) val153+ ------------------------------------------------------------- Percentiles Smallest 1% 0 0 5% 0 0 10% 0 0 Obs 206 25% 0 0 Sum of Wgt. 206 50% .0384615 Mean .1204369 Largest Std. Dev. .1803624 75% .1481481 .6896552 90% .4074074 .75 Variance .0325306 95% .5909091 .7857143 Skewness 2.000967 99% .75 .8571429 Kurtosis 6.49604 SCALE DESCRIPTION This scale captures the tendency of caregivers in the facility to change care plan in response to changes in improving ADL status of the resident. For all charts in the record review, the scale is initialized at 0 and is 1 if there is evidence that the resident's status changed, 2 if changed and at least 2 of the following: evidence of assessment w/in 72 hours, notification of physician, therapies notified, referral or consult ordered, or a treatment was in place. The numerical value is the average for all charts in the facility. (Internal consistency NA). ITEMS IN SCALE item varlab qi3f MRR 3.f new problem-adl improvement qi3af MRR 3a.f doc in 72 hours-adl improvement qi3bf MRR 3b.f phys notified of chg-adl improv qi3cf MRR 3c.f ther notified of chg-adl improv qi3df MRR 3d.f refer w specialist-adl improve qi3ef MRR 3e.f current treatment-adl improve LEVEL-1 QIs qi varlab ADL03 ADL imprvmnt in res. w/capacity (MEGAQI) LEVEL-2 QIs qi varlab none
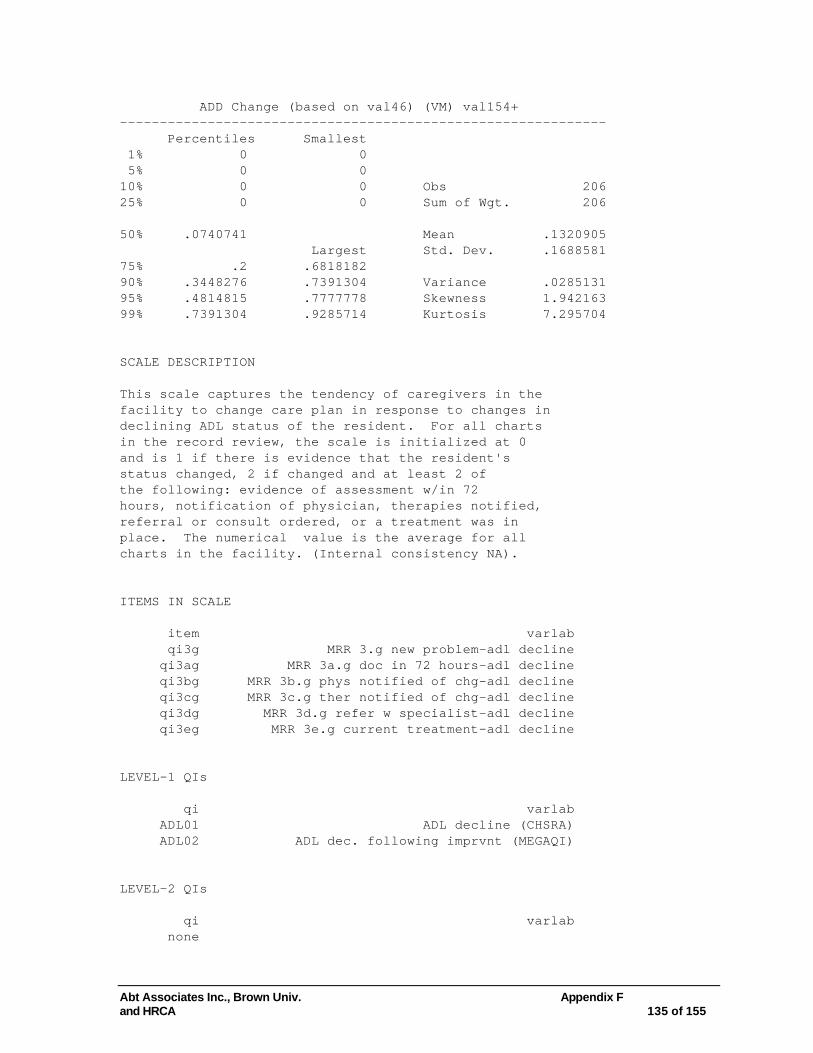
Abt Associates Inc., Brown Univ. Appendix F and HRCA 135 of 155
ADD Change (based on val46) (VM) val154+ ------------------------------------------------------------- Percentiles Smallest 1% 0 0 5% 0 0 10% 0 0 Obs 206 25% 0 0 Sum of Wgt. 206 50% .0740741 Mean .1320905 Largest Std. Dev. .1688581 75% .2 .6818182 90% .3448276 .7391304 Variance .0285131 95% .4814815 .7777778 Skewness 1.942163 99% .7391304 .9285714 Kurtosis 7.295704 SCALE DESCRIPTION This scale captures the tendency of caregivers in the facility to change care plan in response to changes in declining ADL status of the resident. For all charts in the record review, the scale is initialized at 0 and is 1 if there is evidence that the resident's status changed, 2 if changed and at least 2 of the following: evidence of assessment w/in 72 hours, notification of physician, therapies notified, referral or consult ordered, or a treatment was in place. The numerical value is the average for all charts in the facility. (Internal consistency NA). ITEMS IN SCALE item varlab qi3g MRR 3.g new problem-adl decline qi3ag MRR 3a.g doc in 72 hours-adl decline qi3bg MRR 3b.g phys notified of chg-adl decline qi3cg MRR 3c.g ther notified of chg-adl decline qi3dg MRR 3d.g refer w specialist-adl decline qi3eg MRR 3e.g current treatment-adl decline LEVEL-1 QIs qi varlab ADL01 ADL decline (CHSRA) ADL02 ADL dec. following imprvnt (MEGAQI) LEVEL-2 QIs qi varlab none

Abt Associates Inc., Brown Univ. Appendix F and HRCA 136 of 155
MOB Change (based on val46) (VM) val155+ ------------------------------------------------------------- Percentiles Smallest 1% 0 0 5% 0 0 10% 0 0 Obs 206 25% .0333333 0 Sum of Wgt. 206 50% .124359 Mean .2109656 Largest Std. Dev. .2575461 75% .2857143 .9166667 90% .6 1.033333 Variance .06633 95% .7586207 1.037037 Skewness 1.894465 99% 1.033333 1.607143 Kurtosis 7.474715 SCALE DESCRIPTION This scale captures the tendency of caregivers in the facility to change care plan in response to changes in the resident's level of mobility. For all charts in the record review, the scale is initialized at 0 and is 1 if there is evidence that the resident's status changed, 2 if changed and at least 2 of the following: evidence of assessment w/in 72 hours, notification of physician, therapies notified, referral or consult ordered, or a treatment was in place. The numerical value is the average for all charts in the facility. (Internal consistency NA). ITEMS IN SCALE item varlab qi3h MRR 3.h new problem-mobolity\walking qi3ah MRR 3a.h doc in 72 hours-mobility\walk qi3bh MRR 3b.h phys notified of chg-mobil\walk qi3ch MRR 3c.h ther notified of chg-mobil\walk qi3dh MRR 3d.h refer w specialist-mobil\walk qi3eh MRR 3e.h current treatment-mobil\walking LEVEL-1 QIs qi varlab MOB01 Mobility decline (LTCQ) WAL0X Walking performance (MEGAQI) LEVEL-2 QIs qi varlab none

Abt Associates Inc., Brown Univ. Appendix F and HRCA 137 of 155
FAL Change (based on val46) (VM) val156+ ------------------------------------------------------------- Percentiles Smallest 1% 0 0 5% 0 0 10% 0 0 Obs 206 25% .0344828 0 Sum of Wgt. 206 50% .1155556 Mean .1468956 Largest Std. Dev. .1351112 75% .2307692 .4761905 90% .3448276 .5172414 Variance .018255 95% .4137931 .6428571 Skewness 1.0697 99% .5172414 .6785714 Kurtosis 4.13215 SCALE DESCRIPTION This scale captures the tendency of caregivers in the facility to change care plan in response to changes in the resident's risk for a fall. For all charts in the record review, the scale is initialized at 0 and is 1 if there is evidence that the resident's status changed, 2 if changed and at least 2 of the following: evidence of assessment w/in 72 hours, notification of physician, therapies notified, referral or consult ordered, or a treatment was in place. The numerical value is the average for all charts in the facility. (Internal consistency NA). ITEMS IN SCALE item varlab qi3i MRR 3.i new problem w delirium qi3ai MRR 3a.i doc in 72 hours-falls qi3bi MRR 3b.i phys notified of chg-falls qi3ci MRR 3c.i ther notified of chg-falls qi3di MRR 3d.i refer w specialist-falls qi3ei MRR 3e.i current treatment-falls LEVEL-1 QIs qi varlab FAL01 Falls increase (LTCQ) LEVEL-2 QIs qi varlab none

Abt Associates Inc., Brown Univ. Appendix F and HRCA 138 of 155
DRG Change (based on val46) (VM) val157+ ------------------------------------------------------------- Percentiles Smallest 1% 0 0 5% 0 0 10% 0 0 Obs 206 25% 0 0 Sum of Wgt. 206 50% .0344828 Mean .0555901 Largest Std. Dev. .0722503 75% .08 .2962963 90% .1428571 .3 Variance .0052201 95% .2105263 .3043478 Skewness 1.547343 99% .3 .3103448 Kurtosis 5.191354 SCALE DESCRIPTION This scale captures the tendency of caregivers in the facility to change care plan in response to changes in the residents use of antipsychotic meds. For all charts in the record review, the scale is initialized at 0 and is 1 if there is evidence that the resident's status changed, 2 if changed and at least 2 of the following: evidence of assessment w/in 72 hours, notification of physician, therapies notified, referral or consult ordered, or a treatment was in place. The numerical value is the average for all charts in the facility. (Internal consistency NA). ITEMS IN SCALE item varlab qi3j MRR 3.j new problem-drugs qi3aj MRR 3a.j doc in 72 hours-drugs qi3bj MRR 3b.j phys notified of chg-drugs qi3cj MRR 3c.j ther notified of chg-drugs qi3dj MRR 3d.j refer w specialist-drugs qi3ej MRR 3e.j current treatment-drugs LEVEL-1 QIs qi varlab DRG01 Antipsychotic high & low risk (CHSRA) DRG02 Antipsychotic high risk (CHSRA) DRG03 Antipsychotic low risk (CHSRA) LEVEL-2 QIs qi varlab none
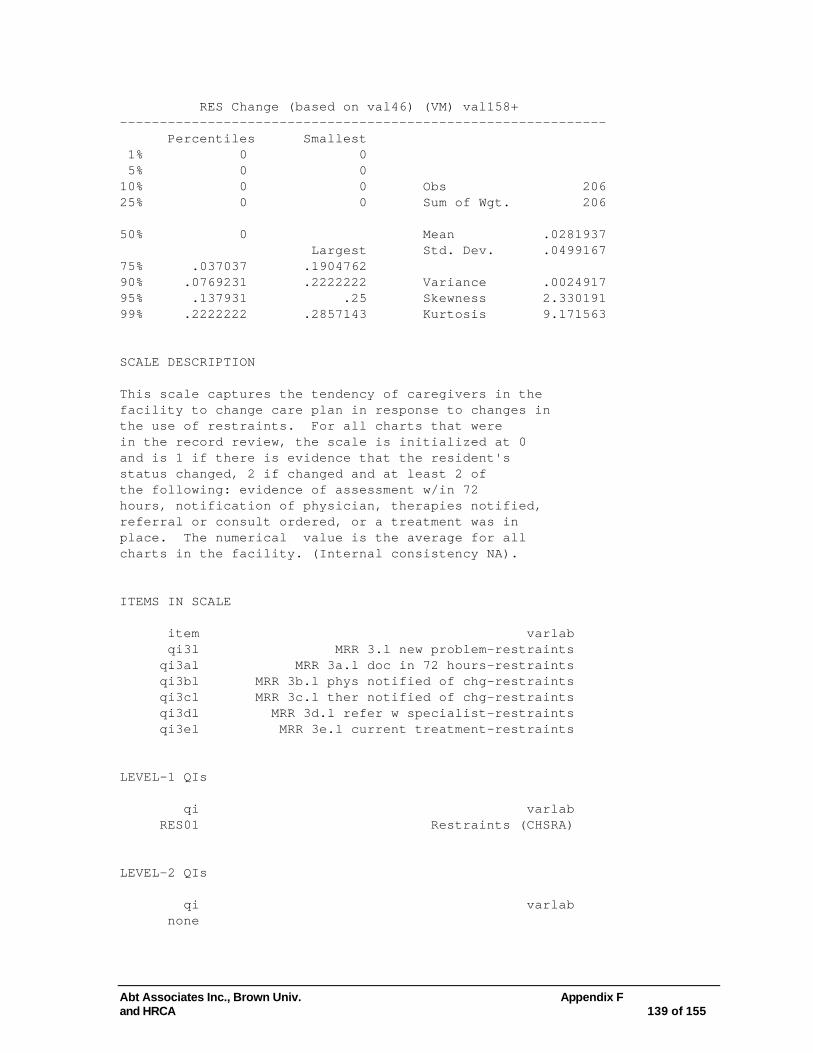
Abt Associates Inc., Brown Univ. Appendix F and HRCA 139 of 155
RES Change (based on val46) (VM) val158+ ------------------------------------------------------------- Percentiles Smallest 1% 0 0 5% 0 0 10% 0 0 Obs 206 25% 0 0 Sum of Wgt. 206 50% 0 Mean .0281937 Largest Std. Dev. .0499167 75% .037037 .1904762 90% .0769231 .2222222 Variance .0024917 95% .137931 .25 Skewness 2.330191 99% .2222222 .2857143 Kurtosis 9.171563 SCALE DESCRIPTION This scale captures the tendency of caregivers in the facility to change care plan in response to changes in the use of restraints. For all charts that were in the record review, the scale is initialized at 0 and is 1 if there is evidence that the resident's status changed, 2 if changed and at least 2 of the following: evidence of assessment w/in 72 hours, notification of physician, therapies notified, referral or consult ordered, or a treatment was in place. The numerical value is the average for all charts in the facility. (Internal consistency NA). ITEMS IN SCALE item varlab qi3l MRR 3.l new problem-restraints qi3al MRR 3a.l doc in 72 hours-restraints qi3bl MRR 3b.l phys notified of chg-restraints qi3cl MRR 3c.l ther notified of chg-restraints qi3dl MRR 3d.l refer w specialist-restraints qi3el MRR 3e.l current treatment-restraints LEVEL-1 QIs qi varlab RES01 Restraints (CHSRA) LEVEL-2 QIs qi varlab none

Abt Associates Inc., Brown Univ. Appendix F and HRCA 140 of 155
NUT Change (based on val46) (VM) val159+ ------------------------------------------------------------- Percentiles Smallest 1% 0 0 5% 0 0 10% 0 0 Obs 206 25% 0 0 Sum of Wgt. 206 50% 0 Mean .03068 Largest Std. Dev. .0536685 75% .0666667 .2068966 90% .1071429 .2068966 Variance .0028803 95% .1538462 .2307692 Skewness 1.879285 99% .2068966 .2333333 Kurtosis 5.951236 SCALE DESCRIPTION This scale captures the tendency of caregivers in the facility to change care plan in response to changes in the nutritional status of the resident. For all charts in the record review, the scale is initialized at 0 and is 1 if there is evidence that the resident's status changed, 2 if changed and at least 2 of the following: evidence of assessment w/in 72 hours, notification of physician, therapies notified, referral or consult ordered, or a treatment was in place. The numerical value is the average for all charts in the facility. (Internal consistency NA). ITEMS IN SCALE item varlab qi3m MRR 3.m new problem-tube feeding qi3am MRR 3a.m doc in 72 hours-tube feeding qi3bm MRR 3b.m phys notified of chg-tube feeding qi3cm MRR 3c.m ther notified of chg-tube feeding qi3dm MRR 3d.m refer w specialist-tube feeding qi3em MRR 3e.m current treatment-tube feeding LEVEL-1 QIs qi varlab NUT01 Tube feeding (RAMSEY) LEVEL-2 QIs qi varlab none

Abt Associates Inc., Brown Univ. Appendix F and HRCA 141 of 155
WGT Change (based on val46) (VM) val160+ ------------------------------------------------------------- Percentiles Smallest 1% 0 0 5% 0 0 10% 0 0 Obs 206 25% .0344828 0 Sum of Wgt. 206 50% .137931 Mean .1514251 Largest Std. Dev. .1327962 75% .2333333 .5 90% .3214286 .5714286 Variance .0176348 95% .3809524 .6 Skewness 1.009756 99% .5714286 .7 Kurtosis 4.186769 SCALE DESCRIPTION This scale captures the tendency of caregivers in the facility to change care plan in response to changes in the resident's weight or weight loss. For all charts in the record review, the scale is initialized at 0 and is 1 if there is evidence that the resident's status changed, 2 if changed and at least 2 of the following: evidence of assessment w/in 72 hours, notification of physician, therapies notified, referral or consult ordered, or a treatment was in place. The numerical value is the average for all charts in the facility. (Internal consistency NA). ITEMS IN SCALE item varlab qi3n MRR 3.n new problem-undernutrition qi3an MRR 3a.n doc in 72 hours-undernutrition qi3bn MRR 3b.n phys notified of chg-undernutrit qi3cn MRR 3c.n ther notified of chg-undernutrit qi3dn MRR 3d.n refer w specialist-undernutrition qi3en MRR 3e.n current treatment-undernutrition LEVEL-1 QIs qi varlab BMI0X Low BMI (MEGAQI) WGT01 Weight loss (LTCQ) LEVEL-2 QIs qi varlab none

Abt Associates Inc., Brown Univ. Appendix F and HRCA 142 of 155
CAT Change (based on val46) (VM) val161+ ------------------------------------------------------------- Percentiles Smallest 1% 0 0 5% 0 0 10% 0 0 Obs 206 25% 0 0 Sum of Wgt. 206 50% .037037 Mean .0696104 Largest Std. Dev. .0926728 75% .1071429 .3703704 90% .2068966 .3793103 Variance .0085883 95% .2413793 .44 Skewness 1.796667 99% .3793103 .5 Kurtosis 6.729243 SCALE DESCRIPTION This scale captures the tendency of caregivers in the facility to change care plan in response to changes in the resident's catheter. For all charts that were in the record review, the scale is initialized at 0 and is 1 if there is evidence that the resident's status changed, 2 if changed and at least 2 of the following: evidence of assessment w/in 72 hours, notification of physician, therapies notified, referral or consult ordered, or a treatment was in place. The numerical value is the average for all charts in the facility. (Internal consistency NA). ITEMS IN SCALE item varlab qi3o MRR 3.o new problem-urinary catheter qi3ao MRR 3a.o doc in 72 hours-urinary catheter qi3bo MRR 3b.o phys notified of chg-urinary cath qi3co MRR 3c.o ther notified of chg-urinary cath qi3do MRR 3d.o refer w specialist-urinary catheter qi3eo MRR 3e.o current treatment-urinary catheter LEVEL-1 QIs qi varlab CAT01 Indwelling urin cath (LTCQ) LEVEL-2 QIs qi varlab none

Abt Associates Inc., Brown Univ. Appendix F and HRCA 143 of 155
BLA Change (based on val46) (VM) val162+ ------------------------------------------------------------- Percentiles Smallest 1% 0 0 5% 0 0 10% 0 0 Obs 206 25% 0 0 Sum of Wgt. 206 50% 0 Mean .0343736 Largest Std. Dev. .05081 75% .0666667 .173913 90% .1071429 .1785714 Variance .0025817 95% .1428571 .2068966 Skewness 1.853156 99% .1785714 .3181818 Kurtosis 7.599785 SCALE DESCRIPTION This scale captures the tendency of caregivers in the facility to change care plan in response to changes in the resident's level of bladder continence. All Charts in the record review, the scale is initialized at 0 and is 1 if there is evidence that the resident's status changed, 2 if changed and at least 2 of the following: evidence of assessment w/in 72 hours, notification of physician, therapies notified, referral or consult ordered, or a treatment was in place. The numerical value is the average for all charts in the facility. (Internal consistency NA). ITEMS IN SCALE item varlab qi3p MRR 3.p new problem-bladder continence qi3ap MRR 3a.p doc in 72 hours-bladder contin qi3bp MRR 3b.p phys notif of chg-bladder contin qi3cp MRR 3c.p ther notif of chg-bladder contin qi3dp MRR 3d.p refer w specialist-bladder contin qi3ep MRR 3e.p current treatment-bladder contin LEVEL-1 QIs qi varlab CNT03 Bladder incont decline (LTCQ) CNT01 Incontinence hi & lo risk (CHSRA) CNT05 Incontinence high risk (CHSRA) CNT06 Incontinence low risk (CHSRA) LEVEL-2 QIs qi varlab none

Abt Associates Inc., Brown Univ. Appendix F and HRCA 144 of 155
BOW Change (based on val46) (VM) val163+ ------------------------------------------------------------- Percentiles Smallest 1% 0 0 5% 0 0 10% 0 0 Obs 208 25% 0 0 Sum of Wgt. 208 50% 0 Mean .0116268 Largest Std. Dev. .0269791 75% 0 .1153846 90% .04 .1333333 Variance .0007279 95% .0714286 .1363636 Skewness 2.837367 99% .1333333 .16 Kurtosis 11.87326 SCALE DESCRIPTION This scale captures the tendency of caregivers in the facility to change care plan in response to changes in the resident's level of bowel continence. For all charts in the record review, the scale is initialized at 0 and is 1 if there is evidence that the resident's status changed, 2 if changed and at least 2 of the following: evidence of assessment w/in 72 hours, notification of physician, therapies notified, referral or consult ordered, or a treatment was in place. The numerical value is the average for all charts in the facility. (Internal consistency NA). ITEMS IN SCALE item varlab qi3q MRR 3.q new problem-bowel continence qi3aq MRR 3a.q doc in 72 hours-bowel contin qi3bq MRR 3b.q phys notif of chg-bowel contin qi3cq MRR 3c.q ther notif of chg-bowel contin qi3dq MRR 3d.q refer w specialist-bowel contin qi3eq MRR 3e.q current treatment-bowel contin LEVEL-1 QIs qi varlab CNT02 Bowel incont decline (LTCQ) CNT01 Incontinence hi & lo risk (CHSRA) CNT05 Incontinence high risk (CHSRA) CNT06 Incontinence low risk (CHSRA) LEVEL-2 QIs qi varlab none
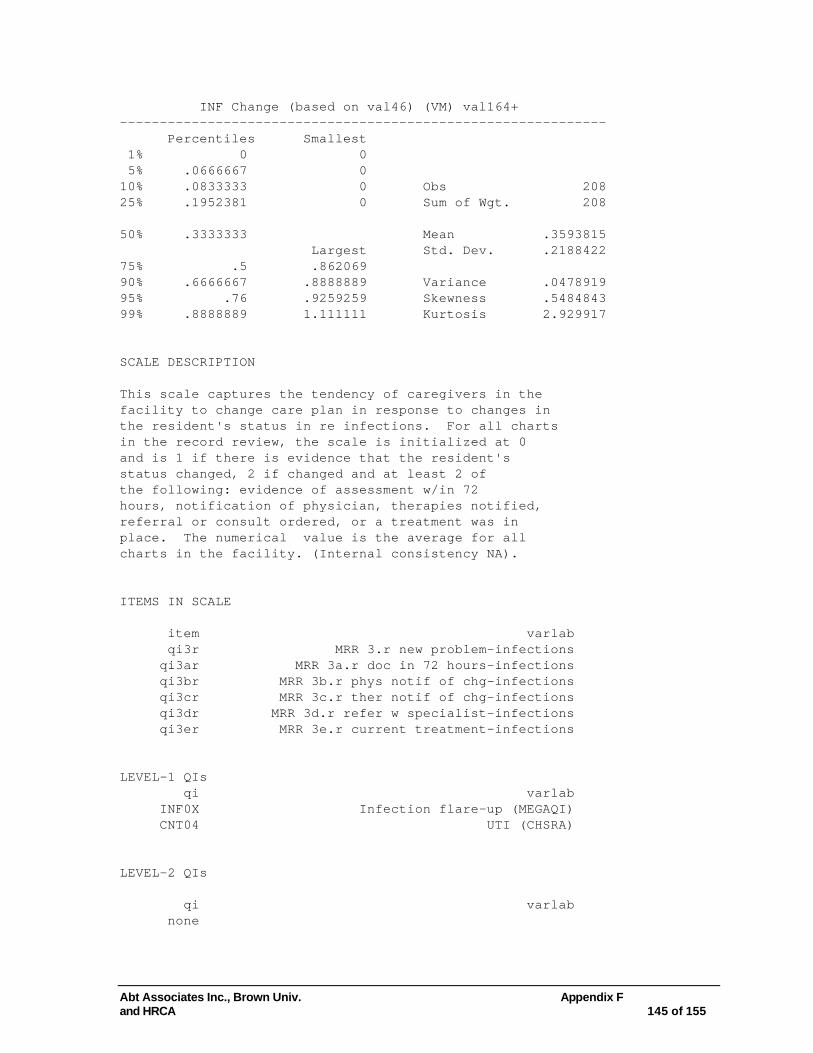
Abt Associates Inc., Brown Univ. Appendix F and HRCA 145 of 155
INF Change (based on val46) (VM) val164+ ------------------------------------------------------------- Percentiles Smallest 1% 0 0 5% .0666667 0 10% .0833333 0 Obs 208 25% .1952381 0 Sum of Wgt. 208 50% .3333333 Mean .3593815 Largest Std. Dev. .2188422 75% .5 .862069 90% .6666667 .8888889 Variance .0478919 95% .76 .9259259 Skewness .5484843 99% .8888889 1.111111 Kurtosis 2.929917 SCALE DESCRIPTION This scale captures the tendency of caregivers in the facility to change care plan in response to changes in the resident's status in re infections. For all charts in the record review, the scale is initialized at 0 and is 1 if there is evidence that the resident's status changed, 2 if changed and at least 2 of the following: evidence of assessment w/in 72 hours, notification of physician, therapies notified, referral or consult ordered, or a treatment was in place. The numerical value is the average for all charts in the facility. (Internal consistency NA). ITEMS IN SCALE item varlab qi3r MRR 3.r new problem-infections qi3ar MRR 3a.r doc in 72 hours-infections qi3br MRR 3b.r phys notif of chg-infections qi3cr MRR 3c.r ther notif of chg-infections qi3dr MRR 3d.r refer w specialist-infections qi3er MRR 3e.r current treatment-infections LEVEL-1 QIs qi varlab INF0X Infection flare-up (MEGAQI) CNT04 UTI (CHSRA) LEVEL-2 QIs qi varlab none

Abt Associates Inc., Brown Univ. Appendix F and HRCA 146 of 155
PRU Change (based on val46) (VM) val165+ ------------------------------------------------------------- Percentiles Smallest 1% 0 0 5% 0 0 10% 0 0 Obs 208 25% .0408333 0 Sum of Wgt. 208 50% .137931 Mean .1633256 Largest Std. Dev. .1458643 75% .2320513 .5862069 90% .35 .75 Variance .0212764 95% .4137931 .7586207 Skewness 1.407435 99% .75 .7619048 Kurtosis 5.838603 SCALE DESCRIPTION This scale captures the tendency of caregivers in the facility to change care plan in response to changes in the resident's pressure sores. For all charts in the record review, the scale is initialized at 0 and is 1 if there is evidence that the resident's status changed, 2 if changed and at least 2 of the following: evidence of assessment w/in 72 hours, notification of physician, therapies notified, referral or consult ordered, or a treatment was in place. The numerical value is the average for all charts in the facility. (Internal consistency NA). ITEMS IN SCALE item varlab qi3s MRR 3.s new problem-pressure ulcers qi3as MRR 3a.s doc in 72 hours-pressure ulcers qi3bs MRR 3b.s phys notif of chg-pressure ulcers qi3cs MRR 3c.s ther notif of chg-pressure ulcers qi3ds MRR 3d.s refer w specialist-pressure ulcers qi3es MRR 3e.s current treatment-pressure ulcers LEVEL-1 QIs qi varlab PRU01 PU high & low risk (CHSRA) PRU02 PU high risk (CHSRA) PRU03 PU low risk (CHSRA) PRU04 PU onset or worsening (LTCQ) LEVEL-2 QIs qi varlab none

Abt Associates Inc., Brown Univ. Appendix F and HRCA 147 of 155
BUR Change (based on val46) (VM) val166+ ------------------------------------------------------------- Percentiles Smallest 1% 0 0 5% 0 0 10% 0 0 Obs 208 25% .0344828 0 Sum of Wgt. 208 50% .0909091 Mean .1331115 Largest Std. Dev. .1399105 75% .1923077 .5238096 90% .3043478 .5666667 Variance .019575 95% .4583333 .6071429 Skewness 1.594947 99% .5666667 .7916667 Kurtosis 5.933088 SCALE DESCRIPTION This scale captures the tendency of caregivers in the facility to change care plan in response to changes in the resident's skin condition. For all charts that were in the record review, the scale is initialized at 0 and is 1 if there is evidence that the resident's status changed, 2 if changed and at least 2 of the following: evidence of assessment w/in 72 hours, notification of physician, therapies notified, referral or consult ordered, or a treatment was in place. The numerical value is the average for all charts in the facility. (Internal consistency NA). ITEMS IN SCALE item varlab qi3t MRR 3.t new problem-burns, abrasions qi3at MRR 3a.t doc in 72 hours-burns, abrasions qi3bt MRR 3b.t phys notif of chg-burns, abras qi3ct MRR 3c.t ther notif of chg-burns, abras qi3dt MRR 3d.t refer w specialist-burns, abrasions qi3et MRR 3e.t current treatment-burns, abrasions LEVEL-1 QIs qi varlab BUR0X Burns abrasions bruises (MEGAQI) LEVEL-2 QIs qi varlab none

Abt Associates Inc., Brown Univ. Appendix F and HRCA 148 of 155
SOC Change (based on val46) (VM) val167+ ------------------------------------------------------------- Percentiles Smallest 1% 0 0 5% 0 0 10% 0 0 Obs 208 25% 0 0 Sum of Wgt. 208 50% 0 Mean .0204198 Largest Std. Dev. .0456744 75% 0 .1818182 90% .0714286 .2142857 Variance .0020862 95% .1333333 .2173913 Skewness 2.824972 99% .2142857 .2692308 Kurtosis 11.48496 SCALE DESCRIPTION This scale captures the tendency of caregivers in the facility to change care plan in response to changes in the resident's level of social engagement. All charts in the record review, the scale is initialized at 0 and is 1 if there is evidence that the resident's status changed, 2 if changed and at least 2 of the following: evidence of assessment w/in 72 hours, notification of physician, therapies notified, referral or consult ordered, or a treatment was in place. The numerical value is the average for all charts in the facility. (Internal consistency NA). ITEMS IN SCALE item varlab qi3u MRR 3.u new problem-social isolation qi3au MRR 3a.u doc in 72 hours-social isolation qi3bu MRR 3b.u phys notif of chg-soc isolation qi3cu MRR 3c.u ther notif of chg-soc isolation qi3du MRR 3d.u refer w specialist-socila isolation qi3eu MRR 3e.u current treatment-social isolation LEVEL-1 QIs qi varlab SOC02 Little or no activities (CHSRA) LEVEL-2 QIs qi varlab none

Abt Associates Inc., Brown Univ. Appendix F and HRCA 149 of 155
Match of K2 & Care Plan (MATCHPLAN) (VM) VAL168+ ------------------------------------------------------------- Percentiles Smallest 1% .1333333 .08 5% .2758621 .1 10% .32 .1333333 Obs 206 25% .4333333 .1904762 Sum of Wgt. 206 50% .5536399 Mean .5734583 Largest Std. Dev. .1953091 75% .7142857 .9666666 90% .862069 1 Variance .0381456 95% .8928571 1 Skewness .1059362 99% 1 1 Kurtosis 2.509303 SCALE DESCRIPTION This scale captures the tendency of the care plan to match data recorded elsewhere in the medical chart. The numerical value for this score is the proportion of charts with pain noted as a problem in the chart and also have evidence of pain care planning with regards to pain. (Internal consistency reliability not applicable). ITEMS IN SCALE item varlab qi2k MRR 2.k doc problem-pain qi4K qi4ak MRR 4a.k recent update-pain qi4bK qi4ck MRR 4c.k goals for prevent-pain qi4dk MRR 4d.k nurse interven-pain LEVEL-1 QIs qi varlab PAI0X Pain poorly managed (MEGAQI) PAN01 Pain worsening (LTCQ) LEVEL-2 QIs qi varlab none
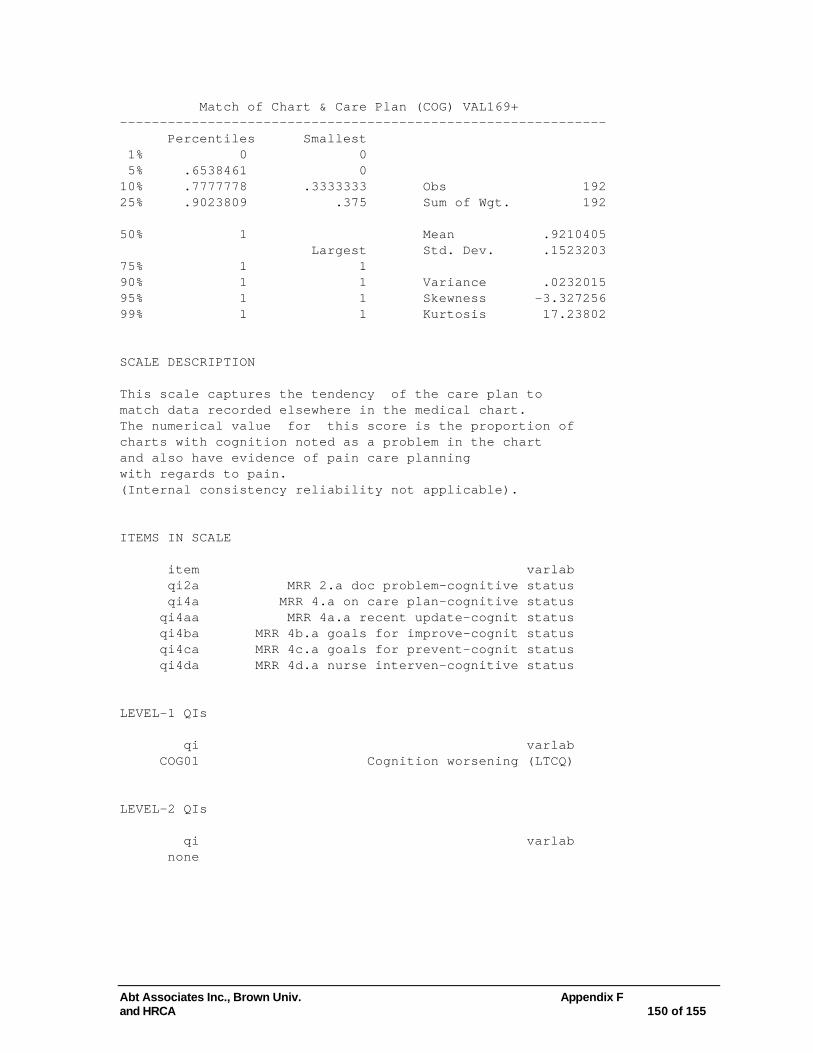
Abt Associates Inc., Brown Univ. Appendix F and HRCA 150 of 155
Match of Chart & Care Plan (COG) VAL169+ ------------------------------------------------------------- Percentiles Smallest 1% 0 0 5% .6538461 0 10% .7777778 .3333333 Obs 192 25% .9023809 .375 Sum of Wgt. 192 50% 1 Mean .9210405 Largest Std. Dev. .1523203 75% 1 1 90% 1 1 Variance .0232015 95% 1 1 Skewness -3.327256 99% 1 1 Kurtosis 17.23802 SCALE DESCRIPTION This scale captures the tendency of the care plan to match data recorded elsewhere in the medical chart. The numerical value for this score is the proportion of charts with cognition noted as a problem in the chart and also have evidence of pain care planning with regards to pain. (Internal consistency reliability not applicable). ITEMS IN SCALE item varlab qi2a MRR 2.a doc problem-cognitive status qi4a MRR 4.a on care plan-cognitive status qi4aa MRR 4a.a recent update-cognit status qi4ba MRR 4b.a goals for improve-cognit status qi4ca MRR 4c.a goals for prevent-cognit status qi4da MRR 4d.a nurse interven-cognitive status LEVEL-1 QIs qi varlab COG01 Cognition worsening (LTCQ) LEVEL-2 QIs qi varlab none
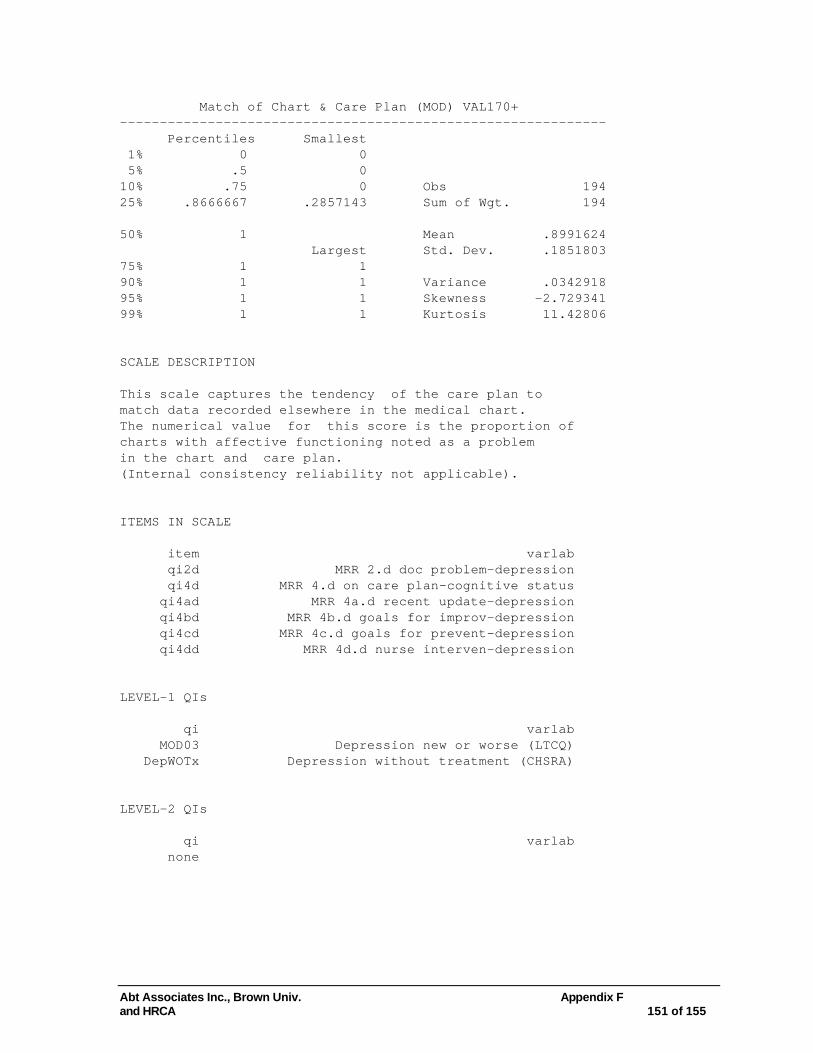
Abt Associates Inc., Brown Univ. Appendix F and HRCA 151 of 155
Match of Chart & Care Plan (MOD) VAL170+ ------------------------------------------------------------- Percentiles Smallest 1% 0 0 5% .5 0 10% .75 0 Obs 194 25% .8666667 .2857143 Sum of Wgt. 194 50% 1 Mean .8991624 Largest Std. Dev. .1851803 75% 1 1 90% 1 1 Variance .0342918 95% 1 1 Skewness -2.729341 99% 1 1 Kurtosis 11.42806 SCALE DESCRIPTION This scale captures the tendency of the care plan to match data recorded elsewhere in the medical chart. The numerical value for this score is the proportion of charts with affective functioning noted as a problem in the chart and care plan. (Internal consistency reliability not applicable). ITEMS IN SCALE item varlab qi2d MRR 2.d doc problem-depression qi4d MRR 4.d on care plan-cognitive status qi4ad MRR 4a.d recent update-depression qi4bd MRR 4b.d goals for improv-depression qi4cd MRR 4c.d goals for prevent-depression qi4dd MRR 4d.d nurse interven-depression LEVEL-1 QIs qi varlab MOD03 Depression new or worse (LTCQ) DepWOTx Depression without treatment (CHSRA) LEVEL-2 QIs qi varlab none

Abt Associates Inc., Brown Univ. Appendix F and HRCA 152 of 155
Match of Chart & Care Plan (ADI) VAL171+ ------------------------------------------------------------- Percentiles Smallest 1% 0 0 5% 0 0 10% 0 0 Obs 137 25% .5 0 Sum of Wgt. 137 50% .875 Mean .7222176 Largest Std. Dev. .3578526 75% 1 1 90% 1 1 Variance .1280584 95% 1 1 Skewness -1.09298 99% 1 1 Kurtosis 2.753384 SCALE DESCRIPTION This scale captures the tendency of the care plan to match data recorded elsewhere in the medical chart. The numerical value for this score is the proportion of charts with ADL functioning noted as a problem in the chart and care plan. (Internal consistency reliability not applicable). ITEMS IN SCALE item varlab qi2f MRR 2.f doc problem-adl improvement qi4f MRR 4.f on care plan-delirium qi4af MRR 4a.f recent update-adl improvement qi4bf MRR 4b.f goals for improve-adl improv qi4cf MRR 4c.f goals for prevent-adl improv qi4df MRR 4d.f nurse interven-adl improvement LEVEL-1 QIs qi varlab ADL03 ADL imprvmnt in res. w/capacity (MEGAQI) LEVEL-2 QIs qi varlab none

Abt Associates Inc., Brown Univ. Appendix F and HRCA 153 of 155
Match of Chart & Care Plan (MOB) VAL172+ ------------------------------------------------------------- Percentiles Smallest 1% .2857143 .1428571 5% .6666667 .2857143 10% .7777778 .5 Obs 199 25% .9047619 .5384616 Sum of Wgt. 199 50% 1 Mean .9341925 Largest Std. Dev. .1245138 75% 1 1 90% 1 1 Variance .0155037 95% 1 1 Skewness -2.983607 99% 1 1 Kurtosis 14.7687 SCALE DESCRIPTION This scale captures the tendency of the care plan to match data recorded elsewhere in the medical chart. The numerical value for this score is the proportion of charts with mobility functioning noted as a problem in the chart and care plan. (Internal consistency reliability not applicable). ITEMS IN SCALE item varlab qi2h MRR 2.h doc problem-mobolity\walking qi4h MRR 4.h on care plan-communication qi4ah MRR 4a.h recent update-mobility\walking qi4bh MRR 4b.h goals for improv-mobility\walk qi4ch MRR 4c.h goals for prevent-mobility\walk qi4dh MRR 4d.h nurse interven-mobility\walking LEVEL-1 QIs qi varlab MOB01 Mobility decline (LTCQ) WAL0X Walking performance (MEGAQI) LEVEL-2 QIs qi varlab none

Abt Associates Inc., Brown Univ. Appendix F and HRCA 154 of 155
Match of Chart & Care Plan (INF) VAL173+ ------------------------------------------------------------- Percentiles Smallest 1% 0 0 5% .1333333 0 10% .4 0 Obs 179 25% .6 0 Sum of Wgt. 179 50% .8571429 Mean .7679908 Largest Std. Dev. .2721518 75% 1 1 90% 1 1 Variance .0740666 95% 1 1 Skewness -1.15596 99% 1 1 Kurtosis 3.702884 SCALE DESCRIPTION This scale captures the tendency of the care plan to match data recorded elsewhere in the medical chart. The numerical value for this score is the proportion of charts with infection noted as a problem in the chart and care plan. (Internal consistency reliability not applicable). ITEMS IN SCALE item varlab qi2r MRR 2.r doc problem-infections qi4r MRR 4.r on care plan-infections qi4ar MRR 4a.r recent update-infections qi4br MRR 4b.r goals for improv-infections qi4cr MRR 4c.r goals for prevent-infections qi4dr MRR 4d.r nurse interven-infections LEVEL-1 QIs qi varlab INF0X Infection flare-up (MEGAQI) LEVEL-2 QIs qi varlab none
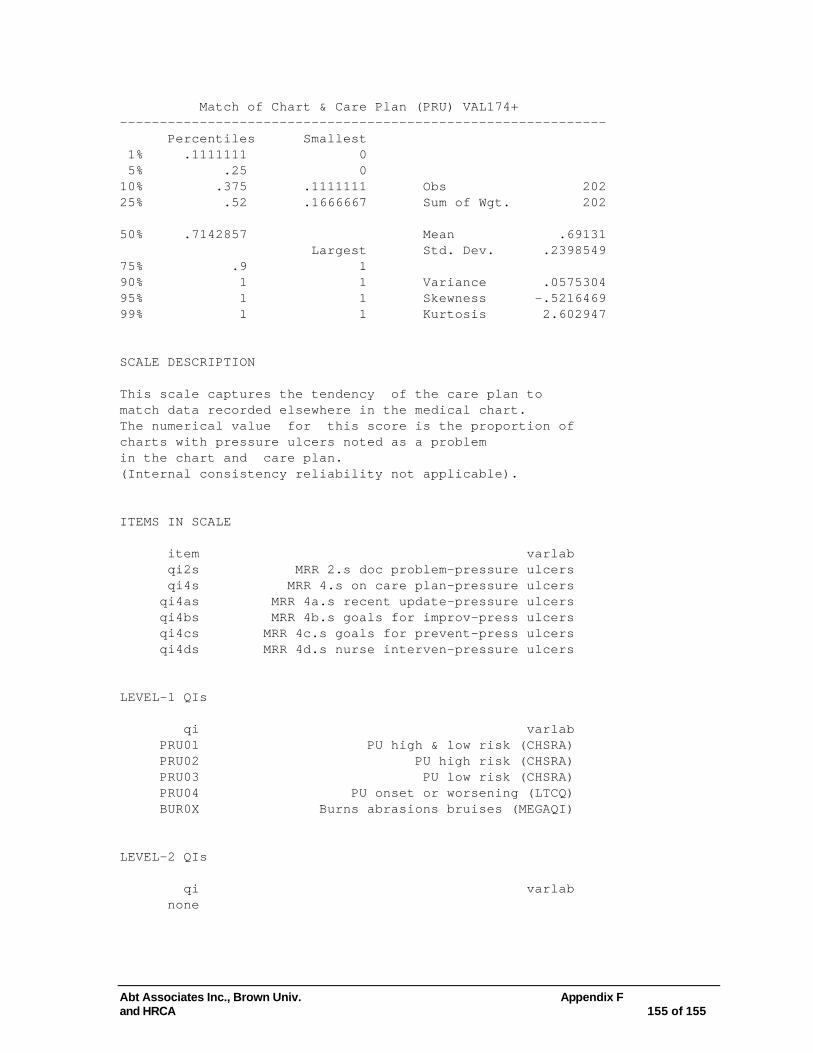
Abt Associates Inc., Brown Univ. Appendix F and HRCA 155 of 155
Match of Chart & Care Plan (PRU) VAL174+ ------------------------------------------------------------- Percentiles Smallest 1% .1111111 0 5% .25 0 10% .375 .1111111 Obs 202 25% .52 .1666667 Sum of Wgt. 202 50% .7142857 Mean .69131 Largest Std. Dev. .2398549 75% .9 1 90% 1 1 Variance .0575304 95% 1 1 Skewness -.5216469 99% 1 1 Kurtosis 2.602947 SCALE DESCRIPTION This scale captures the tendency of the care plan to match data recorded elsewhere in the medical chart. The numerical value for this score is the proportion of charts with pressure ulcers noted as a problem in the chart and care plan. (Internal consistency reliability not applicable). ITEMS IN SCALE item varlab qi2s MRR 2.s doc problem-pressure ulcers qi4s MRR 4.s on care plan-pressure ulcers qi4as MRR 4a.s recent update-pressure ulcers qi4bs MRR 4b.s goals for improv-press ulcers qi4cs MRR 4c.s goals for prevent-press ulcers qi4ds MRR 4d.s nurse interven-pressure ulcers LEVEL-1 QIs qi varlab PRU01 PU high & low risk (CHSRA) PRU02 PU high risk (CHSRA) PRU03 PU low risk (CHSRA) PRU04 PU onset or worsening (LTCQ) BUR0X Burns abrasions bruises (MEGAQI) LEVEL-2 QIs qi varlab none