appendix f bat acoustical studies - u.s. department of energy
TRANSCRIPT

Hermosa West Wind Energy Project Draft EIS Appendix F
DOE/EIS-0438 September 2012
APPENDIX F
BAT ACOUSTICAL STUDIES

Appendix F Hermosa West Wind Energy Project Draft EIS
September 2012 DOE/EIS-0438
This page intentionally left blank

Bat Acoustical Studies for the
Hermosa West Wind Resource Area Albany County, Wyoming
Final Report
July 2009 – November 2009
Prepared for:
Shell WindEnergy, Inc. 910 Louisiana St. Houston, Texas
Prepared by:
Kenton Taylor, Donald Solick, and Kimberly Bay
Western EcoSystems Technology, Inc. 2003 Central Avenue Cheyenne, Wyoming
WEST, Inc.
July 9, 2010

Hermosa West Anabat Survey Report
Western EcoSystems Technology, Inc. i July 9, 2010
EXECUTIVE SUMMARY
Western EcoSystems Technology, Inc. initiated surveys in July 2009 designed to assess bat use within the proposed Hermosa West Wind Resource Area, Albany County, Wyoming. Acoustic surveys for bats using AnabatTM SD1 ultrasonic detectors at 6 stations were conducted from July 15 to November 3, 2009, to estimate the seasonal and spatial use of the Hermosa West Wind Resource Area by bats. Two detectors were paired at a meteorological tower in grassland habitat, one placed near the ground and the other raised to approximately 45 meters. A third detector was moved among four temporary ground stations located in different habitats. Anabat units recorded 1,167 bat passes during 252 detector-nights. Averaging bat passes per detector-night across the four temporary stations, a mean of 14.11 bat passes per detector-night was recorded. The fixed raised station recorded an average of 2.05 bat passes per detector-night. The fixed ground station recorded 2.22 bat passes per detector-night and was the activity estimate used to assess risk, as it was the only location suitable for comparison with data from other wind-energy facilities that have recorded both bat activity and fatality rates. Bat activity was greater at temporary stations than at fixed stations, likely due to habitat differences. Most bat passes were recorded at stations located near water, which may attract bats for foraging and drinking opportunities. Activity was moderate (relative to other sampling stations) within Ponderosa pine habitat, and was lowest within grassland and mountain mahogany habitats. Weekly bat activity was relatively steady between mid-July and mid-September, with most passes recorded in August. Recorded bat activity likely represents a combination of foraging activity by resident bats and commuting activity by bats migrating through the area. Bat activity was similar between the ground and raised detector at station HE1; however, species composition differed between detectors, with low-frequency species comprising the majority of bat passes at the raised station, likely due to their flight and echolocation characteristics. Low-frequency bats (<30 kHz; e.g., big brown bat, hoary bat, silver-haired bat) comprised 48.2% of recorded bat passes, while 35.9% of passes were made by high-frequency bats (>40 kHz in frequency; e.g. Myotis species). The remaining passes were determined to be mid-frequency bat species (30-40 kHz; e.g. eastern red bat). Species identification was only possible for hoary and eastern red bats. Passes attributable to hoary bats comprised 8.1% of all passes. Hoary bats were recorded at all stations, and were most active between mid-July and late-September, suggesting this species was present in the Hermosa West Wind Resource Area during the summer season. September activity by hoary bats may also indicate passage of individuals migrating through the area. Eastern red bats comprised 2.0% of all passes, and most were recorded at the temporary station located in aspen riparian habitat. Eastern red bats were most active in late August and mid-September, suggesting fall migration through the area. The mean number of bat passes per detector-night from the fixed ground station was compared to existing data from nine wind-energy facilities where both bat use and mortality levels have been measured as well as to publicly available bat activity levels recorded at facilities in Wyoming. The level of bat use documented at the Hermosa West Wind Resource Area was similar to the Foote Creek Rim Facility in Wyoming, where reported bat mortalities are low, and
Hermosa West Anabat Survey Report
Western EcoSystems Technology, Inc. ii July 9, 2010
was much lower than at facilities in the eastern US, where reported bat mortality is highest. Assuming a relationship between pre-construction bat activity and post-construction fatalities, bat mortality rates at the HWWRA are expected to be similar to the low rates reported at Foote Creek Rim, Wyoming. Based on fatality rates at wind-energy facilities in the Rocky Mountain/western North American region, the bat activity observed at this project, and habitat of the project, it is expected that the potential risk to bats from turbine operations to be similar to rates observed at the Foote Creek Rim Facility in Wyoming, and not nearly as high as the rates observed at eastern ridgeline facilities. As more research is conducted at facilities in Wyoming, more information regarding the potential direct impacts of Wyoming wind-energy facilities to bats will be obtained.

Hermosa West Anabat Survey Report
Western EcoSystems Technology, Inc. iii July 9, 2010
STUDY PARTICIPANTS
Western EcoSystems TechnologyKenton Taylor Project Manager Donald Solick Bat Biologist and Data Analyst Patrick McKann Bat Data Analyst Andrea Chatfield Bat Data Compiler Kimberly Bay Data Analyst and Report Manager Christina Roderick Statistician JR Boehrs GIS Technician Elizabeth Baumgartner Report Compiler Andrea Palochak Technical Editor Kyle Nerhing Field Technician
REPORT REFERENCE
K. Taylor, D. Solick, and K. Bay. 2010. Bat Acoustical Studies for the Hermosa Wind Resource Area, Albany County, Wyoming. Final Report: July 2009 – November 2009. Prepared for Shell WindEnergy, Inc., Houston, Texas. Prepared by Western EcoSystems Technology, Inc. (WEST), Cheyenne, Wyoming.
ACKNOWLEDGEMENTS
A number of individuals were instrumental in the completion of the bat acoustical surveys conducted at the proposed Hermosa Wind Resource Area. Clark McCreedy and Patricia Sweanor of the US Fish and Wildlife Service Ecological Field Office provided recommendations and review of the study design as did Scott Gamo and Mary Flanderka of the Wyoming Game and Fish Department. Shell WindEnergy provided funding for the field studies and access to the Hermosa Wind Resource Area. Jonathan Burke (project manager) and Helen Chun (health and safety advisor) of Shell were instrumental in administering information and coordination to WEST. All the landowners in the Hermosa Wind Resource Area deserve recognition for their support and cooperation in allowing safe, secure, and trouble-free property access.
Hermosa West Anabat Survey Report
Western EcoSystems Technology, Inc. iv July 9, 2010
TABLE OF CONTENTS
EXECUTIVE SUMMARY ............................................................................................................. i
INTRODUCTION .......................................................................................................................... 1
STUDY AREA ............................................................................................................................... 1
METHODS ..................................................................................................................................... 1
Bat Acoustic Surveys .................................................................................................................. 1
Statistical Analysis .................................................................................................................. 2
RESULTS ....................................................................................................................................... 3
Bat Acoustic Surveys .................................................................................................................. 3
Spatial Variation ...................................................................................................................... 3 Temporal Variation ................................................................................................................. 4 Species Composition ............................................................................................................... 4
DISCUSSION ................................................................................................................................. 4
Potential Impacts ......................................................................................................................... 4
Overall Bat Activity ................................................................................................................ 5 Spatial Variation ...................................................................................................................... 5 Temporal Variation ................................................................................................................. 6 Species Composition ............................................................................................................... 6
Regional Studies .......................................................................................................................... 7
REFERENCES ............................................................................................................................... 7
LIST OF TABLES
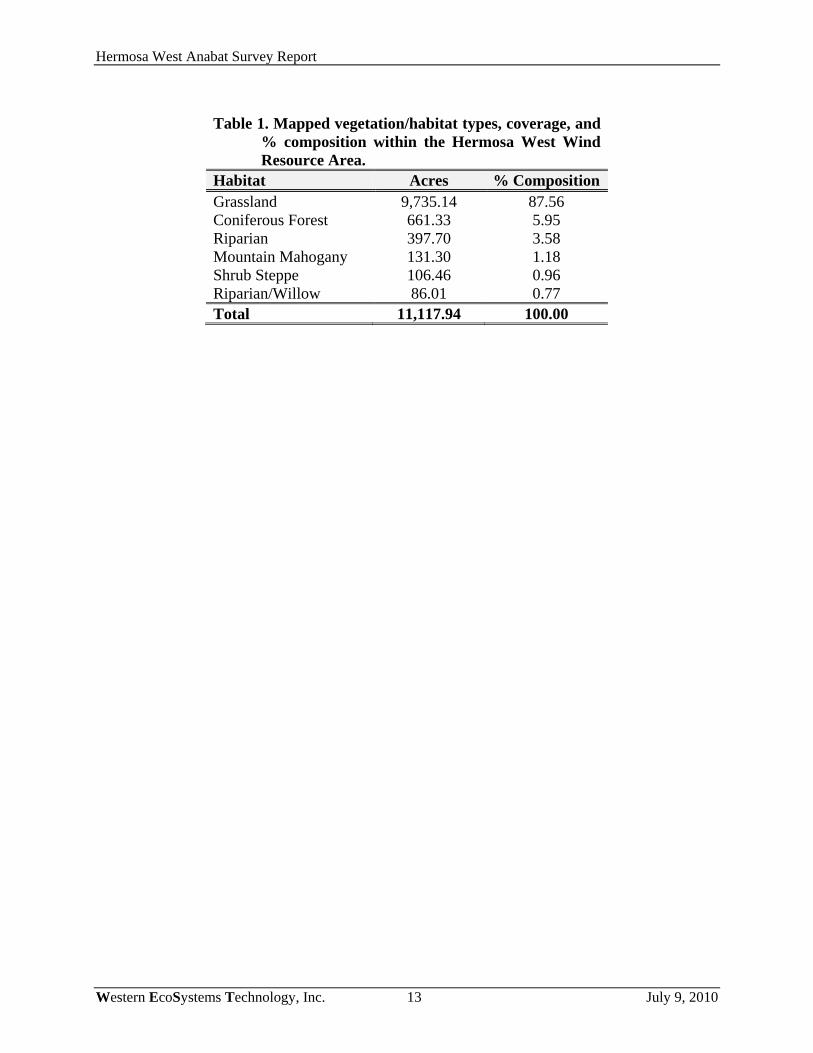
Table 1. Mapped vegetation/habitat types, coverage, and % composition within the Hermosa West Wind Resource Area. ............................................................................................... 13
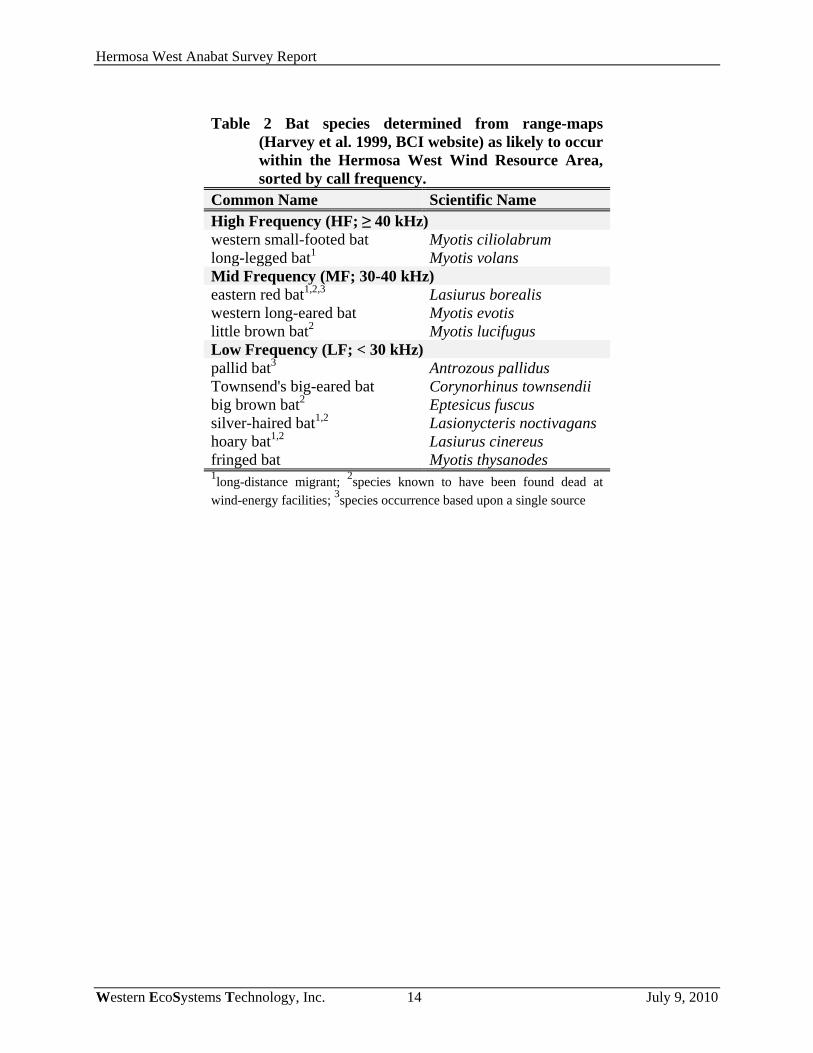
Table 2 Bat species determined from range-maps (Harvey et al. 1999, BCI website) as likely to occur within the Hermosa West Wind Resource Area, sorted by call frequency. ........ 14
Table 3. Results of acoustic bat surveys conducted at the Hermosa West Wind Resource Area, July 15 – November 3, 2009, separated by call frequency (HF = high frequency, MF = mid frequency, LF = low frequency). ................................................... 15
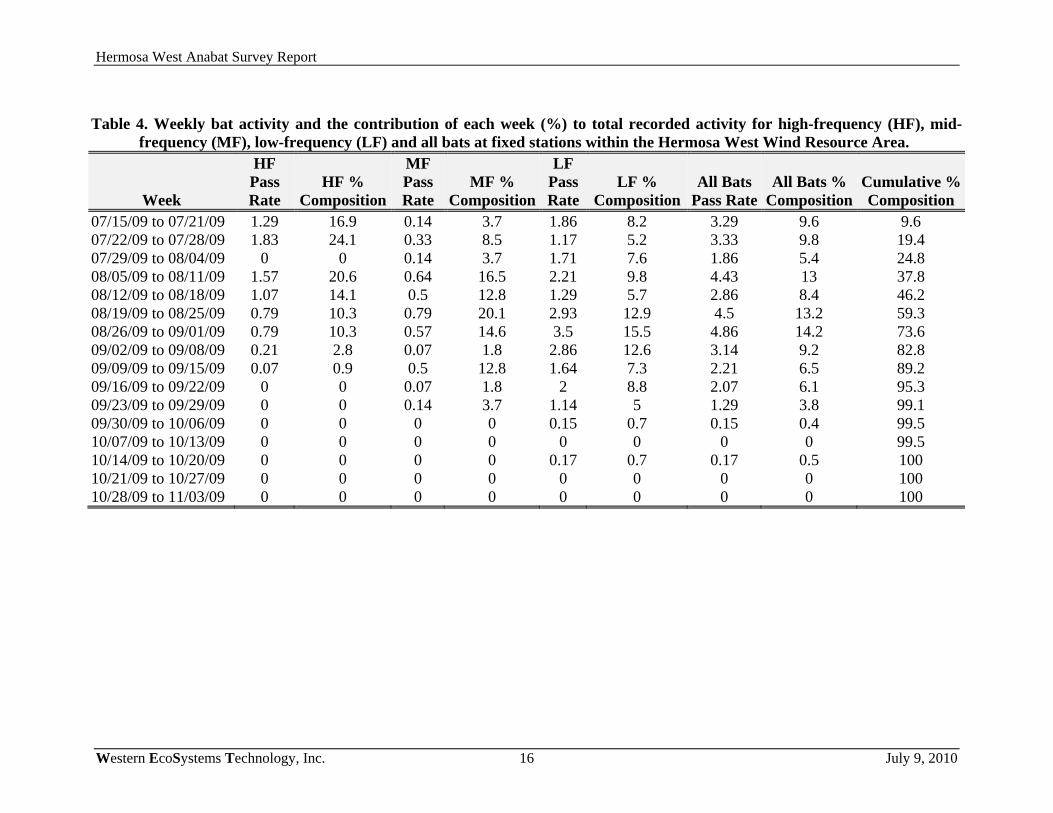
Table 4. Weekly bat activity and the contribution of each week (%) to total recorded activity for high-frequency (HF), mid-frequency (MF), low-frequency (LF) and all bats at fixed stations within the Hermosa West Wind Resource Area. ........................................ 16
Table 5. Weekly bat use and the contribution of each week (%) to total recorded activity for hoary bats and eastern red bats at fixed stations within the Hermosa West Wind Resource Area, from July 15 – November 3, 2009. .......................................................... 17
Hermosa West Anabat Survey Report
Western EcoSystems Technology, Inc. v July 9, 2010
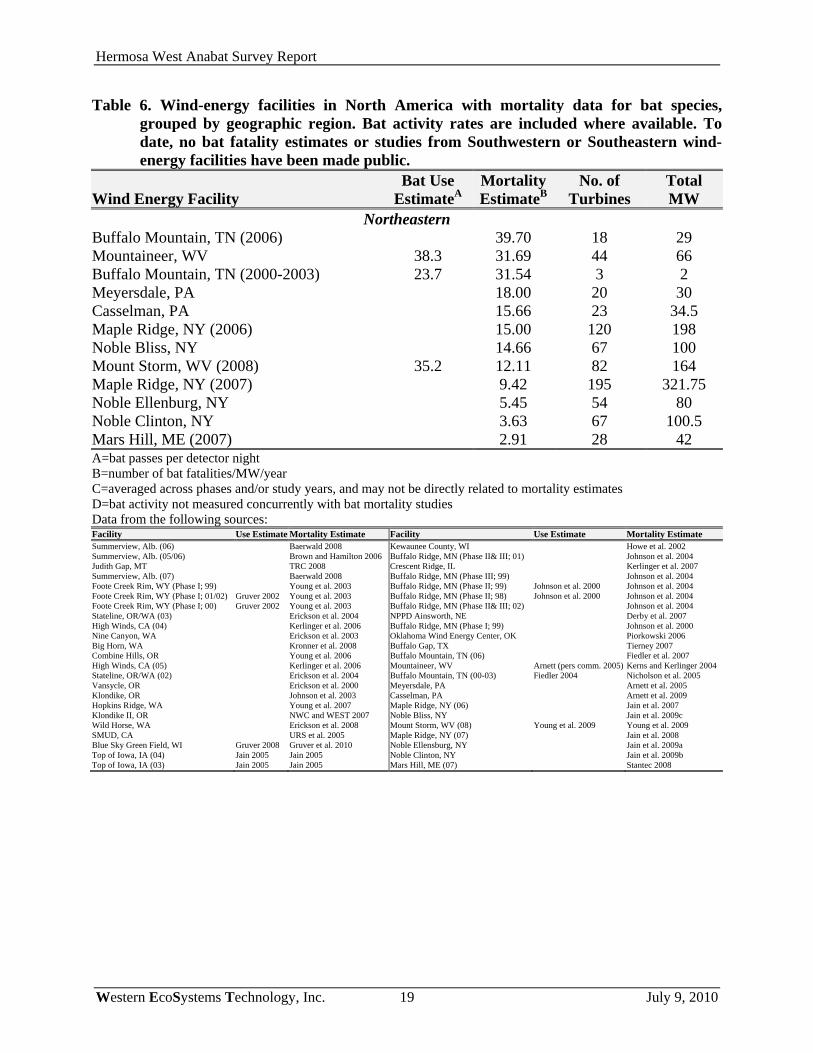
Table 6. Wind-energy facilities in North America with mortality data for bat species, grouped by geographic region. Bat activity rates are included where available. To date, no bat fatality estimates or studies from Southwestern or Southeastern wind-energy facilities have been made public. .......................................................................... 18
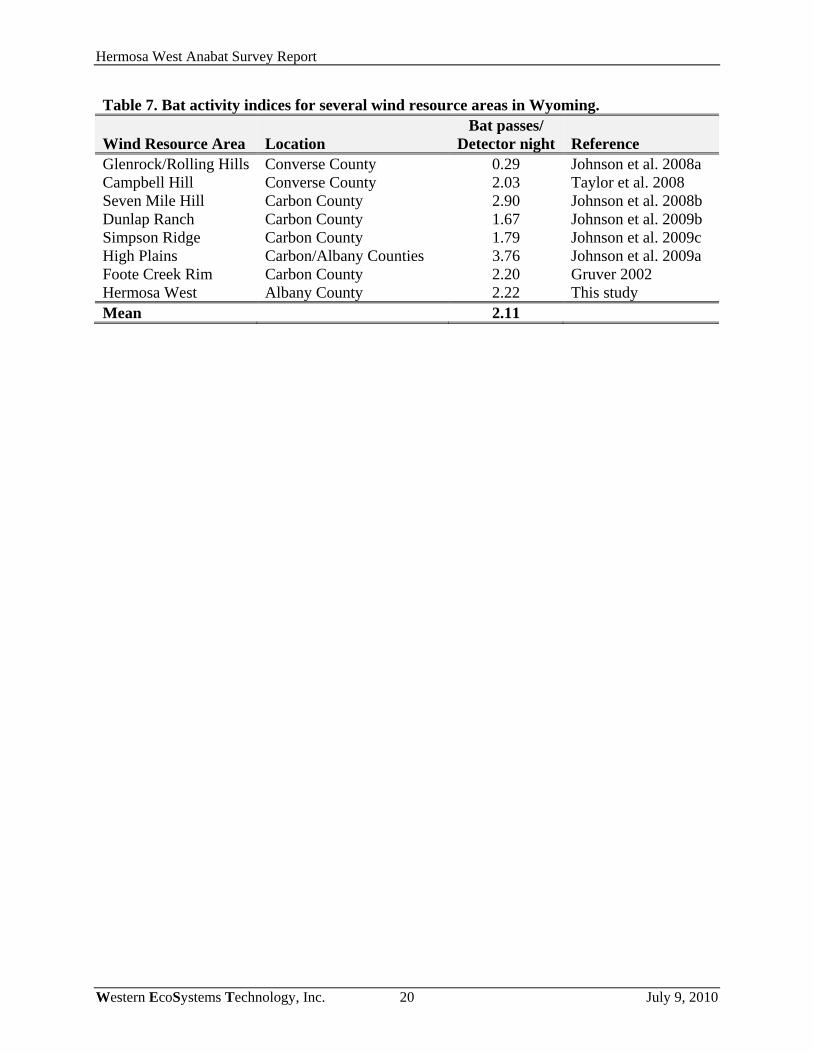
Table 7. Bat activity indices for several wind resource areas in Wyoming. ................................. 20
LIST OF FIGURES
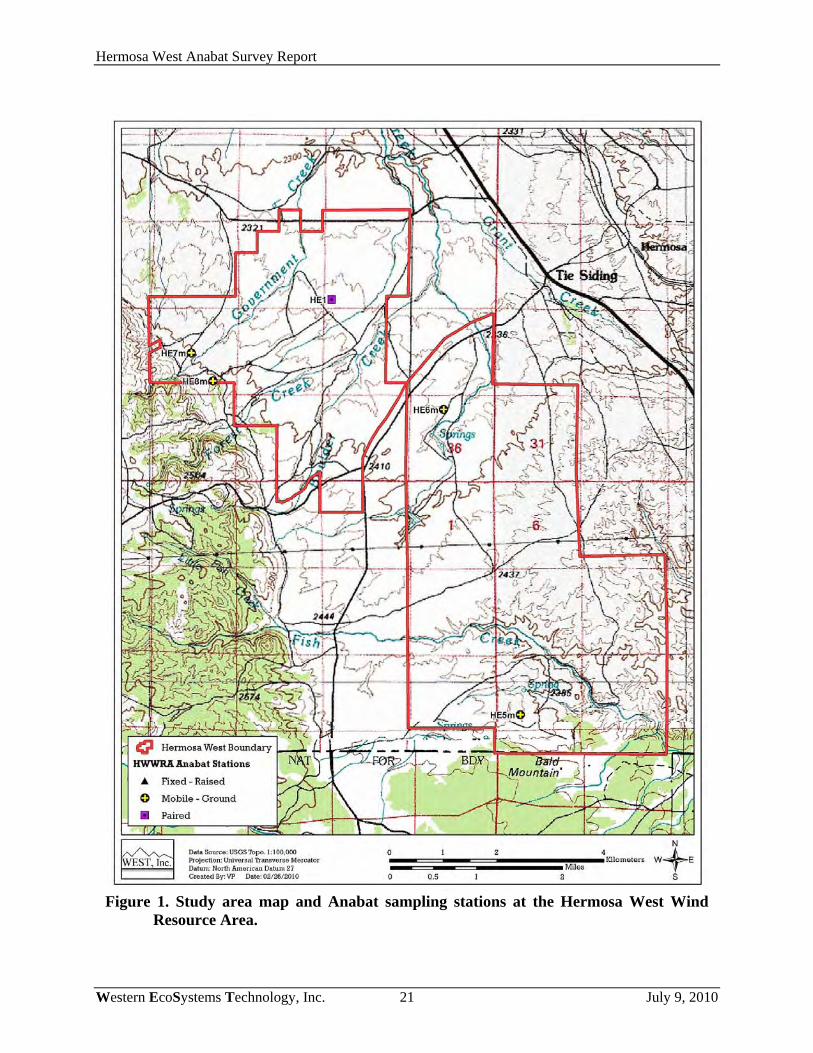
Figure 1. Study area map and Anabat sampling stations at the Hermosa West Wind Resource Area. .................................................................................................................................. 21
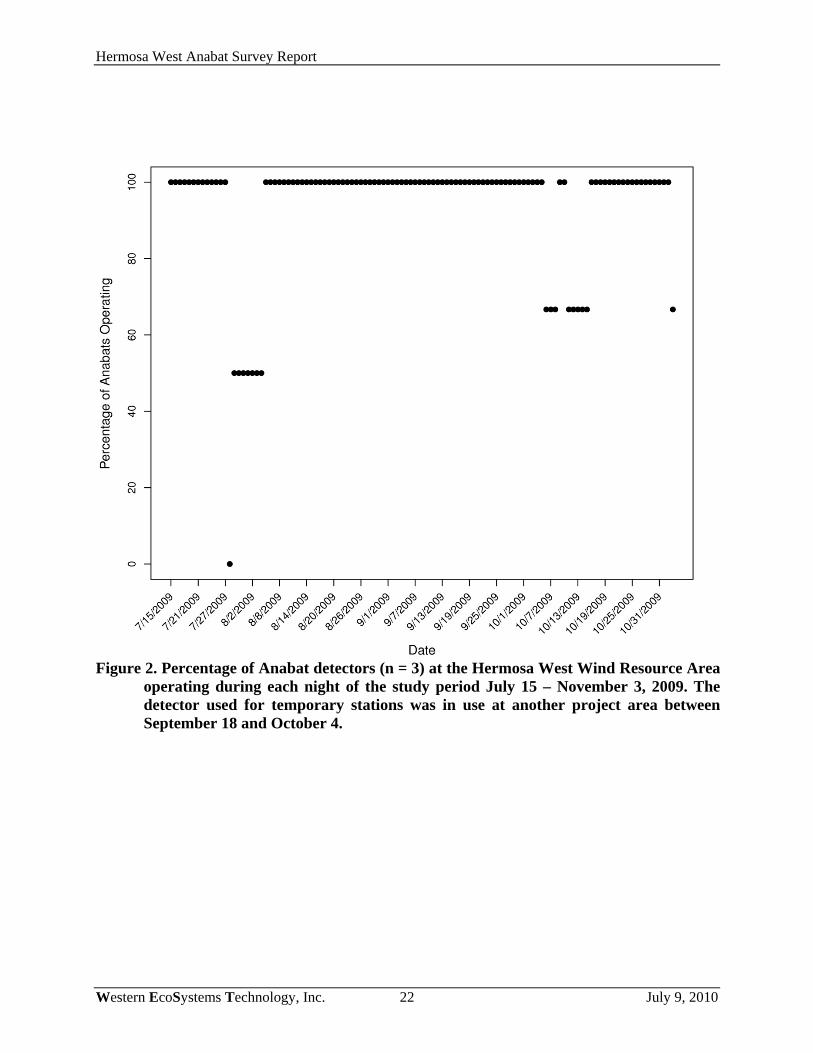
Figure 2. Percentage of Anabat detectors (n = 3) at the Hermosa West Wind Resource Area operating during each night of the study period July 15 – November 3, 2009. The detector used for temporary stations was in use at another project area between September 18 and October 4. ............................................................................................ 22
Figure 3. Bat use and noise files detected per detector-night for fixed stations at the Hermosa West Wind Resource Area for the study period July 15 – November 3, 2009, presented by week. Noise files are indicated on the second axis. ..................................... 23
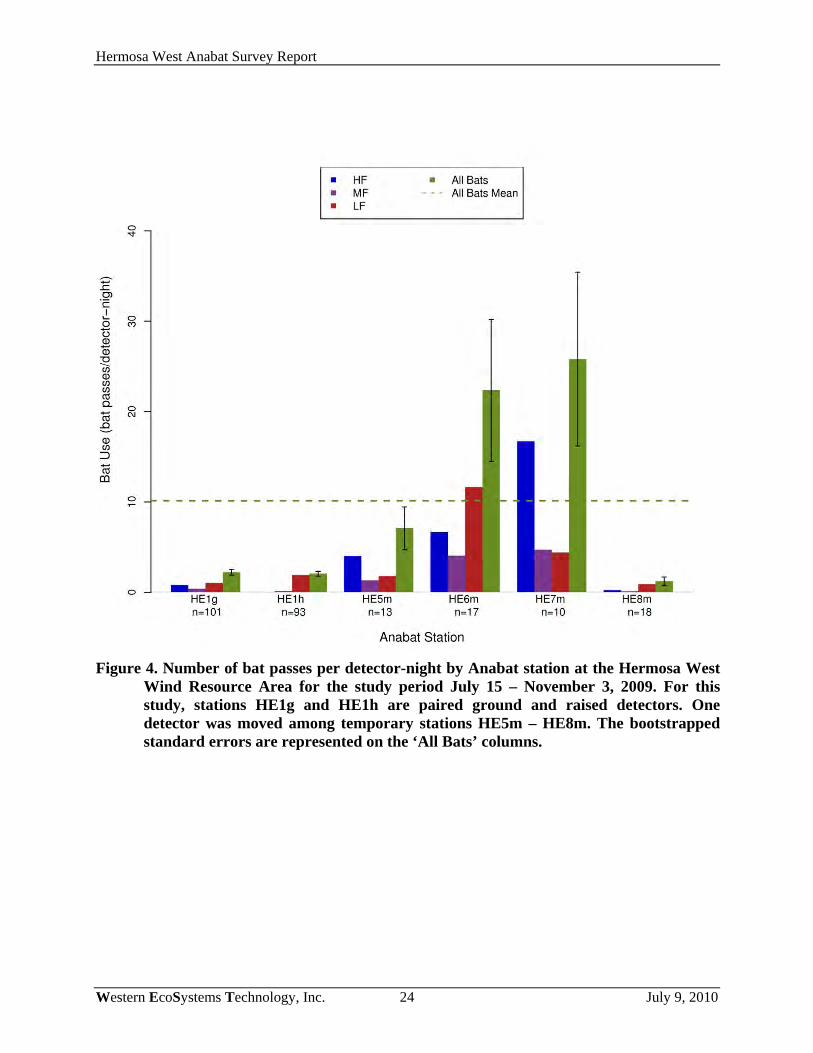
Figure 4. Number of bat passes per detector-night by Anabat station at the Hermosa West Wind Resource Area for the study period July 15 – November 3, 2009. For this study, stations HE1g and HE1h are paired ground and raised detectors. One detector was moved among temporary stations HE5m – HE8m. The bootstrapped standard errors are represented on the ‘All Bats’ columns. ............................................................. 24
Figure 5. Number of high-frequency (HF), mid-frequency (MF), and low-frequency (LF) bat passes per detector-night recorded at the paired Anabat station with ground and raised detectors at the Hermosa West Wind Resource Area for the study period July 15 – November 3, 2009. .................................................................................................... 25
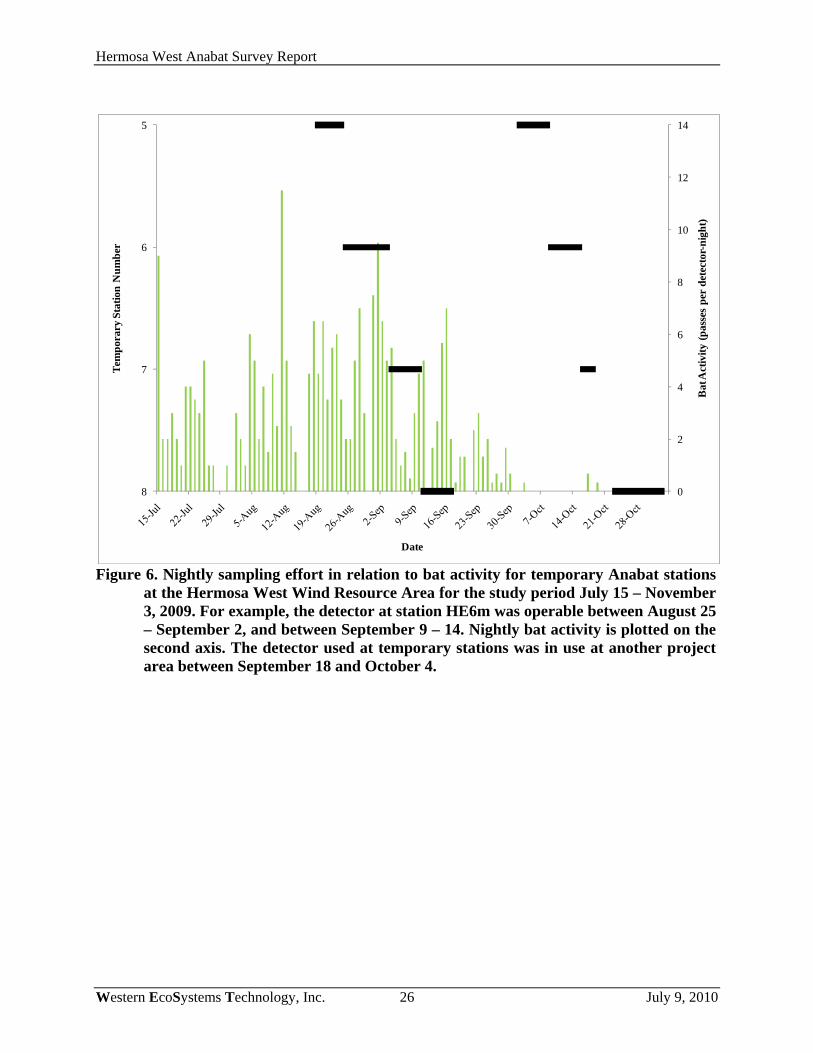
Figure 6. Nightly sampling effort in relation to bat activity for temporary Anabat stations at the Hermosa West Wind Resource Area for the study period July 15 – November 3, 2009. For example, the detector at station HE6m was operable between August 25 – September 2, and between September 9 – 14. Nightly bat activity is plotted on the second axis. The detector used at temporary stations was in use at another project area between September 18 and October 4. ...................................................................... 26
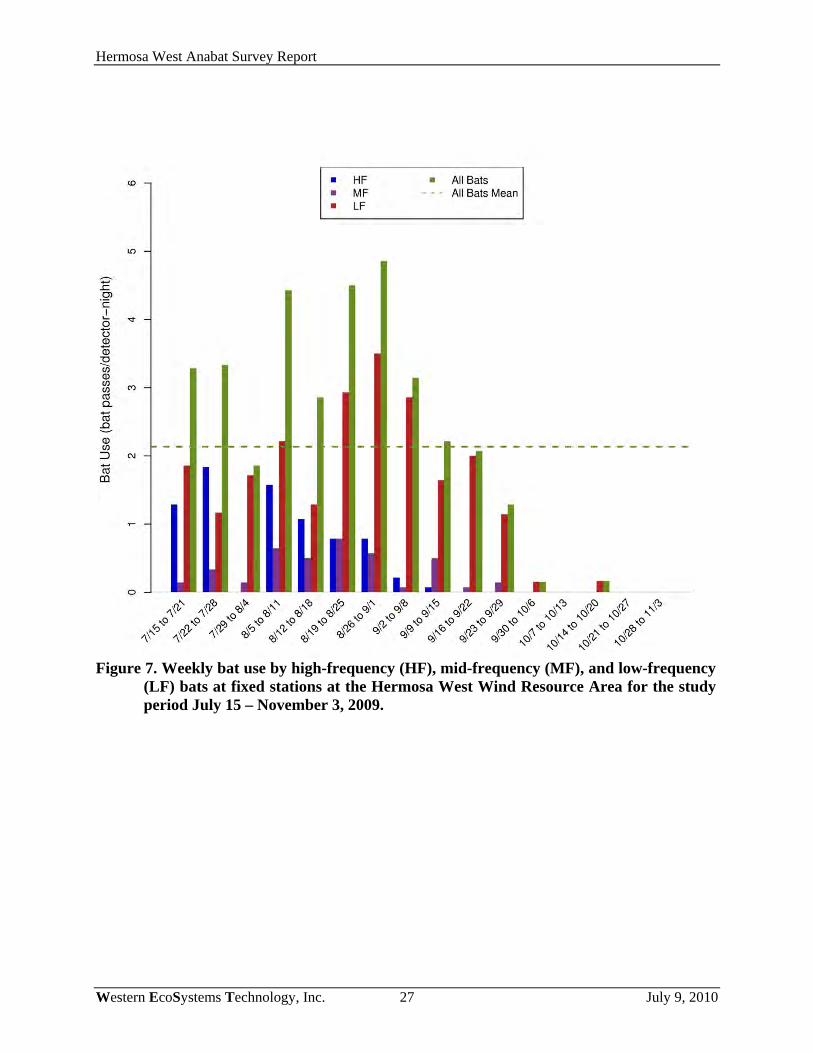
Figure 7. Weekly bat use by high-frequency (HF), mid-frequency (MF), and low-frequency (LF) bats at fixed stations at the Hermosa West Wind Resource Area for the study period July 15 – November 3, 2009. ................................................................................. 27
Figure 8. Empirical cumulative distribution of bat passes at ground and raised stations within the Hermosa West Wind Resource Area, July 15 – November 3, 2009. Dashed vertical lines indicate the point at which 50% of the calls occurred, an indication of the median date of bat activity. .................................................................... 28

Hermosa West Anabat Survey Report
Western EcoSystems Technology, Inc. vi July 9, 2010
Figure 9. Number of passes per detector–night by hoary bats and eastern red bats recorded at Anabat stations within the Hermosa West Wind Resource Area, for the study period July 15 – November 3, 2009. ............................................................................................ 29
Figure 10. Weekly activity by hoary bats and eastern red bats at fixed stations within the Hermosa West Wind Resource Area for the study period July 15 – November 3, 2009................................................................................................................................... 30

Hermosa West Anabat Survey Report
Western EcoSystems Technology, Inc. 1 July 9, 2010
INTRODUCTION
Shell WindEnergy, LLC (Shell) is proposing to develop a wind-energy facility in Albany County, Wyoming. Shell requested that Western EcoSystems Technology, Inc. (WEST) develop and implement a standardized protocol for baseline studies of bat use in the Hermosa West Wind Resource Area (HWWRA) for the purpose of estimating the impacts of the wind-energy facility on bats, and to assist with siting turbines to minimize impacts to bats. The protocol for this baseline study is similar to protocols used at other wind-energy facilities in the United States. The protocol has been developed based on WEST’s experience studying wildlife and wind turbines at wind-energy facilities throughout the US and included passive acoustic sampling using Anabat™ bat detectors to quantify bat use in the study area. Input from the Wyoming Game and Fish Department (WGFD) and US Fish and Wildlife Service (USFWS) were incorporated into the survey protocol. In addition, bat acoustical sampling is being conducted in 2010 at the request of the WGFD. The following is a final report describing the results of acoustical bat surveys during the 2009 study season within the proposed HWWRA. In addition to site-specific data, this report presents existing information and results of bat monitoring studies conducted at other wind-energy facilities. Where possible, comparisons with regional and local studies were made.
STUDY AREA
The HWWRA, approximately 11,118 acres (17.4 square miles [mi2]) in size, is located in southeastern Wyoming (Figure 1). The proposed wind resource area contains a variety of topographic features from generally flat/rolling areas to large drainage features and prominent rocky outcrops. Based on a vegetation/habitat mapping effort conducted within the HWWRA, grassland is the dominant landcover type (87.6%), followed by coniferous forest (6.0%), riparian (3.6%), and mountain mahogany (Cerocarpus spp., 1.2%). shrub-steppe and riparian/willow (Salix spp.) each cover less than 1% of the HWWRA (Table 1). The HWWRA is a mixture of private and state lands with the dominant land use being rangeland for grazing livestock.
METHODS
Bat Acoustic Surveys
The objective of the bat use surveys was to estimate the seasonal and spatial use of the HWWRA by bats. Bats were surveyed using Anabat™ SD1 bat detectors (Titley Scientific™, Australia). Bat detectors are a recommended method to index and compare habitat use by bats. The use of bat detectors for calculating an index to bat impacts is a primary bat risk assessment tool for baseline wind development surveys (Arnett 2007, Kunz et al. 2007a). Bat activity was surveyed using three detectors from July 15 to November 3, 2009, a period corresponding to likely fall bat migration at the HWWRA. Two detectors were paired at a meteorological tower in grassland habitat (station HE1) to compare bat activity at different heights; one was placed near the ground at a height of approximately 3.3 ft (1 m), and the other was mounted on the tower at a height of
Hermosa West Anabat Survey Report
Western EcoSystems Technology, Inc. 2 July 9, 2010
approximately 148 ft (45 m). A third detector was moved among four temporary locations between August 19 and November 3 to sample different habitats and increase spatial coverage within the HWWRA (Figure 1). Station HE5m was located in ponderosa pine (Pinus ponderosa) forest, station HE6m was located in willow/riparian habitat, station HE7m was located in aspen/riparian habitat, and station HE8m was located in mountain mahogany. Anabat detectors record bat echolocation calls with a broadband microphone. The echolocation sounds are then translated into frequencies audible to humans by dividing the frequencies by a predetermined ratio. A division ratio of 16 was used for this study. Bat echolocation detectors also detect other ultrasonic sounds, such as those sounds made by insects, raindrops hitting vegetation, and other sources. A sensitivity level of six was used to reduce interference from these other sources of ultrasonic noise. Calls were recorded to a compact flash memory card with large storage capacity. The detection range of Anabat detectors depends on a number of factors (e.g., echolocation call characteristics, microphone sensitivity, habitat, the orientation of the bat, and atmospheric conditions; Limpens and McCracken 2004), but is generally less than 98 ft (30 m) due to atmospheric absorption on echolocation pulses (Fenton 1991). To ensure similar detection ranges among detectors, microphone sensitivities were calibrated using a BatChirp (Tony Messina, Las Vegas, Nevada) ultrasonic emitter as described in Larson and Hayes (2000). All units were programmed to turn on each night approximately one half-hour before sunset and turn off approximately one half-hour after sunrise. Anabat detectors were placed inside plastic weather-tight containers with a hole cut in the side of the container for the microphone to extend through. Microphones were encased in PVC tubing with drain holes that curved skyward at 45 degrees outside the container to minimize the potential for water damage due to rain. Containers were raised off the ground to minimize echo interference and lift the unit above vegetation. Raised Anabat microphones were elevated on meteorological towers using a pulley system. Microphones were encased in a Bat-Hat weatherproof housing (EME Systems, Berkeley, California), and attached to a coaxial cable that transmitted ultrasonic sounds to an Anabat unit at the base of the tower. The Bat-Hat weatherproof housing was modified by replacing the Plexiglas reflector plate with a 45-degree angle PVC elbow, for better comparability with data collected by detectors on the ground.
Statistical Analysis
The units of bat activity were the number of bat passes (Hayes 1997). A pass was defined as a continuous series of two or more call notes produced by an individual bat with no pauses between call notes of more than one second (White and Gehrt 2001, Gannon et al. 2003). The number of bat passes was determined by downloading the data files to a computer and tallying the number of echolocation passes recorded. Total number of passes was corrected for effort by dividing by the number of detector-nights. For each station, bat passes were sorted into three groups, based on their minimum frequency, that correspond roughly to species groups of interest. For example, most species of Myotis bats echolocate at frequencies above 40 kilohertz (kHz), whereas species such as the eastern red bat (Lasiurus borealis) typically have echolocation calls that fall between 30 and 40 kHz, and species such as big brown (Eptesicus fuscus), silver-haired (Lasionycteris noctivagans), and hoary bat (Lasiurus cinereus) have echolocation frequencies that fall at or below 25 kHz.
Hermosa West Anabat Survey Report
Western EcoSystems Technology, Inc. 3 July 9, 2010
Therefore, passes were classified as high-frequency (HF; > 40 kHz), mid-frequency (MF; 30-40 kHz), or low-frequency (LF; < 30 kHz). To establish which species may have produced passes in each category, a list of species expected to occur in the HWWRA was compiled from range maps (Table 2; Harvey et al. 1999, BCI website). Data determined to be noise (produced by a source other than a bat) or call notes that did not meet the pre-specified criteria to be termed a pass were removed from the analysis. Within these categories, an attempt was made to identify passes made by two Lasiurus species: hoary and eastern red bats. Passes that had a distinct U-shape and that exhibited variability in the minimum frequency across the call sequence were identified as belonging to the Lasiurus genus (C. Corben, pers comm.). Hoary and eastern red bats were distinguished based on minimum frequency; hoary bats typically produce calls with minimum frequencies between 18 and 24 kHz, whereas eastern red bats typically emit calls with minimum frequencies between 30 and 43 kHz (J. Szewczak, pers comm.). Only sequences containing three or more calls were used for species identification. These are conservative parameters; given the high intra-specific variability of Lasiurus calls and the number of call files that were too fragmented for proper identification, it is likely that more hoary and eastern red bat calls were recorded than were positively identified. The total number of bat passes per detector-night was used as an index for bat use in the HWWRA. Bat pass data represented levels of bat activity rather than the numbers of individuals present because individuals could not be differentiated by their calls. To assess potential for bat mortality, the mean number of bat passes per detector-night (averaged across fixed ground-based monitoring stations) was compared to existing data from wind-energy facilities where both bat activity and mortality levels have been measured.
RESULTS
Bat Acoustic Surveys
Bat activity was monitored at six sampling locations on a total of 112 nights during the period July 15 to November 3, 2009. Anabat units were operable for 93.7% of the sampling period (Figure 2). Levels of wind and insect noise were relatively low throughout the study period (i.e., <1,500 noise files per detector-night; Figure 3). Anabat units recorded 1,167 bat passes on 252 detector-nights (Table 3). Averaging bat passes per detector-night across all stations, a mean of 10.12 ± 2.16 bat passes per detector-night was recorded. The pass rate for the fixed ground station was (mean ± SE) 2.22 ± 0.32 bat passes per detector-night, and for the fixed raised station the pass rate was 2.05 ± 0.27 bat passes per detector-night. The average pass rate for temporary ground stations was 14.11 ± 3.12.
Spatial Variation Bat activity varied among Anabat ground stations (Figure 4), ranging between 2.22 and 25.80 passes per detector-night (Table 3). Activity was lowest in grassland and mountain mahogany habitats (stations HE1g, HE8m) and highest in riparian habitats (stations HE6m, HE7m). Differences in activity levels were likely due to differences in habitat rather than to timing of sampling effort, as temporary stations were sampled during periods of high and low bat activity (Figure 5). Comparing data at the paired station on just the nights that both ground and raised

Hermosa West Anabat Survey Report
Western EcoSystems Technology, Inc. 4 July 9, 2010
detectors were operating, pass rates were similar, although species composition differed (Figure 6).
Temporal Variation
Weekly bat activity at fixed stations was generally steady from the start of the study period on July 15 through September 8, with nearly half of all passes recorded between August 5 and September 1 (48.8%; Table 4, Figure 7). Activity declined through the end of September, and very few bats were detected in October (Figure 7). Temporary stations were excluded from temporal analyses because individual temporary stations were not sampled on a continuous basis throughout the study period. Temporal patterns between the ground and raised detector at station HE1 were similar (Figure 8), although the ground detector consistently recorded more bat passes on a nightly basis.
Species Composition
For all stations, passes by low-frequency bats (LF; 48.2% of all passes) outnumbered passes by high-frequency (HF; 35.9%) and mid-frequency bats (MF; 15.9%; Table 3). However, species composition varied considerably among stations (Figure 4). At paired station HE1, the raised station recorded mostly LF bat passes (94%; Table 3) relative to the ground station (Figure 5). Among fixed stations, patterns of weekly activity differed among species groups (Figure 7). HF bats were most active early in the season, between July 15 and September 1 (96.3% of HF passes; Table 4), with no HF passes recorded after September 15 (Figure 7). MF species were most active between August 5 and September 1 (64% of MF passes; Table 4), with no MF passes recorded past September 29. Activity by LF bats was relatively high through September 22, with 41.0% of passes recorded between August 19 and September 8 (Table 4). For all stations, passes attributable to hoary bats accounted for 8.1% of all bat passes, and 16.7% of all LF bat passes (Table 3). Hoary bats were detected at all Anabat stations (Figure 9), with most activity recorded at the raised grassland station (HE1h) and the temporary station located in riparian/willow habitat (HE6m). Among fixed stations, weekly hoary bat activity was relatively high and steady between July 15 and September 22 (96.9% of hoary bat passes; Table 5, Figure 10). Few hoary bats were recorded after September 22. For all stations, passes attributable to eastern red bats accounted for 2.0% of all passes, and 12.4% of all MF passes (Table 3). Eastern red bats were recorded at raised station HE1h, and at temporary stations HE5m – HE7m (Figure 9), with most (73.9%; Table 3) recorded at station HE7m. Among fixed stations, eastern red bats were only detected in late August and mid-September (Figure 9; Table 5).
DISCUSSION
Potential Impacts
Assessing the potential impacts of wind-energy development to bats at the HWWRA is complicated because the proximate and ultimate causes of bat fatalities at turbines are poorly understood (Kunz et al. 2007b, Baerwald et al. 2008, Cryan and Barclay 2009), and because
Hermosa West Anabat Survey Report
Western EcoSystems Technology, Inc. 5 July 9, 2010
monitoring elusive, night-flying animals is inherently difficult (O’Shea et al. 2003). In addition, because installed capacity for wind-energy has increased rapidly in recent years, the availability of well-designed studies from existing projects lags development of proposed projects (Kunz et al. 2007b). To date, monitoring studies of wind-energy facilities suggest that:
a) bat mortality shows a potential relationship with bat use (Table 6);
b) the majority of fatalities occur during the post-breeding or fall migration season (roughly August and September);
c) migratory tree-roosting species (eastern red, hoary, and silver-haired bats) comprise
almost 75% of reported bat fatalities, and; d) the highest reported fatalities occur at wind-energy facilities located along forested
ridge tops in the eastern and northeastern US. However, recent studies in agricultural regions of Iowa and Alberta, Canada, report relatively high fatalities as well (Table 6).
Based on these patterns, current guidance to estimate potential mortality levels at a proposed wind project involves evaluation of the on-site bat acoustic data in terms of activity levels, seasonal variation, and species composition (Kunz et al. 2007b), as well as comparison to regional patterns.
Overall Bat Activity To date, few studies of wind-energy facilities have recorded both Anabat detections per night and bat mortality (Table 6). The addition of data sets from projects such as Hermosa will contribute to understanding of the relationship between bat activity near wind turbines and bat fatalities. To our knowledge, the Anabat detections per night data for the studies in Table 6 were collected from ground locations that were selected to sample areas representative of proposed turbine locations. Thus, this report relies on the mean bat activity for the one fixed ground-based detector to assess potential risk of bat fatality at the HWWRA relative to other publicly available studies with similar data. Bat use recorded by the fixed ground detector within the HWWRA (2.22 ± 0.32 bat passes per detector-night) was similar to that observed at the Foote Creek Rim Facility in Wyoming, where recorded bat mortality was low, and was much lower than activity recorded at sites in West Virginia, Iowa, and Tennessee, where bat mortality rates were high (Table 6). Thus, assuming a relationship between pre-construction bat activity and post-construction fatalities, bat mortality rates at the HWWRA are expected to be similar to the low rates reported at Foote Creek Rim, Wyoming (Table 6).
Spatial Variation
The proposed wind-energy facility is not located near any large, known bat colonies likely to attract large numbers of bats. In general, bat activity was greater at temporary stations than at fixed stations, likely due to differences in habitat. The fixed ground station was located in grassland habitat, while temporary stations were located in habitats that might be attractive to

Hermosa West Anabat Survey Report
Western EcoSystems Technology, Inc. 6 July 9, 2010
bats, such as riparian/willow, riparian/aspen, or forested areas. Notably, the stations that recorded the most bat passes (HE6m and HE7m) were located in riparian habitat. Bat activity was moderate at the Ponderosa pine (station HE5m) location. Activity was lowest at the mountain mahogany location (HE8m). The ground and raised detectors at the paired station (HE1) recorded similar bat activity, suggesting that bats fly at a range of altitudes within the HWWRA.
Temporal Variation
Bat activity at fixed stations was relatively steady between mid-July and mid-September, with most passes recorded in August. Bat activity in July likely corresponds with the reproductive season, when pups are being weaned and foraging rates are high. Activity between August and mid-September is likely a combination of continued foraging activity by resident bats, as well as movement of migrating bats through the area. Few bats were recorded in October, indicating that most bats had left the area for winter hibernacula or warmer climates. Fatality studies of bats at wind-energy facilities in the US have shown a peak in mortality in August and September and generally lower mortality earlier in the summer (Johnson 2005, Arnett et al. 2008). While the survey effort varies among the different studies, the studies that combine Anabat surveys and fatality surveys show a general association between the timing of increased bat call rates and timing of mortality, with both call rates and mortality peaking during the fall. Based on the available data, it is expected that bat mortality at the HWWRA will be highest between August and early-September.
Species Composition Of the 11 species of bat likely to occur in the HWWRA, five are known fatalities at wind-energy facilities (Table 2). Acoustic bat surveys were able to classify bat calls to frequency groups that roughly correspond to groups of relative risk. Approximately 48% of passes were by low-frequency bats, suggesting greater relative abundance of species such as big brown, hoary and silver-haired bats. At raised stations, low-frequency passes outnumbered passes by other species groups, which most likely reflects different foraging behaviors among species. The behavioral characteristics of low-frequency bats may provide insight into why low-frequency bat passes outnumbered passes by other species groups. Generally, low-frequency species tend to forage at greater heights due to their wing morphology and echolocation call structure (Norberg and Rayner 1987). Species composition varied over time at the fixed stations. High-frequency passes were most numerous from mid-July to late-August, and suggests these species leave the area once young are weaned and able to fly. Mid-frequency passes were most numerous in August, and may represent bats migrating through the project area. Low-frequency passes were numerous for the majority of the study period, with most passes recorded in August, and likely represent a combination of activity by resident and migrating individuals. Hoary bats comprised 8.1% of all passes, were recorded at all stations, and were most active from mid-July to late-September. These results suggest this species likely resides in the HWWRA during the summer, although late-August to mid-September activity may also represent individuals migrating through the area. Hoary bat passes were most numerous at the station in riparian/willow habitat, and suggest this species may be attracted to this habitat for
Hermosa West Anabat Survey Report
Western EcoSystems Technology, Inc. 7 July 9, 2010
foraging, drinking, and possibly roosting opportunities. Hoary bats were also active at the raised station in grassland habitat, and indicate this species may be at greater risk for collision with turbine blades than lower-flying species. Eastern red bats comprised 2.0% of all bat passes, and were mainly recorded at station HE7m, located in aspen riparian habitat. Eastern red bats were most active in late August and mid September at fixed stations, suggesting migration through the HWWRA, but the data are too few to draw meaningful conclusions about their timing.
Regional Studies
Publicly available bat fatality rate estimates corrected for searcher efficiency and carcass removal rates are available for 15 wind-energy facilities located throughout the Rocky Mountains and western North America, where annual bat fatality rates have ranged from 0.07 fatalities/MW/year at a wind-energy facility in California to 14.62 fatalities/MW/year at a facility in Alberta, and averaged 3.30 fatalities/MW/year (Table 6). Bat activity from the ground based detector at the HWWRA (2.22± 0.32 bat passes/detector-night) was similar to the mean of 2.2 bat passes/detector-night recorded at the Foote Creek Rim wind-energy facility in 2000. The Foote Creek Rim facility is located approximately 60 miles (96.6 km) northwest of the HWWRA. Actual bat mortality at the Foote Creek Rim facility in 2000 (the only year for which bat activity estimates are available) was estimated at 1.05 bat fatalities/MW/year (Gruver 2002). The rate of 1.05 bat fatalities/MW/year measured at Foote Creek Rim is low compared to most other operational wind-energy facilities (Johnson 2005, Arnett et al. 2008). Based on similar activity levels, the proximity of the HWWRA to the Foote Creek Rim Facility, and the presence of similar habitats among the two areas, similar rates of bat mortality could be expected at the HWWRA. Bat activity at the HWWRA was within the range of bat activity levels recorded at several other wind resource areas in Wyoming, where they have ranged from 0.29 to 3.76 bat passes/detector night (Table 7). To date, however, the only bat mortality data for Wyoming are from the Foote Creek Rim wind-energy facility. As more research is conducted at facilities in the Wyoming, more information regarding the potential direct impacts of Wyoming wind-energy facilities to bats will be obtained.
REFERENCES
Arnett, E. 2007. Report from the Bats and Wind Energy Cooperative (BWEC) on Collaborative Work and Plans. Presentation at the NWCC Wildlife Workgroup Meeting, Boulder Colorado. Conservation International. November 14th, 2007. Information available at www.nationwind.org
Arnett, E.B., K. Brown, W.P. Erickson, J. Fiedler, B.L. Hamilton, T.H. Henry, A. Jain, G.D. Johnson, J. Kerns, R.R. Kolford, C.P. Nicholson, T. O’Connell, M. Piorkowski, and R. Tankersley, Jr. 2008. Patterns of Fatality of Bats at Wind Energy Facilities in North America. Journal of Wildlife Management 72: 61-78.
Arnett, E.B., W.P. Erickson, J. Kerns, and J. Horn. 2005. Relationships between Bats and Wind Turbines in Pennsylvania and West Virginia: An Assessment of Fatality Search Protocols, Patterns of Fatality, and Behavioral Interactions with Wind Turbines. Prepared for the Bats and Wind Energy Cooperative. March 2005.

Hermosa West Anabat Survey Report
Western EcoSystems Technology, Inc. 8 July 9, 2010
Arnett, E.B., M. Schirmacher, M.M.P. Huso, and J.P. Hayes. 2009. Effectiveness of Changing Wind Turbine Cut-in Speed to Reduce Bat Fatalities at Wind Facilities: 2008 Annual Report. Prepared for the Bats and Wind Energy Cooperative (BWEC) and the Pennsylvania Game Commission. April 2009. http://www.batsandwind.org/pdf/Curtailment_2008_Final_Report.pdf
Baerwald, E.F. 2008. Variation in the Activity and Fatality of Migratory Bats at Wind Energy Facilities in Southern Alberta: Causes and Consequences. Thesis. University of Calgary, Calgary, Alberta, Canada.
Baerwald, E.F., G.H. D’Amours, B.J. Klug, and R.M.R. Barclay. 2008. Barotrauma is a Significant Cause of Bat Fatalities at Wind Turbines. Current Biology 18(16): R695-R696.
Bat Conservation International (BCI) website. Bat Species: US Bats. Bat Conservation International, Inc., Austin, Texas. Accessed March and April, 2010. Homepage: http://www.batcon.org; Species Profiles: http://batcon.org/index.php/education/article-and-information/species-profiles.html
Brown, W.K. and B.L. Hamilton. 2006. Monitoring of Bird and Bat Collisions with Wind Turbines at the Summerview Wind Power Project, Alberta: 2005-2006. Prepared for Vision Quest Windelectric, Calgary, Alberta by TEAM Ltd., Calgary, Alberta, and BLH Environmental Services, Pincher Creek, Alberta. September 2006. http://www.batsandwind.org/pdf/Brown2006.pdf
Cryan, P.M. and R.M.R. Barclay. 2009. Causes of Bat Fatalities at Wind Turbines: Hypotheses and Predictions. Journal of Mammalogy 90(6): 1330-1340.
Derby, C., A. Dahl, W. Erickson, K. Bay, and J. Hoban. 2007. Post-Construction Monitoring Report for Avian and Bat Mortality at the NPPD Ainsworth Wind Farm. Unpublished report prepared by Western EcoSystems Technology, Inc. (WEST), Cheyenne, Wyoming, for the Nebraska Public Power District.
Erickson, W.P., J. Jeffrey, K. Kronner, and K. Bay. 2004. Stateline Wind Project Wildlife Monitoring Final Report: July 2001 - December 2003. Technical report for and peer-reviewed by FPL Energy, Stateline Technical Advisory Committee, and the Oregon Energy Facility Siting Council, by Western EcoSystems Technology, Inc. (WEST), Cheyenne, Wyoming, and Walla Walla, Washington, and Northwest Wildlife Consultants (NWC), Pendleton, Oregon. December 2004. http://www.west-inc.com
Erickson, W.P., J. Jeffrey, and V.K. Poulton. 2008. Avian and Bat Monitoring: Year 1 Report. Puget Sound Energy Wild Horse Wind Project, Kittitas County, Washington. Prepared for Puget Sound Energy, Ellensburg, Washington, by Western EcoSystems Technology, Inc. (WEST), Cheyenne, Wyoming. January 2008.
Erickson, W.P., G.D. Johnson, M.D. Strickland, and K. Kronner. 2000. Avian and Bat Mortality Associated with the Vansycle Wind Project, Umatilla County, Oregon: 1999 Study Year. Technical report prepared by WEST, Inc. for Umatilla County Department of Resource Services and Development, Pendleton, Oregon. 21pp. http://www.west-inc.com/reports/vansyclereportnet.pdf
Erickson, W.P., K. Kronner, and B. Gritski. 2003. Nine Canyon Wind Power Project Avian and Bat Monitoring Report. September 2002 – August 2003. Prepared for the Nine Canyon Technical Advisory Committee and Energy Northwest by Western EcoSystems Technology, Inc. (WEST), Cheyenne, Wyoming, and Northwest Wildlife Consultants (NWC), Pendleton, Oregon. October 2003. http://www.west-inc.com/reports/nine_canyon_monitoring_final.pdf
Fenton, M.B. 1991. Seeing in the Dark. BATS (Bat Conservation International) 9(2): 9-13.

Hermosa West Anabat Survey Report
Western EcoSystems Technology, Inc. 9 July 9, 2010
Fiedler, J.K. 2004. Assessment of Bat Mortality and Activity at Buffalo Mountain Windfarm, Eastern Tennessee. M.S. Thesis. University of Tennessee, Knoxville, Tennessee. August, 2004. http://www.tva.gov/environment/bmw_report/bat_mortality_bmw.pdf
Fiedler, J.K., T.H. Henry, R.D. Tankersley, and C.P. Nicholson. 2007. Results of Bat and Bird Mortality Monitoring at the Expanded Buffalo Mountain Windfarm, 2005. Tennessee Valley Authority, Knoxville, Tennessee. https://www.tva.gov/environment/bmw_report/results.pdf
Gannon, W.L., R.E. Sherwin, and S. Haymond. 2003. On the Importance of Articulating Assumptions When Conducting Acoustic Studies of Habitat Use by Bats. Wildlife Society Bulletin 31: 45-61.
Gruver, J. 2008. Bat Acoustic Studies for the Blue Sky Green Field Wind Project, Fond Du Lac County, Wisconsin. Final Report: July 24 - October 29, 2007. Prepared for We Energies, Milwaukee, Wisconsin. Prepared by Western EcoSystems Technology, Inc. (WEST), Cheyenne, Wyoming. February 26, 2008.
Gruver, J., M. Sonnenburg, K. Bay, and W. Erickson. 2010. Post-Construction Bat and Bird Fatality Study at the Blue Sky Green Field Wind Energy Center, Fond Du Lac County, Wisconsin July 21, 2008 - October 31, 2008 and March 15, 2009 - June 4, 2009. Unpublished report prepared by Western EcoSystems Technology, Inc. (WEST), Cheyenne, Wyoming.
Gruver, J.C. 2002. Assessment of Bat Community Structure and Roosting Habitat Preferences for the Hoary Bat (Lasiurus cinereus) near Foote Creek Rim, Wyoming. M.S. Thesis. University of Wyoming, Laramie, Wyoming. 149 pp.
Harvey, M.J., J.S. Altenbach, and T.L. Best. 1999. Bats of the United States. Arkansas Game and Fish Commission and US Fish and Wildlife Service, Arkansas.
Hayes, J.P. 1997. Temporal Variation in Activity of Bats and the Design of Echolocation-Monitoring Studies. Journal of Mammalogy 78: 514-524.
Howe, R.W., W. Evans, and A.T. Wolf. 2002. Effects of Wind Turbines on Birds and Bats in Northeastern Wisconsin. Prepared by University of Wisconsin-Green Bay, for Wisconsin Public Service Corporation and Madison Gas and Electric Company, Madison, Wisconsin. November 21, 2002. 104 pp.
Jain, A. 2005. Bird and Bat Behavior and Mortality at a Northern Iowa Windfarm. M.S. Thesis. Iowa State University, Ames, Iowa.
Jain, A., P. Kerlinger, R. Curry, and L. Slobodnik. 2007. Annual Report for the Maple Ridge Wind Power Project: Post-Construction Bird and Bat Fatality Study – 2006. Final Report. Prepared for PPM Energy and Horizon Energy and Technical Advisory Committee (TAC) for the Maple Ridge Project Study.
Jain, A., P. Kerlinger, R. Curry, and L. Slobodnik. 2008. Annual Report for the Maple Ridge Wind Power Project: Post-Construction Bird and Bat Fatality Study - 2007. Final report prepared for PPM Energy and Horizon Energy and Technical Advisory Committee (TAC) for the Maple Ridge Project Study.
Jain, A., P. Kerlinger, R. Curry, L. Slobodnik, A. Fuerst, and C. Hansen. 2009a. Annual Report for the Noble Ellenburg Windpark, LLC, Postconstruction Bird and Bat Fatality Study - 2008. Prepared for Noble Environmental Power, LLC by Curry and Kerlinger, LLC. April 13, 2009.
Jain, A., P. Kerlinger, R. Curry, L. Slobodnik, J. Histed, and J. Meacham. 2009b. Annual Report for the Noble Clinton Windpark, LLC, Postconstruction Bird and Bat Fatality Study - 2008. Prepared for Noble Environmental Power, LLC by Curry and Kerlinger, LLC. April 13, 2009.

Hermosa West Anabat Survey Report
Western EcoSystems Technology, Inc. 10 July 9, 2010
Jain, A., P. Kerlinger, R. Curry, L. Slobodnik, J. Quant, and D. Pursell. 2009c. Annual Report for the Noble Bliss Windpark, LLC, Postconstruction Bird and Bat Fatality Study - 2008. Prepared for Noble Environmental Power, LLC by Curry and Kerlinger, LLC. April 13, 2009.
Johnson, G.D. 2005. A Review of Bat Mortality at Wind-Energy Developments in the United States. Bat Research News 46(2): 45-49.
Johnson, G.D., W.P. Erickson, M.D. Strickland, M.F. Shepherd, and D.A. Shepherd. 2000. Avian Monitoring Studies at the Buffalo Ridge Wind Resource Area, Minnesota: Results of a 4-Year Study. Final report prepared for Northern States Power Company, Minneapolis, Minnesota, by Western EcoSystems Technology, Inc. (WEST), Cheyenne, Wyoming. September 22, 2000. 212 pp. http://www.west-inc.com
Johnson, G.D., W.P. Erickson, and J. White. 2003. Avian and Bat Mortality During the First Year of Operation at the Klondike Phase I Wind Project, Sherman County, Oregon. March 2003. Technical report prepared for Northwestern Wind Power, Goldendale, Washington, by Western EcoSystems Technology, Inc. (WEST), Cheyenne, Wyoming. http://www.west-inc.com
Johnson, G.D., M.K. Perlik, W.P. Erickson, and M.D. Strickland. 2004. Bat Activity, Composition and Collision Mortality at a Large Wind Plant in Minnesota. Wildlife Society Bulletin 32(4): 1278-1288.
Johnson, G.D., K. Bay, J. Eddy, and T. Rintz. 2008a. Wildlife Baseline Studies for the Glenrock Wind Resource Area, Converse County, Wyoming. Prepared for CH2M Hill by Western EcoSystems Technology, Inc. (WEST), Cheyenne, Wyoming.
Johnson, G.D., J. Eddy, and A. Chatfield. 2008b. Wildlife Baseline Studies for the Seven Mile Hill Wind Resource Area, Carbon County, Wyoming: April 30, 2007 - November 15, 2007. Unpublished report prepared by Western EcoSystems Technology, Inc. (WEST) for CH2M Hill, Englewood, Colorado.
Johnson, G.D., K. Bay, and J. Eddy. 2009a. Wildlife Baseline Studies for the High Plains Wind Resource Area, Carbon and Albany Counties, Wyoming. Prepared for CH2M HILL by Western EcoSystems Technology, Inc. (WEST) Cheyenne, Wyoming.
Johnson, G.D., J. Eddy, and K. Bay. 2009b. Wildlife Baseline Studies for the Dunlap Ranch Wind Resource Area, Carbon County, Wyoming: June 4, 2008 - May 27, 2009. Unpublished report prepared by Western EcoSystems Technology, Inc. (WEST) for CH2M Hill, Englewood, Colorado.
Johnson, G.D., D. Solick, and J. Eddy. 2009c. Bat Acoustic Studies for the Simpson Ridge Wind Resource Area, Carbon County, Wyoming. Prepared for Horizon Wind Energy by Western EcoSystems Technology, Inc. (WEST), Cheyenne, Wyoming.
Kerlinger, P., R. Curry, L. Culp, A. Jain, C. Wilkerson, B. Fischer, and A. Hasch. 2006. Post-Construction Avian and Bat Fatality Monitoring for the High Winds Wind Power Project, Solano County, California: Two Year Report. Prepared for High Winds LLC, FPL Energy by Curry and Kerlinger, LLC. April 2006.
Kerlinger, P., R. Curry, A. Hasch, and J. Guarnaccia. 2007. Migratory Bird and Bat Monitoring Study at the Crescent Ridge Wind Power Project, Bureau County, Illinois: September 2005 - August 2006. Final draft prepared for Orrick Herrington and Sutcliffe, LLP. May 2007.
Hermosa West Anabat Survey Report
Western EcoSystems Technology, Inc. 11 July 9, 2010
Kerns, J. and P. Kerlinger. 2004. A Study of Bird and Bat Collisions at the Mountaineer Wind Energy Facility, Tucker County, West Virginia: Annual Report for 2003. Prepared for FPL Energy and the Mountaineer Wind Energy Center Technical Review Committee. February 14, 2004. Technical report prepared by Curry and Kerlinger, LLC., for FPL Energy and Mountaineer Wind Energy Center Technical Review Committee. Curry and Kerlinger, LLC. 39 pp. http://www.wvhighlands.org/Birds/MountaineerFinalAvianRpt-%203-15-04PKJK.pdf
Kronner, K., B. Gritski, and S. Downes. 2008. Big Horn Wind Power Project Wildlife Fatality Monitoring Study: 2006−2007. Final report prepared for PPM Energy and the Big Horn Wind Project Technical Advisory Committee by Northwest Wildlife Consultants, Inc. (NWC), Mid-Columbia Field Office, Goldendale, Washington. June 1, 2008.
Kunz, T.H., E.B. Arnett, B.M. Cooper, W.P. Erickson, R.P. Larkin, T. Mabee, M.L. Morrison, M.D. Strickland, and J.M. Szewczak. 2007a. Assessing Impacts of Wind-Energy Development on Nocturnally Active Birds and Bats: A Guidance Document. Journal of Wildlife Management 71(8): 2449-2486.
Kunz, T.H., E.B. Arnett, W.P. Erickson, A.R. Hoar, G.D. Johnson, R.P. Larkin, M.D. Strickland, R.W. Thresher, and M.D. Tuttle. 2007b. Ecological Impacts of Wind Energy Development on Bats: Questions, Research Needs, and Hypotheses. Frontiers in Ecology and the Environment 5(6): 315-324.
Larson, D.J. and J.P. Hayes. 2000. Variability in Sensitivity of Anabat II Detectors and a Method of Calibration. Acta Chiropterologica 2: 209-213.
Limpens, H.J.G.A. and G.F. McCracken. 2004. Choosing a Bat Detector: Theoretical and Practical Aspects. In: Bat Echolocation Research: Tools, Techniques, and Analysis. Brigham, R.M., E.K.V. Kalko, G. Jones, S. Parsons, and H.J.G.A. Limpens, eds. Bat Conservation International, Austin, Texas. Pp. 28-37.
Nicholson, C.P., J. R.D. Tankersley, J.K. Fiedler, and N.S. Nicholas. 2005. Assessment and Prediction of Bird and Bat Mortality at Wind Energy Facilities in the Southeastern United States. Final Report. Tennessee Valley Authority, Knoxville, Tennessee.
Norberg, U.M. and J.M.V. Rayner. 1987. Ecological Morphology and Flight in Bats (Mammalia; Chiroptera): Wing Adaptations, Flight Performance, Foraging Strategy and Echolocation. Philosophical Transactions of the Royal Society of London 316: 335-427.
Northwest Wildlife Consultants, Inc. (NWC) and Western EcoSystems Technology, Inc. (WEST). 2007. Avian and Bat Monitoring Report for the Klondike II Wind Power Project. Sherman County, Oregon. Prepared for PPM Energy, Portland, Oregon. Managed and conducted by NWC, Pendleton, Oregon. Analysis conducted by WEST, Cheyenne, Wyoming. July 17, 2007.
O’Shea, T.J., M.A. Bogan, and L.E. Ellison. 2003. Monitoring Trends in Bat Populations of the US and Territories: Status of the Science and Recommendations for the Future. Wildlife Society Bulletin 31: 16-29.
Piorkowski, M.D. 2006. Breeding Bird Habitat Use and Turbine Collisions of Birds and Bats Located at a Wind Farm in Oklahoma Mixed-Grass Prairie. M.S. Thesis. Oklahoma State University, Stillwater, Oklahoma. 112 pp. July 2006. http://www.batsandwind.org/pdf/Piorkowski_2006.pdf
Stantec Consulting Inc. (Stantec). 2008. 2007 Spring, Summer, and Fall Post-Construction Bird and Bat Mortality Study at the Mars Hill Wind Farm, Maine. Prepared for UPC Wind Management, LLC, Cumberland, Maine, by Stantec Consulting, formerly Woodlot Alternatives, Inc., Topsham, Maine. January, 2008.
Hermosa West Anabat Survey Report
Western EcoSystems Technology, Inc. 12 July 9, 2010
Taylor, K., J. Gruver, and K. Bay. 2008. Wildlife Studies for the Campbell Hill Wind Resource Area, Converse County, Wyoming. Fall Summary Report: September 9 - November 5, 2008. Prepared for Three Buttes Windpower, LLC/Duke Energy. Prepared by Western EcoSystems Technology, Inc. (WEST), Cheyenne, Wyoming. December 30, 2008.
Tierney, R. 2007. Buffalo Gap I Wind Farm Avian Mortality Study: February 2006-January 2007. Final Survey Report. Prepared for AES SeaWest, Inc. TRC, Albuquerque, New Mexico.TRC Report No. 110766-C-01. May 2007.
TRC Environmental Corporation. 2008. Post-Construction Avian and Bat Fatality Monitoring and Grassland Bird Displacement Surveys at the Judith Gap Wind Energy Project, Wheatland County, Montana. Prepared for Judith Gap Energy, LLC, Chicago, Illinois. TRC Environmental Corporation, Laramie, Wyoming. TRC Project 51883-01 (112416). January 2008. http://www.newwest.net/pdfs/AvianBatFatalityMonitoring.pdf
URS, W.P. Erickson, and L. Sharp. 2005. Phase 1 and Phase 1A Avian Mortality Monitoring Report for 2004-2005 for the SMUD Solano Wind Project. Prepared for Sacramento Municipal Utility District (SMUD), Sacramento, California. Co-Authors: Wally Erickson, Western EcoSystems Technology, Inc. (WEST) and Lynn Sharp, Environmental Consultant. August 2005.
White, E.P. and S.D. Gehrt. 2001. Effects of Recording Media on Echolocation Data from Broadband Bat Detectors. Wildlife Society Bulletin 29: 974-978.
Young, D.P. Jr., W.P. Erickson, K. Bay, S. Nomani, and W. Tidhar. 2009. Mount Storm Wind Energy Facility, Phase 1 Post-Construction Avian and Bat Monitoring, July - October 2008. Prepared for NedPower Mount Storm, LLC, Houston, Texas, by Western EcoSystems Technology (WEST), Inc., Cheyenne, Wyoming.
Young, D.P. Jr., W.P. Erickson, R.E. Good, M.D. Strickland, and G.D. Johnson. 2003. Avian and Bat Mortality Associated with the Initial Phase of the Foote Creek Rim Windpower Project, Carbon County, Wyoming, Final Report, November 1998 - June 2002. Prepared for Pacificorp, Inc. Portland, Oregon, SeaWest Windpower Inc. San Diego, California, and Bureau of Land Management, Rawlins District Office, Rawlins, Wyoming.
Young, D.P. Jr., W.P. Erickson, J. Jeffrey, and V.K. Poulton. 2007. Puget Sound Energy Hopkins Ridge Wind Project Phase 1 Post-Construction Avian and Bat Monitoring First Annual Report, January - December 2006. Technical report for Puget Sound Energy, Dayton, Washington and Hopkins Ridge Wind Project Technical Advisory Committee, Columbia County, Washington. Western EcoSystems Technology, Inc. (WEST) Cheyenne, Wyoming, and Walla Walla, Washington. 25 pp.
Young, D.P. Jr., J. Jeffrey, W.P. Erickson, K. Bay, and V.K. Poulton. 2006. Eurus Combine Hills Turbine Ranch. Phase 1 Post Construction Wildlife Monitoring First Annual Report. Technical report prepared for Eurus Energy America Corporation, San Diego, California, and the Combine Hills Technical Advisory Committee, Umatilla County, Oregon. Prepared by Western EcoSystems Technology, Inc. (WEST), Cheyenne, Wyoming, and Northwest Wildlife Consultants, Inc. (NWC), Pendleton, Oregon.
Hermosa West Anabat Survey Report
Western EcoSystems Technology, Inc. 13 July 9, 2010
Table 1. Mapped vegetation/habitat types, coverage, and
% composition within the Hermosa West Wind Resource Area.
Habitat Acres % Composition Grassland 9,735.14 87.56 Coniferous Forest 661.33 5.95 Riparian 397.70 3.58 Mountain Mahogany 131.30 1.18 Shrub Steppe 106.46 0.96 Riparian/Willow 86.01 0.77 Total 11,117.94 100.00
Hermosa West Anabat Survey Report
Western EcoSystems Technology, Inc. 14 July 9, 2010
Table 2 Bat species determined from range-maps
(Harvey et al. 1999, BCI website) as likely to occur within the Hermosa West Wind Resource Area, sorted by call frequency.
Common Name Scientific Name High Frequency (HF; ≥ 40 kHz) western small-footed bat Myotis ciliolabrum long-legged bat1 Myotis volans Mid Frequency (MF; 30-40 kHz) eastern red bat1,2,3 Lasiurus borealis western long-eared bat Myotis evotis little brown bat2 Myotis lucifugus Low Frequency (LF; < 30 kHz) pallid bat3 Antrozous pallidus Townsend's big-eared bat Corynorhinus townsendii big brown bat2 Eptesicus fuscus silver-haired bat1,2 Lasionycteris noctivagans hoary bat1,2 Lasiurus cinereus fringed bat Myotis thysanodes 1long-distance migrant; 2species known to have been found dead at wind-energy facilities; 3species occurrence based upon a single source

Hermosa West Anabat Survey Report
Western EcoSystems Technology, Inc. 15 July 9, 2010
Table 3. Results of acoustic bat surveys conducted at the Hermosa West Wind Resource Area, July 15 – November 3, 2009,
separated by call frequency (HF = high frequency, MF = mid frequency, LF = low frequency).
Anabat Station Type Type Habitat
# of HF Bat Passes
# of MF Bat Passes
# of LF Bat Passes
# of Eastern Red Bat Passes*
# of Hoary Bat Passes**
Total Bat
Passes Detector- Nights
Bat Passes/ Night
HE1g Fixed Ground Grassland 82 38 104 0 9 224 101 2.22±0.34 HE1h Fixed Raised Grassland 1 12 178 3 60 191 93 2.05±0.27
HE5m Temporary Ground Ponderosa
pine 52 17 23 1 2 92 13 7.08±2.03
HE6m Temporary Ground Riparian/ willow 113 69 198 2 21 380 17 22.35±8.19
HE7m Temporary Ground Riparian/
aspen 167 47 44 17 1 258 10 25.80±8.81
HE8m Temporary Ground Mountain mahogany 4 2 16 0 1 22 18 1.22±0.46
Total Temporary Ground 336 135 281 20 25 752 58 14.11±3.12 Grand Total 419 185 563 23 94 1,167 252 10.12±2.16
*Passes by eastern red bats included in mid-frequency (MF) numbers; **Passes by hoary bats included in low-frequency (LF) numbers.
Hermosa West Anabat Survey Report
Western EcoSystems Technology, Inc. 16 July 9, 2010
Table 4. Weekly bat activity and the contribution of each week (%) to total recorded activity for high-frequency (HF), mid-
frequency (MF), low-frequency (LF) and all bats at fixed stations within the Hermosa West Wind Resource Area.
Week
HF Pass Rate
HF % Composition
MF Pass Rate
MF % Composition
LF Pass Rate
LF % Composition
All Bats Pass Rate
All Bats % Composition
Cumulative % Composition
07/15/09 to 07/21/09 1.29 16.9 0.14 3.7 1.86 8.2 3.29 9.6 9.6 07/22/09 to 07/28/09 1.83 24.1 0.33 8.5 1.17 5.2 3.33 9.8 19.4 07/29/09 to 08/04/09 0 0 0.14 3.7 1.71 7.6 1.86 5.4 24.8 08/05/09 to 08/11/09 1.57 20.6 0.64 16.5 2.21 9.8 4.43 13 37.8 08/12/09 to 08/18/09 1.07 14.1 0.5 12.8 1.29 5.7 2.86 8.4 46.2 08/19/09 to 08/25/09 0.79 10.3 0.79 20.1 2.93 12.9 4.5 13.2 59.3 08/26/09 to 09/01/09 0.79 10.3 0.57 14.6 3.5 15.5 4.86 14.2 73.6 09/02/09 to 09/08/09 0.21 2.8 0.07 1.8 2.86 12.6 3.14 9.2 82.8 09/09/09 to 09/15/09 0.07 0.9 0.5 12.8 1.64 7.3 2.21 6.5 89.2 09/16/09 to 09/22/09 0 0 0.07 1.8 2 8.8 2.07 6.1 95.3 09/23/09 to 09/29/09 0 0 0.14 3.7 1.14 5 1.29 3.8 99.1 09/30/09 to 10/06/09 0 0 0 0 0.15 0.7 0.15 0.4 99.5 10/07/09 to 10/13/09 0 0 0 0 0 0 0 0 99.5 10/14/09 to 10/20/09 0 0 0 0 0.17 0.7 0.17 0.5 100 10/21/09 to 10/27/09 0 0 0 0 0 0 0 0 100 10/28/09 to 11/03/09 0 0 0 0 0 0 0 0 100

Hermosa West Anabat Survey Report
Western EcoSystems Technology, Inc. 17 July 9, 2010
Table 5. Weekly bat use and the contribution of each week (%) to total recorded activity for hoary bats and eastern red bats
at fixed stations within the Hermosa West Wind Resource Area, from July 15 – November 3, 2009.
Week Hoary Bat Pass Rate
Hoary Bat % Composition
Eastern Red Bat
Use
Eastern Red Bat
Composition All Bats
Use All Bats %
CompositionCumulative % Composition
07/15/09 to 07/21/09 0 0 0.43 7.6 3.29 9.6 9.6 07/22/09 to 07/28/09 0 0 0.17 3 3.33 9.8 19.4 07/29/09 to 08/04/09 0 0 0.71 12.7 1.86 5.4 24.8 08/05/09 to 08/11/09 0 0 0.93 16.5 4.43 13 37.8 08/12/09 to 08/18/09 0 0 0.5 8.9 2.86 8.4 46.2 08/19/09 to 08/25/09 0 0 0.93 16.5 4.5 13.2 59.3 08/26/09 to 09/01/09 0.14 66.7 0.21 3.8 4.86 14.2 73.6 09/02/09 to 09/08/09 0 0 0.5 8.9 3.14 9.2 82.8 09/09/09 to 09/15/09 0.07 33.3 0.43 7.6 2.21 6.5 89.2 09/16/09 to 09/22/09 0 0 0.64 11.4 2.07 6.1 95.3 09/23/09 to 09/29/09 0 0 0 0 1.29 3.8 99.1 09/30/09 to 10/06/09 0 0 0.08 1.4 0.15 0.4 99.5 10/07/09 to 10/13/09 0 0 0 0 0 0 99.5 10/14/09 to 10/20/09 0 0 0.08 1.5 0.17 0.5 100 10/21/09 to 10/27/09 0 0 0 0 0 0 100 10/28/09 to 11/03/09 0 0 0 0 0 0 100

Hermosa West Anabat Survey Report
Western EcoSystems Technology, Inc. 18 July 9, 2010
Table 6. Wind-energy facilities in North America with mortality data for bat species,
grouped by geographic region. Bat activity rates are included where available. To date, no bat fatality estimates or studies from Southwestern or Southeastern wind-energy facilities have been made public.
Wind Energy Facility Bat Use
EstimateA Mortality EstimateB
No. of Turbines
Total MW
Hermosa West, WY 2.22 Rocky Mountains and Western
Summerview, Alb. (2006) 14.62 39 70.2 Summerview, Alb. (2005/6) 10.27 39 70.2 Judith Gap, MT 8.93 90 135 Summerview, Alb. (2007) 8.23 39 70.2 Foote Creek Rim, WY (Phase I; 1999) 3.97 69 41.4 Foote Creek Rim, WY (Phase I; 2001/2002) 1.57 69 41.4 Foote Creek Rim, WY (Phase I; 2000) 2.2 1.05 69 41.4 Stateline, OR/WA (2003) 2.52 454 300 High Winds, CA (2004) 2.51 90 162 Nine Canyon, WA 2.47 37 48 Big Horn, WA 1.90 133 199.5 Combine Hills, OR 1.88 41 41 High Winds, CA (2005) 1.52 90 162 Stateline, OR/WA (2002) 1.20 454 300 Vansycle, OR 1.12 38 24.9 Klondike, OR 0.77 16 24 Hopkins Ridge, WA 0.63 83 150 Klondike II, OR 0.41 50 75 Wild Horse, WA 0.39 127 229 SMUD, CA 0.07 15
MidwestBlue Sky Green Field, WI 7.7D 24.57 88 145 Top of Iowa, IA (2004) 34.9C 10.27 89 80 Top of Iowa, IA (2003) 34.9C 7.16 89 80 Kewaunee County, WI 6.55 31 20 Buffalo Ridge, MN (Phases II & III; 2001) 2.2 4.03 281 210.75 Crescent Ridge, IL 3.27 33 49.5 Buffalo Ridge, MN (Phase III; 1999) 2.72 138 103.5 Buffalo Ridge, MN (Phase II; 1999) 2.59 143 107.25 Buffalo Ridge, MN (Phase II; 1998) 2.16 143 107.25 Buffalo Ridge, MN (Phases II & III; 2002) 1.9 1.73 281 210.75 NPPD Ainsworth, NE 1.16 36 59.4 Buffalo Ridge, MN (Phase I; 1999) 0.76 73 25
Southern PlainsOklahoma Wind Energy Center, OK 0.53 68 102 Buffalo Gap, TX 0.10 67 134
Hermosa West Anabat Survey Report
Western EcoSystems Technology, Inc. 19 July 9, 2010
Table 6. Wind-energy facilities in North America with mortality data for bat species, grouped by geographic region. Bat activity rates are included where available. To date, no bat fatality estimates or studies from Southwestern or Southeastern wind-energy facilities have been made public.
Wind Energy Facility Bat Use
EstimateA Mortality EstimateB
No. of Turbines
Total MW
NortheasternBuffalo Mountain, TN (2006) 39.70 18 29 Mountaineer, WV 38.3 31.69 44 66 Buffalo Mountain, TN (2000-2003) 23.7 31.54 3 2 Meyersdale, PA 18.00 20 30 Casselman, PA 15.66 23 34.5 Maple Ridge, NY (2006) 15.00 120 198 Noble Bliss, NY 14.66 67 100 Mount Storm, WV (2008) 35.2 12.11 82 164 Maple Ridge, NY (2007) 9.42 195 321.75 Noble Ellenburg, NY 5.45 54 80 Noble Clinton, NY 3.63 67 100.5 Mars Hill, ME (2007) 2.91 28 42 A=bat passes per detector night B=number of bat fatalities/MW/year C=averaged across phases and/or study years, and may not be directly related to mortality estimates D=bat activity not measured concurrently with bat mortality studies Data from the following sources: Facility Use Estimate Mortality Estimate Facility Use Estimate Mortality Estimate Summerview, Alb. (06) Baerwald 2008 Kewaunee County, WI Howe et al. 2002 Summerview, Alb. (05/06) Brown and Hamilton 2006 Buffalo Ridge, MN (Phase II& III; 01) Johnson et al. 2004 Judith Gap, MT TRC 2008 Crescent Ridge, IL Kerlinger et al. 2007 Summerview, Alb. (07) Baerwald 2008 Buffalo Ridge, MN (Phase III; 99) Johnson et al. 2004 Foote Creek Rim, WY (Phase I; 99) Young et al. 2003 Buffalo Ridge, MN (Phase II; 99) Johnson et al. 2000 Johnson et al. 2004 Foote Creek Rim, WY (Phase I; 01/02) Gruver 2002 Young et al. 2003 Buffalo Ridge, MN (Phase II; 98) Johnson et al. 2000 Johnson et al. 2004 Foote Creek Rim, WY (Phase I; 00) Gruver 2002 Young et al. 2003 Buffalo Ridge, MN (Phase II& III; 02) Johnson et al. 2004 Stateline, OR/WA (03) Erickson et al. 2004 NPPD Ainsworth, NE Derby et al. 2007 High Winds, CA (04) Kerlinger et al. 2006 Buffalo Ridge, MN (Phase I; 99) Johnson et al. 2000 Nine Canyon, WA Erickson et al. 2003 Oklahoma Wind Energy Center, OK Piorkowski 2006 Big Horn, WA Kronner et al. 2008 Buffalo Gap, TX Tierney 2007 Combine Hills, OR Young et al. 2006 Buffalo Mountain, TN (06) Fiedler et al. 2007 High Winds, CA (05) Kerlinger et al. 2006 Mountaineer, WV Arnett (pers comm. 2005) Kerns and Kerlinger 2004 Stateline, OR/WA (02) Erickson et al. 2004 Buffalo Mountain, TN (00-03) Fiedler 2004 Nicholson et al. 2005 Vansycle, OR Erickson et al. 2000 Meyersdale, PA Arnett et al. 2005 Klondike, OR Johnson et al. 2003 Casselman, PA Arnett et al. 2009 Hopkins Ridge, WA Young et al. 2007 Maple Ridge, NY (06) Jain et al. 2007 Klondike II, OR NWC and WEST 2007 Noble Bliss, NY Jain et al. 2009c Wild Horse, WA Erickson et al. 2008 Mount Storm, WV (08) Young et al. 2009 Young et al. 2009 SMUD, CA URS et al. 2005 Maple Ridge, NY (07) Jain et al. 2008 Blue Sky Green Field, WI Gruver 2008 Gruver et al. 2010 Noble Ellensburg, NY Jain et al. 2009a Top of Iowa, IA (04) Jain 2005 Jain 2005 Noble Clinton, NY Jain et al. 2009b Top of Iowa, IA (03) Jain 2005 Jain 2005 Mars Hill, ME (07) Stantec 2008
Hermosa West Anabat Survey Report
Western EcoSystems Technology, Inc. 20 July 9, 2010
Table 7. Bat activity indices for several wind resource areas in Wyoming.
Wind Resource Area Location Bat passes/
Detector night Reference Glenrock/Rolling Hills Converse County 0.29 Johnson et al. 2008a Campbell Hill Converse County 2.03 Taylor et al. 2008 Seven Mile Hill Carbon County 2.90 Johnson et al. 2008b Dunlap Ranch Carbon County 1.67 Johnson et al. 2009b Simpson Ridge Carbon County 1.79 Johnson et al. 2009c High Plains Carbon/Albany Counties 3.76 Johnson et al. 2009a Foote Creek Rim Carbon County 2.20 Gruver 2002 Hermosa West Albany County 2.22 This study Mean 2.11
Hermosa West Anabat Survey Report
Western EcoSystems Technology, Inc. 21 July 9, 2010
Figure 1. Study area map and Anabat sampling stations at the Hermosa West Wind Resource Area.
Hermosa West Anabat Survey Report
Western EcoSystems Technology, Inc. 22 July 9, 2010
Figure 2. Percentage of Anabat detectors (n = 3) at the Hermosa West Wind Resource Area operating during each night of the study period July 15 – November 3, 2009. The detector used for temporary stations was in use at another project area between September 18 and October 4.

Hermosa West Anabat Survey Report
Western EcoSystems Technology, Inc. 23 July 9, 2010
Figure 3. Bat use and noise files detected per detector-night for fixed stations at the Hermosa West Wind Resource Area for the study period July 15 – November 3, 2009, presented by week. Noise files are indicated on the second axis.
Hermosa West Anabat Survey Report
Western EcoSystems Technology, Inc. 24 July 9, 2010
Figure 4. Number of bat passes per detector-night by Anabat station at the Hermosa West Wind Resource Area for the study period July 15 – November 3, 2009. For this study, stations HE1g and HE1h are paired ground and raised detectors. One detector was moved among temporary stations HE5m – HE8m. The bootstrapped standard errors are represented on the ‘All Bats’ columns.

Hermosa West Anabat Survey Report
Western EcoSystems Technology, Inc. 25 July 9, 2010
Figure 5. Number of high-frequency (HF), mid-frequency (MF), and low-frequency (LF) bat passes per detector-night recorded at the paired Anabat station with ground and raised detectors at the Hermosa West Wind Resource Area for the study period July 15 – November 3, 2009.
Hermosa West Anabat Survey Report
Western EcoSystems Technology, Inc. 26 July 9, 2010
Figure 6. Nightly sampling effort in relation to bat activity for temporary Anabat stations at the Hermosa West Wind Resource Area for the study period July 15 – November 3, 2009. For example, the detector at station HE6m was operable between August 25 – September 2, and between September 9 – 14. Nightly bat activity is plotted on the second axis. The detector used at temporary stations was in use at another project area between September 18 and October 4.
0
2
4
6
8
10
12
145
6
7
8
Bat
Act
ivity
(pas
ses
per
dete
ctor
-nig
ht)
Tem
pora
ry S
tatio
n N
umbe
r
Date
Hermosa West Anabat Survey Report
Western EcoSystems Technology, Inc. 27 July 9, 2010
Figure 7. Weekly bat use by high-frequency (HF), mid-frequency (MF), and low-frequency (LF) bats at fixed stations at the Hermosa West Wind Resource Area for the study period July 15 – November 3, 2009.

Hermosa West Anabat Survey Report
Western EcoSystems Technology, Inc. 28 July 9, 2010
Figure 8. Empirical cumulative distribution of bat passes at ground and raised stations within the Hermosa West Wind Resource Area, July 15 – November 3, 2009. Dashed vertical lines indicate the point at which 50% of the calls occurred, an indication of the median date of bat activity.

Hermosa West Anabat Survey Report
Western EcoSystems Technology, Inc. 29 July 9, 2010
Figure 9. Number of passes per detector–night by hoary bats and eastern red bats recorded at Anabat stations within the Hermosa West Wind Resource Area, for the study period July 15 – November 3, 2009.

Hermosa West Anabat Survey Report
Western EcoSystems Technology, Inc. 30 July 9, 2010
Figure 10. Weekly activity by hoary bats and eastern red bats at fixed stations within the Hermosa West Wind Resource Area for the study period July 15 – November 3, 2009.

This page intentionally left blank.
Hermosa West Wind Energy Project Draft EIS Appendix G
DOE/EIS-0438 September 2012
APPENDIX G
TRIBAL CONSULTATION LETTER

Appendix G Hermosa West Wind Energy Project Draft EIS
September 2012 DOE/EIS-0438
This page intentionally left blank


This page intentionally left blank.
Hermosa West Wind Energy Project Draft EIS Appendix H
DOE/EIS-0438 September 2012
APPENDIX H
PALEONTOLOGIC RESOURCES ANALYSIS LETTER REPORT

Appendix H Hermosa West Wind Energy Project Draft EIS
September 2012 DOE/EIS-0438
This page intentionally left blank

1
Erathem-Vanir Geological Consultants 3359 Summit Drive, Pocatello, ID 83201
Phone/Fax (208) 232-5212 Cell Phone (208) 244-1161 Email [email protected]
14 May 2010
PALEONTOLOGIC RESOURCES ANALYSIS LETTER REPORT (EVG-2010-03) Project: Shell Wind Energy, Inc. has applied to construct, operate and maintain the Hermosa West Wind Farm Project (Project) in southeast Albany County, Wyoming, near Tie Siding (Figure 1-1). Location: The Project encompasses Section 31, T13N, R72W; Sections 22, 23,25, 26, 27, 28, 34, 35, and 36, T13N, R73W; Sections 6, 7, 8, 17, and 18, T12N, R72W and Sections 1, 2, 3, 12, and 13, T12N,, R73W (Figure 1-1, 1-2). Summary of Work Conducted and Recommendations: A paleontological review was conducted for the Project by Erathem-Vanir Geological Consultants (EVG). The review included a geological map and literature review and fossil locality records search. The records search was conducted at the University of Wyoming. No existing fossil localities within the Project were revealed as a result of the records search. Based on the results of this map and literature review a spot inspection for fossils of any kind was recommended and conducted for geological outcrops mapped as the Pennsylvanian/Permian Fountain and Casper Formation within the Project. No fossils of any kind were discovered during field inspection and although inspection was hindered by extensive snow cover, EVG determined that deep regolithic soil and thin loess deposits cover most of the exposures of the Casper Formation in the Project. As a result the Casper Formation is very poorly exposed in the Project. It also appears that none of the outcrops present in the Project contain limestone beds from which Casper Formation fossils have been previously recovered. This review, as well as the nature of Wind Farm construction, indicates that it is very unlikely that any significant fossil resources will be encountered during development of the wind turbines, meteorological towers, substation, buildings, electrical connections, or access roads. As a result, no specific recommendations are made for fossil resources for the Project; however, if fossils of suspected scientific importance are discovered during construction a qualified paleontologist should be notified to evaluate the discovery. Paleontological Principal Investigator (PI)/Field Investigator (FI): PI - Gustav F. Winterfeld, PhD, (EVG), Pocatello, ID. FI – Thomas M. Bown, PhD, EVG, Westminster, CO.

2
Project Description: The proposed Hermosa West Wind Farm Project would consist of a maximum of 200 wind turbines with a total generating capacity of up to 300 megawatts of electricity. The Project would also include a wind energy collection system, on-site operation and maintenance (O&M) building, underground collector lines, a transmission line and substation, associated access roads, and upgrades to facilities owned by the Western Area Power Administration. The wind turbines would be arranged in roughly 11 collinear “strings”; each turbine string would be situated within an approximately 250 foot (ft) wide corridor, except for strings located in areas with steep topography, which would be located within an approximately 400 ft wide corridor in order to be safely constructed. This corridor design approach allows for turbines to be moved during the design phase within the corridor to avoid, when possible, wetlands, water bodies, cultural sites, and other environmentally sensitive areas, while the actual construction footprint will be much smaller. These corridors have been designed to incorporate landowner requirements and setbacks. Access roads and power collection lines will also be located within these corridors where feasible to minimize the Project’s overall footprint. For parts of the Project where it is not feasible to locate the access roads and power collection lines within the turbine string corridors, 250 ft wide corridors will be utilized in these areas. The precise locations of each turbine within the corridor would be based on the wind turbine model selected and other criteria such as optimal wind speed, geotechnical conditions, environmental considerations, and landowner requested setbacks. Geologic Map Coverage: Ver Ploeg, A.J., Boyd, C.S. and Kirkaldie, A.L., 2000, Preliminary digital geologic map of the Laramie 30 minute x 60 minute Quadrangle, Albany and Laramie Counties, Wyoming: Wyoming State Geological Survey, Geologic Hazards Section Digital Map HSDM 00-1, scale 1:100000. Love, J. D. and A. Christiansen, 1985. Geologic Map of Wyoming. Scale 1:500,000 (Figure 1-3). Work Conducted/Personnel: At the request of Environmental Resource Management (ERM), EVG’s Principal Scientist, Dr. Winterfeld conducted a study of the paleontology of the Project area. Dr. Gustav F. Winterfeld, is a registered Professional Geologist with 32 years field experience, and is considered to be an expert in the geology and paleontology of Wyoming. He has directed and performed literature and records reviews and conducted field geological and paleontological surveys for projects including coal mines, trona mines, pipelines, dam sites, flood control projects, gravel mining, housing developments, road construction, transmission lines, and well pads. He has analyzed environmental impacts to fossil resources and recommended and implemented mitigation and resource recovery programs for paleontological resources for clients including the federal, state and local government agencies, and private companies.
3
The preliminary study conducted by Dr. Winterfeld included literature and records reviews and searches, specifically:
• a geological review to identify the nature and ages of geological units within the Project area;
• a paleontological review to identify known and potential fossil-bearing rock units
within the area;
• a paleontological locality search to identify known fossil localities which was conducted at the Department of Geology and Geophysics at The University of Wyoming, in Laramie by Dr. Michael Cassiliano;
• a review of the paleontological significance of known or potential fossils that
occur within the area or the same geological units that occur nearby. As a result of the study, Dr. Winterfeld has included recommendation for a spot inspection for fossils of any kind was recommended and conducted for geological outcrops mapped as the Pennsylvanian/Permian Fountain and Casper Formation within the Project. Dr. Thomas M. Bown conducted a spot inspection of geological outcrops on April 27, 2010 and was accompanied by Ms. Kathryn Wanka with ERM, Houston, Texas. Dr. Bown is a paleontologist with over 40 years geological and paleontological experience and is considered an expert in the paleontology and geology of the western United States. Paleontology Definitions and Significance: Paleontology (Gk paleos = ancient ology = study of) is a biologic and geologic scientific discipline involving the study of fossil materials. Despite the tremendous volumes of sedimentary deposits preserved world-wide and the total number of organisms that must have lived, fossils (Greek: to be dug up) are rare and considered nonrenewable resources. Only a small percentage of all organisms that have ever lived have been preserved by fossilization. Even fewer are destined to be discovered, recovered, curated into museum collections and studied. Paleontological resources or fossils include the body remains, traces, or imprints of plants or animals that has been preserved in the Earth’s crust since some past geologic or prehistoric time. Generally in order to be considered fossil the remains must be older than Recent (10,000 years) in age. All fossils contain scientific information, but not all fossils are considered to have high scientific significance. Among paleontologists, fossils are generally considered to be scientifically significant if they are unique, unusual, or rare, diagnostically or stratigraphically important, or add to the existing body of knowledge in a specific area of the science. Government land agencies consider all vertebrate fossils to be scientifically significant. Invertebrate and plant fossils may be determined to be significant depending on the nature of the fossils on a case-by-case

4
basis. Petrified wood is treated as a mineral material and may be collected or purchased under the Material Sales Act of 1947. Fossils are of scientific interest as records of ancient life because of their rarity and the scientific information they contain. They provide information about the relationships of living organisms, their ancestry, and their former distribution. Progressive morphologic changes seen in fossil lineages provide critical information on the evolutionary process--the ways new species arise and organisms adapt or fail to adapt to changing environmental circumstances. Fossils also serve as important guides to the ages of the rocks in which they are contained and are useful in determining the temporal relationships of rock units from one area to another and the timing of geologic events. Time scales established by fossils provide relative chronologic frameworks for geologic studies of all kinds. Fossils can also provide clues to depositional environments of sedimentary rocks in which they are preserved, and they can be important indicators of ancient climates, and they help document climatic change, locally and globally. Results of Geological Map and Literature Review: The Project is located near Tie Siding, Wyoming, just east of US Highway 287, about 15 miles south of Laramie. The southern boundary of the Project extends to the Wyoming/Colorado border. The Project is included in the Rocky Mountain Foreland Structural Province, an area characterized by broad intermontane basins surrounded by massive reverse fault bounded uplifts with Precambrian rocks exposed in their cores. The Project overlies the southern end of the Laramie Range, which is composed chiefly of granite monandnocks that rise above a broad erosion surface and form extensive unwooded parks with surfaces generally at about 7,000 feet in elevation. Eastward-north eastward drainages from south to north that cross the area include, Fish Creek, Willow Creek, Boulder Creek, Forest Creek and Government Creek. As mapped by Ver Ploeg and others (2000) and Love and Christiansen (1985), rocks of Precambrian, Pennsylvanian/Permian and sediments of Quaternary (Pleistocene and Holocene) occur in the Project area. Precambrian Rocks Granite (Ys on Figure 1-3) that comprises the bulk of the Laramie Range is part of the Sherman Batholith that was emplaced about 1.4 billion years ago. The Sherman Granite forms the core of the range and underlies most of the Project area at depth. It is exposed at the surface in the southeastern part of the Project, east of Cherokee Park Road. The Laramie Range is composed of lesser amounts of metasedimentary and metavolanic rocks including pelitic schist, marble, granite gneiss, layered amphobolite, and felsic gneiss (Xsv on Figure 1-3). These rocks are exposed in the northeastern part of the Project along Willow Creek, east of Cherokee Park Road. The Precambrian rocks, including the Sherman Granite and metasedimentary and metavolcanic rocks forming the Laramie Range and exposed in the Project have no paleontological potential.
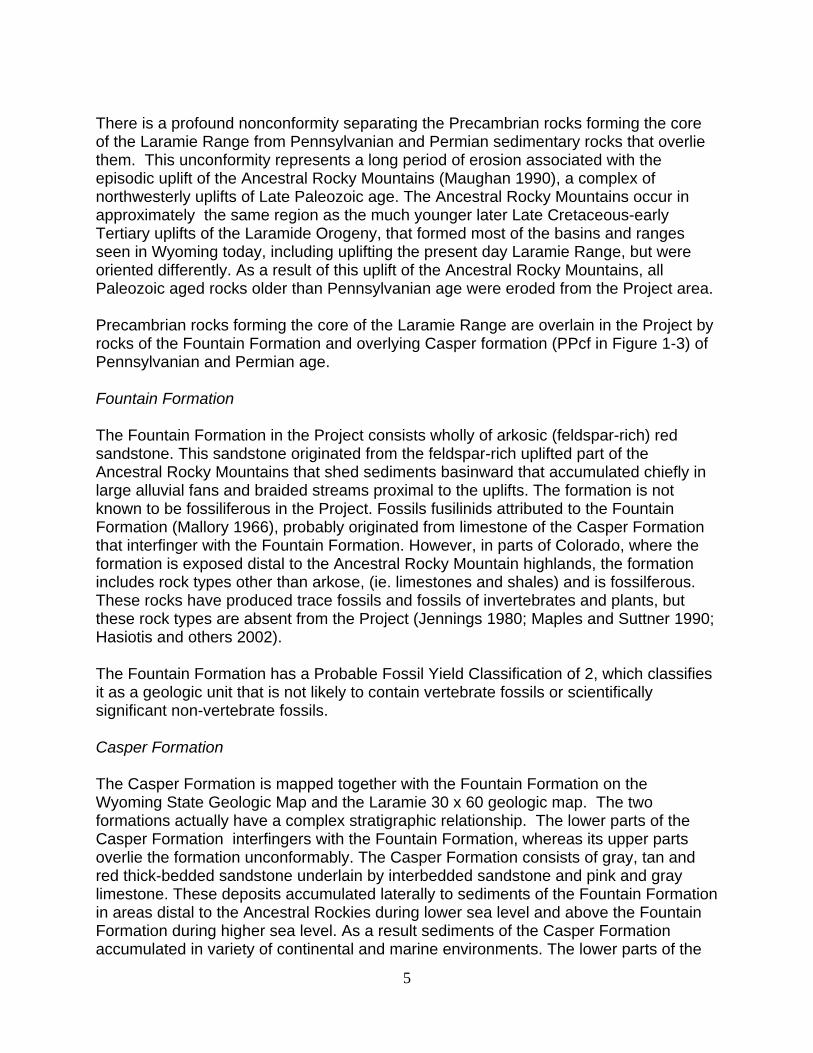
5
There is a profound nonconformity separating the Precambrian rocks forming the core of the Laramie Range from Pennsylvanian and Permian sedimentary rocks that overlie them. This unconformity represents a long period of erosion associated with the episodic uplift of the Ancestral Rocky Mountains (Maughan 1990), a complex of northwesterly uplifts of Late Paleozoic age. The Ancestral Rocky Mountains occur in approximately the same region as the much younger later Late Cretaceous-early Tertiary uplifts of the Laramide Orogeny, that formed most of the basins and ranges seen in Wyoming today, including uplifting the present day Laramie Range, but were oriented differently. As a result of this uplift of the Ancestral Rocky Mountains, all Paleozoic aged rocks older than Pennsylvanian age were eroded from the Project area. Precambrian rocks forming the core of the Laramie Range are overlain in the Project by rocks of the Fountain Formation and overlying Casper formation (PPcf in Figure 1-3) of Pennsylvanian and Permian age. Fountain Formation The Fountain Formation in the Project consists wholly of arkosic (feldspar-rich) red sandstone. This sandstone originated from the feldspar-rich uplifted part of the Ancestral Rocky Mountains that shed sediments basinward that accumulated chiefly in large alluvial fans and braided streams proximal to the uplifts. The formation is not known to be fossiliferous in the Project. Fossils fusilinids attributed to the Fountain Formation (Mallory 1966), probably originated from limestone of the Casper Formation that interfinger with the Fountain Formation. However, in parts of Colorado, where the formation is exposed distal to the Ancestral Rocky Mountain highlands, the formation includes rock types other than arkose, (ie. limestones and shales) and is fossilferous. These rocks have produced trace fossils and fossils of invertebrates and plants, but these rock types are absent from the Project (Jennings 1980; Maples and Suttner 1990; Hasiotis and others 2002). The Fountain Formation has a Probable Fossil Yield Classification of 2, which classifies it as a geologic unit that is not likely to contain vertebrate fossils or scientifically significant non-vertebrate fossils. Casper Formation The Casper Formation is mapped together with the Fountain Formation on the Wyoming State Geologic Map and the Laramie 30 x 60 geologic map. The two formations actually have a complex stratigraphic relationship. The lower parts of the Casper Formation interfingers with the Fountain Formation, whereas its upper parts overlie the formation unconformably. The Casper Formation consists of gray, tan and red thick-bedded sandstone underlain by interbedded sandstone and pink and gray limestone. These deposits accumulated laterally to sediments of the Fountain Formation in areas distal to the Ancestral Rockies during lower sea level and above the Fountain Formation during higher sea level. As a result sediments of the Casper Formation accumulated in variety of continental and marine environments. The lower parts of the
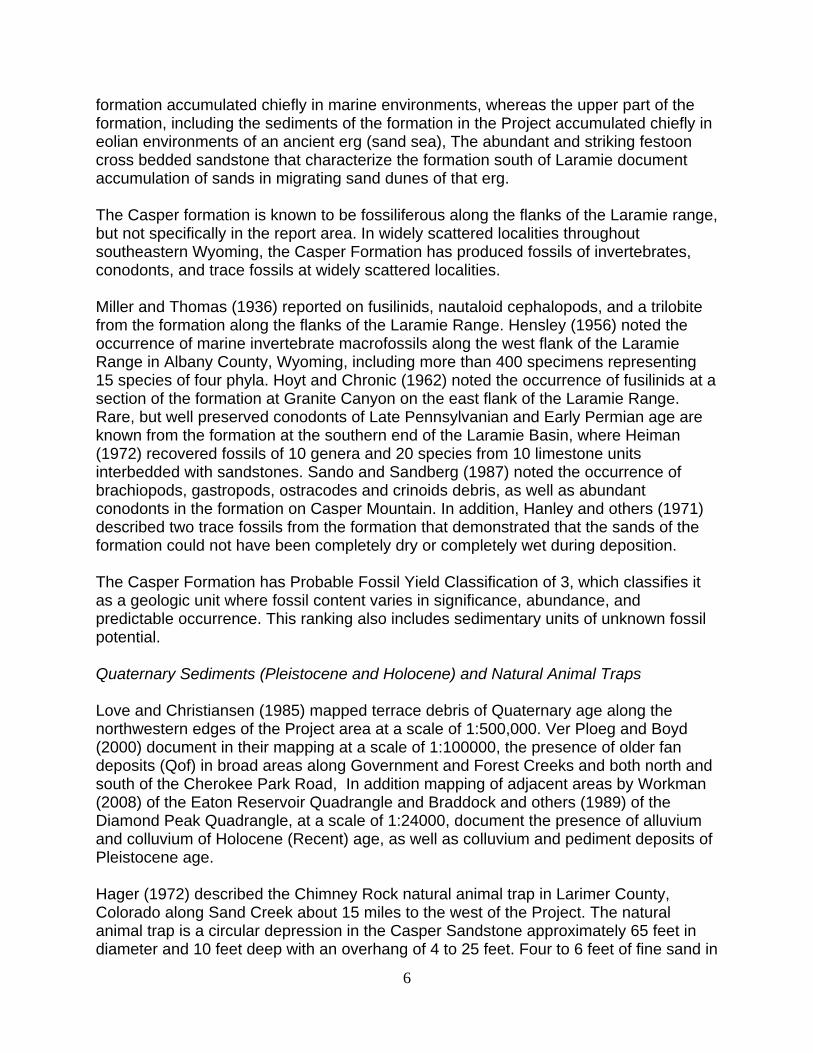
6
formation accumulated chiefly in marine environments, whereas the upper part of the formation, including the sediments of the formation in the Project accumulated chiefly in eolian environments of an ancient erg (sand sea), The abundant and striking festoon cross bedded sandstone that characterize the formation south of Laramie document accumulation of sands in migrating sand dunes of that erg. The Casper formation is known to be fossiliferous along the flanks of the Laramie range, but not specifically in the report area. In widely scattered localities throughout southeastern Wyoming, the Casper Formation has produced fossils of invertebrates, conodonts, and trace fossils at widely scattered localities. Miller and Thomas (1936) reported on fusilinids, nautaloid cephalopods, and a trilobite from the formation along the flanks of the Laramie Range. Hensley (1956) noted the occurrence of marine invertebrate macrofossils along the west flank of the Laramie Range in Albany County, Wyoming, including more than 400 specimens representing 15 species of four phyla. Hoyt and Chronic (1962) noted the occurrence of fusilinids at a section of the formation at Granite Canyon on the east flank of the Laramie Range. Rare, but well preserved conodonts of Late Pennsylvanian and Early Permian age are known from the formation at the southern end of the Laramie Basin, where Heiman (1972) recovered fossils of 10 genera and 20 species from 10 limestone units interbedded with sandstones. Sando and Sandberg (1987) noted the occurrence of brachiopods, gastropods, ostracodes and crinoids debris, as well as abundant conodonts in the formation on Casper Mountain. In addition, Hanley and others (1971) described two trace fossils from the formation that demonstrated that the sands of the formation could not have been completely dry or completely wet during deposition. The Casper Formation has Probable Fossil Yield Classification of 3, which classifies it as a geologic unit where fossil content varies in significance, abundance, and predictable occurrence. This ranking also includes sedimentary units of unknown fossil potential. Quaternary Sediments (Pleistocene and Holocene) and Natural Animal Traps Love and Christiansen (1985) mapped terrace debris of Quaternary age along the northwestern edges of the Project area at a scale of 1:500,000. Ver Ploeg and Boyd (2000) document in their mapping at a scale of 1:100000, the presence of older fan deposits (Qof) in broad areas along Government and Forest Creeks and both north and south of the Cherokee Park Road, In addition mapping of adjacent areas by Workman (2008) of the Eaton Reservoir Quadrangle and Braddock and others (1989) of the Diamond Peak Quadrangle, at a scale of 1:24000, document the presence of alluvium and colluvium of Holocene (Recent) age, as well as colluvium and pediment deposits of Pleistocene age. Hager (1972) described the Chimney Rock natural animal trap in Larimer County, Colorado along Sand Creek about 15 miles to the west of the Project. The natural animal trap is a circular depression in the Casper Sandstone approximately 65 feet in diameter and 10 feet deep with an overhang of 4 to 25 feet. Four to 6 feet of fine sand in
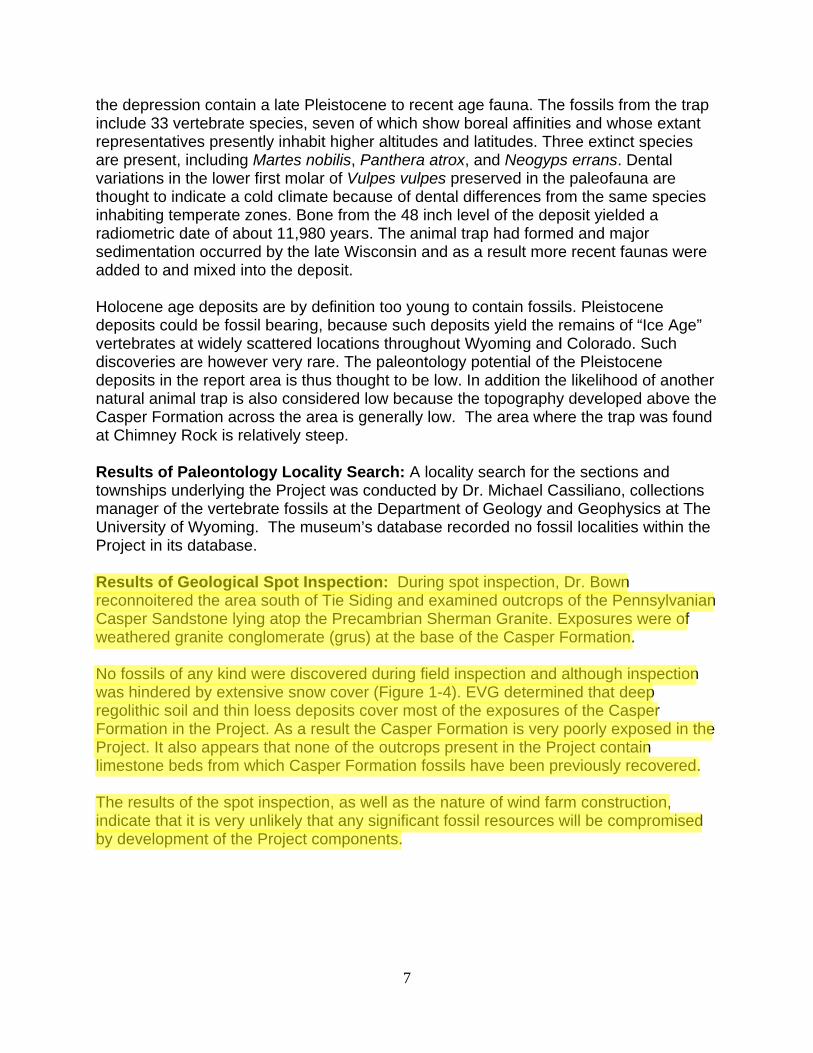
7
the depression contain a late Pleistocene to recent age fauna. The fossils from the trap include 33 vertebrate species, seven of which show boreal affinities and whose extant representatives presently inhabit higher altitudes and latitudes. Three extinct species are present, including Martes nobilis, Panthera atrox, and Neogyps errans. Dental variations in the lower first molar of Vulpes vulpes preserved in the paleofauna are thought to indicate a cold climate because of dental differences from the same species inhabiting temperate zones. Bone from the 48 inch level of the deposit yielded a radiometric date of about 11,980 years. The animal trap had formed and major sedimentation occurred by the late Wisconsin and as a result more recent faunas were added to and mixed into the deposit. Holocene age deposits are by definition too young to contain fossils. Pleistocene deposits could be fossil bearing, because such deposits yield the remains of “Ice Age” vertebrates at widely scattered locations throughout Wyoming and Colorado. Such discoveries are however very rare. The paleontology potential of the Pleistocene deposits in the report area is thus thought to be low. In addition the likelihood of another natural animal trap is also considered low because the topography developed above the Casper Formation across the area is generally low. The area where the trap was found at Chimney Rock is relatively steep. Results of Paleontology Locality Search: A locality search for the sections and townships underlying the Project was conducted by Dr. Michael Cassiliano, collections manager of the vertebrate fossils at the Department of Geology and Geophysics at The University of Wyoming. The museum’s database recorded no fossil localities within the Project in its database. Results of Geological Spot Inspection: During spot inspection, Dr. Bown reconnoitered the area south of Tie Siding and examined outcrops of the Pennsylvanian Casper Sandstone lying atop the Precambrian Sherman Granite. Exposures were of weathered granite conglomerate (grus) at the base of the Casper Formation. No fossils of any kind were discovered during field inspection and although inspection was hindered by extensive snow cover (Figure 1-4). EVG determined that deep regolithic soil and thin loess deposits cover most of the exposures of the Casper Formation in the Project. As a result the Casper Formation is very poorly exposed in the Project. It also appears that none of the outcrops present in the Project contain limestone beds from which Casper Formation fossils have been previously recovered. The results of the spot inspection, as well as the nature of wind farm construction, indicate that it is very unlikely that any significant fossil resources will be compromised by development of the Project components.

8
Recommendations for Fossil Resources: No specific recommendations are made for fossil resources for the Project; however, if fossils of suspected scientific importance are discovered during construction a qualified paleontologist should be notified to evaluate the discovery. Sincerely,
Gustav F. Winterfeld Ph.D. 14 May 2010 Gustav F. Winterfeld, Ph.D. Date Principal Scientist Cited References: Braddock, W.A., Cole, J.C. and Eggler, D.H., 1989, Geologic map of the Diamond Peak quadrangle, Larimer County, Colorado, and Albany County, Wyoming: U.S. Geological Survey, Geologic Quadrangle Map GQ-1614, scale 1:24000. Hager, M. W. 1972. A late Wisconsin–Recent vertebrate fauna from the Chimney Rock animal trap, Larimer County, Colorado. Wyoming Contributions to Geology 2:63–71. Hanley, J. H., Steidtmann, J. R., and H. Toots, (1971). Trace fossils from the Casper Formation (Permian) of the southern Laramie Basin, Wyoming and Colorado. Journal of Sedimentary Petrology, December 1971, Vol. 41, Issue 4, pp. 1065-1068 Hasiotis S., Feldman, H.R. snd L. J. Suttner (2002). Sequence stratigraphy of a wave-dominated fan delta in the Fountain Formation (Morrowan-Atokan) near Colorado Springs, Colorado in AAPG Hedberg Conference “Late Paleozoic Tectonics and Hydrocarbon Systems of Western North America – The Greater Ancestral Rockies, July 21-26, 2002 Vail, Colorado. Heiman, M. (1972). A conodont definition of the Pennsylvanian-Permian boundary in southeastern Wyoming. Abstracts with Programs - Geological Society of America, 4(6), 380. Hensley, F. S., Jr. (1956). Some macrofossils of the Pennsylvanian-Permian Casper Formation along the west flank of the Laramie Range, Albany County, Wyoming. Masters Abstracts International. Vol. 45, no. 5. Hoyt J. and J. Chronic, (1962). Atokan fusulinids from the Casper Formation, east flank of the Laramie Mountains, Wyoming. Journal of Paleontology V. 36(1):161-164. Jennings J. (1980). Fossil plants from the Fountain Formation (Pennsylvanian) of Colorado. Journal of Paleontology, V. 54(1):149-158. Love, J.D., and A.C. Christiansen. 1985. Geologic Map of Wyoming. U.S. Geological Survey and Wyoming Geological Survey; Scale 1:500000.

9
Mallory, W. M. (1966). Pennsylvanian and awsociated rocks in Wyoming. USGS Professional Paper 554: 236-263. Maples, C. G and L. J. Suttner. (1990). Trace fossils and marine−nonmarine cyclicity in the Fountain Formation (Pennsylvanian: Morrowan/Atokan) near Manitou Spring, Colorado. Journal of Paleontology 64: 859–880. Maughan, E. K. (1990) Summary of the Ancestral Rock Mountain epeirogeny in Wyoming and adjacent areas. USGS open File Report OF90-447: 9 p. Miller, A. K., and H. D. Thomas (1936). The Casper Formation (Pennsylvanian) of Wyoming and its cephalopod fauna." Journal of Paleontology V. 10(8) (1936): 715-738. Sando, W. and C. A. Sandberg (1987). New interpretations of Paleozoic stratigraphy and history in the northern Laramie Range and vicinity, Southeast Wyoming. U. S. Geological Survey Professional Paper, 1450:45 p. Ver Ploeg, A.J., Boyd, C.S. and Kirkaldie, A.L. (2000), Preliminary digital geologic map of the Laramie 30 minute x 60 minute Quadrangle, Albany and Laramie Counties, Wyoming: Wyoming State Geological Survey, Geologic Hazards Section Digital Map HSDM 00-1, scale 1:100000. Workman, R. J. (2008). Geologic map of the the Eaton Reservoir Quadrangle, Larimer County, Colorado and Albany County, Wyoming. USGS Scientific Investigations Map 3029. Scale 1:24,000. Other Pertinent References (identified by Literature Search) EBSCOR Reference Search
Terms: Casper Formation, Fountain Formation Google Scholar Search
Terms: Fountain Formation (N=634), Casper Formation (N=234) Other Search Terms: Tensleep Formation, Fossils Fountain Formation, Fossils Casper Formation, Trace Fossils Wyoming, Natural Animal Traps
Bilodeau, S. (1987). Geology of Boulder, Colorado, United States of America. Bulletin of the Association of Engineering Geologists, 24(3), 289-332. Burns, D. (2007). Idealized stratal column for a mixed carbonate/clastic system; Casper Formation, southeastern Wyoming, USA. Abstracts with Programs - Geological Society of America, 39(6), 149. Burns, D. M. (2005). An analogy to the maximum flooding surface of a transgressive systems tract in a regressive systems tract; Pennsylvanian-Permian Casper Formation, southeastern Wyoming, USA. Abstracts with Programs - Geological Society of America V. 37(7): 142. De Voto, R. H. (1973). Sedimentation associated with tectonism of ancestral Rock Mountains. American Association of Petroleum Geologists Bulletin V. 57 (4) (1973): 775.

10
Diehl, J. (1976). Paleomagnetism of the Casper Formation in southeastern Wyoming. Eos, Transactions, American Geophysical Union, 57(12), 903. Diehl, J. (1981). Paleomagnetic results from the Late Carboniferous/Early Permian Casper Formation; implications for Northern Appalachian tectonics. Earth and Planetary Science Letters, 54(2), 281-292. Dutta, P. (1986). Alluvial sandstone composition and paleoclimate; II, Authigenic mineralogy. Journal of Sedimentary Petrology, 56(3), 346-358. Ellis, C. (1966). Paleontologic age of the Fountain Formation south of Denver, Colorado. Mountain Geologist, V. 3(4):155-160. Garner, H. (1963). Fountain Formation, Colorado; a discussion. Geological Society of America Bulletin V. 74(10):1299-1301. Gibson, D. (2005). Geology of Boulder flatirons; the Fountain Formation. Proceedings - Geoscience Information Society, 35125. Girty, G. (1931). Carboniferous invertebrates, Part 3. Journal of the Washington Academy of Sciences V. 21(16):390-397. Grose, T. (1993). Overview of the geology of the east flank of the Front Range. Colorado School of Mines Quarterly, 93(1), 19-20. Hager, M. W. 1972. A late Wisconsin–Recent vertebrate fauna from the Chimney Rock animal trap, Larimer County, Colorado. Wyoming Contributions to Geology 2:63–71. Hanley, J. H., Steidtmann, J. R., and H. Toots, (1971). Trace fossils from the Casper Formation (Permian) of the southern Laramie Basin, Wyoming and Colorado. Journal of Sedimentary Petrology, December 1971, Vol. 41, Issue 4, pp. 1065-1068 Hanley, J. (1972). Origin of limestone lentils in the Casper Formation (Penn. Perm.), southern Laramie Basin, Wyoming. Abstracts with Programs - Geological Society of America, 4(6), 379-380. Hanley, J. (1973). Petrology of limestone lenses in the Casper Formation, southernmost Laramie Basin, Wyoming and Colorado. Journal of Sedimentary Petrology, 43(2), 428-434. Hansen, S. (1992). Probable rhizoliths in mottled marine limestones, Casper Formation (Penn.-Perm.), southeastern Wyoming. Abstracts with Programs - Geological Society of America, 24(6), 17. Hansen, S. A., 1992. Animal and plant ichnology of the Permo-Pennsylvanian Casper Formation, Southeast Wyoming. Masters Abstracts International. Vol. 45, no. 6. 1992. Haywood, H. (1973). Depositional processes of the Casper Sandstone in the southernmost Laramie Basin as indicated by settling velocities of light and heavy minerals [e-book]. United States: 1973. Available from: GeoRef, Ipswich, MA. Accessed October 22, 2009.
11
Hoyt, J. (1962). Pennsylvanian and Lower Permian of northern Denver Basin, Colorado, Wyoming, and Nebraska. Bulletin of the American Association of Petroleum Geologists, 46(1), 46-59. Kairo, S. (1989). Cyclic sedimentation in an orogenic setting; the Fountain Formation (Pennsylvanian) near Colorado Springs. Abstracts with Programs - Geological Society of America, 21(4), 16-17. Kelly, A. O. (1984). Significance of interdune deposits in the upper Casper Formation. Guidebook - Wyoming Geological Association 35.(1984): 97-110. Kluth, C. (2006). Reinterpretation of the geometry and orientation of the late Paleozoic Frontrange Uplift. Abstracts with Programs - Geological Society of America, 38(6), 29. Langford R. (1982). A new conodont locality in the Fountain Formation. Abstracts with Programs - Geological Society of America V. 14(6):319. Langford, R. (1982). Depositional systems and geologic history of the lower part of the Fountain Formation, Manitou Embayment, Colorado [e-book]. United States: 1982. Available from: GeoRef, Ipswich, MA. Accessed October 22, 2009. Larson, E. (1984). Characteristic remanent magnetization of boulders and cobbles in red beds of Pennsylvanian and Permian age in Colorado. Eos, Transactions, American Geophysical Union, 65(45), 864. Loope, D. (1980). Caliche in the late Paleozoic Fountain Formation; rediscovery and implications. Abstracts with Programs - Geological Society of America V.12(7):473. Loope, D. (1988). Rhizoliths in ancient eolianites. Sedimentary Geology V. 56(1-4):301-314. Maughan, E. K., 1960. Pennsylvanian and Permian strata in southern Wyoming and northern Colorado. United States: Rocky Mtn. Assoc. Geologists: 95-104 Maughan, E. K. (1963) Permian and Pennsylvanian strata in southern Wyoming and northern Colorado: Rocky Mtn. Assoc. Geologists : Denver, CO, United States; 1960. McKee, E. D. (1979). Ancient sandstones considered to be eolian. U. S. Geological Survey Professional Paper (1979): 187-238. Napp, K. (1985). Depositional systems of Fountain Formation and its basinal equivalents, northwestern Denver Basin, Colorado. AAPG Bulletin, 69(5), 857-858. Pearson, E. F. "Significance of thin carbonates in interpreting the depositional environments of thick clastic sequences." Contributions to Geology 13.2 (1974): 63-66. GeoRef. EBSCO. Web. 22 Oct. 2009. Pearson, E. (1974). Significance of thin carbonates in interpreting the depositional environments of thick clastic sequences. Contributions to Geology V. 13(2):63-66.

12
Pederson, S. L., 1953. Stratigraphy of the Fountain and Casper Formations in the southern part of the Laramie Basin, southeastern Wyoming and north-central Colorado. Bulletin of the Geological Society of America V. 64(12), Part 2 (1953): 1551. Pederson, S.L. (1953). Stratigraphy of the Casper and Fountain formations of southeastern Wyoming and north-central Colorado. Guidebook - Wyoming Geological Association 8.(1953): 18-25. 2009. Pederson, S. l. (1954). Permian (Wolfcampian) fauna of the Casper Formation of southeastern Wyoming. Journal of Paleontology V. 28(1):17-21. Shultz, A. (1982). Fountain Formation near Canon City, Colorado; atypical stratigraphy and sedimentation. Abstracts with Programs - Geological Society of America, 14(6), 349. Stanesco, J. (2004). Discovering the ancestral Rockies; a guided field inquiry for first semester geology students. Abstracts with Programs - Geological Society of America, 36(5), 159. Steidtmann J. R. (1974). Evidence for Eolian Origin of Cross-Stratification in Sandstone of the Casper Formation, Southernmost Laramie Basin, Wyoming. Geological Society of America Bulletin, V. 85(12):1835-1842. Steidtmann, J. R. (1976). Eolian origin of sandstone in the Casper Formation, southernmost Laramie Basin, Wyoming. Professional Contributions of the Colorado School of Mines V. 8:86-95. Steidtmann, J. R. (1987). Sandstones of the Casper Formation of the southern Laramie Basin, Wyoming; type locality for festoon cross-lamination Centennial field guide. United States: Geol. Soc. Am. : Boulder, CO, United States, 1987. Steidtmann, J. R. (1972). The origin of large-scale, trough-shaped cross-stratification in the Casper Formation (Penn.-Perm.), Southern Laramie Basin, Wyoming." Abstracts with Programs - Geological Society of America 4.7 (1972): 676. Suttner L. M. (1987). Trace fossils from the Lower Pennsylvanian part of the Fountain Formation, Manitou Springs, Colorado. Abstracts with Programs - Geological Society of America V. 19(7):860-861. Suttner, L. (1982). New interpretation of the stratigraphic relationship between the Fountain Formation (Pennsylvanian) and its Glen Eyrie Member near Colorado Springs. Abstracts with Programs - Geological Society of America, 14(6), 351. Suttner, L. (1984). Climatic influence on Fountain sedimentation in the Manitou Embayment. United States: Soc. Econ. Paleontol. and Mineral. : Tulsa, OK, United States. Suttner, L. (1985). Field Trip 4; Guide to the field study of alluvial fan and fan-delta deposits in the Fountain Formation (Pennsylvania-Permian), Colorado. United States: Third Int. Fluvial Sed. Conf. : Fort Collins, CO, United States.

13
Suttner, L. (1986). Alluvial sandstone composition and paleoclimate; I, Framework mineralogy. Journal of Sedimentary Petrology, 56(3), 329-345. Suttner, L. (1987). Marine trace fossils from the Lower Pennsylvanian part of the Fountain Formation, Manitou Springs, Colorado. Abstracts with Programs - Geological Society of America, 19(7), 860-861. Suttner, L. (1988). Influence of depositional processes on the composition of sandstone in a wave-dominated fan delta. AAPG Bulletin, 72(2), 252. Sweet, D. (2005). Periglacial features in the Fountain Formation (Permo-Pennsylvanian, Colorado)?. Abstracts with Programs - Geological Society of America, 37(6), 43. Sweet, D. (2005). Periglacial features in the paleoequatorial Fountain Formation (Permo-Pennsylvanian), Colorado?. Eos, Transactions, American Geophysical Union, 86(52, Suppl.), pp11b Sweet, D. (2008). Polygonal cracking in coarse clastics records cold temperatures in the equatorial Fountain Formation (Pennsylvanian-Permian, Colorado). Palaeogeography, Palaeoclimatology, Palaeoecology, 268(3-4), 193-204. Thomas, H. D. (1953). Stratigraphy of the Casper Formation, Part 1 of Fusulinids of the Casper Formation of Wyoming. Bulletin - Geological Survey of Wyoming 46: 5-14. Thompson, M. L. (1953). Systematic paleontology of fusulinids from the Casper Formation, Part 2, of Fusulinids of the Casper Formation of Wyoming. Bulletin - Geological Survey of Wyoming 46: 15-56. Warren, T. (1960). Stratigraphy and sedimentation of the Pennsylvanian-Permian Fountain Formation, Fremont County, Colorado [e-book Weimer, R. (1987). Paleozoic-Mesozoic section; Red Rocks Park, I-70 road cut, and Rooney Road, Morrison area, Jefferson County, Colorado Centennial field guide. United States: Geological Society America. Boulder, CO, United States.
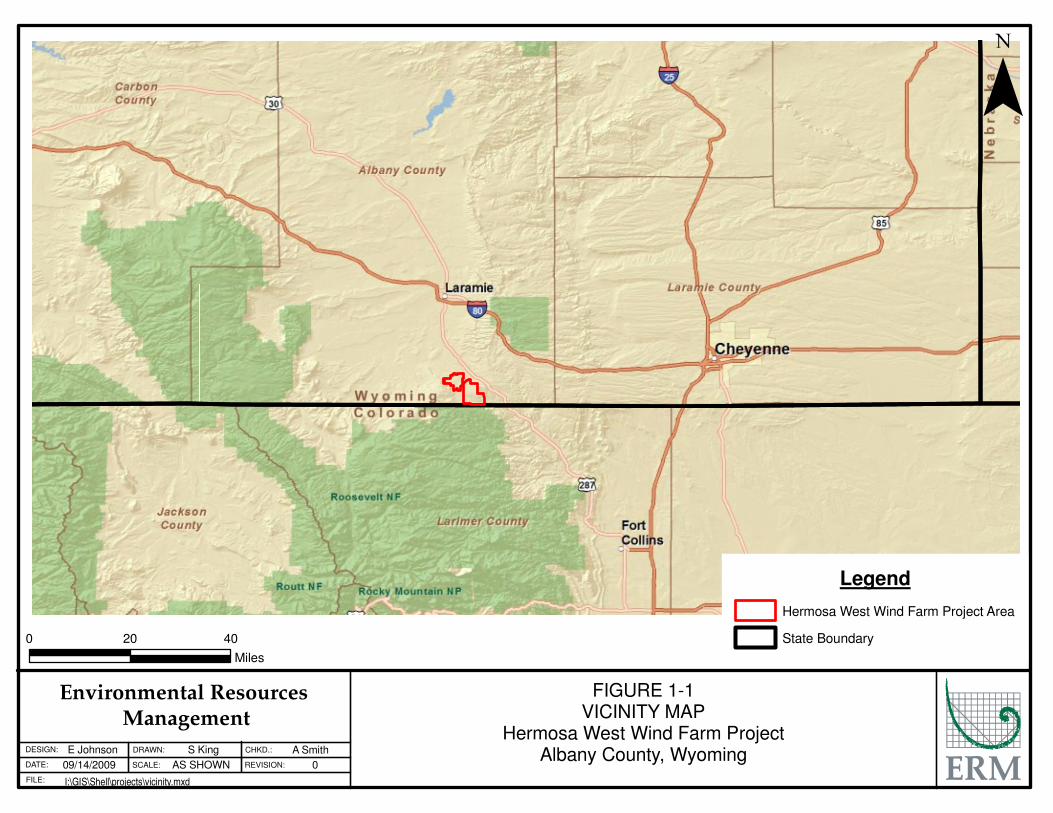
0 20 40
Miles
FIGURE 1-1
VICINITY MAP
Hermosa West Wind Farm Project
Albany County, WyomingE Johnson
09/14/2009
S King
AS SHOWN
A Smith
0
I:\GIS\Shell\projects\vicinity.mxdFILE:
DATE:
DESIGN: DRAWN:
SCALE:
CHKD.:
REVISION:
Environmental Resources Management
¯
Legend
Hermosa West Wind Farm Project Area
State Boundary
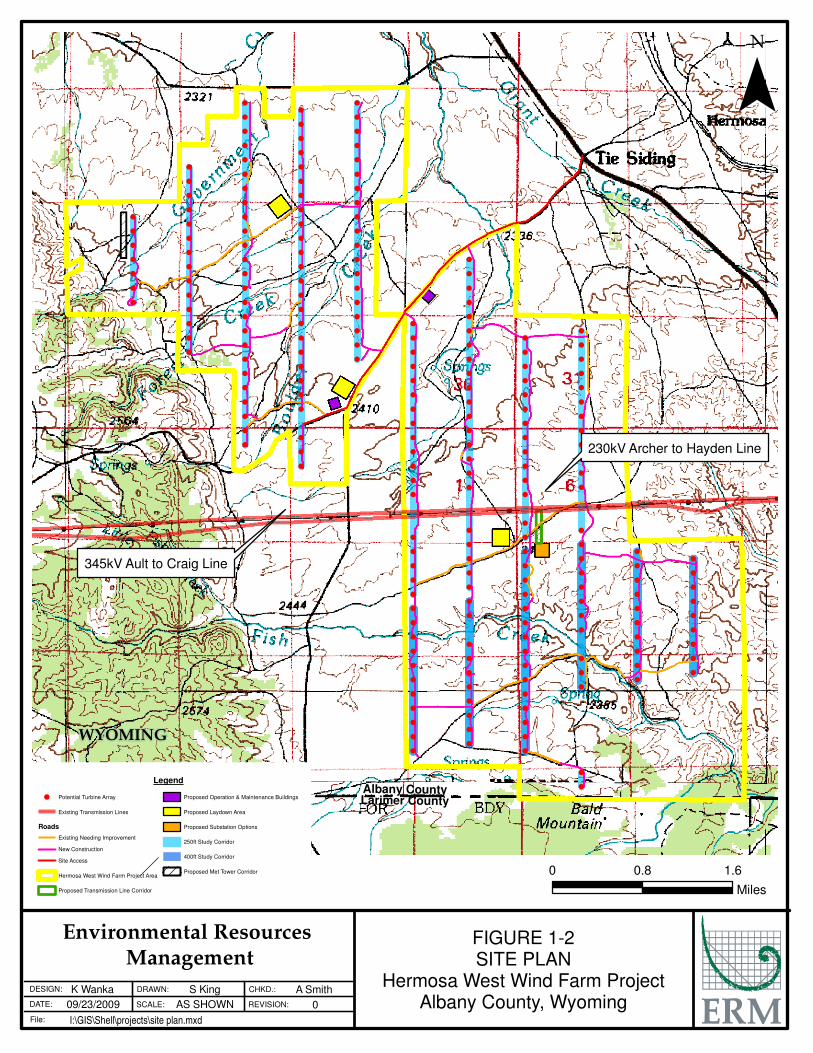
!
!
!
!
!
!
! !
! ! !
! ! !
! !
! !
! ! !
! ! !
! ! !
! ! !
! ! !
! !
! !
! !
! !
! !
! ! !
! ! !
! ! !
! ! !
! ! !
! ! !
! ! ! !
! ! ! !
! ! ! !
! ! !
! ! ! !
! ! ! !
! ! ! !
! ! ! !
! ! !
! ! !
! ! !
! !
! !
! !
! !
! !
! !
! !
! !
! !
! !
! !
! !
! !
! ! !
! ! !
! ! !
! ! !
! ! !
! ! !
! ! !
! ! !
! ! !
! !
! !
!
! !
! !
! ! !
! ! !
! ! !
! !
! ! !
! ! !
! ! !
! ! !
! ! ! !
! ! ! !
! ! !
! !
! !
! !
! !
! !
! !
! !
! !
! !
! !
! !
!
!
!
!
!
Albany CountyLarimer County
¯
0 0.8 1.6
Miles
FIGURE 1-2
SITE PLAN
Hermosa West Wind Farm Project
Albany County, Wyoming
K Wanka
09/23/2009
S King
AS SHOWN
A Smith
0
I:\GIS\Shell\projects\site plan.mxdFile:
DATE:
DESIGN: DRAWN:
SCALE:
CHKD.:
REVISION:
Environmental Resources Management
Legend
! Potential Turbine Array
Existing Transmission Lines
Roads
Existing Needing Improvement
New Construction
Site Access
Hermosa West Wind Farm Project Area
Proposed Transmission Line Corridor
Proposed Operation & Maintenance Buildings
Proposed Laydown Area
Proposed Substation Options
250ft Study Corridor
400ft Study Corridor
Proposed Met Tower Corridor
345kV Ault to Craig Line
230kV Archer to Hayden Line
WYOMING
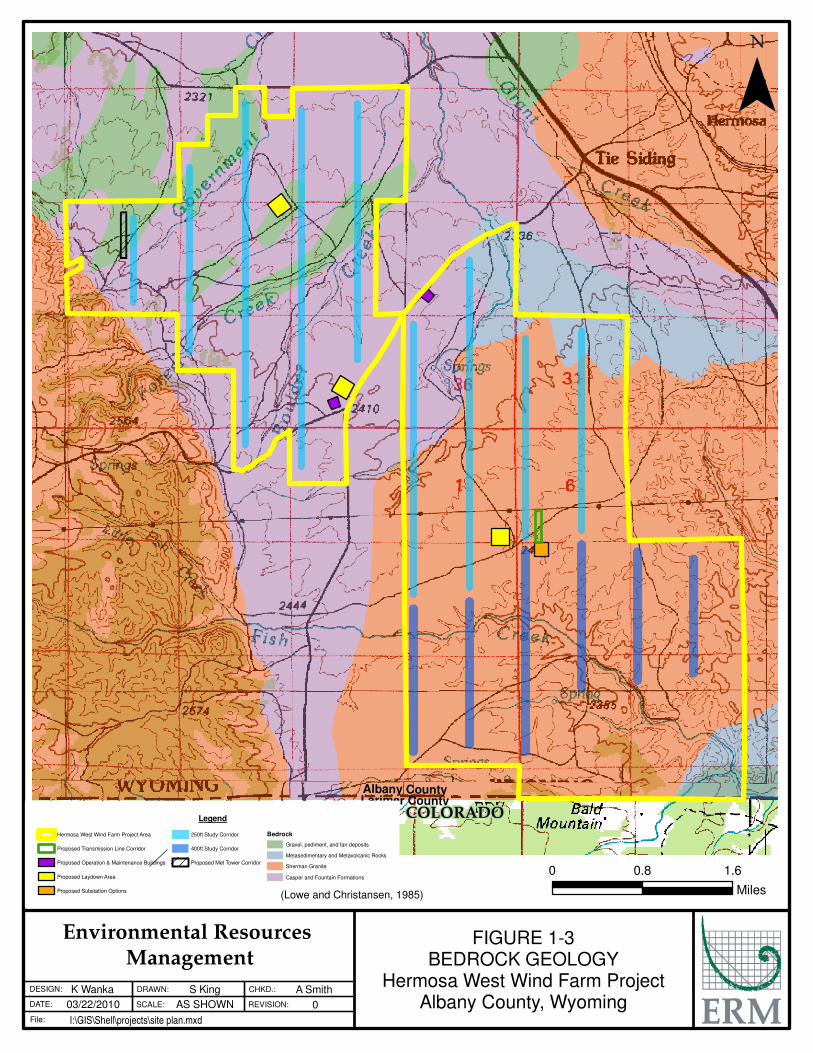
Albany CountyLarimer County
¯
0 0.8 1.6
Miles
FIGURE 1-3
BEDROCK GEOLOGY
Hermosa West Wind Farm Project
Albany County, Wyoming
K Wanka
03/22/2010
S King
AS SHOWN
A Smith
0
I:\GIS\Shell\projects\site plan.mxdFile:
DATE:
DESIGN: DRAWN:
SCALE:
CHKD.:
REVISION:
Environmental Resources Management
Legend
Hermosa West Wind Farm Project Area
Proposed Transmission Line Corridor
Proposed Operation & Maintenance Buildings
Proposed Laydown Area
Proposed Substation Options
250ft Study Corridor
400ft Study Corridor
Proposed Met Tower Corridor
Bedrock
Gravel, pediment, and fan deposits
Metasedimentary and Metavolcanic Rocks
Sherman Granite
Casper and Fountain Formations
COLORADO
(Lowe and Christansen, 1985)

FIGURE 1-4
SITE PHOTOGRAPHS
Hermosa West Wind Farm Project
Albany County, Wyoming
A Smith
05/14/2010
S King
AS SHOWN
A Smith
0
I:\GIS\Shell\Hermosa\projects\photos.mxdFile:
DATE:
DESIGN: DRAWN:
SCALE:
CHKD.:
REVISION:
Environmental Resources Management
View to southwest of regolithic soil (foreground) and sandstone of Casper Formation
(middle distance) from NAD83, UTM Zone 13T 0454684mE, 04548775mN.
View to south of regolithic soil and weathered sandstones of Casper Formation
from UTM (NAD83) Zone 13T 0454684mE, 04548775mN.

This page intentionally left blank.
Hermosa West Wind Energy Project Draft EIS Appendix I
DOE/EIS-0438 September 2012
APPENDIX I
NOISE ASSESSMENT

Appendix I Hermosa West Wind Energy Project Draft EIS
September 2012 DOE/EIS-0438
This page intentionally left blank

Hermosa West Wind Energy Project Draft EIS Appendix I
DOE/EIS-0438 September 2012
NOISE ASSESSMENT, UPDATED, MARCH 15, 2012

Appendix I Hermosa West Wind Energy Project Draft EIS
September 2012 DOE/EIS-0438
This page intentionally left blank
Hermosa West Wind Farm: Updated Noise Assessment
Shell WindEnergy Albany County, Wyoming
March 15, 2012
www.erm.com
Delivering sustainable solutions in a more competitive world
Texas Registered Engineering Firm F-2393
Shell WindEnergy
Hermosa West Wind Farm:
Updated Noise Assessment
March 15, 2012
Project No. 0116974
Albany County, Wyoming
Alicia Smith, REM
Partner-in-Charge
Kurtis Schlicht
Project Manager Environmental Resources Management 15810 Park Ten Place, Suite 300 Houston, Texas 77084-5140 T: 281-600-1000 F: 281-600-1001
Texas Registered Engineering Firm F-2393 G:\2012\0116974\17117Hrpt.doc ii
TABLE OF CONTENTS
1.0 INTRODUCTION 1
1.1 BACKGROUND 1 1.2 SCOPE OF ASSESSMENT 1
1.2.1 Glossary of Terms 2
2.0 NOISE CRITERIA 5
2.1 APPLICABLE NOISE CRITERIA FOR WIND TURBINE NOISE 5 2.2 REVIEW OF WIND TURBINE NOISE CRITERIA 5 2.3 HERMOSA WEST WIND TURBINE NOISE OPERATIONAL
NOISE CRITERIA 5 2.4 CONSTRUCTION NOISE 6
3.0 BASELINE NOISE & METEOROLOGICAL DATA 7
3.1 NOISE 7 3.2 EXISTING AMBIENT LAEQ NOISE LEVELS 10
4.0 CALCULATION PROCEDURES 11
5.0 RESULTS 13
5.1 SUMMARY OF OPERATIONAL NOISE ASSESSMENT 15 5.2 CONSTRUCTION NOISE 16 5.3 SUBSTATION NOISE 16 5.4 WIND TURBINE NOISE & ALLEGED HEALTH EFFECTS 17 5.5 VIBRATION 18
5.5.1 Construction 18 5.5.2 Operation 19
6.0 CONCLUSION 20
APPENDICES A GE 1.5MW RESULTS B SIEMENS 2.3MW RESULTS C VESTAS V90 3MW RESULTS D PREDICTED NOISE LEVELS AT BOUNDARY LOCATIONS

Texas Registered Engineering Firm F-2393 G:\2012\0116974\17117Hrpt.doc iii
TABLE OF CONTENTS (Cont’d) List of Tables 1-1 Examples of Noise Levels on a Decibel Scale 3-1 Summary of Noise Measurement Locations 3-2 Summary of Measured Ambient LAeq Noise Levels 4-1 Assumed Octave Band Sound Power Level Spectral Shape (dB) for Wind
Turbines 4-2 Wind Turbine Sound Power Levels (dB) for the Wind Turbines (hub height
80m/262 feet, corrected to 10m/33 feet) at Increasing Wind Speeds 5-1 Predicted Wind Turbine Noise from the GE 1.5 MW (Normal Operation) at the
Closest Noise Sensitive Receivers 5-2 Predicted Wind Turbine Noise from the Siemens SWT 2.3 MW (Normal
Operation) at the Closest Noise Sensitive Receivers 5-3 Predicted Wind Turbine Noise from the Vestas V90 3 MW (Mode 0) at the
Closest Noise Sensitive Receivers 5-4 Predicted Noise Levels at Boundary Locations as Identified on Figure 4 List of Figures 1 Location of Noise Sensitive Properties, Project Area and Layout for GE1.5 MW
Turbines 2 Location of Noise Sensitive Properties, Project Area and Layout for Siemens
SWT 2.3 MW Turbines 3 Location of Noise Sensitive Properties, Project Area and Layout for Vestas V90
3 MW Turbines 4 Location of Noise Sensitive Properties, Project Area and Representative
Boundary Noise Assessment Points
Environmental Resources Management G:\2012\0116974\17117Hrpt.doc Texas Registered Engineering Firm F-2393
1
1.0 INTRODUCTION
1.1 BACKGROUND This report is an update to the ERM Hermosa West Wind Farm Project Noise Assessment that was initiated in 2010. Data in this report will be used to estimate the noise impacts of three selected turbine models and layouts on the closest noise sensitive properties. It concluded that there were no significant operational wind turbine noise impacts when assessed against the Albany County noise criteria of 55 dB(A) at any point along the common property lines and at the closest representative noise sensitive properties. This noise assessment has taken into account additional data collected since the initial study, including newly measured baseline noise data at representative noise sensitive properties associated with the project. In general, noise from wind turbines increases with the wind speed up to the ‘rated power’ when the noise then remains constant or reduces at higher wind speeds. Background noise, noise experienced at a property in the absence of wind turbine noise, tends to increase with wind speed at a rate greater than that of wind turbines, the effect of which can be to mask wind farm noise. Currently the only standards for addressing noise for this project are those established by Albany County Wind Energy Siting Regulations which require a standard of 55 dB(A) along the common property lines. The purpose of baseline noise data presented in this report is to understand the existing environment of the area and to compare turbine noise levels to measured ambient noise levels in addition to the assessment against the Albany County criteria.
1.2 SCOPE OF ASSESSMENT This noise assessment provides a refined noise prediction model taking account of pre-existing background noise levels to assess wind turbine generator (WTG) noise at the closest representative noise sensitive properties and at the project site boundary. As set out in the March 2010 assessment, the project shall consist of a maximum of 200 wind turbines with a total generating capacity of up to 300 megawatts (MW) of electricity. Although the precise layout and turbine type have yet to be selected, the following three options have been considered:
• 224 GE 1.5MW wind turbines (normal operation), hub height 80m and total capacity of 336MW;
• 147 Siemens SWT 2.3MW wind turbines (normal operation), hub height 80m and total capacity of 338 MW; and
• 113 Vestas V90 3MW wind turbines (mode 0), hub height 80m and total capacity of 339MW.
Environmental Resources Management G:\2012\0116974\17117Hrpt.doc Texas Registered Engineering Firm F-2393
2
The Project area is within Albany County, Wyoming; approximately 18 miles south east of the City of Laramie; with the town of Tie Siding located to the north-northeast of the Project area. There are a number of isolated properties in and around the Project area; nine of which have been selected as representative of the closest noise affected properties. The reactions of individuals to the windfarm will be very context specific, and will result from a complex mixture of site and receptor specific factors. This study has followed the guidance proposed for Albany County which has been adopted to indicate a level which provides an objective means of assessing the effects on resources and the surrounding community.
1.2.1 Glossary of Terms The terms ‘sound’ and ‘noise’ tend to be used interchangeably, but noise can be defined as unwanted sound. Sound is a normal and desirable part of life. However, when noise is imposed on people it can lead to disturbance, annoyance and other undesirable effects. Noise is measured and quantified using decibels (dB), and examples of noise levels are shown in Table 1-1.
TABLE 1-1: Examples of Noise Levels on a Decibel Scale
Noise Level, dB(A) Typical noise source / example
0 “Threshold of hearing” – lowest sound an average person can hear
20 Standard required in a broadcasting or recording studio – just audible
30 Library or soft whisper at 5 feet – this is very quiet
40 Bedroom or living room
50 Conversational speech at 3 feet
60 Busy general office or air conditioning unit at 20 feet
70 Traffic on freeway at 50 feet
80 Pneumatic drill at 50 feet
90 Heavy truck at 50 feet
140 “Threshold of Pain” – maximum tolerable noise level such as very close to a jet engine or similar
The dB(A) scale is a particular way of measuring the different frequencies in sound, designed to match how the human ear perceives sound, called the ‘A’-weighting.
The decibel scale is logarithmic, which means that noise levels do not add up or change according to simple linear arithmetic. For example, adding two equal noise sources results in a doubling of sound energy, which gives a combined noise level that is 3 dB higher than the individual levels. For example, adding 60 dB and 60 dB equals 63 dB. However, even though the energy levels have doubled, the ear perceives only a slight increase in loudness instead of a doubling because human hearing responds to changes in noise logarithmically. This means that a relatively large
Environmental Resources Management G:\2012\0116974\17117Hrpt.doc Texas Registered Engineering Firm F-2393
3
change in sound energy is needed before it is perceived to be louder or quieter. For example, it is generally accepted that:
• an increase or decrease of 1 dB cannot usually be heard in everyday conditions (although possible in ‘laboratory’ conditions);
• an increase or decrease of 3 dB is generally accepted as the smallest change that is noticeable in ordinary conditions;
• an increase or decrease of 5 dB is a clearly perceptible change in noise; and
• an increase or decrease of 10 dB is perceived to be a doubling (or halving) of perceived loudness.
Sound can be distinguished by its content, and Hertz (Hz) is the unit used to describe the tonality or the frequency content of sound. The lowest frequency that can be identified as sound by a person with good hearing is approximately 20Hz. Frequencies below this (infrasound) can be detected, but are perceived as a feeling in the body as opposed to an actual sound. At the other end of the scale, the highest frequency that can he heard may be up to 20,000Hz (20KHz), but this depends on factors such as age, health and previous exposure to noise and an upper range between 16 and 18 KHz might be more representative. Sound below 20Hz is referred to as ‘infrasound’, and sound between 10Hz and 200Hz is often described as ‘low frequency noise’ (LFN), although there is not a commonly held definition for these terms. Noise from wind turbines are in the mid-frequencies of 200Hz to 1kHz. Human hearing can detect sounds throughout this range, but it does not ascribe the same importance or ‘weight’ to sound in each frequency. For example, if a person was listening to a tone at 1KHz at a fixed level, then a tone at 30Hz would have to be approximately 50dB higher for it to be judged equally as loud, although this varies depending on the reference loudness. To account for our sensitivity to sound over different frequencies, environmental noise sources are often described as ‘A’-weighted decibels, denoted as dB (A). This A-weighting is an internationally agreed standard that reflects the frequency sensitivity of the ear. Since noise also often varies over time, statistical parameters (or metrics) are used to measure, and describe noise. Two common noise metrics used for environmental noise measurement are the LAeq and LA90. The LAeq, T metric is called the ‘continuous equivalent sound level’. It represents a varying noise level by calculating the constant sound level that would have the same sound energy content over the measurement period. The letter ‘A’ denotes that ‘A’-weighting has been used and the ‘eq’ indicates that an equivalent level has been calculated. So ‘LAeq,T’ is the A-weighted continuous sound level, measured over period ‘T’. LAeq is a logarithmic average noise level over a period (instead of an arithmetic average) which gives a high weighting to high noise levels even if they are relatively short lived or infrequent events.

Environmental Resources Management G:\2012\0116974\17117Hrpt.doc Texas Registered Engineering Firm F-2393
4
The LA90, T metric is a percentile noise level in dB(A). This represents the noise level exceeded for 90% of the time period (T) being considered. Note that it is higher than the minimum noise level but may be regarded as the typical noise level during ‘quiet periods’ and is often used to describe the background or underlying noise level. Noise can also be referred to in terms of their ‘power’ level or as a ‘pressure’ level. A Sound Power Level (Lw) is a measure of the total power radiated by a source. The Lw of a source is a fundamental property of the source and is independent of the surrounding environment. Wind turbine manufacturers will often quote the noise levels from their turbines in terms of Lw. The Sound Pressure Level (Lp) on the other hand is the level of sound pressure (in terms of movements in air pressure) and is the received sound experienced by a person and can be measured directly with a sound level meter. This differs from Lw in that it can be affected by environmental factors such as the presence of other sounds, meteorological conditions, ground conditions and barriers. The Lw is therefore useful in calculating the Lp at a desired location. Where Lp levels are quoted they must be given at a defined distance or location relative to the source, otherwise it is meaningless. Noise at any particular location can also be affected by a number of factors, the most significant being:
• how loud the source is;
• how far away the source is from the receiver;
• what type of ground is between the source and the receiver, for example concrete, grass, water, sand etc;
• how the ground topography varies between the source and the receiver (is it flat, hilly, mountainous) as blocking the line of sight to a noise source will generally reduce the level of noise; and
• any other obstacles that block the line of sight between the source to receiver e.g. buildings or walls.
Environmental Resources Management G:\2012\0116974\17117Hrpt.doc Texas Registered Engineering Firm F-2393
5
2.0 NOISE CRITERIA
2.1 APPLICABLE NOISE CRITERIA FOR WIND TURBINE NOISE The Albany County Standard for noise is as follows. Noise associated with wind energy operation shall not exceed fifty-five (55) dB(A) as measured at a point along the common property lines between a non-participating property and a participating property. a. This level may be exceeded during short-term events such as utility outages, severe
weather events, and construction and maintenance operations. b. This standard shall not apply along any portion of the common property line where
the participating property abuts state or federal property. c. Noise levels may exceed the fifty-five (55) dB(A) limit along common property lines
if written permission, as recorded with the Albany County Clerk, is granted by the affected adjacent non-participating property owners.
In order to provide a robust assessment ERM has predicted noise levels at the common property lines and at the closest representative noise sensitive properties.
2.2 REVIEW OF WIND TURBINE NOISE CRITERIA The New York State Department of Environmental Conservation publication ‘Assessing and Mitigating Noise Impacts’ (February, 2001) suggests noise impacts should be assessed on the basis of:
• magnitude of change in noise (comparing the wind turbine noise against ‘background’ noise); and
• a fixed noise guidance level, which depending on the context is generally in the range of 55 dB to 65 dB.
However, noise from wind turbine generators (WTGs) is unusual in that noise will increase with wind speed and the rotational speed of the rotor blades. Background noise (i.e. the noise that exists without the WTG) will also increase with wind speed in most areas, unless the noise is dominated by a fixed noise source such as a noisy factory. The greatest difference between turbine noise and background noise is therefore likely to occur when wind speeds are low. However, for some sheltered locations, the background noise (from wind) may remain low even when wind speeds are high, meaning such locations will be less likely to experience ‘masking’ from background wind noise.
2.3 HERMOSA WEST WIND TURBINE NOISE OPERATIONAL NOISE CRITERIA This assessment has adopted WTG operational noise criteria based on the Albany County Standard where the absolute operational noise criteria level is LA90, 10-min 55 dB. However, consideration has also been made between
Environmental Resources Management G:\2012\0116974\17117Hrpt.doc Texas Registered Engineering Firm F-2393
6
measured background noise and wind turbine noise in order to put this standard and the predicted noise levels into context.
2.4 CONSTRUCTION NOISE The following significance criteria were developed by the Western Area Power Administration for use in determining whether construction noise impacts from the proposed Project may be significant. A significant impact on noise may result if any of the following were to occur from construction or operation of the proposed Project:
• Exceeding local, state or Federal noise regulations or guidelines at sensitive receptors, such as residences, hospitals, or schools.
• Exposure of persons to or generation of excessive ground borne vibration or ground borne noise levels where they live, work or participate in recreational activities.
No contractor has been selected and no new information has been made available on the construction methodology or likely program of works, therefore, no noise modelling of construction noise levels at the closest noise sensitive receivers has been undertaken, and the results of the previous assessment for this site have been used to assess construction noise. Section 5.2 discusses construction noise impacts further.
Environmental Resources Management G:\2012\0116974\17117Hrpt.doc Texas Registered Engineering Firm F-2393
7
3.0 BASELINE NOISE & METEOROLOGICAL DATA
3.1 NOISE Baseline noise measurements were undertaken at eight locations between November 17 to 25, 2010 and June 2 to 15, 2011. The measurements recorded the LAeq and LA90 parameters in consecutive 10-minute increments, this sample period was selected to correspond with the wind speed data recorded at Shell’s Met tower located on site. Location 3, north of Fish Creek Road and west of Elk Crossing Road did not yield any results due to equipment failure. The survey was undertaken using Quest Technologies Sound Pro Model DL (Type 1) Sound Level Meters (SLMs). These were deployed in a secure environmental enclosure with independent power supplies and environmental microphones. No rainfall was recorded during the assessment period. The SLMs were generally placed on relatively flat areas which mainly consisted of hill grassland ranch areas and located away from reflective surfaces and roads by at least 15 – 30 meters (50 to 100 feet) and away from any trees and streams. A description of each noise measurement location (including distance to the closest wind turbine for the three layouts) is given in Table 3-1 and illustrated in Figures 1, 2 and 3. A summary of measured existing LAeq noise levels is provided in Section 3.2.2.

Environmental Resources Management G:\2012\0116974\17117Hrpt.doc Texas Registered Engineering Firm F-2393
8
TABLE 3-1: Summary of Noise Measurement Locations
Location
Coordinates (Easting, Northing)
Elevation (m)
Distance to Closest Turbine (m) & Turbine ID (GE 1.5Mw Layout)
Distance to Closest Turbine (m) & Turbine ID (Siemens 2.3 Mw Layout)
Distance to Closest Turbine (m) & Turbine ID (Vestas 3 Mw Layout) Comments
Location 1 451528.26 E; 4544766.27 N
2439 352 (T187) 445 (T123) 583 (T36) Located on Elk Crossing Road to the north of Colorado Road 319. The area was rolling hills with pine trees, shrubs and grassland. The SLM was placed 3 m (10 ft) from a wire fence and 31 m (100 ft) from the nearest trees and shrubs
Location 2 451697.87 E; 4543436.73 N
2481 917 (T44) 928 (T30) 983 (T78) Located on Colorado Road 319 which is bounded by Cherokee Park Road to the East and Elk Crossing Road to the west. The area was flat rolling hills grassland. The SLM was placed approximately 6m (20 ft) from the road. There was an ephemeral creek approximately 12m (40 ft) west of the road. Water was not observed at the time of the site visits. No structures were noted. A small tree was located about 3 to 4.5m (10 to 15 ft) away from the SLM
Location 6 457486.73 E; 4539629.14 N
2410 609 (T8) 613 (T1) 603 (T60) Located at the eastern portion of Cara’s Trail. The area can be described as flat rolling hills pasture ranch grassland. The SLM was placed in an open area approximately 90 m (400 ft) from the nearest trees and about 37m (120 ft) away from the road. This property is within the Project area boundary
Location 7 462015.47 E; 4540233.57 N
2295 3055 (T11) 3048 (T8) 3048 (T61) Located on Home Rock Road. The area consisted of rolling hills grassland. The SLM was placed away approximately 15m (50 ft) away from bushes or other reflective surfaces and 25m (80 ft) to the south of the road
Location 8 460632.74 E; 4541437.64 N
2334 1667 (T24) 1681 (T16) 1667 (T69) Located to the north of location 6 (eastern portion of Cara’s Trail), on Home Rock Road. The area consisted of a hilly, rocky area used as a pasture. The SLM was placed approximately 15m (50 ft) south of Home Rock Road and was at least 90m (300 ft) away from a shed
Location 9 459563.78 E; 4545591.21 N
2435 202 (T73) 2205 (T49) 2243 (T91) Located next to the meteorological tower north of Pumpkin Vine Road. The area was a large hill consisting of grassland and the SLM placed in proximity to the site meteorological tower

Environmental Resources Management G:\2012\0116974\17117Hrpt.doc Texas Registered Engineering Firm F-2393
9
Location
Coordinates (Easting, Northing)
Elevation (m)
Distance to Closest Turbine (m) & Turbine ID (GE 1.5Mw Layout)
Distance to Closest Turbine (m) & Turbine ID (Siemens 2.3 Mw Layout)
Distance to Closest Turbine (m) & Turbine ID (Vestas 3 Mw Layout) Comments
Location 10 454899.86 E; 4550408.25 N
2403 1991 (T117) 2133 (T76) 2207 (T113) Located off to Sportsman Lake Road and northwest of Tie Siding. The area was flat, slightly rolling grassland. No trees or signs of wildlife were observed until the last site visit where horses were seen. The SLM was placed 3m (10 ft) onto the property beyond a wire fence. There was an ephemeral creek approximately 27m (90 ft) to the east of the location but did not contain any water at the time of the site visit
Location 15 450131.39 E; 4546241.77 N
2437 859 (T89) 455 (T136) 278 (T44) Location at the end of Sportsman Lake Road and west of location 1. The area was flat rolling hills grassland approximately 400m (120 ft) north of foothills. The SLM was placed approximately 15m (50 ft) to the north of wire fence and 6m (20 ft) from a small wooden structure. No trees or signs of wildlife were noted in the area
1. Location 3 has been excluded as no valid noise measurement data was collected
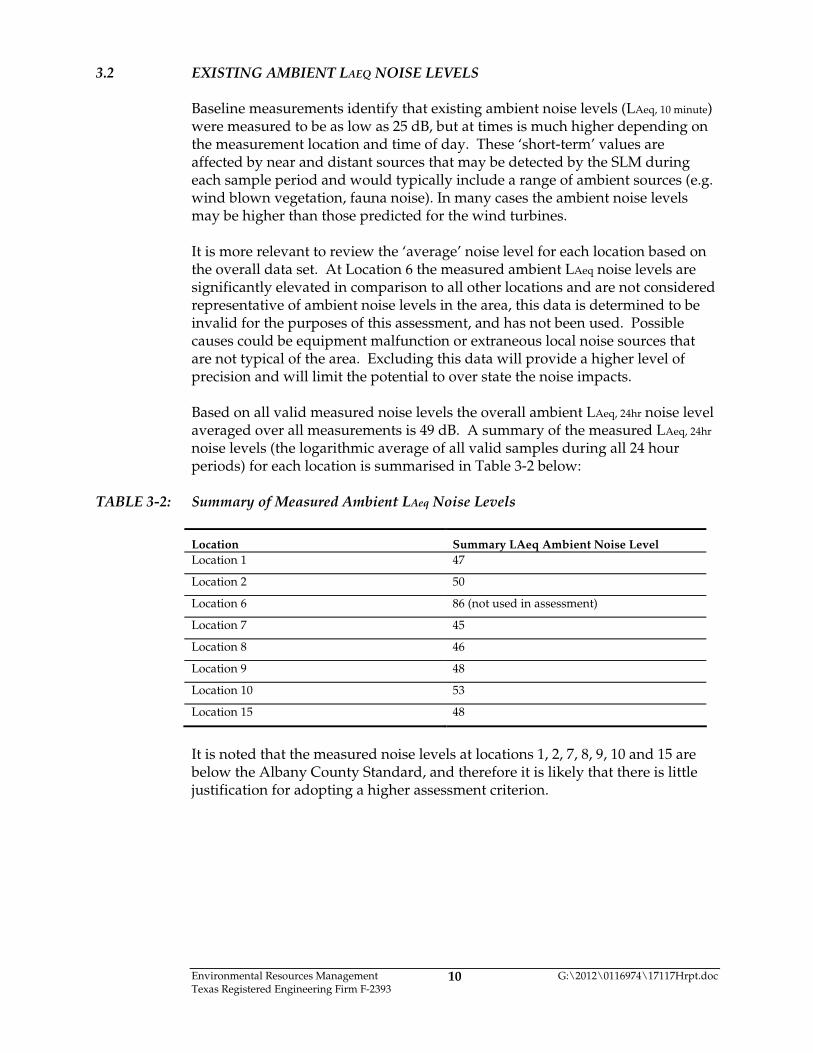
Environmental Resources Management G:\2012\0116974\17117Hrpt.doc Texas Registered Engineering Firm F-2393
10
3.2 EXISTING AMBIENT LAEQ NOISE LEVELS Baseline measurements identify that existing ambient noise levels (LAeq, 10 minute) were measured to be as low as 25 dB, but at times is much higher depending on the measurement location and time of day. These ‘short-term’ values are affected by near and distant sources that may be detected by the SLM during each sample period and would typically include a range of ambient sources (e.g. wind blown vegetation, fauna noise). In many cases the ambient noise levels may be higher than those predicted for the wind turbines. It is more relevant to review the ‘average’ noise level for each location based on the overall data set. At Location 6 the measured ambient LAeq noise levels are significantly elevated in comparison to all other locations and are not considered representative of ambient noise levels in the area, this data is determined to be invalid for the purposes of this assessment, and has not been used. Possible causes could be equipment malfunction or extraneous local noise sources that are not typical of the area. Excluding this data will provide a higher level of precision and will limit the potential to over state the noise impacts. Based on all valid measured noise levels the overall ambient LAeq, 24hr noise level averaged over all measurements is 49 dB. A summary of the measured LAeq, 24hr noise levels (the logarithmic average of all valid samples during all 24 hour periods) for each location is summarised in Table 3-2 below:
TABLE 3-2: Summary of Measured Ambient LAeq Noise Levels
Location Summary LAeq Ambient Noise Level
Location 1 47
Location 2 50
Location 6 86 (not used in assessment)
Location 7 45
Location 8 46
Location 9 48
Location 10 53
Location 15 48
It is noted that the measured noise levels at locations 1, 2, 7, 8, 9, 10 and 15 are below the Albany County Standard, and therefore it is likely that there is little justification for adopting a higher assessment criterion.
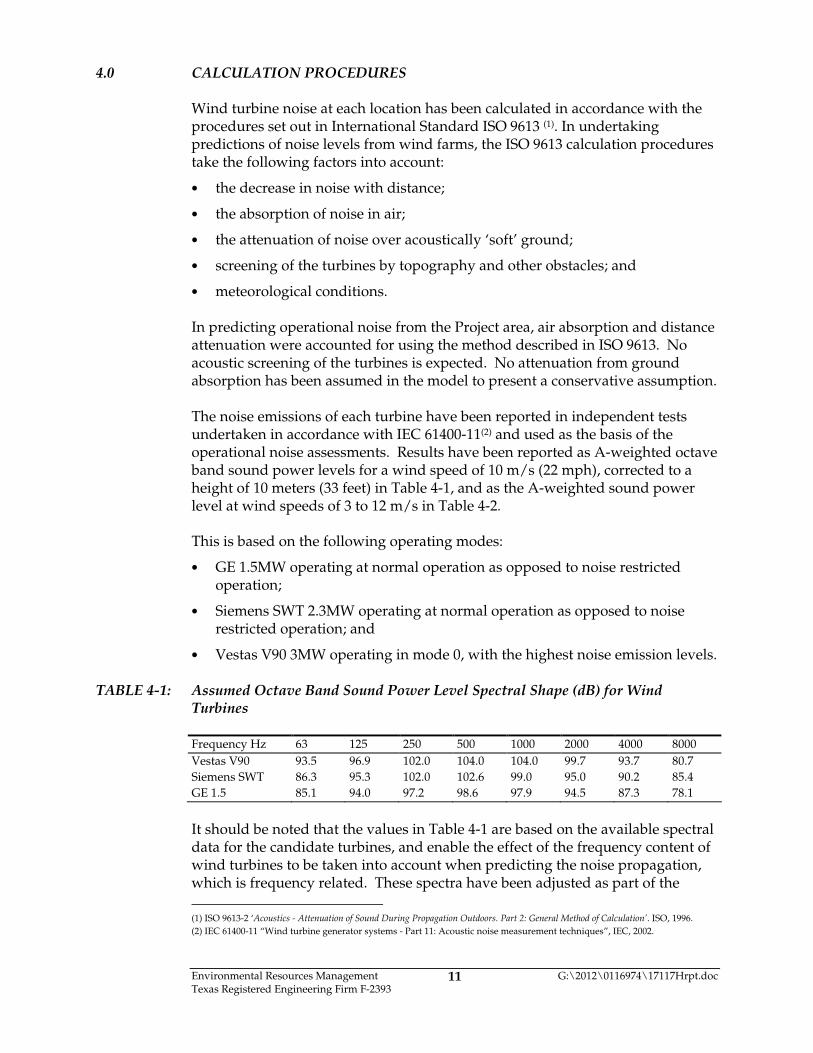
Environmental Resources Management G:\2012\0116974\17117Hrpt.doc Texas Registered Engineering Firm F-2393
11
4.0 CALCULATION PROCEDURES Wind turbine noise at each location has been calculated in accordance with the procedures set out in International Standard ISO 9613 (1). In undertaking predictions of noise levels from wind farms, the ISO 9613 calculation procedures take the following factors into account:
• the decrease in noise with distance;
• the absorption of noise in air;
• the attenuation of noise over acoustically ‘soft’ ground;
• screening of the turbines by topography and other obstacles; and
• meteorological conditions. In predicting operational noise from the Project area, air absorption and distance attenuation were accounted for using the method described in ISO 9613. No acoustic screening of the turbines is expected. No attenuation from ground absorption has been assumed in the model to present a conservative assumption. The noise emissions of each turbine have been reported in independent tests undertaken in accordance with IEC 61400-11(2) and used as the basis of the operational noise assessments. Results have been reported as A-weighted octave band sound power levels for a wind speed of 10 m/s (22 mph), corrected to a height of 10 meters (33 feet) in Table 4-1, and as the A-weighted sound power level at wind speeds of 3 to 12 m/s in Table 4-2. This is based on the following operating modes:
• GE 1.5MW operating at normal operation as opposed to noise restricted operation;
• Siemens SWT 2.3MW operating at normal operation as opposed to noise restricted operation; and
• Vestas V90 3MW operating in mode 0, with the highest noise emission levels.
TABLE 4-1: Assumed Octave Band Sound Power Level Spectral Shape (dB) for Wind Turbines
Frequency Hz 63 125 250 500 1000 2000 4000 8000
Vestas V90 93.5 96.9 102.0 104.0 104.0 99.7 93.7 80.7
Siemens SWT 86.3 95.3 102.0 102.6 99.0 95.0 90.2 85.4
GE 1.5 85.1 94.0 97.2 98.6 97.9 94.5 87.3 78.1
It should be noted that the values in Table 4-1 are based on the available spectral data for the candidate turbines, and enable the effect of the frequency content of wind turbines to be taken into account when predicting the noise propagation, which is frequency related. These spectra have been adjusted as part of the
(1) ISO 9613-2 ‘Acoustics - Attenuation of Sound During Propagation Outdoors. Part 2: General Method of Calculation’. ISO, 1996. (2) IEC 61400-11 “Wind turbine generator systems - Part 11: Acoustic noise measurement techniques”, IEC, 2002.

Environmental Resources Management G:\2012\0116974\17117Hrpt.doc Texas Registered Engineering Firm F-2393
12
prediction methodology so that absolute sound power levels on which the predictions at receptors are as show in Table 4-2 which is derived from data from wind turbine manufacturers.
TABLE 4-2: Wind Turbine Sound Power Levels (dB) for the Wind Turbines (hub height 80m/262 feet, corrected to 10m/33 feet) at Increasing Wind Speeds
Wind Speed (m/s) at 10m / 33 feet (mph in
brackets)
Sound Power Level (LWA) for Vestas V90,
dB
Sound Power Level (LWA) for Siemens
SWT, dB Sound Power Level
(LWA) for GE 1.5, dB (1)
3 (7) - - 98.0
4 (9) 97.0 - 98.0
5 (11) 105.0 - 101.1
6 (13) 105.8 105.0 105.0
7 (16) 108.2 107.0 106.0
8 (18) 109.3 107.0 106.0
9 (20) 109.4 107.0 106.0
10 (22) 106.7 107.0 -
11 (25) 105.9 - -
12 (27) 105.7 - -
This includes a +2 dB uncertainty correction reported in the test report for this turbine. Full data between 3 – 12m/s for the Siemens SWT and GE wind turbines were not made available in the independent test reports.
The calculation of wind turbine noise above approximately 12 m/s is not usually required as wind affected background noise above this speed tends to dominate and typically wind turbines do not operate at this speed. It can be seen from Table 5-1 that the sound power values do not increase above 10 m/s.

Environmental Resources Management G:\2012\0116974\17117Hrpt.doc Texas Registered Engineering Firm F-2393
13
5.0 RESULTS The overall noise level contribution from each of the turbines was predicted at the property boundary and closest residential locations identified in Table 3-2 in accordance with ISO 9613. A summary of the predicted noise levels for the closest noise sensitive receivers for the GE 1.5MW, Siemens SWT 2.3MW and Vestas V90 3MW turbine layouts are presented in Tables 5-1, 5-2 and 5-3 respectively. Wind speeds evaluated for each of the turbines were based on recommended levels provided by the manufacturer. Since we are using a fixed criterion in this case, the important thing to recognize is that the highest noise output from the windfarm has been considered. The three sets of data all include the wind speeds of 8 and 9 m/s and which suggests that the noise from the wind turbines tends to flatten out or reduce above these speeds. Therefore, although the highest wind speed is not the same in all cases it is reasonable to say that those speeds that are presented cover the highest likely noise levels from wind farm based on typical characteristics. It is important to note that average wind speeds for the area are approximately 10 m/s. Appendix A, Appendix B and Appendix C provide figures plotting the predicted wind turbine noise over wind speed at the sensitive receiver locations and the Albany County noise criteria (55 dB). Predicted noise levels at selected boundary locations (illustrated on Figure 4) are summarised in Table 5-4 below and visually presented as Appendix D with the Albany County noise criteria.
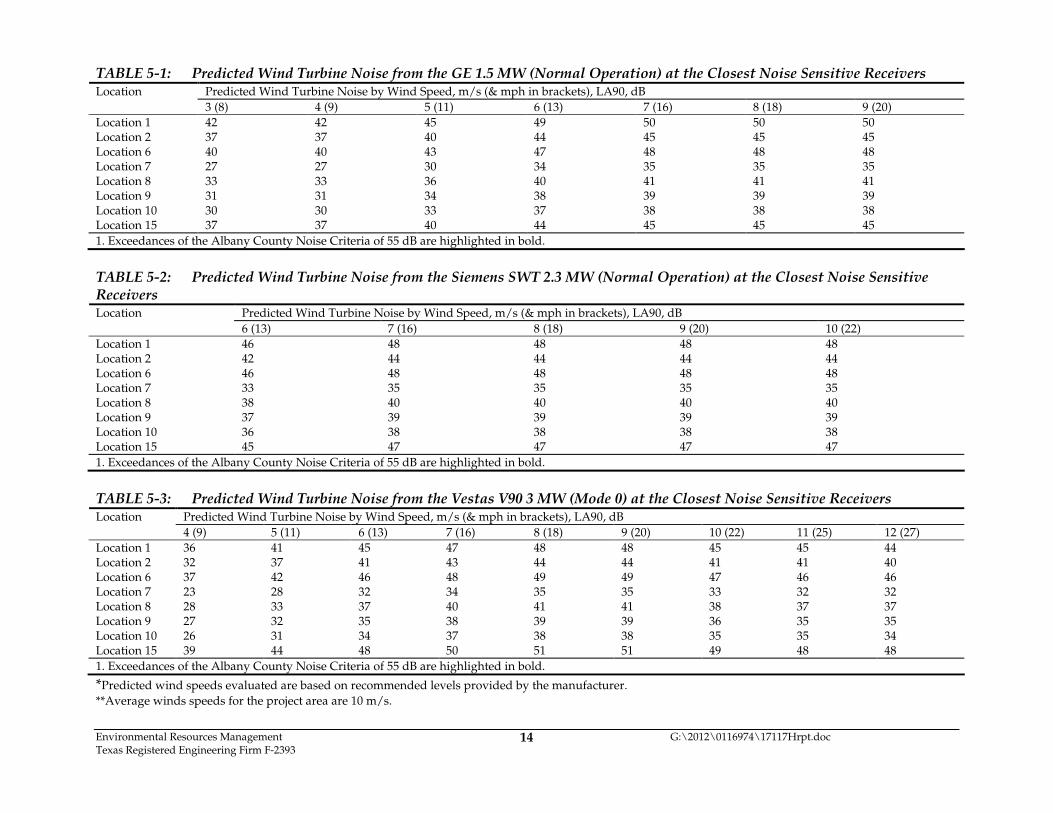
Environmental Resources Management G:\2012\0116974\17117Hrpt.doc Texas Registered Engineering Firm F-2393
14
TABLE 5-1: Predicted Wind Turbine Noise from the GE 1.5 MW (Normal Operation) at the Closest Noise Sensitive Receivers Predicted Wind Turbine Noise by Wind Speed, m/s (& mph in brackets), LA90, dB Location
3 (8) 4 (9) 5 (11) 6 (13) 7 (16) 8 (18) 9 (20)
Location 1 42 42 45 49 50 50 50 Location 2 37 37 40 44 45 45 45 Location 6 40 40 43 47 48 48 48 Location 7 27 27 30 34 35 35 35 Location 8 33 33 36 40 41 41 41 Location 9 31 31 34 38 39 39 39 Location 10 30 30 33 37 38 38 38 Location 15 37 37 40 44 45 45 45
1. Exceedances of the Albany County Noise Criteria of 55 dB are highlighted in bold.
TABLE 5-2: Predicted Wind Turbine Noise from the Siemens SWT 2.3 MW (Normal Operation) at the Closest Noise Sensitive Receivers
Predicted Wind Turbine Noise by Wind Speed, m/s (& mph in brackets), LA90, dB Location
6 (13) 7 (16) 8 (18) 9 (20) 10 (22)
Location 1 46 48 48 48 48 Location 2 42 44 44 44 44 Location 6 46 48 48 48 48 Location 7 33 35 35 35 35 Location 8 38 40 40 40 40 Location 9 37 39 39 39 39 Location 10 36 38 38 38 38 Location 15 45 47 47 47 47
1. Exceedances of the Albany County Noise Criteria of 55 dB are highlighted in bold.
TABLE 5-3: Predicted Wind Turbine Noise from the Vestas V90 3 MW (Mode 0) at the Closest Noise Sensitive Receivers
Predicted Wind Turbine Noise by Wind Speed, m/s (& mph in brackets), LA90, dB Location
4 (9) 5 (11) 6 (13) 7 (16) 8 (18) 9 (20) 10 (22) 11 (25) 12 (27)
Location 1 36 41 45 47 48 48 45 45 44 Location 2 32 37 41 43 44 44 41 41 40 Location 6 37 42 46 48 49 49 47 46 46 Location 7 23 28 32 34 35 35 33 32 32 Location 8 28 33 37 40 41 41 38 37 37 Location 9 27 32 35 38 39 39 36 35 35 Location 10 26 31 34 37 38 38 35 35 34 Location 15 39 44 48 50 51 51 49 48 48
1. Exceedances of the Albany County Noise Criteria of 55 dB are highlighted in bold.
*Predicted wind speeds evaluated are based on recommended levels provided by the manufacturer.
**Average winds speeds for the project area are 10 m/s.
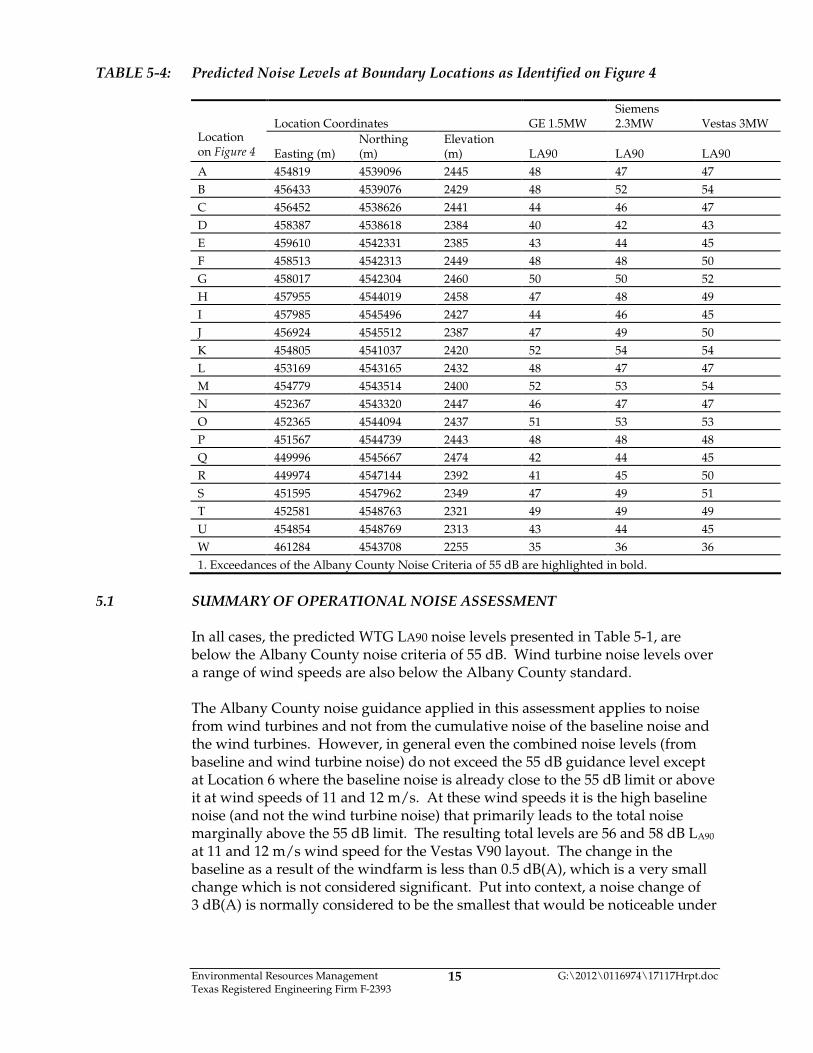
Environmental Resources Management G:\2012\0116974\17117Hrpt.doc Texas Registered Engineering Firm F-2393
15
TABLE 5-4: Predicted Noise Levels at Boundary Locations as Identified on Figure 4
Location Coordinates GE 1.5MW Siemens 2.3MW Vestas 3MW
Location on Figure 4 Easting (m)
Northing (m)
Elevation (m) LA90 LA90 LA90
A 454819 4539096 2445 48 47 47
B 456433 4539076 2429 48 52 54
C 456452 4538626 2441 44 46 47
D 458387 4538618 2384 40 42 43
E 459610 4542331 2385 43 44 45
F 458513 4542313 2449 48 48 50
G 458017 4542304 2460 50 50 52
H 457955 4544019 2458 47 48 49
I 457985 4545496 2427 44 46 45
J 456924 4545512 2387 47 49 50
K 454805 4541037 2420 52 54 54
L 453169 4543165 2432 48 47 47
M 454779 4543514 2400 52 53 54
N 452367 4543320 2447 46 47 47
O 452365 4544094 2437 51 53 53
P 451567 4544739 2443 48 48 48
Q 449996 4545667 2474 42 44 45
R 449974 4547144 2392 41 45 50
S 451595 4547962 2349 47 49 51
T 452581 4548763 2321 49 49 49
U 454854 4548769 2313 43 44 45
W 461284 4543708 2255 35 36 36
1. Exceedances of the Albany County Noise Criteria of 55 dB are highlighted in bold.
5.1 SUMMARY OF OPERATIONAL NOISE ASSESSMENT
In all cases, the predicted WTG LA90 noise levels presented in Table 5-1, are below the Albany County noise criteria of 55 dB. Wind turbine noise levels over a range of wind speeds are also below the Albany County standard. The Albany County noise guidance applied in this assessment applies to noise from wind turbines and not from the cumulative noise of the baseline noise and the wind turbines. However, in general even the combined noise levels (from baseline and wind turbine noise) do not exceed the 55 dB guidance level except at Location 6 where the baseline noise is already close to the 55 dB limit or above it at wind speeds of 11 and 12 m/s. At these wind speeds it is the high baseline noise (and not the wind turbine noise) that primarily leads to the total noise marginally above the 55 dB limit. The resulting total levels are 56 and 58 dB LA90 at 11 and 12 m/s wind speed for the Vestas V90 layout. The change in the baseline as a result of the windfarm is less than 0.5 dB(A), which is a very small change which is not considered significant. Put into context, a noise change of 3 dB(A) is normally considered to be the smallest that would be noticeable under
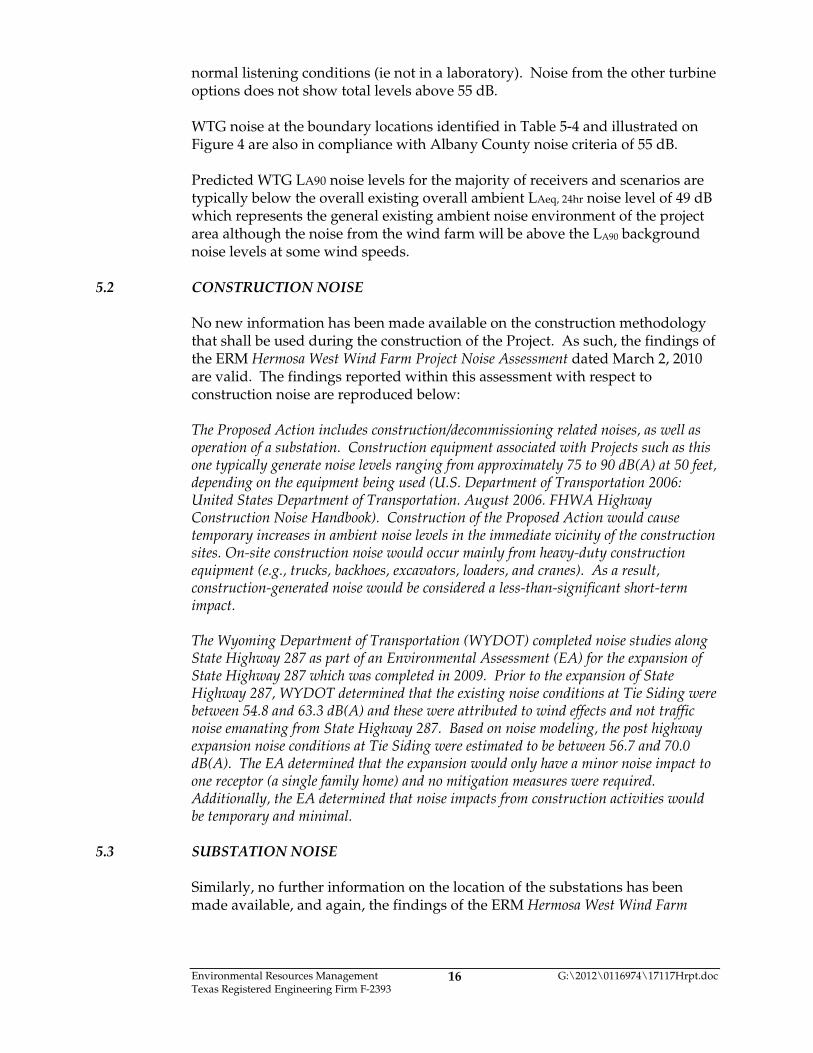
Environmental Resources Management G:\2012\0116974\17117Hrpt.doc Texas Registered Engineering Firm F-2393
16
normal listening conditions (ie not in a laboratory). Noise from the other turbine options does not show total levels above 55 dB. WTG noise at the boundary locations identified in Table 5-4 and illustrated on Figure 4 are also in compliance with Albany County noise criteria of 55 dB. Predicted WTG LA90 noise levels for the majority of receivers and scenarios are typically below the overall existing overall ambient LAeq, 24hr noise level of 49 dB which represents the general existing ambient noise environment of the project area although the noise from the wind farm will be above the LA90 background noise levels at some wind speeds.
5.2 CONSTRUCTION NOISE No new information has been made available on the construction methodology that shall be used during the construction of the Project. As such, the findings of the ERM Hermosa West Wind Farm Project Noise Assessment dated March 2, 2010 are valid. The findings reported within this assessment with respect to construction noise are reproduced below: The Proposed Action includes construction/decommissioning related noises, as well as operation of a substation. Construction equipment associated with Projects such as this one typically generate noise levels ranging from approximately 75 to 90 dB(A) at 50 feet, depending on the equipment being used (U.S. Department of Transportation 2006: United States Department of Transportation. August 2006. FHWA Highway Construction Noise Handbook). Construction of the Proposed Action would cause temporary increases in ambient noise levels in the immediate vicinity of the construction sites. On-site construction noise would occur mainly from heavy-duty construction equipment (e.g., trucks, backhoes, excavators, loaders, and cranes). As a result, construction-generated noise would be considered a less-than-significant short-term impact. The Wyoming Department of Transportation (WYDOT) completed noise studies along State Highway 287 as part of an Environmental Assessment (EA) for the expansion of State Highway 287 which was completed in 2009. Prior to the expansion of State Highway 287, WYDOT determined that the existing noise conditions at Tie Siding were between 54.8 and 63.3 dB(A) and these were attributed to wind effects and not traffic noise emanating from State Highway 287. Based on noise modeling, the post highway expansion noise conditions at Tie Siding were estimated to be between 56.7 and 70.0 dB(A). The EA determined that the expansion would only have a minor noise impact to one receptor (a single family home) and no mitigation measures were required. Additionally, the EA determined that noise impacts from construction activities would be temporary and minimal.
5.3 SUBSTATION NOISE Similarly, no further information on the location of the substations has been made available, and again, the findings of the ERM Hermosa West Wind Farm
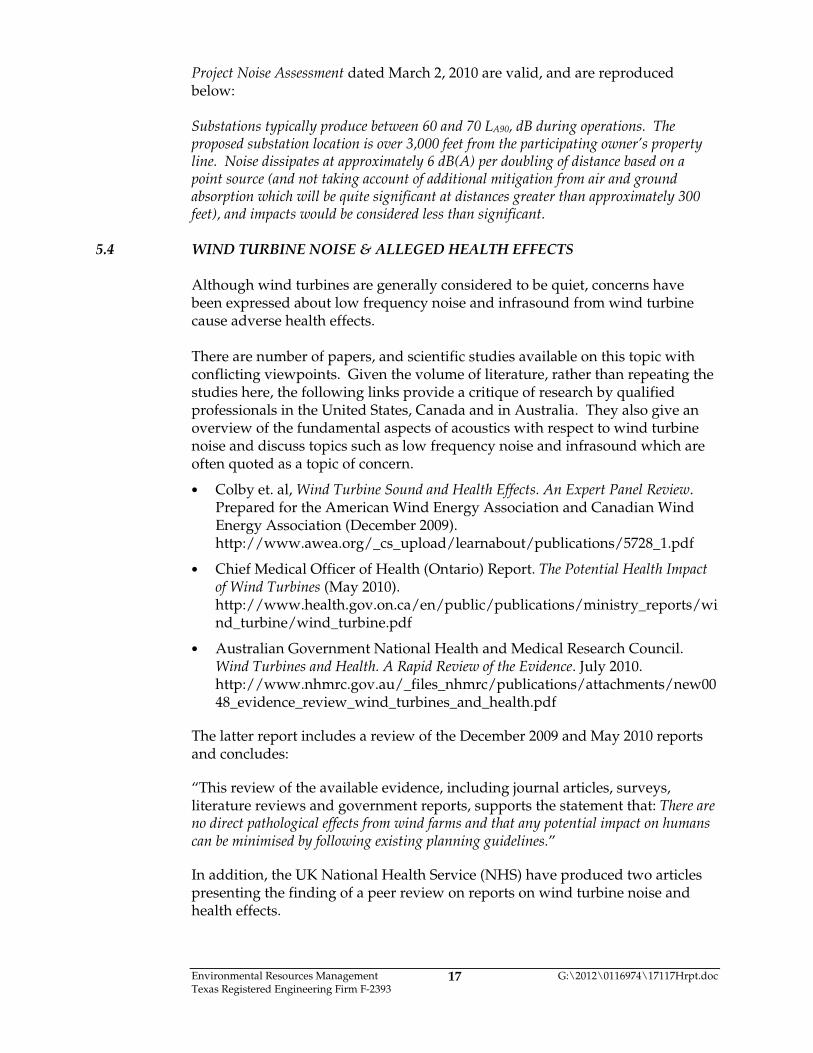
Environmental Resources Management G:\2012\0116974\17117Hrpt.doc Texas Registered Engineering Firm F-2393
17
Project Noise Assessment dated March 2, 2010 are valid, and are reproduced below: Substations typically produce between 60 and 70 LA90, dB during operations. The proposed substation location is over 3,000 feet from the participating owner’s property line. Noise dissipates at approximately 6 dB(A) per doubling of distance based on a point source (and not taking account of additional mitigation from air and ground absorption which will be quite significant at distances greater than approximately 300 feet), and impacts would be considered less than significant.
5.4 WIND TURBINE NOISE & ALLEGED HEALTH EFFECTS Although wind turbines are generally considered to be quiet, concerns have been expressed about low frequency noise and infrasound from wind turbine cause adverse health effects. There are number of papers, and scientific studies available on this topic with conflicting viewpoints. Given the volume of literature, rather than repeating the studies here, the following links provide a critique of research by qualified professionals in the United States, Canada and in Australia. They also give an overview of the fundamental aspects of acoustics with respect to wind turbine noise and discuss topics such as low frequency noise and infrasound which are often quoted as a topic of concern.
• Colby et. al, Wind Turbine Sound and Health Effects. An Expert Panel Review. Prepared for the American Wind Energy Association and Canadian Wind Energy Association (December 2009). http://www.awea.org/_cs_upload/learnabout/publications/5728_1.pdf
• Chief Medical Officer of Health (Ontario) Report. The Potential Health Impact of Wind Turbines (May 2010). http://www.health.gov.on.ca/en/public/publications/ministry_reports/wind_turbine/wind_turbine.pdf
• Australian Government National Health and Medical Research Council. Wind Turbines and Health. A Rapid Review of the Evidence. July 2010. http://www.nhmrc.gov.au/_files_nhmrc/publications/attachments/new0048_evidence_review_wind_turbines_and_health.pdf
The latter report includes a review of the December 2009 and May 2010 reports and concludes:
“This review of the available evidence, including journal articles, surveys, literature reviews and government reports, supports the statement that: There are no direct pathological effects from wind farms and that any potential impact on humans can be minimised by following existing planning guidelines.”
In addition, the UK National Health Service (NHS) have produced two articles presenting the finding of a peer review on reports on wind turbine noise and health effects.

Environmental Resources Management G:\2012\0116974\17117Hrpt.doc Texas Registered Engineering Firm F-2393
18
The first is a review of the work of Dr Nina Pierpont, the author of Wind Turbine Syndrome: A report on a natural experiment: (http://www.windturbinesyndrome.com)
Dr Pierpont has made well publicised claims of links between wind turbine noise and health effects. The second article provides a review of the December 2009 study by Colby et. al.
Links to these articles can be found here:
• NHS Are wind farms a health risk? (August 3, 2009). http://www.nhs.uk/news/2009/08august/Pages/Arewindfarmsahealthrisk.aspx
• NHS Wind turbine sound 'needs research' (January 28, 2010). http://www.nhs.uk/news/2010/01January/Pages/Wind-turbine-sound-and-health.aspx
On the Pierpont study, the NHS review commented: No firm conclusions can be drawn from this study as the design was weak and included only 38 people. Participants were asked about their symptoms before they were exposed to wind turbines to provide a control for their symptoms after exposure. This was not a sufficient control as many of the participants were reportedly already convinced that wind turbines caused their symptoms and were actively trying to move out of their homes or had already moved. Further study is needed. On the Colby Study the review commented: This research is unlikely to resolve the controversy over the potential health effects from wind turbines. This is mainly because the research on which the review was based is not sufficient to prove or disprove that there are health effects. The review itself also had some methodological shortcomings, and the reviewing group did not include an epidemiologist, usually a given for assessing potential environmental health hazards. Further research on this issue is needed. Ideally this would involve comparing people exposed to wind turbine noise with well-matched control subjects who have not had that exposure. These studies should also carefully evaluate the psychological harms of noise exposure.
5.5 VIBRATION
5.5.1 Construction The closest sensitive properties are greater than 200m from the nearest wind turbines (refer Table 3-1); beyond 100 m construction vibration is unlikely to be perceptible. Therefore, significant disturbance is not expected given the separation distance between the construction site and the nearest properties. Ground-borne vibration from construction is not likely to result in significant effects.
Environmental Resources Management G:\2012\0116974\17117Hrpt.doc Texas Registered Engineering Firm F-2393
19
5.5.2 Operation A comprehensive study of vibration measurements in the vicinity of a modern wind farm undertaken in 1997 (3) found that vibration levels 100 m from the nearest turbine were a factor of 10 less than those recommended for human exposure in sensitive buildings, such as hospitals or laboratories housing precision measurement instruments. Ground-borne vibration from wind turbines is not likely to result in significant effects.
(3) ETSU W/13/00392/REP 'Low frequency noise and vibrations measurement at a modern wind far'. Department of Trade and
Industry, 1997.

Environmental Resources Management G:\2012\0116974\17117Hrpt.doc Texas Registered Engineering Firm F-2393
20
6.0 CONCLUSION This report presents the findings of the ERM Hermosa West Wind Farm Project Noise Assessment that was complete in July 2011. This noise assessment has taken into account data collected used to measure baseline noise levels at representative noise sensitive properties associated with the Project. Operational WTG noise levels from three different turbine layouts have been predicted at representative noise sensitive receivers around the site (identified on Figures 1, 2 and 3); and at selected boundary locations (Figure 4). The turbine options considered in this assessment consisted the following:
• 224 GE 1.5MW wind turbines (normal operation), hub height 80m and total capacity of 336MW;
• 147 Siemens SWT 2.3MW wind turbines (normal operation), hub height 80m and total capacity of 338 MW; and
• 113 Vestas V90 3MW wind turbines (mode 0), hub height 80m and total capacity of 339MW.
It is noted that although several options with larger MW output were evaluated as part of this study the total power generation capacity of the wind farm will not exceed 300 MW in any operational scenario. The larger volume of MW output was used to provide a broader range of field data and to allow for adjustments in the locations of turbines. Operational noise levels have been assessed against the Albany County Standard noise criteria of LA90, 10-min 55 dB and data from this study indicate that predicted noise levels will be in compliance with this standard. In all cases, WTG noise is below the Albany County criteria at the closest noise sensitive receivers and at the project site boundary and no significant operational noise impacts from wind turbine noise are predicted on this basis (4). Although no new information has been made available on the likely construction method and program, or on substation locations; no significant noise impacts from these sources are expected. Determining the likelihood of health effects is outside the scope of this report, however a number of links to key research papers has been made available in Section 5.4. No vibration impacts are expected.
(4) It is noted that a dose response relationship is not available for wind farm noise and annoyance, and this assessment cannot
therefore consider the likelihood of individuals being annoyed by the noise from the wind farm.

Texas Registered Engineering Firm F-2393 G:\2012\0116974\17117Hrpt.doc
Figures
March 15, 2012 Project No. 0116974
Environmental Resources Management 15810 Park Ten Place, Suite 300
Houston, Texas 77084-5140 (281) 600-1000
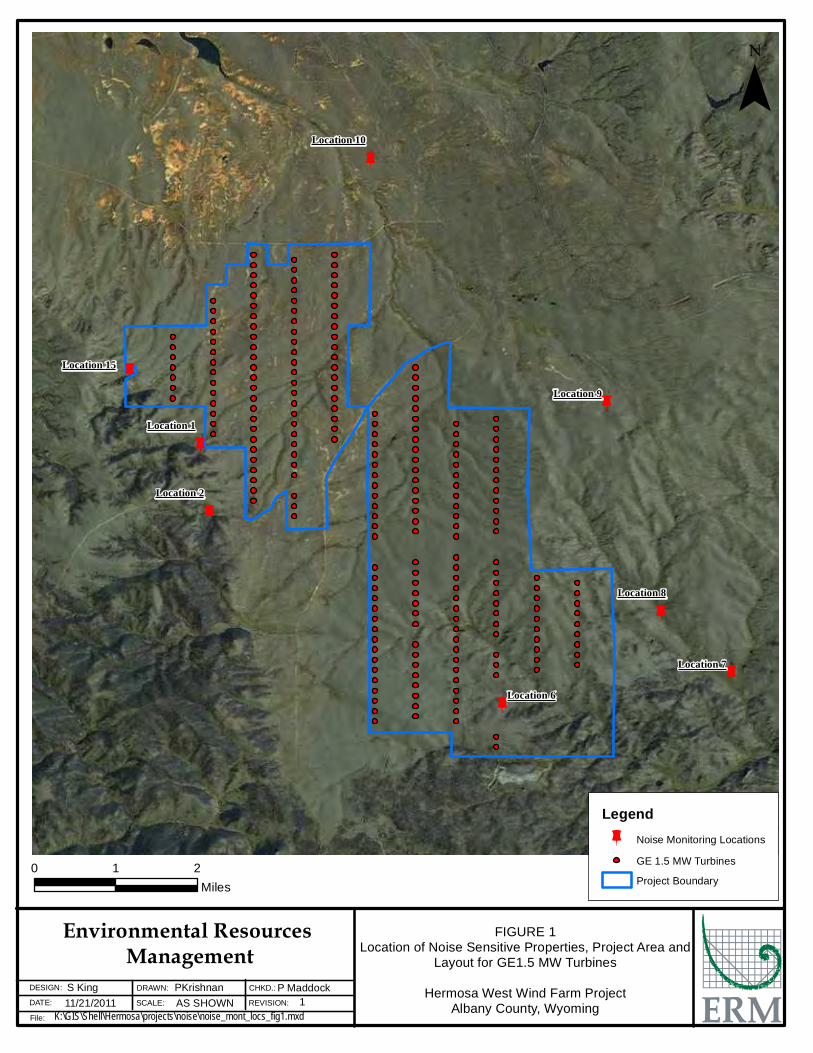
a
a
a
a
a
a
a
aLocation 1
Location 15
Location 10
Location 8
Location 7
Location 6
Location 2
Location 9
¯
0 1 2Miles
S King11/21/2011
PKrishnanAS SHOWN
P Maddock1
K:\GIS\Shell\Hermosa\projects\noise\noise_mont_locs_fig1.mxdFile:
DATE:
DESIGN: DRAWN:
SCALE:
CHKD.:
REVISION:
Environmental Resources Management
FIGURE 1Location of Noise Sensitive Properties, Project Area and
Layout for GE1.5 MW Turbines
Hermosa West Wind Farm ProjectAlbany County, Wyoming
Legenda Noise Monitoring Locations
GE 1.5 MW Turbines
Project Boundary
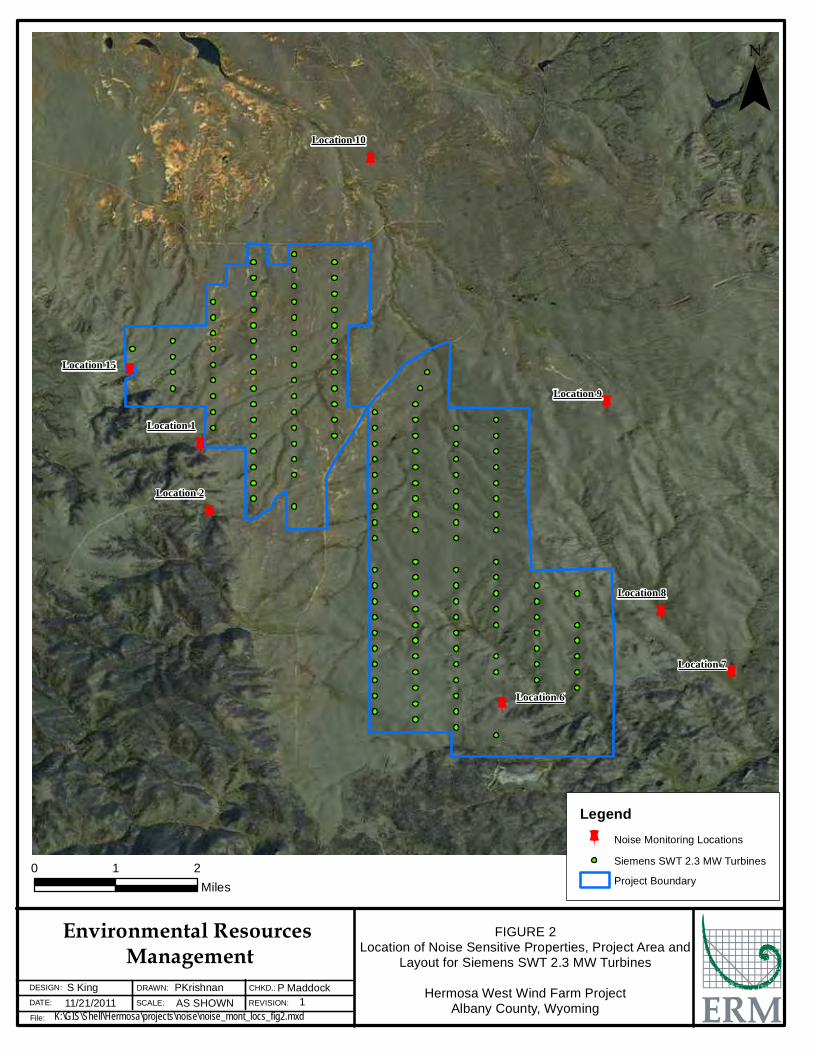
a
a
a
a
a
a
a
aLocation 1
Location 15
Location 10
Location 8
Location 7
Location 6
Location 2
Location 9
¯
0 1 2Miles
S King11/21/2011
PKrishnanAS SHOWN
P Maddock1
K:\GIS\Shell\Hermosa\projects\noise\noise_mont_locs_fig2.mxdFile:
DATE:
DESIGN: DRAWN:
SCALE:
CHKD.:
REVISION:
Environmental Resources Management
FIGURE 2Location of Noise Sensitive Properties, Project Area and
Layout for Siemens SWT 2.3 MW Turbines
Hermosa West Wind Farm ProjectAlbany County, Wyoming
Legenda Noise Monitoring Locations
Siemens SWT 2.3 MW Turbines
Project Boundary

a
a
a
a
a
a
a
aLocation 1
Location 15
Location 10
Location 8
Location 7
Location 6
Location 2
Location 9
¯
0 1 2Miles
S King11/21/2011
PKrishnanAS SHOWN
P Maddock1
K:\GIS\Shell\Hermosa\projects\noise\noise_mont_locs_fig3.mxdFile:
DATE:
DESIGN: DRAWN:
SCALE:
CHKD.:
REVISION:
Environmental Resources Management
FIGURE 3Location of Noise Sensitive Properties, Project Area and
Layout for Vestas V90 3 MW Turbines
Hermosa West Wind Farm ProjectAlbany County, Wyoming
Legenda Noise Monitoring Locations
Vestas V90 3 MW Turbines
Project Boundary

_̂ _̂_̂ _̂
_̂_̂_̂
_̂
_̂_̂
_̂
_̂_̂
_̂
_̂
_̂
_̂
_̂
_̂
_̂ _̂
_̂
_̂
a
a
a
a
a
a
a
aLocation 1
Location 15
Location 10
Location 8
Location 7
Location 6
Location 2
Location 9
A B
CD
EF
G
H
IJ
K
LM
N
O
P
Q
R
S
T U
W
¯
0 1 2Miles
S King11/21/2011
PKrishnanAS SHOWN
P Maddock1
K:\GIS\Shell\Hermosa\projects\noise\noise_mont_locs_fig4.mxdFile:
DATE:
DESIGN: DRAWN:
SCALE:
CHKD.:
REVISION:
Environmental Resources Management
FIGURE 4Location of Noise Sensitive Properties, Project Area and
Representative Boundary Noise Assessment Points
Hermosa West Wind Farm ProjectAlbany County, Wyoming
Legenda Noise Monitoring Locations
_̂ Boundary Noise Assesment Points
Project Boundary

Texas Registered Engineering Firm F-2393 G:\2012\0116974\17117Hrpt.doc
GE 1.5Mw Results Appendix A
March 15, 2012 Project No. 0116974
Environmental Resources Management 15810 Park Ten Place, Suite 300
Houston, Texas 77084-5140 (281) 600-1000
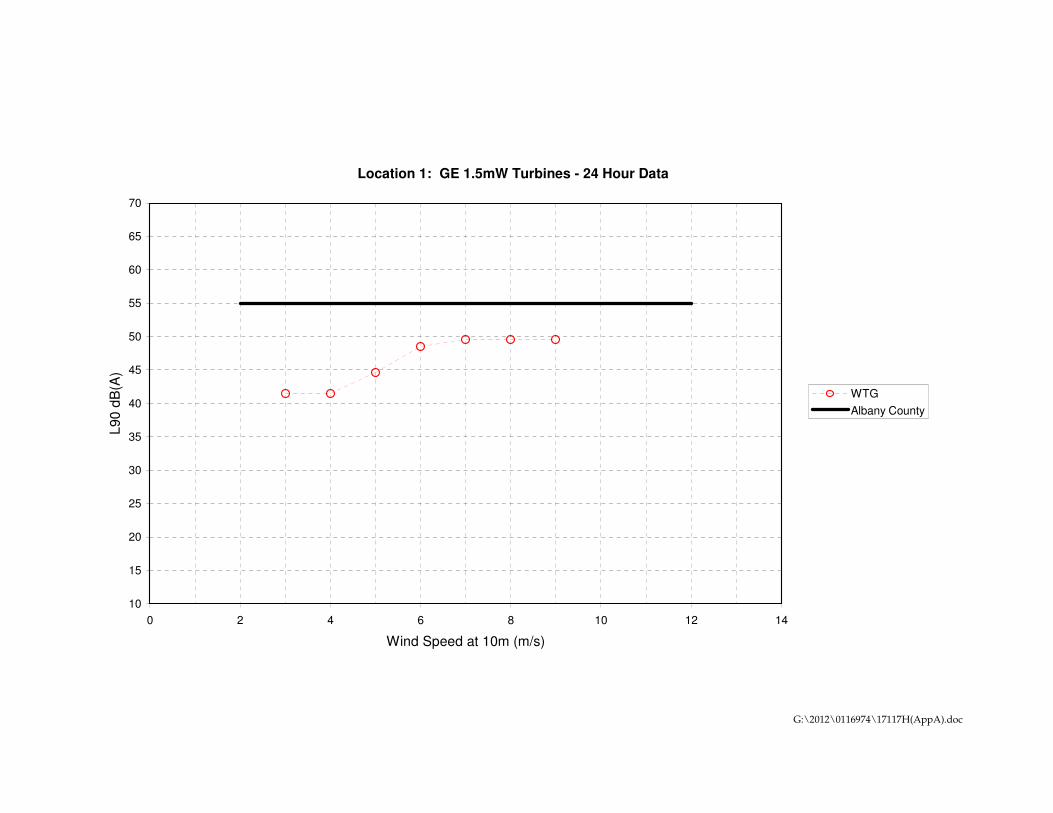
G:\2012\0116974\17117H(AppA).doc
Location 1: GE 1.5mW Turbines - 24 Hour Data
10
15
20
25
30
35
40
45
50
55
60
65
70
0 2 4 6 8 10 12 14
Wind Speed at 10m (m/s)
L90
dB
(A
)
WTG
Albany County

G:\2012\0116974\17117H(AppA).doc
Location 2: GE 1.5mW Turbines - 24 Hour Data
10
15
20
25
30
35
40
45
50
55
60
65
70
0 2 4 6 8 10 12 14
Wind Speed at 10m (m/s)
L90
dB
(A
)
WTG
Albany County
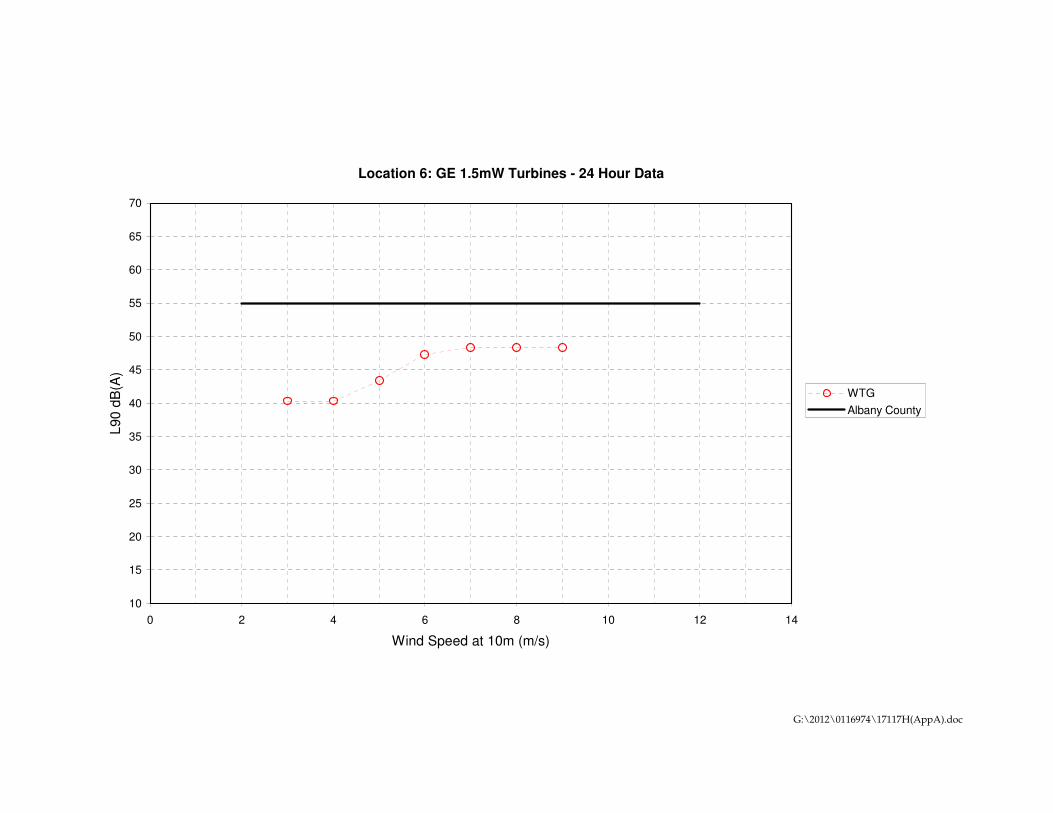
G:\2012\0116974\17117H(AppA).doc
Location 6: GE 1.5mW Turbines - 24 Hour Data
10
15
20
25
30
35
40
45
50
55
60
65
70
0 2 4 6 8 10 12 14
Wind Speed at 10m (m/s)
L90
dB
(A
)
WTG
Albany County
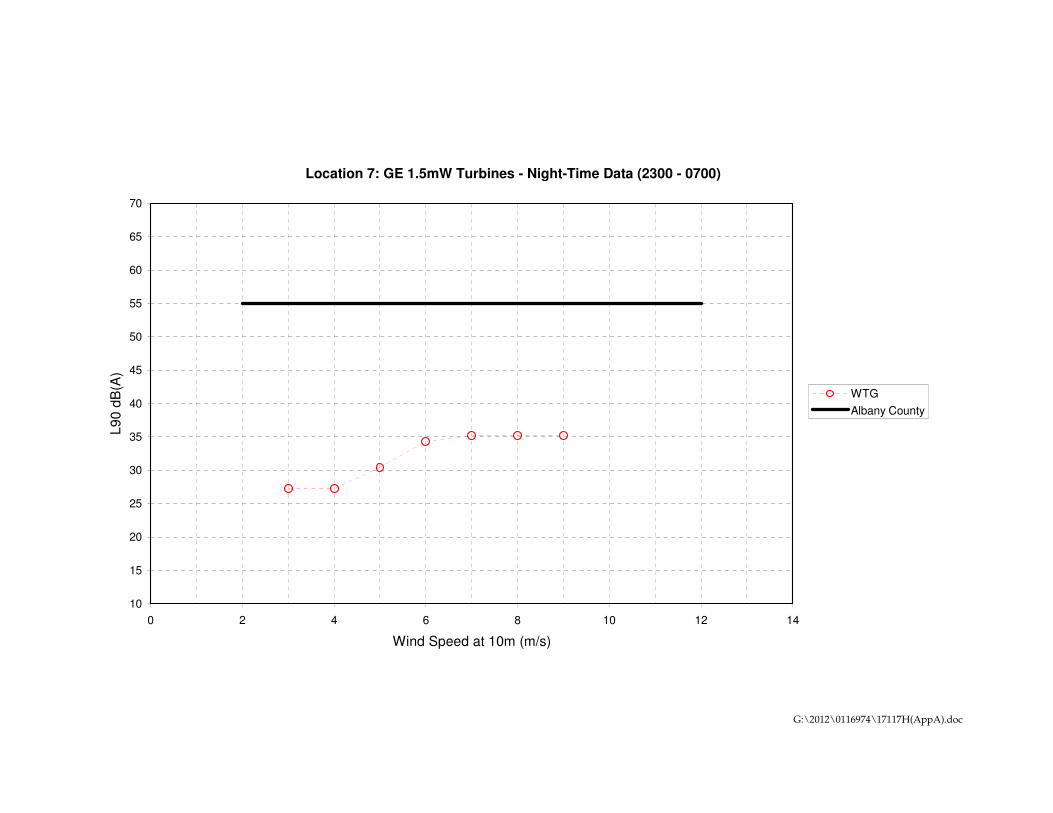
G:\2012\0116974\17117H(AppA).doc
Location 7: GE 1.5mW Turbines - Night-Time Data (2300 - 0700)
10
15
20
25
30
35
40
45
50
55
60
65
70
0 2 4 6 8 10 12 14
Wind Speed at 10m (m/s)
L9
0 dB
(A
)
WTG
Albany County
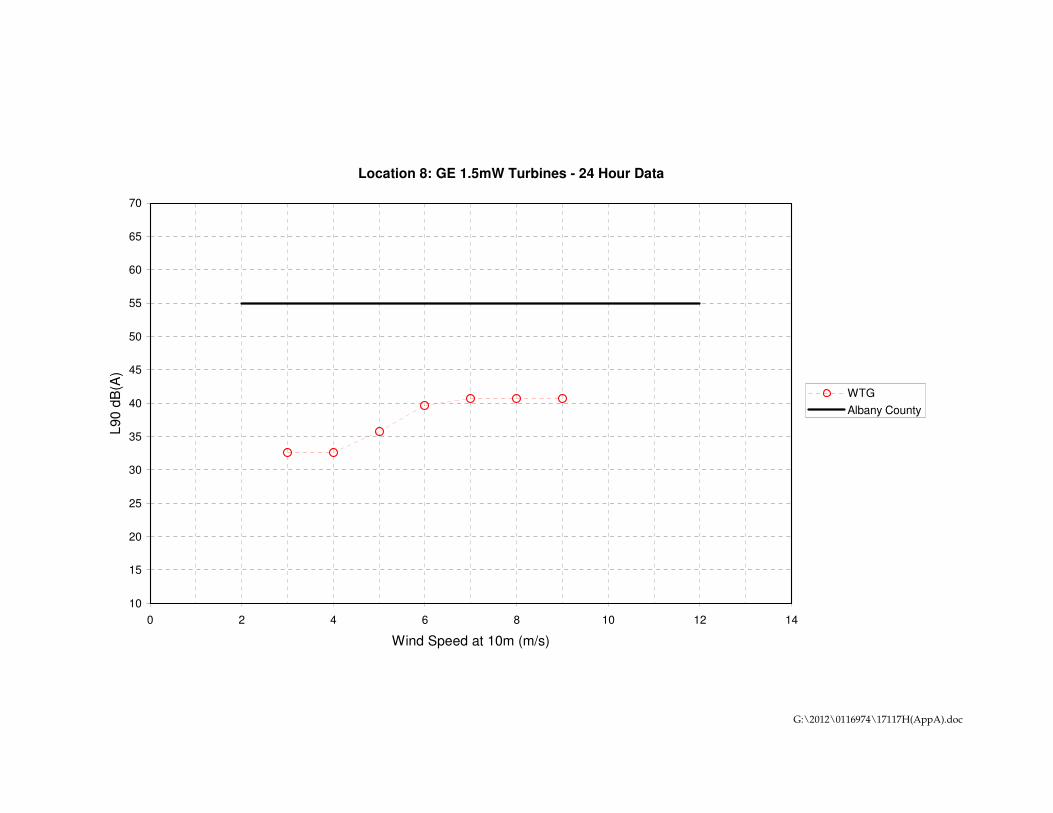
G:\2012\0116974\17117H(AppA).doc
Location 8: GE 1.5mW Turbines - 24 Hour Data
10
15
20
25
30
35
40
45
50
55
60
65
70
0 2 4 6 8 10 12 14
Wind Speed at 10m (m/s)
L90
dB
(A
)
WTG
Albany County

G:\2012\0116974\17117H(AppA).doc
Location 9: GE 1.5mW Turbines - 24 Hour Data
10
15
20
25
30
35
40
45
50
55
60
65
70
0 2 4 6 8 10 12 14
Wind Speed at 10m (m/s)
L90
dB
(A
)
WTG
Albany County
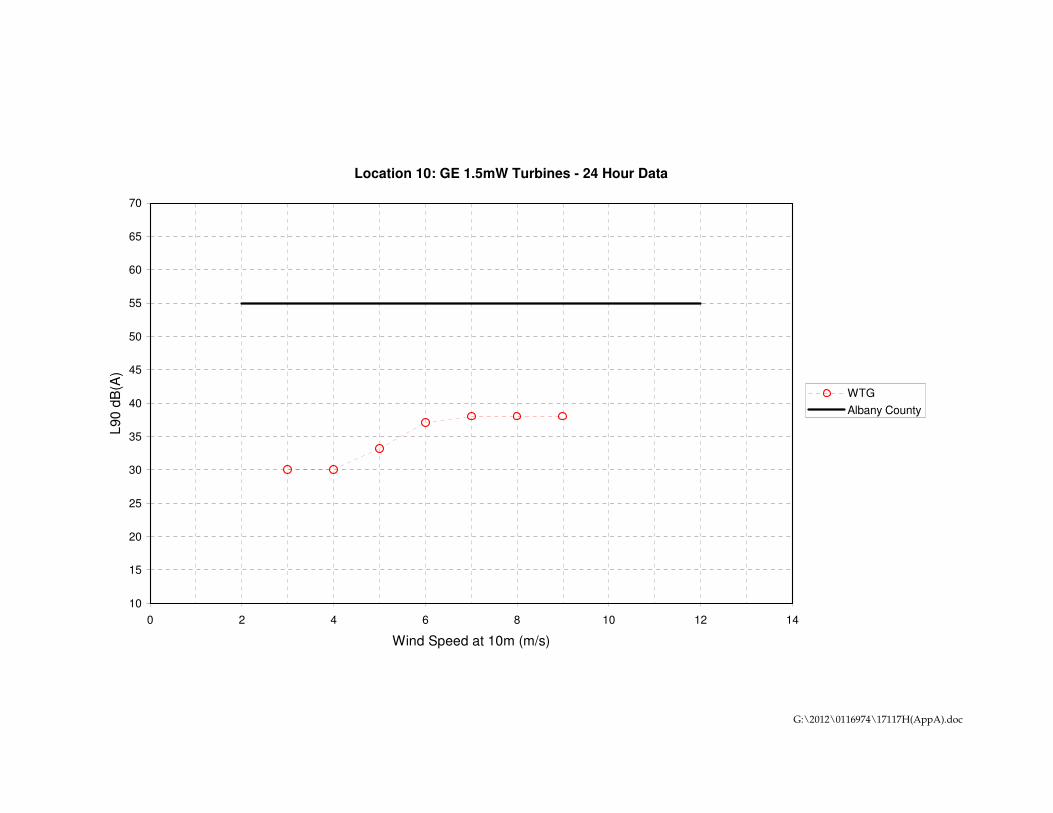
G:\2012\0116974\17117H(AppA).doc
Location 10: GE 1.5mW Turbines - 24 Hour Data
10
15
20
25
30
35
40
45
50
55
60
65
70
0 2 4 6 8 10 12 14
Wind Speed at 10m (m/s)
L90
dB
(A
)
WTG
Albany County

G:\2012\0116974\17117H(AppA).doc
Location 15: GE 1.5mW Turbines - 24 Hour Data
10
15
20
25
30
35
40
45
50
55
60
65
70
0 2 4 6 8 10 12 14
Wind Speed at 10m (m/s)
L90
dB
(A
)
WTG
Albany County

Texas Registered Engineering Firm F-2393 G:\2012\0116974\17117Hrpt.doc
Siemens 2.3Mw Results Appendix B
March 15, 2012 Project No. 0116974
Environmental Resources Management 15810 Park Ten Place, Suite 300
Houston, Texas 77084-5140 (281) 600-1000

G:\2012\0116974\17117H(AppB).doc
Location 1: Siemens SWT 2.3mW Turbines - 24 Hour Data
10
15
20
25
30
35
40
45
50
55
60
65
70
0 2 4 6 8 10 12 14
Wind Speed at 10m (m/s)
L90
dB
(A
)
WTG
Albany County
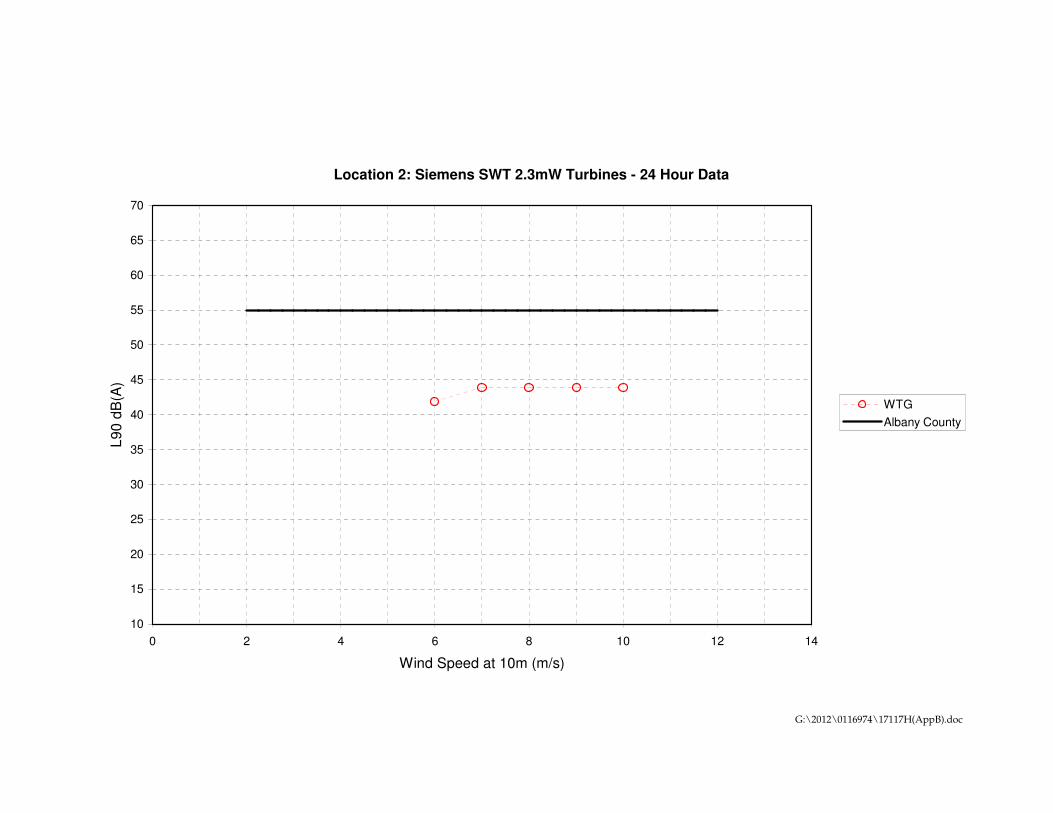
G:\2012\0116974\17117H(AppB).doc
Location 2: Siemens SWT 2.3mW Turbines - 24 Hour Data
10
15
20
25
30
35
40
45
50
55
60
65
70
0 2 4 6 8 10 12 14
Wind Speed at 10m (m/s)
L9
0 d
B(A
)
WTG
Albany County
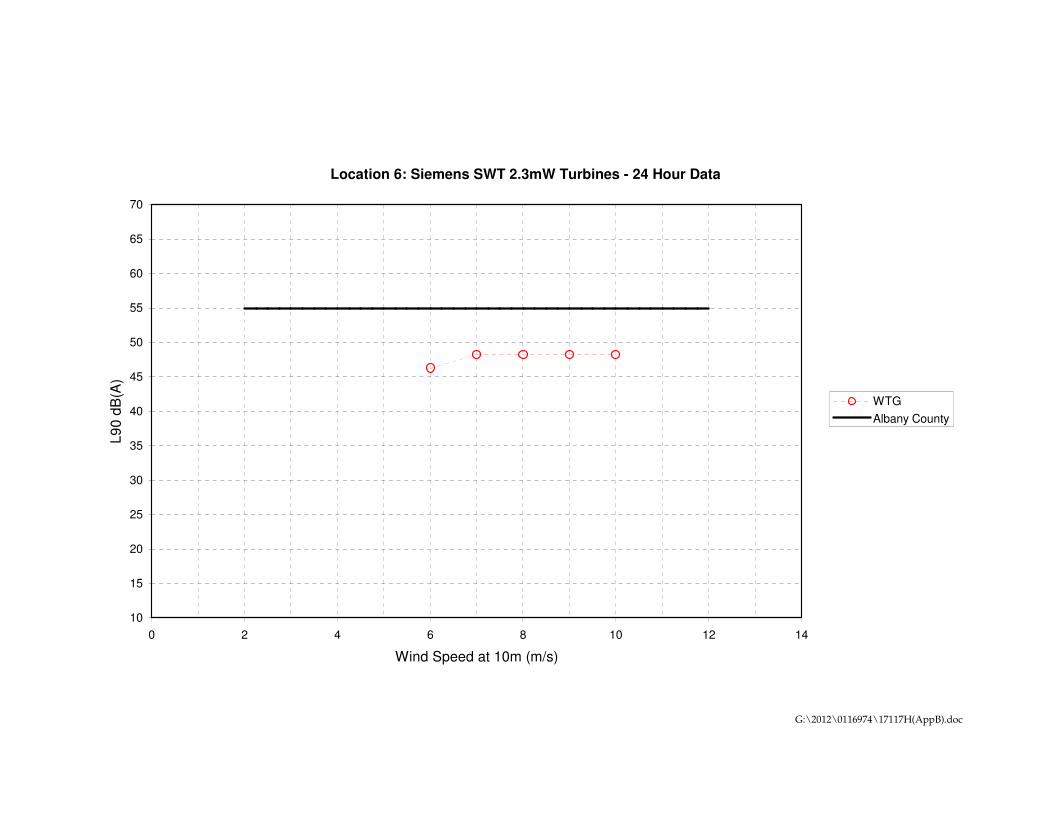
G:\2012\0116974\17117H(AppB).doc
Location 6: Siemens SWT 2.3mW Turbines - 24 Hour Data
10
15
20
25
30
35
40
45
50
55
60
65
70
0 2 4 6 8 10 12 14
Wind Speed at 10m (m/s)
L9
0 d
B(A
)
WTG
Albany County
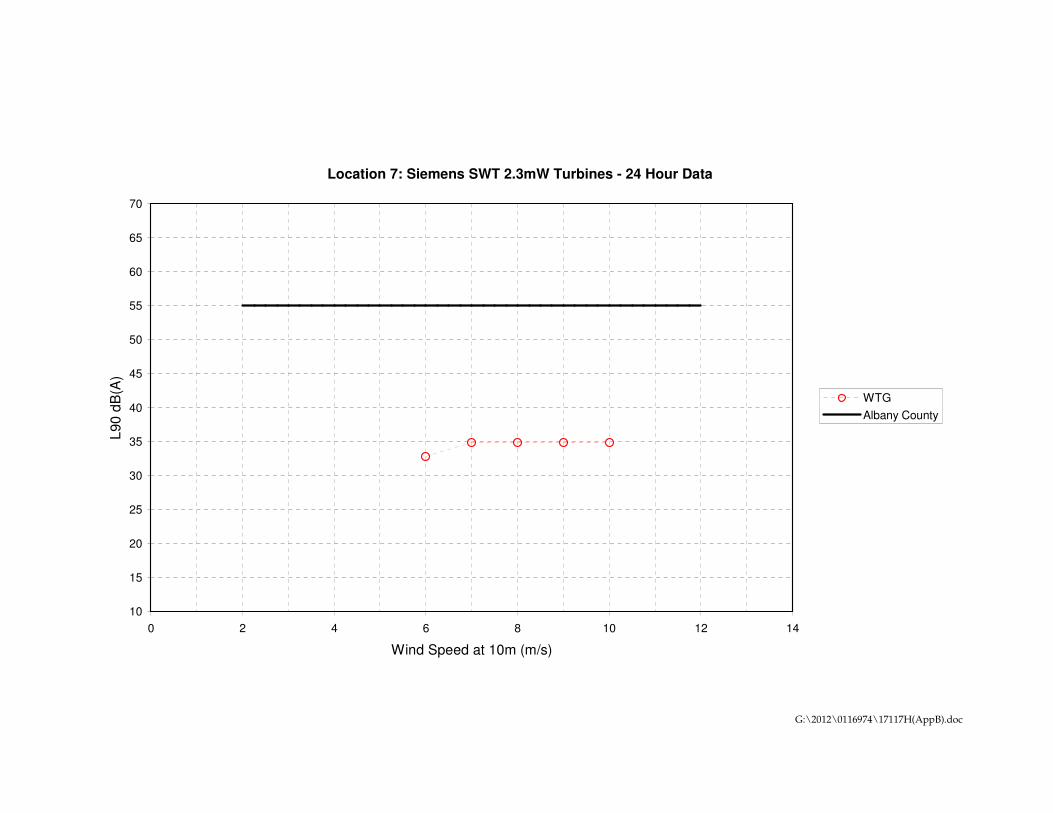
G:\2012\0116974\17117H(AppB).doc
Location 7: Siemens SWT 2.3mW Turbines - 24 Hour Data
10
15
20
25
30
35
40
45
50
55
60
65
70
0 2 4 6 8 10 12 14
Wind Speed at 10m (m/s)
L90
dB
(A
)
WTG
Albany County
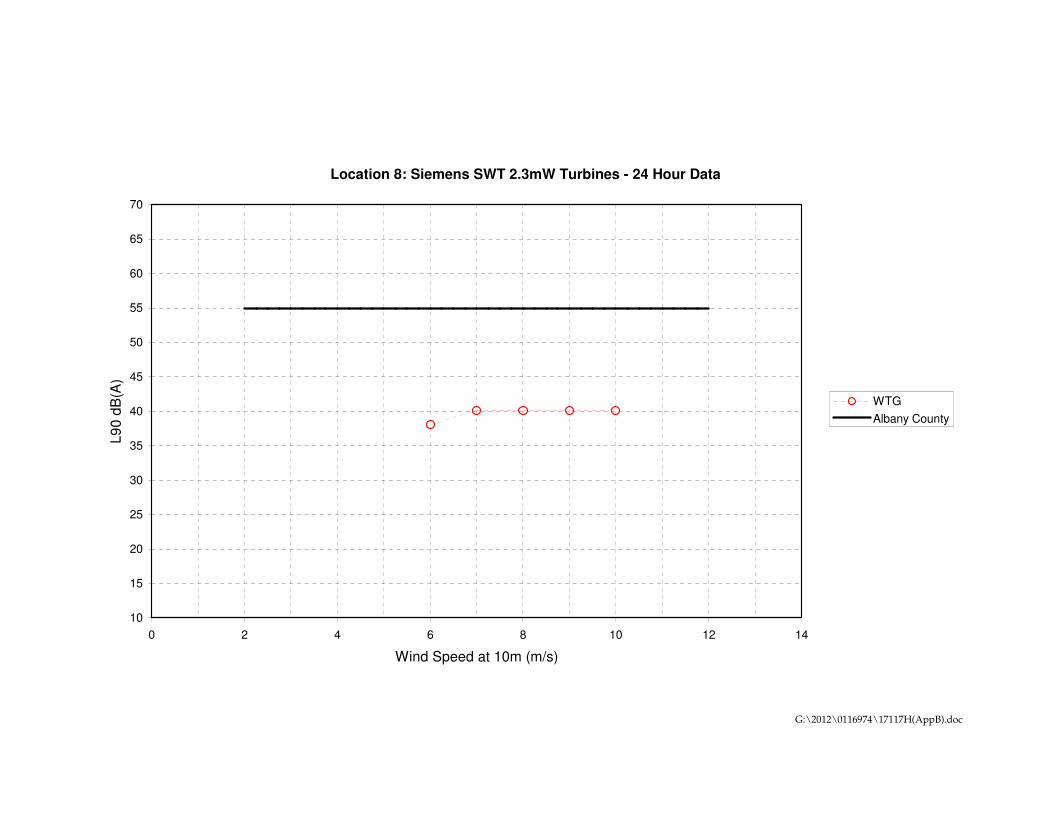
G:\2012\0116974\17117H(AppB).doc
Location 8: Siemens SWT 2.3mW Turbines - 24 Hour Data
10
15
20
25
30
35
40
45
50
55
60
65
70
0 2 4 6 8 10 12 14
Wind Speed at 10m (m/s)
L9
0 d
B(A
)
WTG
Albany County

G:\2012\0116974\17117H(AppB).doc
Location 9: Siemens SWT 2.3mW Turbines - 24 Hour Data
10
15
20
25
30
35
40
45
50
55
60
65
70
0 2 4 6 8 10 12 14
Wind Speed at 10m (m/s)
L9
0 d
B(A
)
WTG
Albany County

G:\2012\0116974\17117H(AppB).doc
Location 10: Siemens SWT 2.3mW Turbines - 24 Hour Data
10
15
20
25
30
35
40
45
50
55
60
65
70
0 2 4 6 8 10 12 14
Wind Speed at 10m (m/s)
L90
dB
(A
)
WTG
Albany County

G:\2012\0116974\17117H(AppB).doc
Location 15: Siemens SWT 2.3mW Turbines - 24 Hour Data
10
15
20
25
30
35
40
45
50
55
60
65
70
0 2 4 6 8 10 12 14
Wind Speed at 10m (m/s)
L9
0 d
B(A
)
WTG
Albany County

Texas Registered Engineering Firm F-2393 G:\2012\0116974\17117Hrpt.doc
Vestas V90 3Mw Results Appendix C
March 15, 2012 Project No. 0116974
Environmental Resources Management 15810 Park Ten Place, Suite 300
Houston, Texas 77084-5140 (281) 600-1000
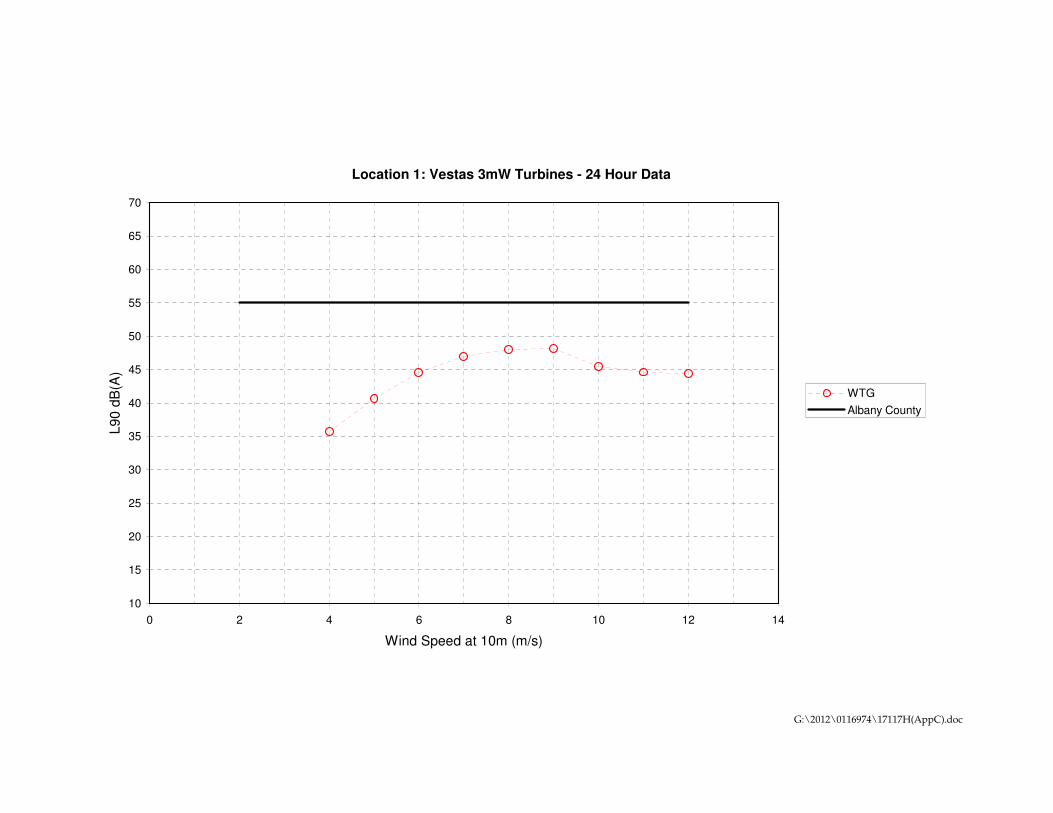
G:\2012\0116974\17117H(AppC).doc
Location 1: Vestas 3mW Turbines - 24 Hour Data
10
15
20
25
30
35
40
45
50
55
60
65
70
0 2 4 6 8 10 12 14
Wind Speed at 10m (m/s)
L90
dB
(A
)
WTG
Albany County

G:\2012\0116974\17117H(AppC).doc
Location 2: Vestas 3mW Turbines - 24 Hour Data
10
15
20
25
30
35
40
45
50
55
60
65
70
0 2 4 6 8 10 12 14
Wind Speed at 10m (m/s)
L90
dB
(A
)
WTG
Albany County

G:\2012\0116974\17117H(AppC).doc
Location 6: Vestas 3mW Turbines - 24 Hour Data
10
15
20
25
30
35
40
45
50
55
60
65
70
0 2 4 6 8 10 12 14
Wind Speed at 10m (m/s)
L90
dB
(A
)
WTG
Albany County

G:\2012\0116974\17117H(AppC).doc
Location 7: Vestas 3mW Turbines - 24 Hour Data
10
15
20
25
30
35
40
45
50
55
60
65
70
0 2 4 6 8 10 12 14
Wind Speed at 10m (m/s)
L90
dB
(A
)
WTG
Albany County
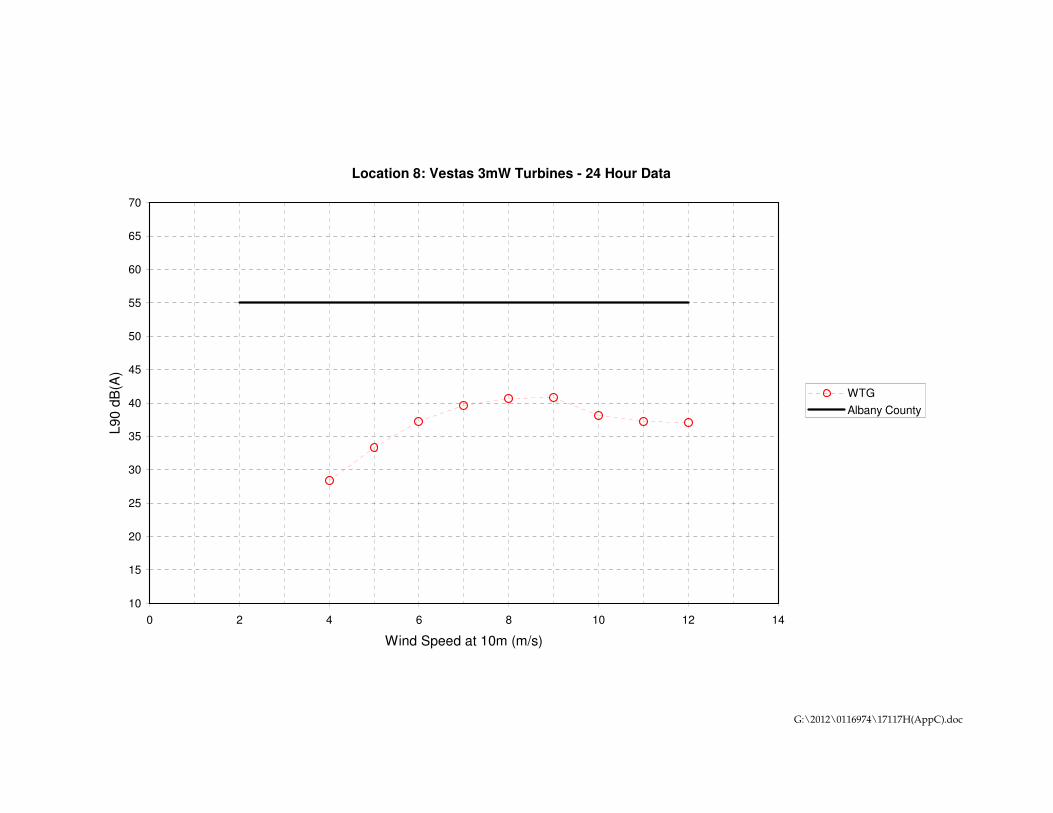
G:\2012\0116974\17117H(AppC).doc
Location 8: Vestas 3mW Turbines - 24 Hour Data
10
15
20
25
30
35
40
45
50
55
60
65
70
0 2 4 6 8 10 12 14
Wind Speed at 10m (m/s)
L90
dB
(A
)
WTG
Albany County
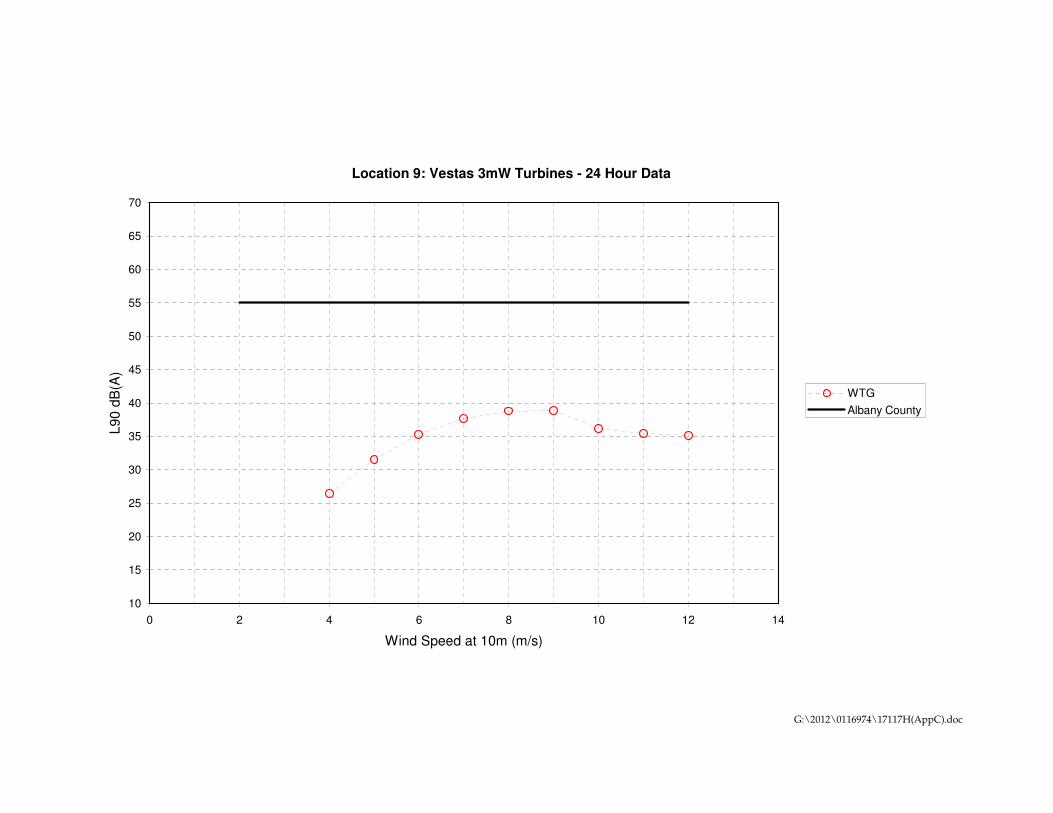
G:\2012\0116974\17117H(AppC).doc
Location 9: Vestas 3mW Turbines - 24 Hour Data
10
15
20
25
30
35
40
45
50
55
60
65
70
0 2 4 6 8 10 12 14
Wind Speed at 10m (m/s)
L90
dB
(A
)
WTG
Albany County

G:\2012\0116974\17117H(AppC).doc
Location 10: Vestas 3mW Turbines - 24 Hour Data
10
15
20
25
30
35
40
45
50
55
60
65
70
0 2 4 6 8 10 12 14
Wind Speed at 10m (m/s)
L90
dB
(A
)
WTG
Albany County

G:\2012\0116974\17117H(AppC).doc
Location 15: Vestas 3mW Turbines - 24 Hour Data
10
15
20
25
30
35
40
45
50
55
60
65
70
0 2 4 6 8 10 12 14
Wind Speed at 10m (m/s)
L90
dB
(A
)
WTG
Albany County
Texas Registered Engineering Firm F-2393 G:\2012\0116974\17117Hrpt.doc
Predicted Noise Levels at Boundary Locations Appendix D
March 15, 2012 Project No. 0116974
Environmental Resources Management 15810 Park Ten Place, Suite 300
Houston, Texas 77084-5140 (281) 600-1000
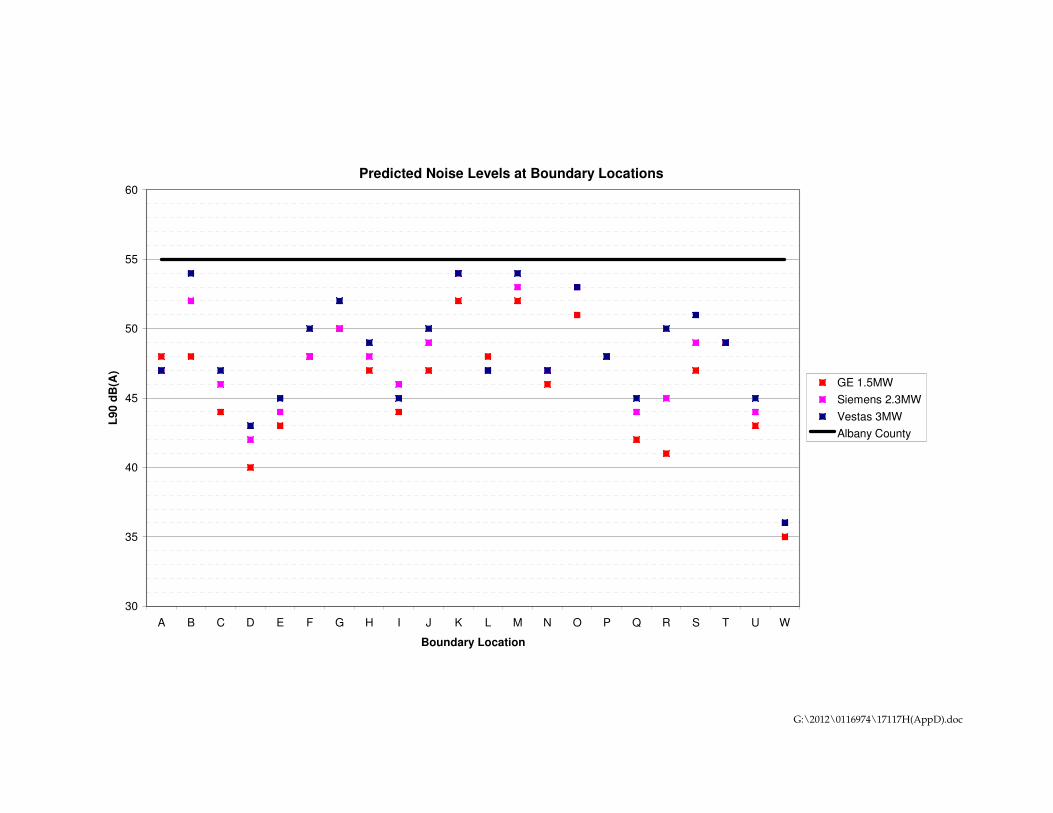
G:\2012\0116974\17117H(AppD).doc
Predicted Noise Levels at Boundary Locations
30
35
40
45
50
55
60
A B C D E F G H I J K L M N O P Q R S T U W
Boundary Location
L9
0 d
B(A
)
GE 1.5MW
Siemens 2.3MW
Vestas 3MW
Albany County

Hermosa West Wind Energy Project Draft EIS Appendix I
DOE/EIS-0438 September 2012
NOISE ASSESSMENT, JUNE 4, 2010

Appendix I Hermosa West Wind Energy Project Draft EIS
September 2012 DOE/EIS-0438
This page intentionally left blank
Delivering sustainable solutions in a more competitive world
Noise Assessment
Shell WindEnergy Hermosa West Wind Farm Project, Albany County, Wyoming June 4, 2010
www.erm.com

Texas Registered Engineering Firm F-2393
Shell WindEnergy
Noise Assessment:
Hermosa West Wind Farm Project
June 4, 2010
Project No. 0111210
Albany County, Wyoming
Alicia C. Smith, R.E.M.
Partner-in-Charge
Chris Zeisloft
Project Manager Environmental Resources Management Southwest, Inc. 15810 Park Ten Place, Suite 300 Houston, Texas 77084-5140 T: 281-600-1000 F: 281-600-1001

Texas Registered Engineering Firm F-2393 G:\2010\0111210\14661Hrpt.doc ii
TABLE OF CONTENTS
1.0 HERMOSA WEST WIND FARM NOISE ASSESSMENT 1
1.1 INTRODUCTION 1 1.2 PROJECT SETTING 1
1.2.1 Baseline Information 2 1.2.2 Acoustics and Glossary of Terms 3
1.3 NOISE PREDICTION MODEL 4
2.0 NOISE PREDICTIONS 6
2.1 WIND TURBINE NOISE SOURCE TERMS 6
3.0 NOISE FROM WIND TURBINES, LOW FREQUENCY NOISE, INFRASOUND AND HEALTH EFFECTS 10
3.1 INTRODUCTION 10 3.2 SOURCES OF NOISE 10 3.3 WEATHER EFFECTS AND WIND SHEAR 10 3.4 INFRASOUND, LOW FREQUENCY NOISE AND ANNOYANCE 11 3.5 VIBRATION 13
4.0 RESULTS 14
Texas Registered Engineering Firm F-2393 G:\2010\0111210\14661Hrpt.doc iii
List of Tables 1-1 Closest Noise Sensitive Properties to the Project 1-2 Site Wind Measurements 1-3 Examples of Noise Levels on a Decibel Scale 2-1 Octave Band Sound Power Levels (dB) for the Vestas V90 3 MW, Siemens SWT
2.3MW and GE 1.5MW Wind Turbines (hub height 80m/262 feet, corrected to 10m/33 feet) in Accordance with IEC 61400-11
2-2 Wind Turbine Noise Levels (dB) for the Vestas V90 3MW, Siemens SWT 2.3MW and GE 1.3 MW Turbines (hub height 80m/262 feet, corrected to 10m/33 feet) at Increasing Wind Speeds
2-3 Predicted WTG Noise from the Vestas V90 3 MW (mode 0) at the Closest Noise Sensitive Properties
2-4 Predicted WTG Noise from the Siemens SWT 2.3MW (normal operation) at the Closest Noise Sensitive Properties
2-5 Predicted WTG Noise from the GE 1.5MW (normal operation) at the Closest Noise Sensitive Properties
List of Figures 1-1 Vicinity Map 1-2 Vestas V90 3MW Turbines And Receptors 1-3 Siemens SWT 2-3MW Turbines And Receptors 1-4 GE 1.5MW Turbines And Receptors

Environmental Resources Management G:\2010\0111210\14661Hrpt.doc Texas Registered Engineering Firm F-2393
1
1.0 HERMOSA WEST WIND FARM NOISE ASSESSMENT
1.1 INTRODUCTION Shell WindEnergy, Inc. (SWE) proposes to construct, operate and maintain the Hermosa West Wind Farm Project (the Project) in southeast Albany County, Wyoming near Tie Siding (Figure 1-1, Site Vicinity Map). Western Area Power Authority (Western) is evaluating under the National Environmental Policy Act (NEPA) the interconnection of the Project, which consists of transmission system upgrades and construction of a new substation (Proposed Action). The Project would consist of a maximum of 200 wind turbines with a total generating capacity of up to 300 megawatts (MW) of electricity. The wind turbines would be arranged in roughly collinear “strings”; each turbine string would be situated within an approximately 250 foot (ft) or 400ft wide corridor, depending on topography. The Project would interconnect with a Western-operated transmission line traversing the Project area. The Project would also include a wind energy collection system, on-site operation and maintenance (O&M) building, underground collector lines, an Applicant-built transmission line and substation, associated access roads, and off-site upgrades to facilities owned by Western. At the request of SWE, Environmental Resources Management (ERM) has prepared this Noise Assessment for the Project. The Noise Assessment is intended to provide information on estimated noise impacts of the three selected turbine models on sensitive noise receptors located near the Project area. Noise prediction (screening) calculations have been undertaken at the closest noise sensitive properties to the three proposed scheme layout and wind turbine options. The following options have been considered:
• 147 Siemens SWT 2.3MW wind turbines (normal operation), hub height 80m and total capacity of 338 MW;
• 224 GE 1.5MW wind turbines (normal operation), hub height 80m and total capacity of 336MW; and
• 113 Vestas V90 3MW wind turbines (mode 0), hub height 80m and total capacity of 339MW.
The layouts of each turbine option (and closest noise sensitive properties) are illustrated in Figures 1-2, 1-3 and 1-4.
1.2 PROJECT SETTING The Project area is located within Albany County, Wyoming. The City of Laramie is located approximately 18 miles northwest of the Project area, while the town of Tie Siding, Wyoming is located to the north-northeast of the Project area. One residence is located within the Project area, while the area surrounding the Project area is sparsely populated with a majority of these homes being located directly west of the Project area along a ridge line. The elevation of the Project area is 7,100 to 7,900 ft and it is characterized by nearly level floodplains and low terraces. According to the National Renewable Energy the average wind speed at 30m within the Project Area is
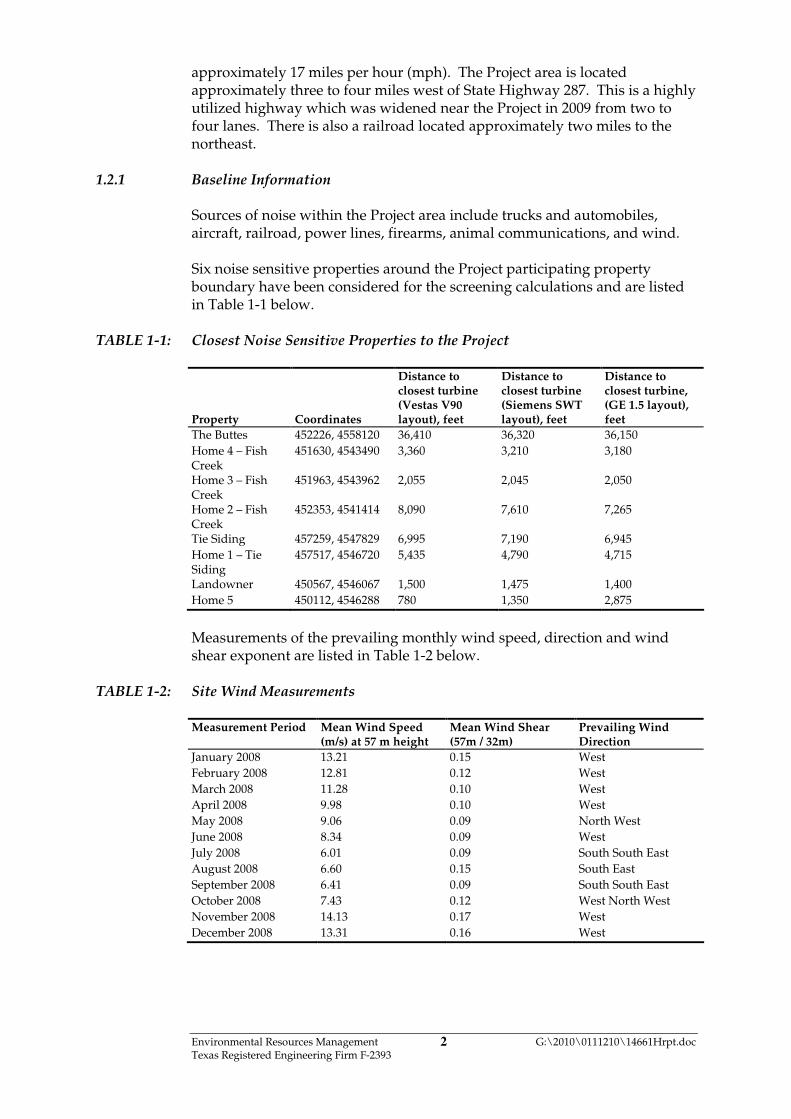
Environmental Resources Management G:\2010\0111210\14661Hrpt.doc Texas Registered Engineering Firm F-2393
2
approximately 17 miles per hour (mph). The Project area is located approximately three to four miles west of State Highway 287. This is a highly utilized highway which was widened near the Project in 2009 from two to four lanes. There is also a railroad located approximately two miles to the northeast.
1.2.1 Baseline Information Sources of noise within the Project area include trucks and automobiles, aircraft, railroad, power lines, firearms, animal communications, and wind. Six noise sensitive properties around the Project participating property boundary have been considered for the screening calculations and are listed in Table 1-1 below.
TABLE 1-1: Closest Noise Sensitive Properties to the Project
Property Coordinates
Distance to closest turbine (Vestas V90 layout), feet
Distance to closest turbine (Siemens SWT layout), feet
Distance to closest turbine, (GE 1.5 layout), feet
The Buttes 452226, 4558120 36,410 36,320 36,150
Home 4 – Fish Creek
451630, 4543490 3,360 3,210 3,180
Home 3 – Fish Creek
451963, 4543962 2,055 2,045 2,050
Home 2 – Fish Creek
452353, 4541414 8,090 7,610 7,265
Tie Siding 457259, 4547829 6,995 7,190 6,945
Home 1 – Tie Siding
457517, 4546720 5,435 4,790 4,715
Landowner 450567, 4546067 1,500 1,475 1,400
Home 5 450112, 4546288 780 1,350 2,875
Measurements of the prevailing monthly wind speed, direction and wind shear exponent are listed in Table 1-2 below.
TABLE 1-2: Site Wind Measurements Measurement Period Mean Wind Speed
(m/s) at 57 m height Mean Wind Shear (57m / 32m)
Prevailing Wind Direction
January 2008 13.21 0.15 West
February 2008 12.81 0.12 West
March 2008 11.28 0.10 West
April 2008 9.98 0.10 West
May 2008 9.06 0.09 North West
June 2008 8.34 0.09 West
July 2008 6.01 0.09 South South East
August 2008 6.60 0.15 South East
September 2008 6.41 0.09 South South East
October 2008 7.43 0.12 West North West
November 2008 14.13 0.17 West
December 2008 13.31 0.16 West
Environmental Resources Management G:\2010\0111210\14661Hrpt.doc Texas Registered Engineering Firm F-2393
3
The predominant wind direction, based on 2008 measurements is westerly (7 months out of 12), blowing away from the town of Tie Siding. This could also increase ambient noise levels in the area from the highway. Wind shear is discussed in Section 3-3 below.
1.2.2 Acoustics and Glossary of Terms The terms ‘sound’ and ‘noise’ tend to be used interchangeably, but noise can be defined as unwanted sound. Sound is a normal and desirable part of life. However, when noise is imposed on people it can lead to disturbance, annoyance and other undesirable effects. Noise is measured and quantified using decibels (dB), and examples of noise levels are shown in Table 1-3.
TABLE 1-3: Examples of Noise Levels on a Decibel Scale Noise Level, dB(A) Typical noise source / example
0 “Threshold of hearing” – lowest sound an average person can hear
20 Standard required in a broadcasting or recording studio – just audible
30 Library or soft whisper at 5 feet – this is very quiet
40 Bedroom or living room
50 Conversational speech at 3 feet
60 Busy general office or air conditioning unit at 20 feet
70 Traffic on freeway at 50 feet
80 Pneumatic drill at 50 feet
90 Heavy truck at 50 feet
140 “Threshold of Pain” – maximum tolerable noise level such as very close to a jet engine or similar
The dB(A) scale is a particular way of measuring the different frequencies in sound, designed to match how the human ear perceives sound, called the ‘A’-weighting.
The decibel scale is logarithmic, which means that noise levels do not add up or change according to simple linear arithmetic. For example, adding two equal noise sources results in a doubling of sound energy, which gives a combined noise level that is 3dB higher than the individual levels. So, 60 dB + 60 dB = 63 dB (not 120 dB). However, even though the energy levels have doubled, the ear perceives only a slight increase in loudness instead of a doubling because human hearing responds to changes in noise logarithmically. This means that a relatively large change in sound energy is needed before it is perceived to be louder or quieter. For example, it is generally accepted that:
• an increase or decrease of 1dB cannot usually be heard in everyday
conditions (although possible in ‘laboratory’ conditions);
• an increase or decrease of 3dB is generally accepted as the smallest
change that is noticeable in ordinary conditions;
• an increase or decrease of 5dB is a clearly perceptible change in noise; and
• an increase or decrease of 10dB is perceived to be a doubling (or halving)
of perceived loudness.
Environmental Resources Management G:\2010\0111210\14661Hrpt.doc Texas Registered Engineering Firm F-2393
4
To place this into context, to change a noise level by around 3dB there would need to be a doubling or halving of the noise energy; and a change of 10dB would need a ten-fold change in noise energy. Sound can be distinguished by its content, and Hertz (Hz) is the unit used to describe the tonality or frequency content of sound. The lowest frequency that can be identified as sound by a person with good hearing is 20Hz. Frequencies below this (infrasound) can be detected, but are perceived as a feeling in the body as opposed to an actual sound. At the other end of the scale, the highest frequency that can he heard may be up to 20,000Hz, but this depends on factors such as age, health and previous exposure to noise and an upper range between 16 and 18 kilo hertz ( KHz) might be more representative. Sound below 20Hz is referred to as ‘infrasound’, and sound between 10Hz and 200Hz is often described as ‘low frequency noise’ (LFN), although there is no a commonly held definition for these terms. Although our hearing can detect sounds throughout this range, it does not ascribe the same importance or weight to sound in each frequency. For example, if a person was listening to a tone at 1KHz at a fixed level, then a tone at 30Hz would have to be 50dB higher for it to be judged equally as loud, although this varies depending on the reference loudness. To account for our sensitivity to sound over different frequencies, environmental noise sources are often described as ‘A’-weighted decibels, denoted as dB(A). This A-weighting is an internationally agreed standard that reflects the frequency sensitivity of the ear. Since noise also often varies over time, statistical parameters (or metrics) are used to measure, and describe noise. Two common noise metrics used for environmental noise measurement are the LAeq and LA90. The LAeq, T metric is called the ‘continuous equivalent sound level’. It represents a varying noise level by calculating the constant sound level that would have the same sound energy content over the measurement period. The letter ‘A’ denotes that ‘A’-weighting has been used and the ‘eq’ indicates that an equivalent level has been calculated. So ‘LAeq,T’ is the A-weighted continuous sound level, measured over period ‘T’. LAeq is a logarithmic average noise level over a period (instead of an arithmetic average) which gives a high weighting to high noise levels even if they are relatively short lived or infrequent events. The LA90, T metric is a percentile noise level in dB(A). This represents the value exceeded for 90% of the time period (T) being considered. Note that it is higher than the minimum noise level but may be regarded as the typical noise level during ‘quiet periods’.
1.3 NOISE PREDICTION MODEL
Wind Turbine Generated (WTG) noise predictions were carried out under down wind propagation conditions. The predictions were performed using

Environmental Resources Management G:\2010\0111210\14661Hrpt.doc Texas Registered Engineering Firm F-2393
5
the calculation methodology set out in ISO 96131 Acoustics - Attenuation of Sound During Propagation Outdoors. Part 2: General Method of Calculation. The sound power levels used as a basis of the assessment are also measured under down wind conditions. In undertaking predictions of noise levels from wind farms the following factors can be considered:
• the decrease in noise with distance;
• the absorption of noise in air;
• the attenuation of noise over acoustically ‘soft’ ground;
• screening of the turbines by topography and other obstacles; and
• meteorological conditions.
The calculation inputs (wind turbine sound sources in sound power level octave bands) were entered into the model as X, Y and Z coordinates (representing northing, easting, and elevation). Additionally included in the calculation is the hub height of each type of turbine. Once these are fixed, noise levels from all turbines were calculated at each property (input as X, Y, and Z) and the combined turbine noise level reported for at 10 meters (33 feet). This method allows for verifying consistency with the noise source data that is always presented at a derived 10 meter height.
In predicting operational noise from the Project area, air absorption and distance attenuation were accounted for using the method described in
ISO 9613 assuming 10°C and 70% humidity. No acoustic screening of the turbines is expected. In this approach, no corrections have been applied for ground roughness or for intervening barriers (for example topography) to provide for a reasonable worst-case assessment. Additionally, no attenuation from ground absorption has been assumed in the model to present a conservative assumption. Spectral data in the form of octave band sound power levels for each type of turbine was taken into account, and then added to provide the LAeq and LA90 noise levels
1 ISO 9613-2 ‘Acoustics - Attenuation of Sound During Propagation Outdoors. Part 2: General Method of Calculation’.
ISO, 1996.
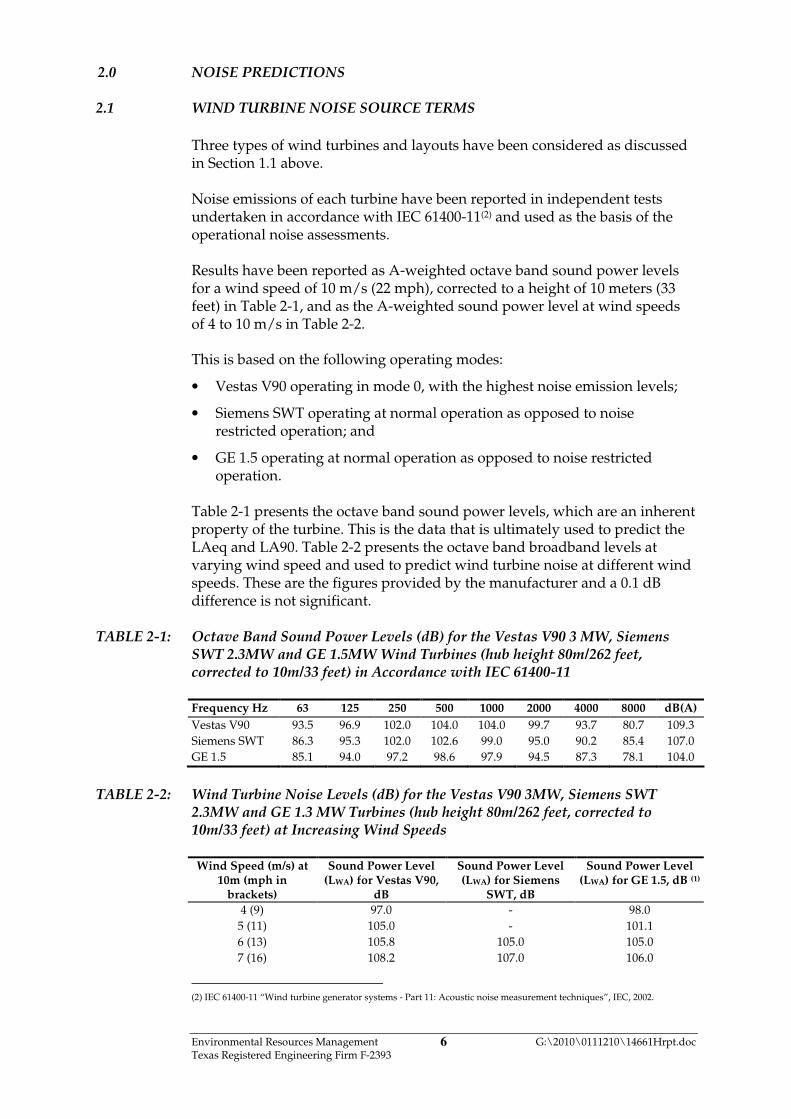
Environmental Resources Management G:\2010\0111210\14661Hrpt.doc Texas Registered Engineering Firm F-2393
6
2.0 NOISE PREDICTIONS
2.1 WIND TURBINE NOISE SOURCE TERMS
Three types of wind turbines and layouts have been considered as discussed in Section 1.1 above. Noise emissions of each turbine have been reported in independent tests undertaken in accordance with IEC 61400-11(2) and used as the basis of the operational noise assessments. Results have been reported as A-weighted octave band sound power levels for a wind speed of 10 m/s (22 mph), corrected to a height of 10 meters (33 feet) in Table 2-1, and as the A-weighted sound power level at wind speeds of 4 to 10 m/s in Table 2-2. This is based on the following operating modes:
• Vestas V90 operating in mode 0, with the highest noise emission levels;
• Siemens SWT operating at normal operation as opposed to noise restricted operation; and
• GE 1.5 operating at normal operation as opposed to noise restricted operation.
Table 2-1 presents the octave band sound power levels, which are an inherent property of the turbine. This is the data that is ultimately used to predict the LAeq and LA90. Table 2-2 presents the octave band broadband levels at varying wind speed and used to predict wind turbine noise at different wind speeds. These are the figures provided by the manufacturer and a 0.1 dB difference is not significant.
TABLE 2-1: Octave Band Sound Power Levels (dB) for the Vestas V90 3 MW, Siemens SWT 2.3MW and GE 1.5MW Wind Turbines (hub height 80m/262 feet, corrected to 10m/33 feet) in Accordance with IEC 61400-11 Frequency Hz 63 125 250 500 1000 2000 4000 8000 dB(A)
Vestas V90 93.5 96.9 102.0 104.0 104.0 99.7 93.7 80.7 109.3
Siemens SWT 86.3 95.3 102.0 102.6 99.0 95.0 90.2 85.4 107.0
GE 1.5 85.1 94.0 97.2 98.6 97.9 94.5 87.3 78.1 104.0
TABLE 2-2: Wind Turbine Noise Levels (dB) for the Vestas V90 3MW, Siemens SWT
2.3MW and GE 1.3 MW Turbines (hub height 80m/262 feet, corrected to 10m/33 feet) at Increasing Wind Speeds Wind Speed (m/s) at
10m (mph in brackets)
Sound Power Level (LWA) for Vestas V90,
dB
Sound Power Level (LWA) for Siemens
SWT, dB
Sound Power Level (LWA) for GE 1.5, dB (1)
4 (9) 97.0 - 98.0
5 (11) 105.0 - 101.1
6 (13) 105.8 105.0 105.0
7 (16) 108.2 107.0 106.0
(2) IEC 61400-11 “Wind turbine generator systems - Part 11: Acoustic noise measurement techniques”, IEC, 2002.

Environmental Resources Management G:\2010\0111210\14661Hrpt.doc Texas Registered Engineering Firm F-2393
7
Wind Speed (m/s) at 10m (mph in
brackets)
Sound Power Level (LWA) for Vestas V90,
dB
Sound Power Level (LWA) for Siemens
SWT, dB
Sound Power Level (LWA) for GE 1.5, dB (1)
8 (18) 109.3 107.0 -
9 (20) 109.4 107.0 -
10 (22) 106.7 107.0 -
11 (25) 105.9 - -
12 (27) 105.7 - - (1) This includes a +2 dB uncertainty correction reported in the test report for this turbine
The location and elevations of the turbines layouts used in this analysis are
illustrated in Figures 1-2, 1-3, and 1-4. The results of the assessment are
presented in Table 2-3, Table 2-4 and, Table 2-5 below. All results presented
in the report assume cumulative noise from all turbines for each layout and
turbine combination at the identified properties. Refer to Section 1.2.2 for
definition of acoustic terminology.
The "average" LAeq shown in the third column in Tables 2-3 to 2-5 is calculated from the data given in Table 2-1 for each turbine type. The predicted LAeq noise levels, over a range of wind speed, are derived from the data presented in Table 2-2. Tables 2-3 through 2-5 present the overall noise levels predicted for each noise receptor based on the turbine type and layout. The variation in noise levels in Tables 2-3 through 2-5 are different because of two factors:
• the layout given for each turbine type (GE 1.5 based on 224 turbines; Siemens 2.3 based on 147 turbines and Vestas V90 3.0 based on 113 turbines); and
• the source noise levels of each turbine (Tables 2-1 and 2-2). Predicted noise levels show that the GE 1.5MW turbine will have the lowest noise levels, followed by the Siemens 2.3MW turbine and the Vestas V90 3MW turbine. However, all turbine types / configurations meet the 55 dB Albany County Standard. Based on these data, SWE would not be confined to one particular turbine type of the three evaluated and can use whichever of the three turbine types (and layouts) that best meet their needs.
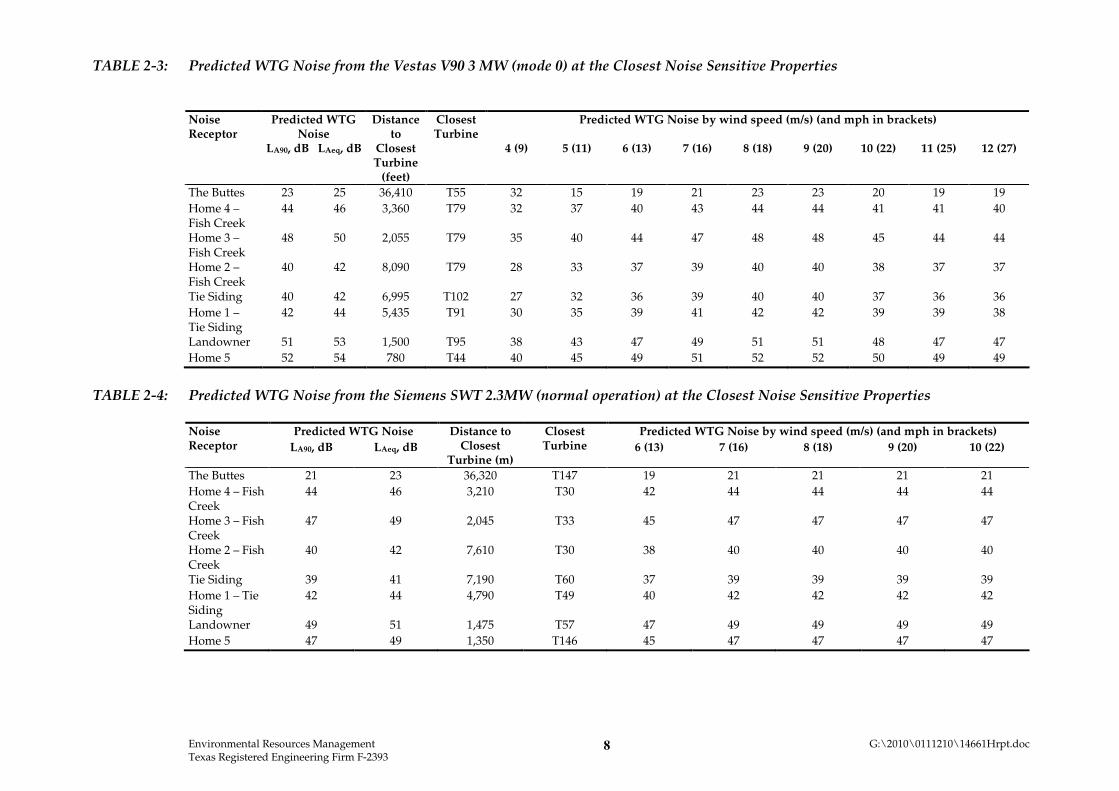
Environmental Resources Management G:\2010\0111210\14661Hrpt.doc Texas Registered Engineering Firm F-2393
8
TABLE 2-3: Predicted WTG Noise from the Vestas V90 3 MW (mode 0) at the Closest Noise Sensitive Properties
Predicted WTG Noise
Predicted WTG Noise by wind speed (m/s) (and mph in brackets) Noise Receptor
LA90, dB LAeq, dB
Distance to
Closest Turbine
(feet)
Closest Turbine
4 (9) 5 (11) 6 (13) 7 (16) 8 (18) 9 (20) 10 (22) 11 (25) 12 (27)
The Buttes 23 25 36,410 T55 32 15 19 21 23 23 20 19 19
Home 4 – Fish Creek
44 46 3,360 T79 32 37 40 43 44 44 41 41 40
Home 3 – Fish Creek
48 50 2,055 T79 35 40 44 47 48 48 45 44 44
Home 2 – Fish Creek
40 42 8,090 T79 28 33 37 39 40 40 38 37 37
Tie Siding 40 42 6,995 T102 27 32 36 39 40 40 37 36 36
Home 1 – Tie Siding
42 44 5,435 T91 30 35 39 41 42 42 39 39 38
Landowner 51 53 1,500 T95 38 43 47 49 51 51 48 47 47
Home 5 52 54 780 T44 40 45 49 51 52 52 50 49 49
TABLE 2-4: Predicted WTG Noise from the Siemens SWT 2.3MW (normal operation) at the Closest Noise Sensitive Properties
Predicted WTG Noise Predicted WTG Noise by wind speed (m/s) (and mph in brackets) Noise
Receptor LA90, dB LAeq, dB
Distance to Closest
Turbine (m)
Closest Turbine 6 (13) 7 (16) 8 (18) 9 (20) 10 (22)
The Buttes 21 23 36,320 T147 19 21 21 21 21
Home 4 – Fish Creek
44 46 3,210 T30 42 44 44 44 44
Home 3 – Fish Creek
47 49 2,045 T33 45 47 47 47 47
Home 2 – Fish Creek
40 42 7,610 T30 38 40 40 40 40
Tie Siding 39 41 7,190 T60 37 39 39 39 39
Home 1 – Tie Siding
42 44 4,790 T49 40 42 42 42 42
Landowner 49 51 1,475 T57 47 49 49 49 49
Home 5 47 49 1,350 T146 45 47 47 47 47

Environmental Resources Management G:\2010\0111210\14661Hrpt.doc Texas Registered Engineering Firm F-2393
9
TABLE 2-5: Predicted WTG Noise from the GE 1.5MW (normal operation) at the Closest Noise Sensitive Properties
Predicted WTG Noise Predicted WTG Noise by wind speed (m/s) (and mph in brackets) Noise Receptor LA90, dB LAeq, dB
Distance to Closest
Turbine (m)
Closest Turbine 6 (13) 7 (16) 8 (18) 9 (20) 10 (22)
The Buttes 20 22 36,150 T116 15 15 18 22 23
Home 4 – Fish Creek
42 44 3,180 T44 36 36 40 43 44
Home 3 – Fish Creek
46 48 2,050 T47 40 40 43 47 48
Home 2 – Fish Creek
39 41 7,265 T164 33 33 36 40 41
Tie Siding 38 40 6,945 T92 32 32 35 39 40
Home 1 – Tie Siding
38 40 4,715 T73 32 32 35 39 40
Landowner 48 50 1,400 T85 42 42 45 49 50
Home 5 43 45 2,875 T89 37 37 40 44 45
Environmental Resources Management 10 G:\2010\0111210\14661Hrpt.doc
Texas Registered Engineering Firm F-2393
3.0 NOISE FROM WIND TURBINES, LOW FREQUENCY NOISE, INFRASOUND AND HEALTH EFFECTS
3.1 INTRODUCTION Although wind turbines are generally considered to be quiet, concerns have been expressed about low frequency noise and infrasound causing health effects and distress to neighbors. There have been many notable studies published on these topics, some with conflicting viewpoints. In December 2009, an expert panel was assembled by the American Wind Energy Association (AWEA) and Canadian Wind Energy Association (CanWEA) to ‘provide an authoritative reference document for legislators, regulators, and anyone who wants to make sense of the conflicting information about wind turbine sound’(3). To avoid bias and conflict of interest, the expert panel selected consisted of independent experts in acoustics, audiology, medicine, and public health with a remit to address health concerns associated with wind turbine noise. The findings of the AWEA and CanWEA report are discussed here, however for the interested reader the full report can be found at: http://www.awea.org/newsroom/releases/12-15-09-sound_panel_release.html
3.2 SOURCES OF NOISE Wind turbine noise originates from mechanical sound (the gearbox and control mechanisms) and aerodynamic sound (produced by the rotation of the turbine blade through the air). Aerodynamic noise is the dominant source and will be present over all frequencies, including the infrasound range (i.e. below 20Hz), but is generally within the mid frequency range (approximately 500Hz to 1KHz). Noise within this range will rise and fall as the turbine blade rotates and this change or ‘modulation’ is described as ‘amplitude modulation’ which can be perceived by a listener as a fluctuation in sound occurring approximately every second. It has been suggested that under certain conditions such as wind shear (see below), this fluctuation can be heard some distance away, and because it is a noise that frequently changes, it is more noticeable for the listener.
3.3 WEATHER EFFECTS AND WIND SHEAR Meteorological factors can affect the propagation of sound from wind turbines. For example, warm air at ground level would cause noise from the turbine to curve upwards which would reduce noise levels; whilst warm air during temperature inversions may cause noise from the turbine to curve downwards,
(3) 'Wind Turbine Sound and Health Effects. An Expert Panel Review'. AWEA and CanWEA, December 2009
Environmental Resources Management 11 G:\2010\0111210\14661Hrpt.doc
Texas Registered Engineering Firm F-2393
resulting in increased noise levels. Wind direction can also affect the level of turbine noise at a property (i.e. blowing towards or away from the property). Wind shear is a measure of how much wind speed increases with height. Under certain circumstances such as very stable atmospheric conditions, which may occur at night, wind speed at the turbine hub height may be substantially increased over that which is expected. This means that masking of wind turbine noise at a property by the wind does not always occur. For example, the wind at turbine height may be sufficient to power the turbine (and generate noise), yet the wind speed at a property may be negligible and no masking of wind turbine noise will take place leading to higher source noise levels.
There is general agreement that wind turbine noise assessments are undertaken at a reference height of 10m (33 feet) based on the fact that the method(4) used by wind turbine manufacturers to measure noise levels from wind turbines (in turn used to calculated wind turbine noise at properties) are also corrected to a reference height of 10 meters. For the purpose of the modeling described herein, a wind shear correction is applied in converting the hub height noise level to this reference height. Site specific wind shear correction takes into account the different time periods in the day which may vary significantly between early morning, evening and night (data was available from meteorological data collected at the site). A mathematical correction for wind shear is applied to account for this.
Noise models err on the side of caution and present a reasonable worst-case noise assessment, calculating noise downwind and applying a ground roughness factor to account for wind shear effects. Wind shear measurements reported in Table 1-2 are typical of smooth, level, grass covered terrain. The results of this indicate that the predicted noise levels will not be significantly affected by wind shear; although such weather conditions could occur from time to time.
3.4 INFRASOUND, LOW FREQUENCY NOISE AND ANNOYANCE The infrasound from wind turbines is at a level of 50 to 70dB, sometimes higher, but well below the audible threshold of hearing which ranges between 79dB at 20Hz and 107dB at 4Hz. Infrasound from natural sources such as the wind also surrounds us and is also below the threshold of audibility. Some people attribute health effects to wind turbine noise exposure. When amplitude modulation occurs, this can provoke complaint and may be labeled as ‘low frequency noise’ or ‘infrasound’ by some, although this ‘swishing’ noise is in fact in the 500Hz to 1KHz range. It is this fluctuating noise (i.e. amplitude modulation) which only occurs under certain conditions that cause most
(4) IEC 61400-11 'Wind Turbine Generator Systems Part 11: Acoustic Noise Measurement Techniques'.

Environmental Resources Management 12 G:\2010\0111210\14661Hrpt.doc
Texas Registered Engineering Firm F-2393
complaints due to the more disturbing nature of a fluctuating noise compared to a non-fluctuating noise such as free-flowing traffic. The AWEA and CanWEA report refers to a UK study (5) that concluded that out of 130 wind farms, only 4 had a problem with amplitude modulation, and 3 of these had been resolved. Furthermore, this amplitude modulation when observed beneath a turbine does not always occur at greater separation distances. Comprehensive research (6) on low frequency noise has been repeatedly shown by measurements of wind turbine noise undertaken in the USA, UK, Denmark and Germany over the past decade that the levels of infrasonic noise and vibration radiated from modern, wind turbines are at a very low level; so low that they lie below the threshold of perception, even for those people who are particularly sensitive to such noise, and even on an actual wind turbine site. Claims of health effects from wind turbines are addressed within the AWEA and CanWEA report, in particular, the claim of ‘wind turbine syndrome’ promoted by Pierpont (7) based on the following assertions:
• low levels of airborne infrasound from wind turbines (1 – 2Hz) affect the
vestibular system (this is the system that governs our balance and sense of
orientation); and
• low levels of airborne infrasound from wind turbines at the 4 – 8Hz range
enter the lungs and vibrate the diaphragm which in turn transmits vibration
through other organs in the body.
Pierpont claims this combined effect causes a range of symptoms termed wind turbine syndrome. The AWEA and CanWEA report, in response to these assertions states: There is no credible scientific evidence that low levels of wind turbine sound at 1 to 2Hz will directly affect the vestibular system. In fact, it is likely that the sound will be lost in the natural infrasonic background sound of the body. The second hypothesis is equally unsupported with appropriate scientific investigations. The body is a noisy system at low frequencies. In addition to the beating heart at a frequency of 1 to 2Hz, the body emits sounds from blood circulation, bowels, stomach, muscle contraction, and other internal sources. Body sounds can be detected externally to the body by the stethoscope.
(5) 'Research into Aerodynamic Modulation of Wind Turbine Noise' (2007). www.berr.gov.uk/files/file40570.pdf (6) "A Review of Published Research on Low Frequency Noise and its Effects" Report for DEFRA by Dr Geoff Leventhall
Assisted by Dr Peter Pelmear and Dr Stephen Benton. May 2003 (7) Pierpont, N 2009, pre publication draft 'Wind Turbine Syndrome: a report on a natural experiment'.
http://www.windturbinesyndrome.com
Environmental Resources Management 13 G:\2010\0111210\14661Hrpt.doc
Texas Registered Engineering Firm F-2393
The report goes on to say: “Wind turbine syndrome” is not a recognized medical diagnosis, is essentially reflective symptoms associated with noise annoyance and is an unnecessary and confusing addition to the vocabulary on noise. This syndrome is not a recognized diagnosis in the medical community. There are no unique symptoms or combinations of symptoms that would lead to a specific pattern of this hypothesized disorder. The collective symptoms in some people exposed to wind turbines are more likely associated with annoyance to low sound levels. Furthermore, the evidence presented by Pierpont to support the hypothesis of wind turbine syndrome is based a single case series from a group of self-nominated individuals and from a single investigator. This has limited credibility in terms of scientific peer review. In summary, following a review of available literature, the Expert Panel assembled by the AWEA and CanWEA concluded the following.
1. Sound from wind turbines does not pose a risk of hearing loss or any other
adverse health effect in humans.
2. Sub-audible, low frequency sound and infrasound from wind turbines do
not present a risk to human health.
3. Some people may be annoyed at the presence of sound from wind turbines,
but annoyance is not a pathological entity.
4. A major cause of concern about wind turbine sound is its fluctuating nature.
Some may find this sound annoying, a reaction that depends on personal
characteristics as opposed to the intensity of the sound level.
3.5 VIBRATION
A comprehensive study of vibration measurements in the vicinity of a modern wind farm undertaken in 1997 (8) found that vibration levels 100 m from the nearest turbine were a factor of 10 less than those recommended for human exposure in sensitive buildings, such as hospitals or laboratories housing precision measurement instruments.
(8) ETSU W/13/00392/REP 'Low frequency noise and vibrations measurement at a modern wind far'. Department of Trade and
Industry, 1997.

Environmental Resources Management 14 G:\2010\0111210\14661Hrpt.doc
Texas Registered Engineering Firm F-2393
4.0 RESULTS The Proposed Action includes construction/decommissioning related noises, as well as operation of a substation. Construction equipment associated with Projects such as this one typically generate noise levels ranging from approximately 75 to 90 dB(A) at 50 feet, depending on the equipment being used (U.S. Department of Transportation 2006: United States Department of Transportation. August 2006. FHWA Highway Construction Noise Handbook). Construction of the Proposed Action would cause temporary increases in ambient noise levels in the immediate vicinity of the construction sites. On-site construction noise would occur mainly from heavy-duty construction equipment (e.g., trucks, backhoes, excavators, loaders, and cranes). As a result, construction-generated noise would be considered a less-than-significant short-term impact. The Wyoming Department of Transportation (WYDOT) completed noise studies along State Highway 287 as part of an Environmental Assessment (EA) for the expansion of State Highway 287 which was completed in 20099. Prior to the expansion of State Highway 287, WYDOT determined that the existing noise conditions at Tie Siding were between 54.8 and 63.3 dB(A) and these were attributed to wind effects and not traffic noise emanating from State Highway 287. Based on noise modeling, the post highway expansion noise conditions at Tie Siding were estimated to be between 56.7 and 70.0 dB(A). The EA determined that the expansion would only have a minor noise impact to one receptor (a single family home) and no mitigation measures were required. Additionally, the EA determined that noise impacts from construction activities would be temporary and minimal. Substations typically produce between 60 and 70 LA90, dB during operations. The proposed substation location is over 3,000 feet from the participating owner’s property line. Noise dissipates at approximately 6 dB(A) per doubling of distance based on a point source (and not taking account of additional mitigation from air and ground absorption which will be quite significant at distances greater than approximately 300 feet), and impacts would be considered less than significant. In addition to the impacts discussed above, the Project would include wind turbine generated noise. The Albany County standard for noise is as follows. Noise associated with wind energy operation shall not exceed fifty-five (55) dB(A) as measured at any point along the common property lines between a non-participating property and a participating property.
a. This level may be exceeded during short-term events such as utility outages, severe weather events, and construction or maintenance operations.
9 WYDOT. 2007. WYDOT Project No. 0N23-02 (045, 048, 049, 050, 051) US 287, Laramie, Wyoming to the Colorado State Line. U.S. Department of Transportation Federal Highway Administration and WYDOT. 2007.
Environmental Resources Management 15 G:\2010\0111210\14661Hrpt.doc
Texas Registered Engineering Firm F-2393
b. This standard shall not apply along any portion of the common property line where the participating property abuts state or federal property.
c. Noise levels may exceed the fifty-five (55) dB(A) limit along common property lines if written permission, as recorded with the Albany County Clerk, is granted by the affected adjacent non-participating property owners.
Based on the assessment performed, noise levels would not be expected to exceed fifty-five (55) dB(A) as measured at any point along the common property lines between a non-participating property and a participating property. During high wind events in excess of 10 m/s wind generated noise is likely to be masked from wind noise. Other factors such as the existing ambient noise levels (especially from the nearby highway) and wind direction will also affect the perception of wind turbine noise at local properties.

Texas Registered Engineering Firm F-2393 G:\2010\0111210\14661Hrpt.doc
Figures
June 4, 2010 Project No. 0111210
Environmental Resources Management Southwest, Inc. 15810 Park Ten Place, Suite 300
Houston, Texas 77084-5140 (281) 600-1000
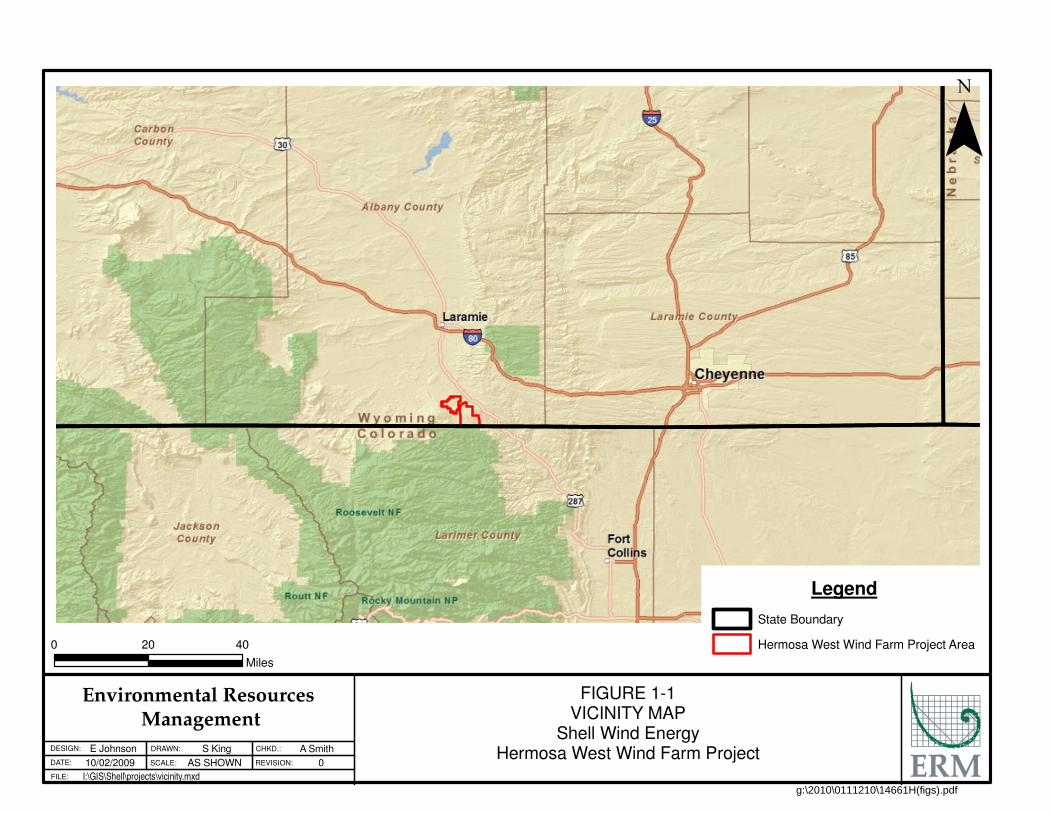
0 20 40
Miles
FIGURE 1-1
VICINITY MAP
Shell Wind Energy
Hermosa West Wind Farm ProjectE Johnson
10/02/2009
S King
AS SHOWN
A Smith
0
I:\GIS\Shell\projects\vicinity.mxdFILE:
DATE:
DESIGN: DRAWN:
SCALE:
CHKD.:
REVISION:
Environmental Resources Management
¯
Legend
State Boundary
Hermosa West Wind Farm Project Area
g:\2010\0111210\14661H(figs).pdf
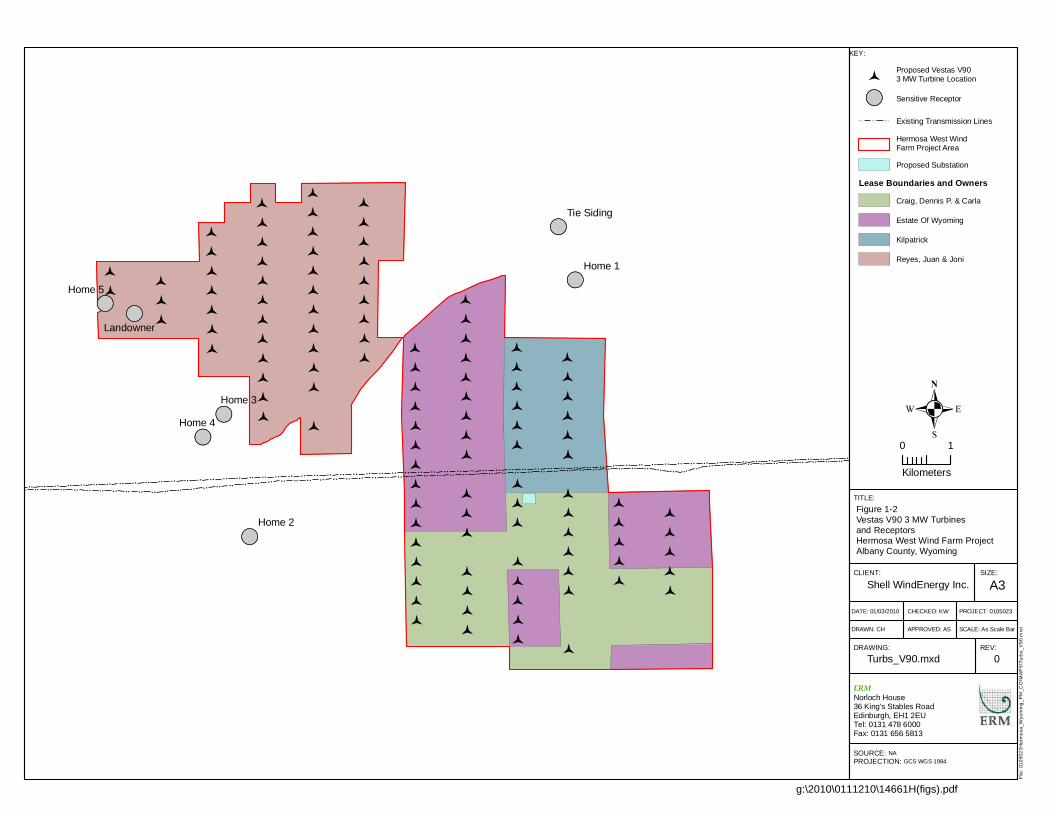
! ! ! ! ! ! ! ! ! ! ! ! ! ! ! ! ! ! ! ! ! ! ! ! ! ! ! ! ! ! ! ! ! ! ! ! ! ! ! ! ! ! ! ! ! ! ! ! ! ! ! ! ! ! ! ! ! ! ! ! ! ! ! ! ! ! ! ! ! ! ! ! ! ! ! ! ! ! ! ! ! ! ! ! ! ! ! ! ! ! ! ! ! !! ! ! ! ! ! ! ! ! ! ! ! ! ! ! ! ! ! ! ! ! ! ! ! ! ! ! ! ! ! ! ! ! ! ! ! ! ! ! ! ! ! ! ! ! ! ! ! ! ! ! ! ! ! ! ! ! ! ! ! ! ! ! ! ! ! ! ! ! ! ! ! ! ! ! ! ! ! ! ! ! ! ! ! ! ! ! ! ! ! ! ! ! ! ! ! ! ! ! ! ! ! ! !
!!
!!
!!
!!
!!
!!
!!
!!
!!
!!
!!
!!
!!
!!
!!
!!
!!
!!
!!
!!
!!
!!
!!
!!
!!
!!
!!
!!
!!
!!
!!
!!
!!!!!!!!!!!!!!!!!!!!!!!!!!!!!!!!!!!!
!!!!!!
!!!!!!!!!!!!!!!!!!!!!!!!!!!!!!!!!!!!!!!!!!!!!!!!!!!!!!!!!!!!!!
!!!!
!!!!!!!!!!
!!!!!!!!!!!!!!!!!!!!!!!!
!((!((
!((
!((
!((
!((!((Home 5
Home 1
Home 2
Home 3
Home 4
Landowner
Tie Siding
SIZE:
TITLE:
DATE: 01/03/2010
DRAWN: CH
CHECKED: KW
APPROVED: AS
PROJECT: 0105023
SCALE: As Scale Bar
DRAWING: REV:
KEY:
A3
Figure 1-2Vestas V90 3 MW Turbinesand ReceptorsHermosa West Wind Farm ProjectAlbany County, Wyoming
Turbs_V90.mxd 0
Proposed Vestas V903 MW Turbine Location
!(( Sensitive Receptor
! ! ! ! ! ! Existing Transmission Lines
Hermosa West WindFarm Project Area
Proposed Substation
Lease Boundaries and OwnersCraig, Dennis P. & Carla
Estate Of Wyoming
Kilpatrick
Reyes, Juan & Joni
CLIENT:
SOURCE: NAPROJECTION: GCS WGS 1984
File
: 010
5023
Her
mos
a_W
yom
ing_
PM
_CO
\MA
PS
\Tur
bs_V
90.m
xd
ERMNorloch House36 King's Stables RoadEdinburgh, EH1 2EUTel: 0131 478 6000Fax: 0131 656 5813
.0 1
Kilometers
Shell WindEnergy Inc.
g:\2010\0111210\14661H(figs).pdf

! ! ! ! ! ! ! ! ! ! ! ! ! ! ! ! ! ! ! ! ! ! ! ! ! ! ! ! ! ! ! ! ! ! ! ! ! ! ! ! ! ! ! ! ! ! ! ! ! ! ! ! ! ! ! ! ! ! ! ! ! ! ! ! ! ! ! ! ! ! ! ! ! ! ! ! ! ! ! ! ! ! ! ! ! ! ! ! ! ! ! !! ! ! ! ! ! ! ! ! ! ! ! ! ! ! ! ! ! ! ! ! ! ! ! ! ! ! ! ! ! ! ! ! ! ! ! ! ! ! ! ! ! ! ! ! ! ! ! ! ! ! ! ! ! ! ! ! ! ! ! ! ! ! ! ! ! ! ! ! ! ! ! ! ! ! ! ! ! ! ! ! ! ! ! ! ! ! ! ! ! ! ! ! ! ! ! ! ! ! ! ! !
!!
!!
!!
!!
!!
!!
!!
!!
!!
!!
!!
!!
!!
!!
!!
!!
!!
!!
!!
!!
!!
!!
!!
!!
!!
!!
!!
!!
!!
!!
!!
!!
!!
!!
!!!!!!!!!!!!!!!!!!!!!!!!!!!!!!!!!!
!!
!!!!
!!!!!!!!!!!!!!!!!!!!!!!!!!!!!!!!!!!!!!!!!!!!!!!!!!!!!!!!!!
!!!!
!!!!
!!!!
!!!!
!!!!!!!!!!!!!!!!!!!!!!!!!
!((
!((
!((
!((
!((
!((!((
Home 5
Home 1
Home 2
Home 3
Home 4
Landowner
Tie Siding
SIZE:
TITLE:
DATE: 29/12/2009
DRAWN: CH
CHECKED: KW
APPROVED: AS
PROJECT: 0105023
SCALE: As Scale Bar
DRAWING: REV:
KEY:
A3
Figure 1-3Siemens SWT 2.3 MW Turbinesand ReceptorsHermosa West Wind Farm ProjectAlbany County, Wyoming
Turbs_SWT.mxd 0
Proposed Siemens SWT2.3 MW Turbine Location
!(( Sensitive Receptor
! ! ! ! ! ! Existing Transmission Lines
Hermosa West WindFarm Project Area
Proposed Substation
Lease Boundaries and OwnersCraig, Dennis P. & Carla
Estate Of Wyoming
Kilpatrick
Reyes, Juan & Joni
CLIENT:
SOURCE: NAPROJECTION: WGS 1984 UTM Zone 13N
File
: 010
5023
Her
mos
a_W
yom
ing_
PM
_CO
\MA
PS
\Tur
bs_S
WT.
mxd
ERMNorloch House36 King's Stables RoadEdinburgh, EH1 2EUTel: 0131 478 6000Fax: 0131 656 5813
.0 1
Kilometers
Shell WindEnergy Inc.
g:\2010\0111210\14661H(figs).pdf

! ! ! ! ! ! ! ! ! ! ! ! ! ! ! ! ! ! ! ! ! ! ! ! ! ! ! ! ! ! ! ! ! ! ! ! ! ! ! ! ! ! ! ! ! ! ! ! ! ! ! ! ! ! ! ! ! ! ! ! ! ! ! ! ! ! ! ! ! ! ! ! ! ! ! ! ! ! ! ! ! ! ! ! ! ! ! ! ! ! ! !
! ! ! ! ! ! ! ! ! ! ! ! ! ! ! ! ! ! ! ! ! ! ! ! ! ! ! ! ! ! ! ! ! ! ! ! ! ! ! ! ! ! ! ! ! ! ! ! ! ! ! ! ! ! ! ! ! ! ! ! ! ! ! ! ! ! ! ! ! ! ! ! ! ! ! ! ! ! ! ! ! ! ! ! ! ! ! ! ! ! ! ! ! ! ! ! ! ! ! ! ! !
!!
!!
!!
!!
!!
!!
!!
!!
!!
!!
!!
!!
!!
!!
!!
!!
!!
!!
!!
!!
!!
!!
!!
!!
!!
!!
!!
!!
!!
!!
!!
!!
!!
!!
!!!!!!!!!!!!!!!!!!!!!!!!!!!!!!!!!!
!!
!!!!
!!!!!!!!!!!!!!!!!!!!!!!!!!!!!!!!!!!!!!!!!!!!!!!!!!!!!!!!!!
!!!!
!!!!
!!!!
!!!!
!!!!!!!!!!!!!!!!!!!!!!!!!
!((
!((
!((
!((
!((
!((!((
Home 5
Home 1
Home 2
Home 3
Home 4
Landowner
Tie Siding
SIZE:
TITLE:
DATE: 29/12/2009
DRAWN: CH
CHECKED: KW
APPROVED: AS
PROJECT: 0105023
SCALE: As Scale Bar
DRAWING: REV:
KEY:
A3
Figure 1-4GE 1.5 MW Turbines and ReceptorsHermosa West Wind Farm ProjectAlbany County, Wyoming
Turbs_300MW.mxd 0
Proposed GE 1.5 MWTurbine Location
!(( Sensitive Receptor
! ! ! ! ! ! Existing Transmission Lines
Hermosa West WindFarm Project Area
Proposed Substation
Lease Boundaries and OwnersCraig, Dennis P. & Carla
Estate Of Wyoming
Kilpatrick
Reyes, Juan & Joni
CLIENT:
SOURCE: NAPROJECTION: WGS 1984 UTM Zone 13N
File
: 010
5023
Her
mos
a_W
yom
ing_
PM
_CO
\MA
PS
\Tur
bs_3
00M
W.m
xd
ERMNorloch House36 King's Stables RoadEdinburgh, EH1 2EUTel: 0131 478 6000Fax: 0131 656 5813
.0 1
Kilometers
Shell WindEnergy Inc.
g:\2010\0111210\14661H(figs).pdf