appendix d geotechnical recommendations - port … terracon/pnd soil test locations ... vst vane...
TRANSCRIPT

Appendix D Geotechnical Recommendations


F i na l Repor t
Anchorage Port Modernization Project Geotechnical Recommendations
Prepared for
Port of Anchorage
December 8, 2014
Prepared by
Anchorage, Alaska


Contents Section Page
Acronyms and Abbreviations................................................................................................................. 1-1
1 Introduction.............................................................................................................................. 1-1 1.1 Description of Modernization Concepts .......................................................................... 1-1 1.2 Scope of Geotechnical Work .......................................................................................... 1-2 1.3 Limitations .................................................................................................................... 1-3
2 Relevant Subsurface Soil and Groundwater Conditions .............................................................. 2-1 2.1 Subsurface Soil Profiles and Properties ........................................................................... 2-1 2.2 Engineering Parameters ................................................................................................. 2-2 2.3 Groundwater Condition ................................................................................................. 2-3
3 Basis of Design .......................................................................................................................... 3-1 3.1 Design Guidelines and Specifications .............................................................................. 3-1 3.2 Key Assumptions ........................................................................................................... 3-1
4 Seismic Design Considerations................................................................................................... 4-1 4.1 Seismic Design Parameters............................................................................................. 4-1 4.2 Liquefaction Potential and Shear Strength Degradation ................................................... 4-1
5 Geotechnical Design Criteria...................................................................................................... 5-1 5.1 Service Life .................................................................................................................... 5-1 5.2 Considerations for Over-Dredging and Scour Depths ....................................................... 5-1 5.3 Allowable Deformations for Embankment Slopes, Bulkhead Walls, and Wharf Structures .. 5-1
6 Geotechnical Analyses and Recommendations........................................................................... 6-1 6.1 Embankment Stability .................................................................................................... 6-1
6.1.1 Static Global Stability Analyses ........................................................................... 6-1 6.1.2 Seismic Stability Analyses ................................................................................... 6-1
6.2 Driven Pile Foundation Design Recommendations ........................................................... 6-5 6.2.1 Resistance Factors for Load and Resistance Factor Design .................................... 6-5 6.2.2 Axial Capacity of Single Pile ................................................................................ 6-6 6.2.3 Geotechnical Parameters for Lateral Response Analysis of Pile............................. 6-7 6.2.4 Drivability Analyses............................................................................................ 6-9
6.3 Lateral Earth Pressure Coefficients for Wall Design .......................................................... 6-9
7 Issues to be Considered in Final Design ...................................................................................... 7-1 7.1 Design-Related Issues .................................................................................................... 7-1 7.2 Construction-Related Issues ........................................................................................... 7-2
8 References................................................................................................................................ 8-1
Tables
1 Engineering Properties of All Soil Units 2 Seismic Design Parameters for Liquefaction Evaluation, APMP 3 Summary of Residual Shear Strength Ratios for Liquefiable Silt and Sands between Mudline and
Elevation -80 feet 4 Performance and Global Stability Criteria for the Terminal Slope and Bulkhead 5 Summary of Results from the Global Stability Analyses
III

CONTENTS, CONTINUED
6 Calculated Yield Acceleration for Each Representative Soil Profile 7 Seismic-Induced Permanent Deformations of the Terminal Slopes Calculated by Simplified Rigid-
Block Methods 8 Resistance Factors for LRFD Design of Driven Piles 9 Inputs Soil Parameters for Lateral Response Analyses 10 Lateral Earth Pressure Coefficients for Retaining Wall Design
Figures
1 Concept A Phasing Alternative 1 2 Concept A Plan 3a Concept C Phasing Alternative 1 3b Concept C Phasing Alternative 1, continued 4 Concept C Plan 5a Concept D Phasing Alternative 1 5b Concept D Phasing Alternative 1, continued 6 Concept D Plan 7 Concept A Typical Section at Terminals 2 and 3 8 Concept A Typical Section Northern Extension 9 Concept C Typical Section at Terminals 2 and 3 10 Concept C Typical Section Northern Extension 11 Concept D Typical Section at Terminals 1 and 2 12 Concept D Typical Section at POL 1 and 2 13 Concept D Typical Section Northern Extension 14 Terracon/PND Soil Test Locations 15 Typical soil profile at the North Extension area 16 Typical soil profile at Profile 1 – North area 17 Typical soil profile at Profile 2 area 18 Typical soil profile at Profile 1 – South area 19 Typical tidal curve in a 24-hour period 20 Residual Shear Strength with Elevation based upon SPT and CPT data and relationships 21 Axial capacity chart for 36-inch wharf piles (unplugged condition) 22 Axial capacity chart for 48-inch wharf piles (unplugged condition) 23 Axial capacity chart for 36-inch piles near mid-span of the trestle (unplugged condition) 24 Axial capacity chart for 48-inch piles near mid-span of the trestle (unplugged condition) 25 Axial capacity chart for 36-inch piles near the entrance of the trestle (unplugged condition) 26 Axial capacity chart for 48-inch piles near the entrance of the trestle (unplugged condition) 27 Axial capacity chart for 36-inch wharf pile (plugged condition) 28 Axial capacity chart for 48-inch wharf pile (plugged condition) 29 Axial capacity chart for 36-inch piles near mid-span of the trestle (plugged condition) 30 Axial capacity chart for 48-inch piles near mid-span of the trestle (plugged condition) 31 Axial capacity chart for 36-inch piles near the entrance of the trestle (plugged condition) 32 Axial capacity chart for 48-inch piles near the entrance of the trestle (plugged condition)
IV APPENDIX D GEOTECHNICAL REPORT FINAL 08DEC14

Acronyms and Abbreviations η group reduction factors σ’v overburden stress ε 50 secant shear strain φ soil friction angle 2-D two-dimensional
AASHTO American Association of State Highway and Transportation Officials APMP Anchorage Port Modernization Project ASCE American Society of Civil Engineers
BCF Bootlegger Cover Formation
CAPWAP Case Pile Wave Analysis Program CLE Contingency level earthquake CPT cone penetrometer test
DSHA deterministic seismic hazard analyses
EPRI Electric Power Research Institute
FHWA Federal Highway Administration FS factor of safety
g acceleration of gravity GAC Geotechnical Advisory Committee
Horizon Horizon Lines, Inc.
k modulus of subgrade reaction K0 at-rest earth pressure coefficient Ka active earth pressure coefficient Kae incremental seismic lateral earth pressure coefficient kh horizontal seismic coefficients for slope stability analysis ksf kips per square foot kv vertical seismic coefficients for slope stability analysis ky yield accelerations
LL liquid limits LRFD Load and Resistance Factor Design
M magnitude of earthquake MCE maximum considered earthquake MLLW mean lower low water Mw moment magnitude
NAVFAC Naval Facilities Engineering Command
OCR over-consolidation ratio OCSP OPEN CELL™ Sheet Pile OLE operating level earthquake
pcf pounds per cubic foot pci pounds per cubic inch PDA pile driving analyzer PGA peak ground accelerator
APPENDIX D GEOTECHNIAL REPORT FINAL 08DEC14 1-1

ACRONYMS AND ABBREVIATIONS
PI plasticity indices PIEP Port Intermodal Expansion Project PHSA probabilistic seismic hazard analyses PND PND Engineers, Inc. POA Port of Anchorage POL Petroleum Oils & Lubricants psf pounds per square foot
qb unit end-bearing resistance qs unit side resistance
SHANSEP stress history and normalized soil engineering properties SPT standard penetration test SSI soil-structure interaction Su undrained shear strength Su0 undrained shear strength – initial undisturbed Sur undrained shear strength ratios ∆Su change in undrained strength
Terracon Terracon Consulting Engineers and Scientists Inc. TOTE Totem Ocean Trailer Express, Inc.
USACE U.S. Army Corps of Engineers
VST Vane shear testing
1-2 APPENDIX D GEOTECHNICAL REPORT FINAL 08DEC14

SECTION 1
Introduction This technical report summarizes geotechnical recommendations developed for the 15 Percent Concept Plans- for the Anchorage Port Modernization Project (APMP). The 15 Percent Concept Plans considered three wharf alternatives near the existing Port of Anchorage (POA) terminal facility. Each of the concepts involved pile-supported wharf and trestle structures. This report documents the design basis, performance criteria, and the analysis details used to develop the geotechnical recommendations for the proposed APMP, including the underlying assumptions that were used in the geotechnical calculations. Results of geotechnical analyses described in this report were used by the CH2M HILL’s structural and civil engineers to support design and develop cost estimates for the construction.
1.1 Description of Modernization Concepts The APMP will modernize the existing POA structures by rehabilitating or replacing Terminals 2 and 3. The modernization concepts include considering the viability of shifting operations south, toward Petroleum, Oil and Lubricates (POL) 1 and Terminal 1, during rehabilitation work on Terminals 2 and 3. The project also includes investigation of stabilization measures at the North Extension.
The goals of the project are as follows:
• Replace/rehabilitate Terminals 2 and 3 while minimizing investment in the North Extension area
• Provide a modern, safe, and efficient regional port that stimulates economic development and the movement of goods into and out of south and south central Alaska, and
• Allow for future growth.
A conceptual design charrette was conducted from August 18 to August 22, 2014, in Anchorage, Alaska, in which four new design concepts (A, B, C, and D) were introduced and discussed by the POA, various stakeholders, and the CH2M HILL project team. These new design concepts were developed mainly based on the three preliminary conceptual design options (1, 5 and 5H) provided by CH2M HILL in the Port of Anchorage Intermodal Expansion Project Study – 15% Concept Plan, February 2013 (CH2M HILL, 2013a). During the design charrette, the participants agreed to drop Concept B from the discussion and to focus on further development of Concepts A, C, and D. The main components of these three selected design concepts are shown in Figures 1 through 6.
The following descriptions reflect what were presented and discussed at the end of the design charrette:
• Concept A – Replace Terminals 2 and 3 in place, retrofit Terminal 1 and POL 1 in place, extend POL 2 in its existing location, and move the berth line out at Terminals 2 and 3. It will be constructed in four phases:
– Phase 1 - Retrofit POL 2 for ABI Cement operations, expand wharf and construct new mooring dolphins, relocate Port Admin Building and Transit Warehouse to port uplands, and reconstruct North Extension to its final configuration.
– Phase 2 - Relocate ABI Cement operations to retrofitted POL 2, retrofit Terminal 1 for Horizon Lines Inc. (Horizon) operations, and retrofit existing wharf and trestles.
– Phase 3 - Relocate Horizon operations to retrofitted Terminal 1 and reconstruct Terminal 2 in its final configuration.
– Phase 4 - Relocate Totem Ocean Trailer Express, Inc. (TOTE) operations to the new Terminal 2 and reconstruct Terminal 3 in its final configuration.
APPENDIX D GEOTECHNIAL REPORT FINAL 08DEC14 1-1

SECTION 1 INTRODUCTION
– Completion - TOTE, Horizon, and ABI Cement operations are restored to their new terminals.
• Concept C – Move Terminals 2 and 3, Terminal 1, POL 1, and POL 2 out from the existing wharf line. This concept will be completed in seven phases:
– Phase 1 - Retrofit POL 2 for ABI Cement operations, expand wharf and construct new mooring dolphins, relocate Port Admin Building and Transit Warehouse to port uplands, and reconstruct North Extension to its final configuration.
– Phase 2 - Relocate ABI Cement operations to the retrofitted POL 2, retrofit Terminal 1 for Horizon operations, retrofit the existing wharf and trestles, and extend crane rail and bus bar.
– Phase 3 - Relocate Horizon operations to the retrofitted Terminal 1, retrofit Terminal 2 for TOTE operations, and widen southern trestle and construct new trestle.
– Phase 4 - Relocate TOTE operations to the retrofitted Terminal 2 and reconstruct Terminal 3 in its final configuration.
– Phase 5 - Restore TOTE operations at Terminal 3 and reconstruct Terminal 2 in its final configuration.
– Phase 6 - Restore Horizon operations at Terminal 2 and reconstruct Terminal 1/POL 1 in its final configuration.
– Phase 7 - Relocate ABI Cement operations to Terminal 1/POL 1 and reconstruct POL 2 in its final configuration.
– Completion - TOTE, Horizon, and ABI Cement operations are restored to their new terminals.
• Concept D – Move TOTE to Terminal 2, move Horizon to Terminal 1, rebuild POL 2, and move POL 1 south of POL 2. All terminals will be moved out from the existing wharf line. This concept will be completed in five phases:
– Phase 1 - Reconstruct POL 1 in its final configuration, relocate Port Admin Building and Transit Warehouse to port uplands, and reconstruct North Extension to its final configuration.
– Phase 2 - Relocate ABI Cement operations to new POL 1, reconstruct most of Terminal 1 in its final configuration, and construct temporary trestle for interim Horizon operations.
– Phase 3 - Relocate Horizon operations to new Terminal 1, complete reconstruction of Terminal 1, and reconstruct most of Terminal 2 in its final configuration.
– Phase 4 - Relocate TOTE operations to new Terminal 2, demolish a portion of Terminal 3, and complete reconstruction of Terminal 2.
– Phase 5 - Complete demolition of Terminal 3 and reconstruct POL 2 in its final configuration.
– Completion - TOTE, Horizon, and ABI Cement operations are restored to their new terminals.
Major structural components for each design concept include pile-supported wharves, pile-supported access trestles, and sheet pile bulkheads. Cross sections showing the final configurations and main structural components at all terminals for each design concept are presented in Figures 7 through 13.
1.2 Scope of Geotechnical Work The following topics were addressed as part of the concept-level (15 percent) geotechnical design studies and will be discussed in this report:
• Relevant subsurface soil and groundwater conditions • Basis of design • Seismic design considerations • Dredge and scour depths
1-2 APPENDIX D GEOTECHNICAL REPORT FINAL 08DEC14

SECTION 1 INTRODUCTION
• Geotechnical design criteria • Geotechnical analyses and design recommendations • Design and construction issues to be considered in the next phases of design
Geotechnical evaluations summarized in this report were based on existing exploration information collected by Terracon Consulting Engineers and Scientists Inc. (Terracon) (2004) and PND Engineers, Inc. (PND) (2008, 2010a, and 2010b) during previous phases of the Anchorage Intermodal Expansion Project (PIEP) and during the Suitability Study (CH2M HILL, 2013b) for the PIEP. CH2M HILL did not conduct any additional field or laboratory work for this conceptual design.
1.3 Limitations This report has been prepared exclusively for the conceptual design of the new pile-supported wharves and trestles at the POA, in accordance with generally accepted geotechnical engineering practice. No other warranty, express or implied, is made. Geotechnical recommendations provided in this report are not sufficient for the final design of the wharves, trestles, and bulkhead walls. Additional field explorations, laboratory soil testing, and foundation design studies are necessary to support the final design.
The analyses and recommendations contained in this report are based primarily on subsurface exploration data collected by Terracon (2004) and PND (2010a) for the PIEP. Exploration data indicate soil conditions and water levels only at specific locations and times, and only to the depths penetrated. The depths and thicknesses of the subsurface strata discussed in this technical memorandum were generalized from and interpolated between exploration locations. Subsurface conditions and water levels at other locations may differ from conditions occurring at these explored locations. It is assumed that the information collected from the borings conducted within the project limits is representative of the subsurface condition at the project site.
In the event that changes in the nature or design of the APMP facility from what is summarized in the 15 Percent Concept Plans report occur, the conclusions and recommendations developed for this report should not be considered valid unless the changes are reviewed and the conclusions of this report are modified or verified in writing by CH2M HILL’s geotechnical staff. CH2M HILL is not responsible for any claims, damages, or liabilities associated with interpretation of subsurface data or for reuse of subsurface data summarized herein without CH2M HILL’s express written authorization.
APPENDIX D GEOTECHNICAL REPORT FINAL 08DEC14 1-3


SECTION 2
Relevant Subsurface Soil and Groundwater Conditions Based on the information provided in the existing boring logs, the subsurface along the proposed APMP alignment was divided into four areas (Figure 14). Subsurface conditions in each area were characterized by a representative soil profile, which included North Extension Profile, Profile 1 – North, Profile 2, and Profile 1 – South. Details of these representative soil profiles are shown in Figures 15 through 18. Descriptions of the major soil units present in the representative profiles, soil engineering properties, and groundwater conditions are provided in the following subsections.
2.1 Subsurface Soil Profiles and Properties Typical subsurface profiles for each area shown in Figure 14 consist of a layer of fill, placed over the native soil materials. Below the existing mudline, the native soils that were encountered above elevation -200 feet mean lower low water (MLLW) include (from top to bottom) Holocene Tidal Flat Deposit, Holocene Fluvial Deposit, Glacioestuarine or Lacustrine silt and clay [Bootlegger Cove Formation (BCF)] Deposit, and the Glaciofluvial Deposit. Descriptions of each of these soil units are as follows:
• Fill Deposit: Fill Deposit are found in the backlands within the North Extension and behind the existing terminals. According to PND (2008), the fill above the native soils at the North Extension area includes compacted granular fill and un-compacted common fill. The compacted granular fill was used within the footprint of the existing open cells (that is, approximately 200 feet from the face of the OPEN CELL™ Sheet Pile [OCSP] wall), while the common fill was used outside the footprint of the existing open cells. The compacted granular fill mainly consists of clean sand and gravel, with fines content less than 10 percent. The common fill was described as well-graded, granular soil with less than 50 percent fines. As shown in the concept plans, the existing OCSP walls in the North Extension area and a majority of the granular fill within the cells will be removed as part of the APMP work. The granular fill to be used within the new cellular bulkhead in the North Extension area was assumed to be compacted.
Limited information exists regarding the characteristics of fill used at the existing terminals (that is, Soil Profile 1 – North, Soil Profile 2, and Soil Profile 1 – South). Geotechnical explorations were conducted during the 1960s and 1970s for the design of the current facilities. However, available information is limited to stick logs on drawing plans for the original design and construction of the current POA facilities. Reports providing details for the explorations are not available. These stick logs show general soils types and Standard Penetration Test (SPT) blowcounts. For this conceptual design work, the properties of un-compacted common fill were assumed for the fill in these areas.
• Holocene Tidal Flat Deposit: These soil units predominantly consist of sand and silt with occasional thin seams of organic material. At the wharf locations, the Holocene Tidal Flat Deposit typically extends from the mudline to the top of the Holocene Fluvial Deposit with thickness ranging from 5 to 60 feet. These deposits appear to have various composition, density, and consistency because of erosion, reworking by the tides, pre-consolidation, and desiccation. Most of the Tidal Flat Deposit has been removed over the years by dredging and replaced with soft silts and loose sands that have been deposited by tidal action and sedimentation.
The Holocene Tidal Flat Deposit predominantly consists of low plasticity silt (ML), with fines content up to 90 percent. Results from Atterberg limits tests indicate that the deposits in these areas have liquid limits (LL) ranging from 21 to 40 percent and plasticity indices (PI) ranging from non-plastic to about 18 percent. In situ Vane Shear Testing (VST) conducted by U.S. Army Corps of Engineers (USACE) (2008) found a range of undrained shear strengths from 600 to about 2,000 pounds per square foot (psf), with
APPENDIX D GEOTECHNIAL REPORT FINAL 08DEC14 2-1

SECTION 2 RELEVANT SUBSURFACE SOIL AND GROUNDWATER CONDITIONS
peak over residual undrained shear strength ratios (Su/Sur) ranging from 1.8 to 4.3. The thickness of the Holocene Tidal Flat Deposit increases from about 5 feet at the north end to slightly more than 20 feet at the south end of the North Extension area. The thickness of the Holocene Tidal Flat Deposit encountered at the existing terminals ranges from 10 to 30 feet.
• Holocene Fluvial Deposit: This soil unit predominantly consists of sand, silt, and gravel (SM, SP, ML, SP-SM, GP, GP-SM). The Holocene Fluvial Deposit typically extends from the Holocene Tidal Flat Deposit to the top of BCF with strata thickness ranging from 5 to 50 feet. The relative density of the Holocene Fluvial Deposit within Soil Profile 1 – North and Soil Profile 1 – South typically ranged from medium dense to very dense, whereas the relative density of this unit within Soil Profile 2 mostly varied between very loose and medium dense.
• Glacioestuarine or Lacustrine Silt and Clay (Bootlegger Cove Formation) Deposit: The BCF mainly consists of overconsolidated silty clay, with interbedded lenses of dense fine sand and silt. It can be classified as stiff to very stiff silty clay of low plasticity. The BCF is located under the Holocene Fluvial Deposit and extends to approximate elevation -160 feet MLLW. The shear strength characteristics of the BCF clay were studied extensively by PND during the original design of the OCSP wall system (PND, 2008) and by CH2M HILL during the Suitability Study (CH2M HILL, 2013b). The following stress history and normalized soil engineering properties (SHANSEP) relationships were developed to correlate the undrained shear strength (Su) of the BCF clay to effective overburden stress (σ’v) and over-consolidation ratio (OCR) (CH2M HILL, 2013b):
– Triaxial compression loading condition: Su/σ’v = 0.34*(OCR)0.79 [Eq. 1] – Direct simple shear loading condition: Su/σ’v = 0.25*(OCR)0.79 [Eq. 2] – Triaxial extension loading condition: Su/σ’v = 0.17*(OCR)0.79 [Eq. 3]
• Glaciofluvial Deposit: This soil unit mainly consists of dense to very dense sand and gravel, with interbedded hard clay layers that were consolidated under the weight of glaciers. These deposits are present under the BCF, with thickness ranging from 20 to 50 feet. The Glaciofluvial Deposit is underlain by about 500 to 600 feet of Glacial Drift, which overlies the undifferentiated pre-Quaternary deposits or metamorphic bedrock.
2.2 Engineering Parameters The engineering properties of all soil units described in the previous section are summarizes in Table 1.
TABLE 1 Engineering Properties of All Soil Units
Soil Unit
Total Unit Weight, γ
(pcf)
Effective Cohesion, c’ (psf)
Effective Friction Angle, φ' (deg)
Undrained Shear Strength Ratio, S u/σ’v
Static Pseudo-
Static Static Pseudo-Static Static
Pseudo-Static
Common Fi l l 125 0 0 32 27 -- --
Granular Fi l l 130 0 0 40 40 - -
Tida l Flat Depos i t 120 -- -- -- -- 0.55 (min S u = 500 ps f)
0.44 (min S u = 400 ps f)
Fluvia l Depos i t 130 0 100 36 36 -- --
BCF Clay Depos i t 125 0 0 30 -- SHANSEP* SHANSEP*
Glaciofluvia l Depos i t 135 0 0 45 -- -- --
Note: * see Equations 1 through 3
φ = soil fri ction angle pcf = pounds per cubic foot
2-2 APPENDIX D GEOTECHNICAL REPORT FINAL 08DEC14

SECTION 2 RELEVANT SUBSURFACE SOIL AND GROUNDWATER CONDITIONS
2.3 Groundwater Condition Based on the information obtained from piezometers installed in the backfill and the BCF clay, which are located approximately 500 feet behind the face of the existing OCSP walls in the North Extension area, the landside groundwater table in the North Extension appears to be near elevation +20 feet MLLW. Per Terracon (2011), tidal fluctuation up to 35 feet (that is, between elevation +30 feet MLLW and elevation -5 feet MLLW) can be observed during the day. A typical daily tidal curve is shown in Figure 19.
The location of groundwater behind the existing POA terminals has not been determined; however, most likely the groundwater elevations are similar to those described for the North Extension. Future explorations in the existing POA terminal area should include specific plans for groundwater monitoring.
APPENDIX D GEOTECHNICAL REPORT FINAL 08DEC14 2-3


SECTION 3
Basis of Design This section summarizes the design guidelines, specifications, and underlying assumptions used in the geotechnical analyses conducted for the 15 Percent Concept Plans. Additional design criteria are located in Appendix B of this 15 Percent Concept Plans report.
3.1 Design Guidelines and Specifications The following design guidelines and specifications were considered in the conceptual geotechnical analyses described in this technical memorandum:
• Electric Power Research Institute (EPRI). 1990. Manual on Estimating Soil Properties for Foundation Design, EPRI EL-6800, Final Report.
• Federal Highway Administration (FHWA). 2002. Evaluation of Soil and Rock Properties, Geotechnical Engineering Circular No. 5. Report No. FHWA-IF-02-034.
• Naval Facilities Engineering Command (NAVFAC). 1986. Soil Mechanics, Design Manual DM-7.01.
• American Association of State Highway and Transportation Officials (AASHTO). 2014. LRFD Bridge Design Specifications, 7th Edition.
• American Society of Civil Engineers (ASCE). 2014. Seismic Design of Piers and Wharves, ASCE Standard ASCE/COPRI 61-14.
Other design guidelines and specifications, including those related to port design, were also reviewed for this work.
3.2 Key Assumptions Key assumptions made in the geotechnical analyses are as follows:
• The new wharves and access trestles will be supported by either 36-inch or 48-inch, open-ended steel pipe piles. The wall thicknesses of these piles will be 0.75 and 1 inch for the 36-inch and 48-inch pipe piles, respectively.
• The downdrag load acting on the piles because of settlement of the BCF clay will be negligible. This is believed to be a reasonable assumption, considering that the BCF clay at the North Extension area will be “unloaded” when the existing OCSP wall and the contained fill are removed to construct the new bulkhead. Either no or minor fill will be placed in the area planned for new APMP structures.
• All piles will be driven open-ended to the Glaciofluvial Deposit without use of a driving shoe and are considered either plugged or unplugged for estimating pile compressive capacity. This assumption was made because it is currently unclear whether a plug will develop unless a plate or other method is used to force a plug at the end of the pile. The development of a plugged condition without artificial means will depend on whether sufficient setup develops within the piles to offset the very high end bearing capacity of the piles.
• Side resistance during pile driving is 50 percent of the ultimate side resistance (that is, setup factor is 2.0). This assumption was based on the findings from the dynamic pile-load test program conducted by CH2M HILL on 24-inch and 36-inch pipe piles near POL 2 in 1994 (CH2M HILL, 1994).
APPENDIX D GEOTECHNIAL REPORT FINAL 08DEC14 3-1


SECTION 4
Seismic Design Considerations Seismic design parameters and liquefaction potential of the fill and native soils are summarized in this section. The seismic design parameters were obtained from the seismic ground response and liquefaction potential analyses conducted by CH2M HILL (2014a). These analyses were carried out as part of the conceptual design but under a separate task.
4.1 Seismic Design Parameters Table 2 lists the seismic design parameters that were used in the geotechnical analyses conducted to support the conceptual design. These parameters are based on seismic studies conducted by URS (2014) and CH2M HILL (2014a) for the APMP. The URS work consisted of an update to a probabilistic seismic hazard analyses (PSHA) and deterministic seismic hazard analyses (DSHA) conducted by URS for the PIEP (URS, 2008). CH2M HILL’s work involved site-specific ground response analyses for four locations with the APMP site. The ground response studies determined changes to firm-ground motions provided by URS as these motions propagated to the ground surface. One dimensional, nonlinear effective- and total-stress computer modeling was conducted to evaluate these wave propagation effects. Results of the analyses included peak ground acceleration values (PGA) and 5 percent damped response spectra for the Operating Level Earthquake (OLE), Contingency Level Earthquake (CLE), and Maximum Considered Earthquake (MCE).
TABLE 2 Seismic Design Parameters for Liquefaction Evaluation, APMP
Earthquake Level Earthquake
Magnitude, Mw
Mean Peak Ground Acceleration, PGA (g)
Profile 1 – North & South Profile 2
OLE 6.75 and 9.2 0.20 0.14
CLE 9.2 0.33 0.23
MCE 9.2 0.46 0.34
Notes :
g = acceleration of gravity Mw = moment magnitude
4.2 Liquefaction Potential and Shear Strength Degradation Details of the liquefaction potential analysis are summarized in Appendix B of CH2M HILL seismic study (2014a). These analyses involved use of the simplified SPT and Cone Penetrometer Test (CPT) methods to estimate the potential for liquefaction in cohesionless soils along the APMP alignment. Results of numerical analyses using one-dimensional, nonlinear effective stress methods were also used to estimate build-up in porewater pressure. Results of the simplified methods and the numerical modeling show that liquefaction would occur during seismic loading during the OLE, CLE, and MCE.
Residual strengths of the liquefiable soils were estimated from the SPT and CPT data. The residual shear strength ratio, Sur/σ'vo, were calculated using methods developed by Olson and Stark (2002) and Idriss and Boulanger (2007). Table 3 summarizes the average, and ± one standard deviation of the residual shear strength ratio, Sur/σ'vo for each representative soil profile for the main liquefiable layer encountered between the mudline and elevation -80 feet MLLW. Figure 20 presents the average residual shear strength ratio, Sur/σ'vo for the liquefiable layers for each of the profiles. Deeper areas of liquefaction were encountered but were not prevalent or consistent across the site.
APPENDIX D GEOTECHNIAL REPORT FINAL 08DEC14 4-1

SECTION 4 SEISMIC DESIGN CONSIDERATIONS
TABLE 3 Summary of Residual Shear Strength Ratios for Liquefiable Silt and Sands between Mudline and Elevation -80 feet
Profile
Residual Shear Strength Ratio, S ur /σ' vo
Average - 1 StdDev + 1 StdDev
North Extens ion & Profi le 1 – North 0.15 0.06 0.24
Profi le 2 0.09 0.04 0.14
Profi le 1 - South 0.14 0.06 0.22
4-2 APPENDIX D GEOTECHNICAL REPORT FINAL 08DEC14

SECTION 5
Geotechnical Design Criteria This section presents the geotechnical design criteria used in the conceptual design analyses. These criteria are intended to either improve the long-term performance of the facilities during normal operations or provide higher confidence in the performance of these facilities during future seismic events.
5.1 Service Life The new facilities will be designed for a 75-year service life per POA requirements. A 75-year service life is longer than the service life of 50 years, which is typically used for ports and waterfront structures in the United States (for example, Port of Los Angeles, Port of Long Beach, Port of Seattle, and Port of Houston). The 75-year service life is consistent with the service life used in the current AASHTO LRFD Bridge Design Specifications (2014) for the design of most new bridges.
The use of a 75-year service life will change the probability of exceedance values associated with the OLE, CLE, and MCE design earthquakes, which are based on a 50-year service life. The change results in an increase in the probability of exceedance of the ground motions above the 50 percent, 10 percent, and 2 percent normally associated with the OLE, CLE, and MCE. This increase was discussed with the Municipality of Anchorage Geotechnical Advisory Commission (GAC), and it was agreed that the return period associated with the OLE, CLE, and MCE (that is 72, years, 475 years, and 2,475 years) would be held constant and that the small increases in the exceedance probability with the 75-year design life were acceptable.
5.2 Considerations for Over-Dredging and Scour Depths The following assumptions were used regarding the over-dredging and scour depths at the proposed facilities:
• Over-dredging depth: Elevation -51 feet MLLW
• Scour depth: An additional 8-foot scour depth (that is, two pile diameters) was assumed around each pile in the conceptual design to account for localized scour around piles
The increase in depth because of scour and over-dredging was used when assessing the lateral response of piles to seismic and other lateral loads, as well as establishing the geometry of slopes for global embankment slope stability studies. Scour between piles was assumed to be reach an average of 5 feet below the mudline.
5.3 Allowable Deformations for Embankment Slopes, Bulkhead Walls, and Wharf Structures
Allowable deformations for embankment slopes and bulkhead walls are summarized in Table 4. Deformations for short- and long-term static loading are the same as those used for the OCSP (PND, 2008). Allowable displacements during the OLE are the same as defined for the OCSP (PND, 2008). However, allowable displacements for the CLE and MCE have been increased. The amount of increase is based on a qualitative assessment of consequences of movement, as well as judgment. Additional analyses will be required to confirm these displacement limits during later phases of design based on risk of damage and through discussions with the POA.
The displacement limits of wharf and trestle structures during the OLE, CLE, and MCE were assumed to be the same as for the embankment slopes subject to the results of lateral pile analyses. [Note that displacement of slopes, if any, was assumed to have occurred before pile driving.] The lateral pile analyses are required for the OLE, CLE, and MCE to confirm that the allowable deformations are within the
APPENDIX D GEOTECHNIAL REPORT FINAL 08DEC14 5-1
SECTION 5 GEOTECHNICAL DESIGN CRITERIA
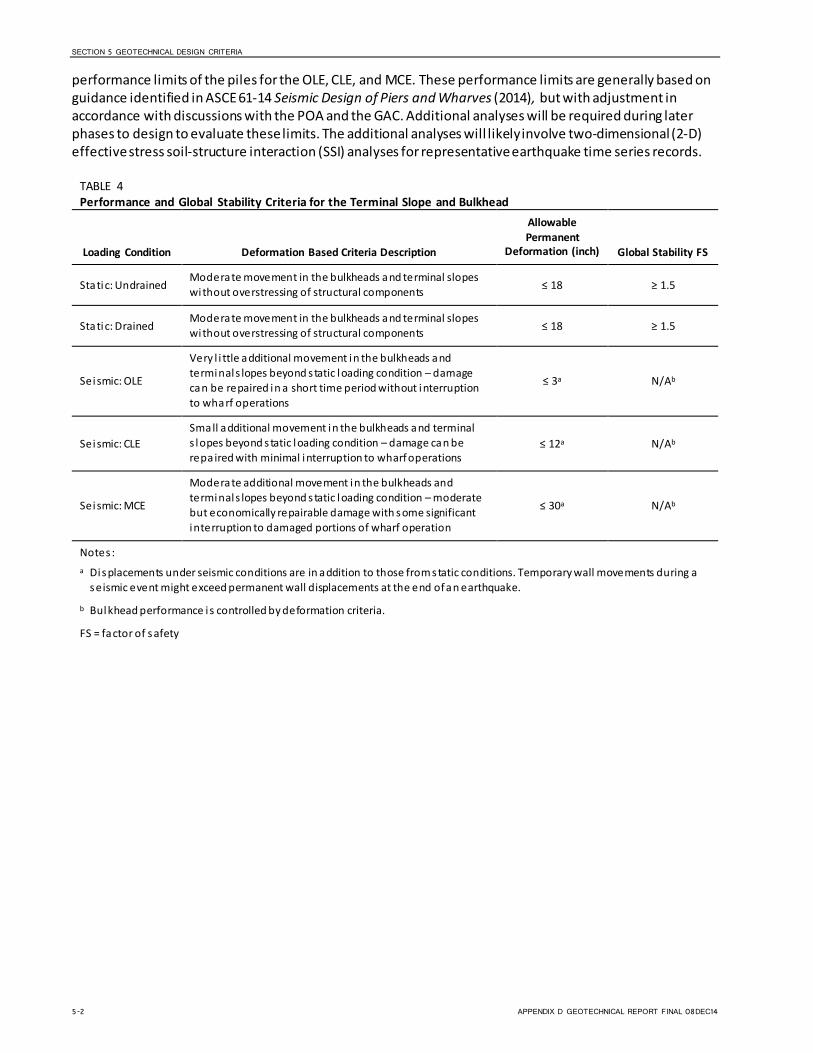
performance limits of the piles for the OLE, CLE, and MCE. These performance limits are generally based on guidance identified in ASCE 61-14 Seismic Design of Piers and Wharves (2014), but with adjustment in accordance with discussions with the POA and the GAC. Additional analyses will be required during later phases to design to evaluate these limits. The additional analyses will likely involve two-dimensional (2-D) effective stress soil-structure interaction (SSI) analyses for representative earthquake time series records.
TABLE 4 Performance and Global Stability Criteria for the Terminal Slope and Bulkhead
Loading Condition Deformation Based Criteria Description
Allowable Permanent
Deformation (inch) Global Stability FS
Static: Undrained Moderate movement in the bulkheads and terminal slopes without overstressing of structural components ≤ 18 ≥ 1.5
Static: Drained Moderate movement in the bulkheads and terminal slopes without overstressing of structural components ≤ 18 ≥ 1.5
Seismic: OLE
Very l i ttle additional movement in the bulkheads and terminal s lopes beyond s tatic loading condition – damage can be repaired in a short time period without interruption to wharf operations
≤ 3a N/Ab
Seismic: CLE Small additional movement in the bulkheads and terminal s lopes beyond s tatic loading condition – damage can be repaired with minimal interruption to wharf operations
≤ 12a N/Ab
Seismic: MCE
Moderate additional movement in the bulkheads and terminal s lopes beyond s tatic loading condition – moderate but economically repairable damage with some significant interruption to damaged portions of wharf operation
≤ 30a N/Ab
Notes : a Displacements under seismic conditions are in addition to those from static conditions. Temporary wall movements during a
seismic event might exceed permanent wall displacements at the end of an earthquake.
b Bulkhead performance i s controlled by deformation criteria.
FS = factor of safety
5-2 APPENDIX D GEOTECHNICAL REPORT FINAL 08DEC14

SECTION 6
Geotechnical Analyses and Recommendations The following subsections provide a summary of geotechnical analyses conducted as part of conceptual design. These analyses cover the stability of embankment slopes, pile capacities and drivability, and lateral earth pressures for bulkhead wall design. Section 7.0 of this report provides a discussion of future issues related to design and construction.
6.1 Embankment Stability Global stability analyses were performed for the terminal slopes under both static and seismic loading conditions. The global stability analyses were performed using a conventional limit-equilibrium methodology, in which the most critical slip surface with the lowest FS was identified from numerous trial slip surfaces. These static stability analyses were followed by a series of pseudo-static seismic stability analyses to evaluate response of the embankment slopes under the OLE, CLE, and MCE. These seismic analyses considered the potential effects of liquefaction on slope stability, as well as deformations that could develop from seismic shaking.
6.1.1 Static Global Stability Analyses For conceptual design level, the static global stability analyses were conducted for four representative soil profiles representing the North Extension and the proposed APMP terminal area. To properly model the slope configuration under and between the new trestles in the existing terminal area, the global stability of Profile 1 – North, Profile 2, and Profile 1 – South were evaluated with and without the pinning effect created by the trestle piles. The critical slip surface was assumed to have a non-circular shape that consists of multiple linear segments defined by a finite number of vertices. The FS of the failure surface was calculated using the Morgenstern-Price method.
Static global stability analyses were conducted for both undrained and drained conditions. For the undrained condition, the BCF clay was divided into three zones: (1) behind the new bulkhead, (2) under the middle part of the terminal slope, and (3) beyond the toe of the slope. The undrained shear strength of the BCF clay under the bulkhead and the slope was calculated using the SHANSEP correlations (Eq. 1 and 2) and the average overburden stress in each zone. The pre-construction undrained shear strength (that is, before dredging) was used for the BCF clay beyond the toe of the slope. For the drained condition, the shear strength of the BCF clay throughout the slope was modeled using a friction angle of 30 degrees with zero cohesion. A live-load surcharge equal to 1,000 psf was assumed behind the bulkhead wall. The sea level was assumed at elevation of -5.2 feet MLLW, whereas the landside groundwater was assumed at elevation +20 feet MLLW.
The global stability FS values calculated for all four representative soil profiles are summarized Table 5. As can be noted, all FS values meet the design requirement (FS ≥ 1.5). Additional evaluations should be conducted in the future design phases to confirm that these slopes have adequate stability.
6.1.2 Seismic Stability Analyses The global stability of the North Extension and APMP terminal area slopes during the design seismic events (that is, OLE, CLE, and MCE) was evaluated using the pseudo-static stability approach. In the pseudo-static analysis, the inertial force induced by an earthquake was calculated as a product of soil mass and the seismic coefficients. The following subsection provide an overview of the methodology used to evaluate pseudo-static stability, global stability for flow failure conditions, lateral spreading forces on piles, and permanent displacements from seismic loading.
APPENDIX D GEOTECHNIAL REPORT FINAL 08DEC14 6-1
SECTION 6 GEOTECHNICAL ANALYSES AND RECOMMENDATIONS
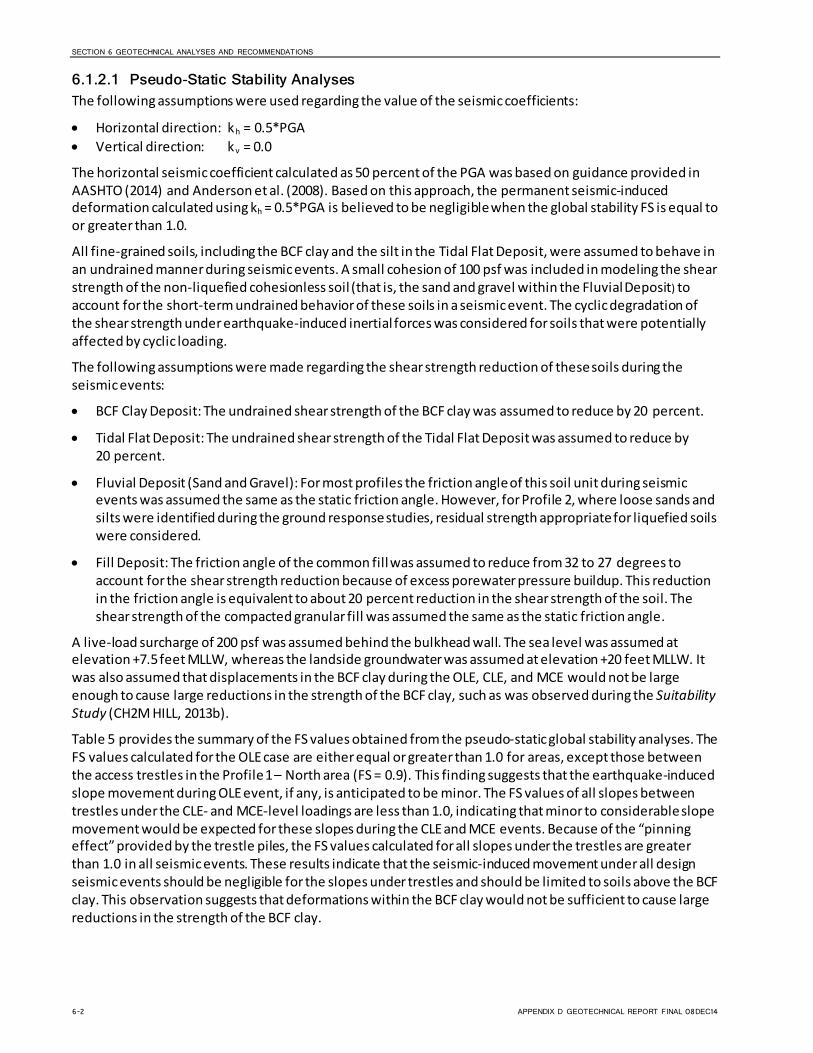
6.1.2.1 Pseudo-Static Stability Analyses The following assumptions were used regarding the value of the seismic coefficients:
• Horizontal direction: kh = 0.5*PGA • Vertical direction: kv = 0.0
The horizontal seismic coefficient calculated as 50 percent of the PGA was based on guidance provided in AASHTO (2014) and Anderson et al. (2008). Based on this approach, the permanent seismic-induced deformation calculated using kh = 0.5*PGA is believed to be negligible when the global stability FS is equal to or greater than 1.0.
All fine-grained soils, including the BCF clay and the silt in the Tidal Flat Deposit, were assumed to behave in an undrained manner during seismic events. A small cohesion of 100 psf was included in modeling the shear strength of the non-liquefied cohesionless soil (that is, the sand and gravel within the Fluvial Deposit) to account for the short-term undrained behavior of these soils in a seismic event. The cyclic degradation of the shear strength under earthquake-induced inertial forces was considered for soils that were potentially affected by cyclic loading.
The following assumptions were made regarding the shear strength reduction of these soils during the seismic events:
• BCF Clay Deposit: The undrained shear strength of the BCF clay was assumed to reduce by 20 percent.
• Tidal Flat Deposit: The undrained shear strength of the Tidal Flat Deposit was assumed to reduce by 20 percent.
• Fluvial Deposit (Sand and Gravel): For most profiles the friction angle of this soil unit during seismic events was assumed the same as the static friction angle. However, for Profile 2, where loose sands and silts were identified during the ground response studies, residual strength appropriate for liquefied soils were considered.
• Fill Deposit: The friction angle of the common fill was assumed to reduce from 32 to 27 degrees to account for the shear strength reduction because of excess porewater pressure buildup. This reduction in the friction angle is equivalent to about 20 percent reduction in the shear strength of the soil. The shear strength of the compacted granular fill was assumed the same as the static friction angle.
A live-load surcharge of 200 psf was assumed behind the bulkhead wall. The sea level was assumed at elevation +7.5 feet MLLW, whereas the landside groundwater was assumed at elevation +20 feet MLLW. It was also assumed that displacements in the BCF clay during the OLE, CLE, and MCE would not be large enough to cause large reductions in the strength of the BCF clay, such as was observed during the Suitability Study (CH2M HILL, 2013b).
Table 5 provides the summary of the FS values obtained from the pseudo-static global stability analyses. The FS values calculated for the OLE case are either equal or greater than 1.0 for areas, except those between the access trestles in the Profile 1 – North area (FS = 0.9). This finding suggests that the earthquake-induced slope movement during OLE event, if any, is anticipated to be minor. The FS values of all slopes between trestles under the CLE- and MCE-level loadings are less than 1.0, indicating that minor to considerable slope movement would be expected for these slopes during the CLE and MCE events. Because of the “pinning effect” provided by the trestle piles, the FS values calculated for all slopes under the trestles are greater than 1.0 in all seismic events. These results indicate that the seismic-induced movement under all design seismic events should be negligible for the slopes under trestles and should be limited to soils above the BCF clay. This observation suggests that deformations within the BCF clay would not be sufficient to cause large reductions in the strength of the BCF clay.
6-2 APPENDIX D GEOTECHNICAL REPORT FINAL 08DEC14

SECTION 6 GEOTECHNICAL ANALYSES AND RECOMMENDATIONS
6.1.2.2 Global Stability Analyses in Flow Failure Condition During liquefaction, porewater pressure build-up occurs, resulting in loss of shear strength that may lead to slope failure under either under seismic loading or under gravity loading after earthquake ground shaking has stopped. If the soil liquefies, slope stability is determined by the residual strength of the soil. When FS values of the slope under gravity loading are less than 1.0, flow failures occur. These failures result in large deformations of the soil mass. For the APMP alignment, the concern is that the soil movement could result in additional loading to the wharf pile
Global stability analyses were conducted for the slopes in all four areas in which the average residual shear strength ratio for the area was used for the liquefiable soils (see Table 3) to evaluate this mechanism of slope failure. The minimum residual shear strength of liquefiable soils was assumed to be 50 psf. A live-load surcharge of 200 psf was assumed on the bulkhead. The sea level was assumed at elevation of +7.5 feet MLLW, whereas the landside groundwater was assumed at elevation +20 feet MLLW. A sea level of +7.5 feet MLLW was determined as a reasonable likely level of water during the Suitability Study (CH2M HILL, 2013b).
TABLE 5 Summary of Results from the Global Stability Analyses
Case No.
Case Descriptions
Global Factor of Safety (FS)
Anticipated Range of
Seismic-Induced Slope
Movement North
Extension
Profile 1 - North Profile 2 Profile 1 - South
Without Trestle Piles
With Trestle Piles
Without Trestle Piles
With Trestle Piles
Without Trestle Piles
With Trestle Piles
1 Static:
Dra ined 2.1 1.5 1.9 1.6 2.2 2.1 2.8 N/A
2 Static:
Undra ined 2.1 1.5 1.9 2.3 3.2 2.1 2.8 N/A
3 Seismic: OLE 1.2 0.9 1.5 1.1 1.7 1.1 1.7 No to minor movement
4 Seismic: CLE 1.0 0.7 1.2 0.9 1.4 0.9 1.3 No to
cons iderable movement
5 Seismic:
MCE 0.8 0.6 1.0 0.8 1.2 0.7 1.2 No to
cons iderable movement
6 Flow Failure 1.7 0.5 1.1 0.3 0.9 0.6 1.6 N/A
The global stability FS values calculated for all four representative soil profiles are summarized Table 5. As can be noted, the FS values for slopes that are not under trestles are all less than 1.0, indicating that these slopes are prone to global failure when soil liquefaction occurs. The FS values for slopes that are under trestles are all greater than 1.0, indicating that these slopes will likely be stable even when soil liquefaction occurs.
6.1.2.3 Lateral Spreading Force on Piles AASHTO Guide Specifications for LRFD Seismic Bridge Design (2012 allows the lateral spreading forces to be decoupled from bridge seismic inertial forces. However, the potential for some combined effect of lateral spreading forces and structural inertial loads should be considered under the CLE and MCE, as the potential magnitude (M) of these events is M9.2, as discussed in URS (2014). The very large magnitude means that
APPENDIX D GEOTECHNICAL REPORT FINAL 08DEC14 6-3

SECTION 6 GEOTECHNICAL ANALYSES AND RECOMMENDATIONS
there is a potential for lateral flow of the slopes, while inertial forces are still very large, especially if the foundation is located near the toe of the lateral spread or flow failure.
In lieu of more sophisticated analyses, such as 2-D dynamic stress-deformation analyses, for sites where there is potential for strong motion to occur after liquefaction-induced lateral ground movement has initiated, it is conservative to combine lateral spreading/flow failure forces on the foundations with the structure inertial forces or the plastic hinge force. The following input can be used to estimate the lateral spreading/flow failure forces on the piles:
• Lateral spreading forces will only affect the wharf piles • The thickness (D) of the moving soil will be 10 feet, starting from the mudline • The residual Su of the moving soil is 100 psf • The lateral spreading force on piles, which can be modeled as a concentrated load, will be calculated as
9*Su*D*d, where d is the diameter of the piles. This lateral concentrated load should be applied at 5 feet above the mudline
A number of simplifying assumptions have been made when developing the input listed above. These assumptions include both the thickness and the strength of the moving mass when it reaches the piles. It is very difficult to predict the consistency of the soil mass once it begins to flow, and depending on the liquefied state and distance of travel, the thickness of the liquefied flowing mass could be greater or less than assumed. Likewise, the strength of the soil could also be larger or small. More rigorous analyses using 2-D soil structure interaction analyses should be conducted during later phases of design to further confirm the potential for and magnitude of these potential forces.
6.1.2.4 Seismic-Induced Permanent Deformation In this section, the seismic-induced permanent deformation estimated using simplified methods is discussed. The simplified methods used in this study are based on the Newmark sliding-block methodology. The simplified Newmark sliding-block methods used in the conceptual design include Hynes-Griffin and Franklin (1984), Ambraseys and Menu (1988), Bray and Travasarou (2007), and Rathje and Saygili (2008). The final seismic-induced permanent deformation was estimated as a weighted average of those calculated by the four methods using the following equation:
D = 0.15*D1 + 0.15*D2 + 0.35*D3 + 0.35*D4 [Eq. 4]
Where:
D = weighted average seismic-induced permanent deformation D1 = seismic-induced permanent deformation estimated by Hynes-Griffin and Franklin (1984) method D2 = seismic-induced permanent deformation estimated by Ambraseys and Menu (1984) method D3 = seismic-induced permanent deformation estimated by Bray and Travasarou (2007) method D4 = seismic-induced permanent deformation estimated by Rathje and Saygili (2008) method
The yield accelerations (ky) calculated for each representative soil profile are shown in Table 6. The yield acceleration is defined as the horizontal acceleration that will result in a FS of 1.0 in the pseudo-static global analyses. Horizontal loading greater than ky will result in slope movements.
TABLE 6 Calculated Yield Acceleration for Each Representative Soil Profile
North Extension
Profile
Profile 1 - North Profile 2 Profile 1 - South
Without Trestle Piles
With Trestle Piles
Without Trestle Piles
With Trestle Piles
Without Trestle Piles
With Trestle Piles
0.16 0.06 0.25 0.1 0.24 0.135 0.26
6-4 APPENDIX D GEOTECHNICAL REPORT FINAL 08DEC14

SECTION 6 GEOTECHNICAL ANALYSES AND RECOMMENDATIONS
Deformations obtained from the analyses using the above simplified Newmark sliding-block methods are summarized in Table 7. Compared to the deformation criteria shown in Table 4, the seismic-induced permanent deformations calculated for all terminal slopes appear to be acceptable.
TABLE 7 Seismic-Induced Permanent Deformations of the Terminal Slopes Calculated by Simplified Rigid-Block Methods
Seismic Event
Earthquake Magnitude
Estimated Seismic-Induced Permanent Deformation (inch)
North Extension
Profile 1 - North Profile 2 Profile 1 - South
Without Trestle
Piles
With Trestle
Piles
Without Trestle
Piles With Trestle
Piles
Without Trestle
Piles
With Trestle Piles
OLE 6.75 or 9.2 1 5 Minimal 1 Minimal 1 Minimal
CLE 9.2 2 13 1 3 Minimal 3 Minimal
MCE 9.2 5 25 2 6 Minimal 7 Minimal
6.2 Driven Pile Foundation Design Recommendations This section provides geotechnical recommendations for driven pile foundation design. These recommendations include resistance factors that should be used for determining the axial capacity of single piles, parameters for evaluating lateral pile response, and pile drivability. The discussion of lateral pile response includes recommendations for the lateral response analysis of piles subjected to seismic-induced slope movement.
6.2.1 Resistance Factors for Load and Resistance Factor Design The recommended resistance factors for side, base, and uplift resistances for driven piles are provided in Table 8. These factors were developed based on guidelines in AASHTO LRFD Bridge Design Specifications (2014). Alternatively, a resistance factor of 0.75 can be used for the total axial capacity if static and/or dynamic load testing (that is, Pile Driving Analyzer [PDA]) is conducted at the project site in the future. Plans for static pile-load tests and indicator pile-load test are discussed in separate CH2M HILL report Anchorage Port Modernization Project Test Pile Work Plan (CH2M HILL, 2014b).
TABLE 8 Resistance Factors for LRFD Design of Driven Piles (AASHTO LRFD, 2014)
Limit State
Resistance Factor, Φ
Side Resistance Base Resistance Uplift Resistance Lateral Resistance
Strength 0.45 0.45 0.35 1.0
Extreme 1.0 1.0 0.80 1.0
Service 1.0 1.0 N/A 1.0
Note:
If s tatic pile-load tests are conducted, resistance factor for axial compressive capacity at the Strength Limit State can be increased to 0.75.
LFRD = load and resistance factor design
APPENDIX D GEOTECHNICAL REPORT FINAL 08DEC14 6-5

SECTION 6 GEOTECHNICAL ANALYSES AND RECOMMENDATIONS
6.2.2 Axial Capacity of Single Pile For conceptual design, the nominal capacities of 36- and 48-inch steel pipe piles were estimated based on the results obtained from the dynamic load tests with signal matching analyses (CAPWAP) conducted by CH2M HILL in 1994. These tests were conducted on 24-inch and 36-inch steel pipe piles (0.75-inch wall thickness), which were installed in the BCF clay at the POL 2 area. Based on the results from these tests and values published in literature (Fellenius, 2014) for similar soils, the following unit resistances were assumed in the pile capacity calculations:
• Unit side resistance (combined external and internal):
– Tidal Flat and Fluvial Deposit: qs = 0.5 kips per square foot (ksf) – BCF Clay Deposit: qs = 1.2 ksf – Glaciofluvial Deposit: qs = 0.35*σ’v - where σ’v is the overburden effective stress in ksf
• Unit end-bearing resistance:
– Tidal Flat and Fluvial Deposit: qb = 40*σ’v (ksf) – BCF Clay Deposit: qb = 30*σ’v (ksf) – Glaciofluvial Deposit: qb = 120*σ’v (ksf)
The following simplified soil profiles were used in the axial pile capacity calculations for the proposed APMP alignment:
• Wharf Pile: The simplified soil profile used for wharf piles consists of a thin layer of Fluvial Deposit overlying the BCF clay and the Glaciofluvial Deposit. This soil profile is suitable for offshore piles supporting wharves or the trestle piles that are located near the toe of the terminal slopes.
• Trestle Pile 1: This soil profile is suitable for piles located near the mid-section of the access trestle. This soil profile consists of a layer of Tidal Flat and Fluvial Deposit overlying the BCF clay and the Glaciofluvial Deposit.
• Trestle Pile 2: This soil profile is suitable for piles located near the landside entrance of the access trestle. This soil profile consists of a layer of fill overlying the Tidal Flat and Fluvial Deposit, the BCF clay, and the Glaciofluvial Deposit.
The nominal axial capacity charts associated with each soil profile are shown in Figures 21 through 32. The following factors should be considered when estimating the pile length:
• The nominal pile resistances in the figures should be used in combination with the resistance factors provided in Table 5 to develop factored resistances required for length determination.
• Group effects can be ignored when the center-to-center spacing between adjacent piles is greater than 6 pile diameters. The group reduction factors (η) should be taken as 1.0 and 0.65 for center-to-center spacings of 6 and 2.5 pile diameters, respectively. For intermediate spacings, the group reduction factor should be determined by linear interpolation.
• Depending on the final layout of the piles, pile group analysis may be required to estimate group capacity and performances.
• The nominal uplift resistance of pile is assumed to be equal to the nominal side resistance (that is, without end-bearing resistance). The nominal side resistance should be used in combination with the uplift resistance factors provided in Table 8.
Compressive capacities shown in Figures 21 through 32 show capacities for both plugged and unplugged conditions. In this context, “plugged” means that the entire diameter of the pile will develop resistance to downward movement. In this case the compressive capacity is determined by the unit end bearing within the soil multiplied by the total cross-sectional area of the pile and the external side friction along the length
6-6 APPENDIX D GEOTECHNICAL REPORT FINAL 08DEC14
SECTION 6 GEOTECHNICAL ANALYSES AND RECOMMENDATIONS
of the pile. In this context, “unplugged” means the compressive capacity is limited to unit end bearing in the soil multiplied by the steel cross-sectional area plus a combination of outer and inner skin friction along the pile. For the unplugged case, the unit skin friction determined by PDA measurements at POL 1 (CH2M HILL, 1994) was used.
The BCF clay results of the test pile program at POL 1 suggest that the BCF clay will not develop plugged conditions even after 5 weeks of setup. A similar situation is expected if the pile is driven open-ended into the Glaciofluvial Deposit. However, with sufficient penetration into the Glaciofluvial Deposit and with time of setup, a plugged condition may develop in the Glaciofluvial Deposit. One of the objectives of the pile-load test being planned for the APMP site (CH2M HILL, 2014b) could be to investigate this potential for development of a plug.
In the event that plugged conditions are required to develop loads required for wharf support, the option exists to force a plug to develop by placing a plate at the end of the pile or at some distance above the toe of the pile. This concept was tested in the 1994 PDA test program (CH2M HILL, 1994) for a pile located in the BCF clay. Somewhat higher capacities were observed. However, it is expected that if a plate were used and the pile driven into the Glaciofluvial Deposit, very high capacities would be mobilized as shown in Figures 21 through 32. The tradeoff with using a bottom plate is that driving requirements become much higher. Additional studies will be required to evaluate these requirements.
Another option to forming a plug is to clean the pile to some depth below the top of the plug and cast a concrete plug into the pile. This approach appears to have some merit for the APMP piles, as plans are to place reinforced concrete from the deck level to 15 or 20 feet below the mudline at the pile location to address the high rates of corrosion at the APMP site. For this design, the assumption is that the steel pipe could lose its strength by corrosion but the remaining reinforced concrete would meet load demands. With this approach, the cleanout could extend closer to the toe of the pile to assure development of the plug.
6.2.3 Geotechnical Parameters for Lateral Response Analysis of Pile The lateral responses of the piles will be analyzed using the program LPILE (Wang and Reese, 1993) or other similar programs. The LPILE program is based on the P-y spring approach, in which the surrounding soils are modeled as a series of springs represented by non-linear load versus displacement or P-y curves. The initial slope of the P-y curves is either defined by the modulus of subgrade reaction (k) when the soils are cohesionless or by the secant shear strain (ε 50) when the soils are cohesive. Based on Reese et al. (2000), the modulus of subgrade reaction and the ε 50 can be estimated using the φ and the Su, respectively.
The recommended geotechnical soil parameters for use in the lateral response analysis of the piles are provided in Table 9 for Profile 1 North and South shown in Figure 14. These parameters were developed following the guidance provided by Wang and Reese (1993). For piles located in liquefiable soils, residual undrained strengths were developed to represent soil response during liquefied conditions. These soils are located primarily within the upper Tidal Flat Deposit in Soil Profile 1 North and South. Although zones of liquefiable soils were also identified in the Fluvial Deposit, the distribution of the low SPT blowcounts in Soil Profile 1 North and South are such that the soil is assumed to be non-liquefiable.
Soil Profile 2 is generally the same as summarized in Table 9 except for two important differences:
• The top elevations of Fluvial Deposit and the BCF Clay Deposit decrease by approximately 30 feet along the wharf alignment and approximately 40 feet at the landside of the trestle entrance
• Liquefaction has a much greater potential within the Fluvial Deposit than noted for Soil Profile 1 North and South
The greater depth of the Fluvial and BCF Clay Deposits for Soil Profile 2 appears to be consistent with infilling of a previous channel. Additional evaluations will be required in later phases of design to confirm these deeper conditions. The higher potential for liquefaction is based on detailed evaluations conducted as part of the Seismic Ground Response Analyses (CH2M HILL, 2014a).
APPENDIX D GEOTECHNICAL REPORT FINAL 08DEC14 6-7

SECTION 6 GEOTECHNICAL ANALYSES AND RECOMMENDATIONS
TABLE 9 Inputs Soil Parameters for Lateral Response Analyses
Soil Unit Description
Top Elevation (feet, MLLW)
Effective Unit Weight, γ (pcf)
Static Friction Angle, φ
(degrees)
Seismic Friction Angle, φs (degrees)
Static Undrained
Shear Strength, S u (ksf)
Seismic Undrained
Shear Strength, S us (ksf)
Subgrade Modulus
Reaction, k (pci)
Secant Shear Strain, ε50 (--)
Wharf Piles for Soil Profile 1 North and South
1 Fluvia l Depos i t -51 -66 36 36 -- -- -- 0.01
2 BCF Clay Depos i t -60 61 -- -- S u0 = 2.4 ∆S u = 0.021*
S u0 = 2.4 ∆S u = 0.021*
-- 0.0045
3 Glaciofluvia l Depos i t -160 71 45 45 -- -- 185 --
Trestle Piles Near the Mid-Span of the Trestle for Soil Profile 1 North and South
1 Tida l Flat Depos i t -10 56 -- -- 0.5 0.4 -- 0.01
2 Fluvia l Depos i t -30 66 36 -- -- -- 75 --
3 BCF Clay Depos i t -45 61 -- 45 S u0 = 2.4 ∆S u = 0.021*
S u0 = 2.4 ∆S u = 0.021*
-- 0.0045
4 Glaciofluvia l Depos i t -160 71 45 36 -- -- 185 --
Trestle Piles Near the Landside Entrance of the Trestle for Soil Profile 1 North and South
1 Fi l l 30 61 32 27 -- -- 13 --
2 Tida l Flat Depos i t 22 56 -- -- 0.5 0.4 -- 0.01
3 Fluvia l Depos i t -15 66 36 45 -- -- 75 --
4 BCF Clay Depos i t -40 61 -- 36 S u0 = 3.0
∆S u = 0.021* S u0 = 3.0
∆S u = 0.021* -- 0.0045
5 Glaciofluvia l Depos i t -160 71 45 -- -- -- 185 --
Notes :
(*) (1) Undra ined shear s trength of the BCF clay increases with depth with an increment of 0.021 ks f per foot.
(2) Elevation for the top of the Fluvial Deposit and BCF Clay Deposit decreased for Soil Profile 2 by 30 feet for wharf piles, 35 feet for mid-point, and by 40 feet for trestle piles at landside entrance to trestles.
pci = pounds per cubic inch S u0 = undrained shear s trength – initial undisturbed ∆S u = change in undrained strength
6-8 APPENDIX D GEOTECHNICAL REPORT FINAL 08DEC14

SECTION 6 GEOTECHNICAL ANALYSES AND RECOMMENDATIONS
For conceptual, the residual strength of the liquefied Fluvial Deposit can be determined based on the following equation: Sur = 0.1 σ v’, where σ v’ is the effective overburden pressure before the seismic event.
When using these soil parameters in the LPILE analysis, sensitivity studies should be conducted to account for variations in the P-y parameters specific to project soil and site conditions, including the difference between upslope and downslope responses of the piles. A variation of plus 100 percent and minus 50 percent of the P-y response should be considered to evaluate the effects of these parameters.
6.2.4 Drivability Analyses This section summarizes the findings from the analyses carried out to evaluate the drivability of the proposed 36-inch and 48-inch steel pipe piles at the project site. The assumptions used in the drivability analyses are provided in Section 3.2. The findings can be summarized as follows:
• Based on results from the drivability analyses and dynamic load tests at POL 1 site conducted by CH2M HILL in 1994, the 36-inch and 48-inch pipe piles can be driven to the top of the Glaciofluvial Deposit (average top elevations at -160 feet MLLW) using the Pileco D100-13 hammer (or hammers with similar capacity). Indicator pile testing with PDA measurements would be required to further refine the depth that can be achieved with different hammer sizes.
• The long-term axial capacity of the 36-inch and 48-inch pipe piles estimated from the drivability analyses ranged from 1,000 kips (offshore piles) to about 2,000 kips (trestle piles) when the piles were terminated in the BCF clay. The axial capacity increased significantly when the piles were driven into the Glaciofluvial Deposit. If a nominal axial capacity of more than 2,000 kips is required, then it is very likely that the piles will have to be driven into the Glaciofluvial Deposit.
• Compressive stress in the piles during driving could be up to 30 ksi. The tensile stress during driving ranged from 5 to 10 ksi. Maximum blow counts in the BCF clay to drive the piles to the top of the Glaciofluvial Deposit using Pileco D100-13 could be up to 35 blows per foot.
6.3 Lateral Earth Pressure Coefficients for Wall Design The lateral earth pressures for the design of the sheet pile bulkheads and retaining walls were estimated assuming a vertical wall and a level ground surface behind the wall. For the cellular sheet pile bulkhead design, the fill within the circular cells was assumed to be compacted with unit weight of 130 pcf and friction angle of 40 degrees. For the sheet pile bulkhead (Concept A), the fill behind the wall was assumed to be un-compacted common fill with unit weight of 125 pcf and friction angle of 32 degrees.
Because lateral movement of the compacted fill within the circular cells will be restricted, at-rest earth pressure coefficient (K0) should be used to estimate the lateral earth pressure inside the cellular sheet pile bulkhead. For the sheet pile walls at the existing terminals (Concept A), the active earth pressure coefficient (Ka) should be used to estimate the lateral earth pressure on the walls. A surcharge live load of 1,000 psf should be used for these computations.
For seismic loading, the seismic increment of the active lateral earth pressure can be estimated using the coefficient (∆Kae), which can be calculated using the Mononobe-Okabe method. Under seismic loading, the cellular sheet pile bulkhead should have sufficient flexibility to behave similarly to a cantilevered retaining wall. It was also assumed that both retaining structures may translate back and forth a couple of inches during the seismic event. As a result, the kh, which was used in calculating ∆Kae, was assumed to be half the PGA value. The recommended lateral earth pressure coefficients are summarized in Table 10. A reduced surcharge live load of 200 psf should be used when estimating lateral earth pressure for seismic loading. Passive earth pressure in front of the retaining wall and cellular sheet pile bulkhead should not be included in the wall stability analyses.
APPENDIX D GEOTECHNICAL REPORT FINAL 08DEC14 6-9

SECTION 6 GEOTECHNICAL ANALYSES AND RECOMMENDATIONS
TABLE 10 Lateral Earth Pressure Coefficients for Retaining Wall Design
Parameter Value
At-rest Lateral Earth Pressure Coefficient, K0 0.36
Active Lateral Earth Pressure Coefficient, Ka 0.28
Incremental Seismic Lateral Earth Pressure Coefficient (∆Kae) for OLE Event 0.05
Incremental Seismic Lateral Earth Pressure Coefficient (∆Kae) for CLE Event 0.10
Incremental Seismic Lateral Earth Pressure Coefficient (∆Kae) for MCE Event 0.14
6-10 APPENDIX D GEOTECHNICAL REPORT FINAL 08DEC14
SECTION 7
Issues to be Considered in Final Design The geotechnical analyses and discussions presented in the previous sections, as well as other supporting information in this technical memorandum, are only suitable for conceptual design. This level of design is sufficient for geotechnical feasibility assessments and preliminary cost evaluations. Additional geotechnical evaluations will be required for final design. These future evaluations should include additional field exploration and laboratory testing; final embankment slope, bulkhead, and foundation design studies; and pre-production pile load testing. A number of issues related to the planned construction approach will also need to be discussed to confirm that geotechnical design methods being used for final design are consistent with planned construction methods. The followings subsections identify a number of these future design and construction issues.
7.1 Design-Related Issues The following issues should be considered as the project advances from conceptual design to final geotechnical design:
• Soil-structure interaction under static and dynamic loading conditions should be considered in modeling the pile-supported wharves, trestles, and embankment slopes. The soil-structure interaction analyses should be conducted using either 2-D or 3-D finite element or finite difference models. These models are able to evaluate static and earthquake-induced slope deformations, effects of piles on embankment stability, and issues such as inertial response of the wharf and kinematic loading from ground movement.
• The shear strength reduction of the BCF clay, especially under large earthquake-induced slope deformation, should be confirmed for final design. The BCF clay encountered at the project site has a high potential for strain-softening (that is, loss of strength at large shear strain) when subject to large soil displacements. It is critical that the design confirms that such deformations and loss of strength do not develop during OLE, CLE, and MCE events.
• Liquefaction potential and the impacts of liquefaction on the piles and bulkheads should be re-evaluated and adjusted in final design to confirm that liquefaction within the granular backfill does not result in unacceptable loading to the piles or loss of support to the bulkhead wall. These analyses will require additional soil-structure interaction analyses, and may require further evaluation of the effects of fill removal on the final embankment slopes.
• The slope protection design should be considered in case erosion because wave and ice become an issue. Slope protection design includes the gradation and thickness of bedding layers to meet filter requirements, as well as required sizes of armor stones to meet wave and ice loading conditions.
• A number of additional studies will be required to finalize pile selection. For example, axial capacity calculations for pipe piles should be refined considering other capacity predictive methods such as CPT-based analysis. Various pile size and type could be considered and optimized if necessary. The resistance factors used in the pile foundation analysis should also be adjusted if static and dynamic load tests are to be conducted. Using higher resistance factors will result in shorter or smaller diameter piles. Drivability analysis should be refined considering various hammer types and sizes. The capacity (both skin- and end-bearing) mobilized during pile driving should be re-evaluated.
• Other alternatives for bulkhead and retaining walls should be considered in the final design. In addition, the suitability of the existing sheets (that is, salvaged from the existing OCSP structures) for sheet pile bulkhead and retaining wall construction must be re-evaluated. Other alternatives for the stabilization of the bulkhead and retaining wall should be considered in the final design.
APPENDIX D GEOTECHNIAL REPORT FINAL 08DEC14 7-1

SECTION 7 ISSUES TO BE CONSIDERED IN FINAL DESIGN
7.2 Construction-Related Issues The following issues should be considered in the development of the design concept and construction planning in the final design:
• The conceptual design currently assumes that the existing OCSP structures and retained fill will be removed before the construction of the embankment slope and pile-supported wharves and trestles. Construction methodology and staging for the removal of the existing OCSP structures and the retained fill must be fully reviewed for feasibility in the final design. At least a part of the fill contained within the cells must be removed before the sheets can be pulled or cut.
• Field pile-load testing involving both static (top down) capacity tests and dynamic tests (PDA with CAPWAP) during pile installation should be planned. These tests have an important benefit relative to the length and size of production piles. These pre-installation tests can be used to establish pile hammer requirements, pile drivability, formation of soil plugs with the pile, and ultimate (that is nominal) side and toe capacities. Load tests also allow use of higher resistance factors of design, which results in a better optimization of the production piles.
• The conceptual design assumes that up to 50 percent of the required sheets for the cellular sheet pile bulkhead and retaining wall will come from new sheets existing at the POA that were purchased for the OCSP structures. Undamaged sheets removed during demolition of the existing OCSP structure may also be used for construction of the cellular sheet pile bulkhead and retaining wall, depending on their conditions after removal. These assumptions must be re-evaluated in the final design, particularly relative to installation requirements. The conceptual design also assumes that the fill within the cellular sheet pile bulkhead can be vibro-compacted. The suitability of the vibro-compaction method must be re-evaluated in the final design as the fine content of the fill can be high. Ground improvement using stone columns may be considered if vibro-compaction is deemed unsuitable for the type of material encountered within and under the bulkhead.
7-2 APPENDIX D GEOTECHNICAL REPORT FINAL 08DEC14

SECTION 8
References Ambraseys, N.N., and Menu, J.M. 1988. “Earthquake-induced ground displacements.” Earthquake Engineering and Structural Dynamics. V. 16. Pp. 985-1006.
American Association of State Highway and Transportation Officials (AASHTO). 2014. LRFD Bridge Design Specifications, 7th Edition.
American Association of State Highway and Transportation Officials (AASHTO). 2012. Guide Specifications for LRFD Seismic Bridge Design, 2nd Edition.
American Society of Civil Engineers (ASCE). 2014. Seismic Design of Piers and Wharves, ASCE Standard, ASCE/COPRI 61-14.
Anderson, D.G., Martin, G.R., Lam, I., and Wang, J.N. 2008. Seismic Analysis and Design of Retaining Walls, Buried Structures, Slopes, and Embankments, National Cooperative Highway Research Program, NCHRP Report 611.
Bray, J.D., and Travasarou, T. 2007. “Simplified procedure for estimating earthquake-induced deviatoric slope displacement.” ASCE Journal of Geotechnical and Environmental Engineering. Vol. 130, No. 12. Pp 1314-1340. December.
CH2M HILL. 2014a. Anchorage Port Modernization Project Seismic Ground Response Study. November.
CH2M HILL. 2014b. Anchorage Port Modernization Project Test Pile Work Plan. November.
CH2M HILL. 2013a. Port of Anchorage Intermodal Expansion Project Study – 15% Concept Plan. February 28.
CH2M HILL. 2013b. Port of Anchorage Intermodal Expansion Suitability Study – Final Summary Report. February 14.
CH2M HILL. 1994. Test Pile Program Report, POL Terminal 2, Port of Anchorage. Report prepared for Municipality of Anchorage and Tryck, Nyman & Hayes, Inc.
Electric Power Research Institute (EPRI). 1990. Manual on Estimating Soil Properties for Foundation Design, EPRI EL-6800, Final Report.
Federal Highway Administration (FHWA). 2002. Evaluation of Soil and Rock Properties, Geotechnical Engineering Circular No. 5. Report No. FHWA-IF-02-034.
Fellenius, B. H. 2014. Basics of Foundation Design. Electronic Edition, February 2014.
Hynes-Griffin, M.E., and Franklin, A.G. 1984. Rationalization of the Seismic Method. U.S. Army Corp of Engineers, Waterways Experiment Station Miscellaneous Paper GL-84-13. Vicksburg, MS.
Idriss, I.M. and Boulanger, R.W. 2007. “SPT and CPT-Based Relationships for the Residual Shear Strength of Liquefied Soils.” Earthquake Geotechnical Engineering, eds. K.D. Titilakis.
Naval Facilities Engineering Command (NAVFAC). 1986. Soil Mechanics, Design Manual DM-7.01.
Olson, S.M. and Stark, T.D. 2002. “Liquefied Strength Ratio from Liquefaction Flow Failure Case Histories.” Canadian Geotechnical Journal, Vol. 39.
PND Engineers, Inc. (PND). 2010a. 2008 Sampling Report. Volume 1. Appendix P to PND (2008b). February.
PND Engineers, Inc. (PND). 2010b. Refined Engineering Analyses for the OPEN CELL® Wharf at the South Extension. Appendix R to PND (2008b). July.
APPENDIX D GEOTECHNIAL REPORT FINAL 08DEC14 8-1
SECTION 8 REFERENCES
PND Engineers, Inc. (PND). 2008. Port of Anchorage Marine Terminal Redevelopment Geotechnical Analysis Report. Prepared for Integrated Concepts and Research Corporation. April.
Rathje, E.M., and Saygili, G. 2008. “Probabilistic seismic hazard analysis for the sliding displacement of slopes: scalar and vector approaches.” ASCE Journal of Geotechnical and Geoenvironmental Engineering. Vol. 134, No. 6.
Reese, L.C., Wang, S.T., Isenhower, W.M. and Arrellaga, J.A. 2000. Computer Program LPILE Plus, Version 4.0, Technical Manual, Ensoft, Inc. Austin, Texas.
Terracon Consulting Engineers and Scientists Inc. 2004. Marine Geotechnical Exploration, Port of Anchorage Intermodal Expansion, Volumes 1 and 2, prepared by Terracon Consultants Inc., Rayleigh, N.C. for Koniag Services, Anchorage, Alaska.
Terracon Consulting Engineers and Scientists Inc. 2011. Interim Monitoring Summary Report, North Extension Instrumentation, Port of Anchorage Intermodal Expansion Project, Anchorage, Alaska. Prepared for ICRC, Anchorage Alaska. November.
URS. 2014. Site-Specific Seismic Hazard Analyses and Development of Earthquake Ground Motions for the Anchorage Port Modernization Project, Alaska. Prepared for Municipality of Anchorage, Anchorage, Alaska, November 3.
URS. 2008. Site-Specific Probabilistic and Deterministic Seismic Hazard Analyses and Development of Earthquake Ground Motions for the Anchorage Port of Anchorage Expansion Project. Prepared for Terracon Consultants, Charlotte, North Carolina, April 4.
U.S. Army Corps of Engineers (USACE). 2008. Geotechnical Finding Report for the Anchorage Harbor Deepening Project.
Wang, S.T. and Reese, L.C. 1993. COM 624P – Laterally Loaded Pile Analysis Program for Microcomputer, Version 2.0, FHWA Report No. FHWA-SA-91-048, US Department of Transportation.
8-2 APPENDIX D GEOTECHNICAL REPORT FINAL 08DEC14

Figures


TRANSIT BLDG
CONCEPT A
NORTHERN EXTENSION UNDER CONSTRUCTIONTERMINAL 1 POL 1TERMINAL 2TERMINAL 3
PHASING ALTERNATIVE 1
TERMINAL 2TERMINAL 3
TERMINAL 3
TERMINAL 2TERMINAL 3
RECONSTRUCTEDTERMINAL, TYP
NEW TERMINAL UNDERCONSTRUCTION
NEW TERMINAL UNDERCONSTRUCTION
TERMINAL UNDERCONSTRUCTION
RETROFITTEDTERMINAL, TYP
POL 2
RETROFITTEDTERMINAL
POL 2
POL 2
TERMINAL UNDERCONSTRUCTION
TEMP CEMENT BERTH
TEMP CEMENT BERTH
TEMP CEMENT BERTH
TEMP HORIZON BERTH
TEMP HORIZON BERTHTEMP TOTE BERTH
RETROFITTEDTERMINAL, TYP
PHASE 1 - RETROFIT POL2 FOR CEMENT OPERATIONS - EXPAND WHARF AND CONSTRUCT NEW MOORING DOLPHINS.RELOCATE TRANSIT BUILDING OPERATIONS TO PORT UPLANDS.RECONSTRUCT NORTHERN EXTENSION TO ITS FINAL CONFIGURATION.
500 750
Scale In Feet
2500
500 750
Scale In Feet
2500
500 750
Scale In Feet
2500
500 750
Scale In Feet
2500
PHASE 2 - RELOCATE CEMENT OPERATIONS TO RETROFITTED POL2. RETROFIT T1 FOR HORIZON OPERATIONS - RETROFIT EXISTING WHARF AND TRESTLES.
PHASE 3 - RELOCATE HORIZON OPERATIONS TO RETROFITTED T1. RECONSTRUCT T2 IN ITS FINAL CONFIGURATION.
PHASE 4 - RELOCATE TOTE OPERATIONS TO NEW T2.RECONSTRUCT T3 IN ITS FINAL CONFIGURATION.
TERMINAL 1 POL 1
TERMINAL 2 POL 2
TERMINAL 1 POL 1
TERMINAL 1 POL 1
TEMP TRESTLE,TYP
RECONSTRUCTED NORTHERN EXTENSION
RECONSTRUCTED NORTHERN EXTENSION
RECONSTRUCTED NORTHERN EXTENSION
COMPLETION - TOTE, HORIZON, AND CEMENT OPERATIONS ARE RESTORED TO THEIR NEW TERMINALS.
TERMINAL 2TERMINAL 3 POL 2
RECONSTRUCTEDTERMINAL, TYP
RETROFITTEDTERMINAL, TYP
500 750
Scale In Feet
2500
TERMINAL 1 POL 1RECONSTRUCTED NORTHERN EXTENSION

CONCEPT A
500 750
Scale In Feet
250
RECONSTRUCTED NORTHERN EXTENSION
TERMINAL 1 POL 1TERMINAL 2TERMINAL 3 POL 2
RECONSTRUCTEDTERMINAL, TYP
0
TOTE BERTHHORIZON BERTH CEMENT BERTH
NEW SHEET PILEBULKHEAD, TYP
GENERAL NOTES:
1. THE EXISTING SHEET PILE WALLS, TAIL WALLS, ROCK STABILIZED SLOPES, EARTH EMBANKMENT ANDOTHER FEATURES ARE NOT SHOWN ON GENERAL SITE LAYOUT FOR CLARITY.
2. THIS CONCEPT CAN BE COMBINED WITH OPTION S1. THE NEW TERMINAL CONSTRUCTED WITH OPTIONS1 WOULD SERVE CEMENT OPERATIONS AND ASSIST IN PROJECT PHASING.
(OPTION N3)
RETROFITTEDTERMINAL, TYP
EXISTING USACE -35'DREDGE LIMIT
NEW TAG OPERATIONSBUILDING
FIRE BOAT STORAGEBUILDING
NEW PORT ADMINISTRATIONBUILDING

TRANSIT BLDG
CONCEPT C
NORTHERN EXTENSION UNDER CONSTRUCTION TERMINAL 1 POL 1TERMINAL 2TERMINAL 3
PHASING ALTERNATIVE 1
TERMINAL 1 POL 1TERMINAL 2TERMINAL 3
TERMINAL 1 POL 1TERMINAL 2TERMINAL 3 POL 2
0 500 750
Scale In Feet
250
TERMINAL 2
TERMINAL 3
RETROFITTEDTERMINAL, TYP
NEW TERMINAL UNDERCONSTRUCTION
TERMINAL UNDERCONSTRUCTION
TERMINAL UNDERCONSTRUCTION
RETROFITTEDTERMINAL, TYP
POL 2RETROFITTEDTERMINAL, TYP
POL 2
POL 2
TERMINAL UNDERCONSTRUCTION
TEMP CEMENT BERTH
TEMP CEMENT BERTH
TEMP CEMENT BERTH
TEMP HORIZON BERTH
TEMP HORIZON BERTHTEMP TOTE BERTH
PHASE 1 - RETROFIT POL2 FOR CEMENT OPERATIONS - EXPAND WHARF AND CONSTRUCT NEW MOORING DOLPHINS.RELOCATE TRANSIT BUILDING OPERATIONS TO THE PORT UPLANDS.RECONSTRUCT NORTHERN EXTENSION TO ITS FINAL CONFIGURATION.
PHASE 2 - RELOCATE CEMENT OPERATIONS TO RETROFITTED POL2. RETROFIT T1 FOR HORIZON OPERATIONS - RETROFIT EXISTING WHARF AND TRESTLE, EXTEND CRANE RAIL AND BUS BAR.
PHASE 3 - RELOCATE HORIZON OPERATIONS TO RETROFITTED T1. RETROFIT T2 FOR TOTE OPERATIONS - WIDEN SOUTHERN TRESTLE AND CONSTRUCT NEW TRESTLE.
PHASE 4 - RELOCATE TOTE OPERATIONS TO RETROFITTED T2.RECONSTRUCT T3 IN ITS FINAL CONFIGURATION.
0 500 750
Scale In Feet
250
0 500 750
Scale In Feet
250
0 500 750
Scale In Feet
250
POL 2
TEMP HORIZON BERTHTEMP CEMENT BERTH
NEW TERMINAL UNDERCONSTRUCTION
RECONSTRUCTEDTERMINAL
TERMINAL 2TERMINAL 3
RETROFITTEDTERMINAL, TYP
PHASE 5 - RESTORE TOTE OPERATIONS AT T3.RECONSTRUCT T2 IN ITS FINAL CONFIGURATION .
500 750
Scale In Feet
250
TERMINAL 1 POL 1
TERMINAL 1 POL 1
RECONSTRUCTED NORTHERN EXTENSION
RECONSTRUCTED NORTHERN EXTENSION
RECONSTRUCTED NORTHERN EXTENSION
RECONSTRUCTED NORTHERN EXTENSION

CONCEPT CPHASING ALTERNATIVE 1
TERMINAL 2TERMINAL 3
TERMINAL 1/POL 1TERMINAL 2TERMINAL 3 POL 2
RECONSTRUCTED NORTHERN EXTENSION
TERMINAL 2TERMINAL 3
POL 2
RECONSTRUCTEDTERMINAL, TYP
TEMP CEMENT BERTH
NEW TERMINAL UNDERCONSTRUCTION
NEW TERMINAL UNDERCONSTRUCTION
POL 2TERMINAL 1/POL 1
RECONSTRUCTEDTERMINAL, TYP
RECONSTRUCTEDTERMINAL, TYP
PHASE 6 - RESTORE HORIZON OPERATIONS AT T2. RECONSTRUCT T1 /POL1 IN ITS FINAL CONFIGURATION.
PHASE 7 - RELOCATE CEMENT OPERATIONS TO T1/POL1.RECONSTRUCT POL2 IN ITS FINAL CONFIGURATION.
COMPLETION - TOTE, HORIZON AND CEMENT OPERATIONS ARE RESTORED TO THEIR NEW TERMINALS.
0 500 750
Scale In Feet
250
0 500 750
Scale In Feet
250
0 500 750
Scale In Feet
250
TERMINAL 1 POL 1RETROFITTEDTERMINAL, TYP
RECONSTRUCTED NORTHERN EXTENSION
RECONSTRUCTED NORTHERN EXTENSION

CONCEPT C
500 750
Scale In Feet
250
RECONSTRUCTED NORTHERN EXTENSION
TERMINAL 1/POL 1TERMINAL 2TERMINAL 3 POL 2
RECONSTRUCTEDTERMINAL, TYP
0
NEW SLOPE PROTECTION TOTE BERTHHORIZON BERTH
CEMENT BERTH
NEW SHEET PILEBULKHEAD, TYP
GENERAL NOTES:
1. THE EXISTING SHEET PILE WALLS, TAIL WALLS, ROCK STABILIZED SLOPES, EARTH EMBANKMENT ANDOTHER FEATURES ARE NOT SHOWN ON GENERAL SITE LAYOUT FOR CLARITY.
2. THIS CONCEPT CAN BE COMBINED WITH OPTION S1. THE NEW TERMINAL CONSTRUCTED WITH OPTIONS1 WOULD SERVE CEMENT OPERATIONS AND ASSIST IN PROJECT PHASING.
(OPTION N2)
EXISTING USACE -35'DREDGE LIMIT
NEW TAG OPERATIONSBUILDING
FIRE BOAT STORAGEBUILDING
NEW PORT ADMINISTRATIONBUILDING

TRANSIT BLDG
NORTHERN EXTENSION UNDER CONSTRUCTION TERMINAL 1
NEW POL 1
TERMINAL 2TERMINAL 3
TERMINAL 1
TERMINAL 2TERMINAL 3
TERMINAL 2
TERMINAL 3 POL 2
NEW TERMINAL UNDERCONSTRUCTION
NEW TERMINAL UNDERCONSTRUCTION
RECONSTRUCTEDTERMINAL, TYP
POL 2
RECONSTRUCTEDTERMINAL
POL 2
NEW TERMINAL UNDERCONSTRUCTION
PHASE 1 - RECONSTRUCT POL 1 IN ITS FINAL CONFIGURATION.RELOCATE TRANSIT BUILDING OPERATIONS TO THE PORT UPLANDS.RECONSTRUCT NORTHERN EXTENSION TO ITS FINAL CONFIGURATION
PHASE 2 - RELOCATE CEMENT OPERATIONS TO NEW POL 1.RECONSTRUCT MOST OF T1 IN ITS FINAL CONFIGURATION.CONSTRUCT TEMPORARY TRESTLE FOR INTERIM HORIZON OPERATIONS.
PHASE 3 - RELOCATE HORIZON OPERATIONS TO NEW T1.COMPLETE RECONSTRUCTION OF T1.RECONSTRUCT MOST OF T2 IN ITS FINAL CONFIGURATION.
500 750
Scale In Feet
2500
500 750
Scale In Feet
2500
500 750
Scale In Feet
2500
TERMINAL 1
POL 1
POL 1
CONCEPT DPHASING ALTERNATIVE 1
RECONSTRUCTED NORTHERN EXTENSION
RECONSTRUCTED NORTHERN EXTENSION
POL 1
UPLAND EXPANSION
TEMP TRESTLE

CONCEPT DPHASING ALTERNATIVE 1
RECONSTRUCTEDTERMINAL, TYP
RECONSTRUCTED NORTHERN EXTENSION
TERMINAL 1TERMINAL 2
COMPLETION - TOTE, HORIZON, AND CEMENT OPERATIONS ARE RESTORED TO THEIR NEW TERMINALS.
500 750
Scale In Feet
250
0
TERMINAL 1TERMINAL 2
RECONSTRUCTEDTERMINAL, TYP
POL 2
NEW TERMINAL UNDERCONSTRUCTION
PHASE 5 - COMPLETE DEMOLITION OF T3.RECONSTRUCT POL2 IN ITS FINAL CONFIGURATION.
500 750
Scale In Feet
2500
POL 1
POL 1
POL 2
TERMINAL 2
TERMINAL 3 POL 2
PHASE 4 - RELOCATE TOTE OPERATIONS TO NEW T2.DEMOLISH A PORTION OF T3.COMPLETE RECONSTRUCTION OF T2.
500 750
Scale In Feet
250
TERMINAL 1
POL 1
RECONSTRUCTEDTERMINAL, TYP
RECONSTRUCTED NORTHERN EXTENSION
RECONSTRUCTED NORTHERN EXTENSION
NEW TERMINAL UNDERCONSTRUCTION
0

2
CONCEPT D
500 750
Scale In Feet
250
RECONSTRUCTED NORTHERN EXTENSION
TERMINAL 1
POL 1
TERMINAL 2POL 2
RECONSTRUCTEDTERMINAL, TYP
0
NEW SLOPE PROTECTION
TOTE BERTHHORIZON BERTH
CEMENT BERTH
NEW SHEET PILEBULKHEAD, TYP
GENERAL NOTES:
1. THE EXISTING SHEET PILE WALLS, TAIL WALLS, ROCK STABILIZED SLOPES, EARTH EMBANKMENT ANDOTHER FEATURES ARE NOT SHOWN ON GENERAL SITE LAYOUT FOR CLARITY.
2. THIS CONCEPT INCLUDES OPTION S1. THE NEW TERMINAL CONSTRUCTED WITH OPTION S1 WOULDSERVE CEMENT OPERATIONS AND ASSIST IN PROJECT PHASING.
(OPTION N2)
EXISTING USACE -35'DREDGE LIMIT
UPLAND EXPANSION
NEW TAG OPERATIONSBUILDING
FIRE BOAT STORAGEBUILDING
NEW PORT ADMINISTRATIONBUILDING

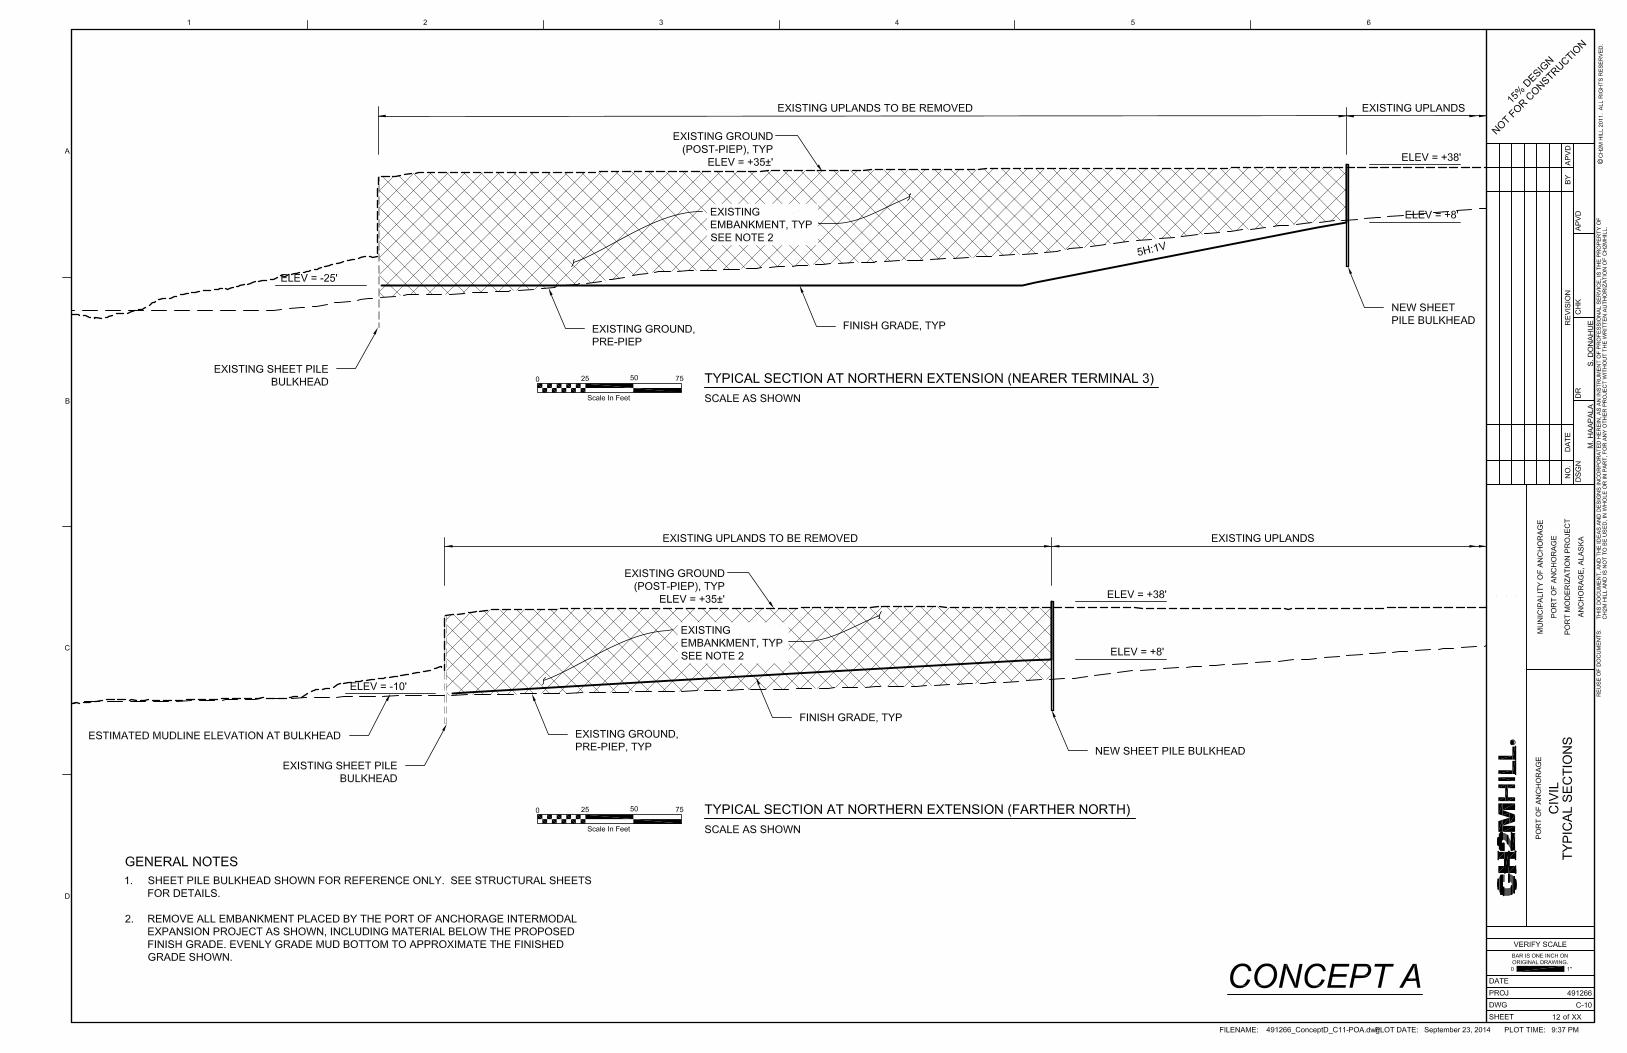
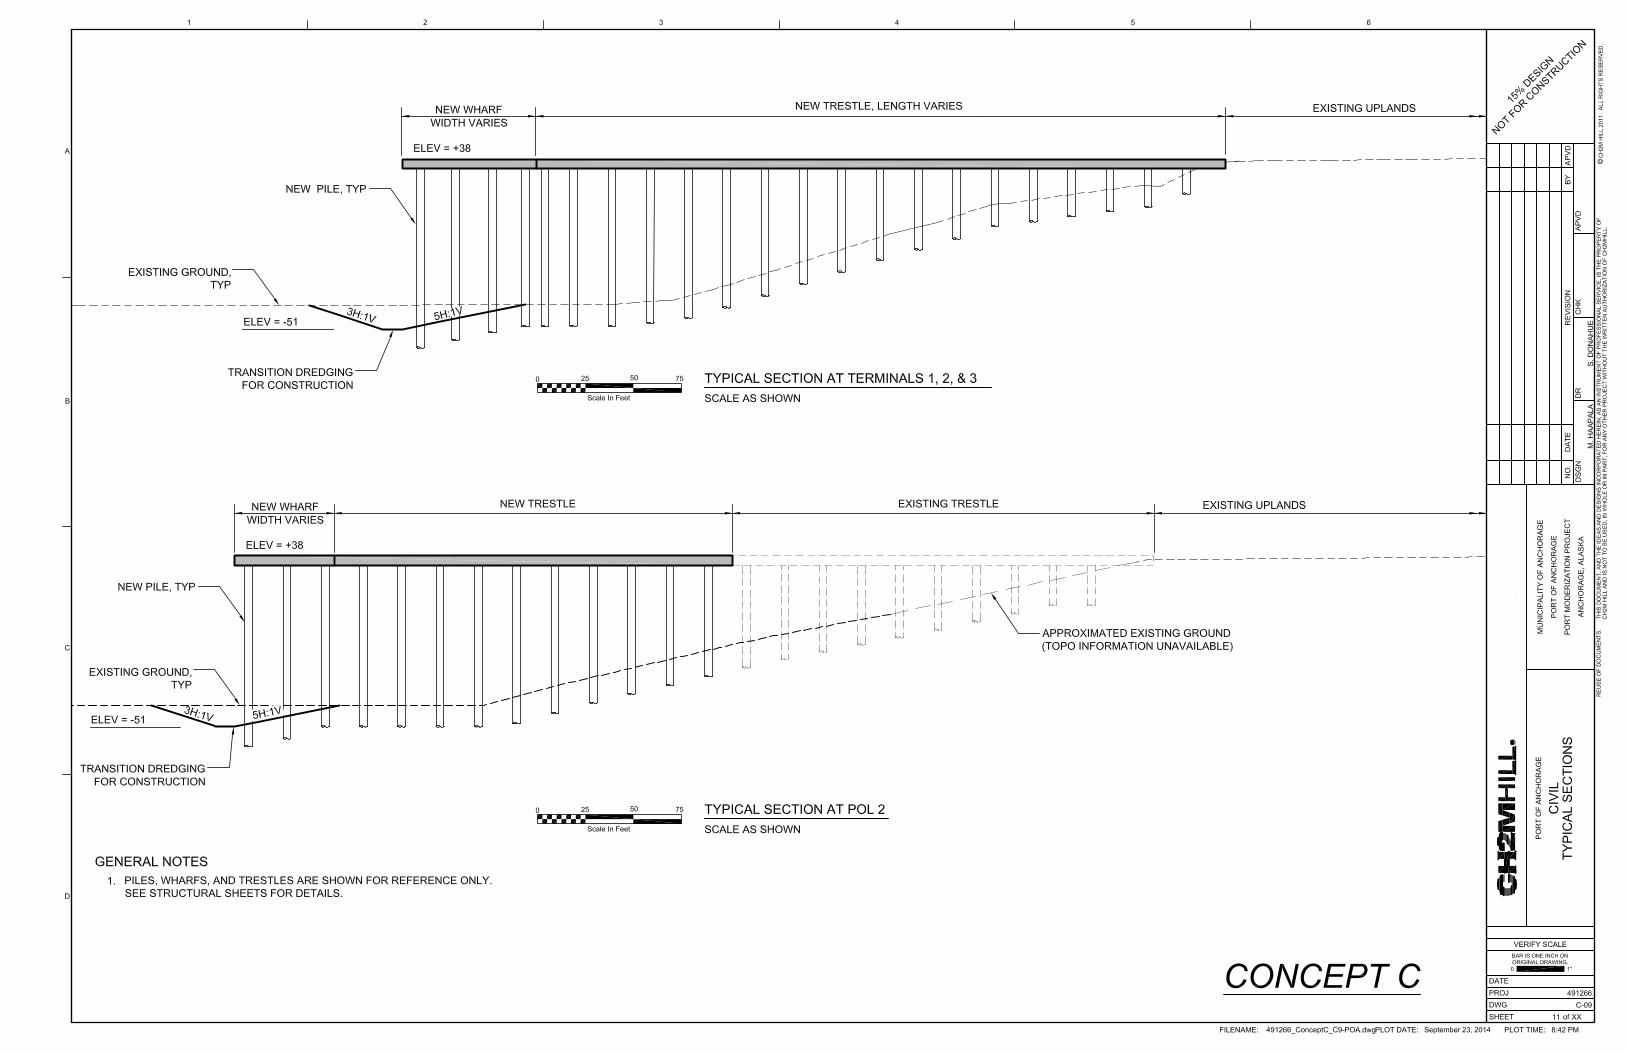


2
420 630
Scale In Feet
2100
GENERAL NOTES:
1. UNDERLYING PHOTO IS NOT ORTHOMETRIC, AND DISTORTION SHOULD BE EXPECTED, THEREFOREAERIAL SCALE IS APPROXIMATE.
2. NEW UPLAND BUILDINGS NOT SHOWN FOR CLARITY.
3. LOCATIONS OF BORINGS, BORE HOLES, SPT'S, AND CONE PENETROMETER TESTS APPROXIMATEDFROM PIEP PROJECT GEOTECHNICAL DOCUMENTS.
LEGEND
TERRACON SOIL BORING LOCATION
TERRACON CONE PENETROMETER TEST LOCATION
PND BORE HOLE LOCATION
PND SPT LOCATION
NORTH EXTENSION
PROFILE 1 - NORTH
PROFILE 1 - SOUTH
PROFILE 2
TERRACON/PNDSOIL TEST
LOCATIONS
LIMITED SUBSURFACE INFORMATION

Figure 15. Typical soil profile at the North Extension area.

Figure 16. Typical soil profile at Profile 1 – North area.

Figure 17. Typical soil profile at Profile 2 area.

Figure 18. Typical soil profile at Profile 1 – South area.

Figure 19. Typical tidal curve in a 24‐hour period.
‐10
‐5
0
5
10
15
20
25
30
35
1 2 3 4 5 6 7 8 9 10 11 12 13 14 15 16 17 18 19 20 21 22 23 24
Sea level, ft
Time, hour

Figure 20. Residual Shear Strength with Elevation based upon SPT and CPT data and relationships.

Figure 21. Axial capacity chart for 36‐inch wharf piles (unplugged condition).
‐180
‐160
‐140
‐120
‐100
‐80
‐60
‐40
‐20
00 500 1000 1500 2000 2500 3000 3500
Elevation (fe
et, M
LLW)
Nominal Axial Capacity (kip)
Skin Friction End Bearing Total

Figure 22. Axial capacity chart for 48‐inch wharf piles (unplugged condition).
‐180
‐160
‐140
‐120
‐100
‐80
‐60
‐40
‐20
00 500 1000 1500 2000 2500 3000 3500
Elevation (fe
et, M
LLW)
Nominal Axial Capacity (kip)
Skin Friction End Bearing Total

Figure 23. Axial capacity chart for 36‐inch piles near mid‐span of the trestle (unplugged condition).
‐180
‐160
‐140
‐120
‐100
‐80
‐60
‐40
‐20
00 500 1000 1500 2000 2500 3000 3500 4000 4500
Elevation (fe
et, M
LLW)
Nominal Axial Capacity (kip)
Skin Friction End Bearing Total

Figure 24. Axial capacity chart for 48‐inch piles near mid‐span of the trestle (unplugged condition).
‐180
‐160
‐140
‐120
‐100
‐80
‐60
‐40
‐20
00 500 1000 1500 2000 2500 3000 3500 4000 4500
Elevation (fe
et, M
LLW)
Nominal Axial Capacity (kip)
Skin Friction End Bearing Total

Figure 25. Axial capacity chart for 36‐inch piles near the entrance of the trestle (unplugged condition).
‐200
‐180
‐160
‐140
‐120
‐100
‐80
‐60
‐40
‐20
0
20
400 500 1000 1500 2000 2500 3000 3500 4000 4500 5000
Elevation (fe
et, M
LLW)
Nominal Axial Capacity (kip)
Skin Friction End Bearing Total

Figure 26. Axial capacity chart for 48‐inch piles near the entrance of the trestle (unplugged condition).
‐200
‐180
‐160
‐140
‐120
‐100
‐80
‐60
‐40
‐20
0
20
400 500 1000 1500 2000 2500 3000 3500 4000 4500 5000
Elevation (fe
et, M
LLW)
Nominal Axial Capacity (kip)
Skin Friction End Bearing Total

Figure 27. Axial capacity chart for 36‐inch wharf piles (plugged condition).
‐180
‐160
‐140
‐120
‐100
‐80
‐60
‐40
‐20
00 2000 4000 6000 8000 10000 12000 14000
Elevation (fe
et, M
LLW)
Nominal Axial Capacity (kip)
Skin Friction End Bearing Total
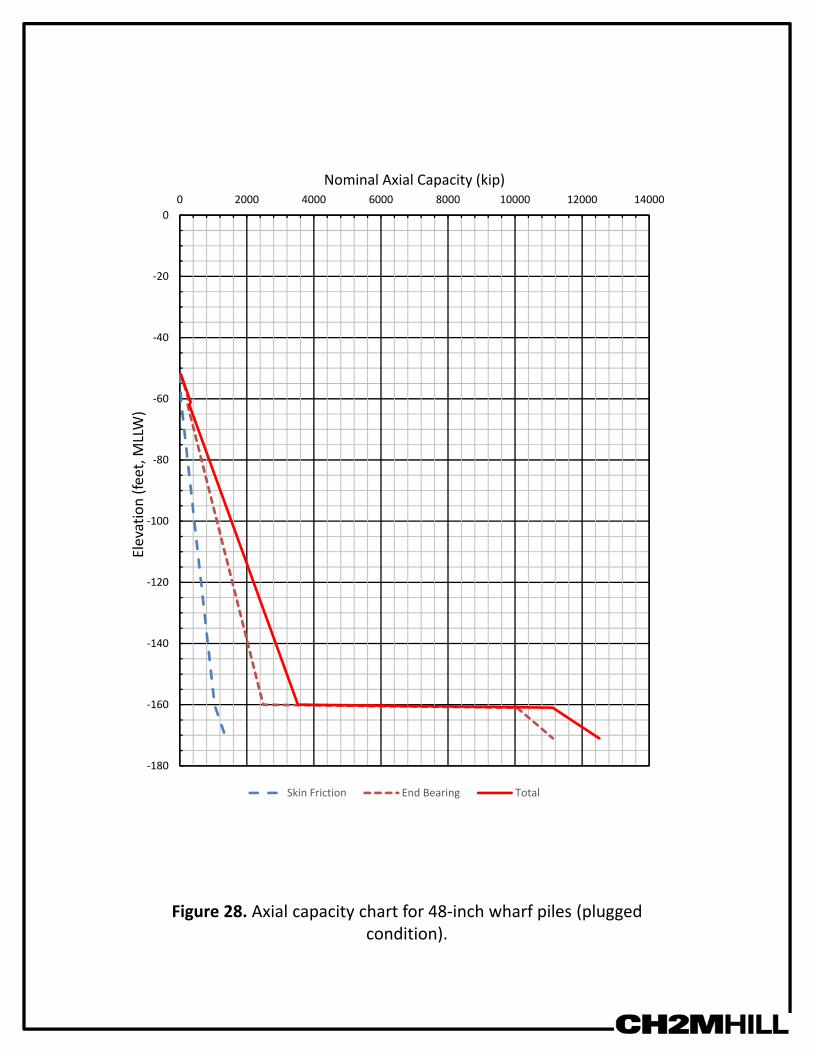
Figure 28. Axial capacity chart for 48‐inch wharf piles (plugged condition).
‐180
‐160
‐140
‐120
‐100
‐80
‐60
‐40
‐20
00 2000 4000 6000 8000 10000 12000 14000
Elevation (fe
et, M
LLW)
Nominal Axial Capacity (kip)
Skin Friction End Bearing Total

Figure 29. Axial capacity chart for 36‐inch piles near mid‐span of the trestle (plugged condition).
‐180
‐160
‐140
‐120
‐100
‐80
‐60
‐40
‐20
00 2000 4000 6000 8000 10000 12000 14000 16000 18000
Elevation (fe
et, M
LLW)
Nominal Axial Capacity (kip)
Skin Friction End Bearing Total

Figure 30. Axial capacity chart for 48‐inch piles near mid‐span of the trestle (plugged condition).
‐180
‐160
‐140
‐120
‐100
‐80
‐60
‐40
‐20
00 2000 4000 6000 8000 10000 12000 14000 16000 18000
Elevation (fe
et, M
LLW)
Nominal Axial Capacity (kip)
Skin Friction End Bearing Total
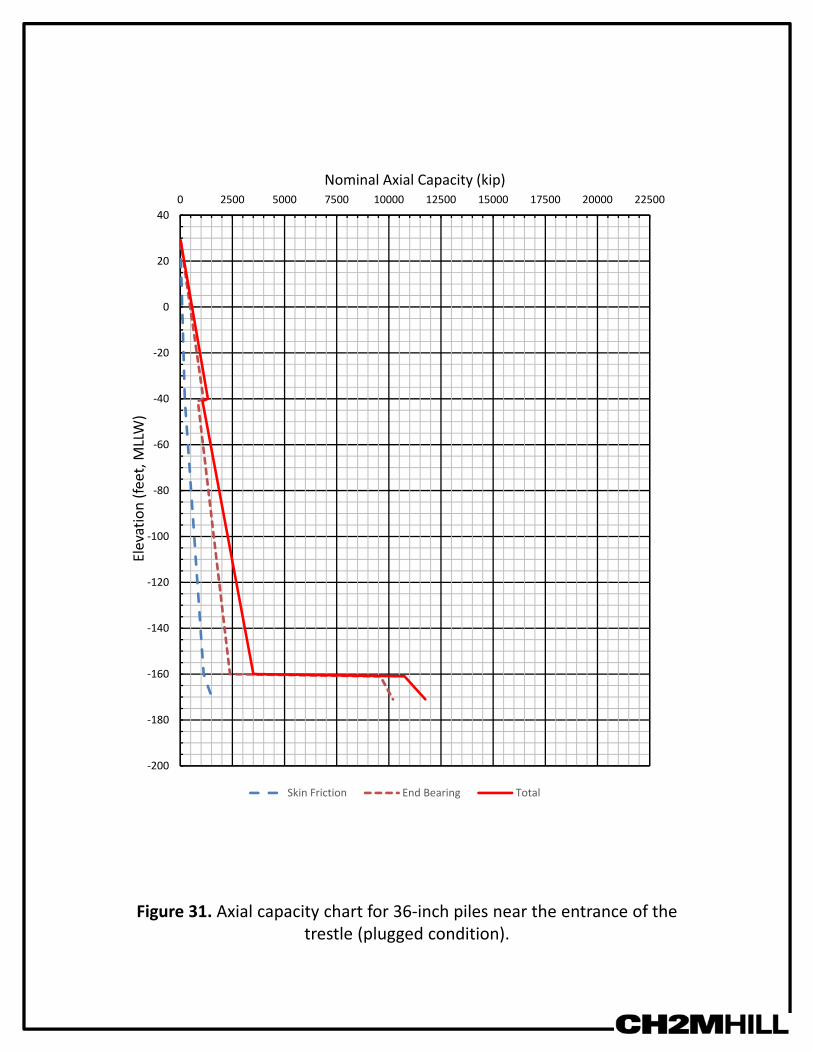
Figure 31. Axial capacity chart for 36‐inch piles near the entrance of the trestle (plugged condition).
‐200
‐180
‐160
‐140
‐120
‐100
‐80
‐60
‐40
‐20
0
20
400 2500 5000 7500 10000 12500 15000 17500 20000 22500
Elevation (fe
et, M
LLW)
Nominal Axial Capacity (kip)
Skin Friction End Bearing Total
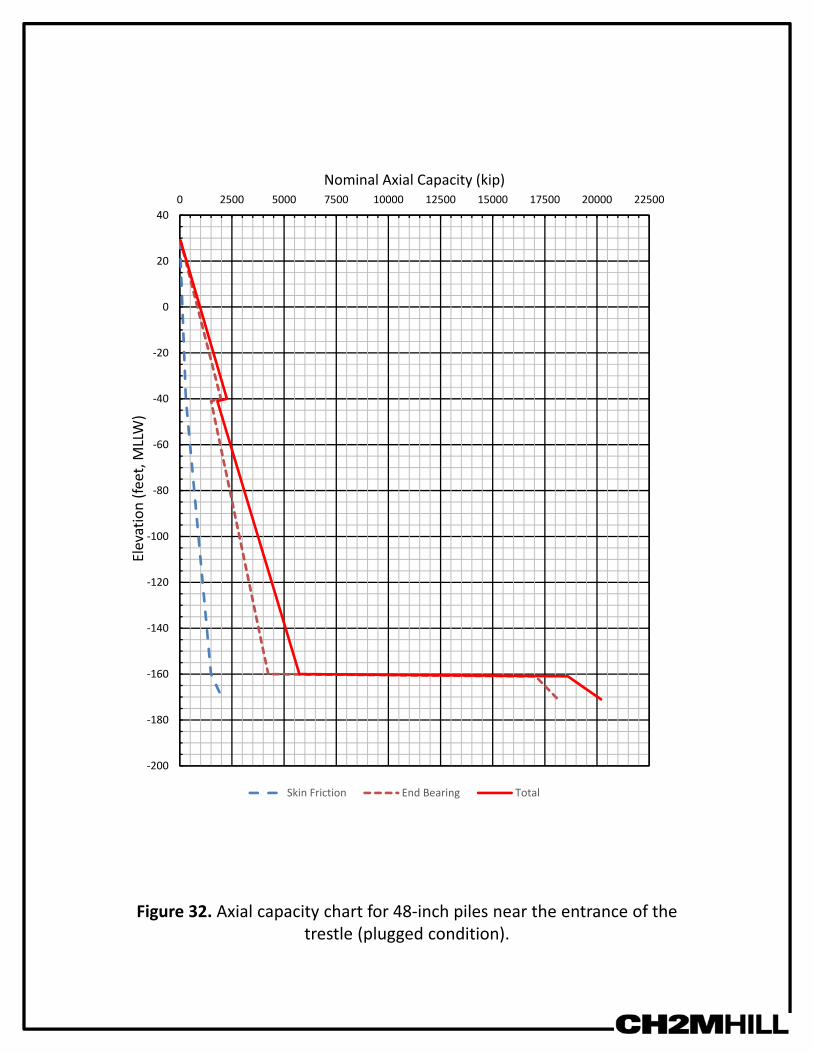
Figure 32. Axial capacity chart for 48‐inch piles near the entrance of the trestle (plugged condition).
‐200
‐180
‐160
‐140
‐120
‐100
‐80
‐60
‐40
‐20
0
20
400 2500 5000 7500 10000 12500 15000 17500 20000 22500
Elevation (fe
et, M
LLW)
Nominal Axial Capacity (kip)
Skin Friction End Bearing Total