appendix d data validation and usability report · method 4500-p e. ascorbic acid method, standard...
TRANSCRIPT

Appendix D Data Validation and Usability Report
USACE New England
Lower Merrimack River
Water Quality Monitoring Data Usability and Assessment Review
Laboratory Data
May 2017

i
Table of Contents
Section 1 Introduction ..............................................................................................................1-1
1.1 Data Usability and Assessment Review ..................................................................... 1-1
Section 2 Usability Summary .....................................................................................................2-1
Section 3 Quality Assurance Objectives .....................................................................................3-1
Section 4 Summary of Field and Laboratory QA Activities ..........................................................4-1
4.1 Deviations from Field Procedures ............................................................................. 4-1
4.2 Field and Analytical QA/QC ....................................................................................... 4-1
4.3 Laboratory Methods.................................................................................................. 4-2
Section 5 Data Review Procedures ............................................................................................5-1
5.1 Qualifier Definitions .................................................................................................. 5-1
Section 6 Data Quality Indicators ..............................................................................................6-1
6.1 Precision .................................................................................................................... 6-1
6.2 Accuracy .................................................................................................................... 6-5
6.3 Blank Contamination ................................................................................................. 6-6
Section 7 Representativeness, Comparability, and Sensitivity
7.1 Representativeness ................................................................................................... 7-1
7.2 Comparability ............................................................................................................ 7-2
7.3 Sensitivity .................................................................................................................. 7-3
7.4 Data Completeness ................................................................................................... 7-4
Section 8 Assessment of Data Usability and Reconciliation with QAPP Goals ..............................8-1
Section 9 References.................................................................................................................9-1
Attachment 1. Data Validation and Usability Report
Attachment 2. June 2014 and February 2015 Ammonia Field Blank Analysis

ii
Acronyms
°C degrees Centigrade
C/N Carbon to Nitrogen Ratio
CBOD20 20-day Carbonaceous Biological Oxygen Demand
CBOD5 5-day Carbonaceous Biological Oxygen Demand
DIN Dissolved Inorganic Nitrogen
DO Dissolved Oxygen
DON Dissolved Organic Nitrogen
DQI data quality indicators
DQOs data quality objectives
EAI Eastern Analytical, Inc.
EPA U.S. Environmental Protection Agency
LCS laboratory control sample
MDL method detection limit
mg/L milligrams per liter
MS/MSDs matrix spike/matrix spike duplicates
NC not calculable
ND nondetect
NOX Nitrate and Nitrite
PARCCS precision, accuracy, representativeness, comparability, completeness, and
sensitivity
PO4 Orthophosphate
POC Particulate Organic Carbon
PON Particulate Organic Nitrogen
QA quality assurance
QA/QC quality assurance/quality control
QAPP quality assurance project plan
RL reporting limit
RPD relative percent difference
SDG sample delivery group
SOP standard operating procedures
SQL sample quantitation limit
SMAST The School for Marine Science and Technology at University of Massachusetts
Dartmouth
TDN Total Dissolved Nitrogen
TKN Total Kjeldhal Nitrogen
TN Total Nitrogen
TP Total Phosphorus
TSS Total Suspended Solids
ug/L micrograms per liter

1-1
Section 1
Introduction
1.1 Data Usability and Assessment Review A field sampling program was developed as part of the Lower Merrimack River Study (Phase III of the
Merrimack River Watershed Assessment Study). The primary objective of the field sampling program
is to provide an accurate and representative picture of the current water quality conditions at specific
sampling stations along the mainstem and key tributaries, with particular emphasis on nonpoint
sources including major tributaries. Data collected under this task will be used to augment Phase I
and Phase II data, to better understand nonpoint sources and how to manage them, and to refine
existing water quality and hydrologic/hydraulic models. These models will serve as the basis for
future planning and regulatory decisions in the basin.
The purpose of this assessment is to evaluate the data collected and determine whether they meet
the quality objectives outlined in the Lower Merrimack River Quality Assurance Project Plan (QAPP),
revised December 2014. This report details the quality assurance/quality control (QA/QC) activities
conducted, describes the data verification, data validation and data usability review, and summarizes
the review results for all Phase III sampling events.

2-1
Section 2
Usability Summary
Samples were collected and analyzed in accordance with the work plan except for some field changes
enacted during the investigations. These changes and deviations did not negatively impact the
usability of the data and are discussed in Section 2 of the Lower Merrimack River Study Monitoring
Report. The sampling deviations did not affect project goals.
The data reported in this usability report is usable as reported with the data validation qualifiers
added. No analytical sample results were rejected.

3-1
Section 3
Quality Assurance Objectives
QA objectives for measuring data are expressed in terms of precision, accuracy, representativeness,
comparability, completeness, and sensitivity (PARCCS). The QA objectives provide a mechanism for
ongoing control and evaluating and measuring data quality throughout the project.
A review of the collected data is necessary in order to identify if data measurement objectives
established in the seven-step data quality objective (DQO) process have been met. In general the
following data measurement objectives were considered:
� Specification of particular analytical method and reporting detection limit requirements
� Identification of the appropriate laboratory analytical QC requirements
� Verify if appropriate levels of other PARCCS criteria for the data has been met
� Delineation of specific sample-handling issues or other project-specific issues
The data validation review of the QA objectives verifies if the collected data are of sufficient quality to
support their intended use.
4-1
Section 4
Summary of Field and Laboratory QA Activities
CDM Smith performed sampling for one dry weather mainstem event in June 2014, one wet weather
mainstem event in October 2015, one dry weather key tributary event in July 2016, and one hybrid
dry/wet weather mainstem event in August 2016. Specific sampling details are presented in Section 2
of the Lower Merrimack River Study Monitoring Report.
CDM Smith completed all sampling activities in accordance with the approved QAPP. Samples were
collected and shipped to University of Massachusetts University Laboratory, School for Marine Science
and Technology at UMASS-Dartmouth (SMAST) and Eastern Analytical, Inc. (EAI) of Concord, New
Hampshire. The QAPP and associated attachments defined the procedures to be followed and the
data quality requirements for the field program.
4.1 Deviations from Field Procedures Due to conditions encountered in the field, some deviations were made from the QAPP during the
fieldwork portion of the sampling events. Specific deviations are discussed in Section 2 of the Lower
Merrimack River Study Monitoring Report.
None of the deviations compromised the quality of the data.
4.2 Field and Analytical QA/QC QC samples such as field blanks, equipment rinsate blanks and field duplicates were collected at the
frequency described in the QAPP to determine the quality of the field data.
Field QA/QC objectives were accomplished through the use of appropriate sampling techniques and
collection of field duplicates and rinsate blanks.
As detailed in Attachment 1, analytical QC data (such as calibrations, method blanks, spike recoveries,
etc.) were not provided for independent verification for a majority of sample analyses. Method blanks
were provided by EAI for non-bacterial analyses, and laboratory control samples (LCS) and LCS
duplicates were provided for CBOD5, CBOD20 (select events only), and Total Suspended Solids (TSS). A
laboratory duplicate was provided for the select chlorophyll-a results. Otherwise, the laboratory
indicated if there were any quality issues with the data and those have been addressed in this report.

Section 4 • Summary of Field and Laboratory QA Activities
4-2
4.3 Laboratory Methods Samples were analyzed using the following methods:
Parameter Method Description
Alkalinity SM 2320B- Titration (f)
Ammonia Nitrogen (NH4) SM 4500 NH3D- Phenate Method (b)
5-day Carbonaceous Biological
Oxygen Demand (CBOD5)
SM5210B-01- incubation and DO measurement
20-day Carbonaceous Biological
Oxygen Demand (CB0D20)
SM5210B-01- incubation and DO measurement
Chlorophyll-a SM 10200H
C/N (Carbon to Nitrogen Ratio) Ratio: Moles of POC/moles of PON
Conductivity Field measurement with YSI
Dissolved Inorganic Nitrogen (DIN) Sum of ammonia nitrogen and nitrate + nitrite
Dissolved Organic Nitrogen (DON) SM 4500 NO3 F- Persulfate Digest & Automated Cadmium
Reduction Method (a, c)
Dissolved Oxygen (DO) Winkler DO- Potentiometric autotitrator; Field
measurement with YSI
Enterococcus ASTM D6503
Escherichia coli (E. Coli) SM 9223B
Fecal Coliform SM 9223B C18 QT
Field Dissolved Oxygen Percent Field measurement with YSI
Nitrate + Nitrite (NOX) SM 4500 NO3 F- Automated Cadmium Reduction Method
(a)
Orthophosphate (PO4) SM 4500 PE- Ascorbic Acid Method (d)
Particulate Organic Carbon (POC) Elemental analysis (e)
Particulate Organic Nitrogen (PON) Elemental analysis (e)
pH Field measurement with YSI
Salinity Field measurement with YSI
Specific Conductivity Field measurement with YSI
Temperature Field measurement with YSI
Total Dissolved Nitrogen (TDN) SM 4500 NO3 F- Persulfate Digest & Automated Cadmium
Reduction Method (a, c,)
Total Kjeldhal Nitrogen (TKN) Sum of ammonium and total organic nitrogen
Total Nitrogen (TN) Post-analytical calculation
Total Phosphorus (TP) SM 4500 PE- Persulfate Method (a, c, d)
Total Suspended Solids (TSS) SM 2540D-97
Turbidity Field measurement with HACH kit
a. QuikChem Method 10-107-04-1-J (0-700uM) and 31-107-04-1-C (0-50 and 0-10uM)
Zellweger Analytics, Lachat Instruments Division, Milwaukee, WI USA.
Quik Chem method based upon the following techniques:

Section 4 • Summary of Field and Laboratory QA Activities
4-3
Method 4500-NO3- F. Automated Cadmium Reduction Method, Standard Methods
Wood, E., F. Armstrong and F. Richards. 1967. Determination of nitrate in sea water by
cadmium copper reduction to nitrite. J. Mar. Biol. Ass. U.K. 47:23-31.
Bendschneider, K. and R. Robinson. 1952. A new spectrophotometric method for the
determination of nitrite in sea water. J. Mar. Res. 11: 87-96.
b. Ammonia method based upon the following techniques:
Scheiner, D. 1976. Determination of ammonia and Kjeldahl nitrogen by indophenol method.
Water Resources 10: 31-36.
Method 4500-NH3 D. Phenate Method, Standard Methods.
c. D'Elia, C.F., P.A. Stuedler and N. Corwin. 1977. Determination of total nitrogen in aqueous
samples using persulfate digestion. Limnol. Oceanogr. 22: 760-764.
d. Murphy, J. and J.Riley. 1962. A modified single solution method for the determination of
phosphate in natural waters. Analytical Chimica Acta 27:31-36.
Method 4500-P E. Ascorbic Acid Method, Standard Methods.
e. Perkin-Elmer Model 2400 CHN Elemental Analyzer Technical Manual.
f. Method 2320 Alkalinity, Standard Methods
Hach alkalinity Titration Kit, Digital Titrator Model 16900-01
It should be noted that there were minor variations in the analytical method used versus those listed
in the QAPP, as follows:
� DON via SM 4500 NO3 F, versus SM 4500 N-org as listed in the QAPP;
� Fecal coliform via SM 9223B C18 QT, versus SM9221 as listed in the QAPP;
� NOX via SM 4500 NO3 F, versus EPA 353.2 as listed in the QAPP;
� PO4 via SM 4500 PE, versus EPA 300.1 as listed in the QAPP; and,
� POC and PON via elemental analysis, versus EPA 440.0 as listed in the QAPP.
Regardless, all the methods used for these sampling events met project objectives as specified in the
QAPP.

5-1
Section 5
Data Review Procedures
Data review was conducted by qualified CDM Smith data validators. Where specific guidance was not
available, the data was evaluated in a conservative manner consistent with industry standards using
professional experience. To the extent possible the data were reviewed and data qualifiers were
added in accordance with the following documents, as applicable for each method.
� U.S Environmental Protection Agency (EPA) National Functional Guidelines for Inorganic
Superfund Data Validation, August 2014;
� EPA SW 846, Third Edition, Test Methods for Evaluating Solid Waste, update1, July 1992; update
IIA, August 1993; update II, September 1994; update IIB, January 1995; update III, December
1996; and
� Standard Methods for the Examination of Water and Wastewater, 21st Edition, American Public
Health Association 2005.
The data review narratives indicate that the sample analyses generally met the QC criteria cited in the
methods. Results associated with QC outliers were qualified by the data validators.
5.1 Qualifier Definitions The following definitions provide explanations of the qualifiers assigned to results in the data review
process.
J Estimated data due to exceeded quality control criteria.
U Analyte was analyzed for but not detected.
UJ Nondetect result is estimated due to exceeded quality control criteria.
R Data is rejected.
ND Non-detect (used by the laboratories for this project)

6-1
Section 6
Data Quality Indicators
Data Quality Indicators (DQI) criteria were established to ensure precision, accuracy,
representativeness, comparability, completeness, and sensitivity of analysis for the analytical fractions
and for the media sampled. Analytical QC procedures are detailed in the most current revisions of SW-
846 methodologies and laboratory specific criteria. Analytical precision, accuracy, and sensitivity DQIs
required for this project are provided in the laboratory SOWs.
The DQIs provide a mechanism for ongoing control, to evaluate and measure data quality throughout
the project. These criteria are defined in the sections below. Individual sample delivery group (SDGs)
validation reports with specific sample detail are provided in Attachment 1.
6.1 Precision Precision is a quantitative term that estimates the reproducibility of a set of replicate measurements
under a given set of conditions. It is defined as a measurement of mutual agreement between
measurements of the same property, and is expressed in terms of relative percent difference (RPD)
between duplicate determinations.
RPD is calculated as follows:
RPD = absolute value [(C1-C2)/{(C1+C2)/2)}] x 100 percent
Where: C1 = Concentration of split sample #1
C2 = Concentration of split sample #2
Laboratory analytical precision for the reported data is determined by review of the laboratory
duplicate results. Field duplicate precision is determined by review of field duplicate results. As
stated previously, laboratory analytical precision QC was not provided by the laboratories for Event
#1-Dry Weather (June 2014); however one laboratory duplicate sample for chlorophyll-a was provided
for Event #2- Wet Weather (October 2015) and Tributary Event #1 – Dry Weather (July 2016), and six
laboratory duplicate samples, two for each CBOD, CB0D-5 and chlorophyll-a were provided for Event
#3 – Dry/Wet Weather (August 2016). Four field duplicate samples were collected for Event #1-Dry
Weather (June 2014) data set; five field duplicate samples were collected for the Event #2- Wet
Weather (October 2015); five field duplicate samples were collected for the Event #3-Dry/Wet
Weather (August 2016) ; and 3 field duplicate samples were collected for Tributary Event #1 – Dry
Weather (July 2016)
Analytical precision cannot be determined if one of the reported values is less than the reporting limit
(nondetect). Therefore when an analyte is not detected in both the parent and duplicate sample, the
RPD result is reported as not calculable (NC). When one concentration is above and one below the
reporting limit, the criteria used is that the detected result must be less than two times the reporting
limit of the nondetect sample.

Section 6 • Data Quality Indicators
6-2
The field duplicate RPD criterion is 30 percent and the laboratory duplicate RPD criterion is 20
percent. Duplicate results for concentrations close to the detection limits are reviewed based on their
absolute differences as compared to their respective quantitation limit values. When the analyte
concentration is less than 5 times the reporting limit in either sample, the criteria used is the absolute
difference between the two values which should be less than the reporting limit.
The field duplicate RPD results are as follows:
Mainstem Event #1 (Dry Weather)- June 2014 Data
One field duplicate pair analyzed for chlorophyll-a (M-024D-G-EVENT1/ DUP4-D-EVENT1) had an RPD
above the 30 percent criteria at 135 percent. These chlorophyll-a results were qualified as estimated
“J” for the duplicate sample and parent sample. Note, this qualification is based on the revised result
for the parent sample due to pheophytin interferences.
Two field duplicate pairs analyzed for dissolved organic nitrogen (DON) (M004-G-EVENT1/ DUP1-D-
EVENT1 and M010-G-EVENT 1/ DUP2-D-EVENT1) had RPDs above the 30 percent criteria at 34.0
percent AND 30.9 percent, respectively. These DON results were qualified as estimated “J” for the
duplicate sample and parent sample.
One field duplicate pair analyzed for E. coli (M-024D-G-EVENT1/ DUP4-D-EVENT1) had an RPD above
the 30 percent criteria at 44.6 percent. These E. coli results were qualified as estimated “J” for the
duplicate sample and parent sample.
One field duplicate pair analyzed for orthophosphate (PO4) (M010-G-EVENT 1/ DUP2-D-EVENT1) had
an RPD above the 30 percent criteria at 37.7 percent. These PO4 results were qualified as estimated
“J” for the duplicate sample and parent sample.
Two field duplicate pairs analyzed for particulate organic nitrogen (PON) (M010-G-EVENT 1/ DUP2-D-
EVENT1 and T010-G-EVENT 1/ DUP3-D-EVENT1) had RPDs above the 30 percent criteria at 49.8
percent AND 73.7 percent, respectively. These PON results were qualified as estimated “J” for the
duplicate sample and parent sample.
Carbon to nitrogen (C/N) ratio was calculated by the laboratory for two field duplicate pairs (M010-G-
EVENT1/ DUP2-D-EVENT1 and T010-G-EVENT 1/ DUP3-D-EVENT1), which had RPDs above the 30
percent criteria at 53.5 percent AND 72.3 percent, respectively. It should be noted that these data
points are a ratio of POC to PON molar results rather than straight analytical results, and that PON
results for these duplicate pairs were already qualified above. These C/N ratio results were qualified
as estimated “J” for the duplicate sample and parent sample; however the qualification is considered
conservative since PON results were already qualified.
One field duplicate pair analyzed for TSS (M-024D-G-EVENT1/ DUP4-D-EVENT1) had an RPD above the
30 percent criteria at 33.3. These TSS results were qualified as estimated “J” for the duplicate sample
and parent sample.
All other RPD results were within criteria, and all results are considered usable. The attached data
validation reports in Attachment 1 detail these results.
Section 6 • Data Quality Indicators
6-3
Mainstem Event #2 (Wet Weather)- October 2015 Data
One field duplicate pair analyzed for ammonia (M004D-G-EVENT2/M004-D-EVENT2) had an RPD
above the 30 percent criteria at 32.6 percent. These ammonia results were qualified as estimated “J”
for the duplicate sample and parent sample.
One field duplicate pair analyzed for TSS (M004D-G-EVENT2/M004-D-EVENT2) had an RPD above the
30 percent criteria at 31.6 percent. These TSS results were qualified as estimated “J” for the duplicate
sample and parent sample.
Dissolved oxygen was measured in the field for all stations and analyzed for select samples by the
laboratory via the Winkler method. An additional calculation was performed on the Winkler result to
determine percent saturation. One field/laboratory duplicate pair analyzed for dissolved oxygen
[M001-F-EVENT2 (Field)/M001-G-EVENT2 (Winkler)] had an RPD above the 30 percent criteria at 130.2
percent and 130.3 percent, respectively for concentration and saturation. While it is suspected that
the Winkler result may be an outlier based on the low concentration reported as compared to results
at nearby sampling stations, dissolved oxygen results were qualified as estimated “J” for both the field
and laboratory samples as a conservative measure.
All other RPD results were within criteria, and all results are considered usable. The attached data
validation reports in Attachment 1 detail these results.
Mainstem Event #3 (Dry/Wet Weather)- August 2016 Data
One field duplicate pair analyzed for ammonia (O002D-G-EVENT3/DUP2-D-EVENT3) had an RPD above
the 30 percent criteria at 46.41 percent. These ammonia results were qualified as estimated “J” for
the duplicate sample and parent sample.
One field duplicate pair analyzed for particulate organic carbon (T010-G-EVENT3/DUP3-D-EVENT3)
had an RPD above the 30 percent criteria at 58.59 percent. These particulate organic carbon results
were qualified as estimated “J” for the duplicate sample and parent sample.
Two field duplicate pairs analyzed for particulate organic nitrogen (T010-G-EVENT3/DUP3-D-EVENT3
and M016D-C-EVENT3/DUP5-D-EVENT3) had RPDs above the 30 percent criteria at 38.91 percent and
36.15 percent, respectively. These particulate organic nitrogen results were qualified as estimated “J”
for the duplicate samples and parent samples.
One field duplicate pair analyzed for fecal coliform (M024D-G-EVENT3/DUP4-D-EVENT3) had an RPD
above the 30 percent criteria at 60.22 percent. These fecal coliform results were qualified as
estimated “J” for the duplicate sample and parent sample.
Two field duplicate pairs analyzed for dissolved organic nitrogen (M024D-C-EVENT3/DUP4-D-EVENT3
and M016D-C-EVENT3/DUP5-D-EVENT3) had RPDs above the 30 percent criteria at 113.32 percent
and 75.03 percent, respectively. These dissolved organic nitrogen results were qualified as estimated
“J” for the duplicate samples and parent samples.
Two field duplicate pairs analyzed for total organic nitrogen (M024D-C-EVENT3/DUP4-D-EVENT3 and
M016D-C-EVENT3/DUP5-D-EVENT3) had RPDs above the 30 percent criteria at 48.29 percent and

Section 6 • Data Quality Indicators
6-4
51.32 percent, respectively. These total organic nitrogen results were qualified as estimated “J” for
the duplicate samples and parent samples.
One field duplicate pair analyzed for TSS (M016D-C-EVENT3/DUP5-D-EVENT3) had an RPD above the
30 percent criteria at 51.85 percent. These TSS results were qualified as estimated “J” for the
duplicate sample and parent sample.
One field duplicate pair analyzed for CBOD5 (M016D-C-EVENT3/DUP5-D-EVENT3) had an RPD above
the 30 percent criteria at 46.15 percent. These CBOD5 results were qualified as estimated “J” for the
duplicate sample and parent sample.
One field duplicate pair analyzed for nitrates (M016D-C-EVENT3/DUP5-D-EVENT3) had an RPD above
the 30 percent criteria at 40.98 percent. These nitrates results were qualified as estimated “J” for the
duplicate sample and parent sample.
Dissolved oxygen was measured in the field for all stations and analyzed for select samples by the
laboratory via the Winkler method. An additional calculation was performed on the Winkler result to
determine percent saturation. During the August 2016 event, one team (Boat Team 1) collected
Winkler samples at two samples on their stretch of the river, and both of these samples demonstrated
variability when compared to the field readings. The field/laboratory duplicate pairs analyzed for
dissolved oxygen [M001-F-EVENT3 (Field)/M001-G-EVENT3 (Winkler) and M004-F-EVENT3
(Field)/M001-G-EVENT3 (Winkler] had an RPD above the 30 percent criteria at 34.6 percent/35.7
percent and 40.1 percent/ 40.7 percent, respectively for concentration and saturation. While all
individual results are within acceptable ranges and some variability is expected, dissolved oxygen
concentration and percent saturation results were qualified as estimated “J” for all field and
laboratory samples collected by Boat 1 as a conservative measure (Stations M001, M002, M003, M004,
M006D, O001U, O001D, O003U, and O003D).
All other RPD results were within criteria, and all results are considered usable. The attached data
validation reports in Attachment 1 detail these results.
Tributary Event #1 (Dry Weather)- July 2016 Data
One field duplicate pair analyzed for chlorophyll-a (Shawsheen6-G-EVENT1/ DUP3-D-EVENT1) had an
RPD above the 30 percent criteria at 108.4 percent. These CHLA results were qualified as estimated “J”
for the duplicate sample and parent sample.
Two field duplicate pair analyzed for E. coli (Spicket5-G-EVENT1/ DUP5-D-EVENT1 and Shawsheen6-G-
EVENT1/ DUP3-D-EVENT1) had an RPD above the 30 percent criteria at 80.9 percent AND 55.6
percent, respectively. These E. coli results were qualified as estimated “J” for the duplicate sample and
parent sample.
Two field duplicate pair analyzed for Fecal Coliform (Spicket5-G-EVENT1/ DUP5-D-EVENT1 and
Shawsheen6-G-EVENT1/ DUP3-D-EVENT1) had an RPD above the 30 percent criteria at 58.8 percent
AND 117.6 percent, respectively. These Fecal Coliform results were qualified as estimated “J” for the
duplicate sample and parent sample.

Section 6 • Data Quality Indicators
6-5
One field duplicate pair analyzed for CBOD-20 (Concord5D-C-EVENT1/ DUP1-D-EVENT1) had an RPD
above the 30 percent criteria at 31.6 percent. These CBOD-20 results were qualified as estimated “J”
for the duplicate sample and parent sample.
All other RPD results were within criteria, and all results are considered usable. The attached data
validation reports in Attachment 1 detail these results.
Reporting Limits
It is important to note that reporting limits for all parameters during all events were very low (by most
analytical laboratory standards) and all results were within the same order of magnitude. Very low
reporting limits are needed to generate results that are useful for modeling. If many results are
reported as “non-detect,” it is difficult to know if the models are representing the water quality within
a reasonable range. As discussed with the laboratory, the differences in parent and duplicate samples
are most likely due to an increased margin of error with concentrations that low and so close to the
reporting limit. As a result, all results are considered acceptable and no rejection of data is required.
6.2 Accuracy Accuracy is the degree of agreement of a measurement with an accepted reference or true value, and
is a measure of the bias in a system. Accuracy of the laboratory data was assessed by comparing LCS
recovery, MS recovery, and other applicable laboratory QC. Accuracy is expressed as a percent
recovery, which was calculated by:
The EAI laboratory reports 133001, 148530, 148531, 159240, 159241, 159348, and 158501 included
LCS and LCS duplicate samples for TSS and CBOD5. Additionally, 148530, 148531, 159240, 159241,
159348, and 158501 included LCS and LCS duplicate samples for CBOD20. According to the QAPP, the
percent recovery criteria range is between 80 and 100 percent, and the RPD between the LCS and
LCSD results must be less than 20 percent. The acceptable percent recovery criteria established by
the laboratory was slightly different. The LCS/LCSD percent recoveries and RPDs were within all
applicable criteria.
Accuracy based on LCS/LCSD percent recoveries and RPDs could not be evaluated based on the
analytical data received from EAI for other analyses including bacteria, CBOD20 (2014), and
chlorophyll-a, or based on the analytical data from SMAST.
Accuracy of field measurements was assessed by comparing readings to the expected range for each
parameter. With the exception of turbidity during Mainstem Event #1-Dry Weather (June 2014), all
results were within acceptable ranges. Initial and final field turbidity readings from the June 2014
event were slightly below the acceptable range for select stations, with readings ranging from -1.90
NTU to -7.40 NTU. The negative results were rejected. The turbidity readings during Mainstem Event
#2-Wet Weather (October 2015), Mainstem Event #3 Event- Dry/Wet Weather (August 2016), and
Tributary Event #1 – Dry Weather (July 2016) were all within the acceptable range. While some field
Added Analyte
PresentOriginally AnalyteFound Analyte TotalcoveryPercent Re
100)( ×−=

Section 6 • Data Quality Indicators
6-6
readings during these events were slightly outside of the ranges typically observed, all results were
within acceptable levels and no qualification was required.
Sample Preservation and Holding Times
Sample preservation, handling, and holding times are evaluated during the validation process. All
holding times were met for the June 2014 Dry Weather Event #1 data set. All samples collected on the
day of sampling were preserved on ice during sampling and transportation. This was confirmed by the
sample conditions page in EAI report 133000, which stated that samples adhered to the lab's sample
acceptance policy and were received on ice. There are 11 samples that were reported as being
received between 10.2°C and 11°C. All of these samples were collected between 6:15 am and 8:30 am,
and were in transit to the lab by 9:45 am. It is estimated that all of these samples were in laboratory
custody within 2 to 4.5 hours after sample collection, and any temperature impacts during that brief
time period would be minimal. It is suspected that the warmers temperatures measured at receipt
may be a result of consolidation of sample bottles into fewer coolers to facilitate transportation and
the time required for that cooler's temperature to fully acclimate. It should also be noted that EAI
recommends that the acceptable temperature range is 0-6°C; however, 9223B C18 QT (Colilert-18/
Quanti Tray) indicates that temperatures less than 10°C for fecal coliform samples are acceptable.
Though some temperatures were above the maximum recommended temperatures, the
temperatures were not considered grossly outside of the guidance temperature range and samples
were consistently preserved on ice, and therefore no qualifiers were applied.
During the October 2015 mainstem wet weather event, all samples except the Merrimac MA WWTP
Effluent 1 CBOD5 and CBOD20 samples and reanalyzed M027-G-EVENT2 enterococcus sample were
analyzed within their respective hold times. The Merrimac MA WWTP Effluent 1 sample was analyzed
for CBOD and CBOD20 50 hours and 45 minutes after sampling, which is 2 hours and 45 minutes past
the hold time of 48 hours. The M027-G-EVENT2 enterococcus sample was diluted and re-analyzed just
outside the hold time of 8 hours (8 hours and 54 minutes after sample collection). These hold time
exceedances have been evaluated to be insignificant, and since no samples were analyzed grossly
outside their hold times, no qualifiers were applied.
All holding times and preservation requirements were met for the July 2016 Dry Weather Tributary
Event #1 data set, as well as August 2016 Dry/Wet Weather Event #3 data set
6.3 Blank Contamination As stated in the field sampling plan, rinsate blanks were to be prepared and submitted for analysis
with primary samples. The field blanks and equipment rinsate blanks consisted of distilled water.
Similarly, a laboratory blank is a water sample free of any known contaminants that is used to
determine if any contamination occurred during the analytical process.
The field blank samples were prepared from distilled water. The individual sample bottles were filled
at the sampling location with distilled water. The rinsate blank samples were prepared with distilled
water that was passed over the decontaminated sampling equipment and transferred to the
appropriate sample bottles.
Field, equipment, and laboratory blank results are summarized below:

Section 6 • Data Quality Indicators
6-7
Mainstem Event #1 (Dry Weather)- June 2014 Data
A select few field and equipment blanks had concentrations greater than sample results at respective
river stations. No qualifiers were applied to sample results based on field blank results but the data
user should note that some of the field blank samples had minor contamination. Of note were the
ammonia concentrations in field blank samples. Field blank samples were prepared by multiple land
and boat sampling crews at various sample stations by pouring distilled water directly into the sample
bottle. The purpose of these field blanks is to assess potential contamination from field conditions
during sampling or from the laboratory during the analytical process. It was observed that all
ammonia field blanks had relatively comparable concentrations above the reporting limit, and in one
suspect instance above its respective river station result. It is important to recognize that the
laboratory was able to meet very low reporting limits, and thus able to report trace concentrations of
ammonia in the blank samples.
In order to determine if the source of ammonia in these blanks was due to contamination from
ambient conditions on the day of sampling, sample bottles, the distilled water itself, or the analytical
process, additional field blank samples were analyzed by SMAST in February 2015. Three field blanks
were prepared at CDM Smith’s sample room using bottles from SMAST and one bottle from an
additional laboratory. Distilled water was filtered and poured directly into sample bottles.
Additionally, SMAST prepared a blank using their own high quality water source, and prepared a
standard sample with a known concentration of ammonia. Results from this additional analysis
indicated that field blank concentrations were slightly higher or on the same order of magnitude as
concentrations observed during the June 2014 blanks. Although lower than results from CDM Smith’s
supplied blank samples, the laboratory also reported concentrations in their blank water source
comparable to those observed during the June 2014 round. As a result, it is believed that the trace
concentrations observed in the field blanks during the June 2014 event are not significant. The June
2014 concentrations are likely due to the sources of distilled water rather than ambient conditions,
bottle source, deviations in the sampling plan, or laboratory contamination. Field blank audit results
from June 2014 and February 2015 are included in Attachment 2.
As the field blank audit samples indicated that the source of ammonia in field blanks is due to the
distilled water source, CDM Smith used professional judgment in qualifying associated results. Since
distilled water was used for both the field blank and equipment rinsate blank samples, it was
determined that the rinsate blank results are biased high and should be adjusted based on the
ammonia field blank results for each respective team. As a result, all ammonia rinsate blank
concentrations were below analytical results for the respective team, indicating that proper
equipment decontamination was performed.
Since the data is being used to establish a general characterization of the water quality and is not
intended as a regulatory determination of compliance, all data is considered usable despite the minor
contamination in the blank samples. Laboratory blanks were nondetect for those parameters
analyzed. Thus, for the purposes of the Lower Merrimack River Study, blank contamination does not
violate the data quality objectives. Specific details of blank concentrations are presented in
Attachment 1.

Section 6 • Data Quality Indicators
6-8
Mainstem Event #2 (Wet Weather)- October 2015 Data
A select few field and equipment blanks had concentrations greater than sample results at respective
river stations. One field blank and two equipment rinsate blanks had results that exceeded the results
of the samples collected by their corresponding land or boat sampling crews. In two of those three
samples, ammonia was the analyte in question. As was the case with the June 2014 data, the source
of ammonia in the field and equipment blanks is considered to be the distilled water rather than
ambient conditions, deviations in the sampling plan, or laboratory contamination. Since the same
distilled water was used for both the field blank and equipment rinsate blank samples, it was
determined that the rinsate blank results are biased high and should be adjusted based on the
ammonia field blank results for each respective team. As a result, all ammonia rinsate blank
concentrations were below reporting limits and/or below concentrations for the respective team,
indicating that proper equipment decontamination was performed. As such, no qualifiers were
applied to sample results based on field or equipment blank results due to the assumed
contamination of the source.
Since the data is being used to establish a general characterization of the water quality and is not
intended as a regulatory determination of compliance, all data is considered usable despite the minor
contamination in the blank samples. Laboratory blanks were nondetect for those parameters
analyzed. Thus, for the purposes of the Lower Merrimack River Study, blank contamination does not
violate the data quality objectives. Specific details of blank concentrations are presented in
Attachment 1.
Mainstem Event #3 (Dry/Wet Weather)- August 2016 Data
A select few field and equipment blanks had concentrations greater than sample results at respective
river stations. No qualifiers were applied to sample results based on field blank results but the data
user should note that some of the field blank samples had minor contamination. Similar to 2014 and
2015 results, of note were the ammonia concentrations in field blank samples. Field blank samples
were prepared by multiple land and boat sampling crews at various sample stations by pouring
distilled water directly into the sample bottle. It is important to recognize that the laboratory was able
to meet very low reporting limits, and thus able to report trace concentrations of ammonia in the
blank samples. As a result, it is believed that the trace concentrations observed in the field blanks
during the August 2016 event are not significant. The August 2016 concentrations are likely due to the
sources of distilled water rather than ambient conditions, bottle source, deviations in the sampling
plan, or laboratory contamination. Field blank audit results from June 2014 and February 2015 are
included in Attachment 2.
Since distilled water was used for both the field blank and equipment rinsate blank samples, it was
determined that the rinsate blank results are biased high and should be adjusted based on the
ammonia field blank results for each respective team. As a result, most ammonia rinsate blank
concentrations were at or below analytical results for the respective team with the exception of Land
Team 1 samples, indicating that proper equipment decontamination was performed. While the Land
Team 1 equipment rinsate blank was relatively higher than the others, this result and associated
sample results are still considered low-level and over an order of magnitude below any regulatory
thresholds, and no qualifiers were applied. Also, since the data is being used to establish a general
Section 6 Data Quality Indicators
6‐9
characterization of the water quality and is not intended as a regulatory determination of compliance,
all data is considered usable despite the minor contamination in the blank samples. Laboratory blanks
were nondetect for those parameters analyzed. Thus, for the purposes of the Lower Merrimack River
Study, blank contamination does not violate the data quality objectives. Specific details of blank
concentrations are presented in Attachment 1.
Tributary Event #1 (Dry Weather)‐ July 2016 Data A select few field and equipment blanks had concentrations greater than sample results at respective
river stations. Not including NH4 results which are addressed below, three field blank results and
three equipment rinsate blank results exceeded the results of the samples collected by their
corresponding land or boat sampling crews.
As was the case with all other events, the source of ammonia in the field and equipment blanks is
considered to be the distilled water rather than ambient conditions, deviations in the sampling plan,
or laboratory contamination. Since the same distilled water was used for both the field blank and
equipment rinsate blank samples, it was determined that the rinsate blank results are biased high and
should be adjusted based on the ammonia field blank results for each respective team. As a result,
most ammonia rinsate blank concentrations were at or below concentrations for the respective team,
with the exception of Boat Team 1, indicating that proper equipment decontamination was
performed. While the Boat Team 1 equipment rinsate blank was relatively higher than the others, this
result and associated sample results are still considered low‐level and over an order of magnitude
below any regulatory thresholds, and no qualifiers were applied.
Since the data is being used to establish a general characterization of the water quality and is not
intended as a regulatory determination of compliance, all data is considered usable despite the minor
contamination in the blank samples. Laboratory blanks were nondetect for those parameters
analyzed. Thus, for the purposes of the Lower Merrimack River Study, blank contamination does not
violate the data quality objectives. Specific details of blank concentrations are presented in
Attachment 1.

7-1
Section 7
Representativeness, Comparability, and Sensitivity
Representativeness and comparability are achieved by using approved, documented sampling
procedures and analytical methodologies. By following the approved QAPP, sampling events should
yield results representative of environmental conditions at the time of sampling. Similarly, reasonable
comparability of analytical results for this, and future sampling events, can be achieved if the same
approved analytical methods and sampling procedures are employed.
A review of reported sample result detection limits compared to the QAPP requirements ensures the
collected data meets project objectives for sensitivity.
7.1 Representativeness Representativeness is a qualitative term that expresses the degree to which the sample data
accurately and precisely represent the environmental conditions corresponding to the location and
depth interval of sample collection. Requirements and procedures for sample collection and analysis
are designed to maximize sample representativeness.
Representativeness can be monitored by reviewing field documentation and/or by performing field
audits. Chain of custodies and field notes were reviewed by the field team leader for the dry weather
sampling event. The field team leader also performed audits of the sampling activities including
checking paperwork and sampling methods.
Field sampling accuracy was attained through strict adherence to the approved final work plan and by
using approved analytical methods for sample analyses. Based on this, the data should represent as
near as possible the actual field conditions at the time of the sampling.
All analytical methods used by the laboratory were acceptable. It should be noted, however, that EAI
inadvertently provided the incorrect analytical method for chlorophyll-a in laboratory reports 133001
and 148529. The method used consistently was Standard Method 10200H (2c)(1b), “Determination of
chlorophyll-a ,b, and c (trichromatic method)”, which is a type of spectrophotometric method. The
laboratory reports were reissued with the correct method references.
In the original report for 133001, the laboratory indicated the chlorophyll-a results for six samples
collected during the June 2014 event may have been biased high due to the presence of pheophytin,
as detailed in Attachment 1. Pheophytin is a degradation product of chlorophyll-a. Therefore, the
potentially high biased data may not have been entirely representative of chlorophyll-a conditions at
those stations. Based on further discussion later in the Study, EAI determined it was appropriate to
adjust the concentrations of these six results in 133001 (June 2014 event), plus 30 samples in 148529
(October 2015 event) and 2 samples in 159241 (August 2016 event) to account for pheophytin
interferences. Adjustments were only possible in samples that could be acidified. Acidification to
determine pheophytin interference is not a step in the 10200H (2c) method; however, EAI’s internal
SOP does state that samples that have absorbances between 0.1 and 1.0nm should be acidified and,

Section 7 • Representativeness, Comparability, and Sensitivity
7-2
based on a calculated ratio, the report should be footnoted if interference is present. This step goes a
little beyond what is required in section (2c) of the referenced Standard Method, and follows 10200
(H)(2b) which is the spectrophotometric determination of Chlorophyll-a in the presence of
pheophytin. EAI indicated that they did not originally footnote it on several reports when there might
have been an interference. They further indicated that while not required by the standard method,
acidified data was available for select samples that had absorbances between 0.1 and 1.0nm that
would allow calculation of chlorophyll-a minus any interference from pheophytin on these samples.
Calculations for pheophytin interference cannot be done on samples that were not acidified. EAI
reissued lab reports 133001, 148529, and 159241 with the adjusted chlorophyll-a results, ultimately
resulting in an average decrease of approximately 45% (See Attachment 1). No qualifiers were applied
by CDM Smith since these adjusted results are considered to be accurate and representative of
chlorophyll-a concentrations in the river at those locations.
E.coli are an integral part of the Fecal coliform group, as are Klebsiella and other bacteria. There are
many different strains of E.coli, and some are less tolerant to higher temperatures than
others. Laboratories are limited by EPA's SOPs as to what temperatures and media may be used for
analysis. As such, E.coli must be incubated at 35°C and Fecal Coliform at 44.5 °C. Both tests use the
same method and media except for the incubation temperature. For multiple reports, the laboratory
indicated that some E. coli species were less tolerant to the higher temperatures required by the Fecal
Coliform test resulting in Fecal Coliform results less than E. coli results. When the E.coli is higher than
the Fecal Coliform it means that at 35 ° C E.coli was able to properly grow, but at 44.5°C it may have
died off, leading to lower Fecal numbers. Since the laboratory did not qualify these results in the
October 2015 and August 2016 rounds, no qualifiers will be applied to this data; however, it is
important to note that some Fecal Coliform results may be biased low.
By using EPA or applicable approved sampling procedures, analytical methodologies, and written
SOPs, as presented in the QAPP, these sampling events should yield results representative of
environmental conditions at the time of sampling.
Deviations to the planned sampling activities were minimal and did not compromise the quality of the
data to represent conditions within the project area. All analytical methods were acceptable.
Therefore, the data collected are suitable for a representative characterization of the project area.
7.2 Comparability Comparability is a qualitative term that expresses the confidence with which a data set can be
compared with another. Strict adherence to standard sample collection procedures, analytical
detection limits, and analytical methods assures that data are comparable. This comparability is
independent of laboratory personnel, data reviewers, or sampling personnel. Comparability criteria
are met for the project if, based on data review, the sample collection and analytical procedures are
determined to have been followed, or defined to show that variations did not affect the values
reported.
To ensure comparability of data generated for the site, standard sample collection procedures and
approved analytical methods were utilized by CDM Smith. Sample analyses were performed by the
subcontract laboratories using the equivalent methodology. Utilizing such procedures and methods
Section 7 • Representativeness, Comparability, and Sensitivity
7-3
enables the current data to be comparable with the previous data sets generated with similar
methods.
EAI noted that the analytical procedure for the enterococcus bacteria requires relatively low salinity
levels to avoid interference. Two select samples exceeded that salinity level for the October 2015
mainstem wet weather event. When a sample’s salinity is too high, the laboratory is required to dilute
the sample to normalize the salinity. One such sample was analyzed undiluted, and the enterococcus
result was qualified as estimated J, as presented in Attachment 1.
For the purposes of this data usability report, comparability has been met.
7.3 Sensitivity Sensitivity is related to the ability to compare analytical results with project-specific levels of interest,
such as delineation levels or action levels. Analytical quantitation limits for the various sample
analytes should be below the level of interest to allow an effective comparison.
Detection Limits
Each analytical method used during the monitoring sampling was chosen because it has a reporting
limit (RL) at or below the level of concern. For each analyte, the QAPP provided a RL that the
laboratory was to achieve to provide analytical results at or below regulatory comparison criteria.
The RL is generally equal to or greater than the method detection limit (MDL). The RLs are set above
MDLs to allow for sample matrix interferences and minimize false positives.
Development of the MDL is detailed in 40 CFR part 136 Appendix B as "the minimum concentration of
a substance that can be measured and reported with a 99 percent confidence that the analyte
concentration is greater than zero…" Generated by statistical analysis of multiple analyses of a low
level standard, MDLs represent the best fundamental measurement of instrument sensitivity and the
basis for establishing reporting limits.
Reporting limits are a compromise between analytical sensitivity and precision. Setting low RLs can
lead to poorly defensible data due to false positive (Type I) and/or false negative (Type II) errors,
whereas elevated RLs can hamper site characterization. Laboratory determinations of MDLs are
performed on non-typical samples (e.g., distilled water) leading to idealized limits. Confidence in
detection limits increases with instrument signal level above the MDL, and higher limits mean better
precision.
Laboratory results are reported according to rules that provide established certainty of detection and
reporting limits. The laboratory reported nondetect results as “false” or with a “<” sign indicating the
result is less than the reporting limit. Qualifying the result as an estimated concentration reflects
increased uncertainty in the reported value.
Detection limits were low enough to meet project objectives for all events.

Section 7 • Representativeness, Comparability, and Sensitivity
7-4
7.4 Data Completeness Completeness of the field program is defined as the percentage of samples planned for collection as
listed in the QAPP versus the actual samples collected during the field program (see equation A).
Completeness for acceptable data is defined as the percentage of acceptable data obtained judged to
be valid versus the total quantity of data generated (see equation B.) Acceptable data includes both
data which passes all the QC criteria (unqualified data) and data that may not pass all of the QC
criteria but had appropriate corrective actions taken (qualified but useable data).
A.
Where: C = actual number of samples collected
n = total number of samples planned
B.
Where: V = number of measurements judged valid
n' = total number of measurements made
Completeness goals for both the number of samples collected in the field and for sample results that
are usable for project decisions (not rejected and appropriately qualified if required) have been met
for both the wet and dry weather sampling events.
n
100CxssCompletene Field% =
n'
100VxssCompletene Analytical % =

8-1
Section 8
Assessment of Data Usability and Reconciliation
with QAPP Goals
For all wet weather and/or dry weather sampling events on the mainstem and key tributaries, minimal
qualifiers were applied due to field QC parameters. No qualifiers were applied to any data set due to
laboratory QC parameters. Laboratory QC parameters were not provided by the laboratories for all
parameters and hence were only able to be evaluated for select parameters. The field QC results
were overall within criteria and based on professional judgment the data sets from all sampling events
are usable for project decisions.

9-1
Section 9
References
CDM Smith Federal Programs. 2014. Merrimack River Watershed Assessment Study Phase III QAPP,
December 2014.
U.S Environmental Protection Agency (EPA) National Functional Guidelines for Inorganic Superfund
Data Validation, August 2014
SW 846, Third Edition, Test Methods for Evaluating Solid Waste, update1, July 1992; update IIA,
August 1993; update II, September 1994; update IIB, January 1995; update III, December 1996.
Standard Methods for the Examination of Water and Wastewater, 21st Edition, American Public
Health Association. 2005.

Attachment 1
Data Validation and Usability Report

Event 1 (Dry Weather Event)School for Marine Science and Technology at UMASS-Darmouth (SMAST)- Report CDM 2014Eastern Analytical Laboratory (EAI)- Reports 133000 & 133001R
Matrix: WaterCollection date: 6/25/2014
C/N - Carbon to Nitrogen Ratio NOX - Nitrates
CBOD20 - 20 day Carbonaceous Biological Oxygen Demand pH (Field reading)
CBOD5 - 5 day Carbonaceous Biological Oxygen Demand PO4 - Orthophosphates
CHLA - Chlorophyll-a POC - Particulate Organic Carbon
COND - Conductivity (Field reading) PON - Particulate Organic Nitrogen
DIN - Dissolved Inorganic Nitrogen Salinity (Field reading)
D.O. - Dissolved Oxygen (Winkler) Temperature (Field reading)
D.O. CONC - Field Dissolved Oxygen TDN -Total Dissolved Nitrogen
D.O. PERC - Field Dissolved Oxygen Percent TON - Total Organic Nitrogen
DON - Dissolved Organic Nitrogen TKN -Total Kjedhal Nitrogen
Ecoli TN - Total Nitrogen
Enterococci TP - Total Phosphorus
Fecal Coliform TSS - Total Suspended Solids
NH4 - Ammonium Turbidity (Field reading)
See Attached Sample Result Tables for the following:
Sampling Event 1 (Dry Weather Event)
Precision: Yes No N/A
Are the field duplicate relative percent differences (RPD) ≤ 30% for water or within CRQL criteria? No
Are the laboratory duplicate RPDs ≤ 20% for water or within CRQL criteria? N/A
N/A
Analyte RPD Qualifier
C/N 53.5% J
C/N 72.3% J
Chlorophyll-a 135.0% J
DON 34.0% J
DON 30.9% J
E. Coli 44.6% J
PO4 37.7% J
PON 49.8% J
PON 73.7% J
TSS 33.3% J
Accuracy: Yes No N/A
Was matrix spike criteria met (frequency 20% and % recovery 75-125%)? N/A
Was post digestion spike criteria met (if applicable)? N/A
Was laboratory control sample criteria met?
Was field blanks and rinsate blank criteria met? No
Yes (Only provided for EAI
report 133001)
N/A
All except turbidity
Attachment 1
Data Validation Worksheet
Laboratory:
Analysis/Methods:
Sample Event:
Lower Merrimack River Study
T010-G-EVENT1/DUP3-D-EVENT1
Field Duplicate Pairs
M024D-G-EVENT1/ DUP4-D-EVENT1
Samples in SDG:
Are the matrix spike duplicates RPD ≤ 20%?
Wet Chemistry Parameters
Reference Documents Used in Data Validation:
USEPA National Functional Guidelines for InorganicSuperfund Data Validation , August 2014; Quality Assurance Project
Plan (QAPP), CDM Smith, May 2014.
M024D-C-EVENT1/ DUP4-D-EVENT1
M024D-G-EVENT1/ DUP4-D-EVENT1 M024D-G-EVENT1/ DUP4-D-EVENT1
Comments (note deviations): All field duplicate RPD results were within criteria except for the analytes listed below. The
sample results for the parent sample and the field dupliate sample were qualified as estimated J.
Was laboratory blank criteria met (within control limits)?
M024D-G-EVENT1/ DUP4-D-EVENT1
M024D-C-EVENT1/ DUP4-D-EVENT1
Associated Samples
M010-G-EVENT1/ DUP2-D-EVENT1 M010-G-EVENT1/ DUP2-D-EVENT1
M010-G-EVENT1/ DUP2-D-EVENT1
T010-G-EVENT1/DUP3-D-EVENT1
Yes (Only provided for select
parameters in EAI report 133001)
M010-G-EVENT1/ DUP2-D-EVENT1
M010-G-EVENT1/ DUP2-D-EVENT1
T010-G-EVENT1/DUP3-D-EVENT1 T010-G-EVENT1/DUP3-D-EVENT1
M004-G-EVENT1/ DUP1-D-EVENT1
M010-G-EVENT1/ DUP2-D-EVENT1 M010-G-EVENT1/ DUP2-D-EVENT1
M010-G-EVENT1/ DUP2-D-EVENT1
M004-G-EVENT1/ DUP1-D-EVENT1
Were ICV/CCV % recoveries within 90-110%?
Comments (note deviations): Field blanks and field equipment blanks were collected. The majority of the blank concentrations
are less than the sample concentrations. Blank results that are greater than some of the sample results are listed below. Initial
and final field turbidity readings were slightly below the acceptable range for those stations listed on the next page, with readings
ranging from -1.90 NTU to -7.40 NTU. The negative results were rejected.
Were field measurements within the acceptable ranges?
Attachment 1: Data Validation Worksheet (Mainstem Event 1)

Field Blank
Analyte Sample Results Land 2: T010
Boat 1: M004
Boat 2: M010
Boat 4: M024D
DIN 1.62-54.3 All Teams All sample results greater than 54.3
DON 41.4-169.6 All Teams All sample results greater than 169.6
NH4* 1.27 Land 2 All sample results greater than 1.27 ug/L.
54 ug/L Boat 1 8 sample results on Boat 1 less than 54 ug/L, including M004.
31.5 ug/L Boat 2 M010 greater than 31.5 ug/L. 3 other samples on Boat 2 less than 31.5 ug/L.
4.69 ug/L Boat 4 All sample results on Boat 4 greater than 4.69 ug/L.
POC 17.1-45.2 All Teams All sample results greater than 45.2
PON 0.66-8.82 All Teams All sample results greater than 8.82
TDN 43.1-223.9 All Teams All sample results greater than 223.9
TN 43.7-225.1 All Teams All sample results greater than 225.1
TON 42.1-170.8 All Teams All sample results greater than 170.8
TP 2.21-2.57 All Teams All sample results greater than 2.57
TSS ND Land 2 All Land 2 sample results greater than field blank.
ND Boat 1 All Boat 1 sample results greater than field blank.
ND Boat 2 All Boat 2 sample results greater than field blank.
1 mg/L Boat 4 All Boat 4 sample results greater than 1 mg/L.
*An audit performed for ammonia field blank samples indicated the source of these trace ammonia concentrations was the distilled water used for sampling.
Equipment Rinsate Blanks
Analyte Sample Results Land 2: T010
Boat 1: M004
Boat 2: M010
Boat 4: M024D
CBOD5 ND Land 2 All sample results ND.
ND Boat 1 All sample results ND.
ND Boat 2 All sample results ND.
3 mg/L Boat 4 Sample M024D=3.0 mg/L. 3 other samples on Boat 4 ≤3.0 mg/L.
CBOD20 6 mg/L Boat 4 Sample M024D=6.0 mg/L. 2 other samples on Boat 4 ≤6.0 mg/L.
DIN 7.09-22.1 All Teams All sample results greater than respective rinsate blank.
DON 97.3-119.3 All Teams All sample results greater than respective rinsate blank.
NH4 6.15 ug/L Land 2 All Land 1 sample results greater than 6.15 ug/L.
20.8 ug/L Boat 1 All Boat 1 sample results greater than 20.8 ug/L.
17.4 ug/L Boat 2 Sample M010 greater than 17.4 ug/L. 1 other sample on Boat 2 less than 17.4 mg/L.
21.8 ug/L Boat 4 Sample M024D greater than 21.8 ug/L. 2 other samples on Boat 4 less than 21.8 ug/L.
NH4 4.88 ug/L Land 2 All Land 1 sample results greater than adjusted rinsate blank result (4.88 ug/L).
ND Boat 1 All Boat 1 sample results greater than adjusted rinsate blank result.
ND Boat 2 All Boat 2 sample results greater than adjusted rinsate blank result.
17.11 ug/L Boat 4 All Boat 4 sample results greater than adjusted rinsate blank result (17.11 ug/L).
NOX 0.939-2.55 All Teams All sample results greater than respective rinsate blank.
PO4 3.87 ug/L Land 2 Sample T010 greater than 3.87 ug/L. 2 other samples on Land 1 less than 3.87 ug/L.
1.55 ug/L Boat 1 All sample results ND or greater than 1.55 ug/L.
ND Boat 2 All sample results greater than rinsate blank.
1.55 ug/L Boat 4 All sample results greater than 1.55 ug/L.
POC 22.7-66.5 All Teams All sample results greater than respective rinsate blank.
PON 1.32-20.5 All Teams All sample results greater than respective rinsate blank.
TDN 108.9-139.2 All Teams All sample results greater than respective rinsate blank.
TON 103.1-122.8 All Teams All sample results greater than respective rinsate blank.
TN 110.2-142.7 All Teams All sample results greater than respective rinsate blank.
TP 3.91-11.4 All Teams All sample results greater than respective rinsate blank.
(adjusted for
field blank
detections)
No qualifiers were applied to the samples based on field blank and rinsate blank contamination but the data user should note that blank samples had
some minor contamination. Ammonia rinsate blanks were adjusted based on the field blank conentrations as the source was determined to be the
distilled water. Sample concentrations that were less than the blank concentrations have been highlighted.
The field blank samples were prepared from distilled water. The individual sample bottles were filled at the samplling
location with distilled water. The rinsate blank samples were prepared with distilled water that was passed over the
decontaminated sampling equipment and transferred to the appropriate sample bottles.
Blank concentration or Range
(4 field blanks and 4 field equipment
blanks were collected for each
analyte)
Blank detection concentration or
Range (4 field blanks and 4 field
equipment blanks were collected for
each analyte)
Attachment 1: Data Validation Worksheet (Mainstem Event 1)

Sampling
Station Initial/ Final?
Turbidity
Result Qualifier
Sampling
Station Initial/ Final? Turbidity Result Qualifier
M001 Initial -6.90 R M028U Initial -4.80 R
M001 Final -6.90 R M028U Final -5.00 R
M002 Initial -7.10 R M029D Initial -1.90 R
M002 Final -7.20 R M029D Final -4.60 R
M003 Initial -7.10 R M029U Initial -5.20 R
M003 Final -6.90 R M029U Final -4.80 R
M004 Initial -7.30 R M030 Initial -4.60 R
M004 Final -7.30 R M030 Final -4.30 R
M005D Initial -6.20 R O001D Initial -7.30 R
M005D Final -6.20 R O001D Final -7.20 R
M005U Initial -5.60 R O001U Initial -7.20 R
M005U Final -6.10 R O001U Final -7.30 R
M006D Initial -7.40 R O002D Initial -5.90 R
M006D Final -7.20 R O002D Final -5.90 R
M011 Initial -6.10 R O002U Initial -6.10 R
M011 Final -6.10 R O002U Final -6.20 R
M025D Initial -4.40 R O003D Initial -7.00 R
M025D Final -4.30 R O003D Final -7.00 R
M025U Initial -4.70 R O003U Initial -6.90 R
M025U Final -4.60 R O003U Final -6.90 R
M026D Initial -3.10 R O005U Initial -5.80 R
M026D Final -3.30 R O005U Final -5.80 R
M026U Initial -3.00 R T001 Initial -5.70 R
M026U Final -3.10 R T001 Final -5.80 R
M027 Initial -5.40 R T002 Initial -6.00 R
M027 Final -5.90 R T002 Final -6.20 R
M028D Initial -5.60 R T011 Single reading -3.10 R
M028D Final -5.40 R
Representativeness: Yes No N/A
Yes
Yes
Yes
Yes (EAI); No (SMAST)
Adjusted Chlorophyll-a Results
Sampling
Station
Original (ug/L) Revised
(ug/L)
Reduction
(ug/L)
Reduction
(%)
M023D-G 38 18 20 53%
M024D-C 36 6.8 29.2 81%
M024U-G 41 11 30 73%
M026D-C 51 27 24 47%
M026U-G 46 19 27 59%
T011G-G 49 16 33 67%
Comparability: Yes No N/A
Were analytical procedures and methods follows as defined in the QAPP or field change documentation? Yes
Completeness (90%): Yes No N/A
Are all data in this SDG usable? Lab Data- Yes; Field Data-
No
Were sampling procedures and design criteria met?
Were holding times met?
Was preservation criteria met? (4̊ C ± 2̊ C)?
Were Chain-of-Custody records complete and provided in data package?
Comments (note deviations): See Accuracy Section above for rejected field results.
Comments (note deviations): None
Comments (note deviations): Although some samples were received at EAI slightly below 2°C or above 6°C, the laboratory
indicated that the samples adhered to the sample acceptance policy and were received on ice. Samples were consistently
preserved on ice during sampling and transportation, and were transported to the lab within 2-4.5 of sampling. Any temperature
impacts during that brief time period would be minimal. It is suspected that the warmers temperatures measured at receipt may
be a result of consolidation of sample bottles into fewer coolers to facilitate transportation and the time required for that cooler's
temperature to fully acclimate. Also, no samples were grossly outside of the guidance temperature range, and therefore no
qualifers were applied.
The original lab narrative indicated that six chlorophyll-a results may be biased high due to the presence of pheophytin;
however, the lab did not apply any qualifiers. Subsequently, the lab resissued the lab report and these same chlorophyll-a
results were adjusted by the lab to account for pheophytin interferences, as listed below
Attachment 1: Data Validation Worksheet (Mainstem Event 1)

Sensitivity: Yes No N/A
Is a verification report present for method detection limits, interelement correction factors and linear ranges? No
Are MDLs present and reported? Yes (in lab QA manuals)
Do the reporting limits meet project requirements? Yes
Are results above the linear range of the instrument? Yes
Data Validator: Date: 12/1/2014; Rev 5/17/2017
Data Reviewer: Date: 1/14/2015Jamie Lefkowitz
Sue Gryszkiewicz
Comments (note deviations): None.
Attachment 1: Data Validation Worksheet (Mainstem Event 1)

Event 2 (Wet Weather Event)
School for Marine Science and Technology at UMASS-Darmouth (SMAST)- Report CDM 2015
Eastern Analytical Laboratory (EAI)- Reports 148529R, 148530, & 148531
Matrix: WaterCollection date: 10/1/2015
C/N - Carbon to Nitrogen Ratio NOX - Nitrates
CBOD20 - 20 day Carbonaceous Biological Oxygen Demand pH (Field reading)
CBOD5 - 5 day Carbonaceous Biological Oxygen Demand PO4 - Orthophosphates
CHLA - Chlorophyll-a POC - Particulate Organic Carbon
COND - Conductivity (Field reading) PON - Particulate Organic Nitrogen
DIN - Dissolved Inorganic Nitrogen Salinity (Field reading)
D.O. - Dissolved Oxygen (Winkler) Temperature (Field reading)
D.O. CONC - Field Dissolved Oxygen TDN -Total Dissolved Nitrogen
D.O. PERC - Field Dissolved Oxygen Percent TON - Total Organic Nitrogen
DON - Dissolved Organic Nitrogen TKN -Total Kjedhal Nitrogen
E. coli TN - Total Nitrogen
Enterococci TP - Total Phosphorus
Fecal Coliform TSS - Total Suspended Solids
NH4 - Ammonium Turbidity (Field reading)
See Attached Sample Result Tables for the following:
Sampling Event 2 (Wet Weather Event)
Precision: Yes No N/A
Are the field duplicate relative percent differences (RPD) ≤ 30% for water or within CRQL criteria? No
Are the laboratory duplicate RPDs ≤ 20% for water or within CRQL criteria? Yes (Only provided for
chlorophyll a in EAI report
148529R)
N/A
Analyte RPD Qualifier
NH4 32.6% J
TSS 31.6% J
DO (mg/L) 130.2% J
DO (%) 130.3% J
Accuracy: Yes No N/A
Was matrix spike criteria met (frequency 20% and % recovery 75-125%)? N/A
Was post digestion spike criteria met (if applicable)? N/A
Yes (Only provided for
select parameters in EAI
reports 148530, and 148531)
Were field blanks and rinsate blank criteria met? No
Yes (Only provided for
select parameters in EAI
reports 148529R, 148530,
and 148531)
N/A
Yes
Attachment 1
Lower Merrimack River Study
Data Validation Worksheet
Sample Event:
Laboratory:
Analysis/Methods:
Samples in SDG:
Reference Documents Used in Data Validation:
USEPA National Functional Guidelines for Inorganic Superfund Data Validation , August 2014; Quality Assurance Project
Plan (QAPP), CDM Smith, May 2014.
Wet Chemistry Parameters
Are the matrix spike duplicates RPD ≤ 20%?
Comments (note deviations): All field duplicate RPD results were within criteria except for the analytes listed below. The
sample results for the parent sample and the field duplicate sample were qualified as estimated J.
Field Duplicate Pairs Associated Samples
M004-G-EVENT2/M004-D-EVENT2 M004-G-EVENT2/M004-D-EVENT2
M004-G-EVENT2/M004-D-EVENT2 M004-G-EVENT2/M004-D-EVENT2
Was laboratory control sample criteria met?
Was laboratory blank criteria met (within control limits)?
Were ICV/CCV % recoveries within 90-110%?
Were field measurements within the acceptable ranges?
M001-F-EVENT2 (Field)/M001-G-
EVENT2 (Winkler)
M001-F-EVENT2 (Field)/M001-G-
EVENT2 (Winkler)
M001-F-EVENT2 (Field)/M001-G-
EVENT2 (Winkler- calculated)
M001-F-EVENT2 (Field)/M001-G-
EVENT2 (Winkler-calculated)
Comments (note deviations): Field blanks and field equipment blanks were collected. The majority of the blank concentrations
are less than the sample concentrations. Blank results that are greater than some of the sample results are highlighted below.
Attachment 1: Data Validation Worksheet (Mainstem Event 2)

Field Blank
Analyte Sample Results Land 1: O002D
Land 2: T010
Boat 1: M004
Boat 3: M016D
Boat 4: M024D
CHLA ND-0.7 ug/L All Teams All sample results greater than 0.7 ug/L.
DIN 27.04 ug/L Land 1 All Land 1 sample results greater than 27.04 ug/L.
34.17 ug/L Land 2 All Land 2 sample results greater than 34.17 ug/L.
25.28 ug/L Boat 1 All Boat 1 sample results greater than 25.28 ug/L.
32.66 ug/L Boat 3 All Boat 3 sample results greater than 32.66 ug/L.
36.37 ug/L Boat 4 All Boat 4 sample results greater than 36.37 ug/L.
DON 22.68-66.55 ug/L All Teams All sample results greater than 66.55 ug/L.
NH4* 18.82 ug/L Land 1 Samples T002-G and T007-G <18.82 ug/L. All other Land 1 results > 18.82 ug/L.
27.71 ug/L Land 2 All Land 2 sample results greater than 27.71 ug/L.
22.63 ug/L Boat 1 All Boat 1 sample results greater than 22.63 ug/L.
30.25 ug/L Boat 3 All Boat 3 sample results greater than 30.25 ug/L.
32.79 ug/L Boat 4 All Boat 4 sample results greater than 32.79 ug/L.
NOX 2.40-8.22 ug/L All Teams All sample results greater than 8.22 ug/L.
PO4 ND (<3.1 ug/L) All Teams All sample results nondetect or greater than 3.1 ug/L.
POC 34.11-48.30 ug/L All Teams All sample results greater than 48.30 ug/L.
PON ND (<9.80 ug/L) All Teams All sample results greater than 9.80 ug/L.
TDN 0.05-0.09 mg/L All Teams All sample results greater than 0.09 mg/L.
TKN 0.05-0.09 mg/L All Teams All sample results greater than 0.09 mg/L.
TN 0.06-0.09 ug/L All Teams All sample results greater than 0.09 mg/L.
TON 25.15-69.06 ug/L All Teams All sample results greater than 69.06 ug/L.
TP 4.11-6.17 ug/L All Teams All sample results greater than 6.11 ug/L.
Equipment Rinsate Blanks
Analyte Sample Results Land 1: O002D
Land 2: T010
Boat 1: M004
Boat 3: M016D
Boat 4: M024D
CHLA ND-0.7 ug/L All Teams All sample results greater than 0.7 ug/L.
DIN 17.37 ug/L Land 1 All Land 1 sample results greater than 17.37 ug/L.
16.89 ug/L Land 2 All Land 2 sample results greater than 16.89 ug/L.
31.18 ug/L Boat 1 All Boat 1 sample results greater than 31.18 ug/L.
44.34 ug/L Boat 3 All Boat 3 sample results greater than 44.34 ug/L.
50.07 ug/L Boat 4 All Boat 4 sample results greater than 50.07 ug/L.
DON 161.32 ug/L Land 1 Sample O002U-G <161.32 ug/L. All other Land 1 results greater than 161.32 ug/L.
34.38 ug/L Land 2 All Land 2 sample results greater than 34.38 ug/L.
87.29 ug/L Boat 1 All Boat 1 sample results greater than 87.29 ug/L.
45.03 ug/l Boat 3 All Boat 3 sample results greater than 45.03 ug/L.
110.59 ug/L Boat 4 All Boat 4 sample results greater than 110.59 ug/L.
NH4 16.28 ug/L Land 1 Sample T002-G and T007-G<16.28 ug/L. All other Land 1 results were > 16.28 ug/L.
15.01 ug/L Land 2 All Land 2 sample results greater than 15.01 ug/L.
28.98 ug/L Boat 1 All Boat 1 sample results greater than 28.98 ug/L.
35.33 ug/L Boat 3 All Boat 3 sample results greater than 35.33 ug/L.
43.59 ug/L Boat 4 All Boat 4 sample results greater than 43.59 ug/L.
NH4 ND Land 1 All Land 1 sample results greater than adjusted rinsate blank result.
ND Land 2 All Land 2 sample results greater than adjusted rinsate blank result.
6.35 ug/L Boat 1 All Boat 1 sample results greater than adjusted rinsate blank result (6.35 ug/L).
5.08 ug/L Boat 3 All Boat 3 sample results greater than adjusted rinsate blank result (5.08 ug/L).
10.80 ug/L Boat 4 All Boat 4 sample results greater than adjusted rinsate blank result (10.80 ug/L).
NOX 1.09-9.0 ug/l All Teams All sample results greater than 9.0 ug/L.
PO4 ND (<3.1 ug/L) All Teams All sample results nondetect or greater than 3.1 ug/L.
POC 31.06-125.64 ug/L All Teams All sample results greater than 125.64 ug/L.
PON ND (<9.80 ug/L) All Teams All sample results greater than 9.80 ug/L.
TDN 0.05-0.18 mg/L All Teams All sample results greater than 0.18 mg/L.
TKN 0.05-0.18 mg/L All Teams All sample results greater than 0.18 mg/L.
TN 0.05-0.18 mg/L All Teams All sample results greater than 0.18 mg/L.
TON 36.57-161.81 ug/L All Teams All sample results greater than 161.81 ug/L.
TP ND-6.17 ug/L All Teams All sample results greater than 6.17 ug/L.
Blank concentration or Range
(5 field blanks and 5 field equipment
blanks were collected for each
analyte listed, except for CHLA
which had 4)
Blank detection concentration or
Range (5 field blanks and 5 field
equipment blanks were collected for
each analyte listed, except for CHLA
which had 4)
Yes (Only provided for select
parameters in EAI report 133001)
(adjusted for
field blank
detections)
*An audit performed for Event 1 ammonia field blank samples indicated the source of these trace ammonia concentrations was the distilled water used for
sampling.
Attachment 1: Data Validation Worksheet (Mainstem Event 2)

Representativeness: Yes No N/A
Yes
Yes
Yes
Yes (EAI); No (SMAST)
Adjusted Chlorophyll-a Results
Sampling
Station
Original (ug/L) Revised
(ug/L)
Reduction
(ug/L)
Reduction
(%)
DUP4-D
(M024D-C)
32 22 10 31%
M015-G 21 6.8 14.2 68%
M017-G 18 9.4 8.6 48%
M018-G 18 10 8 44%
M019-G 26 14 12 46%
M020-G 22 12 10 45%
M021D-C 22 10 12 55%
M021U-G 30 15 15 50%
M022-G 26 16 10 38%
M023D-G 31 17 14 45%
M023U-G 33 17 16 48%
M024D-C 34 25 9 26%
M024U-G 30 18 12 40%
M025D-C 33 21 12 36%
M025U-G 36 22 14 39%
M026D-C 34 21 13 38%
M026U-G 32 20 12 38%
M028D-C 31 18 13 42%
M028U-G 35 25 10 29%
M029D-C 22 13 9 41%
M029U-G 26 14 12 46%
M030-G 25 15 10 40%
O007D-G 16 10 6 38%
O009D-G 29 14 15 52%
O009U-G 31 15 16 52%
O010D-G 34 22 12 35%
O010U-G 36 19 17 47%
T002-G 15 11 4 27%
T008-G 28 18 10 36%
T011-G 32 23 9 28%
No qualifiers were applied to the samples based on field blank and rinsate blank contamination but the data user should note that blank samples had
some minor contamination. Ammonia rinsate blanks were adjusted based on the field blank concentrations as the source was determined to be the
distilled water. Sample concentrations that were less than the blank concentrations have been highlighted.
Were sampling procedures and design criteria met?
Were holding times met?
Was preservation criteria met? (4̊ C ± 2̊ C)?
Were Chain-of-Custody records complete and provided in data package?
The field blank samples were prepared from distilled water. The individual sample bottles were filled at the sampling location with distilled water. The
rinsate blank samples were prepared with distilled water that was passed over the decontaminated sampling equipment and transferred to the
appropriate sample bottles.
Comments (note deviations): Although some samples were received at EAI slightly below 2°C or above 6°C, the laboratory
indicated that the samples adhered to the sample acceptance policy. No samples were grossly outside of the guidance
temperature range, and therefore no qualifiers were applied. All samples except the Merrimac MA WWTP Effluent 1 CBOD5
and CBOD20 samples and reanalyzed M027-G-EVENT2 enterococcus sample were analyzed within their respective hold times.
The Merrimac MA WWTP Effluent 1 sample was analyzed for CBOD and CBOD20 50 hours and 45 minutes after sampling; 2
hours and 45 minutes past the hold time of 48 hours. The M027-G-EVENT2 enterococcus sample was diluted and re-analyzed
just outside the hold time of 8 hours (8 hours and 54 minutes after sample collection). These hold time exceedances have been
evaluated to be insignificant, and since no samples were analyzed grossly outside their hold times, no qualifiers were applied.
Although all analytical procedures were followed and no qualifiers were applied, it should be noted that some E. coli species
were less tolerant to the higher temperatures required by the Fecal Coliform test resulting in Fecal Coliform< E. coli results.
Select chlorophyll-a results (30 total) were adjusted by the lab to account for pheophytin interferences, as detailed below.
Attachment 1: Data Validation Worksheet (Mainstem Event 2)

Comparability: Yes No N/A
Were analytical procedures and methods follows as defined in the QAPP or field change documentation? No - See Comments
Analyte Qualifier
Enterococcus J
Completeness (90%): Yes No N/A
Are all data in this SDG usable? Yes
Sensitivity: Yes No N/A
Is a verification report present for method detection limits, interelement correction factors and linear ranges? No
Are MDLs present and reported? Yes (in lab QA manuals)
Do the reporting limits meet project requirements? Yes
Are results above the linear range of the instrument? Yes
Data Validator: Date: 2/17/2016
Data Reviewer: Date: 3/28/2016; Rev 5/17/17
Comments (note deviations): The analysis for the enterococcus bacteria requires a level of salinity that was exceeded in
samples M027-G-EVENT2 and M029D-G-EVENT2. The M027-G-EVENT2 sample was diluted and re-analyzed. EAI considers
the diluted M027-G-EVENT2 sample to be most representative and as such, the results have been accepted. The M029D-G-
EVENT2 sample was analyzed without dilution, and as a result the enterococcus result may be biased high and was qualified as
estimated J.
Comments (note deviations): None.
Comments (note deviations): None.
Patrick Donohue
Sue Gryszkiewicz
Associated Sample
M029D-G-EVENT2
Attachment 1: Data Validation Worksheet (Mainstem Event 2)
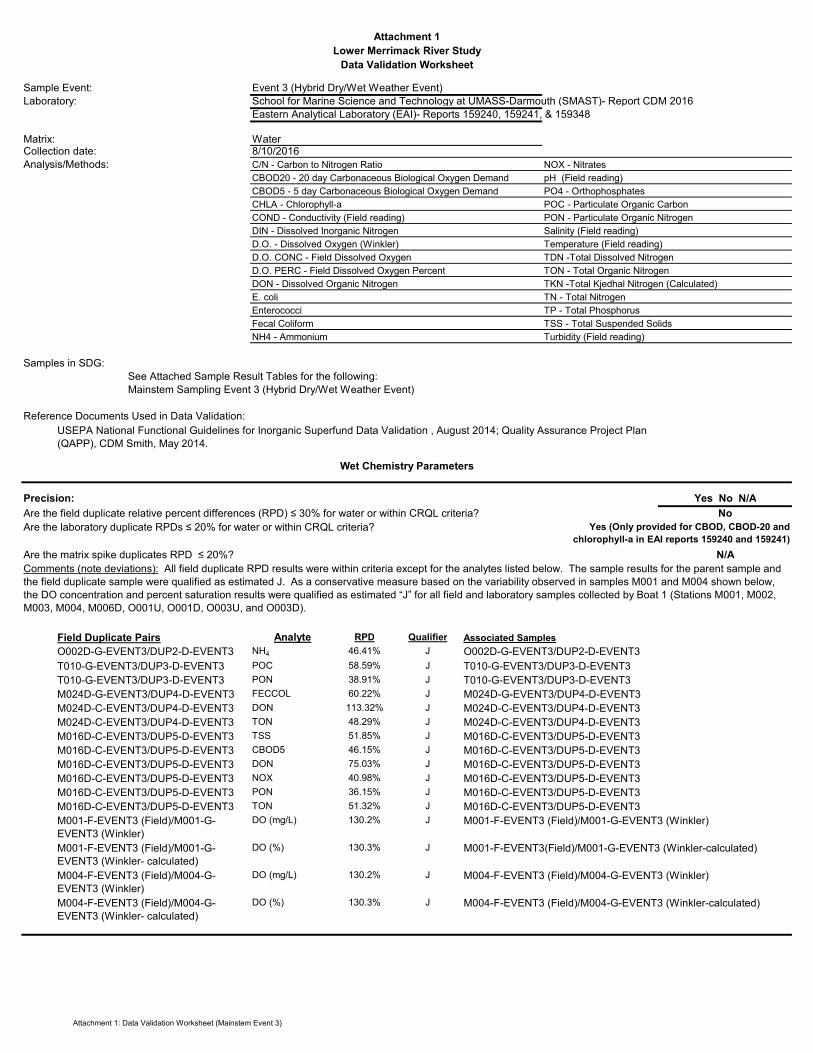
Event 3 (Hybrid Dry/Wet Weather Event)
School for Marine Science and Technology at UMASS-Darmouth (SMAST)- Report CDM 2016
Eastern Analytical Laboratory (EAI)- Reports 159240, 159241, & 159348
Matrix: WaterCollection date: 8/10/2016
C/N - Carbon to Nitrogen Ratio NOX - Nitrates
CBOD20 - 20 day Carbonaceous Biological Oxygen Demand pH (Field reading)
CBOD5 - 5 day Carbonaceous Biological Oxygen Demand PO4 - Orthophosphates
CHLA - Chlorophyll-a POC - Particulate Organic Carbon
COND - Conductivity (Field reading) PON - Particulate Organic Nitrogen
DIN - Dissolved Inorganic Nitrogen Salinity (Field reading)
D.O. - Dissolved Oxygen (Winkler) Temperature (Field reading)
D.O. CONC - Field Dissolved Oxygen TDN -Total Dissolved Nitrogen
D.O. PERC - Field Dissolved Oxygen Percent TON - Total Organic Nitrogen
DON - Dissolved Organic Nitrogen TKN -Total Kjedhal Nitrogen (Calculated)
E. coli TN - Total Nitrogen
Enterococci TP - Total Phosphorus
Fecal Coliform TSS - Total Suspended Solids
NH4 - Ammonium Turbidity (Field reading)
See Attached Sample Result Tables for the following:
Mainstem Sampling Event 3 (Hybrid Dry/Wet Weather Event)
Precision: Yes No N/A
Are the field duplicate relative percent differences (RPD) ≤ 30% for water or within CRQL criteria? No
Are the laboratory duplicate RPDs ≤ 20% for water or within CRQL criteria?
N/A
Analyte RPD Qualifier
NH4 46.41% J
POC 58.59% J
PON 38.91% J
FECCOL 60.22% J
DON 113.32% J
TON 48.29% J
TSS 51.85% J
CBOD5 46.15% J
DON 75.03% J
NOX 40.98% J
PON 36.15% J
TON 51.32% J
DO (mg/L) 130.2% J
DO (%) 130.3% J
DO (mg/L) 130.2% J
DO (%) 130.3% J
Yes (Only provided for CBOD, CBOD-20 and
chlorophyll-a in EAI reports 159240 and 159241)
Are the matrix spike duplicates RPD ≤ 20%?
Field Duplicate Pairs
Attachment 1
Lower Merrimack River Study
Data Validation Worksheet
Sample Event:
Laboratory:
Analysis/Methods:
Samples in SDG:
Reference Documents Used in Data Validation:
USEPA National Functional Guidelines for Inorganic Superfund Data Validation , August 2014; Quality Assurance Project Plan
(QAPP), CDM Smith, May 2014.
Wet Chemistry Parameters
Associated Samples
O002D-G-EVENT3/DUP2-D-EVENT3 O002D-G-EVENT3/DUP2-D-EVENT3
T010-G-EVENT3/DUP3-D-EVENT3 T010-G-EVENT3/DUP3-D-EVENT3
M016D-C-EVENT3/DUP5-D-EVENT3
T010-G-EVENT3/DUP3-D-EVENT3 T010-G-EVENT3/DUP3-D-EVENT3
M024D-G-EVENT3/DUP4-D-EVENT3 M024D-G-EVENT3/DUP4-D-EVENT3
M024D-C-EVENT3/DUP4-D-EVENT3 M024D-C-EVENT3/DUP4-D-EVENT3
M016D-C-EVENT3/DUP5-D-EVENT3
M016D-C-EVENT3/DUP5-D-EVENT3
M016D-C-EVENT3/DUP5-D-EVENT3
M024D-C-EVENT3/DUP4-D-EVENT3 M024D-C-EVENT3/DUP4-D-EVENT3
M016D-C-EVENT3/DUP5-D-EVENT3
M016D-C-EVENT3/DUP5-D-EVENT3
Comments (note deviations): All field duplicate RPD results were within criteria except for the analytes listed below. The sample results for the parent sample and
the field duplicate sample were qualified as estimated J. As a conservative measure based on the variability observed in samples M001 and M004 shown below,
the DO concentration and percent saturation results were qualified as estimated “J” for all field and laboratory samples collected by Boat 1 (Stations M001, M002,
M003, M004, M006D, O001U, O001D, O003U, and O003D).
M001-F-EVENT3 (Field)/M001-G-
EVENT3 (Winkler)
M001-F-EVENT3 (Field)/M001-G-
EVENT3 (Winkler- calculated)
M001-F-EVENT3 (Field)/M001-G-EVENT3 (Winkler)
M001-F-EVENT3(Field)/M001-G-EVENT3 (Winkler-calculated)
M004-F-EVENT3 (Field)/M004-G-
EVENT3 (Winkler)
M004-F-EVENT3 (Field)/M004-G-EVENT3 (Winkler)
M004-F-EVENT3 (Field)/M004-G-
EVENT3 (Winkler- calculated)
M004-F-EVENT3 (Field)/M004-G-EVENT3 (Winkler-calculated)
M016D-C-EVENT3/DUP5-D-EVENT3
M016D-C-EVENT3/DUP5-D-EVENT3
M016D-C-EVENT3/DUP5-D-EVENT3
M016D-C-EVENT3/DUP5-D-EVENT3 M016D-C-EVENT3/DUP5-D-EVENT3
M016D-C-EVENT3/DUP5-D-EVENT3
Attachment 1: Data Validation Worksheet (Mainstem Event 3)

Accuracy: Yes No N/A
Was matrix spike criteria met (frequency 20% and % recovery 75-125%)?
Was post digestion spike criteria met (if applicable)? N/A
Was laboratory control sample criteria met?
Were field blanks and rinsate blank criteria met? No
Was laboratory blank criteria met (within control limits)?
N/A
Yes
Field Blank
Analyte Sample Results Land 1: O002D
Land 2: T010
Boat 1: M004
Boat 3: M016D
Boat 4: M024D
CHLA ND (0.5 ug/L) All Teams All sample results nondetect or greater than 0.5 ug/L.
CBOD ND (<3 mg/L) All Teams All sample results nondetect or greater than 3 mg/L.
CBOD-20 ND (<3 mg/L) All Teams All sample results nondetect or greater than 3 mg/L.
Ecoli 1 MPN/100ml Boat 1, Land 1,
Land 2
Sample M001-G = 1 MPN/100mL. All other results greater than1 MPN/100mL.
10 MPN/100ml Boat 4 All sample results greater than 10 MPN/100m.
FECCOL 1 MPN/100ml Boat 1, Land 1,
Land 2Sample M002-G = 1 MPN/100mL. All other results greater than1 MPN/100m.
10 MPN/100ml Boat 4 All sample results greater than 10 MPN/100m.
DIN 35.86 ug/L Boat 1 All Boat 1 sample results greater than 35.86 ug/L.
33.50 ug/L Boat 3 All Boat 3 sample results greater than 33.50 ug/L.
34.68 ug/L Boat 4 All Boat 4 sample results greater than 34.68 ug/L.
14.79 ug/L Land 1 All Land 1 sample results greater than 14.79 ug/L.
66.28 ug/L Land 2 Sample T012-G < 66.28 ug/L. All other Land 2 resutls greater than 66.28 ug/L.
DON 50.21 ug/L Boat 1 All sample results greater than 50.21 ug/L.
46.03 ug/L Boat 3 All sample results greater than 46.03 ug/L.
63.16 ug/L Boat 4 Samples M023D-G and M024D-C < 63.16 ug/L.All other Boat 4 results > 63.16 ug/L.
42.08 ug/L Land 1 All sample results greater than 42.08 ug/L.
84.71 ug/L Land 2 All sample results greater than 84.71 ug/L.
NH4* 34.27 ug/L Boat 1
31.70 ug/L Boat 3
29.78 ug/L Boat 4 All Boat 4 sample results greater than 29.78 ug/L.
13.73 ug/L Land 1 All Land 1 sample results greater than 13.73 ug/L.
34.27 ug/L Land 2
NOX 1.59 ug/L Boat 1 All sample results greater than 1.59 ug/L.
1.79 ug/L Boat 3 All sample results greater than 1.79 ug/L.
4.90 ug/L Boat 4 All sample results greater than 4.90 ug/L.
1.05 ug/L Land 1 All sample results greater than 1.05 ug/L.
32.02 ug/L Land 2 Sample T012-G < 32.02 ug/L. All other Land 2 Results greater than 32.02 ug/L.
PO4 ND (<3.1 ug/L) Boat 1 All other Boat 1 results nondetect or greater than 3.1 ug/L.
ND (<3.1 ug/L) Boat 3 All Boat 3 results greater than 3.1 ug/L.
ND (<3.1 ug/L) Boat 4 All Boat 4 results greater than 3.1 ug/L.
ND (<3.1 ug/L) Land 1 All other Land 1 results nondetect or greater than 3.1 ug/L.
3.22 ug/L Land 2 All Land 2 sample results greater than 3.22 ug/L.
POC 27.44-177.64 ug/L All Teams All sample results greater than respective field blanks.
PON ND (<9.8 ug/L) All Teams All sample results greater than 9.8 ug/L.
TDN 0.06-0.15 mg/L All Teams All sample results greater than respective field blanks.
TKN 0.059-0.12 mg/L All Teams All sample results greater than respective field blanks.
TN 0.06-0.15 mg/L All Teams All sample results greater than respective field blanks.
TON 44.96-87.11 ug/L All Teams All sample results greater than respective field blanks.
TP ND-7.68 ug/L All Teams All sample results greater than respective field blanks.
Yes (Only provided for select parameters in EAI
reports 159240, 159241, and 159348)
Yes (Only provided for select parameters in EAI
reports 59240, 159241, and 159348)
Samples M014-G, O006D-G, O006U-G, and T012-G< 34.27 ug/L. All other Land 2 results >
34.27 ug/L.
Samples M011-G, M012-G, M013-G, M018-G, O005D-G and O005U-G <31.70 ug/L. All other
Boat 3 results > 31.70 ug/L.
Samples M001-G, M002-G, M003-G, M004-G/D, O001D-G and O001U-G < 34.27 ug/L. All other
Boat 1 results > 34.27 ug/L.
Were ICV/CCV % recoveries within 90-110%?
Were field measurements within the acceptable ranges?
Comments (note deviations): Field blanks and equipment rinsate blanks were collected. The majority of the blank concentrations are
less than the sample concentrations. Blank results that are greater than some of the sample results are highlighted below.
Blank concentration or Range
(5 field blanks and 5 field equipment
blanks were collected for each analyte
listed, except for bacteria, CHLA and
CBOD20)
*An audit performed for Event 1 ammonia field blank samples indicated the source of these trace ammonia concentrations was the distilled water used for sampling.
Yes (Only provided for select
parameters in EAI report 133001)
Attachment 1: Data Validation Worksheet (Mainstem Event 3)

Equipment Rinsate Blanks
Analyte Sample Results Land 1: O002D
Land 2: T010
Boat 1: M004
Boat 3: M016D
Boat 4: M024D
CHLA ND (0.5 ug/L) All Teams All sample results nondetect or greater than 0.5 ug/L.
CBOD ND (<3 mg/L) All Teams All sample results nondetect or greater than 3 mg/L.
CBOD-20 ND (<3 mg/L) All Teams All sample results nondetect or greater than 3 mg/L.
Ecoli 1 MPN/100ml Boat 1 Sample M001-G = 1 MPN/100m. All other Boat 1 results greater than1 MPN/100m.
10 MPN/100ml Boat 4 All Boat 4 sample results greater than 10 MPN/100m
1 MPN/100ml Land 1 All Land 1 sample results greater than 1 MPN/100m
13.1 MPN/100ml Land 2 All Land 2 sample results greater than 13.1 MPN/100m
FECCOL 1 MPN/100ml Boat 1 Sample M002-G = 1 MPN/100m. All other results greater than1 MPN/100m.
10 MPN/100ml Boat 4 All Boat 4 sample results greater than 10 MPN/100m
1 MPN/100ml Land 1 All Land 1 sample results greater than 1 MPN/100m
32.3 MPN/100ml
Land 2
DIN 38.21 ug/L Boat 1 All Boat 1 sample results greater than 38.21 ug/L.
37.20 ug/L Boat 3 All Boat 3 sample results greater than 37.20 ug/L.
43.62 ug/L Boat 4 All Boat 4 sample results greater than 43.62 ug/L.
108.43 ug/L Land 1 All Land 1 sample results greater than 108.43 ug/L.
37.78 ug/L Land 2 Sample T012-G < 37.78 ug/L. All other Land 2 resutls greater than 37.78 ug/L.
DON 134.57 ug/L Boat 1 All Boat 1 sample results greater than 134.57 ug/L.
104.64 ug/L Boat 3 All Boat 3 sample results greater than 104.64 ug/L.
95.17 ug/L Boat 4 Samples M023D-G and M024D-C < 95.17 ug/L.All other Boat 4 results > 95.17 ug/L.
87.45 ug/l Land 1 All Land 1 sample results greater than 87.45 ug/L.
44.80 ug/L Land 2 All Land 2 sample results greater than 44.80 ug/L.
NH4 36.83 ug/L Boat 1
32.98 ug/L Boat 3
34.27 ug/L Boat 4 All Boat 4 sample results greater than 34.27 ug/L.
105.16 ug/L Land 1
32.34 ug/L Land 2
NH4 2.56 ug/L Boat 1 All Boat 1 sample results greater than adjusted rinsate blank result (2.56 ug/L).
1.28 ug/L Boat 3
4.49 ug/L Boat 4 All Boat 4 sample results greater than adjusted rinsate blank result (4.49 ug/L).
91.43 ug/L Land 1
ND Land 2 All Land 2 sample results greater than adjusted rinsate blank result (ND).
NOX 1.38-9.36 ug/L All Teams All sample results greater than 9.36 ug/L.
PO4 ND (<3.1 ug/L) Boat 1 All other Boat 1 results nondetect or greater than 3.1 ug/L.
ND (<3.1 ug/L) Boat 3 All Boat 3 results greater than 3.1 ug/L.
ND (<3.1 ug/L) Boat 4 All Boat 4 results greater than 3.1 ug/L.
ND (<3.1 ug/L) Land 1 All other Land 1 results nondetect or greater than 3.1 ug/L.
ND (<3.1 ug/L) Land 2 All Land 2 sample results greater than 3.1 ug/L.
POC 50.56-256.81 ug/L All Teams All sample results greater than 256.81 ug/L.
PON ND- 10.73 ug/L All Teams All sample results greater than 10.73 ug/L.
TDN 0.08-0.20 mg/L All Teams All sample results greater than their respective equipment blank.
TKN 0.08-0.20 mg/L All Teams All sample results greater than their respective equipment blank.
TN 0.09-0.20 mg/L All Teams All sample results greater than their respective equipment blank.
TON 47.90-140.0 ug/L All Teams All sample results greater than their respective equipment blank.
TP 3.84-9.6 ug/L All Teams All sample results greater than their respective equipment blank.
Samples M005U-G, M006U-G, O002D-G/D, O002U-G, O004D-G, T001-G, T006-G, T007-G and
T008-G <105.16 ug/L. All other Land 1 results > 105.16 ug/L.
Samples M005U-G, M006U-G, O002D-G/D, O002U-G, O004D-G, T001-G, T006-G, T007-G <91.43
ug/L. All other Land 1 results > adjusted rinsate blank result (91.43 ug/L).
Sample O005D-G <1.28 ug/L. All other Boat 3 sample results > adjusted rinsate blank result
(1.28 ug/L).
Samples M014-G, O006D-G,O006U-G, and T012-G < 32.34 ug/L. All other Land 2 results
>32.34 ug/L.
Samples M011-G, M012-G, M013-G, M018-G, O005D-G and O005U-G <32.98 ug/L. All other
Boat 3 results >32.98 ug/L.
Samples M001-G, M002-G, M003-G, M004-G/D, O001D-G and O001U-G < 36.83 ug/L. All
other Boat 1 results > 36.83 ug/L.
Samples M014-G, O006D-G and O006U-G < 32.3 MPN/100ml. All other Land 2 results are
greater than 32.3 MPN/100ml.
Blank detection concentration or Range
(5 field blanks and 5 field equipment
blanks were collected for each analyte
listed, except for bacteria, CHLA, and
CBOD20)
(adjusted for
field blank
detections)
The field blank samples were prepared from distilled water. The individual sample bottles were filled at the sampling location with distilled water. The rinsate
blank samples were prepared with distilled water that was passed over the decontaminated sampling equipment and transferred to the appropriate sample
bottles.
No qualifiers were applied to the samples based on field blank and rinsate blank contamination but the data user should note that blank samples had some
minor contamination. Ammonia rinsate blanks were adjusted based on the field blank concentrations as the source was determined to be the distilled water.
Sample concentrations that were less than the blank concentrations have been highlighted.
Attachment 1: Data Validation Worksheet (Mainstem Event 3)

Representativeness: Yes No N/A
Yes
Yes
Yes
Yes (EAI); No (SMAST)
Adjusted Chlorophyll-a Results
Sampling
Station
Original (ug/L) Revised (ug/L) Reduction
(ug/L)
Reduction
(%)
M028U-G 49 16 33 67%
T012-G 120 90 30 25%
Comparability: Yes No N/A
Were analytical procedures and methods follows as defined in the QAPP or field change documentation? Yes
Completeness (90%): Yes No N/A
Are all data in this SDG usable? Yes
Sensitivity: Yes No N/A
Is a verification report present for method detection limits, interelement correction factors and linear ranges? No
Are MDLs present and reported? Yes (in lab QA
manuals)
Do the reporting limits meet project requirements? Yes
Are results above the linear range of the instrument? Yes
Data Validator: Date: 12/23/2016
Data Reviewer: Date: 1/17/2017; Rev 5/17/17Sue Gryszkiewicz
Were holding times met?
Was preservation criteria met? (4̊ C ± 2̊ C)?
Were Chain-of-Custody records complete and provided in data package?
Comments (note deviations): The laboratory indicated that all samples adhered to the sample acceptance policy. All samples were
analyzed within their respective hold times. Although all analytical procedures were followed and no qualifiers were applied, it should be
noted that some E. coli species were less tolerant to the higher temperatures required by the Fecal Coliform test resulting in Fecal
Coliform< E. coli results.
Two chlorophyll-a results were adjusted by the lab to account for pheophytin interferences, as detailed below.
Comments (note deviations): None
Comments (note deviations): None.
Comments (note deviations): None.
Parnian Baniahmad
Were sampling procedures and design criteria met?
Attachment 1: Data Validation Worksheet (Mainstem Event 3)
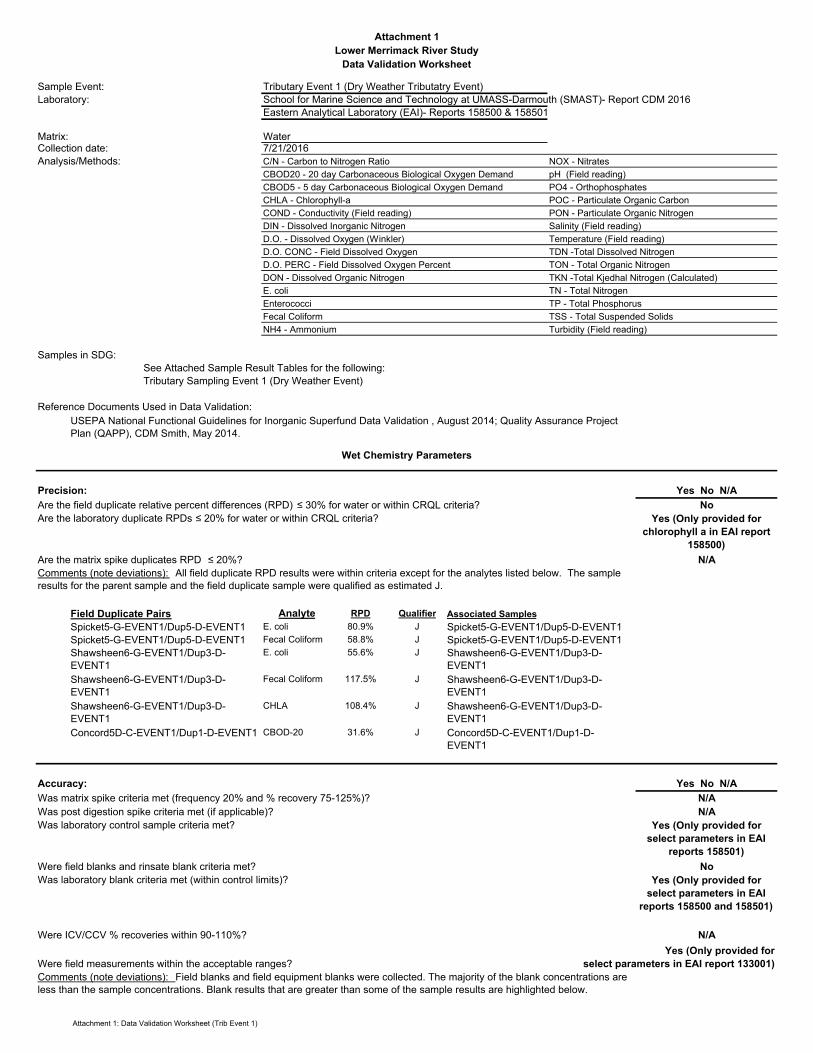
Tributary Event 1 (Dry Weather Tributatry Event)
School for Marine Science and Technology at UMASS-Darmouth (SMAST)- Report CDM 2016
Eastern Analytical Laboratory (EAI)- Reports 158500 & 158501
Matrix: WaterCollection date: 7/21/2016
C/N - Carbon to Nitrogen Ratio NOX - Nitrates
CBOD20 - 20 day Carbonaceous Biological Oxygen Demand pH (Field reading)
CBOD5 - 5 day Carbonaceous Biological Oxygen Demand PO4 - Orthophosphates
CHLA - Chlorophyll-a POC - Particulate Organic Carbon
COND - Conductivity (Field reading) PON - Particulate Organic Nitrogen
DIN - Dissolved Inorganic Nitrogen Salinity (Field reading)
D.O. - Dissolved Oxygen (Winkler) Temperature (Field reading)
D.O. CONC - Field Dissolved Oxygen TDN -Total Dissolved Nitrogen
D.O. PERC - Field Dissolved Oxygen Percent TON - Total Organic Nitrogen
DON - Dissolved Organic Nitrogen TKN -Total Kjedhal Nitrogen (Calculated)
E. coli TN - Total Nitrogen
Enterococci TP - Total Phosphorus
Fecal Coliform TSS - Total Suspended Solids
NH4 - Ammonium Turbidity (Field reading)
See Attached Sample Result Tables for the following:
Tributary Sampling Event 1 (Dry Weather Event)
Precision: Yes No N/A
Are the field duplicate relative percent differences (RPD) ≤ 30% for water or within CRQL criteria? No
Are the laboratory duplicate RPDs ≤ 20% for water or within CRQL criteria? Yes (Only provided for
chlorophyll a in EAI report
158500)
N/A
Analyte RPD Qualifier
E. coli 80.9% J
Fecal Coliform 58.8% J
E. coli 55.6% J
Fecal Coliform 117.5% J
CHLA 108.4% J
CBOD-20 31.6% J
Accuracy: Yes No N/A
Was matrix spike criteria met (frequency 20% and % recovery 75-125%)? N/A
Was post digestion spike criteria met (if applicable)? N/A
Yes (Only provided for
select parameters in EAI
reports 158501)
Were field blanks and rinsate blank criteria met? No
Yes (Only provided for
select parameters in EAI
reports 158500 and 158501)
N/A
Were field measurements within the acceptable ranges?
USEPA National Functional Guidelines for Inorganic Superfund Data Validation , August 2014; Quality Assurance Project
Plan (QAPP), CDM Smith, May 2014.
Wet Chemistry Parameters
Are the matrix spike duplicates RPD ≤ 20%?
Comments (note deviations): All field duplicate RPD results were within criteria except for the analytes listed below. The sample
results for the parent sample and the field duplicate sample were qualified as estimated J.
Field Duplicate Pairs Associated Samples
Samples in SDG:
Reference Documents Used in Data Validation:
Attachment 1
Lower Merrimack River Study
Data Validation Worksheet
Sample Event:
Laboratory:
Analysis/Methods:
Spicket5-G-EVENT1/Dup5-D-EVENT1
Spicket5-G-EVENT1/Dup5-D-EVENT1 Spicket5-G-EVENT1/Dup5-D-EVENT1
Shawsheen6-G-EVENT1/Dup3-D-
EVENT1
Shawsheen6-G-EVENT1/Dup3-D-
EVENT1
Spicket5-G-EVENT1/Dup5-D-EVENT1
Shawsheen6-G-EVENT1/Dup3-D-
EVENT1
Shawsheen6-G-EVENT1/Dup3-D-
EVENT1
Was laboratory control sample criteria met?
Was laboratory blank criteria met (within control limits)?
Shawsheen6-G-EVENT1/Dup3-D-
EVENT1
Shawsheen6-G-EVENT1/Dup3-D-
EVENT1
Concord5D-C-EVENT1/Dup1-D-EVENT1 Concord5D-C-EVENT1/Dup1-D-
EVENT1
Were ICV/CCV % recoveries within 90-110%?
Comments (note deviations): Field blanks and field equipment blanks were collected. The majority of the blank concentrations are
less than the sample concentrations. Blank results that are greater than some of the sample results are highlighted below.
Yes (Only provided for
select parameters in EAI report 133001)
Attachment 1: Data Validation Worksheet (Trib Event 1)
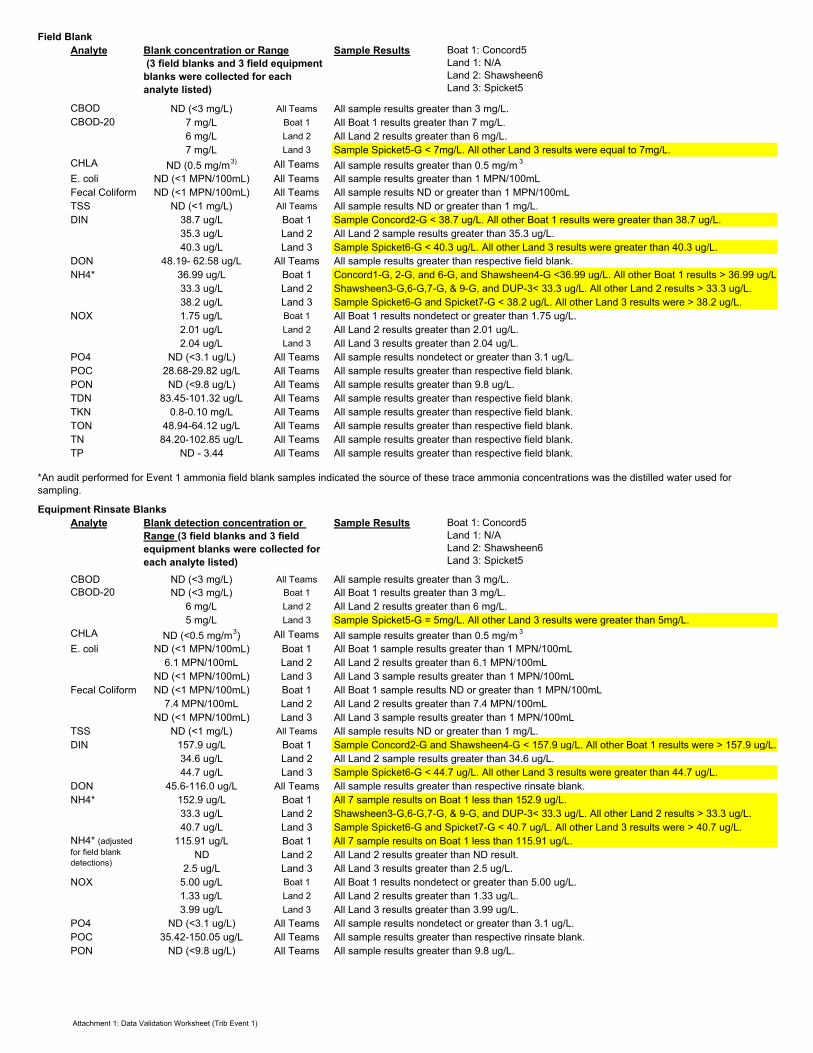
Field Blank
Analyte Sample Results Boat 1: Concord5
Land 1: N/A
Land 2: Shawsheen6
Land 3: Spicket5
CBOD ND (<3 mg/L) All Teams All sample results greater than 3 mg/L.
CBOD-20 7 mg/L Boat 1 All Boat 1 results greater than 7 mg/L.
6 mg/L Land 2 All Land 2 results greater than 6 mg/L.
7 mg/L Land 3 Sample Spicket5-G < 7mg/L. All other Land 3 results were equal to 7mg/L.
CHLA ND (0.5 mg/m3) All Teams All sample results greater than 0.5 mg/m
3
E. coli ND (<1 MPN/100mL) All Teams All sample results greater than 1 MPN/100mL
Fecal Coliform ND (<1 MPN/100mL) All Teams All sample results ND or greater than 1 MPN/100mL
TSS ND (<1 mg/L) All Teams All sample results ND or greater than 1 mg/L.
DIN 38.7 ug/L Boat 1 Sample Concord2-G < 38.7 ug/L. All other Boat 1 results were greater than 38.7 ug/L.
35.3 ug/L Land 2 All Land 2 sample results greater than 35.3 ug/L.
40.3 ug/L Land 3 Sample Spicket6-G < 40.3 ug/L. All other Land 3 results were greater than 40.3 ug/L.
DON 48.19- 62.58 ug/L All Teams All sample results greater than respective field blank.
NH4* 36.99 ug/L Boat 1 Concord1-G, 2-G, and 6-G, and Shawsheen4-G <36.99 ug/L. All other Boat 1 results > 36.99 ug/L.
33.3 ug/L Land 2 Shawsheen3-G,6-G,7-G, & 9-G, and DUP-3< 33.3 ug/L. All other Land 2 results > 33.3 ug/L.
38.2 ug/L Land 3 Sample Spicket6-G and Spicket7-G < 38.2 ug/L. All other Land 3 results were > 38.2 ug/L.
NOX 1.75 ug/L Boat 1 All Boat 1 results nondetect or greater than 1.75 ug/L.
2.01 ug/L Land 2 All Land 2 results greater than 2.01 ug/L.
2.04 ug/L Land 3 All Land 3 results greater than 2.04 ug/L.
PO4 ND (<3.1 ug/L) All Teams All sample results nondetect or greater than 3.1 ug/L.
POC 28.68-29.82 ug/L All Teams All sample results greater than respective field blank.
PON ND (<9.8 ug/L) All Teams All sample results greater than 9.8 ug/L.
TDN 83.45-101.32 ug/L All Teams All sample results greater than respective field blank.
TKN 0.8-0.10 mg/L All Teams All sample results greater than respective field blank.
TON 48.94-64.12 ug/L All Teams All sample results greater than respective field blank.
TN 84.20-102.85 ug/L All Teams All sample results greater than respective field blank.
TP ND - 3.44 All Teams All sample results greater than respective field blank.
Equipment Rinsate Blanks
Analyte Sample Results Boat 1: Concord5
Land 1: N/A
Land 2: Shawsheen6
Land 3: Spicket5
CBOD ND (<3 mg/L) All Teams All sample results greater than 3 mg/L.
CBOD-20 ND (<3 mg/L) Boat 1 All Boat 1 results greater than 3 mg/L.
6 mg/L Land 2 All Land 2 results greater than 6 mg/L.
5 mg/L Land 3 Sample Spicket5-G = 5mg/L. All other Land 3 results were greater than 5mg/L.
CHLA ND (<0.5 mg/m3) All Teams All sample results greater than 0.5 mg/m
3
E. coli ND (<1 MPN/100mL) Boat 1 All Boat 1 sample results greater than 1 MPN/100mL
6.1 MPN/100mL Land 2 All Land 2 results greater than 6.1 MPN/100mL
ND (<1 MPN/100mL) Land 3 All Land 3 sample results greater than 1 MPN/100mL
Fecal Coliform ND (<1 MPN/100mL) Boat 1 All Boat 1 sample results ND or greater than 1 MPN/100mL
7.4 MPN/100mL Land 2 All Land 2 results greater than 7.4 MPN/100mL
ND (<1 MPN/100mL) Land 3 All Land 3 sample results greater than 1 MPN/100mL
TSS ND (<1 mg/L) All Teams All sample results ND or greater than 1 mg/L.
DIN 157.9 ug/L Boat 1 Sample Concord2-G and Shawsheen4-G < 157.9 ug/L. All other Boat 1 results were > 157.9 ug/L.
34.6 ug/L Land 2 All Land 2 sample results greater than 34.6 ug/L.
44.7 ug/L Land 3 Sample Spicket6-G < 44.7 ug/L. All other Land 3 results were greater than 44.7 ug/L.
DON 45.6-116.0 ug/L All Teams All sample results greater than respective rinsate blank.
NH4* 152.9 ug/L Boat 1 All 7 sample results on Boat 1 less than 152.9 ug/L.
33.3 ug/L Land 2 Shawsheen3-G,6-G,7-G, & 9-G, and DUP-3< 33.3 ug/L. All other Land 2 results > 33.3 ug/L.
40.7 ug/L Land 3 Sample Spicket6-G and Spicket7-G < 40.7 ug/L. All other Land 3 results were > 40.7 ug/L.
115.91 ug/L Boat 1 All 7 sample results on Boat 1 less than 115.91 ug/L.
ND Land 2 All Land 2 results greater than ND result.
2.5 ug/L Land 3 All Land 3 results greater than 2.5 ug/L.
NOX 5.00 ug/L Boat 1 All Boat 1 results nondetect or greater than 5.00 ug/L.
1.33 ug/L Land 2 All Land 2 results greater than 1.33 ug/L.
3.99 ug/L Land 3 All Land 3 results greater than 3.99 ug/L.
PO4 ND (<3.1 ug/L) All Teams All sample results nondetect or greater than 3.1 ug/L.
POC 35.42-150.05 ug/L All Teams All sample results greater than respective rinsate blank.
PON ND (<9.8 ug/L) All Teams All sample results greater than 9.8 ug/L.
NH4* (adjusted
for field blank
detections)
Blank concentration or Range
(3 field blanks and 3 field equipment
blanks were collected for each
analyte listed)
*An audit performed for Event 1 ammonia field blank samples indicated the source of these trace ammonia concentrations was the distilled water used for
sampling.
Blank detection concentration or
Range (3 field blanks and 3 field
equipment blanks were collected for
each analyte listed)
Attachment 1: Data Validation Worksheet (Trib Event 1)

Equipment Rinsate Blanks (continued)
Analyte Sample Results Boat 1: Concord5
Land 1: N/A
Land 2: Shawsheen6
Land 3: Spicket5
TDN 80.18-273.88 ug/L All Teams All sample results greater than respective rinsate blank.
TKN 0.8-0.28 mg/L All Teams All sample results greater than respective rinsate blank.
TON 46.35-123.84 ug/L All Teams All sample results greater than respective rinsate blank.
TN 80.93-281.73 ug/L All Teams All sample results greater than respective rinsate blank.
TP ND- 4.30 ug/L All Teams All sample results greater than respective rinsate blank.
Representativeness: Yes No N/A
Yes
Yes
Yes
Yes (EAI); No (SMAST)
Comparability: Yes No N/A
Were analytical procedures and methods follows as defined in the QAPP or field change documentation? Yes
Completeness (90%): Yes No N/A
Are all data in this SDG usable? Yes
Sensitivity: Yes No N/A
Is a verification report present for method detection limits, interelement correction factors and linear ranges? No
Are MDLs present and reported? Yes (in lab QA manuals)
Do the reporting limits meet project requirements? Yes
Are results above the linear range of the instrument? Yes
Data Validator: Date: 11/17/2016
Data Reviewer: Date: 1/16/2017Sue Gryszkiewicz
Comments (note deviations): Although receipt temperature was not reported for all samples, the laboratory indicated that the
samples adhered to the sample acceptance policy. Although all analytical procedures were followed and no qualifiers were applied,
it should be noted that some E. coli species were less tolerant to the higher temperatures required by the Fecal Coliform test
resulting in Fecal Coliform< E. coli results. All samples were received and analyzed by EAI within respective hold times.
Comments (note deviations): None.
Blank detection concentration or
Range (3 field blanks and 3 field
equipment blanks were collected for
each analyte listed)
Was preservation criteria met ? (4̊ C ± 2̊ C)?
Were Chain-of-Custody records complete and provided in data package?
Comments (note deviations) : None.
Comments (note deviations): None.
Keith Vincelette
The field blank samples were prepared from distilled water. The individual sample bottles were filled at the sampling location with distilled water. The
rinsate blank samples were prepared with distilled water that was passed over the decontaminated sampling equipment and transferred to the appropriate
sample bottles.
No qualifiers were applied to the samples based on field blank and rinsate blank contamination but the data user should note that blank samples had
some minor contamination. Ammonia rinsate blanks were adjusted based on the field blank concentrations as the source was determined to be the
distilled water. Sample concentrations that were less than the blank concentrations have been highlighted.
Were sampling procedures and design criteria met?
Were holding times met?
Attachment 1: Data Validation Worksheet (Trib Event 1)

Attachment 2
June 2014 and February 2015 Ammonia Field Blank
Analysis

NH4 NH4ANLS DATE CURVE # PROJECT SAMPLE DATE SAMPLE ID (uM) (ug/L)
6/26/2014 CDM 6/25/2014 M004B 3.9 53.966/26/2014 CDM 6/25/2014 M010B 2.3 31.526/26/2014 CDM 6/25/2014 M024B 0.3 4.696/26/2014 CDM 6/25/2014 T010B 0.1 1.276/26/2014 CDM 6/26/2014 BLANK 0.0 0.006/26/2014 CDM 6/26/2014 BLANK 0.0 -0.196/26/2014 CDM 6/26/2014 BLANK 0.0 -0.196/26/2014 CDM 6/26/2014 BLANK 0.0 0.006/26/2014 CDM 6/26/2014 BLANK 0.0 0.006/26/2014 CDM 6/26/2014 BLANK 0.0 0.006/26/2014 CDM 6/26/2014 10uM STANDARD 9.3 130.076/26/2014 CDM 6/26/2014 10uM STANDARD 9.3 130.076/26/2014 CDM 6/26/2014 10uM STANDARD 9.6 134.616/26/2014 CDM 6/26/2014 10uM STANDARD 9.3 130.07
2/14/2015 CDM 2/12/2015 FB1 10.3 143.972/14/2015 CDM 2/12/2015 FB2 10.5 146.472/14/2015 CDM 2/12/2015 FB3 11.2 156.472/14/2015 CDM 2/12/2015 SMAST1 0.1 0.832/14/2015 CDM 2/12/2015 SMAST2 0.1 0.832/14/2015 BLANK 2/12/2015 BLANK 0.1 0.832/14/2015 STANDARD 2/12/2015 10uM STANDARD 9.1 127.79
2/15/2015 CDM 2/12/2015 FB1 10.9 152.412/15/2015 CDM 2/12/2015 FB2 10.3 144.502/15/2015 CDM 2/12/2015 FB3 10.9 152.412/15/2015 CDM 2/12/2015 SMAST1 0.5 6.802/15/2015 CDM 2/12/2015 SMAST2 0.5 6.802/15/2015 BLANK 2/12/2015 BLANK 0.2 2.742/15/2015 STANDARD 2/12/2015 10uM STANDARD 9.6 133.85
June 2014 and February 2015 Ammonia Field Blank AnalysisLower Merrimack River Study
Attachment 2