appendix c2 - erm · 13-347 13 may 2015 page ii kangra discard facility surface water study:...
TRANSCRIPT

Appendix C2 Hydrology Report

63 Wessel Road, Rivonia, 2128 PO Box 2597, Rivonia, 2128 South Africa
Tel: +27 (0) 11 803 5726 Fax: +27 (0) 11 803 5745 Web: www.gcs-sa.biz
GCS (Pty) Ltd. Reg No: 2004/000765/07 Est. 1987
Offices: Durban Johannesburg Lusaka Ostrava Pretoria Windhoek
Directors: AC Johnstone (Managing) PF Labuschagne AWC Marais S Pilane (HR) W Sherriff (Financial)
Non-Executive Director: B Wilson-Jones
www.gcs-sa.biz
Kangra Discard Facility Surface Water Study: Hydrology, Storm Water and Water Balance
Report
Version – 01
13 May 2015
Kangra Coal
GCS Project Number: 13-347

Kangra Kangra Discard Facility
13-347 13 May 2015 Page ii
Kangra Discard Facility Surface Water Study: Hydrology, Storm Water and Water Balance
Report
Version – 01
13 May 2015
Kangra Coal
13-347
DOCUMENT ISSUE STATUS
Report Issue Draft
GCS Reference Number GCS Ref - 13-347
Client Reference GCS Surface Water Study – Proposed Discard Facility
Title Kangra Discard Facility Surface Water Study: Hydrology,
Storm Water and Water Balance
Name Signature Date
Author Maxwell Ndou
June 2014
Co-Author Daniel Fundisi May 2015
Document Reviewer Karen King
May 2015
Director Pieter Labuschagne
May 2015
LEGAL NOTICE This report or any proportion thereof and any associated documentation remain the property of GCS until the mandator effects payment of all fees and disbursements due to GCS in terms of the GCS Conditions of Contract and Project Acceptance Form. Notwithstanding the aforesaid, any reproduction, duplication, copying, adaptation, editing, change, disclosure, publication, distribution, incorporation, modification, lending, transfer, sending, delivering, serving or broadcasting must be authorised in writing by GCS.

Kangra Kangra Discard Facility
13-347 13 May 2015 Page iii
EXECUTIVE SUMMARY
GCS Water and Environment (Pty) Ltd. (GCS) were appointed by Kangra Coal (Pty) Ltd.
(Kangra) to conduct a hydrological assessment study for the proposed discard facility at
Kangra Coal Mine, in the Mpumalanga Province of South Africa. The components of the
hydrological assessment include Water Quality (WQ) analysis, a Water Balance (WB), a Storm
Water Management Plan (SWMP), a Flood Line Analysis and a Risk Assessment. The Kangra
Coal Mine is situated approximately 40km from Piet Retief Town along the N2 National Road.
The proposed site for the discard facility falls on the border between quaternary catchments
W51B and W52A.
The SWMP was undertaken in accordance with the General Notice 704 (GN704) of the South
African National Water Act (Act 36 of 1998) which stipulates guidelines for the prevention or
reduction of pollution of natural surface water resources (South Africa, 1998). The WB was
conducted to adhere to the Department of Water Affairs (DWA) – now the Department of
Water and Sanitation (DWS) - Best Practice Guidelines (BPG) G2: Water and Salt balances
(DWA, 2006). In order to ensure that the proposed developments comply with GN704, 1:50-
year and 1:100-year flood levels for rivers within the vicinity of the proposed discard facility
were calculated and the exclusion zones were determined.
This report details the methodology, results, conclusions and recommendations emanating
from the hydrological assessment study components as outlined above.
Methodology
Industry-accepted algorithms and methodologies were used in undertaking the
aforementioned study components. Results of the Water Resources of South Africa Study;
WRC Reports TT 380 to 382/08 (WRC, 2005), used for base-line runoff data. Three small
subcatchments (areas < 15km2) were delineated using ArcGIS software. The Rational Method
was used to calculate peak flows for the delineated catchments since it is a widely used
method developed for small catchments that is proven for producing acceptable results. The
point precipitation data used was taken from the South African Weather Service (SAWS)
station number 0443807 – Brereton Park.

Kangra Kangra Discard Facility
13-347 13 May 2015 Page iv
Regional Climate
The Mean Annual Precipitation (MAP) of the project was calculated as 877.5 mm while the
Mean Annual Evaporation (MAE) stands at 1654.2 mm (GCS, 2013). The maximum
temperatures for the site average around 260C, while the minimum temperatures in winter
drop as low as 40C (GCS, 2013).
Peak Flows
The 1:50-year and 1:100-year flood depths showed no significant difference due to small
channels with steep river banks (See Table 5.11).
Flood Lines
A flood line analysis was undertaken for the following rivers: The Gude, Voor, Mpundu,
Assegaai and Hlelo Rivers. The flood lines were calculated in HEC-RAS (US Army Corps of
Engineers, 1995) and the Rational Method flood depths were used as input flows. No
encroachment of the infrastructure into the Flood lines and Exclusion zones was noted.
Therefore, the risk of flood inundation as a result of the investigated flood events (1:50-year
and 1:100-year) is unlikely.
Downstream Water Uses
The Water Authorisation Registration Management System (WARMS) database of the
Department of Water and Sanitation (DWS) revealed that commercial forestry and irrigated
agriculture dominate water use in the downstream segment of the Discard Dump site. Mining
and industrial water uses were observed to take an insignificantly small proportion of the
downstream water allocation (See Section 5.7).

Kangra Kangra Discard Facility
13-347 13 May 2015 Page v
Baseline Water Quality
Water quality evaluations were undertaken at 6 sampling points in and around the site area;
these points can be seen in Figure 6.1. The water samples indicated relatively good water
quality in compliance to the South African Water Quality Guidelines (SAWQG) and the South
Africa National Standards (SANS), except for one sample (Maquasa Surface Water 2 (Maq-SW
2)) which had a non-compliant sulphate concentration (Table 6-2). This sample was collected
closer to the Maquasa East Pits and probably lies within the flow direction of effluent from
these pits. It is recommended that the PCD to be constructed to contain effluent from the
Discard Dump should also be designed to contain the excess effluent from these Maquasa East
Pits, in order to prevent the seepage of contaminated water into the environment. Sumps
should be placed at the bottom of these pits with the effluent finally destined for the PCD.
All recommended mitigation measures can be seen in Section 7, which describes the
separation of clean and dirty water catchments to avoid the contamination of clean water
sources.
SWMP
The channelisation and containment of all dirty water, including water containing sediments,
is fully described in the Section 7. Drains are recommended to channel storm water and berms
are recommended for the interception of runoff to ensure that there is no mixing of clean
and dirty water at the Discard Dump site (see Figure 7.3).
WB
The WB recommends a PCD with a minimum capacity of 1 485 400 m3 in order to contain the
effluent from the Discard Dump as well as from back-filled mine pits located to the east of
the discard facility. This figure agrees with the 1 450 000 m3 value recommended by Geo Tail
(2014). Some of the waste water can be recycled and re-used within the mine operations,
thereby minimising the amount of waste water to be discharged into the environment.
Risk Assessment
The identified risks posed by the construction and operation of the Discard Facility, including
all supplementary activities, can be mitigated by adhering to the recommended SWMP and
the mine’s waste disposal plan. Continuous WQ Monitoring is recommended to assess the
effectiveness of the SWMP and to identify any need to either augment or upgrade the existing
system in order to ensure continued compliance to the relevant environmental legislation.

Kangra Kangra Discard Facility
13-347 13 May 2015 Page vi
CONTENTS PAGE
1 INTRODUCTION .......................................................................................................................... 2
2 SCOPE OF WORK ........................................................................................................................ 3
3 METHODOLOGY ......................................................................................................................... 4
4 SITE LOCATION ........................................................................................................................... 5
5 CATCHMENT HYDROLOGY .......................................................................................................... 7
5.1 CATCHMENT DELINEATION, CHARACTERISATION AND PROPERTIES ............................................................ 7 5.2 REGIONAL CLIMATE ........................................................................................................................ 7 5.3 MEAN ANNUAL RAINFALL (MAP) AND MEAN ANNUAL EVAPORATION (MAE) ......................................... 7 5.4 MEAN ANNUAL RUNOFF ................................................................................................................. 8 5.5 FLOOD FLOWS AND VOLUMES .......................................................................................................... 8 5.6 FLOOD LINES ............................................................................................................................... 11
Approach......................................................................................................................... 13 Analysis ........................................................................................................................... 17 Results ............................................................................................................................. 18 Modelling accuracy ......................................................................................................... 20
5.7 DOWNSTREAM WATER USES .......................................................................................................... 22
6 BASELINE WATER QUALITY ....................................................................................................... 23
7 CONCEPTUAL STORM WATER MANAGEMENT PLAN ................................................................ 27
7.1 GUIDELINES CONSIDERED............................................................................................................... 27 7.2 CLEAN AND DIRTY WATER CATCHMENT DELINEATION ........................................................................ 28 7.3 CLEAN WATER DIVERSION .............................................................................................................. 29 7.4 DIRTY WATER CONTAINMENT ......................................................................................................... 32 7.5 SOIL EROSION MEASURES .............................................................................................................. 33
8 WATER BALANCE ...................................................................................................................... 35
9 RISK ASSESSMENT .................................................................................................................... 39
9.1 SURFACE WATER IMPACTS ASSESSMENT .......................................................................................... 39 9.2 KEY ISSUES AND SCENARIOS ........................................................................................................... 42
Changes to water quality of the rivers ............................................................................ 43 Changes in catchment runoff characteristics .................................................................. 43 Changes in Catchment Characteristics............................................................................ 44
10 CONCLUSIONS AND RECOMMENDATIONS ............................................................................... 48
11 REFERENCE ............................................................................. ERROR! BOOKMARK NOT DEFINED.

Kangra Kangra Discard Facility
13-347 13 May 2015 Page vii
LIST OF TABLES
Table 5-1 Mean annual runoff for catchments W52A and W51B ............................... 8 Table 5-2 Design rainfall depths ..................................................................... 8 Table 5-3 Main catchment areas and their parameters ........................................ 10 Table 5-4 Storm flows for sub-catchments within catchment A. ............................. 10 Table 5-5 Storm flows for sub-catchments within catchment B. ............................. 11 Table 5-6 Storm flows for sub-catchments within catchment C. ............................. 11 Table 5-7 Criteria for cross section selection .................................................... 13 Table 5-8 factors influencing flood line determination [Adapted from: .................... 15 Table 5-9 Criteria assigned to cross sections ..................................................... 17 Table 5-10 Average slopes of river sections analysed ............................................ 17 Table 5-11 Flood levels ................................................................................ 18 Table 5-12 Froude numbers & channel flow velocities........................................... 18 Table 5-13 Summary of downstream water uses .................................................. 22 Table 6-1 Water quality type ........................................................................ 24 Table 6-2 Chemical analysis results ................................................................ 25 Table 7-1 Summary of flood peak calculations [Adapted from: Geo Tail (Pty) Ltd, 2014] 31 Table 7-2 Channel sizing and parameters ......................................................... 31 Table 7-3 Channel sizing and parameters ......................................................... 33 Table 8-1 Annual average water balance ......................................................... 37 Table 9-1: Risk Assessment Significance Value.................................................... 41 Table 9-2: Risk Rating Matrix ......................................................................... 42 Table 9-3 Construction phase risk assessment ................................................... 45 Table 9-4 Operational phase risk assessment .................................................... 46 Table 9-5 Closure phase risk assessment .......................................................... 47
LIST OF FIGURES
Figure 4-1 Kangra Coal: Maquasa Site Location .................................................... 6 Figure 5-1 Catchments considered for peak flows [Adapted from: GCS 2013] .............. 12 Figure 5-2 Initially selected cross sections [Adapted from: GCS 2013] ....................... 14 Figure 5-3 Profile plot (top view) ................................................................... 19 Figure 5-4 Profile plot (side view) .................................................................. 19 Figure 5-5 Proposed Kangra Discard Facility 100m river buffer areas ........................ 21 Figure 6-1 Sampling Point Location ................................................................. 26 Figure 7-1 Cross section of the proposed earth channel and berm ........................... 29 Figure 7-2 Sketch depicting the proposed culvert ............................................... 32 Figure 7-3 Layout indicating proposed storm water infrastructure ........................... 34 Figure 8-1 Kangra discard dump process flow diagram .......................................... 36

Kangra Kangra Discard Facility
13-347 13 May 2015 Page 1
GLOSSARY OF TERMINOLOGY
Berm: A wall designed and constructed to change the direction of a natural surface water flow
path.
Catchment: That area from which any surface runoff will naturally drain to a specified point.
Clean water: Natural runoff water from a catchment area that has not been contaminated
through contact with known pollutants.
Dirty water: Water that has been, or could potentially become, contaminated through contact
with known pollutants.
Dirty water system: Any systems designed to collect, convey, contain, store or dispose of
dirty water.
Drainage channel: An artificial flow path designed to convey water.
Hydrology: The study of natural water cycles that includes rainfall, evaporative and
transpiration losses and resulting surface flows.
Pollution Control Dams (PCD): Specialised storage dams designed to prevent environmental
pollution by containing and storing dirty water runoff for safe disposal through evaporation or
by any other environmentally responsible process.
Raw Water Dam (RWD): Specialised storage dams designed to use water storage for
operational and process purposes.
Runoff: Water that falls as rainfall and is not lost through evaporation, transpiration or deep
percolation into the ground. This water either does not penetrate soils but flows directly
across the soil surface, or re-emerges from local soils to flow on the surface along natural flow
paths or watercourses.
Watercourse: Watercourse refers to a river or spring; a natural channel in which water flows
regularly or intermittently; a wetland, lake or dam into which, or from which water flows and
any collection of water which the Minister may by notice in the Gazette, declare to be a
watercourse, and a reference to a watercourse includes, where relevant, its beds and banks
(National Water Act 1998 (Act 36 of 1998)).

Kangra Kangra Discard Facility
13-347 13 May 2015 Page 2
1 INTRODUCTION
GCS Water and Environment (Pty) Ltd. (GCS) were appointed by Kangra Coal (Pty) Ltd.
(Kangra) to conduct a hydrological assessment, water quality analysis, Water Balance (WB),
Storm Water Management Plan (SWMP) and Risk Assessment for their proposed new discard
facility, and to calculate flood lines in the vicinity of the proposed facility. It is understood
that the discard facility will be constructed in three phases with an HDPE liner to limit
groundwater pollution; the liner for each subsequent phase will be constructed while
deposition in the current phase is ongoing and rehabilitation will take place concurrently. It
is further understood that both the discard facility and associated Pollution Control Dam (PCD)
will be lined.
The SWMP was undertaken in accordance with General Notice 704 (GN704) of the South African
National Water Act (36 of 1998) in order to reduce or prevent pollution of natural surface
water resources. This was undertaken by proposing berms and channels around the discard
facility to divert clean water away from the proposed discard facility as well as channelling
dirty water to the proposed PCD. A report detailing a SWMP study that was conducted by
iLanda Water Services for Geo Tail (Pty) Ltd. was used within this study. On the facility,
seepage will be limited owing to the liner used; this will have an impact on the PCD since all
water from the facility will be routed to the PCD (Geo Tail, 2014).
The SWMP was accompanied by a Process Flow Diagram (PFD) and WB which show water
movement within the discard facility and to the proposed PCD, as well as associated losses.
The WB was conducted in accordance with the Department of Water Affairs (DWA) – now the
Department of Water and Sanitation (DWS) Best Practice Guidelines (BPG) G2: Water and Salt
balances (DWA, 2006).
In order to ensure that the proposed developments comply with GN704, flood levels for rivers
within the vicinity of the proposed discard facility were analysed in order to establish the
1:50-year and 1:100-year flood lines. The results indicated that both the 1:50- and 1:100-year
storm events do not cause flood levels that are outside of the 100 m buffer zone, therefore
the 100 m buffer zone was used to delineate the Exclusion Zone, in accordance with GN704
regulations.
The current water quality status of the study area as well as the surrounding areas was also
analysed in order to establish the baseline water quality of the study site. The water quality
samples were collected from six sampling points and were assessed against the SAWQG and
SANS targets.

Kangra Kangra Discard Facility
13-347 13 May 2015 Page 3
A Risk Assessment for the proposed discard facility, with associated mitigation measures, was
undertaken.
2 SCOPE OF WORK
The scope of work for this study included:
• Information collection and literature study:
o A desktop study to review all existing information available.
• Baseline Assessment / Analysis:
o Establishment of the baseline conditions utilising existing information, and
o Description of the affected environment, including downstream water users.
• Hydrology:
o Climate and rainfall evaluation;
o Catchment Delineation;
o Mean Annual Runoff (MAR), and
o Peak flow analysis.
• Water Balance:
o Process Flow Diagram (PFD), and
o Development of an annual average, Excel spreadsheet-based Water Balance
in DWA format.
• Conceptual Storm Water Management Plan (SWMP):
o Developed according to the Best Practice Guideline G1: Storm Water
Management by DWAF, 2006.
• Flood line analyses (modelling)
o Flood line analysis using HEC-RAS software
• Risk Assessment
o A risk assessment for the discard facility, and
o Associated mitigation measures
• Reporting:
o A project draft report detailing the results of all of the activities listed above,
and
o Recommendations made for additional work and data requirements.

Kangra Kangra Discard Facility
13-347 13 May 2015 Page 4
3 METHODOLOGY
This study commenced with the acquisition of relevant data in respect of the hydrology of the
proposed Kangra Discard Facility site. The GCS 2008 hydrology Kangra Proposed Power Station
Hydrology Report (GCS, 2008) provided a significant portion of the basis for this study.
A holistic approach was followed and an attempt was made to link local hydrological, water
quality and environmental studies to regional and national concerns, regulations and
management strategies.
The SWMP was compiled in accordance with the DWA (now DWS) BPG G1: Storm Water
Management (DWA, 2006). The discard facility was delineated as a dirty area and the SWMP
was thus designed such that all discard water and rain water that falls on the discard facility
is contained within the facility. A system of drainage channels and berms was proposed in
order to achieve this. The contained water will then be channelled to the proposed pollution
control dam while all clean water that flows from upstream of the discard facility will be
diverted around the facility.
The Water Balance simulation was developed to understand the movement of water between
the discard facility and the pollution control dam. Both the discard facility and pollution
control dam will have rainfall as a direct water input and evaporation was treated as an
output. It was assumed that runoff will be channelled to the pollution control dam, as
described in the SWMP. The identified water input from mining operations is the water that
will be deposited with the discard material. This water will also be channelled to the pollution
control dam, were it will be stored and can be returned to the process plant. Excess water
will be allowed to evaporate. The decant water that is anticipated to come from pits on the
eastern side of the facility was included in the Water Balance simulation for future scenarios.
The design for the PCD associated with the discard facility was taken from a report by iLanda
Water Services for Geo Tail (Pty) Ltd. (Geo Tail, 2014).
Flood lines were assessed in accordance with the regulations stipulated within the South
African National Water Act (36 of 1998) (South Africa, 1998)It was decided to select 1 cross
section per stream for a basic height determination of flow through the cross section. The
cross section was selected in such a way that the highest possible risk would be captured
(closest to infrastructure). After careful consideration off all the above mentioned aspects, it
was decided to only analyse 6 streams, namely 3, 5, 6, 8, 10, and 14 (Figure 5-1).

Kangra Kangra Discard Facility
13-347 13 May 2015 Page 5
Baseline water quality data was obtained from a study that was conducted by GCS (GCS, 2013).
Six points were sampled and were sent to the laboratory for analysis. The results from the
laboratory were assessed against the SAWQG and SANS standards.
Generally-accepted algorithms and methodologies were used to determine design floods at
various points in the area, in order to estimate flood levels and to draw the flood lines at
these points. Software used in the study includes the following:
• ArcView10.1 (ESRI, 2012) for Geographic Information Systems (GIS) work and
mapping;
• HEC-RAS (US Army Corps of Engineers, 1995) modelling software for hydraulic
calculation of flow depths, and
• Results of the Water Resources of South Africa Study; WRC Reports TT 380 to
382/08 (WRC, 2005), used for base-line runoff data.
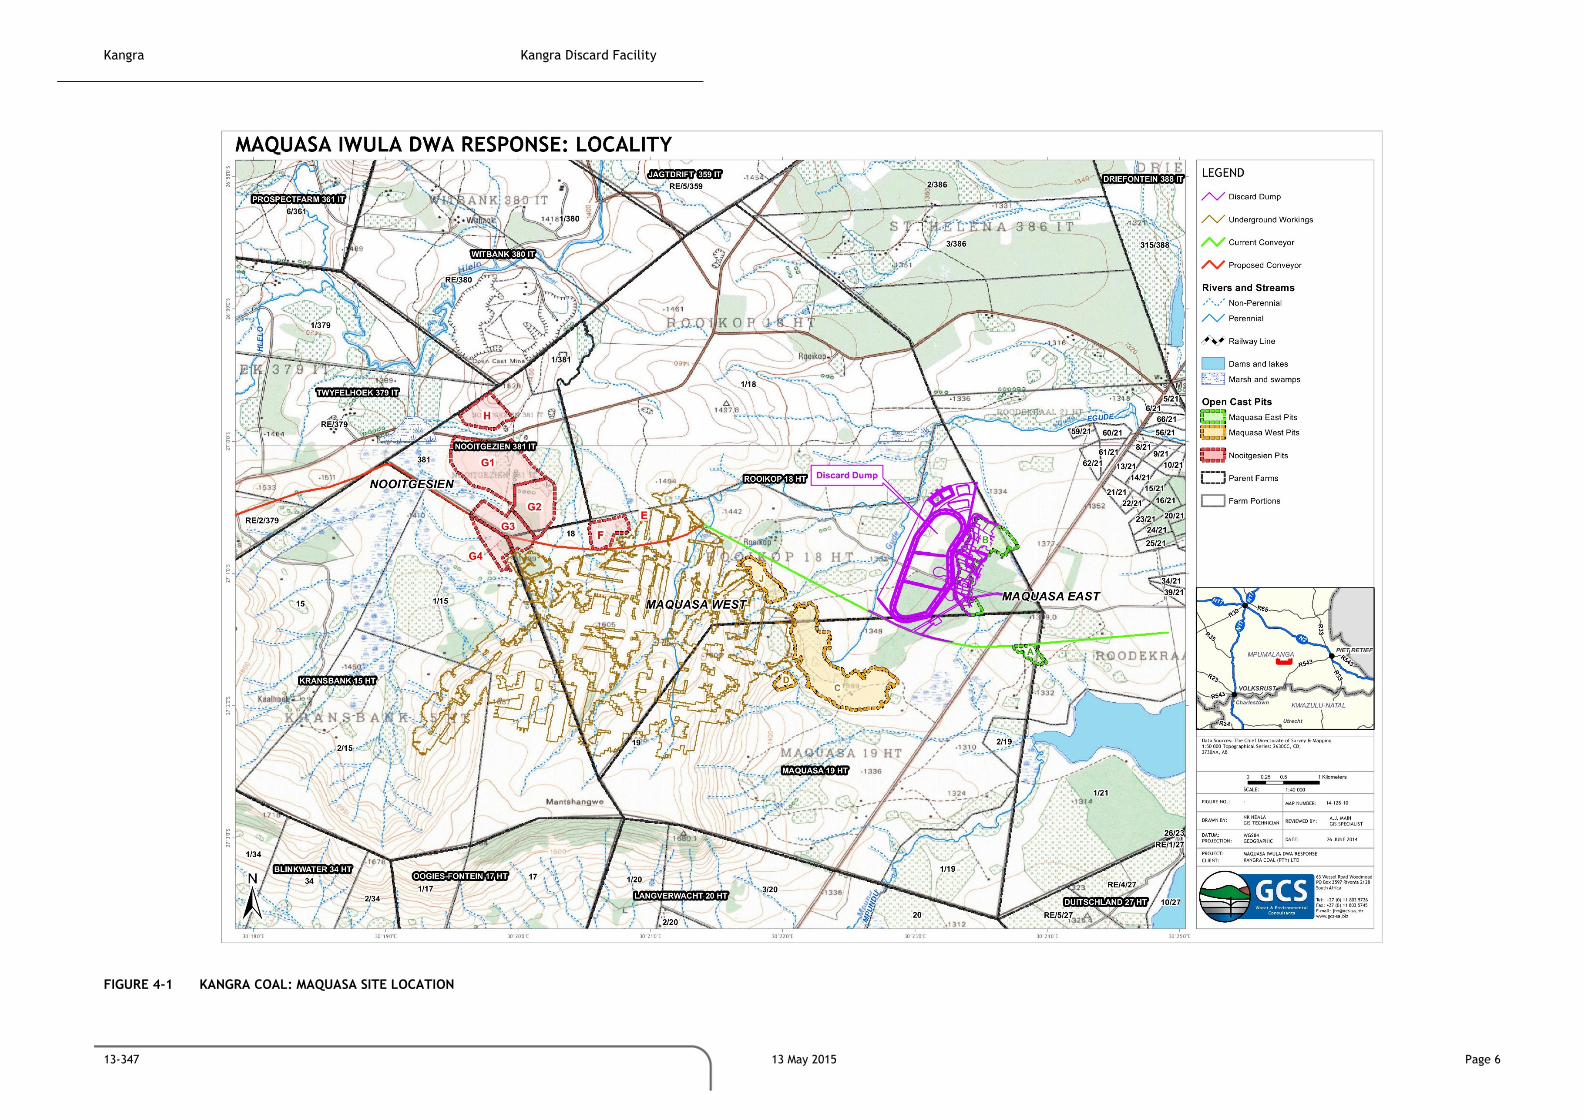
4 SITE LOCATION
The site under investigation is situated near Piet Retief within the Usutu catchment area under
the jurisdiction of the Mkhondo Local Council, Mpumalanga Province of South Africa (See
Figure 4-1). By road the site is approximately 27 km north of the town of Dirkiesdorp and 58
km west of Piet Retief.
Kangra Kangra Discard Facility
13-347 13 May 2015 Page 6
FIGURE 4-1 KANGRA COAL: MAQUASA SITE LOCATION
Kangra Kangra Discard Facility
13-347 13 May 2015 Page 7
5 CATCHMENT HYDROLOGY
The 2008 Kangra Hydrology Report compiled by GCS (GCS, 2008) provides a general
understanding of the surrounding catchment area and information on land cover, river bed
characteristics and flood plain areas.
5.1 Catchment delineation, characterisation and properties
The proposed site falls within quaternary catchment W51B, which is the second catchment of
the Assegaai River. The majority of the project area runoff will drain into this river system.
The area draining to the site falls within two quaternary catchments; W52A, which covers
approximately 25% of the area and W51B, which covers the majority of the project area,
approximately 75%.
5.2 Regional climate
The study area lies at an average altitude of approximately 1430m. It is located in the South
African Highveld sub-humid climatic zone, which is a warm, mild summer rainfall region. It is
characterised by warm, wet summers and cool, dry winters. During the warm summer months
of December and January the average daily temperature is between 200C and 260C, while the
minimum temperatures in winter drop as low as 40C.
5.3 Mean Annual Rainfall (MAP) and Mean Annual Evaporation (MAE)
The closest reliable rainfall station to the area is the Piet Retief Weather Station. The record
from this weather station was used in the GCS 2008 Kangra hydrology study. Rainfall was
recorded at this station from January 1935 to January 1979 and evaporation was recorded
from March 1957 to March 1979. Using these data, the monthly average rainfall (MAP) and
evaporation (MAE) were calculated as 877.5 mm and 1654.2 mm, respectively (Refer to Page
9 of the GCS 2008 Kangra Hydrology Report for monthly average rainfall and evaporation).

Kangra Kangra Discard Facility
13-347 13 May 2015 Page 8
5.4 Mean Annual Runoff
The runoff data used was extracted from the WR2005 database (WRC, 2008). The calculated
mean annual runoff can be seen in Table 5-1.
TABLE 5-1 MEAN ANNUAL RUNOFF FOR CATCHMENTS W52A AND W51B
Month
Runoff (mm)
W52A W51B
Oct 4.43 4.314516
Nov 10.5 8.87
Dec 17.48 13.75
Jan 21.09 17.14
Feb 19.32 14.96
Mar 13.71 10.40
Apr 8.31 6.59
May 4.62 4.23
Jun 2.58 2.98
Jul 1.84 2.42
Aug 1.56 2.02
Sep 1.7 1.98
TOTAL 107.14 89.66
5.5 Flood Flows and Volumes
Design rainfall depths used in the design calculations are shown in Table 5-2. Rainfall is the
primary input needed in order to generate flow sequences. The design rainfall data used was
taken from the SAWB (South African Weather Bureau) station 0443807 – Brereton Park.
TABLE 5-2 DESIGN RAINFALL DEPTHS
Station Name Brereton Park
NUMBER 0443807
Return Period (years) 2 5 10 20 50 100
Design Rainfall (mm) 63 87 106 126 155 180
The rational method was used, in accordance with the Drainage manual 5th edition compiled
by South African Road Agency Limited (SANRAL, 2006), for calculating peak flows for the site.

Kangra Kangra Discard Facility
13-347 13 May 2015 Page 9
The runoff that is generated from a catchment will depend on the:
• Characteristics of the storm event;
• The response characteristics of the catchment, and
• The influence of temporal storage on the run-off.
For the catchments at the proposed Kangra discard facility site, the aforementioned
parameters are listed in Table 5-3.
Table 5-4,

Kangra Kangra Discard Facility
13-347 13 May 2015 Page 10
Table 5-5 and Table 5-6 show the calculated peak flows for 1:50-year and 1:100-year events
for catchments A, B and C, respectively (See Figure 5-1).
TABLE 5-3 MAIN CATCHMENT AREAS AND THEIR PARAMETERS
Catchment Area (km2)
Water course (km)
Height Difference (m)
Catchment A 26.325 12.05 360
Catchment B 10.125 4.61 280
Catchment C 10.35 6.98 270
TABLE 5-4 STORM FLOWS FOR SUB-CATCHMENTS WITHIN CATCHMENT A.
Sub-catchment
Area (km2)
1:50 year (m3/s)
1:100 year (m3/s)
7 3.04 33.54 42.48
8 1.58 17.40 22.02
12 2.03 22.36 28.32
13 1.01 11.18 14.16
14 3.38 37.27 47.20
20 2.81 31.06 39.33
21 0.79 8.70 11.01
22 0.90 9.93 12.59
23 1.46 16.15 20.45
24 1.46 16.15 20.45
32 1.80 19.88 25.17
33 2.02 22.36 28.32
34 3.49 38.51 48.77
35 0.56 6.21 7.87
TOTAL 26.33 290.69 368.13

Kangra Kangra Discard Facility
13-347 13 May 2015 Page 11
TABLE 5-5 STORM FLOWS FOR SUB-CATCHMENTS WITHIN CATCHMENT B.
Sub-catchment
Area (km2)
1:50 year (m3/s)
1:100 year (m3/s)
9 2.81 65.73 83.24
11 2.13 49.95 63.26
25 0.68 15.78 19.98
26 1.69 39.44 49.94
27 2.81 65.73 83.24
TOTAL 10.13 236.63 299.66
TABLE 5-6 STORM FLOWS FOR SUB-CATCHMENTS WITHIN CATCHMENT C.
Sub-catchment
Area (km2)
1:50 year (m3/s)
1:100 year (m3/s)
6 3.04 50.91 64.47
15 2.93 49.02 62.08
18 2.48 41.48 52.53
19 1.91 32.05 40.59
TOTAL 10.35 173.47 219.68
5.6 Flood lines
Flood lines on selected river sections are analysed to evaluate risks associated with potential
flooding of infrastructure and to facilitate the protection of natural resources (GCS, 2013).
Within the GCS 2013 Kangra Hydrology Study, flood lines were calculated to indicate areas
which the proposed infrastructure should not be built. The significant streams/rivers that
were studied are the:
• Gude River;
• Voor River;
• Mpundu River;
• Assegaai River, and the
• Hlelo River.
GN704 stipulates that no mining infrastructure is allowed to be placed and/or constructed
closer than 100m from a river or within the 1:100 year flood line (GCS, 2013). The General
Notice also stipulates that no open cast mining pit is allowed to be placed closer than 100m
or within the 1:50 year flood line of a watercourse. All watercourses that are in close
proximity to existing or proposed infrastructure or pits were identified (Figure 5-1) (GCS,
2013).

Kangra Kangra Discard Facility
13-347 13 May 2015 Page 12
FIGURE 5-1 CATCHMENTS CONSIDERED FOR PEAK FLOWS [ADAPTED FROM: GCS 2013]