appendix c rapid cumulative impacts assessment · appendix c – rapid cumulative impacts...
TRANSCRIPT

Appendix C: Rapid Cumulative Impacts Assessment
DAP Supplemental Environmental and Social Assessment Report
i
Appendix C – Rapid Cumulative Impacts Assessment
PT. Domas Agrointi Prima (DAP) Oleochemical Project – Medan, Indonesia
June 2017
Prepared for Pacific Harbor Group

ESSA Technologies Ltd.
ii
Appendix C – Rapid Cumulative Impacts Assessment
PT. Domas Agrointi Prima (DAP) Oleochemical Project – Medan, Indonesia
Prepared for:
Pacific Harbor Group
June 2017
Contact:
Warren Allderige
Suites 1416 – 17,
14/F Jardine House,
1 Connaught Place,
Central, Hong Kong
Contact: [email protected] +1 613-798-1300
Cover Photo: View of Kuala Tanjung coast © 2015 Google Earth
ESSA Technologies Ltd. Vancouver, BC Canada V6H 3H4
www.essa.com

Appendix C: Rapid Cumulative Impacts Assessment
DAP Supplemental Environmental and Social Assessment Report
3 | P a g e
Table of Contents Objectives and approach ........................................................................................................................................................ 5 1
1.1 Objectives and scope of the RCIA ............................................................................................................................. 5
1.2 Methodological approach and limitations ................................................................................................................... 5
1.3 Sources of information and limitations of the RCIA ................................................................................................... 6
Selected VECs and spatial and temporal boundaries .......................................................................................................... 7 2
2.1 Ecological and socioeconomic context ...................................................................................................................... 7
2.2 Priority VECs ........................................................................................................................................................... 10
2.3 Spatial and temporal boundaries ............................................................................................................................. 11
Other activities and environmental drivers ......................................................................................................................... 16 3
3.1 Other activities ......................................................................................................................................................... 16
3.2 Climate change ........................................................................................................................................................ 24
Current status and trends of selected VECs ...................................................................................................................... 26 4
4.1 Marine habitats ........................................................................................................................................................ 26
4.2 Water supplies ......................................................................................................................................................... 29
4.3 Air quality ................................................................................................................................................................. 34
4.4 Community Health and Safety ................................................................................................................................. 35
4.5 Local livelihoods ...................................................................................................................................................... 36
4.6 Summary of VEC status and trends ........................................................................................................................ 38
Cumulative impacts on selected VECs ............................................................................................................................... 41 5
5.1 Marine habitats ........................................................................................................................................................ 41
5.2 Water supplies ......................................................................................................................................................... 41
5.3 Air quality ................................................................................................................................................................. 42
5.4 Community Health and Safety ................................................................................................................................. 42
5.5 Local livelihoods ...................................................................................................................................................... 43
Significance of predicted cumulative impacts ................................................................................................................... 45 6
6.1 Marine Habitats ........................................................................................................................................................ 45
6.2 Water Supplies ........................................................................................................................................................ 45
6.3 Air quality ................................................................................................................................................................. 45
6.4 Community Health and Safety ................................................................................................................................. 46
6.5 Local Livelihoods ..................................................................................................................................................... 46
6.6 Summary of identified impacts on prioritized and their significance ........................................................................ 47
Endnotes ........................................................................................................................................................................................ 51

ESSA Technologies Ltd.
4
List of Figures Figure 1: Process for cumulative impact assessment ....................................................................................................................... 6
Figure 2: Regional overview, the red marker shows the DAP complex location ............................................................................... 7
Figure 3. Freshwater Ecoregion – North Central Sumatra, and Western Malaysia (Source: Abell et al. 2008) ................................ 8
Figure 4. Terrestrial Ecoregions, the DAP complex was located within an ecoregion characterized by mangroves in 2001. .......... 9
Figure 5. Area of analysis (Source: Google Earth satellite imagery) ............................................................................................... 13
Figure 6. Nearby industries, InAlum, and Wilmar Refinery .............................................................................................................. 18
Figure 7: Marine ecoregions with the Malacca Strait shown in yellow ............................................................................................ 27
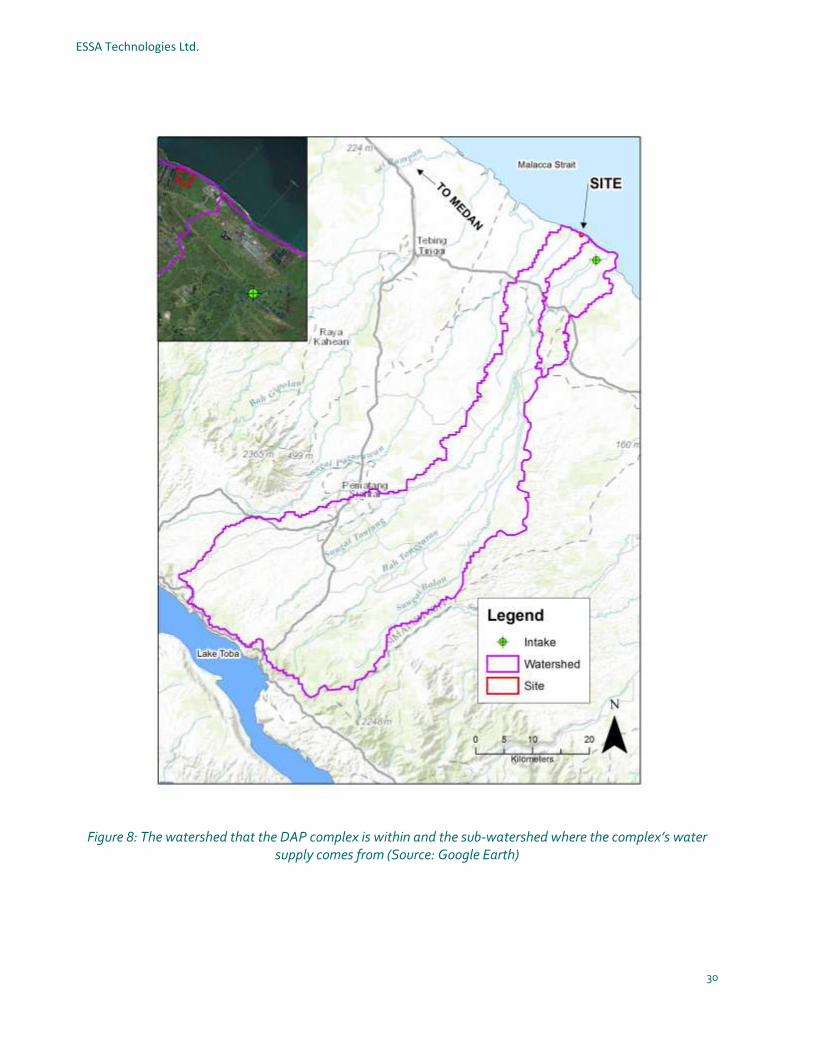
Figure 8: The watershed that the DAP complex is within and the sub-watershed where the complex’s water supply comes from (Source: Google Earth) .................................................................................................................................. 30
Figure 9: Map of the baseline water stress in North Sumatra, higher values indicate more competition among users. The DAP Complex is located within the darker yellow area seen in the middle of the figure (Source: Aqueduct project) ................................................................................................................................................................... 31
Figure 10: The Besar River mouth as it drains out into the Malacca Strait. Retrieved from Google Earth, taken by Ruli Indra, titled, Sungai di sekitar Inalum Kuala Tanjung (River around Inalum Kuala Tanjung). .......................................... 32
Figure 11: DAP’s water intake point along the Besar River. Imagery from Google Earth, taken in 2014 ........................................ 32
Figure 12: The city of Inderapura, the Besar River is seen running through the middle of the image. Imagery from Google Earth. ...................................................................................................................................................................... 34
Figure 13: The proposed transportation corridor to the DAP facility. Inset images show the street view conditions (Source: Imagery from Google Earth and Google Street View). ........................................................................................... 36
Figure 14: Likelihood and level of impact matrix (Source: Hardner et al. 2015) .............................................................................. 47
List of Tables Table 1: Current activities and future developments impacting the VECs....................................................................................... 23
Table 2: Water availability predictions for Sumatra ......................................................................................................................... 24
Table 3: Phytoplankton data comparison ........................................................................................................................................ 28
Table 4: Summary of VEC status and trends .................................................................................................................................. 39
Table 5: Cumulative impacts identified for the prioritized VECs ...................................................................................................... 44
Table 6: Significance of impacts on VECs....................................................................................................................................... 48

Appendix C: Rapid Cumulative Impacts Assessment
DAP Supplemental Environmental and Social Assessment Report
5 | P a g e
Objectives and approach 1
1.1 Objectives and scope of the RCIA
Cumulative impacts can be defined as the change to the environment caused by the incremental and/or combined
effects of an action/project in combination with other present, past, and reasonably foreseen future actions1. These
changes may result in significant impacts that would not be expected in the case of stand-alone projects. For
practical reasons, the identification and management of cumulative impacts are limited to those effects generally
recognized as important on the basis of scientific concerns and/or concerns of affected communities.
IFC’s Performance Standard 1 requires clients to ensure that their assessment of environmental and social
risks/impacts determines the degree to which the project under review is contributing to cumulative effects. Based
on this requirement, the present Rapid Cumulative Impacts Assessment (RCIA) has been developed, according to
international best practice2, to identify the cumulative impacts on valued environmental and/or social components
that the Project might contribute to and preliminarily assess the significance of these cumulative effects.
This RCIA analysis has two objectives:
Provide a preliminary high-level assessment of how the combined effects of the Project with other projects
and activities, and natural environmental drivers, could affect valued environmental and social components
(VECs) in the Project’s area; and
Assess the significance of the identified cumulative risks and impacts, evaluate the Project’s contribution to
these impacts and suggest management measures that could be implemented to prevent unacceptable
VEC condition and for which the Project could contribute.
1.2 Methodological approach and limitations
ESSA has conducted the present RCIA according to international best practice, particularly the IFC’s Good Practice
Handbook on Cumulative Impact Assessment and Management (2013), and commensurate to the significance of
the anticipated impacts and the expected contribution of the Project’s to these incremental impacts in the industrial
estate where the DAP facility is located.
International methodologies for the assessment of cumulative impacts usually adopt a step-based approach with
includes the following common steps, to be followed in a sequential manner although iterations are usually required:
1. Scoping of Valued Environmental and Social Components (VECs) and spatial and temporal boundaries
2. Scoping of other activities and external drivers
3. Establish information on baseline status of VECs
4. Assess cumulative impacts on VECs

ESSA Technologies Ltd.
6
5. Assess significance of predicted cumulative impacts
6. Management of cumulative impacts
The selection of appropriate VECs allows the assessment to be focused on those aspects of the natural and human
environment that are of greatest importance to society3. The use of VECs also improves the effectiveness and
efficiency of assessment, in part by facilitating the selection of appropriate study methods and focusing analysis on
key project-environment interactions.
Figure 1: Process for cumulative impact assessment
1.3 Sources of information and limitations of the RCIA
This RCIA has been developed based on easily accessible information, mostly secondary data although we have
also incorporated the information from the recent baseline studies conducted by PT Hatfield in 2016 for marine
habitats, seawater, groundwater, and freshwater, as well as additional social baseline information compiled by the
DAP team. Other sources of information included Google imagery and data from reputable online sources that
provided quantitative and qualitative data about surrounding environmental, industrial and social activities at various
scales. The RCIA was limited by the lack of quantitative data from the DAP complex area, particularly the lack of
water flow and demand of the surrounding rivers. Estimates of the cumulative impacts of near and long-term
activities were made based on the combination of quantitative and qualitative research and best judgment of
potential impacts by the assessment team. It cannot be considered a detailed assessment of cumulative impacts
but a screening of likely cumulative risks. It is expected that the outcomes of this RCIA will be incorporated by DAP
management in their policies, procedures and monitoring systems in order to improve the environmental and social
performance of the Project.

Appendix C: Rapid Cumulative Impacts Assessment
DAP Supplemental Environmental and Social Assessment Report
7 | P a g e
Selected VECs and spatial and temporal boundaries 2
2.1 Ecological and socioeconomic context
DAP’s oleochemical complex is located on a land area of roughly 114 ha within the larger industrial state of PT
Sarana Industama Perkasa in the export development zone of Kuala Tanjung, on the coast of Batu Bara district in
the province of North Sumatra. This area is located on the Malacca Strait; an important shipping route that is vital to
the economic and social development of Indonesia, Singapore, Malaysia, and Thailand.
Figure 2: Regional overview, the red marker shows the DAP complex location
The area around the Project presents a mix of industrial, residential and agricultural areas in a context of rapid
development. Industrial activities in Kuala Tanjung have been ongoing for decades and the construction of DAP’s
oleochemical complex started in 2001. The Indonesian Government has long-term plans to develop North Sumatra
as a cluster for the downstream palm oil industry.

ESSA Technologies Ltd.
8
2.1.1 Ecological context
The island of Sumatra is characterized by higher elevations found throughout the center of the island, decreasing
towards the Malacca Strait in the east and the Indian Ocean in the west. In terms of the types of ecoregions14 found
in the Project’s area, the complex is located in There are several types of ecoregions that define the area where the
DAP Complex is located in the Northern Central Sumatra – Western Malaysia freshwater ecoregion5 (Figure 3). The
province of Sumatera Utara falls almost entirely within this freshwater ecoregion. Some of the larger rivers in this
ecoregion include the Belawan, Asahan, and Baramum in Sumatra. One of the most notable features is Lake Toba,
the largest lake in Indonesia and largest volcanic lake in the world. The biodiversity data for this ecoregion identifies
that amphibians are high in species richness, fish and turtles are moderate in richness, and crocodiles are
moderate-low in richness. All four animals and animal types are not endemic to the area (moderate to low).
Figure 3. Freshwater Ecoregion – North Central Sumatra, and Western Malaysia (Source: Abell et al. 2008)
In terms of terrestrial habitats in the Project area; this flat coastal region falls in the Sunda Shelf mangroves
ecoregion (Figure 4) found on the eastern coast of Sumatra and the coastal areas of Borneo. Mangroves provide an
important habitat for the monkey and other terrestrial and marine wildlife, including vulnerable and endangered
species6, as well as preserve the shape of the coastline. These freshwater swamp forests are characterized by
fertile alluvial soils. In the area around the DAP complex the original mangrove vegetation has been cleared for
agriculture first and, in more recent decades, for industrial development. The habitat is highly modified and retains
few of the natural ecoregion features. It is estimated that any remaining freshwater swamp forests still in existence
in Sumatra will be under intensive pressure in the coming years7.
The mangrove forests on the east coast of Northern Sumatra decreased by 59.68% between 1977 and 2006
(103,425 ha to 41,700 ha), and very little of what is left is in good condition8.
1 Ecoregions are defined as areas of relatively homogeneous species composition, clearly distinct from adjacent systems (Spalding et al.
2007).

Appendix C: Rapid Cumulative Impacts Assessment
DAP Supplemental Environmental and Social Assessment Report
9 | P a g e
In the interior, most of the original ecoregion - the Sumatran Lowland Rain Forests – is under critical status due to
most of the habitat being lost to intensive agriculture and logging. The remaining intact areas are found primarily in
central Sumatra
Figure 4. Terrestrial Ecoregions, the DAP complex was located within an ecoregion characterized by mangroves in 2001.
2.1.2 Socioeconomic context

ESSA Technologies Ltd.
10
The DAP complex is located within the Batu Bara Regency which as of 2010 has a population of 375,885, of which
60% live rurally. The two closest town to the DAP complex is, Lalang (north of the complex) and Kuala Tanjung
(south of the complex), with a combined population of 13,1412. Pangkalan Dodek (North of Laland), is also fairly
close to the complex with a population of around 28,000.
The average annual population growth rate of North Sumatra from 2000 to 2010 was 1.10%, from 2010 to 2014 the
average annual growth rate decreased to 1.05%. This decreasing trend could infer that North Sumatra’s population
growth rate has most likely stayed constant or dropped slightly in the last 3 years. However, the new influx of
industry associated with the Kuala Tanjung shipping port may have caused an increase in population in the
surrounding cities. With a lack of a recent population estimate for the province, there is the uncertainty of whether
the population is increasing or decreasing, especially in the Batu Bara regency.
2.2 Priority VECs
The DAP complex, along with other ongoing and expected activities around the industrial estate, contributes to the
same type of impacts on the environmental and nearby communities, including; air emissions, increased traffic
(road and marine transportation), generation and discharge of solid wastes and effluents, and potential effects on
the local economy. Based on the expected impacts and the information about the environment around the DAP
complex, the present RCIA analysis will focus on the following VECs:
Marine habitats
The local communities surrounding the DAP complex fish in the Malacca Strait to sustain their livelihoods. It is
important that this habitat is environmentally sustainable and unpolluted so not to impact the lives of the local
people. The Malacca Strait is becoming an increasingly popular shipping route and will continue to be as industry
amongst Thailand, Malaysia and Indonesia continue to develop. This, in conjunction with the other industrial
developments along the coast, will impact the quantity and quality of fish that are caught by local fisher folk. It is,
therefore, an important VEC to consider as marine habitats have a direct social, economic and environmental
impact.
Air quality
The air quality in the area surrounding the DAP complex is impacted by the other industries that are also operating
within the airshed. The DAP complex itself will produce substantial emissions and therefore it is a concern to the
respiratory health of local people, as well as an environmental concern.
Water supplies
The DAP complex requires an input of 750 m3/s of water from the Besar (Large) River, located 7km from the plant.
The surrounding industries and communities share the watershed and sub-watershed that feed this river. The
current flow of the river is unknown, so the rate of the river after the withdrawal is taken is also unknown. The intake
2 de la Cueva Bueno, P. (2016). Environmental and Social Baseline and Compliance Review. PT. Domas Agrointi Prima (DAP)
Oleochemical Project – Medan, Indonesia.

Appendix C: Rapid Cumulative Impacts Assessment
DAP Supplemental Environmental and Social Assessment Report
1 1 | P a g e
station from which the complex takes its water is 2.25 km from the Malacca Strait thereby not having a large impact
on downstream activities. However, the unknown rate of river flow, various user water demand and changing
climatic conditions within the watershed creates a great deal of uncertainty. It is important to assess this VEC to
understand the state of the watershed in the near future.
Community Health and Safety
The DAP complex will impact the health of the local communities due to emissions associated with production and
transportation. It will create an increase in road traffic in the area as trucks will transport the product once it has
been refined. Many houses in the area are built extremely close to roads for convenience, commerce, and
accessibility. There are many different types of vehicles on the roads surrounding the complex including, pedal
bikes, motorbikes, cars, small trucks, large transport trucks, and buses. These conditions pose dangerous
conditions for pedestrians and smaller vehicles.
Local livelihoods
The communities directly beside the DAP complex will be impacted by some degree due to a combination of the
previously stated VECs. The local communities are small and depend largely on agriculture and fisheries to sustain
their livelihood. Their health will be the first to be impacted by the growing industry outputs of emissions.
Consideration for all the cumulative impacts that will negatively affect the locals is needed to prevent deterioration
of their social and economic environments.
2.3 Spatial and temporal boundaries
2.3.1 Spatial
The spatial boundaries are determined so that there is a point at which to stop the pursuit of the cumulative effects.
Too-small of a boundary could potentially not capture all the regional and long-term effects. There is the long-range
transport of pollutants in airsheds and waterways that can cover large geographic areas3. The spatial boundaries
set here are adaptive; as new environmental and social information becomes available during the lifetime of the
project a different boundary may be required.
The direct area of impact (DAI), is located around the DAP complex. However, the environmental data determining
the VECs of the area covers a much wider, generalized area off the coast and inland from the complex. The DAI is
in the immediate surrounding area of the red polygon (the DAP complex), shown in figure 5. Environmental factors
that were included in the analysis are widespread due to the nature of the watershed that extends west towards the
centre of Sumatra. The satellite imagery in Figure 5 shows nearby industries, south of the complex, that also have
an influence on environmental issues in the area. The inset map shows the broader area that is being included in
3 CEAA. (2016). Cumulative Effects Assessment Practitioners’ Guide. https://www.ceaa.gc.ca/default.asp?lang=En&n=43952694-
1&offset=7&toc=hide

ESSA Technologies Ltd.
12
the analysis, the purple outlines are the main watershed and its sub-watershed. The five priority VECs will cover
different geographical reaches, these spatial boundaries were established using the following logic4:
A local study area in which the obvious, easily understood and often mitigable effects will occur.
A regional study area that includes areas where VECs may interact and stakeholders affected.
The use of several boundaries for different environmental components.
Boundaries set at the point at which cumulative effects become insignificant.
Thep VEC boundaries include the following:
Marine habitats: extends into the Malacca Strait, ensuring that the area around the jetty built for the complex is included.
Air quality (defined by airshed assessment; see Appendix E)
Water supplies: includes the main watershed and sub-watershed which also covers the industrial area south of the complex
Community Health and Safety: covers the two towns of Lalang and Kuala Tanjung and the transportation corridor leading from the complex and through the town of Lalang.
Local livelihoods includes the populated areas directly around the DAP complex, the town of Lalang and Kuala Tanjung.
4 Ibid.

Appendix C: Rapid Cumulative Impacts Assessment
DAP Supplemental Environmental and Social Assessment Report
1 3 | P a g e
Figure 5. Area of analysis (Source: Google Earth satellite imagery)
2.3.2 Temporal
The temporal considerations for this study vary depending on the VEC. Generally, the temporal boundaries will start
at the year in which the baseline information for the assessment is collected and last the lifetime of the complex,
and until the VECs have recovered and the impacts become trivial5. A potential time constraint for a cumulative
effects assessment is when the foreseeable future actions can no longer be identified or meaningfully evaluated6.
The approach taken here to setting temporal boundaries on the VECs is centered on each value component. This
5 CEAA. (2016). Cumulative Effects Assessment Practitioners’ Guide. https://www.ceaa.gc.ca/default.asp?lang=En&n=43952694-
1&offset=7&toc=hide
6 Eccleston, C. H. (2011). Environmental impact assessment: A guide to best professional practices. CRC Press.

ESSA Technologies Ltd.
14
approach examines the unique characteristics of impacts on the VEC and takes into account the VEC’s natural
variation over time7.
Marine habitats are so large that they may not feel the effects of certain environmental intrusions until decades
later. A study was done to map the impact of 19 different types of anthropogenic stress on 20 global marine
ecosystem types by using data in 5-year intervals to allow for an assessment of the cumulative impacts. The study
found that this method of observing 5-year intervals allowed for a comparison of which areas saw high and
increasing impacts from anthropogenic stressors8. Marine ecosystems may hold certain threshold responses to
stressors, creating nonlinear cumulative impacts. The time span for monitoring the Malacca Strait near the DAP
Complex should continue for at least five years after the plant is decommissioned to ensure any impacts that may
have affected marine life and the quality of the water do not occur, or if they do can be properly attended to.
The assessment of air quality using a cumulative effects approach should take into consideration past actions that
are abandoned but still may cause effects of concern, any existing, active actions, and any future actions that may
yet occur9. The continued development of the region surrounding the DAP complex suggests that there will be a
need to account for future industrial activities that may impact the air quality. For the future actions, there are three
categories to consider, certain, reasonably foreseeable, and hypothetical10. The InAlum facility is already
constructing their smelter upgrade, as well as the construction of the port is almost complete, therefore the future
impacts are certain and can be taken into consideration.
The availability of water supplies within the spatial boundaries can be impacted immediately and throughout the
lifespan of the processing plant. After the plant is decommissioned water availability should be monitored until it
returns to normal. The quality of the water is likely to take more time to return to baseline conditions. The future
temporal boundary for water supplies cannot be exactly set at this time and will need to consider the variability of
natural cycles of change in the surrounding ecosystems as well as any unforeseen, significant environmental
events that may occur11.
To determine temporal boundaries for community health and safety and local livelihoods, those living within
the area of analysis should have their health and economic well-being is taken into account. Road traffic will
continue to increase as industrial expansion continues in the area. In the case of road safety, it is difficult to
determine future conditions past the time in which the DAP complex ceases to operate due to unknown future
industrial development. Similarly, for the local peoples, the impact on their livelihoods cannot be fully determined
past the lifetime of the DAP complex due to the potential of other industries being built in the future. The best
temporal boundaries for these two VECs is a past boundary starting at baseline conditions, extending the lifetime of
7 CEAA. (2016). Technical Guidance for Assessing Cumulative Environmental Effects under the Canadian Environmental Assessment
Act, 2012. https://ceaa-acee.gc.ca/default.asp?lang=en&n=B82352FF-1&offset=6&toc=hide
8 Halpern, B. S. et al. (2015). Spatial and temporal changes in cumulative human impacts on the world/'s ocean. Nature
communications, 6.
9 CEAA. (2016). Cumulative Effects Assessment Practitioners’ Guide. https://www.ceaa.gc.ca/default.asp?lang=En&n=43952694-
1&offset=7&toc=hide
10 Ibid.
11 Ibid.

Appendix C: Rapid Cumulative Impacts Assessment
DAP Supplemental Environmental and Social Assessment Report
1 5 | P a g e
the DAP complex, and for five years after to assess post-facility conditions. If deemed necessary at that time,
further monitoring of the VECs can be extended.
Give these considerations, two scenarios were defined:
Scenario 1: Near-term development (2020): This scenario represents the cumulative effects in the near
future, after DAP upgrade and restart of the operations.
Scenario 2: Long-term development (2040): This future scenario considers the expected effects of climate
change on the VECs and that planned and ongoing activities are fully operational.

ESSA Technologies Ltd.
16
Other activities and environmental drivers 3This section describes, based on secondary information available at the time of this assessment, existing and
planned activities and environmental factors affecting DAP’s surroundings and the area of analysis.
3.1 Other activities
3.1.1 Existing industrial facilities
PT Wilmar Oil Refinery
The Wilmar Kuala Tanjung Oil Refinery is an active vegetable oil industrial complex located along the coast of North
Sumatra province, 800 meters south of the DAP complex. Wilmar has been an active participant in sustainability
discussions in Asia. The General Manager for Wilmar Sustainability discussed the role of oil palm plantations in
maintaining forest landscapes by committing to conserve High Carbon Stock and High Conversation Value forests,
as well as promoting socio-economic development through smallholder projects12. The Kuala Tanjung Refinery
sends and receives materials from a number of mills and refineries around Malaysia and Indonesia. Some of the
mills and refineries are located on Sumatra, therefore the most economical means of transporting their products is
through trucks which utilize the same transportation corridor as the one proposed for the DAP complex13.
There are many environmental issues associated with the operational phase of vegetable oil production and
processing primarily include the following14:
Solid waste and by-products
o Contaminated sludge and effluent can be created and must be properly disposed of in a landfill or
incinerated.
Water consumption and management
o The facilities require significant amounts of water for cooling purposes during product, chemical
neutralization and subsequent washing and deodorization.
Energy consumption and management
o High amounts of energy are used at processing facilities, putting a strain on local energy
resources
Atmospheric emissions
12
Wilmar. (2016). No Deforestation, No Peat, No Exploitation Policy. Quarter 3 – 2016 Update. http://www.insideindonesia.org/how-vulnerable-is-indonesia-to-future-climate-change
13 Amnesity International. (2016). The Great Palm Oil Scandal: Labour Abuses and Behind Big Brand Names. https://amnistia.org.ar/wp-
content/uploads/delightful-downloads/2016/12/ASA2151842016ENGLISH-101-148-ilovepdf-compressed.pdf
14 IFC. (2015). Environmental, Health and Safety Guidelines for Vegetable Oil Production and Processing.
http://www.ifc.org/wps/wcm/connect/1e6d9780474b37b89a2bfe57143498e5/FINAL_Feb+2015_Vegetable+Oil+Processing+EHS+Guideline.pdf?MOD=AJPERES
Appendix C: Rapid Cumulative Impacts Assessment
DAP Supplemental Environmental and Social Assessment Report
1 7 | P a g e
o Particulate matter and VOCs are the main emissions from vegetable oil production and will
decrease air quality in the vicinity of the facility.
Greenhouse gas emissions
o High nutrient loading of wastewater can be a source of methane when treated or disposed of
anaerobically. It can also be a source of nitrous oxide emissions due to degradation of nitrogen
components in the wastewater.
Hazardous materials
o There are bulk quantities of acids, alkalis, solvents, and hydrogen that are involved in oil
processing. They are extremely flammable and create the potential for hazardous situations if not
handled carefully.
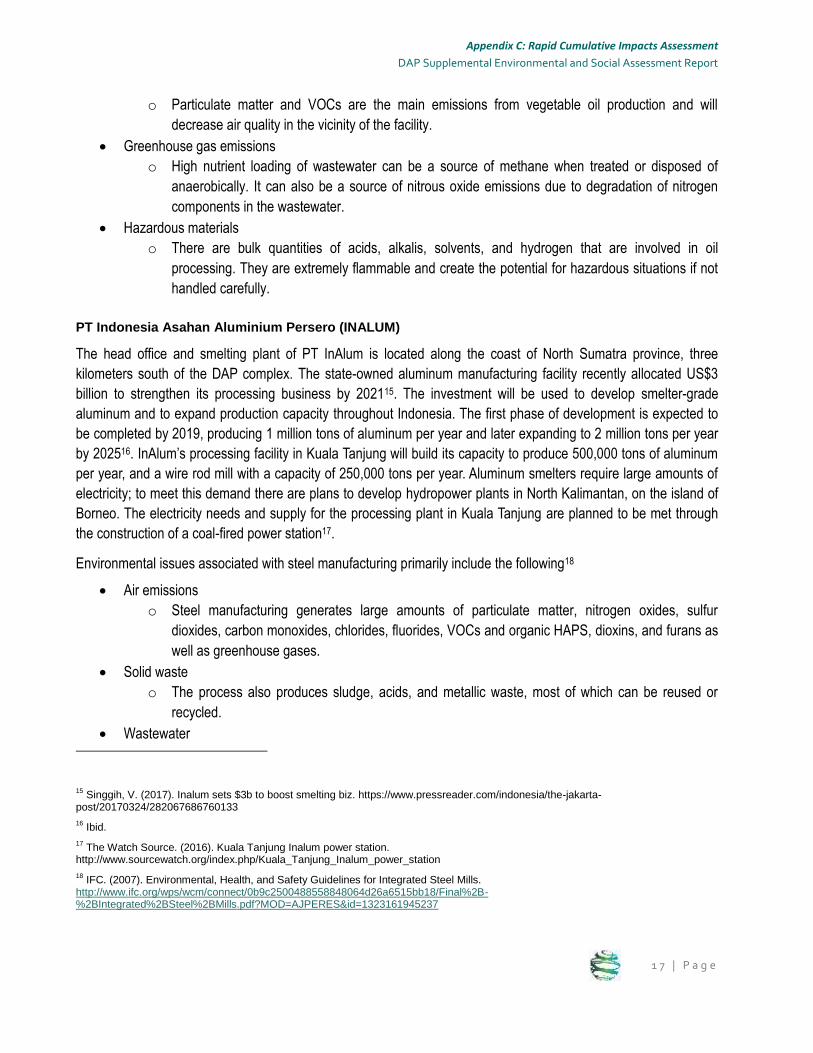
PT Indonesia Asahan Aluminium Persero (INALUM)
The head office and smelting plant of PT InAlum is located along the coast of North Sumatra province, three
kilometers south of the DAP complex. The state-owned aluminum manufacturing facility recently allocated US$3
billion to strengthen its processing business by 202115. The investment will be used to develop smelter-grade
aluminum and to expand production capacity throughout Indonesia. The first phase of development is expected to
be completed by 2019, producing 1 million tons of aluminum per year and later expanding to 2 million tons per year
by 202516. InAlum’s processing facility in Kuala Tanjung will build its capacity to produce 500,000 tons of aluminum
per year, and a wire rod mill with a capacity of 250,000 tons per year. Aluminum smelters require large amounts of
electricity; to meet this demand there are plans to develop hydropower plants in North Kalimantan, on the island of
Borneo. The electricity needs and supply for the processing plant in Kuala Tanjung are planned to be met through
the construction of a coal-fired power station17.
Environmental issues associated with steel manufacturing primarily include the following18
Air emissions
o Steel manufacturing generates large amounts of particulate matter, nitrogen oxides, sulfur
dioxides, carbon monoxides, chlorides, fluorides, VOCs and organic HAPS, dioxins, and furans as
well as greenhouse gases.
Solid waste
o The process also produces sludge, acids, and metallic waste, most of which can be reused or
recycled.
Wastewater
15
Singgih, V. (2017). Inalum sets $3b to boost smelting biz. https://www.pressreader.com/indonesia/the-jakarta-post/20170324/282067686760133
16 Ibid.
17 The Watch Source. (2016). Kuala Tanjung Inalum power station.
http://www.sourcewatch.org/index.php/Kuala_Tanjung_Inalum_power_station
18 IFC. (2007). Environmental, Health, and Safety Guidelines for Integrated Steel Mills.
http://www.ifc.org/wps/wcm/connect/0b9c2500488558848064d26a6515bb18/Final%2B-%2BIntegrated%2BSteel%2BMills.pdf?MOD=AJPERES&id=1323161945237

ESSA Technologies Ltd.
18
o Water is used for cooling processes generating effluent streams that need to be treated.
Noise
o The processes at steel plants generate a high volume of noise and should be tested to ensure
they achieve ambient noise levels.
Figure 6. Nearby industries, InAlum, and Wilmar Refinery
3.1.2 Marine-based activities
Marine traffic
Marine traffic in the Strait of Malacca has become a popular route to get from the Persian Gulf to Japan and South
Korea as it is the straightest and cheapest route19. This makes the Malacca Strait a strategic region for seaborne
trade, especially for oil tankers carrying products from the oil-rich states in the Middle East20. The straits provide
passage to more than 100,000 vessels a year, which at times can create chokepoints the more narrow areas. This
is expected to worsen as traffic is predicted to double in the next ten years, making the Malacca Straits the most
19
Lee, P. (2016). Reuters and other lies on South China Sea. Newsbred. http://www.newsbred.com/reuters-and-other-lies-south-china-sea
20 Strasselink. (2014). Malacca Straits. http://www.strasselink.com/straits.php

Appendix C: Rapid Cumulative Impacts Assessment
DAP Supplemental Environmental and Social Assessment Report
1 9 | P a g e
congested shipping route in the world21. Image 2 shows marine traffic in the Strait, representing a single snapshot
of the conditions of the Strait on June 6th, 2017. The red areas show the chokepoints that develop as ships enter
the narrow areas of the Strait.
Image 1. Marine traffic in the Malacca Straits. Imagery from marrinevesseltraffic.com
The Straits of Malacca also allow for cross-strait traffic and coastal shipping. This has been increasing since 2008
and has been identified as one of the impediments to safe navigation for through traffic22. Haze caused by forest
and plantation fires in Sumatra has at times severely affected visibility for ships passing through the area. Image 3
shows the main flow of shipping traffic, including the cross-strait traffic which adds to the congestion and potential
dangers of collisions within the Strait.
Marine traffic has several environmental impacts such as the high density of boats producing air and GHG
emissions. As traffic in the Strait increases the risk of collisions also increases which create the risk of effluents,
such as oil, ending up in the water. Increased boat presence, emissions and any effluents from the boats will impact
the quantity and quality of aquatic habitats and fisheries.
21
Strasselink. (2014). Malacca Straits. http://www.strasselink.com/straits.php.
22 Ibid.

ESSA Technologies Ltd.
20
Image 2. The main shipping routes through and across the Malacca Strait23.
Fisheries
The fishing industry in Indonesia has seen a trend of positive influences in the last 15 years. In 2004 the marine
capture fisheries for Indonesia were 8.73% in the Malacca Strait, and total production showed a steady increase24.
In 2015 the fishing industry in Indonesia had grown 8.37%, far above the country’s overall economic growth of
4.73%25. There has been an increase in law enforcement against illegal fishing and an overall improvement in
policies that enhance the livelihoods of fisherfolk, allowing for them to increase their catches26
One of Indonesia’s ocean fishing harbors is located in Belawan near Medan, approximately 100km north of the DAP
complex. This type of harbor has the capacity to support 18,000 landings annually27. Due to the improvements of
policies in the fisheries industry, it is reasonable to foresee continued increase in this sector and within the Malacca
Strait over the next several years. The fishing industry could be impacted by the increase in marine traffic. An
example of the impacts of high traffic area occurred in November 2016 when a fishing boat sank after accidentally
colliding with a product tanker off the coast of North Sumatra. Statements from the fisherman say they suffered
23
Strasselink. (2014). Malacca Straits. http://www.strasselink.com/straits.php
24 FAO. (2006). Organisation des Nations Unies pour l'alimentation et l'agriculture. http://www.fao.org/fi/oldsite/FCP/en/idn/profile.htm
25 Global Business Guide Indonesia. (2016). Indonesia’s fisheries sector: Under a New Paradigm.
http://www.gbgindonesia.com/en/agriculture/article/2016/indonesia_s_fisheries_sector_under_a_new_paradigm_11566.php
26 Ibid.
27 FAO. (2006). Organisation des Nations Unies pour l'alimentation et l'agriculture. http://www.fao.org/fi/oldsite/FCP/en/idn/profile.htm.

Appendix C: Rapid Cumulative Impacts Assessment
DAP Supplemental Environmental and Social Assessment Report
2 1 | P a g e
rudder failure and the vessels were too close to each other to avoid a collision28. Fishing activities add to the issues
related to marine traffic, the boats produce air and GHG emissions as well as the possibility of effluent discharge.
These impacts as well as overfishing contribute to the degradation of the surrounding aquatic habitats and fisheries.
3.1.3 Land-based activities
Agriculture
Small holdings make up most of the rubber plantations in Sumatra, these plantations have a low productivity of
around 600 kg/hectare per year due to poor maintenance of seedlings and the health of the old rubber trees does
not allow for further growth. In 2005 North Sumatra had the largest production of rubber plantations totaling 412,000
hectares; rubber production needs large amounts of land and high rainfall to grow productive harvests29.
Key agricultural indicators important to North Sumatra, are paddy, maize, mango, and banana production.
Indonesia’s rice paddy production is heavily exploited in Sumatra, 2,523,393 hectares are used for production on
the island30. Continued production of rice crops in these areas is extremely important to the livelihood of farmers
and the economics of this commodity in Indonesia.
Agricultural activities discharge effluent due to the runoff of nutrients into the water systems surrounding the fields.
The agriculture products produced in this region require a high amount of water resources for adequate growth.
3.1.4 Ongoing and future developments
Kuala Tanjung Port
A new shipping port is currently under construction just south of the DAP complex in the Kuala Tanjung area. The
port is expected to be open in summer 2017 with limited functionality, increasing capacity later into 2018. The port is
being developed in several phases, the first phase which is 80 to 90 percent complete as of April 2017, will be a
multipurpose terminal31. The second phase will include the development of an industrial area and then third will
develop a container port and residential area. The new port will allow for an increase in economic development for
the region, including an estimated reduction in the price of goods in eastern Indonesia by 20-25%32. Once
28
Petrov, S. (2016). Fishing boat Jaya II sank after collision with product tanker Victory Prime in Malacca Strait. http://www.maritimeherald.com/2016/fishing-boat-jaya-ii-sank-after-collision-with-product-tanker-victory-prima-in-malacca-strait/
29 Profile of rubber plantations in Indonesia. (2006, September 1). The Free Library. (2006). Retrieved June 07, 2017 from https://www.thefreelibrary.com/Profile of rubber plantations in Indonesia.-a0155476183
30 Panuju, D. R., Mizuno, K., & Trisasongko, B. H. (2013). The dynamics of rice production in Indonesia 1961–2009. Journal of the Saudi
Society of Agricultural Sciences, 12(1), 27-37.
31 The Jakarta Post. (2017). Kuala Tanjung to start operations in July. News Desk.
http://www.thejakartapost.com/news/2017/04/12/kuala-tanjung-port-to-start-operations-in-july.html
32 Hermansyah, A. (2017). Jokowi proud of maritime sector progress. The Jakarta Post.
http://www.thejakartapost.com/news/2017/05/05/jokowi-proud-of-maritime-sector-progress.html

ESSA Technologies Ltd.
22
completed, the Kuala Tanjung port will be Indonesia’s largest transit hub, creating even greater access to the high
traffic waters of the Malacca Strait33.
During the construction phase of the port, it will produce solid waste and effluents, as well as increased noise
levels. Once the port has been established it will attract a great deal of marine traffic, impacting the aquatic habitats
and fisheries in the area. The boats entering the port will produce noise, air, and GHG emissions. There is a risk
that effluents will be discharged while boats are docked, or if there are collisions.
Kuala Tanjung Inalum power station
A coal-fired power station is in development within the InAlum Kuala Tanjung site, located on 80 hectares of land
adjacent to the aluminum refinery. The construction was scheduled to begin in 2015 but has been delayed several
times, it is currently set to commence in 201734. The size of the plant is proposed to output 700-megawatts of power
in order to meet the demands of the increasing smelter activities that are planned to take place over the next 4
years. The proposed power station will produce air emissions such as toxic ash and GHG emissions from the coal
burning process. It will release toxic solid waste such as sludge and heavy metals into the environment35. Any of
these discharges from the plant will impact the aquatic habitat and fisheries. The plant will also create noise due to
its processes and consume a large amount of water for cooling activities.
DAP Complex and jetty
A jetty is being built off the coast of the DAP complex property to transport raw materials and products servicing the
Industrial Area adjacent to the jetty. An environmental and social impact assessment was done for the project in
May 2017 by Hatfield. Their findings of large and important impacts include the following:
Changes to ambient air quality during construction (mobilization of heavy equipment, material movements, foundation work, soil compaction, construction of buildings)
Changes to noise levels during construction;
Changes to seawater quality during construction and operation phases;
Impacts to marine aquatic biota during construction and operation phases;
Impacts to marine transportation during construction and operation phases;
Work and trade opportunities leading to an increase in livelihood condition; and
Impacts to public health
3.1.5 Types of impacts of existing, ongoing and future activities
Based on the types of activities discussed in the previous sections, the types of ongoing and expected impacts
relevant for the priority VECs were identified (Table 1).
33
The Jakarta Post. (2017). Kuala Tanjung to start operations in July. News Desk. http://www.thejakartapost.com/news/2017/04/12/kuala-tanjung-port-to-start-operations-in-july.html
34 The Watch Source. (2016). Kuala Tanjung Inalum power station.
http://www.sourcewatch.org/index.php/Kuala_Tanjung_Inalum_power_station
35
UCSUSA. Environmental impacts of coal power: wastes generated
http://www.ucsusa.org/clean-energy/coal-and-other-fossil-fuels/waste#.WUGebevyu00

Appendix C: Rapid Cumulative Impacts Assessment
DAP Supplemental Environmental and Social Assessment Report
2 3 | P a g e
Table 1: Current activities and future developments impacting the VECs
Activities
Air
emis
sio
ns
Solid
was
te
Effl
uen
ts
No
ise
GH
G
emis
sio
ns
Wat
er
con
sum
pti
on
Aq
uat
ic
hab
itat
s/
fish
erie
s
Palm oil refinery (PT
Wilmar)
Aluminium factory
(INALUM)
Marine traffic
Fishing
Agriculture
Kuala Tanjung Port
Kuala Tanjung Ina lum
power s tation
DAP Complex and jetty
Current activities
Future developments

ESSA Technologies Ltd.
24
3.2 Climate change
A detailed screening of climate risks for the Project has been included in Section 4.2 of the main report. This section
focuses on climate risks as they may affect the selected VECs. The communities of North Sumatra are extremely
vulnerable to the impacts of climate change. Rising sea levels, increasing temperatures, fluctuating ground water
tables and extreme events will put the health of the population at risk. Climate change will alter the distribution and
productivity of fish and other marine and freshwater species. This has an impact on the sustainability of fisheries
and aquaculture, especially for coastal communities whose livelihoods depend on fishing.
Temperature
There will be an increased need for irrigation as average annual temperatures rise. It is estimated that the largest
temperature increase in Indonesia will occur on the island of Sumatra where it is likely they will see an increase of
around 4 ºC by the end of the century36. Spatial climate analysis shows a consistent trend towards fewer cooler
nights and more warm nights and days for Sumatra37, increasing evapotranspiration. The projected climate change
in Sumatra will likely impose critical stress on water resources.
Precipitation
The change in temperature and rainfall will affect the water balance, combined with the estimated population growth
for the province, severe water shortages are expected to occur during 2020 to 203038.
Table 2: Water availability predictions for Sumatra Area Supply Demand Balance (2009) Balance (2015) Balance (2030)
Sumatra 111,077.65 37,805.55 73,272.10 48,420.07 -67,101.34
Despite expected water shortages, the overall change in annual precipitation for North Sumatra is expected to
increase by about 20% by the 2050s39. The change in the timing of seasons and unpredictable rainfall patterns will
have implications for food production and economic stability. In parts of Sumatra, it has already seen the wet
season began up to 20 days later than the average40.
36
Triastuti, H. (2009). Indonesia Climate Change Sectoral Roadmap (ICCSR). Synthesis Report. Republic of Indonesia. http://www.adaptation-undp.org/sites/default/files/downloads/indonesia_climate_change_sectoral_roadmap_iccsr.pdf
37 MET Office. (2011). Climate: Observations, projections and impacts: Indonesia. http://eprints.nottingham.ac.uk/2040/13/Indonesia.pdf
38 Triastuti, H. (2009). Indonesia Climate Change Sectoral Roadmap (ICCSR). Synthesis Report. Republic of Indonesia.
http://www.adaptation-undp.org/sites/default/files/downloads/indonesia_climate_change_sectoral_roadmap_iccsr.pdf
39 Climate Wizard. (2007). Change in Annual Precipitation by the 2050s. The Nature Conservancy. http://www.climatewizard.org/
40 GFDRR. (2011). Climate Risk and Adaptation Country Profile, Indonesia.
http://sdwebx.worldbank.org/climateportal/countryprofile/doc/GFDRRCountryProfiles/wb_gfdrr_climate_change_country_profile_for_IDN.pdf

Appendix C: Rapid Cumulative Impacts Assessment
DAP Supplemental Environmental and Social Assessment Report
2 5 | P a g e
Extreme events
The east coast of Sumatra has been designated as being at extremely high-risk of flooding due to extreme
rainfall, overloaded surface water sources or water reservoirs, and land characteristics. Floods in this region can
lead to disastrous landslides. The deforestation of the island has led to an increase in landslides41 as the forests
provide natural protection from floods and landslides.
Sea level rise – DAP complex and jetty facilities
The regency of Batu Bara sits almost at sea-level and will experience a loss of land by the rising waters. The DAP
complex will experience flooded land within the complex and the jetty facilities (3.4 m above high tide level) could
be affected as sea level rises.
Saltwater intrusion could affect freshwater resources that are used for agricultural purposes along the eastern coast
of Sumatra, causing a decrease in crop growth and yield42. Under a 1-meter sea-level rise scenario, rice paddy
fields will be reduced by an area of about 3,170 hectares on the island of Sumatra43.
As sea-levels rise during the 21st century, people living along the coasts of Sumatra are at risk of losing their homes
and properties on which they depend upon for their livelihoods. There is an on-going sea level monitoring program
that uses a network of stations around Indonesia to determine mean sea level and monitor the effect of global
climate changes on Indonesian waters44.
41
Martine, E. (2015). Landslides could become Indonesia’s worst nightmare. SciDevNet. http://www.scidev.net/asia-pacific/disasters/feature/landslides-could-become-indonesia-s-worst-nightmare.html
42 Pisaspeak. (2016). Climate change and sea level rise in Asia: Indonesia. https://pisaspeak.wordpress.com/2016/11/08/climate-
change-and-sea-level-rise-in-asia-indonesia/
43 Förster, H., Sterzel, T., Pape, C. A., Moneo-Lain, M., Niemeyer, I., Boer, R., & Kropp, J. P. (2011). Sea-level rise in Indonesia: on
adaptation priorities in the agricultural sector. Regional Environmental Change, 11(4), 893-904.
44 Khafid. (2011). National Report to GLOSS GE XII. Indonesia Sea Level Monitoring. http://www.gloss-
sealevel.org/publications/documents/indonesia_gexii2011.pdf

ESSA Technologies Ltd.
26
Current status and trends of selected VECs 4Based on indicators informative of the status and conditions of the VEC, this section presents a description of the
condition and expected trends of the prioritized VECs.
4.1 Marine habitats
The indicators to be used for this VEC are seawater, marine biodiversity, and marine traffic. Seawater and marine
biodiversity are based on available baseline data surveys done in 2003 for marine habitats, 2010 for seawater and
2016 for both seawater and marine habitats. Comparatively, the data from these studies reveal the trends that
phytoplankton is increasing in abundance and decreasing in diversity. The seawater has an increasing amount of
suspending solids, oil and grease, and a decrease in sulfide, dissolved metals, and ammonia. The increase of
phytoplankton and decrease of elements and chemical compounds could be attributed to the DAP complex closure,
in which less effluent was released into the surrounding waters. Marine traffic data is readily available and shows
observable trends that traffic in the Malacca Strait is increasing and is predicted to continue.
4.1.1 Marine Biodiversity
The DAP complex lies near the coast of the Malacca Strait, an ecoregion that covers the eastern half of Northern
Sumatra (Figure 7). The eastern halves of Aceh, North Sumatra, and most of Riau Provinces are within this
ecoregion. In ecological terms, the Malacca Strait is a cohesive unit, the area that encompasses this ecoregion
shares many characteristics pertaining to biodiversity and types of ecosystems.
Indonesia’s marine and coastal ecosystems in the Malacca Strait45:
Mangroves – 404,606 hectares
Coral Reefs – Some fringing reefs in Northern Sumatera
Seagrass – East coast of Sumatera (12 species)
45
Kaur, C.R. (2016). Biodiversity in the Straits of Malacca: An assessment of issues and challenges on environmental protection. Centre for Coastal and Marine Environment

Appendix C: Rapid Cumulative Impacts Assessment
DAP Supplemental Environmental and Social Assessment Report
2 7 | P a g e
Figure 7: Marine ecoregions with the Malacca Strait shown in yellow46
The baseline survey conducted by the Ministry of Health Standards (DEHL) in 2010 sampled plankton and benthos
at three locations; no other fish or marine fauna were described in the study47. The village immediately around the
project site, Kuala Tanjung does practice marine fishing48 suggesting that the species found in this ecoregion can be
found in the vicinity of the DAP complex. Information on flora and fauna baseline in the area of the industrial estate
is limited in the 2010 DELH. The fauna survey identified the presence of a number of protected bird species. For the
marine environment, plankton and benthos were sampled at three locations; no fish or other marine fauna are
described in the report.
Compared to the baseline study in 2010 there was a decrease in phytoplankton diversity and a significant increase
in abundance. These differences may be due to a number of factors such as differences in nutrient input, the
inactivity of the Project within this period as well as method and timing of sampling.
46
World Wildlife (2007). Marine Ecoregions. https://www.worldwildlife.org/publications/marine-ecoregions-of-the-world-a-bioregionalization-of-coastal-and-shelf-areas
47 de la Cueva Bueno, P. (2016). Environmental and Social Baseline and Compliance Review. PT. Domas Agrointi Prima (DAP) Oleochemical Project – Medan, Indonesia. 48
Ibid.

ESSA Technologies Ltd.
28
Table 3: Phytoplankton data comparison49
Parameter Unit 2016 2010
Total taxa 19-24 19
Abundance Cell/m3 3-8 million ±700,000
Diversity index 1.36-1.79 ±2.9
Equitability index 0.43-0.61 ±0.9
Dominance index 0.31-0.44 ±0.05
The 2016 baseline study surveyed a total of 12 locations at different distances from the land, 7 data locations left of
the jetty and 5 points on the right side of the jetty. Underwater visibility was poor, with turbidity values above the
threshold limit of 5 NTU.
4.1.2 Seawater
This 2010 DELH environmental study reported substandard baseline water quality conditions in the general
industrial zone. Seawater sampling was conducted in three locations and results showed exceedance for copper, oil
layer, and phenol. The 2016 baseline study collected seawater samples from four sites. A number of in-situ
measurements and observations were conducted, including information/data on brightness, pH, salinity, and
turbidity, and temperature, the presence of floating matters and of oil film. The laboratory data shows that all of the
sampling points show brightness values that are less than the minimum threshold values set by the regulation.
These low brightness values are corroborated by the high turbidity values at all points and high TSS concentrations
at most points.
All of the laboratory analysis for total phosphorus (P) show values that are higher than the maximum threshold
value of 0.015 mg/L (values range from 0.030 to 0.085 mg/L). These high values seem to concur with the relatively
high concentrations of phosphorus at both Rindam and Padang River which empties to the seawater sampling
areas. All of the laboratory results for dissolved metals show values that are lower than the maximum threshold
values. Most of the parameters show values that are even lower than the analytical detection limit with the
exception of arsenic where values range from 0.0011 to 0.0013 mg/L. Most of the laboratory analysis for dissolved
oxygen (DO) show values that are slightly lower than the minimum threshold values of 5 mg/L, with the exception of
data at SWQ-250. The complete results from the seawater sampling can be found in Appendix A.
49
PT Hatfield Indoensia. (2016). Environmental Baseline Survey.
50 Ibid.

Appendix C: Rapid Cumulative Impacts Assessment
DAP Supplemental Environmental and Social Assessment Report
2 9 | P a g e
4.1.3 Marine transportation
The Malacca Strait is an important shipping route, therefore the marine area of the ecoregion is at risk of
biodiversity and environmental degradation from51:
Increasing demand and pressure on resources from an increasing coastal population
70,000+ vessels passing through the Straits yearly (potential oil spills, collisions, and ship discharges)
Decline in quality of fisheries landings
Lower catch-per-unit-effort (CPUE)
Loss of mangrove cover: >40% in the Straits of Malacca States
Pollution
Invasive species
A new shipping port is currently under construction just south of the DAP complex in the Kuala Tanjung area. The
port is expected to be open in August 2017 with limited functionality, increasing capacity later into 2018. The new
port will allow for an increase in economic progress for the region, including an estimated reduction in the price of
goods in eastern Indonesia by 20-25%52.
4.2 Water supplies
The Project takes water from a river located approximately 7 km from the DAP complex (Figure 8). The DAP
complex is located in a large watershed that flows from the mountainous central area of North Sumatra out to the
east into the Malacca Strait. The watershed has tributaries that branch off into smaller, sub-watersheds. The DAP
complex uses a water intake site that is outside of the larger watershed. The indicators to be used for this VEC are
water quantity and quality. The current state of the watershed is not fully known due to a lack of data on water
demand and water flow of regional rivers. The continued trend of population and industrial growth within the region
surrounding the DAP Complex will put additional stress on water resources. The following section provides details
of the state of water quantity, quality, water governance, and the main water stressors in the area.
51
Kaur, C.R. (2016). Biodiversity in the Straits of Malacca: An assessment of issues and challenges on environmental protection. Centre for Coastal and Marine Environment
52 Hermansyah, A. (2017). Jokowi proud of maritime sector progress. The Jakarta Post.
http://www.thejakartapost.com/news/2017/05/05/jokowi-proud-of-maritime-sector-progress.html
ESSA Technologies Ltd.
30
Figure 8: The watershed that the DAP complex is within and the sub-watershed where the complex’s water supply comes from (Source: Google Earth)

Appendix C: Rapid Cumulative Impacts Assessment
DAP Supplemental Environmental and Social Assessment Report
3 1 | P a g e
4.2.1 Water quantity
The region the DAP Complex is in receives an annual average of 2,263mm of rain53 which helps to replenish
aquifers and irrigation supplies. Uncertainties surrounding the impacts of climatic changes on the island of Sumatra
leave many unknowns about the state of the watershed as predicted higher temperatures will impact water
resources and could decrease available water resources. Data from the Aqueduct project (Figure 9) measures and
maps global water risk using a baseline water stress (BWS) indicator that measures the ratio of total withdrawals to
the annual available renewable surface water supply54. The dataset uses a time series of supply (1995-2010) in
order to reduce the effect of climate cycles and short-term water storage. Therefore the data measures chronic
stress rather than drought stress. The area the DAP complex is in has a moderate BWS, however, as stated in the
mapping tool, if current use in a catchment is low, any new withdrawals could easily create high-stress conditions,
pushing them into a critical state. Given that the latest data measured for this project was in 2010 it is likely that the
conditions have changed.
Figure 9: Map of the baseline water stress in North Sumatra, higher values indicate more competition among users. The DAP Complex is located within the darker yellow area seen in the middle of the figure (Source:
Aqueduct project9)
53 World Weather Information Service–Medan. (2015). World Meteorological Organization. Retrieved June 18, 2015.
54 Forest Watch (2014). Baseline Water Stress. Global Forest Watch, Water. http://water.globalforestwatch.org/map/

ESSA Technologies Ltd.
32
4.2.2 Water quality
The water in the Besar River has a large amount of suspended solids which can be seen from satellite imagery and
photos taken on the ground. The river originates roughly 100 km away from the intake site, at Lake Toba. It passes
through several towns and agricultural plots of land before reaching the intake site and the Malacca Strait, allowing
for debris and sediment to accumulate within the flow. Baseline studies show that total suspended solids are above
the maximum threshold in the Besar and Rindam Rivers in 2010 and increased further in the 2016 study of the
Rindam River.
Figure 10: The Besar River mouth as it drains out into the Malacca Strait. Retrieved from Google Earth, taken by Ruli Indra, titled, Sungai di sekitar Inalum Kuala Tanjung (River around Inalum Kuala Tanjung).
Figure 11: DAP’s water intake point along the Besar River. Imagery from Google Earth, taken in 2014

Appendix C: Rapid Cumulative Impacts Assessment
DAP Supplemental Environmental and Social Assessment Report
3 3 | P a g e
The 2016 Baseline Study used three sites for freshwater sampling from streams and/or water bodies around the plant. Total phosphorus was found to be higher than the maximum threshold, which is likely due to the plantations upstream of the Rindam and Padang Rivers which use fertilizers. The high levels of suspended solids could be attributed to the rainy conditions. All the parameters with corresponding IFC guideline values show values that are lower than the maximum threshold values for both Criterion Maximum Concentration and Criterion Continuous Concentration. For full results of the water quality study refer to Appendix A.
4.2.3 Water demand and main stressors for water resources
The water demand within the watershed the DAP Complex is located is not entirely known. It can be determined
from qualitative research that there are several towns and villages located within the watershed, and that water
resources are largely used for rice paddy farming and other agricultural practices.
The Besar River provides water for several cities and towns located upstream from the complex, as well as for the
other industries in the area. The complex water intake site is mostly downstream from other users. It is possible that
the water flow needed by the plant may not be plentiful and consistent since it is a downstream user. The watershed
will have increased pressure from an added user needing 750 m3/s of water flow, and this may dry out the lower
reaches the of the Besar River depending on seasonal flows, changes in climatic conditions, and user demand.
Current upstream pressures include:
Agricultural fields – palm and rice paddies are known to be in the surrounding areas and are an important economic commodity for small-holder farms.
The town of Inderapura is upstream of the river that the DAP complex takes its water from. The population is unknown, however, on satellite imagery, it looks larger than the two small towns surrounding the DAP complex.
Pematang Siantar City lies partially in the larger watershed that feeds the Besar River
There are two larger local industries that are south of the DAP complex, also located on the coast of the Malacca
Strait, InAlum, an aluminum smelter plant and Wilmar Refinery, an oil palm refinery. These two plants, which can be
seen in figure 6, may also share in some of the water resources that the DAP complex relies on since they are all in
close proximity to the Besar River. InAlum and the Wilmar Refinery are within the smaller sub-watershed that is fed
by the larger watershed in which the DAP complex is in. The building plans for a coal fire power plant within a
kilometer of the DAP complex will create a higher demand for water resources due to the large amounts of water
needed for cooling processes at the plant.
Watershed management in the region is unknown; it is likely that there is no formal system in place to guide water
withdrawals. Water supply in Indonesia is decentralized, allowing for local governments to control their supplies,
however, this is challenging as they often do not have the capacity to plan and develop their resources properly55.
Governmental reforms over the past two decades have resulted in inefficient or non-existent management of water
55
International Water Centre. Indonesian water governance field work underway. http://www.watercentre.org/news/indonesian-water-governance-field-work-underway

ESSA Technologies Ltd.
34
resources. Water resource responsibilities are distributed throughout various levels of administration including,
national (within Public Works, Forestry, Environment, Bappenas (regional development and planning agency),
Agriculture, and Home Affairs), provincial (under the Provincial Water Resources Management Agency), and locally
(managed by districts and municipalities)56. The decentralized approach and numerous changes in government and
its policies over the years have left water resources unprotected and poorly utilized throughout Indonesia.
Figure 12: The city of Inderapura, the Besar River is seen running through the middle of the image. Imagery
from Google Earth.
4.3 Air quality
The indicators to be used for this VEC are Nitrous Dioxide, Sulphur Dioxide, and total suspended particles based on
data collected from the 2010 and 2016 baseline studies. Between these two studies, all three indicators decreased,
this could be attributed to the plant being out commission during these years.
The 2010 study determined that in terms of air quality, conditions at the industrial site and in the nearest residential
housing were reported as good; with all the measured parameters showed concentrations under the maximum
national standards. The test values from the 2016 Environmental Baseline Survey seen in Table 6 are below the
maximum threshold values stated in national regulation as well as in IFC guidelines. These include concentration
for gaseous as well as particulate parameters. In general, particulate concentrations in AQ-2 ( a residential area
close to the road) are slightly higher than those in AQ-1, which is probably due to particulate generated by traffic. It
56
Wieriks, M. (2011). Water Governance and policy networks in Indonesia The challenges of a decade of water sector reformation, MSc Thesis

Appendix C: Rapid Cumulative Impacts Assessment
DAP Supplemental Environmental and Social Assessment Report
3 5 | P a g e
is worth noting, however, that sampling at both sampling points were conducted during wet season with the
significant amount of rain and as a result, the values are expectedly low. For full results of the air quality study refer
to Appendix A.
4.4 Community Health and Safety
The indicators used for this VEC are the number of hospitals or doctors per person, road related fatalities,
population growth, and noise levels. Regional and local health-related data and road-related fatality data is scarce
or unavailable; quantitative data on these indicators is important to further understand the changes in health and
safety in the area.
4.4.1 Community health
At the time of the 2010 DELH, local health facilities were generally inadequate for the population size. The
communities did not have hospitals, doctors or public health clinics. They were serviced by one small auxiliary
clinic, a total of seven nurses and a small maternity hospital serviced by the nurses and midwives. In the time since
the report, like the school system, the healthcare system has been improved in order to provide better services to
the local communities and BSP has committed to its top practices in this regard, as broadly described in the BSP
Sustainability Report.
4.4.2 Road safety
The roads around the complex are used by varying types of vehicles. Many houses in the area are built extremely
close to roads for convenience, commerce, and accessibility. Google Street View imagery gives insight into the
average modes of transportation used along the surrounding roads. The imagery is from December 2015 and
shows various locations along what will be the main transportation corridor to and from the complex.
Figure 13 shows the proposed transportation corridor along a secondary road. This type of road is wide enough for
two-way traffic at moderate to slow speeds. The imagery seen on the figure in location 2 is located directly outside
of the gated road that leads to the DAP complex. There are local curbside shops that are set up here and will see a
considerable increase in truck traffic. Location 5 on the figure shows local traffic pulled over to the small side
shoulder of the road. If this is a frequent occurrence safety issues could arise due to overcrowded streets that do
not allow space for trucks passing each other. Pedestrians must use the roads to access side-road shops. Location
9 on the figure is where the road runs through the town of Lalang. In this imagery from 2015, at a time when the
DAP complex was closed and the international shipping port has not yet become operational, the volume of traffic is
significant. By using the Street View imagery, it can be seen that along this section of road the traffic becomes
heavy, and there are many types of vehicles on the road. The single snapshot of Location 9 shows cyclists, a truck,
motorcyclists, a bus and a car.

ESSA Technologies Ltd.
36
Figure 13: The proposed transportation corridor to the DAP facility. Inset images show the street view conditions (Source: Imagery from Google Earth and Google Street View).
4.4.3 Noise levels
Noise measurements were taken at the plant and residential area in 2010 and 2016. General noise measurement results in October 2010 are higher than results from November 2016. Noise level inside plant area in 2010 exceeded the maximum threshold value of 70 dBA while noise level in 2016 is lower than the threshold value. Noise level in residential area from the two measurement period seems to show values that do not differ significantly. For full results of the noise measurement study refer to Appendix A.
4.5 Local livelihoods
The indicators to be used for this VEC are percentage of population farming or fishing for their livelihood and the
unemployment for the region or towns. These indicators will help track and quantify the impacts of local livelihoods
from the operation of the DAP complex and external factors such as population growth, climatic changes, and shifts
from rural to urban living. Unsustainable land use practices have led to degraded agricultural fields, and many rice
Appendix C: Rapid Cumulative Impacts Assessment
DAP Supplemental Environmental and Social Assessment Report
3 7 | P a g e
paddy fields have been converted to non-agricultural land use57; this loss of land will lead to fewer people being
able to support themselves through farming. Overfishing in Indonesia is increasing, causing problems for small-
scale fisherfolk who depend on good catches for their livelihood. In the Malacca Strait, demersal fish and shrimp are
overfished and small pelagic fish have been fully exploited58
Population growth is unknown for the immediate vicinity of the DAP complex, however country-wide growth is at an
annual 1.2%, which has been decreasing since 197059. Indonesia’s current unemployment rate is 5.5%, however,
the national definition of an employed person is loosely applied making the rate artificially low60.
4.5.1 Population and Employment
The area immediately around the Project, and considered by the 2010 DELH report, is composed of 2 sizable
villages or desas – Lalang with a population of 6,641 and Kuala Tanjung which has an equivalent size of 6,500.
Population density is high in the area with the 2 desas averaging close to 950 people per square kilometer; more
than twice the density of the regency as a whole. Marine fishing and freshwater fishing to a lesser extent are
practiced in the village of Kuala Tanjung.
The land surrounding the DAP complex is very fertile, and therefore agriculture is an essential part of local
livelihood. The agricultural mentality does not favour conservation as the cultivation of single crops or monocultures
provide quicker returns to farmers. The FAO lists 5 key agricultural indicators as being important to North Sumatra,
they include paddy, maize, mango, and banana production, as well as fisheries.
Indonesia’s rice paddy production is heavily concentrated on Sumatra and Java, therefore continued production of
rice crops in these areas is extremely important to the livelihood of farmers and the economics of this commodity in
Indonesia.
Both desas are rural agricultural communities with approximately 60 % of the residents engaged in smallholder wet
rice (sawah) farming with a scattering of household orchards. This is typically organized by village-based
cooperatives that manage irrigation and commercial logistics. A substantial portion of the Lalang residents are
fishermen including off-shore, fresh water river, and some aquaculture. The greater area produces 261,000 tons of
fish annually. A smaller sector of the communities, about 10 percent, engage in the typical house front or stall
service and commercial activity.
Vulnerable groups
Through their initial community engagement activities, the project’s community relations team has identified
subsistence-level fishing families and female-headed households as vulnerable stakeholders. They have included
57
Suprapto, A. Land and water resources development in Indonesia. FAO. http://www.fao.org/docrep/005/ac623e/ac623e0g.htm
58 Cribb, R. et al. (2009). Indonesia beyond the Water’s Edge: Managing an Archipelagic State.
59 WorldOMeters. (2017). Indonesian Population. http://www.worldometers.info/world-population/indonesia-population/
60 Indonesia Investments. (2017). Unemployment rate Indonesia Falls to 5.5% of Labor Force. https://www.indonesia-
investments.com/news/todays-headlines/unemployment-rate-indonesia-falls-to-5.5-of-labor-force/item6788?

ESSA Technologies Ltd.
38
special consultation activities in the Stakeholder Engagement Program (SEP) for these groups. The project may
expand these vulnerable categories as stakeholder mapping deepens. The project will also consider special
projects for these groups through their CSR activities to assist them in accessing appropriate benefits.
4.6 Summary of VEC status and trends
Table 4 summarizes the information discussed in the previous sections about the status and trends of the prioritized
VECs. An additional column provides information on the availability of information on the VEC and the main
uncertainties detected by the team.

Appendix C: Rapid Cumulative Impacts Assessment
DAP Supplemental Environmental and Social Assessment Report
3 9 | P a g e
Table 4: Summary of VEC status and trends
VEC Current status Trends Indicators of VEC status Availability of
information and uncertainties
Marine habitats
▪ Mangroves have disappeared due to
past activities ▪ Very little fish or marine fauna observed ▪ Suspended solids, phosphorus and nitrate concentrations are above thresholds ▪High density area of marine traffic
Between the Sept 2010 and Nov 2016 study there was: ▪Increase in phytoplankton abundance ▪Decrease in phytoplankton diversity Between the Oct 2010 and Nov 2016 study there was: ▪Increases in suspended solids, and oil and grease ▪Decreases in sulphide, dissolved metals and ammonia ▪Increasing annual marine traffic
▪Seawater ▪Marine biodiversity ▪Marine traffic
Based on baseline studies done in 2003 (marine habitat), 2010 (seawater), and 2016 (seawater and marine habitat). The decreases could be due to the plant being out of commission during these years. Data on marine traffic easily accessible.
Water resources
▪High amounts of rainfall in the area ▪Watershed has a moderate baseline water stress ▪High amounts of suspended solids in surrounding rivers. ▪Exact water demand unknown
Between the Sept 2010 and Nov 2016 baseline study there was: ▪Increases in suspended solids, NO3
▪Decreases in Biochemical oxygen demand, oil and grease. ▪Increase water demand as population and industry in the area grow
▪Water quality ▪Water quantity
Based on baseline studies done in 2003 and 2016, qualitative observations of imagery, online data from Forest Watch. Uncertainties in water demand and flow of rivers
Air quality
▪Chemicals in ambient air surrounding the plant and residential areas are below national regulations ▪Higher concentrations of particulate in the residential area close to the road
Between the Oct 2010 and Nov 2016 study there was: ▪Decreases in NO2, SO2, and total suspended particulates
▪NO2, SO2, total suspended particulates
The decreases could be contributed to the plant being out of commission during these years. Sampling was conducted during the wet season, resulting in lower values. The studies were conducted during different months which may have caused differences in climatic conditions that affected results.
Community Health and
Safety
▪Local health facilities are inadequate for populate size, lack of hospitals, doctors, and public health clinics ▪Roads have moderately heavy traffic at times, utilized by a variety of vehicles types (cars, trucks, bicycles, pedestrians) ▪Noise levels are below thresholds
▪Since the 2010 study the healthcare system has been improved ▪Population and industry has been increasing steadily leading to increased road use ▪Between the Oct 2010 and Nov 2016 study there was a decrease in noise levels around the plant and residential areas
▪Number of hospitals or doctors per person ▪Road related fatalities ▪Noise levels
Regional data for population and health care facilities are infrequently updated. Quantitative and qualitative population and road related data is scarce in the region.

ESSA Technologies Ltd.
40
VEC Current status Trends Indicators of VEC status Availability of information and
uncertainties
Local livelihoods
▪High population density, 950 people/km2 between the two villages ▪Rural, agricultural communities ▪Livelihoods mostly involve rice farming and fisheries, a small percent own road side stalls ▪Fishing families and female-headed households are the most vulnerable stakeholders in the community
▪Annual population growth rate of Indonesia is 1.2%, the rate has decreased since 1970 ▪Urbanization in Indonesia is steadily increasing ▪Increased competition for agriculture and aquatic resources due to environmental changes
▪Percentage of population farming or fishing for livelihood ▪Unemployment rate
Data unavailable at regional and local scales, inferences are made from national statistics.

Appendix C: Rapid Cumulative Impacts Assessment
DAP Supplemental Environmental and Social Assessment Report
4 1 | P a g e
Cumulative impacts on selected VECs 5The cumulative impacts on the VECs estimate the “future baseline” conditions of the VECs—i.e., the condition of
VECs as affected by the other projects, human activities, and natural drivers. This estimation is done with the
effects of planned project mitigation included. The near-term scenario uses the temporal time frame of within the
next 10 years, from 2017 to around 2030. The long-term scenario uses the temporal time frame of 30 years, using
2050 to be able to take into consideration the effects of climate change. The methods chosen for the analysis are
compatible with the information available for the analysis and that can provide, whenever possible, a quantitative
estimate of the cumulative impact. Qualitative estimates have been made where there is a lack of quantitative data
based on a consensus and professional judgement of the assessment team.
5.1 Marine habitats
The estimate of the future baseline conditions of marine habitats in the near-term is that there will be a decrease in
fish biodiversity due to increased marine traffic, overfishing, and increased effluent from industrial activities. Based
on present conditions seawater nutrient levels will continue to be above the threshold value due to the on-going
industrial activities in the area. The cumulative impacts in the near-term will cause degradation to marine habitats,
including the quality of the seawater and the abundance of fish species.
The estimate of the future baseline conditions of marine habitats in the long-term will have similar stressors as the
near-term but with the added impact of climatic changes to the area such as sea level rise and warmer ocean
temperatures as estimated by the IPCC61. The cumulative effects in the long term will be a reduction in marine
habitats available in the Malacca Strait and increased pollution as the level of industrial activity and marine traffic
increase.
5.2 Water supplies
Water supply for the industrial estate comes from the Great River, located approximately 7 km from DAP complex,
and from deep wells located in the estate for some activities. Community water supply for the nearby village of
Lalang comes from local wells.
Vegetable oil facilities require significant amounts of water for crude oil production (cooling water), chemical
neutralization processes, and subsequent washing and deodorization. The plant will require 750 m3/s (current
requirement is 600 m3/s) at the water intake in Large River. The industry in this area has been increasing steadily
and with the building of the international shipping port, it can be expected that this trend will continue.
61
IPCC. (2014). Scenarios of the 21st Century. http://www.ipcc.ch/ipccreports/tar/wg2/index.php?idp=29

ESSA Technologies Ltd.
42
It is estimated that in the near-term baseline water stress of the watershed and sub-watershed will increase as a
result of the cumulative use from the DAP complex, InAlum, Wilmar Refinery, local inhabitant’s personal use, and
agricultural use. These activities will also increase the amount of effluent in the surround water resources. There is
a high probability that with the opening of the international shipping port in late 2017 in this area that continued
development of this area will also add stress to water resources. The cumulative impacts of these water demands
will put additional pressure on water resources, which are currently under moderate stress. There is a risk that
increased effluent will cause water contamination in the area. These impacts create an unstable water supply that
may be depleted at times and is of poor quality.
Climatic changes will impact water availability due to changes in precipitation and seasonal patterns. Impacts will be
an increased frequency of droughts, contamination of freshwater resources and unpredictable water recharge.
Future conditions of water resources in the area surrounding the DAP Complex are estimated to be limited,
groundwater aquifers will be under increased pressure and freshwater further polluted.
5.3 Air quality
In the near-term, there will be an increase of transportation trucks using the roads surrounding the DAP complex to
facilitate moving materials from the site to the next stage of production. The added use of trucks in the area will
increase emissions. It is estimated that these emissions will contribute to deteriorating the air quality within the
direct vicinity of the proposed transportation corridor. The DAP complex and other industries in the area will produce
air pollutants, combined with increased vehicles emissions, this will have an impact on public health, and may
cause respiratory issues in the local population. The near-term future condition of air quality surrounding the
complex will see a rise in contamination.
The long-term scenario estimates a continued increase in industry and number of vehicles in the area contributing
to air pollution and GHG emissions, as well as an increase in average temperatures62. Cumulative impacts from
poor air quality and increased temperatures will be, continued respiratory issues in the local population, heat waves,
and higher air quality related deaths. The future condition of air quality stands to be poor.
5.4 Community Health and Safety
In the near-term scenario, the transportation corridor will see an increase in traffic and a continued variety of vehicle
types using it. The surrounding industries will also use this road, and as the shipping port opens, more connectivity
through this road may occur. Future industrial activities and the reopening of the DAP complex will increase the
noise levels in the area. Population growth is estimated to increase, there will be a need for more health care
facilities to aid in community health and safety issues. The cumulative impacts use of the road by the surrounding
industries will create more hazardous situations for pedestrians and smaller vehicles, as well as increase
emissions. Combined with a growing population and lack of health care facilities the quality of life for the
62
IPCC. (2014). Scenarios of the 21st Century. http://www.ipcc.ch/ipccreports/tar/wg2/index.php?idp=29

Appendix C: Rapid Cumulative Impacts Assessment
DAP Supplemental Environmental and Social Assessment Report
4 3 | P a g e
surrounding communities will decrease as they face noise conditions, dangerous roadways and poor air quality on a
daily basis.
The long-term scenario for this VEC will see similar stressors, but also feel the impacts of climatic changes such as
higher temperatures leading to heat-related illnesses. The constant exposure to these conditions without adequate
health care facilities could lead to the deterioration of community health conditions.
5.5 Local livelihoods
The near-term stressors on local livelihoods are the increase in population that will put a strain on already stressed
resources, combined with overfishing and land degradation situations, unemployment in the region could increase.
There will be less land for agricultural production and less high yield catches for small-scale fisherfolk. The future
near-term condition of this VEC will see a lower quality of life and poor environmental quality. There may also be an
impact on the livelihoods of fisherfolk as marine biodiversity is at risk from the increase of traffic in the Malacca
Strait. However, recent governmental policies favoring Indonesian fisheries will contribute to higher catches and
improved economic return. Population growth will continue to steadily grow as the area attracts more industry,
offering jobs for local peoples. Further development in the area may also increase the percentage of storefronts
along the transportation corridor and within the nearby towns.
In the long-term scenario, local livelihoods will see a shift as climate change will impact resource production.
Seasonal changes will affect the timing of crop cycles, and as temperatures increase more irrigation will be needed.
Good quality agricultural land will continue to disappear as more industry arrives in the area and uses the land for
single crop cultivation63. Soil conditions will worsen for smallholder farmers using the land for quick returns. These
future conditions will lead to less agricultural outputs, especially in rice cultivation for the region, and force farmers
to find other means of income. The estimated temperature increase64 will have an impact on fishing in the Malacca
Strait, the quantity and quality of fish capture could decrease. A transition from traditional livelihoods (agriculture
and fishing) to the industry and services sector is very likely.
63
Suprapto, A. Land and water resources development in Indonesia. FAO. http://www.fao.org/docrep/005/ac623e/ac623e0g.htm
64 IPCC. (2014). Scenarios of the 21
st Century. http://www.ipcc.ch/ipccreports/tar/wg2/index.php?idp=29

ESSA Technologies Ltd.
44
Table 5: Cumulative impacts identified for the prioritized VECs
VEC
Scenario 1: Near-term development (2020) Scenario 2: Long-term development (2040)
Stressors Impacts Future condition of
the VEC Stressors Impacts
Future condition of the VEC
Marine habitats
▪Increased marine traffic, overfishing, effluent from current industries and the DAP Complex
▪Decreased fish biodiversity, increase in polluted waters
▪Increased degradation compared to baseline conditions
▪Increased marine traffic, overfishing, climatic changes (sea level rise, warmer ocean temperatures), effluent from continued industrial growth
▪Loss of fish species in the Strait, polluted waters
▪Loss of quality habitat
Water resources
▪Increased water demand from DAP complex ▪Increased effluent
▪Less water resources available for local agriculture, towns and industries ▪Freshwater contamination
▪ Adequate water supply unavailable at times ▪Continued increase turbidity, water quality diminishes
▪Increased water demand from future industrial developments ▪Increased effluent Increased water demand from growing population ▪Climatic changes
▪Increased frequency of droughts ▪Contaminated freshwater ▪Unpredicatable water resources
▪Deterioration of water quality ▪Water resources under additional stress
Air quality
▪Increase in industries that produce air pollutants and GHGs
▪Respiratory issues and public health concerns
▪Increased contamination in the airshed
▪Increase in industries that produce air pollutants and GHGs ▪Warmer air temperatures
▪Respiratory issues and public health concerns ▪Contribution to climate change ▪Heat waves ▪Higher air quality related deaths
▪Poor air quality due to high levels of contamination
Community Health &
Safety
▪Increase in road traffic ▪Increased emissions from vehicles ▪Lack of health care for growing population ▪Increased noise levels
▪Increased road fatalities ▪Respiratory issues and public health concerns
▪Deterioration of air quality ▪Increased road unsafety
▪Increase in road traffic ▪Increased emissions from vehicles ▪Lack of health care for growing population ▪Increased noise levels ▪Increasing tempertures
▪Increased road fatalities ▪Respiratory issues and public health concerns ▪Contribution to climate change
▪Increased road unsafety ▪Increased incidence of respiratory conditions
Local livelihoods
▪Increasing population ▪Overfishing, land degradation
▪Loss of livelihoods ▪Land loss, decreased yields and catches ▪Potential job creation in the industrial sector
▪Stress on resources (water, land, fisheries) ▪Workers influx
▪Population growth ▪Temperature increase, seasonal changes
▪Stress on resources (water, land, fisheries) ▪Job opportunities in industrial and services sector
▪Sunstantial decrease in traditional activities (agriculture, fishing) ▪Transition to industrial and services occupations

Appendix C: Rapid Cumulative Impacts Assessment
DAP Supplemental Environmental and Social Assessment Report
4 5 | P a g e
Significance of predicted cumulative impacts 6
6.1 Marine Habitats
The marine habitat will likely see a decrease in fish biodiversity and an increase in polluted waters in the near-term
due to the industrial activities and marine traffic in the area. However the marine area surrounding the DAP
Complex is already in poor condition due to past industrial activities, therefore the near-term consequences are
minor.
The likelihood of the long-term scenario occurring is possible in some circumstances depending on future industrial
activities and climatic changes. If industry continues to grow in the area without mitigating the effluent going into the
Malacca Strait it could have a serious impact on the ecosystem. Sea level rise could affect coastal activities,
inundating agricultural land and impacting infrastructure. Changes in ocean temperatures may also have serious
impacts on the marine habitats, which could altogether create areas that are inhabitable by marine life.
Mitigation activities could include, frequently measuring and monitoring effluent coming from the DAP complex on
an annual basis to ensure threshold levels are not exceeded, observing ocean climate trends and create a plan for
sea level rise scenarios so that the complex is prepared for increased flooding and loss of land.
6.2 Water Supplies
Water supplies will likely decrease in the near-term project plan as the DAP complex requires 750m3/s of water
withdrawal from the Besar River. This will have a moderate impact on local activities, there will be less freshwater
available for agricultural, industrial and community users. There is likely to be an increase in effluent in the water
resources as plant operations resume. In the long-term, the water resources are almost certain to become stressed
as there are plans for continued development near the DAP complex. Increasing population will also put a strain on
the watershed, and as climatic changes become more apparent, the probability of droughts and contaminated or
lack of water supplies will have an extreme impact on the surrounding communities and industrial activities.
Mitigation efforts to monitor water quality should continue throughout the lifetime of the complex’s activities and for
five years beyond, adapting as needed when conditions change such as climatic events or measurements exceed
thresholds. Additional efforts could include collecting data on water users in the area, and overall water demand to
enable a clearer outlook of future water demand.
6.3 Air quality
Air quality in the area will decrease in the near-term due to the emissions the DAP complex will add into the
airshed. It is possible that local people will be impacted and see a rise in respiratory issues. It is likely that over the
long-term air quality will continue to deteriorate due to the continued industrial activities planned for the area,
including the coal-fired power plant that will be built within a kilometer of the DAP complex. The combined GHG

ESSA Technologies Ltd.
46
emissions from the activities in this area will contribute to atmospheric climatic changes. The air pollutants from the
plants are likely to create smog, the impacts of which are exacerbated on high heat days. This is likely to have a
serious impact, where there will be an increase in heat-related illnesses as well as respiratory issues in the local
communities.
Mitigation efforts to monitor air quality should continue throughout the lifetime of the complex’s activities and for five
years beyond, adapting as needed when conditions change such as climatic events or measurements exceed
thresholds. Further action that can be taken is to put in place preventative measures that will reduce air and GHG
emissions from the plant. An assessment could be made of what activities at the plant are producing air and GHG
emissions, this will allow for a better examination of what actions can be taken to reduce the emissions. Although
the plant activities do not involve cultivation of the palm plant, efforts could be made to promote sustainable
cultivation methods, and deter farmers from using the slash and burn technique that adds GHGs to the atmosphere.
This could be done through promotional campaigns or reach out directly to agricultural producers.
6.4 Community Health and Safety
It is likely that there will be an increase in road fatalities and public health concerns such as respiratory illnesses as
stated in the air quality sections. The continued development of industrial activities in the area is likely to cause this
increase in the near and long-term. Climatic changes such as increased temperatures are likely to cause a rise in
heat-related illnesses. Over the long-term, this will have an extreme impact on community health. A continued
increase in the number of health facilities in the area will help to mitigate these problems. Additional efforts taken
could be to run health campaigns to raise awareness of smog and air pollution, and ensure that local communities
are well informed about the risks of high temperature and high smog days.
Increased traffic safety precautions and signage along the roads should be considered. Speed policies should be
implemented for the transport truck drivers of the DAP complex to ensure they do not exceed a set speed when
driving on secondary roads and to take extra precautions when approaching and transiting through Lalang.
Pedestrians and those who use bicycles or motorcycles should be made aware through billboards or signage that
there will be an increase of large vehicles on this road.
6.5 Local Livelihoods
It is possible under some circumstance activities from the plant will contribute to a loss of land and a decrease in
agricultural yields and marine catches. Water extraction by the DAP complex will contribute to creating a limited
water supply, impacting agriculture in the near and long-term. Effluent discharged into the marine habitat by the
complex and the building of the jetty could disrupt fisher folk’s aquaculture activities. In the long-term climatic
changes are possible in some circumstances to add to these impacts, reducing resources even further. The
population in the area will be unable to sustain themselves, having an extreme impact on their livelihoods.
Efforts should be made to create or partake in community development activities that focus on sustainable growth.
Education on climate impacts could help the community collectively tackling these possible impacts on the
agriculture and fisheries sectors. An action plan could be created to ensure that laborers from the local communities
are hired to work at the DAP complex. This could include specific training for locals so that they have the necessary

Appendix C: Rapid Cumulative Impacts Assessment
DAP Supplemental Environmental and Social Assessment Report
4 7 | P a g e
skills to work at the plant. This effort will help to avoid a serious drop in employment in the area if agriculture or
fisheries decline significantly in the long-term.
6.6 Summary of identified impacts on prioritized and their significance
To assess the significance – or level of risk - of the identified impacts, we considered the likelihood of the identified
impact and the severity of the consequences to the VECs (Figure 14). Table 6 provides a summary of the
significance of the identified cumulative impacts, as well as some suggestions on how the Project could contribute
to the mitigation of these impacts.
Figure 14: Likelihood and level of impact matrix (Source: Hardner et al. 201510)

ESSA Technologies Ltd.
48
Table 6: Significance of impacts on VECs
Valued Environmental or Social Component
Scenario 1: Near-term development (2020) Scenario 2: Long-term development (2040) Project contribution
Likelihood Consequences Risk level Likelihood Consequences Risk level Mitigation Additional
efforts
Marine habitats
Likely: probably will occur in project plan
Minor impact
M Possible: might occur in some circumstances
Moderate impact
H Continued water quality monitoring
Adapt a Climate action plan, and/or carbon offsetting plan
▪Decreased fish biodiversity, increase in polluted waters
▪Loss of fish species in the Strait, polluted waters
Water resources
Likely: probably will occur in project plan
Moderate impact
H Likely: probably will occur in project plan
Serious impact
H Continued water quality monitoring
Data collection on water users in the area, overall water demand and estimates of future water demand
▪Less water resources available for local agriculture, towns and industries ▪Freshwater contamination
▪Increased frequency of droughts ▪Contaminated freshwater ▪Unpredicatable water resources
Air quality
Possible: might occur in some circumstances
Moderate impact
M Likely: probably will occur in project plan
Moderate impact
H Continued air quality monitoring
Preventative measures to reduce plant emissions, assess plant emission activities , promote sustainable sourcing methods
▪Respiratory issues and public health concerns
▪Respiratory issues and public health concerns ▪Contribution to climate change ▪Heat waves ▪Higher air quality related deaths
Community Health &
Safety
Likely: probably will occur in project plan
Moderate impact
H Likely: probably will occur in project plan
Moderate impact
H
Road Safety Action Plan and community support on health initiatives
Health campaigns to raise awareness of smog/air pollution, create a smog alert system road safety campaigns for plant drivers and locals
▪Increased road fatalities ▪Respiratory issues and public health concerns
▪Increased road fatalities ▪Respiratory issues and public health concerns ▪Contribution to climate change

Appendix C: Rapid Cumulative Impacts Assessment
DAP Supplemental Environmental and Social Assessment Report
4 9 | P a g e
Valued Environmental or Social Component
Scenario 1: Near-term development (2020) Scenario 2: Long-term development (2040) Project contribution
Likelihood Consequences Risk level Likelihood Consequences Risk level Mitigation Additional efforts
Local livelihoods
Possible: might occur in some circumstances
Moderate impact
M Possible: might occur in some circumstances
Moderate impact
M Local hiring and community action plan
Collaborate with regional inititives for local economy development
▪Loss of livelihoods ▪Land loss, decreased yields and catches ▪Potential job creation in the industrial sector
▪Stress on resources (water, land, fisheries) ▪Job opportunities in industrial and services sector

ESSA Technologies Ltd.
50

Appendix C: Rapid Cumulative Impacts Assessment
DAP Supplemental Environmental and Social Assessment Report
5 1 | P a g e
Endnotes
1 Hegmann, G., C. Cocklin, R. Creasey, S. Dupuis, A. Kennedy, L. Kingsley, W. Ross, H. Spaling and D. Stalker. 1999.
Cumulative Effects Assessment Practitioners Guide. Prepared by AXYS Environmental Consulting Ltd. and the CEA Working Group for the Canadian Environmental Assessment Agency, Hull, Quebec.
2 International Finance Corporation. 2013. Good Practice Handbook Cumulative Impact Assessment and Management:
Guidance for the Private Sector in Emerging Markets https://www.ifc.org/wps/wcm/connect/3aebf50041c11f8383ba8700caa2aa08/IFC_GoodPracticeHandbook_CumulativeImpactAssessment.pdf?MOD=AJPERES
3 Environmental Assessment Office (British Columbia). 2013. GUIDELINE FOR THE SELECTION OF VALUED
COMPONENTS AND ASSESSMENT OF POTENTIAL EFFECTS
http://www.eao.gov.bc.ca/pdf/EAO_Valued_Components_Guideline_2013_09_09.pdf
4 Spalding, M. D., Fox, H. E., Allen, G. R., Davidson, N., Ferdana, Z. A., Finlayson, M. A. X. & Martin, K. D. (2007).
Marine ecoregions of the world: a bioregionalization of coastal and shelf areas. BioScience, 57(7), 573-583.
5 Abell, R., M. Thieme, C. Revenga, M. Bryer, M. Kottelat, N. Bogutskaya, B. Coad, N. Mandrak, S. Contreras-Balderas,
W. Bussing, M. L. J. Stiassny, P. Skelton, G. R. Allen, P. Unmack, A. Naseka, R. Ng, N. Sindorf, J. Robertson, E. Armijo, J. Higgins, T. J. Heibel, E. Wikramanayake, D. Olson, H. L. Lopez, R. E. d. Reis, J. G. Lundberg, M. H. Sabaj Perez, and P. Petry. 2008. Freshwater ecoregions of the world: A new map of biogeographic units for freshwater biodiversity conservation. BioScience 58:403-414
6 World Wildlife Fund (2017). Sumatran freshwater swamp forests. www.worldwildlife.org/ecoregions/im0157
7 World Wildlife Fund (2017). Sumatran freshwater swamp forests. www.worldwildlife.org/ecoregions/im0157
8 Halim, A. (2013). Indonesia: Mangroves for Life. World Rainforest Movement. http://wrm.org.uy/articles-from-the-wrm-
bulletin/section1/indonesia-mangroves-for-life/
9 Aqueduct. (2014). Watershed Analysis. Global Forest Watch. http://water.globalforestwatch.org/map/
10 Hardner, J., R.E. Gullison, S. Anstee, M. Meyer. 2015. Good Practices for Biodiversity Inclusive Impact Assessment
and Management Planning. Prepared for the Multilateral Financing Institutions Biodiversity Working Group.
https://publications.iadb.org/bitstream/handle/11319/7094/Good_Practices_for_Biodiversity_Inclusive_Impact_Assessment.pdf?sequence=1