appendix c orienatation data - … technical report no. 106 september 2004 189 figure 171: rose...
TRANSCRIPT

APPENDIX C
ORIENATATION DATA

Stafford, Mylroie & Jenson WERI Technical Report No. 106 September 2004
162
Table 3: Fissure cave primary orientations grouped by physiographic province.

Stafford, Mylroie & Jenson WERI Technical Report No. 106 September 2004
163
Figure 154: Rose diagrams of fissure cave primary orientations
grouped by physiographic province.

Stafford, Mylroie & Jenson WERI Technical Report No. 106 September 2004
164
Tabl
e 4:
Fi
ssur
e ca
ve se
gmen
t orie
ntat
ions
with
segm
ent l
engt
h gr
oupe
d by
phy
siog
raph
ic p
rovi
nce.

Stafford, Mylroie & Jenson WERI Technical Report No. 106 September 2004
165
Tabl
e 4
(con
tinue
d):
Fiss
ure
cave
segm
ent o
rient
atio
ns w
ith se
gmen
t len
gth
grou
ped
by p
hysi
ogra
phic
pro
vinc
e.

Stafford, Mylroie & Jenson WERI Technical Report No. 106 September 2004
166
Figure 155: Rose diagrams of fissure cave, five-meter segment
orientations grouped by physiographic province.

Stafford, Mylroie & Jenson WERI Technical Report No. 106 September 2004
167
Figure 156: Rose diagrams of fissure cave, ten-meter segment
orientations grouped by physiographic province.

Stafford, Mylroie & Jenson WERI Technical Report No. 106 September 2004
168
Table 5: Mixing zone cave primary orientations grouped by physiographic province.

Stafford, Mylroie & Jenson WERI Technical Report No. 106 September 2004
169
Figure 157: Rose diagrams of mixing zone cave, primary
orientations grouped by physiographic province.

Stafford, Mylroie & Jenson WERI Technical Report No. 106 September 2004
170
Tabl
e 6:
M
ixin
g zo
ne c
ave
segm
ent o
rient
atio
ns w
ith se
gmen
t len
gth
grou
ped
by p
hysi
ogra
phic
pro
vinc
e.
Stafford, Mylroie & Jenson WERI Technical Report No. 106 September 2004
171
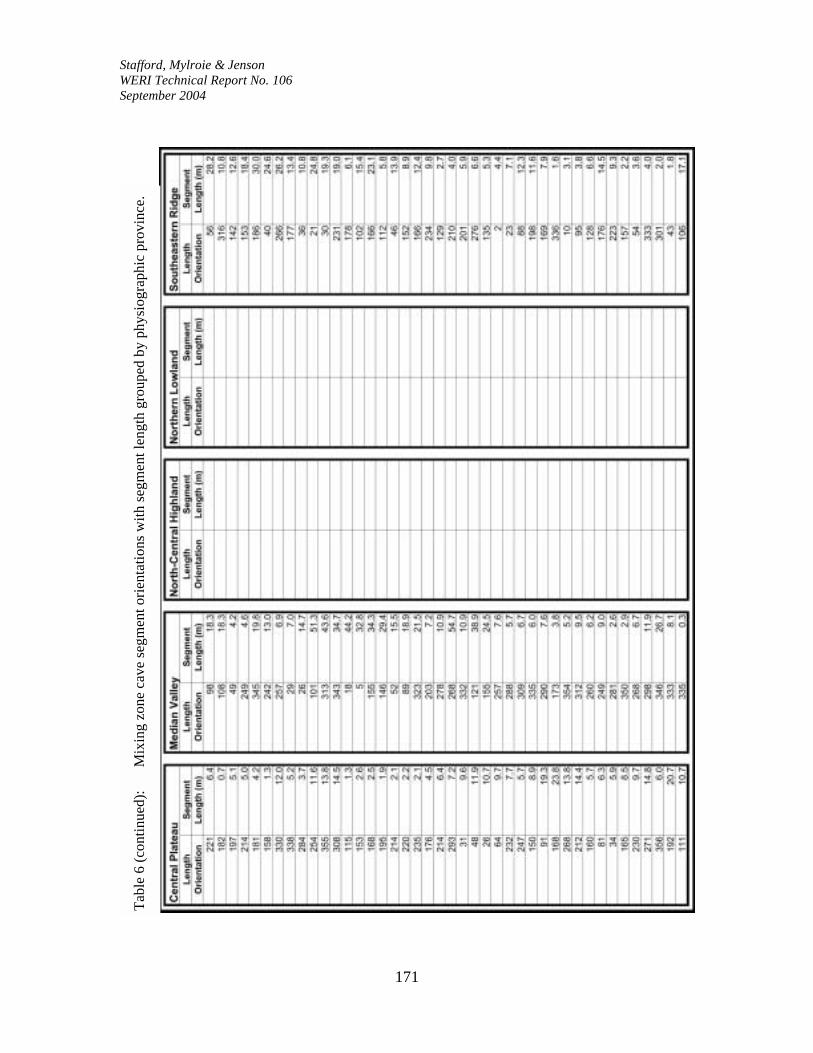
Tabl
e 6
(con
tinue
d):
Mix
ing
zone
cav
e se
gmen
t orie
ntat
ions
with
segm
ent l
engt
h gr
oupe
d by
phy
siog
raph
ic p
rovi
nce.
Stafford, Mylroie & Jenson WERI Technical Report No. 106 September 2004
172
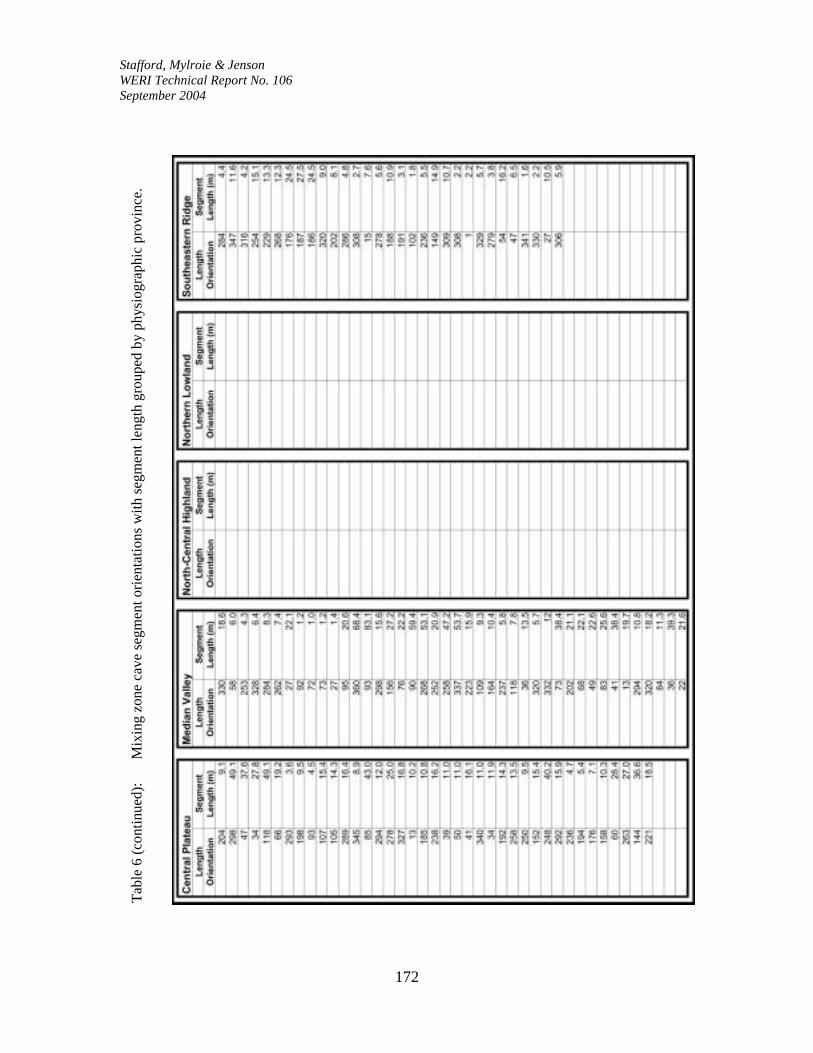
Tabl
e 6
(con
tinue
d):
Mix
ing
zone
cav
e se
gmen
t orie
ntat
ions
with
segm
ent l
engt
h gr
oupe
d by
phy
siog
raph
ic p
rovi
nce.

Stafford, Mylroie & Jenson WERI Technical Report No. 106 September 2004
173
Figure 158: Rose diagrams of mixing zone cave, five-meter segment
orientations grouped by physiographic province.

Stafford, Mylroie & Jenson WERI Technical Report No. 106 September 2004
174
Figure 159: Rose diagrams of mixing zone cave, ten-meter segment
orientations grouped by physiographic province.
Stafford, Mylroie & Jenson WERI Technical Report No. 106 September 2004
175
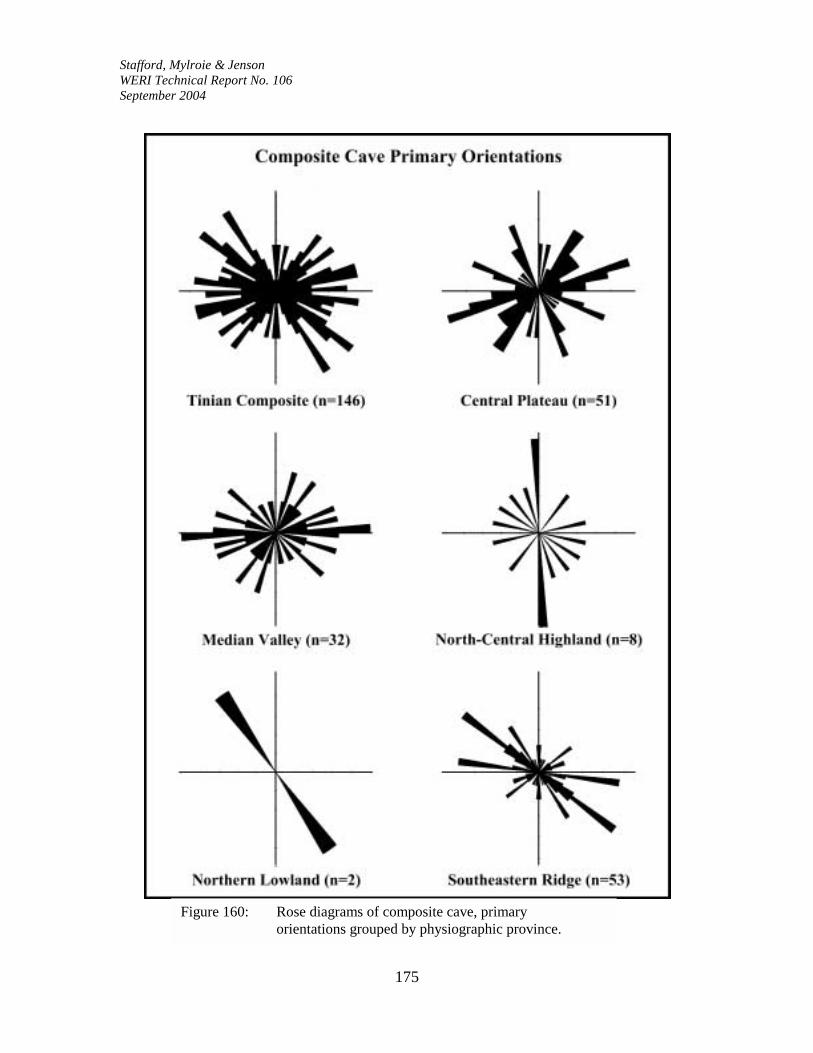
Figure 160: Rose diagrams of composite cave, primary
orientations grouped by physiographic province.
Stafford, Mylroie & Jenson WERI Technical Report No. 106 September 2004
176
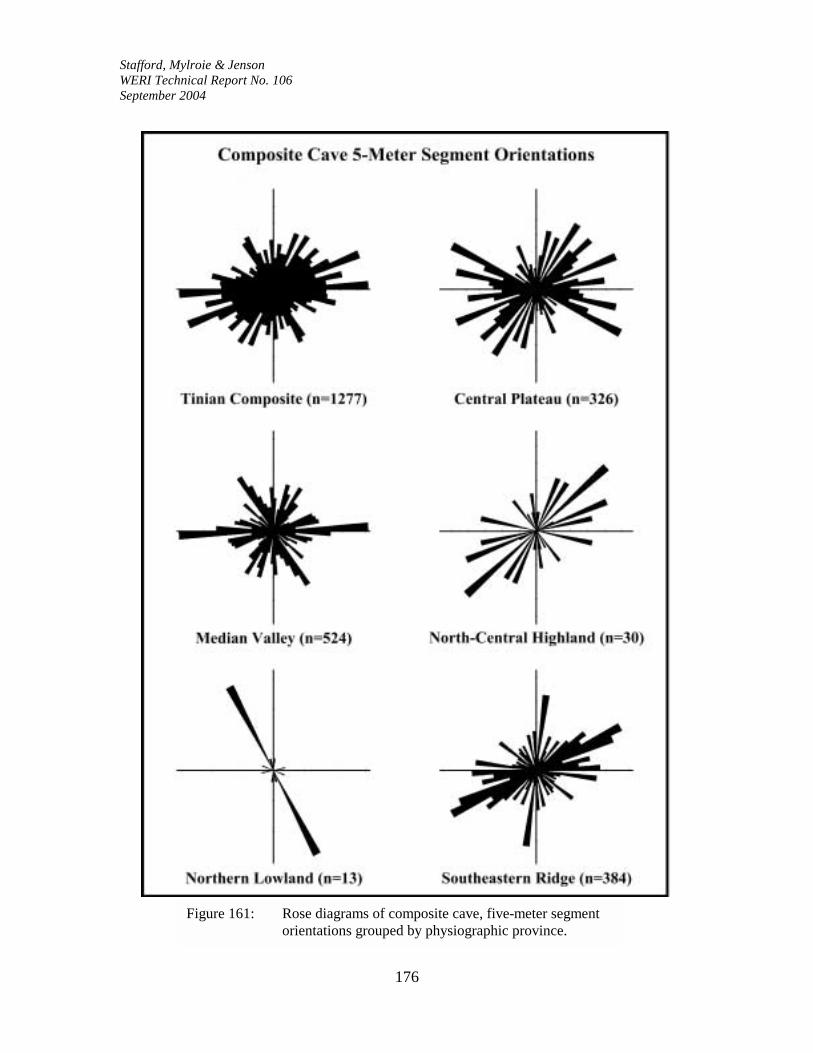
Figure 161: Rose diagrams of composite cave, five-meter segment
orientations grouped by physiographic province.

Stafford, Mylroie & Jenson WERI Technical Report No. 106 September 2004
177
Figure 162: Rose diagrams of composite cave, ten-meter segment
orientations grouped by physiographic province.
Stafford, Mylroie & Jenson WERI Technical Report No. 106 September 2004
178
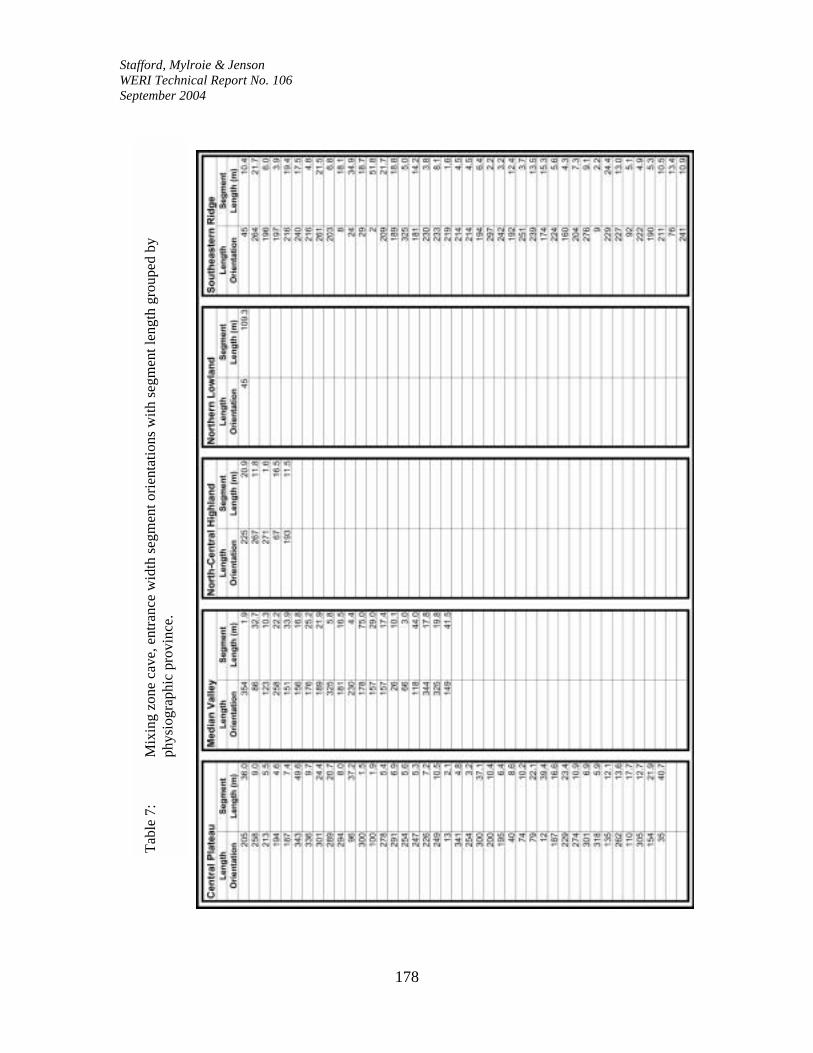
Tabl
e 7:
M
ixin
g zo
ne c
ave,
ent
ranc
e w
idth
segm
ent o
rient
atio
ns w
ith se
gmen
t len
gth
grou
ped
by
phys
iogr
aphi
c pr
ovin
ce.

Stafford, Mylroie & Jenson WERI Technical Report No. 106 September 2004
179
Figure 163: Rose diagrams of mixing zone cave entrance width
orientations grouped by physiographic province.

Stafford, Mylroie & Jenson WERI Technical Report No. 106 September 2004
180
Figure 164: Rose diagrams of mixing zone cave entrance width, five-meter
segment orientations grouped by physiographic province.

Stafford, Mylroie & Jenson WERI Technical Report No. 106 September 2004
181
Figure 165: Rose diagrams of mixing zone cave entrance width, ten-meter
segment orientations grouped by physiographic province.

Stafford, Mylroie & Jenson WERI Technical Report No. 106 September 2004
182
Tabl
e 8:
M
ixin
g zo
ne c
ave,
pen
etra
tion
segm
ent o
rient
atio
ns w
ith se
gmen
t len
gth
grou
ped
by
phys
iogr
aphi
c pr
ovin
ce.

Stafford, Mylroie & Jenson WERI Technical Report No. 106 September 2004
183
Figure 166: Rose diagrams of mixing zone cave penetration
orientations grouped by physiographic province.
Stafford, Mylroie & Jenson WERI Technical Report No. 106 September 2004
184
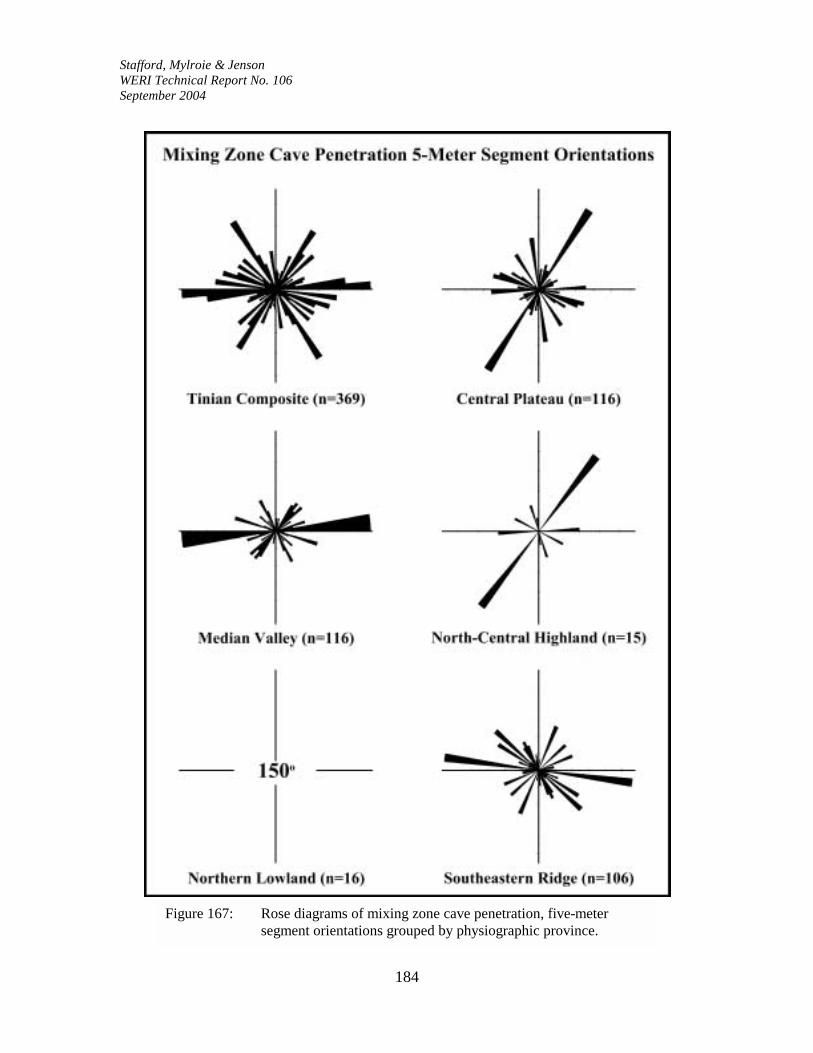
Figure 167: Rose diagrams of mixing zone cave penetration, five-meter
segment orientations grouped by physiographic province.

Stafford, Mylroie & Jenson WERI Technical Report No. 106 September 2004
185
Figure 168: Rose diagrams of mixing zone cave penetration, ten-meter
segment orientations grouped by physiographic province.

Stafford, Mylroie & Jenson WERI Technical Report No. 106 September 2004
186
Tabl
e 9:
M
ixin
g zo
ne c
ave,
max
imum
wid
th se
gmen
t orie
ntat
ions
with
segm
ent l
engt
h gr
oupe
d by
ph
ysio
grap
hic
prov
ince
.

Stafford, Mylroie & Jenson WERI Technical Report No. 106 September 2004
187
Figure 169: Rose diagrams of mixing zone cave maximum width
orientations grouped by physiographic province.

Stafford, Mylroie & Jenson WERI Technical Report No. 106 September 2004
188
Figure 170: Rose diagrams of mixing zone cave maximum width, five-meter
segment orientations grouped by physiographic province.

Stafford, Mylroie & Jenson WERI Technical Report No. 106 September 2004
189
Figure 171: Rose diagrams of mixing zone cave maximum width, ten-meter
segment orientations grouped by physiographic province.

Stafford, Mylroie & Jenson WERI Technical Report No. 106 September 2004
190
Tabl
e 10
: Fa
ults
orie
ntat
ions
repo
rted
by D
oan
and
cow
orke
rs (1
960)
segm
ent l
engt
h gr
oupe
d by
ph
ysio
grap
hic
prov
ince
.

Stafford, Mylroie & Jenson WERI Technical Report No. 106 September 2004
191
Tabl
e 10
(con
tinue
d):
Faul
t orie
ntat
ions
repo
rted
by D
oan
and
cow
orke
rs (1
960)
segm
ent l
engt
h
grou
ped
by p
hysi
ogra
phic
pro
vinc
e.

Stafford, Mylroie & Jenson WERI Technical Report No. 106 September 2004
192
Figure 172: Rose diagrams of fault orientations (Doan et al., 1960)
grouped by physiographic province.

Stafford, Mylroie & Jenson WERI Technical Report No. 106 September 2004
193
Figure 173: Rose diagrams of fifty-meter, fault segment orientations
(Doan et al., 1960) grouped by physiographic province.

Stafford, Mylroie & Jenson WERI Technical Report No. 106 September 2004
194
Figure 174: Rose diagrams of one hundred-meter, fault segment orientations
(Doan et al., 1960) grouped by physiographic province.
Stafford, Mylroie & Jenson WERI Technical Report No. 106 September 2004
195
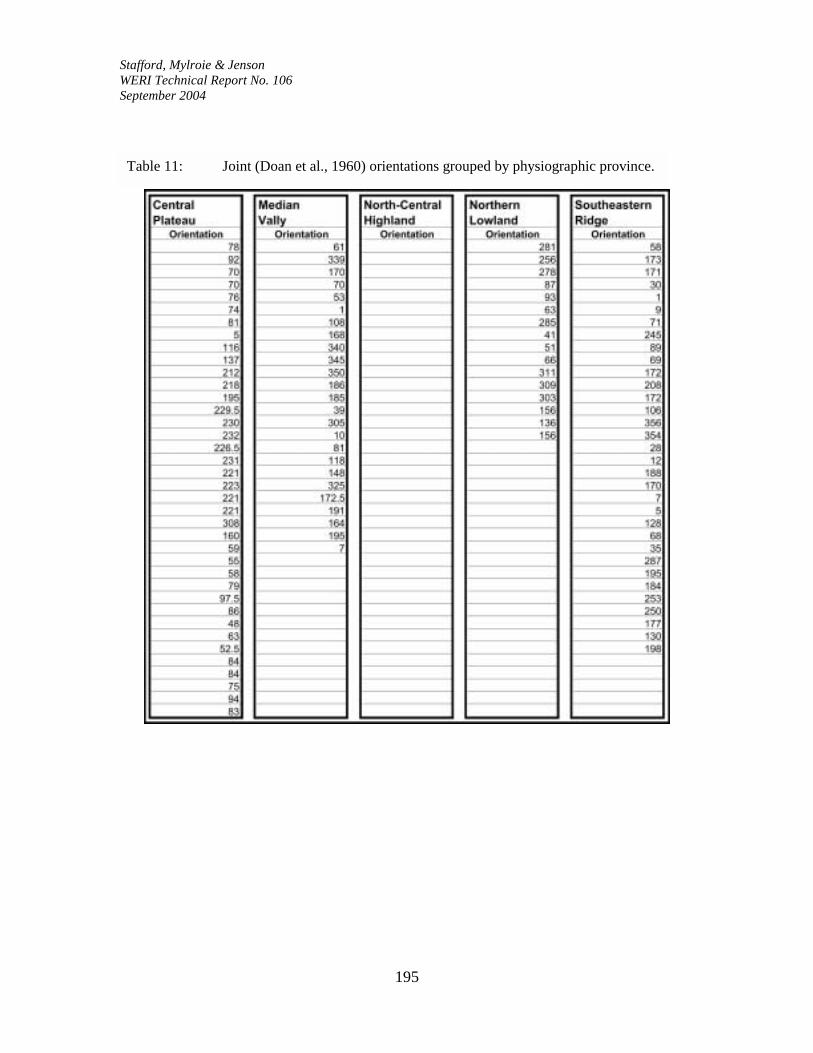
Table 11: Joint (Doan et al., 1960) orientations grouped by physiographic province.

Stafford, Mylroie & Jenson WERI Technical Report No. 106 September 2004
196
Figure 175: Rose diagrams of joint orientations (Doan et al., 1960)
grouped by physiographic province.
Stafford, Mylroie & Jenson WERI Technical Report No. 106 September 2004
197
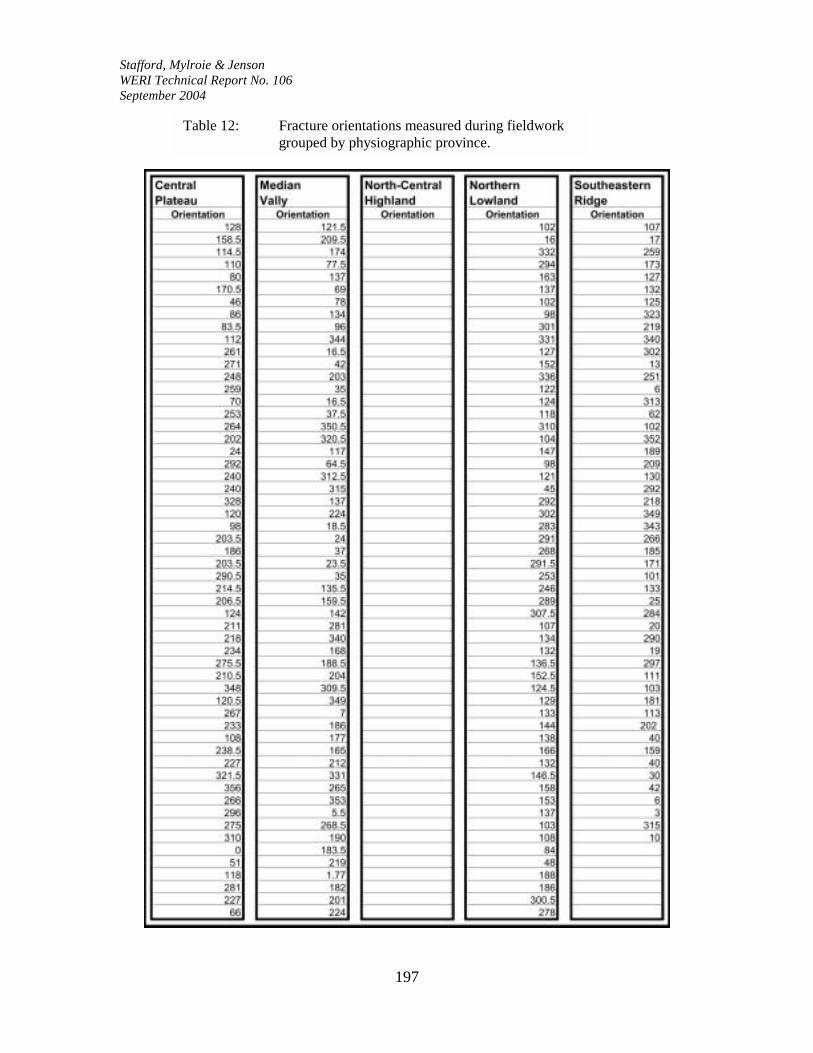
Table 12: Fracture orientations measured during fieldwork
grouped by physiographic province.
Stafford, Mylroie & Jenson WERI Technical Report No. 106 September 2004
198
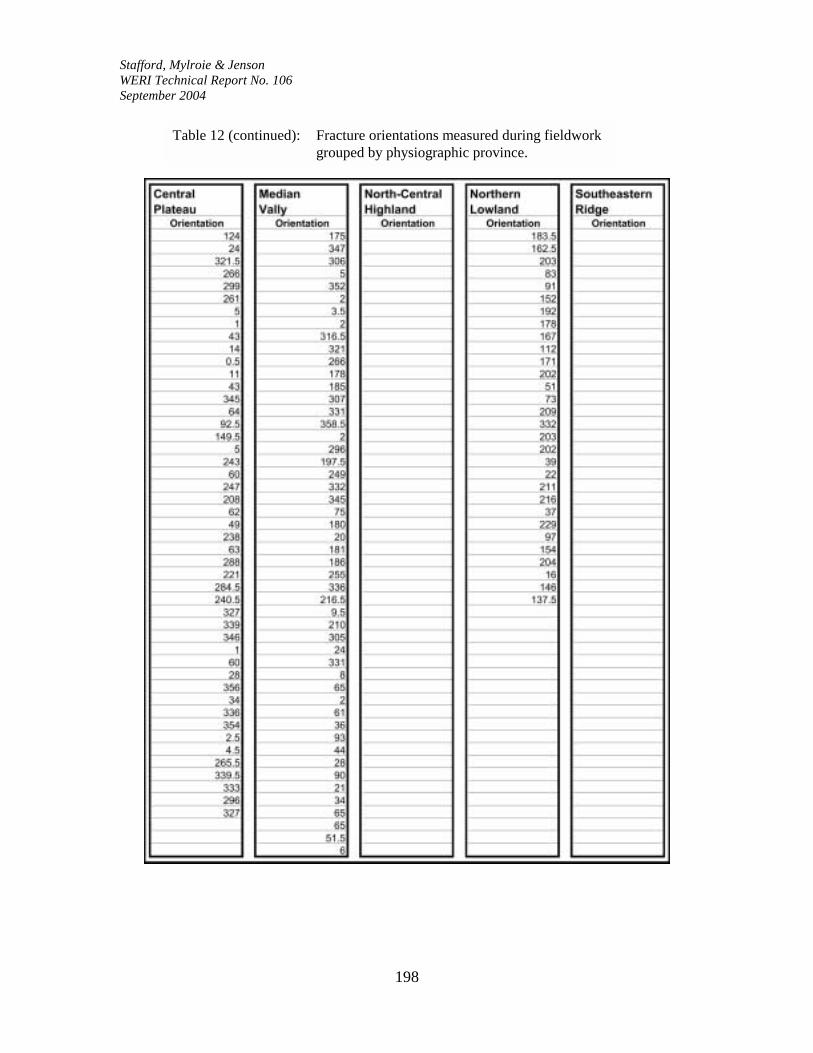
Table 12 (continued): Fracture orientations measured during fieldwork grouped by physiographic province.

Stafford, Mylroie & Jenson WERI Technical Report No. 106 September 2004
199
Figure 176: Rose diagrams of orientations of fractures measured during fieldwork grouped by physiographic province.
Stafford, Mylroie & Jenson WERI Technical Report No. 106 September 2004
200
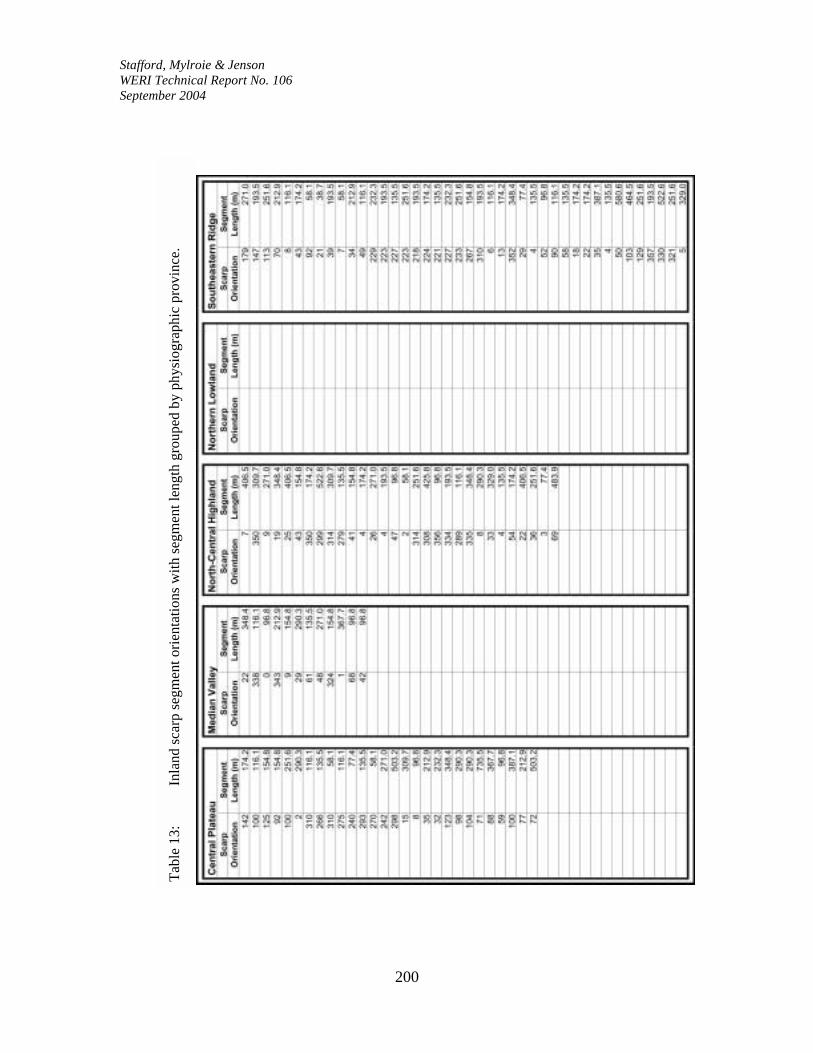
Tabl
e 13
: In
land
scar
p se
gmen
t orie
ntat
ions
with
segm
ent l
engt
h gr
oupe
d by
phy
siog
raph
ic p
rovi
nce.

Stafford, Mylroie & Jenson WERI Technical Report No. 106 September 2004
201
Tabl
e 13
(con
tinue
d):
Inla
nd sc
arp
segm
ent o
rient
atio
ns w
ith se
gmen
t len
gth
grou
ped
by p
hysi
ogra
phic
pro
vinc
e.

Stafford, Mylroie & Jenson WERI Technical Report No. 106 September 2004
202
Figure 177: Rose diagrams of inland scarp orientations
grouped by physiographic province.
Stafford, Mylroie & Jenson WERI Technical Report No. 106 September 2004
203
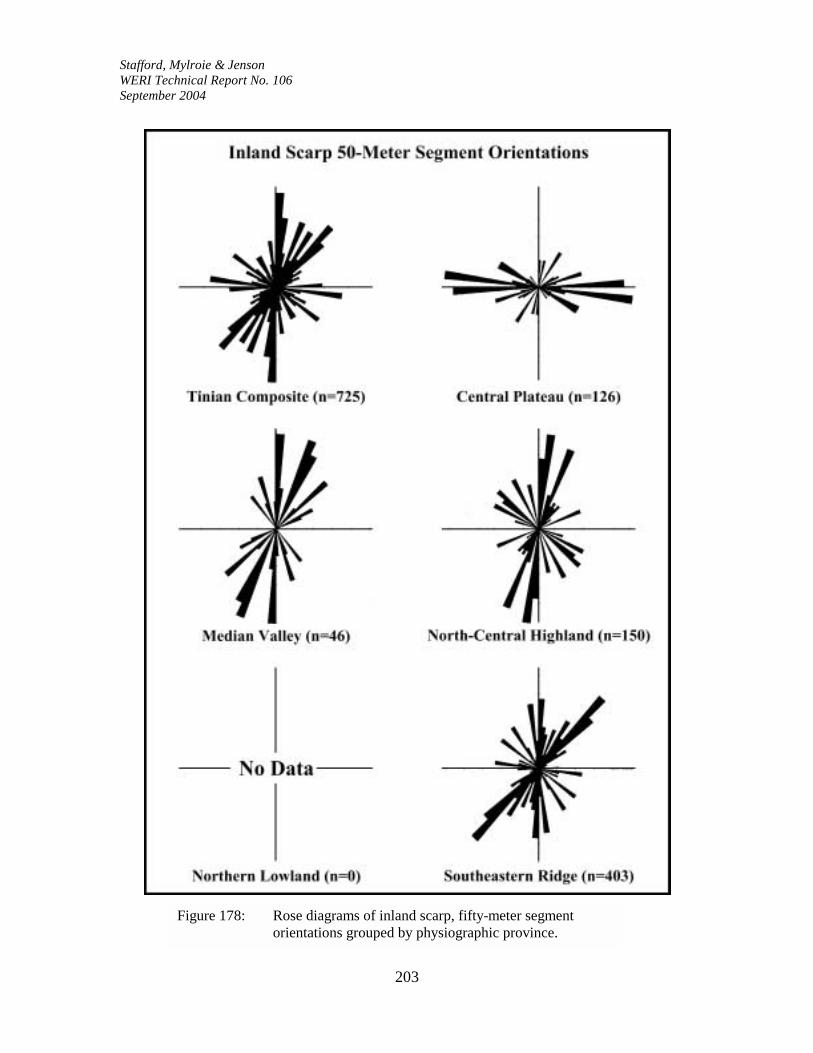
Figure 178: Rose diagrams of inland scarp, fifty-meter segment
orientations grouped by physiographic province.
Stafford, Mylroie & Jenson WERI Technical Report No. 106 September 2004
204
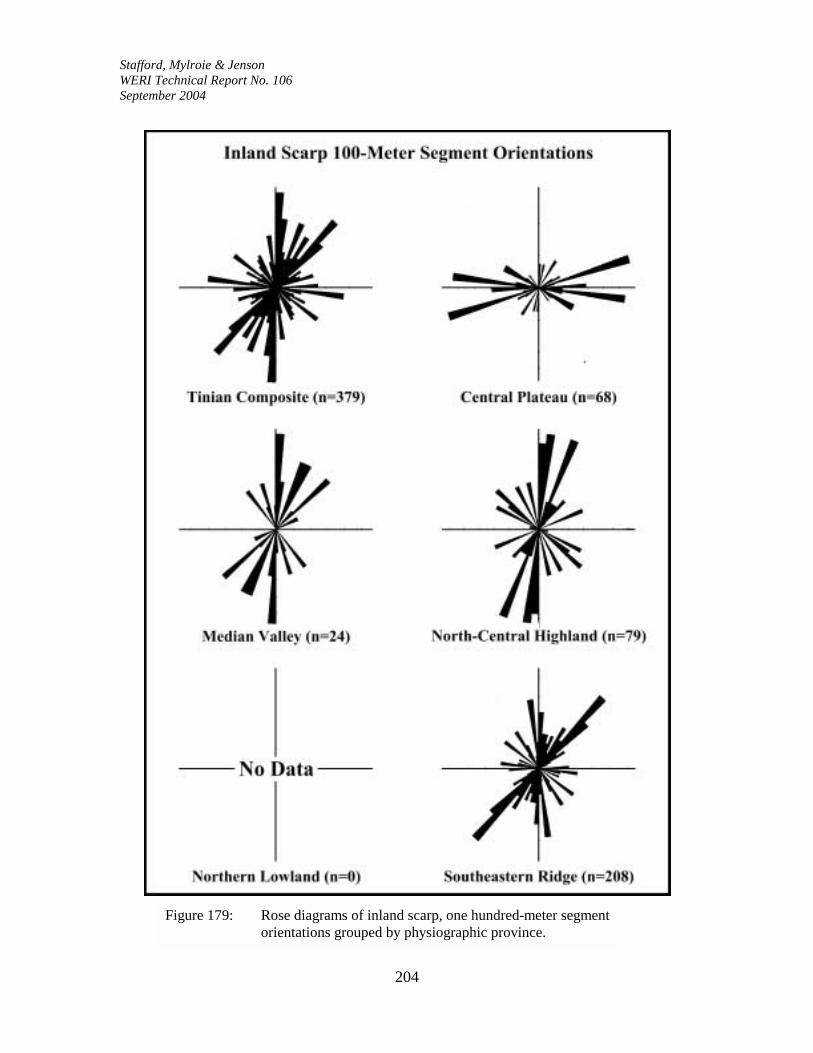
Figure 179: Rose diagrams of inland scarp, one hundred-meter segment
orientations grouped by physiographic province.
Stafford, Mylroie & Jenson WERI Technical Report No. 106 September 2004
205
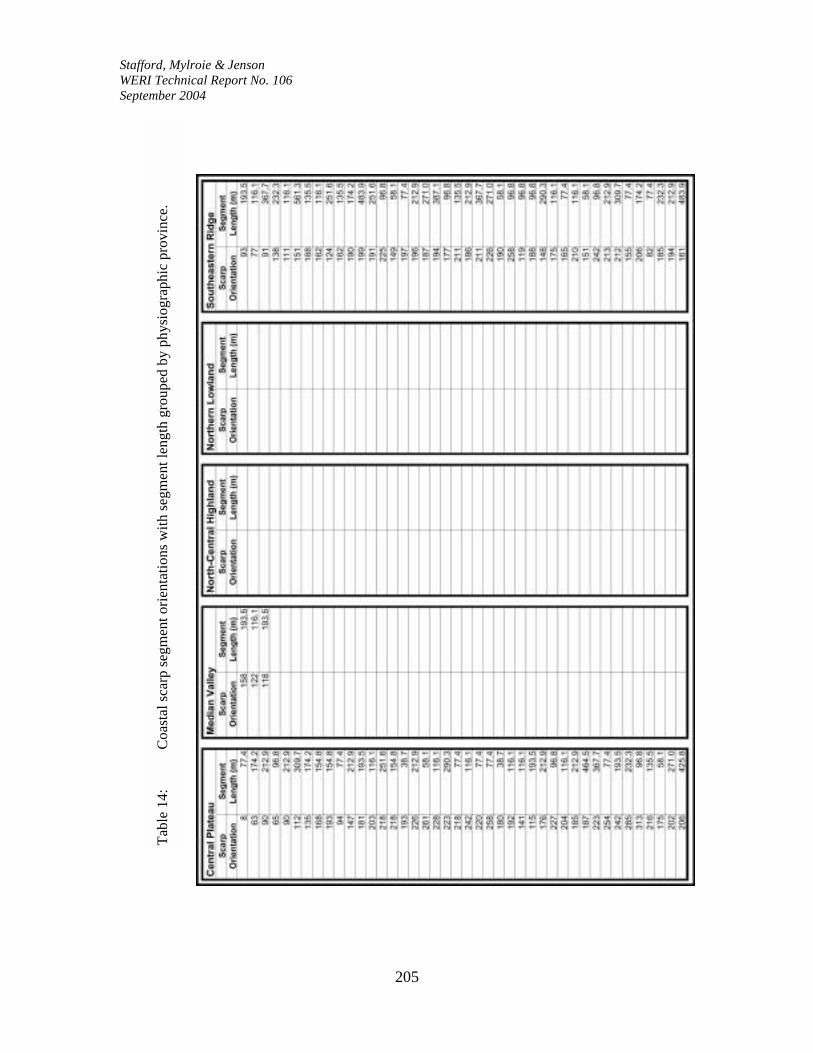
Tabl
e 14
: C
oast
al sc
arp
segm
ent o
rient
atio
ns w
ith se
gmen
t len
gth
grou
ped
by p
hysi
ogra
phic
pro
vinc
e.
Stafford, Mylroie & Jenson WERI Technical Report No. 106 September 2004
206
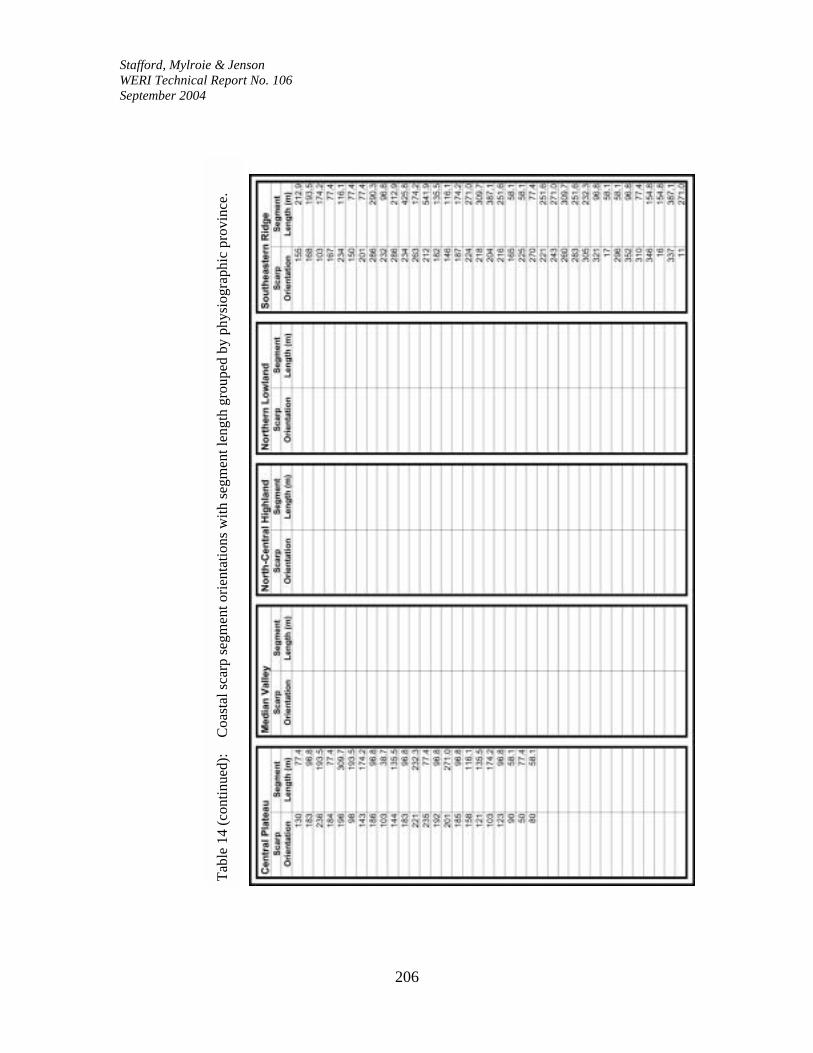
Tabl
e 14
(con
tinue
d):
Coa
stal
scar
p se
gmen
t orie
ntat
ions
with
segm
ent l
engt
h gr
oupe
d by
phy
siog
raph
ic p
rovi
nce.

Stafford, Mylroie & Jenson WERI Technical Report No. 106 September 2004
207
Figure 180: Rose diagrams of coastal scarp orientations
grouped by physiographic province.

Stafford, Mylroie & Jenson WERI Technical Report No. 106 September 2004
208
Figure 181: Rose diagrams of coastal scarp, fifty-meter segment
orientations grouped by physiographic province.

Stafford, Mylroie & Jenson WERI Technical Report No. 106 September 2004
209
Figure 182: Rose diagrams of coastal scarp, one hundred-meter segment
orientations grouped by physiographic province.

Stafford, Mylroie & Jenson WERI Technical Report No. 106 September 2004
210
Figure 183: Rose diagrams of composite scarp orientations
grouped by physiographic province.

Stafford, Mylroie & Jenson WERI Technical Report No. 106 September 2004
211
Figure 184: Rose diagrams of composite scarp, fifty-meter segment
orientations grouped by physiographic province.
Stafford, Mylroie & Jenson WERI Technical Report No. 106 September 2004
212
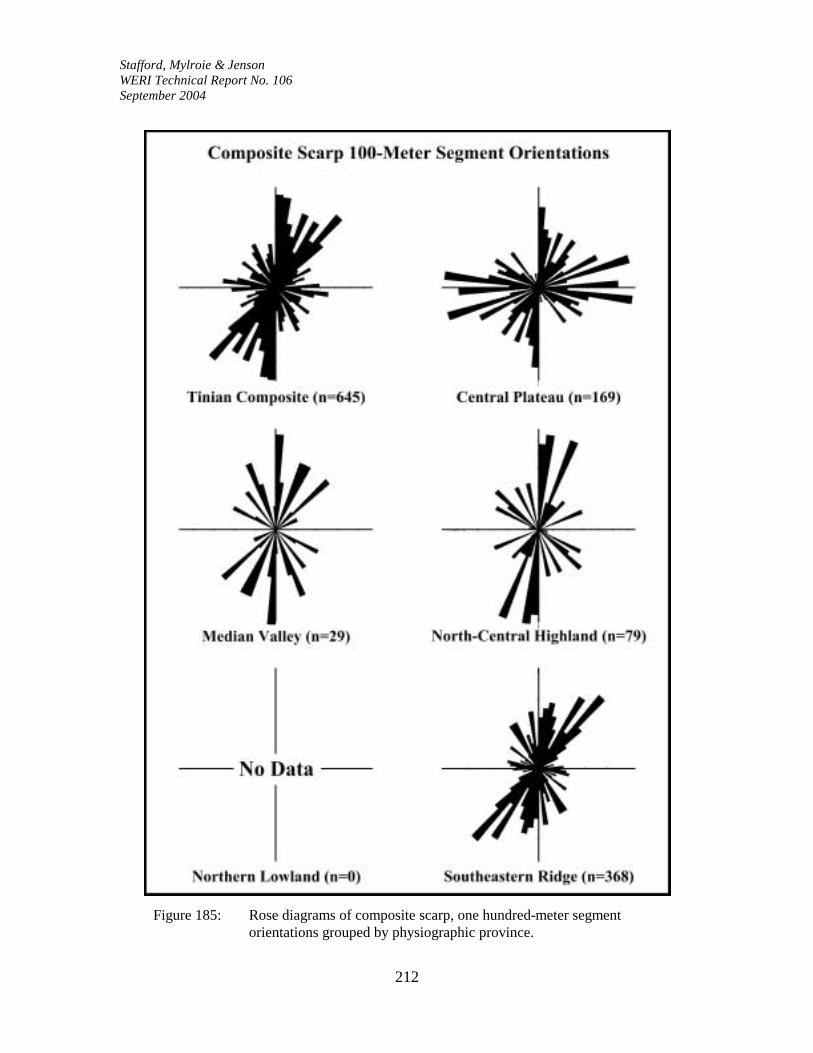
Figure 185: Rose diagrams of composite scarp, one hundred-meter segment
orientations grouped by physiographic province.

Stafford, Mylroie & Jenson WERI Technical Report No. 106 September 2004
213
Tabl
e 15
: C
oast
line
segm
ent o
rient
atio
ns w
ith se
gmen
t len
gth
grou
ped
by p
hysi
ogra
phic
pro
vinc
e.

Stafford, Mylroie & Jenson WERI Technical Report No. 106 September 2004
214
Tabl
e 15
(con
tinue
d):
Coa
stlin
e se
gmen
t orie
ntat
ions
with
segm
ent l
engt
h gr
oupe
d by
phy
siog
raph
ic p
rovi
nce.

Stafford, Mylroie & Jenson WERI Technical Report No. 106 September 2004
215
Figure 186: Rose diagrams of coastline orientations
grouped by physiographic province.

Stafford, Mylroie & Jenson WERI Technical Report No. 106 September 2004
216
Figure 187: Rose diagrams of coastline, fifty-meter segment
orientations grouped by physiographic province.

Stafford, Mylroie & Jenson WERI Technical Report No. 106 September 2004
217
Figure 188: Rose diagrams of coastline, one hundred-meter segment orientations grouped by physiographic province.