appendix c – groundwater recharge technical study of artificial recharge, including spreading...
TRANSCRIPT
Appendix C – Groundwater Recharge Technical Study
August 2013
1
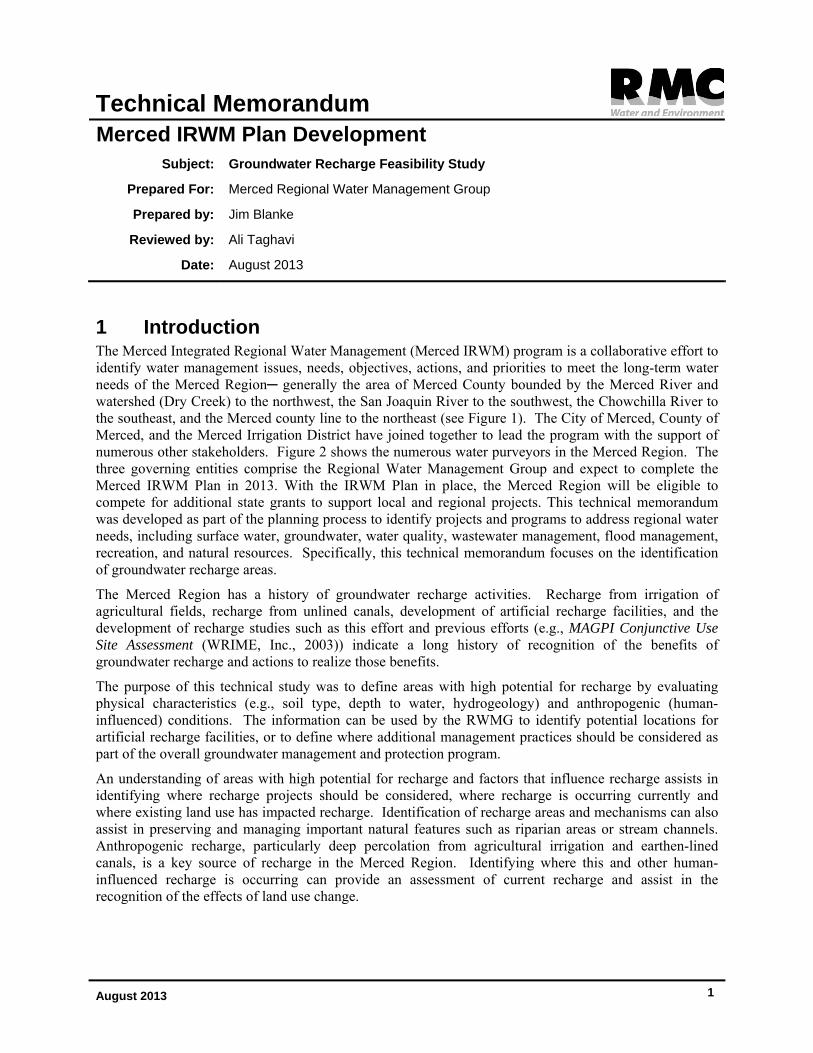
Technical Memorandum Merced IRWM Plan Development
Subject: Groundwater Recharge Feasibility Study
Prepared For: Merced Regional Water Management Group
Prepared by: Jim Blanke
Reviewed by: Ali Taghavi
Date: August 2013
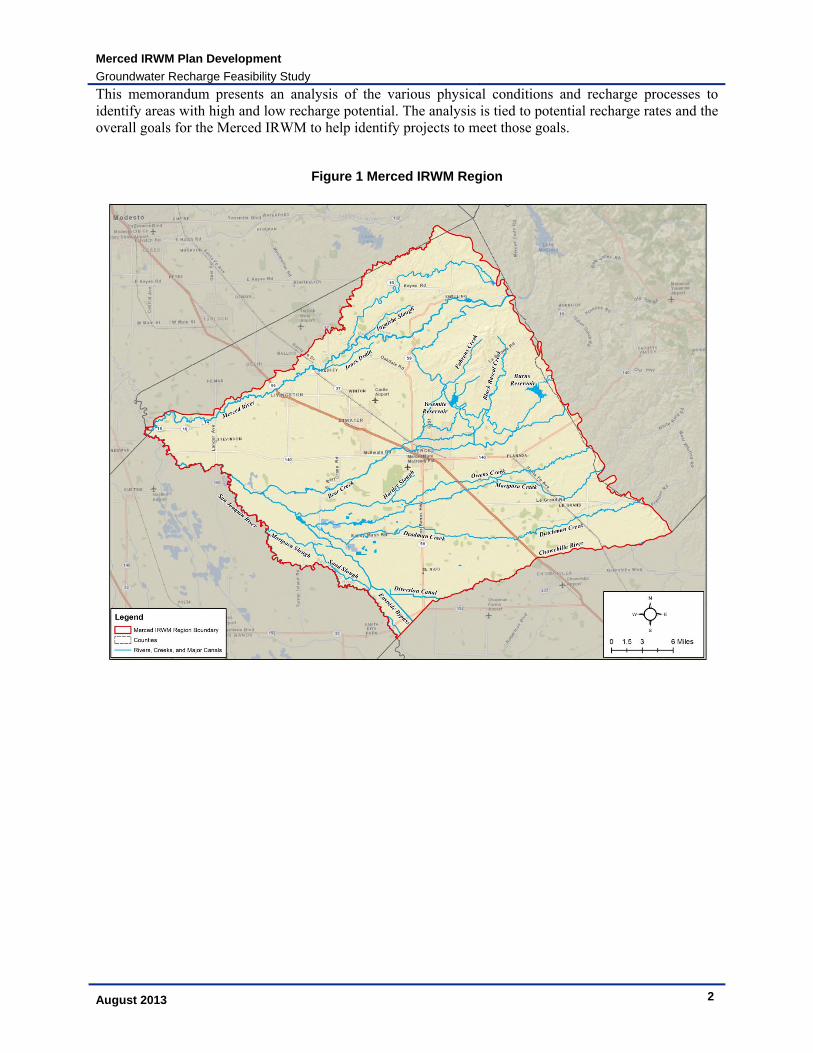
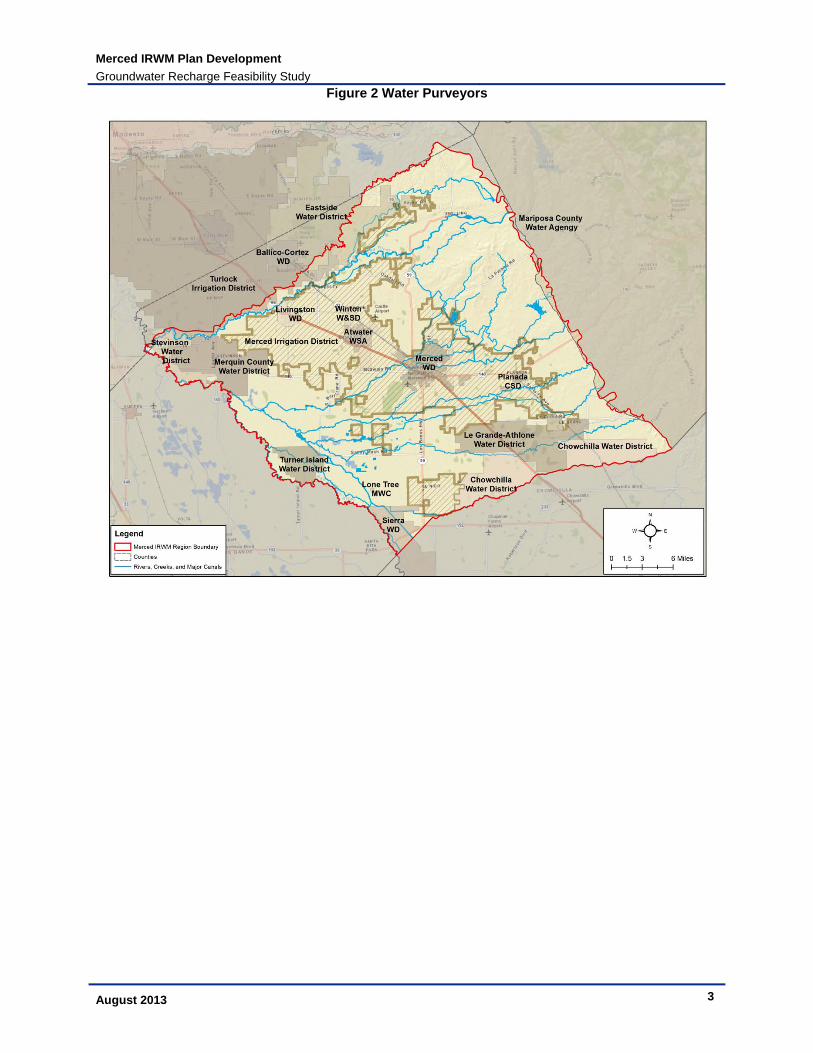
1 Introduction The Merced Integrated Regional Water Management (Merced IRWM) program is a collaborative effort to identify water management issues, needs, objectives, actions, and priorities to meet the long-term water needs of the Merced Region─ generally the area of Merced County bounded by the Merced River and watershed (Dry Creek) to the northwest, the San Joaquin River to the southwest, the Chowchilla River to the southeast, and the Merced county line to the northeast (see Figure 1). The City of Merced, County of Merced, and the Merced Irrigation District have joined together to lead the program with the support of numerous other stakeholders. Figure 2 shows the numerous water purveyors in the Merced Region. The three governing entities comprise the Regional Water Management Group and expect to complete the Merced IRWM Plan in 2013. With the IRWM Plan in place, the Merced Region will be eligible to compete for additional state grants to support local and regional projects. This technical memorandum was developed as part of the planning process to identify projects and programs to address regional water needs, including surface water, groundwater, water quality, wastewater management, flood management, recreation, and natural resources. Specifically, this technical memorandum focuses on the identification of groundwater recharge areas.
The Merced Region has a history of groundwater recharge activities. Recharge from irrigation of agricultural fields, recharge from unlined canals, development of artificial recharge facilities, and the development of recharge studies such as this effort and previous efforts (e.g., MAGPI Conjunctive Use Site Assessment (WRIME, Inc., 2003)) indicate a long history of recognition of the benefits of groundwater recharge and actions to realize those benefits.
The purpose of this technical study was to define areas with high potential for recharge by evaluating physical characteristics (e.g., soil type, depth to water, hydrogeology) and anthropogenic (human-influenced) conditions. The information can be used by the RWMG to identify potential locations for artificial recharge facilities, or to define where additional management practices should be considered as part of the overall groundwater management and protection program.
An understanding of areas with high potential for recharge and factors that influence recharge assists in identifying where recharge projects should be considered, where recharge is occurring currently and where existing land use has impacted recharge. Identification of recharge areas and mechanisms can also assist in preserving and managing important natural features such as riparian areas or stream channels. Anthropogenic recharge, particularly deep percolation from agricultural irrigation and earthen-lined canals, is a key source of recharge in the Merced Region. Identifying where this and other human-influenced recharge is occurring can provide an assessment of current recharge and assist in the recognition of the effects of land use change.
Merced IRWM Plan Development
Groundwater Recharge Feasibility Study
August 2013 2
This memorandum presents an analysis of the various physical conditions and recharge processes to identify areas with high and low recharge potential. The analysis is tied to potential recharge rates and the overall goals for the Merced IRWM to help identify projects to meet those goals.
Figure 1 Merced IRWM Region
Merced IRWM Plan Development
Groundwater Recharge Feasibility Study
August 2013 3
Figure 2 Water Purveyors
Merced IRWM Plan Development
Groundwater Recharge Feasibility Study
August 2013 4
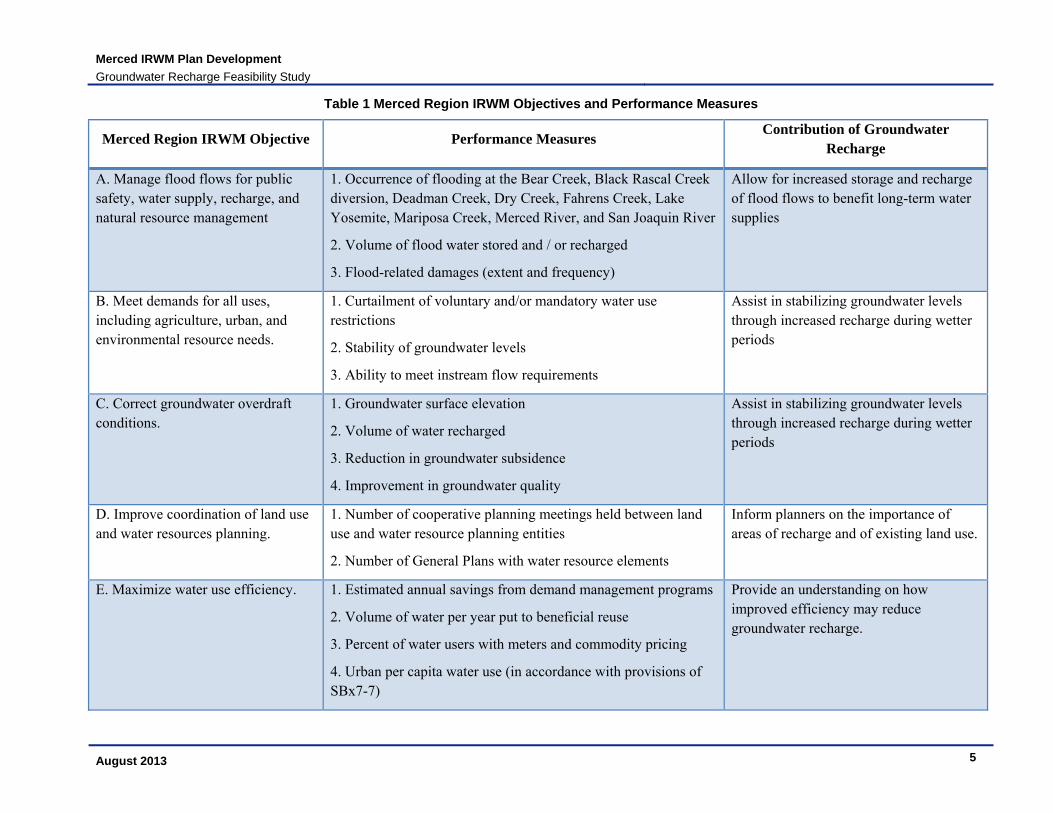
2 Vision and Objectives The Regional Advisory Committee (RAC) developed 12 IRWM Objectives with associated performance measures. Eleven of these objectives have direct relevance to groundwater recharge, as indicated in Table 1, including correcting groundwater overdraft conditions. Recharge, including natural recharge, human-induced (anthropogenic) recharge, and artificial recharge, are important components of water management. These 11 objectives can be met in whole or in part through
Protection of existing recharge,
Incorporation of recharge benefits into multi-benefit projects or programs, or
Development of artificial recharge, including spreading basins and in-lieu recharge.
Together, these recharge components will be an important part of balancing the groundwater budget in the Merced Basin. The groundwater budget is an accounting method of showing the difference between what goes into the groundwater basin (e.g., recharge from precipitation and irrigation, recharge from rivers, subsurface flows from adjacent basins) and what goes out of the groundwater basin (e.g., groundwater pumping, discharge to rivers, subsurface flow to adjacent basins). If the groundwater budget is negative over a long time period (e.g., decades), then there is a long-term trend towards reduced groundwater in storage and declining groundwater levels. If the groundwater budget is positive over a long time period, then there is a long-term trend towards increased groundwater in storage and rising groundwater levels. A groundwater budget showing little difference between inflows and outflows is considered balanced, with stable volumes of groundwater in storage and regionally stable groundwater levels.
In the Merced Region, the current understanding of the groundwater budget indicates a long-term decline in storage (AMEC Geomatrix, 2008). Development of a detailed water budget is planned as part of the development of the new regional integrated water resources model (see Section 6.1.1). Preserving existing recharge and developing artificial recharge can assist in meeting objectives, including correcting groundwater overdraft conditions and others. The RAC has not identified the extent to which it expects groundwater recharge to meet the goal of correcting overdraft conditions, so this memorandum will take the approach of looking at the potential of using recharge as the exclusive tool to meet that goal, while in reality a variety of tools will likely be used, such as conservation and usage of alternate supplies.
Groundwater recharge may occur through three primary methods: spreading basins, in-lieu recharge, and injection.
The development of spreading basins is the focus of this document. Spreading basins involve the construction of a detention basin, and associated water delivery infrastructure, that allows water to percolate from the ground surface to aquifers used for water supply. The siting of such basins is complex as it requires an understanding of surface and subsurface conditions from the ground surface down to the water supply aquifer.
In-lieu recharge substitutes alternate water supplies for groundwater production, allowing the groundwater that would have been pumped to stay in the aquifer. This method is simpler as there is no need for the water to migrate down through the subsurface, but the volume that can be recharged is limited to the timing and overall demand for groundwater pumping in the identified area.
Injection of groundwater, often referred to as Aquifer Storage and Recovery (ASR), uses wells to inject water directly into the subsurface. Like in-lieu, injection avoids the complexity of moving recharge water down through the subsurface, but the injection process is more sensitive to differences in water quality and typically required more facilities although on a small footprint.
The following analysis is focused on the use of spreading basins, although in-lieu and injection remain options for the region.
Merced IRWM Plan Development
Groundwater Recharge Feasibility Study
August 2013 5
Table 1 Merced Region IRWM Objectives and Performance Measures
Merced Region IRWM Objective Performance Measures Contribution of Groundwater
Recharge
A. Manage flood flows for public safety, water supply, recharge, and natural resource management
1. Occurrence of flooding at the Bear Creek, Black Rascal Creek diversion, Deadman Creek, Dry Creek, Fahrens Creek, Lake Yosemite, Mariposa Creek, Merced River, and San Joaquin River
2. Volume of flood water stored and / or recharged
3. Flood-related damages (extent and frequency)
Allow for increased storage and recharge of flood flows to benefit long-term water supplies
B. Meet demands for all uses, including agriculture, urban, and environmental resource needs.
1. Curtailment of voluntary and/or mandatory water use restrictions
2. Stability of groundwater levels
3. Ability to meet instream flow requirements
Assist in stabilizing groundwater levels through increased recharge during wetter periods
C. Correct groundwater overdraft conditions.
1. Groundwater surface elevation
2. Volume of water recharged
3. Reduction in groundwater subsidence
4. Improvement in groundwater quality
Assist in stabilizing groundwater levels through increased recharge during wetter periods
D. Improve coordination of land use and water resources planning.
1. Number of cooperative planning meetings held between land use and water resource planning entities
2. Number of General Plans with water resource elements
Inform planners on the importance of areas of recharge and of existing land use.
E. Maximize water use efficiency. 1. Estimated annual savings from demand management programs
2. Volume of water per year put to beneficial reuse
3. Percent of water users with meters and commodity pricing
4. Urban per capita water use (in accordance with provisions of SBx7-7)
Provide an understanding on how improved efficiency may reduce groundwater recharge.
Merced IRWM Plan Development
Groundwater Recharge Feasibility Study
August 2013 6
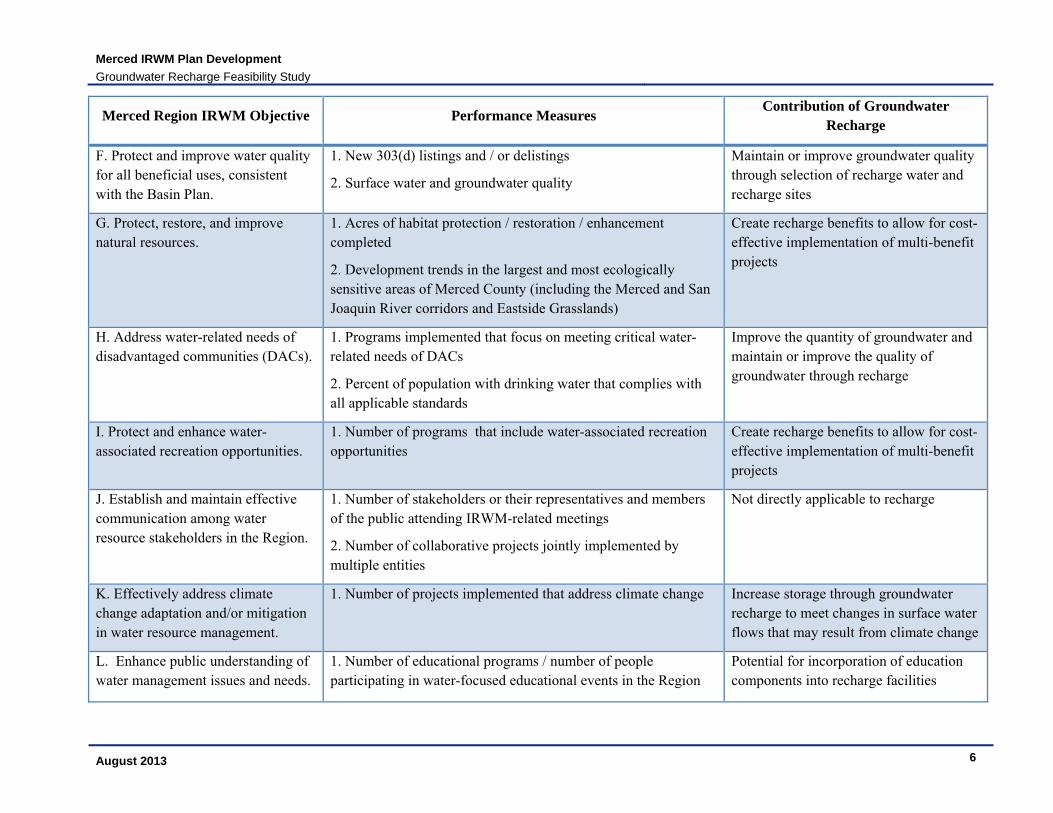
Merced Region IRWM Objective Performance Measures Contribution of Groundwater
Recharge
F. Protect and improve water quality for all beneficial uses, consistent with the Basin Plan.
1. New 303(d) listings and / or delistings
2. Surface water and groundwater quality
Maintain or improve groundwater quality through selection of recharge water and recharge sites
G. Protect, restore, and improve natural resources.
1. Acres of habitat protection / restoration / enhancement completed
2. Development trends in the largest and most ecologically sensitive areas of Merced County (including the Merced and San Joaquin River corridors and Eastside Grasslands)
Create recharge benefits to allow for cost-effective implementation of multi-benefit projects
H. Address water-related needs of disadvantaged communities (DACs).
1. Programs implemented that focus on meeting critical water-related needs of DACs
2. Percent of population with drinking water that complies with all applicable standards
Improve the quantity of groundwater and maintain or improve the quality of groundwater through recharge
I. Protect and enhance water-associated recreation opportunities.
1. Number of programs that include water-associated recreation opportunities
Create recharge benefits to allow for cost-effective implementation of multi-benefit projects
J. Establish and maintain effective communication among water resource stakeholders in the Region.
1. Number of stakeholders or their representatives and members of the public attending IRWM-related meetings
2. Number of collaborative projects jointly implemented by multiple entities
Not directly applicable to recharge
K. Effectively address climate change adaptation and/or mitigation in water resource management.
1. Number of projects implemented that address climate change Increase storage through groundwater recharge to meet changes in surface water flows that may result from climate change
L. Enhance public understanding of water management issues and needs.
1. Number of educational programs / number of people participating in water-focused educational events in the Region
Potential for incorporation of education components into recharge facilities
Merced IRWM Plan Development
Groundwater Recharge Feasibility Study
August 2013 7
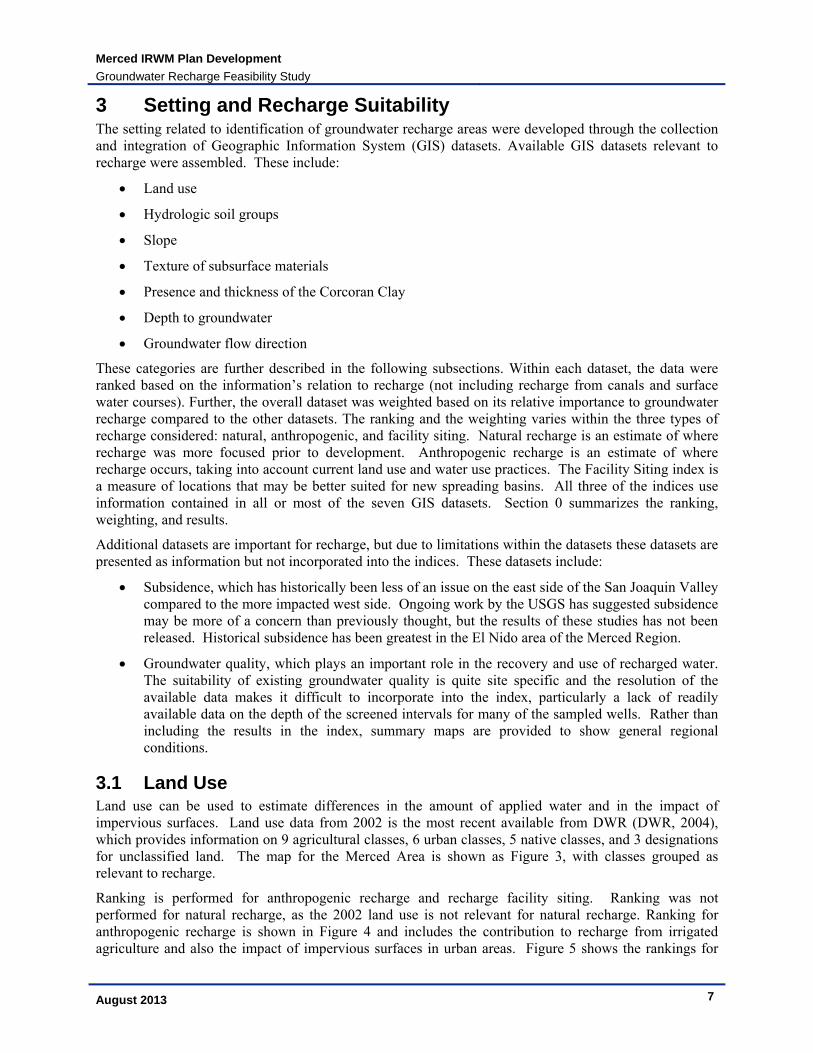
3 Setting and Recharge Suitability The setting related to identification of groundwater recharge areas were developed through the collection and integration of Geographic Information System (GIS) datasets. Available GIS datasets relevant to recharge were assembled. These include:
Land use
Hydrologic soil groups
Slope
Texture of subsurface materials
Presence and thickness of the Corcoran Clay
Depth to groundwater
Groundwater flow direction
These categories are further described in the following subsections. Within each dataset, the data were ranked based on the information’s relation to recharge (not including recharge from canals and surface water courses). Further, the overall dataset was weighted based on its relative importance to groundwater recharge compared to the other datasets. The ranking and the weighting varies within the three types of recharge considered: natural, anthropogenic, and facility siting. Natural recharge is an estimate of where recharge was more focused prior to development. Anthropogenic recharge is an estimate of where recharge occurs, taking into account current land use and water use practices. The Facility Siting index is a measure of locations that may be better suited for new spreading basins. All three of the indices use information contained in all or most of the seven GIS datasets. Section 0 summarizes the ranking, weighting, and results.
Additional datasets are important for recharge, but due to limitations within the datasets these datasets are presented as information but not incorporated into the indices. These datasets include:
Subsidence, which has historically been less of an issue on the east side of the San Joaquin Valley compared to the more impacted west side. Ongoing work by the USGS has suggested subsidence may be more of a concern than previously thought, but the results of these studies has not been released. Historical subsidence has been greatest in the El Nido area of the Merced Region.
Groundwater quality, which plays an important role in the recovery and use of recharged water. The suitability of existing groundwater quality is quite site specific and the resolution of the available data makes it difficult to incorporate into the index, particularly a lack of readily available data on the depth of the screened intervals for many of the sampled wells. Rather than including the results in the index, summary maps are provided to show general regional conditions.
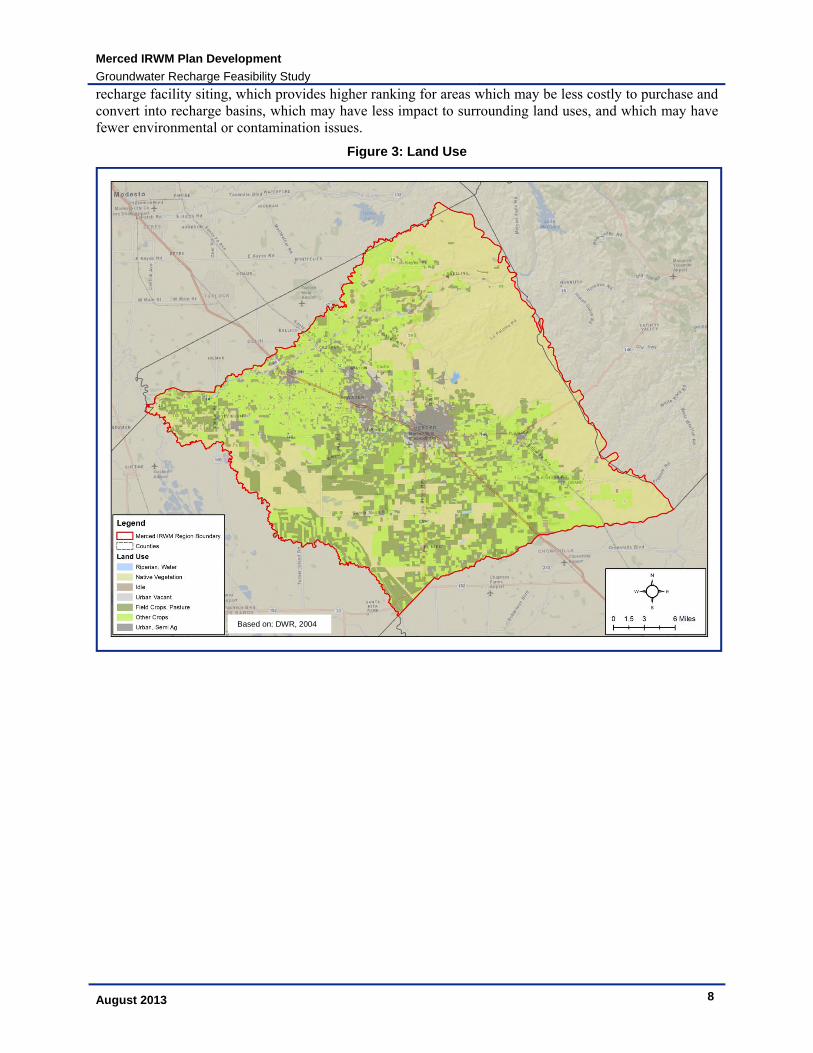
3.1 Land Use Land use can be used to estimate differences in the amount of applied water and in the impact of impervious surfaces. Land use data from 2002 is the most recent available from DWR (DWR, 2004), which provides information on 9 agricultural classes, 6 urban classes, 5 native classes, and 3 designations for unclassified land. The map for the Merced Area is shown as Figure 3, with classes grouped as relevant to recharge.
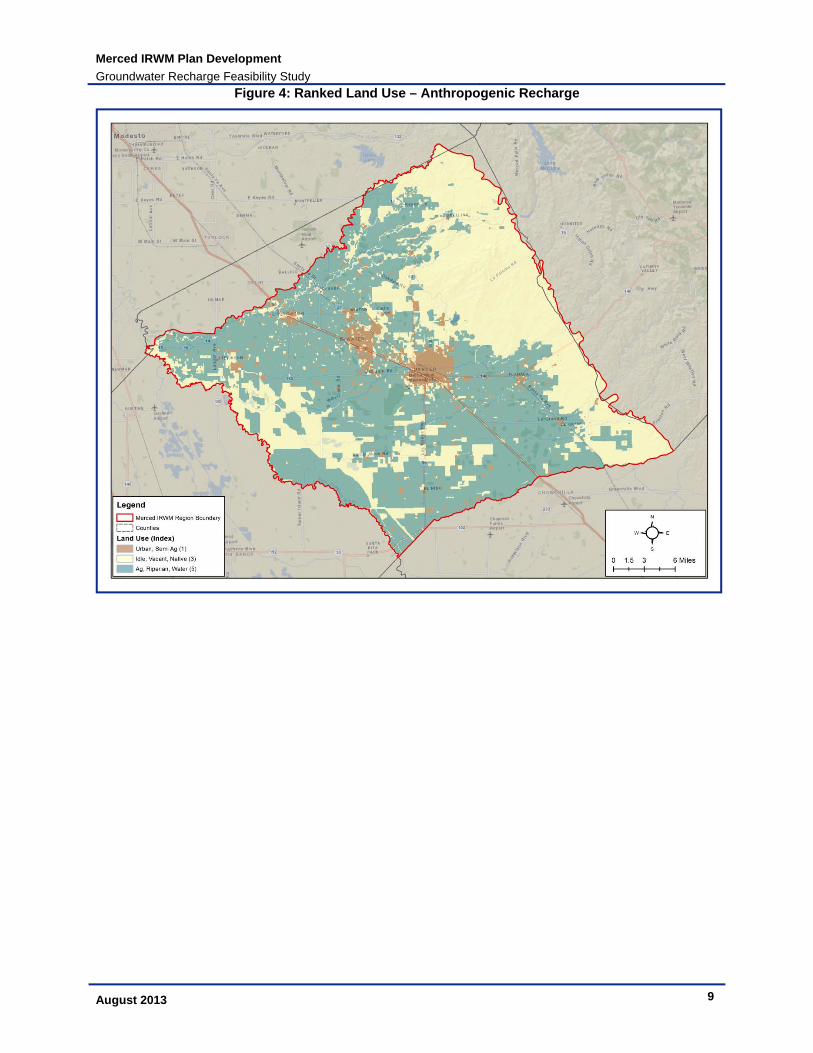
Ranking is performed for anthropogenic recharge and recharge facility siting. Ranking was not performed for natural recharge, as the 2002 land use is not relevant for natural recharge. Ranking for anthropogenic recharge is shown in Figure 4 and includes the contribution to recharge from irrigated agriculture and also the impact of impervious surfaces in urban areas. Figure 5 shows the rankings for
Merced IRWM Plan Development
Groundwater Recharge Feasibility Study
August 2013 8
recharge facility siting, which provides higher ranking for areas which may be less costly to purchase and convert into recharge basins, which may have less impact to surrounding land uses, and which may have fewer environmental or contamination issues.
Figure 3: Land Use
Based on: DWR, 2004
Merced IRWM Plan Development
Groundwater Recharge Feasibility Study
August 2013 9
Figure 4: Ranked Land Use – Anthropogenic Recharge
Merced IRWM Plan Development
Groundwater Recharge Feasibility Study
August 2013 10
Figure 5: Ranked Land Use – Recharge Facility Siting
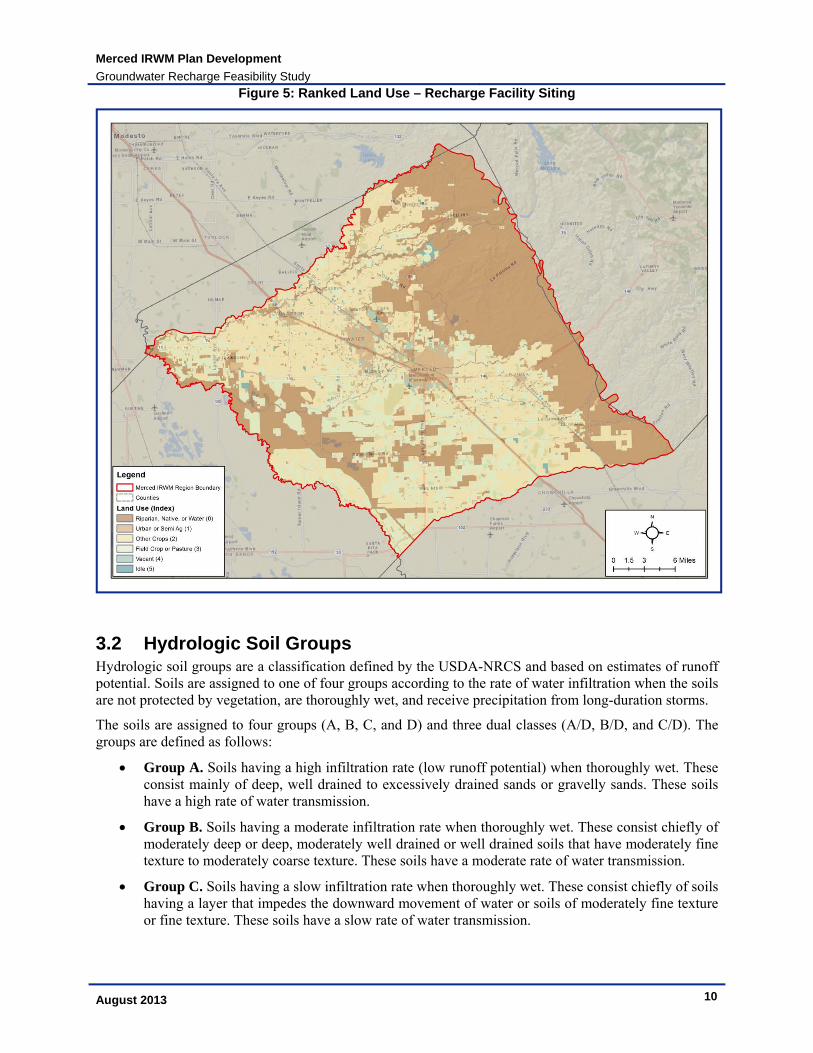
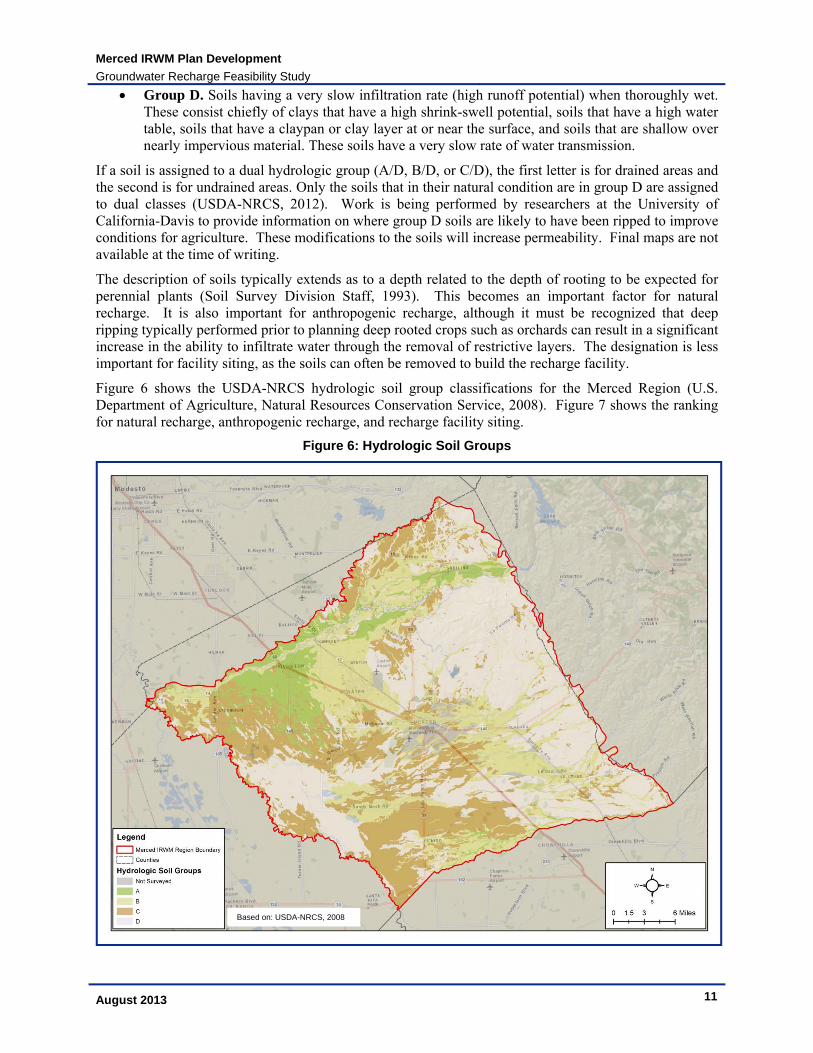
3.2 Hydrologic Soil Groups Hydrologic soil groups are a classification defined by the USDA-NRCS and based on estimates of runoff potential. Soils are assigned to one of four groups according to the rate of water infiltration when the soils are not protected by vegetation, are thoroughly wet, and receive precipitation from long-duration storms.
The soils are assigned to four groups (A, B, C, and D) and three dual classes (A/D, B/D, and C/D). The groups are defined as follows:
Group A. Soils having a high infiltration rate (low runoff potential) when thoroughly wet. These consist mainly of deep, well drained to excessively drained sands or gravelly sands. These soils have a high rate of water transmission.
Group B. Soils having a moderate infiltration rate when thoroughly wet. These consist chiefly of moderately deep or deep, moderately well drained or well drained soils that have moderately fine texture to moderately coarse texture. These soils have a moderate rate of water transmission.
Group C. Soils having a slow infiltration rate when thoroughly wet. These consist chiefly of soils having a layer that impedes the downward movement of water or soils of moderately fine texture or fine texture. These soils have a slow rate of water transmission.
Merced IRWM Plan Development
Groundwater Recharge Feasibility Study
August 2013 11
Group D. Soils having a very slow infiltration rate (high runoff potential) when thoroughly wet. These consist chiefly of clays that have a high shrink-swell potential, soils that have a high water table, soils that have a claypan or clay layer at or near the surface, and soils that are shallow over nearly impervious material. These soils have a very slow rate of water transmission.
If a soil is assigned to a dual hydrologic group (A/D, B/D, or C/D), the first letter is for drained areas and the second is for undrained areas. Only the soils that in their natural condition are in group D are assigned to dual classes (USDA-NRCS, 2012). Work is being performed by researchers at the University of California-Davis to provide information on where group D soils are likely to have been ripped to improve conditions for agriculture. These modifications to the soils will increase permeability. Final maps are not available at the time of writing.
The description of soils typically extends as to a depth related to the depth of rooting to be expected for perennial plants (Soil Survey Division Staff, 1993). This becomes an important factor for natural recharge. It is also important for anthropogenic recharge, although it must be recognized that deep ripping typically performed prior to planning deep rooted crops such as orchards can result in a significant increase in the ability to infiltrate water through the removal of restrictive layers. The designation is less important for facility siting, as the soils can often be removed to build the recharge facility.
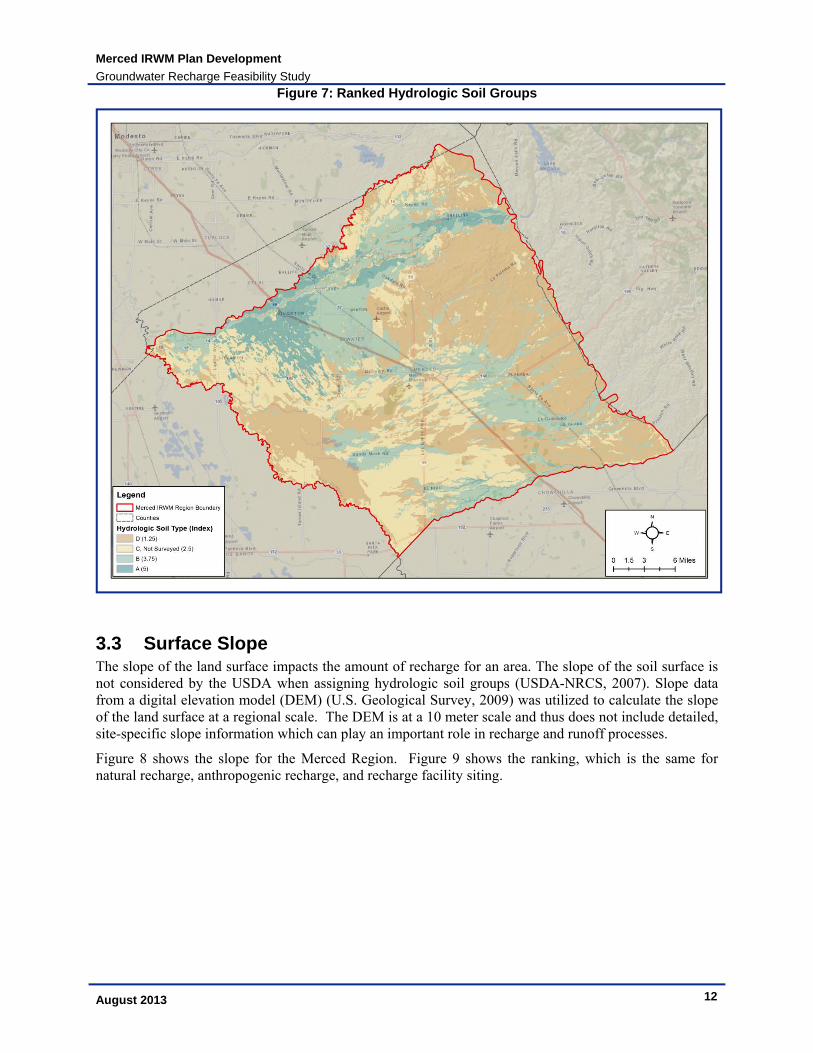
Figure 6 shows the USDA-NRCS hydrologic soil group classifications for the Merced Region (U.S. Department of Agriculture, Natural Resources Conservation Service, 2008). Figure 7 shows the ranking for natural recharge, anthropogenic recharge, and recharge facility siting.
Figure 6: Hydrologic Soil Groups
Based on: USDA-NRCS, 2008
Merced IRWM Plan Development
Groundwater Recharge Feasibility Study
August 2013 12
Figure 7: Ranked Hydrologic Soil Groups
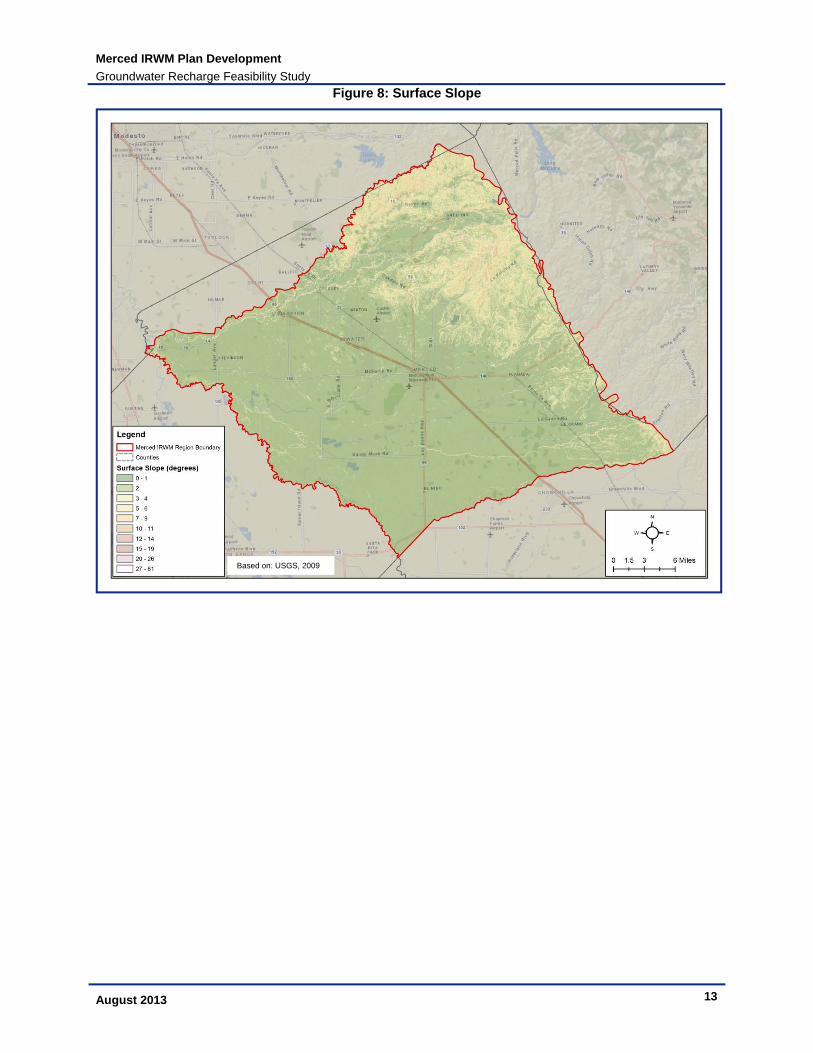
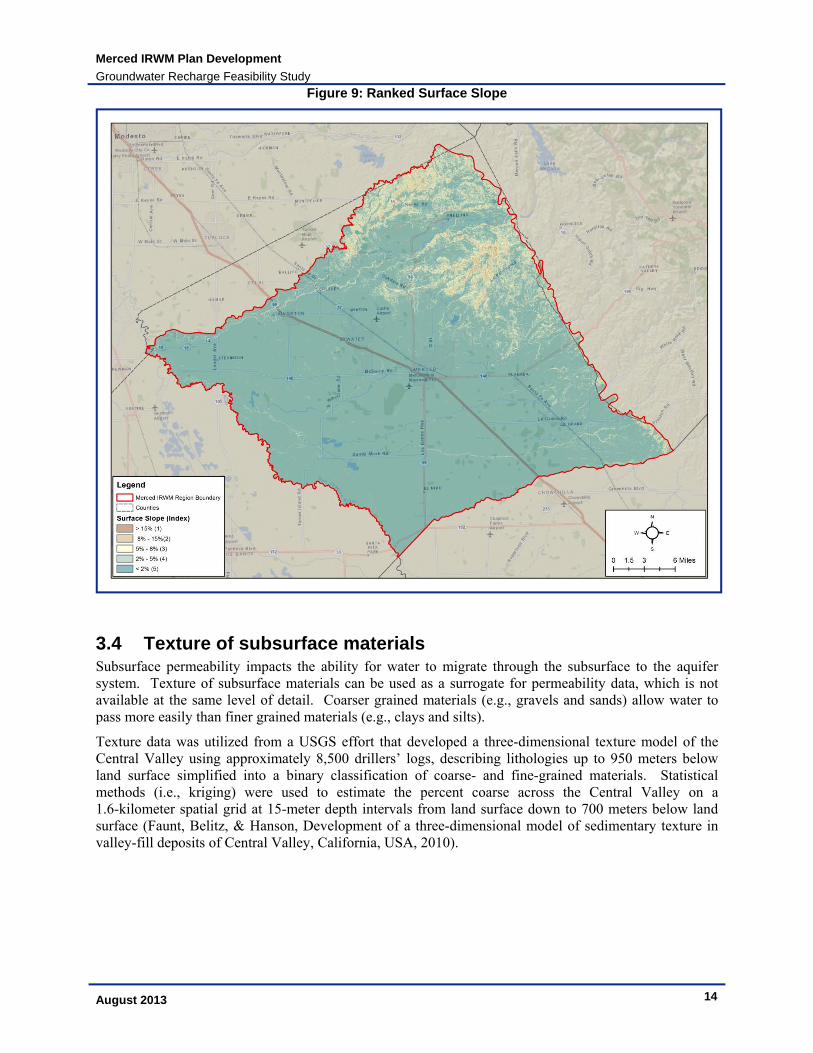
3.3 Surface Slope The slope of the land surface impacts the amount of recharge for an area. The slope of the soil surface is not considered by the USDA when assigning hydrologic soil groups (USDA-NRCS, 2007). Slope data from a digital elevation model (DEM) (U.S. Geological Survey, 2009) was utilized to calculate the slope of the land surface at a regional scale. The DEM is at a 10 meter scale and thus does not include detailed, site-specific slope information which can play an important role in recharge and runoff processes.
Figure 8 shows the slope for the Merced Region. Figure 9 shows the ranking, which is the same for natural recharge, anthropogenic recharge, and recharge facility siting.
Merced IRWM Plan Development
Groundwater Recharge Feasibility Study
August 2013 13
Figure 8: Surface Slope
Based on: USGS, 2009
Merced IRWM Plan Development
Groundwater Recharge Feasibility Study
August 2013 14
Figure 9: Ranked Surface Slope
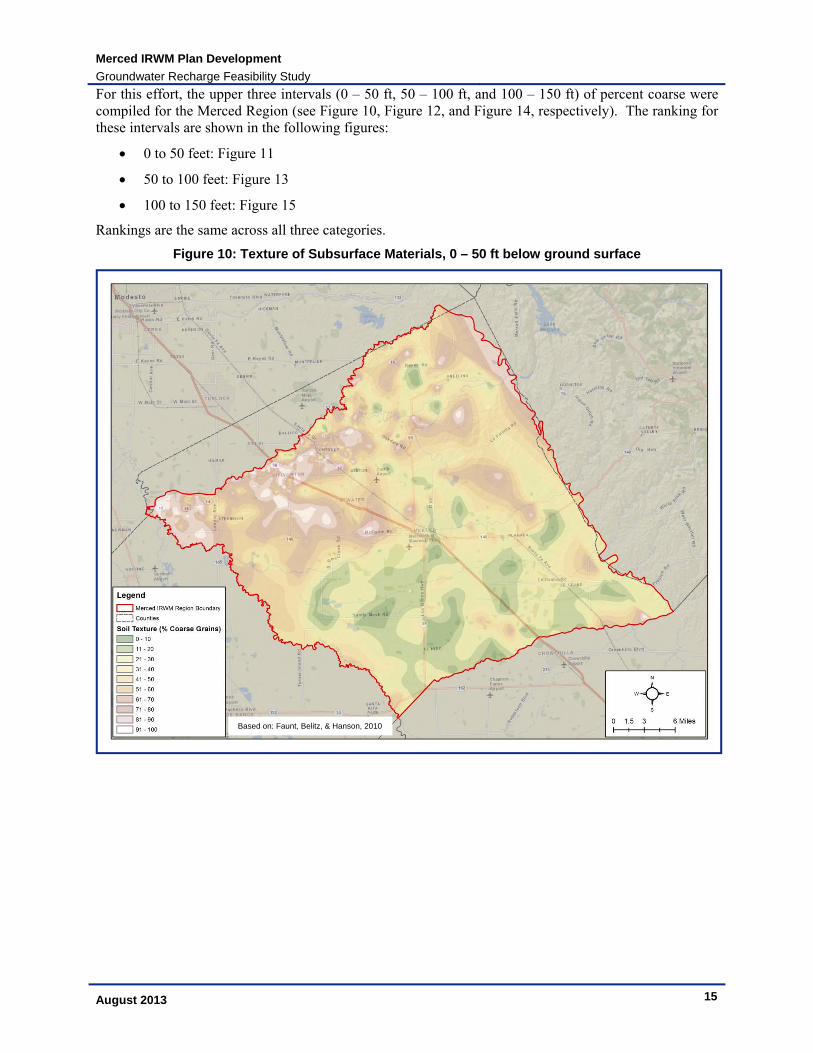
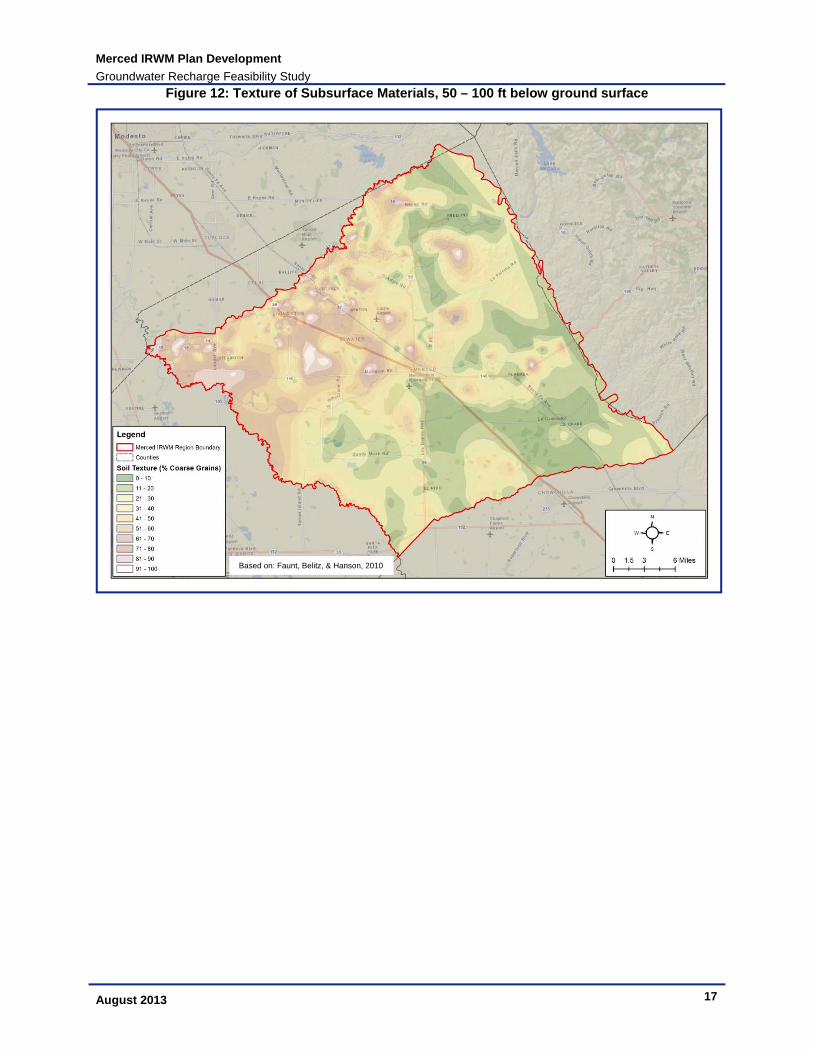
3.4 Texture of subsurface materials Subsurface permeability impacts the ability for water to migrate through the subsurface to the aquifer system. Texture of subsurface materials can be used as a surrogate for permeability data, which is not available at the same level of detail. Coarser grained materials (e.g., gravels and sands) allow water to pass more easily than finer grained materials (e.g., clays and silts).
Texture data was utilized from a USGS effort that developed a three-dimensional texture model of the Central Valley using approximately 8,500 drillers’ logs, describing lithologies up to 950 meters below land surface simplified into a binary classification of coarse- and fine-grained materials. Statistical methods (i.e., kriging) were used to estimate the percent coarse across the Central Valley on a 1.6-kilometer spatial grid at 15-meter depth intervals from land surface down to 700 meters below land surface (Faunt, Belitz, & Hanson, Development of a three-dimensional model of sedimentary texture in valley-fill deposits of Central Valley, California, USA, 2010).
Merced IRWM Plan Development
Groundwater Recharge Feasibility Study
August 2013 15
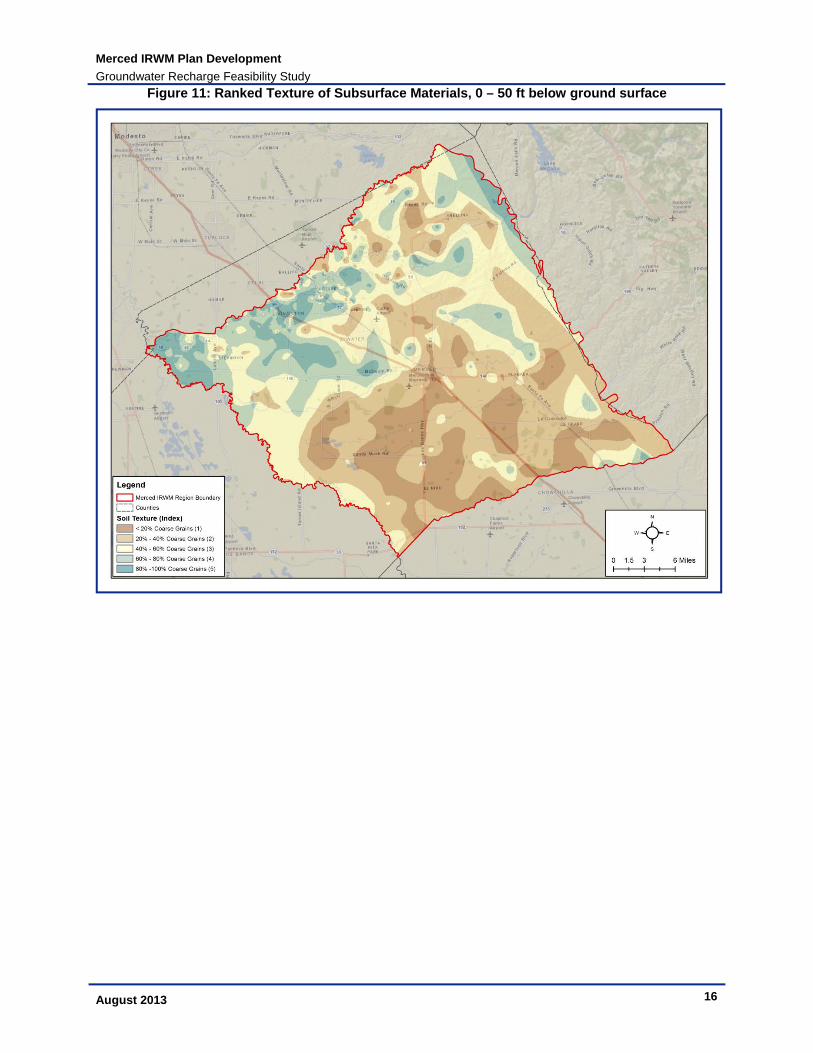
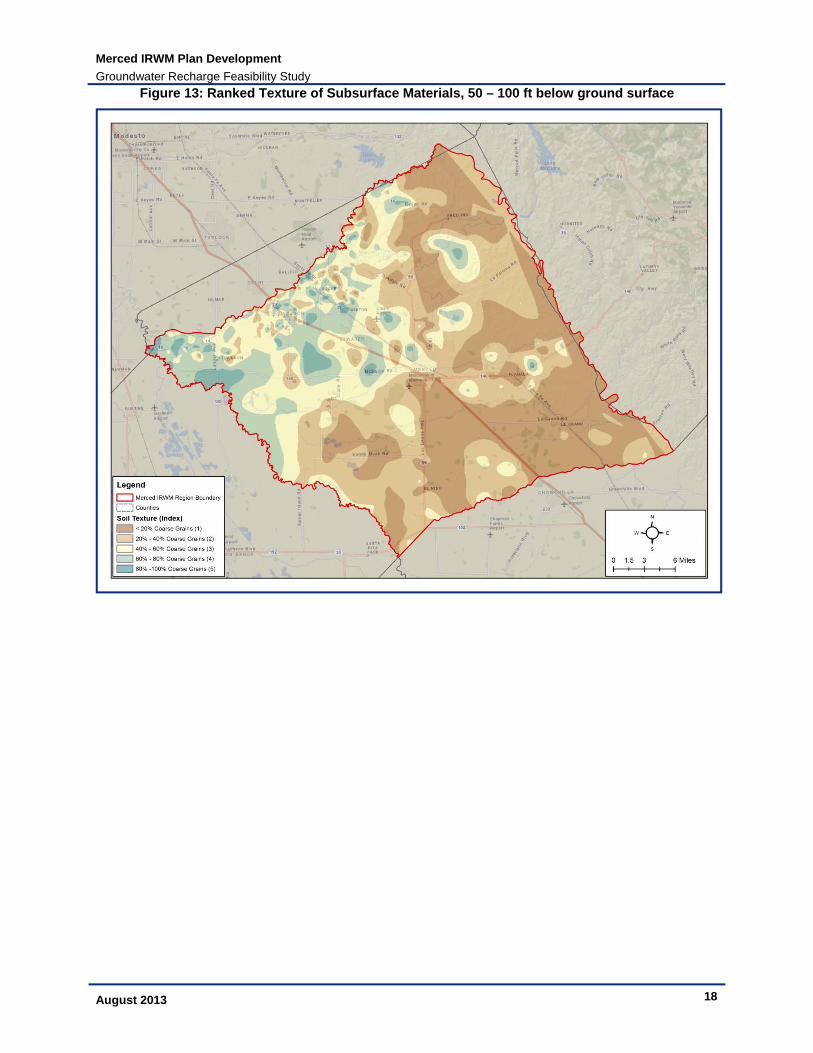
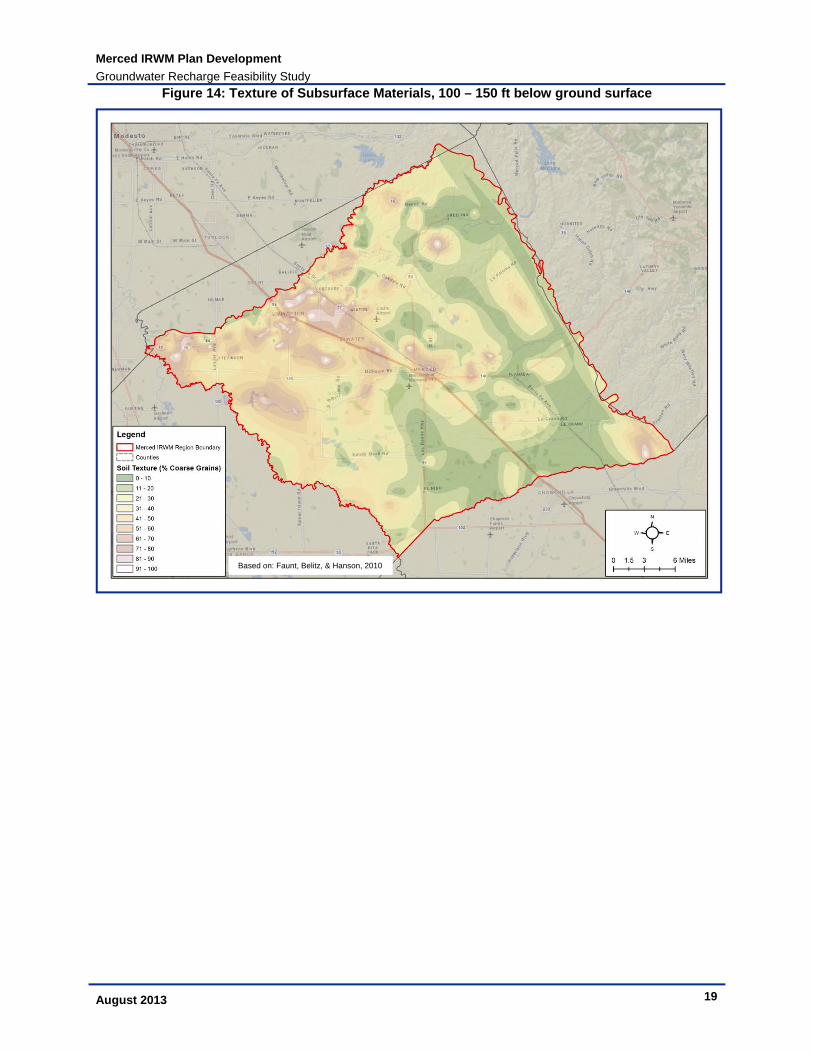
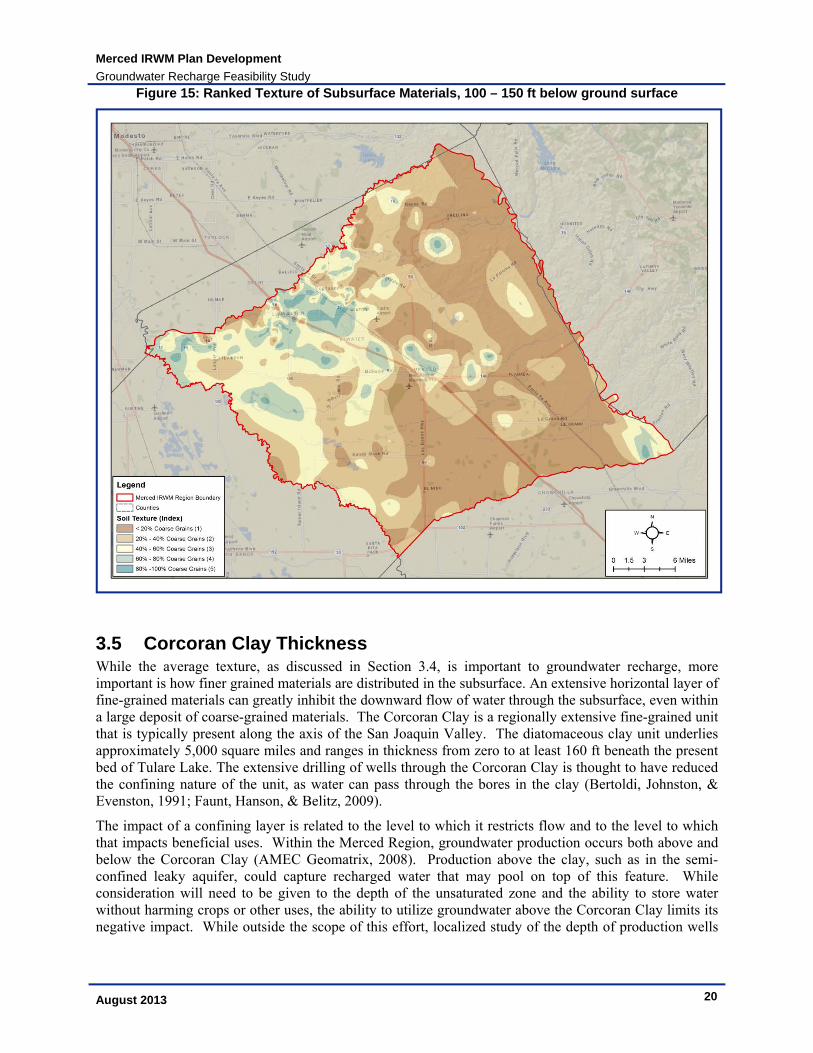
For this effort, the upper three intervals (0 – 50 ft, 50 – 100 ft, and 100 – 150 ft) of percent coarse were compiled for the Merced Region (see Figure 10, Figure 12, and Figure 14, respectively). The ranking for these intervals are shown in the following figures:
0 to 50 feet: Figure 11
50 to 100 feet: Figure 13
100 to 150 feet: Figure 15
Rankings are the same across all three categories.
Figure 10: Texture of Subsurface Materials, 0 – 50 ft below ground surface
Based on: Faunt, Belitz, & Hanson, 2010
Merced IRWM Plan Development
Groundwater Recharge Feasibility Study
August 2013 16
Figure 11: Ranked Texture of Subsurface Materials, 0 – 50 ft below ground surface
Merced IRWM Plan Development
Groundwater Recharge Feasibility Study
August 2013 17
Figure 12: Texture of Subsurface Materials, 50 – 100 ft below ground surface
Based on: Faunt, Belitz, & Hanson, 2010
Merced IRWM Plan Development
Groundwater Recharge Feasibility Study
August 2013 18
Figure 13: Ranked Texture of Subsurface Materials, 50 – 100 ft below ground surface
Merced IRWM Plan Development
Groundwater Recharge Feasibility Study
August 2013 19
Figure 14: Texture of Subsurface Materials, 100 – 150 ft below ground surface
Based on: Faunt, Belitz, & Hanson, 2010
Merced IRWM Plan Development
Groundwater Recharge Feasibility Study
August 2013 20
Figure 15: Ranked Texture of Subsurface Materials, 100 – 150 ft below ground surface
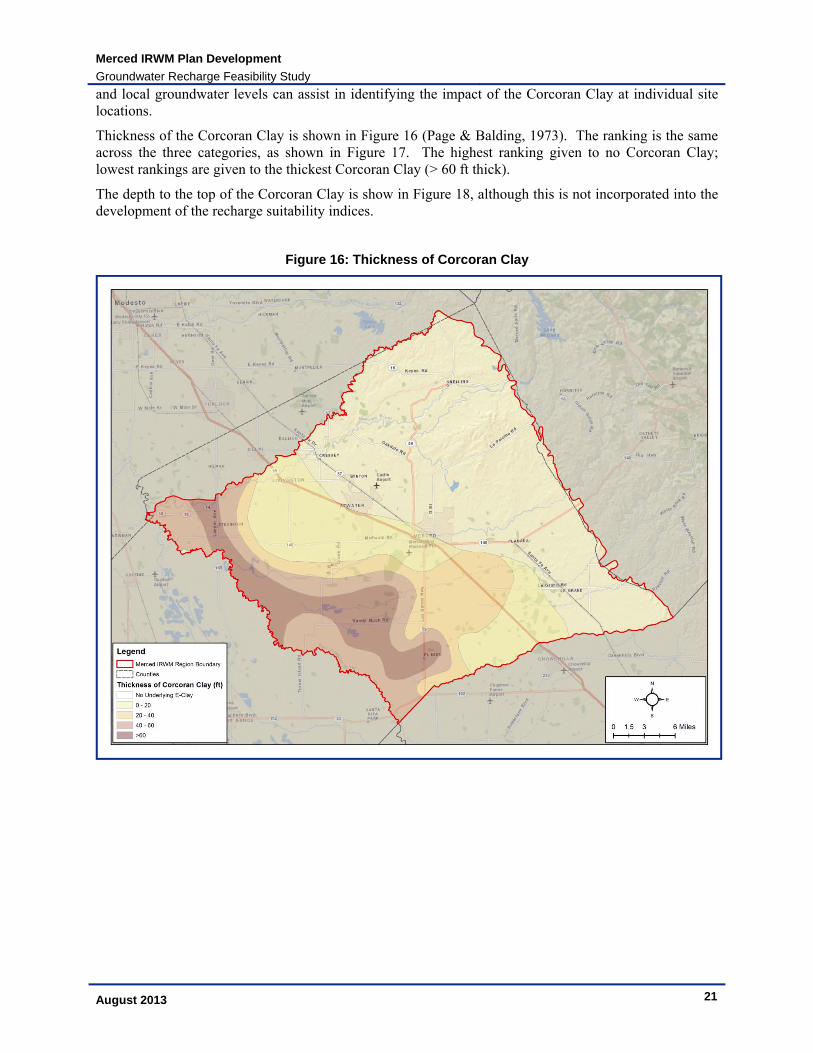
3.5 Corcoran Clay Thickness While the average texture, as discussed in Section 3.4, is important to groundwater recharge, more important is how finer grained materials are distributed in the subsurface. An extensive horizontal layer of fine-grained materials can greatly inhibit the downward flow of water through the subsurface, even within a large deposit of coarse-grained materials. The Corcoran Clay is a regionally extensive fine-grained unit that is typically present along the axis of the San Joaquin Valley. The diatomaceous clay unit underlies approximately 5,000 square miles and ranges in thickness from zero to at least 160 ft beneath the present bed of Tulare Lake. The extensive drilling of wells through the Corcoran Clay is thought to have reduced the confining nature of the unit, as water can pass through the bores in the clay (Bertoldi, Johnston, & Evenston, 1991; Faunt, Hanson, & Belitz, 2009).
The impact of a confining layer is related to the level to which it restricts flow and to the level to which that impacts beneficial uses. Within the Merced Region, groundwater production occurs both above and below the Corcoran Clay (AMEC Geomatrix, 2008). Production above the clay, such as in the semi-confined leaky aquifer, could capture recharged water that may pool on top of this feature. While consideration will need to be given to the depth of the unsaturated zone and the ability to store water without harming crops or other uses, the ability to utilize groundwater above the Corcoran Clay limits its negative impact. While outside the scope of this effort, localized study of the depth of production wells
Merced IRWM Plan Development
Groundwater Recharge Feasibility Study
August 2013 21
and local groundwater levels can assist in identifying the impact of the Corcoran Clay at individual site locations.
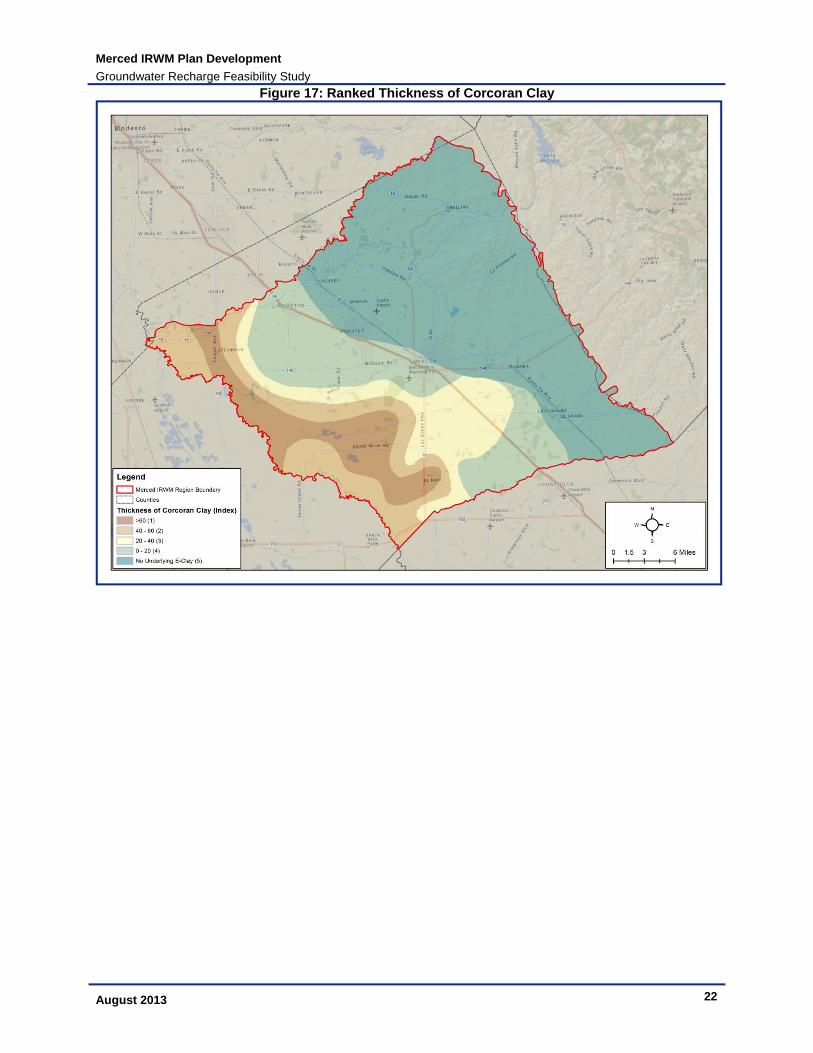
Thickness of the Corcoran Clay is shown in Figure 16 (Page & Balding, 1973). The ranking is the same across the three categories, as shown in Figure 17. The highest ranking given to no Corcoran Clay; lowest rankings are given to the thickest Corcoran Clay (> 60 ft thick).
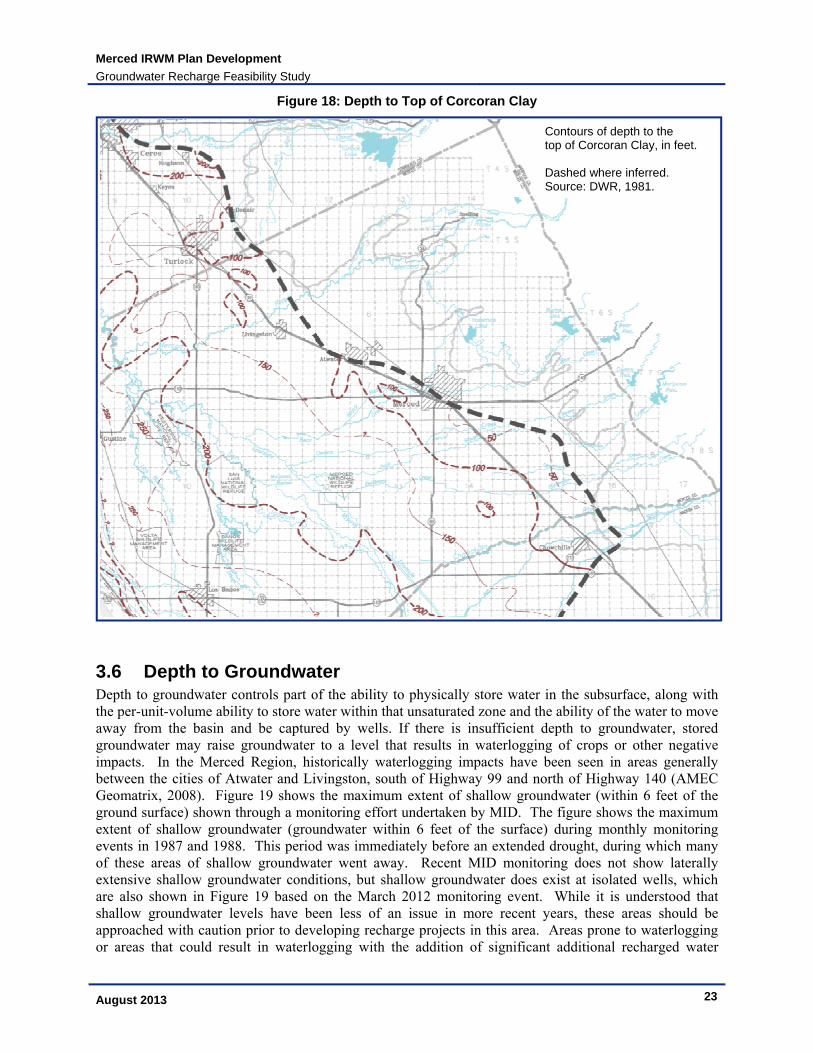
The depth to the top of the Corcoran Clay is show in Figure 18, although this is not incorporated into the development of the recharge suitability indices.
Figure 16: Thickness of Corcoran Clay
Merced IRWM Plan Development
Groundwater Recharge Feasibility Study
August 2013 22
Figure 17: Ranked Thickness of Corcoran Clay
Merced IRWM Plan Development
Groundwater Recharge Feasibility Study
August 2013 23
Figure 18: Depth to Top of Corcoran Clay
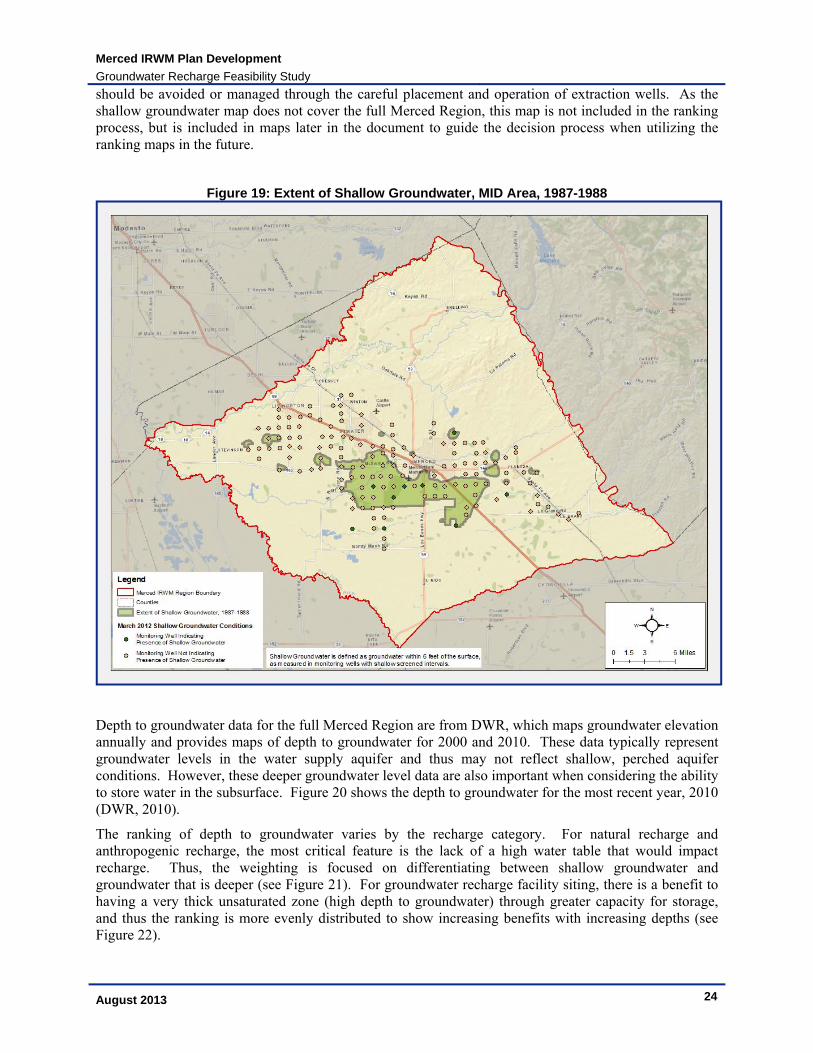
3.6 Depth to Groundwater Depth to groundwater controls part of the ability to physically store water in the subsurface, along with the per-unit-volume ability to store water within that unsaturated zone and the ability of the water to move away from the basin and be captured by wells. If there is insufficient depth to groundwater, stored groundwater may raise groundwater to a level that results in waterlogging of crops or other negative impacts. In the Merced Region, historically waterlogging impacts have been seen in areas generally between the cities of Atwater and Livingston, south of Highway 99 and north of Highway 140 (AMEC Geomatrix, 2008). Figure 19 shows the maximum extent of shallow groundwater (within 6 feet of the ground surface) shown through a monitoring effort undertaken by MID. The figure shows the maximum extent of shallow groundwater (groundwater within 6 feet of the surface) during monthly monitoring events in 1987 and 1988. This period was immediately before an extended drought, during which many of these areas of shallow groundwater went away. Recent MID monitoring does not show laterally extensive shallow groundwater conditions, but shallow groundwater does exist at isolated wells, which are also shown in Figure 19 based on the March 2012 monitoring event. While it is understood that shallow groundwater levels have been less of an issue in more recent years, these areas should be approached with caution prior to developing recharge projects in this area. Areas prone to waterlogging or areas that could result in waterlogging with the addition of significant additional recharged water
Contours of depth to the top of Corcoran Clay, in feet. Dashed where inferred. Source: DWR, 1981.
Merced IRWM Plan Development
Groundwater Recharge Feasibility Study
August 2013 24
should be avoided or managed through the careful placement and operation of extraction wells. As the shallow groundwater map does not cover the full Merced Region, this map is not included in the ranking process, but is included in maps later in the document to guide the decision process when utilizing the ranking maps in the future.
Figure 19: Extent of Shallow Groundwater, MID Area, 1987-1988
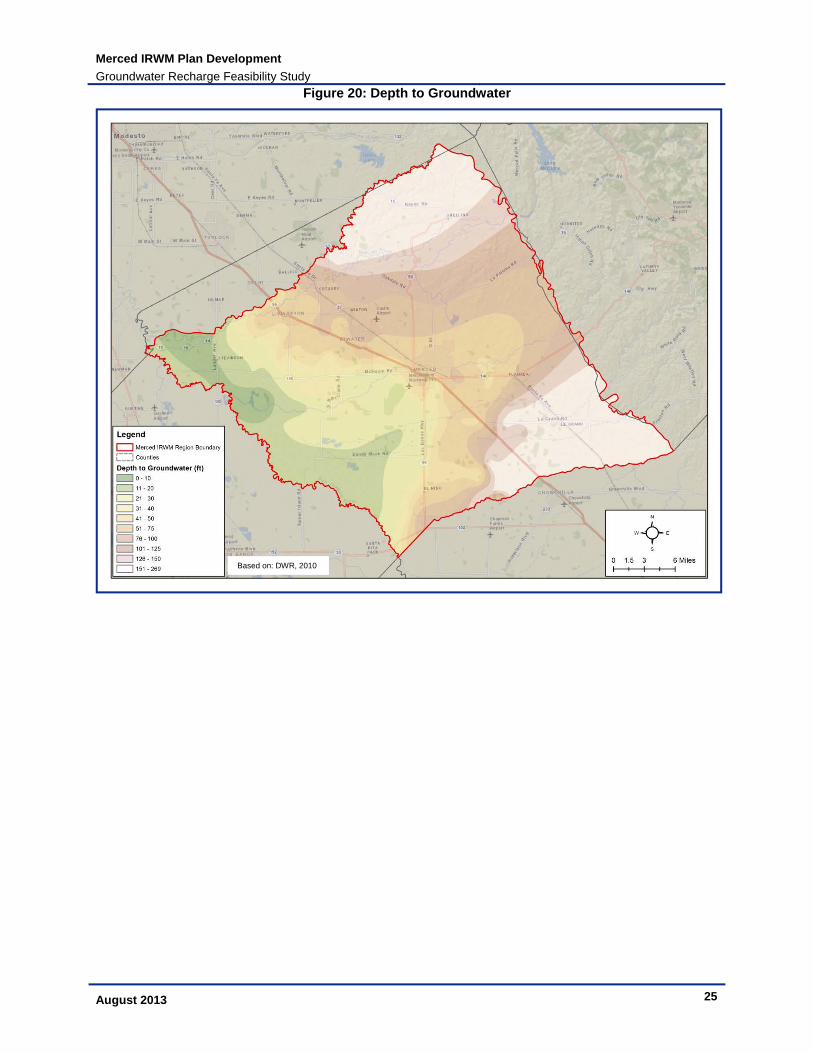
Depth to groundwater data for the full Merced Region are from DWR, which maps groundwater elevation annually and provides maps of depth to groundwater for 2000 and 2010. These data typically represent groundwater levels in the water supply aquifer and thus may not reflect shallow, perched aquifer conditions. However, these deeper groundwater level data are also important when considering the ability to store water in the subsurface. Figure 20 shows the depth to groundwater for the most recent year, 2010 (DWR, 2010).
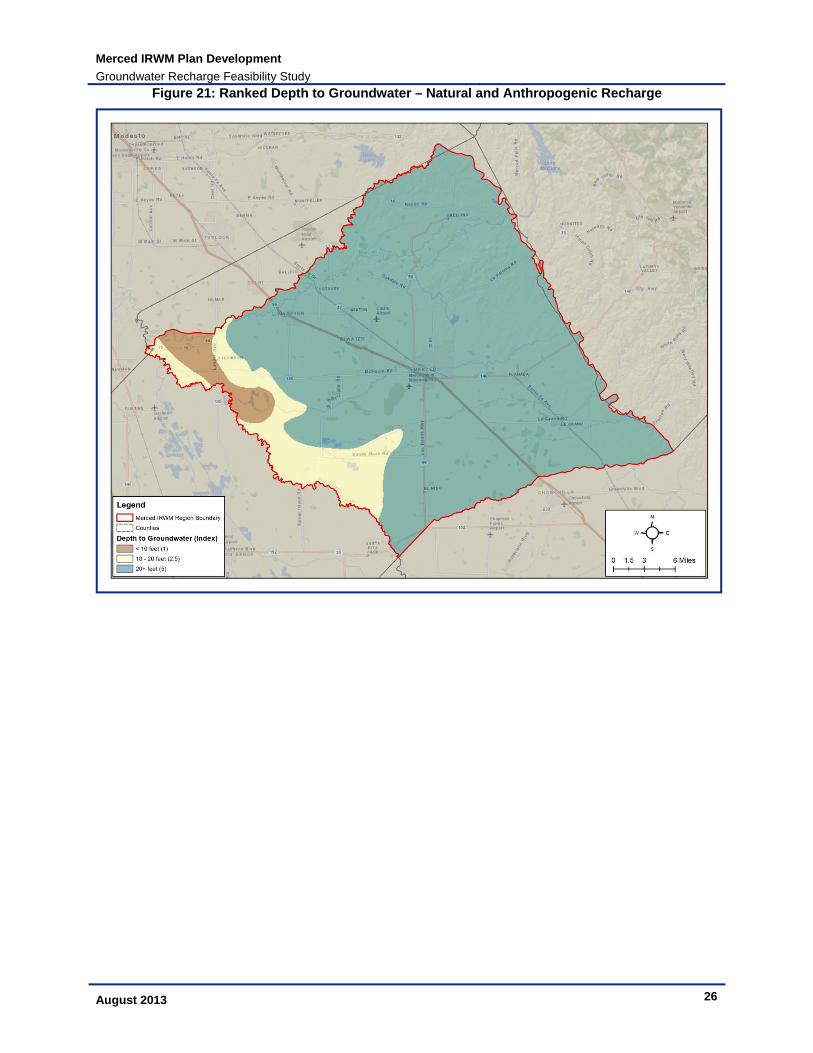
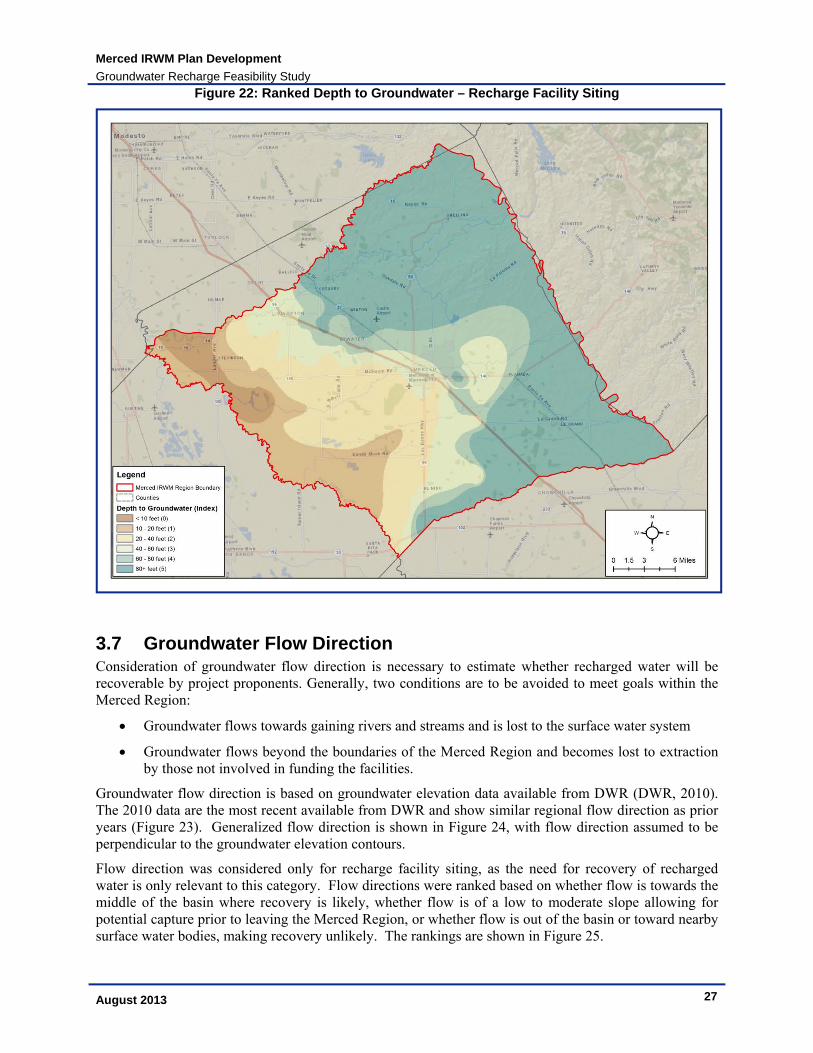
The ranking of depth to groundwater varies by the recharge category. For natural recharge and anthropogenic recharge, the most critical feature is the lack of a high water table that would impact recharge. Thus, the weighting is focused on differentiating between shallow groundwater and groundwater that is deeper (see Figure 21). For groundwater recharge facility siting, there is a benefit to having a very thick unsaturated zone (high depth to groundwater) through greater capacity for storage, and thus the ranking is more evenly distributed to show increasing benefits with increasing depths (see Figure 22).
Merced IRWM Plan Development
Groundwater Recharge Feasibility Study
August 2013 25
Figure 20: Depth to Groundwater
Based on: DWR, 2010
Merced IRWM Plan Development
Groundwater Recharge Feasibility Study
August 2013 26
Figure 21: Ranked Depth to Groundwater – Natural and Anthropogenic Recharge
Merced IRWM Plan Development
Groundwater Recharge Feasibility Study
August 2013 27
Figure 22: Ranked Depth to Groundwater – Recharge Facility Siting
3.7 Groundwater Flow Direction Consideration of groundwater flow direction is necessary to estimate whether recharged water will be recoverable by project proponents. Generally, two conditions are to be avoided to meet goals within the Merced Region:
Groundwater flows towards gaining rivers and streams and is lost to the surface water system
Groundwater flows beyond the boundaries of the Merced Region and becomes lost to extraction by those not involved in funding the facilities.
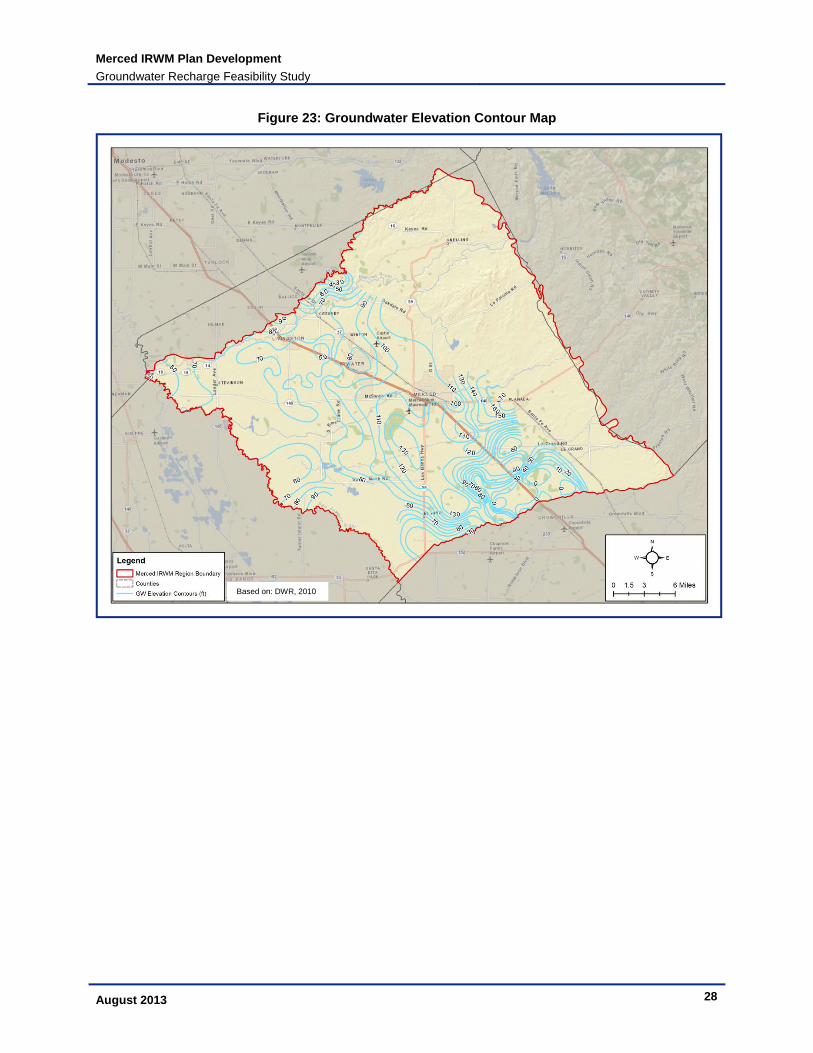
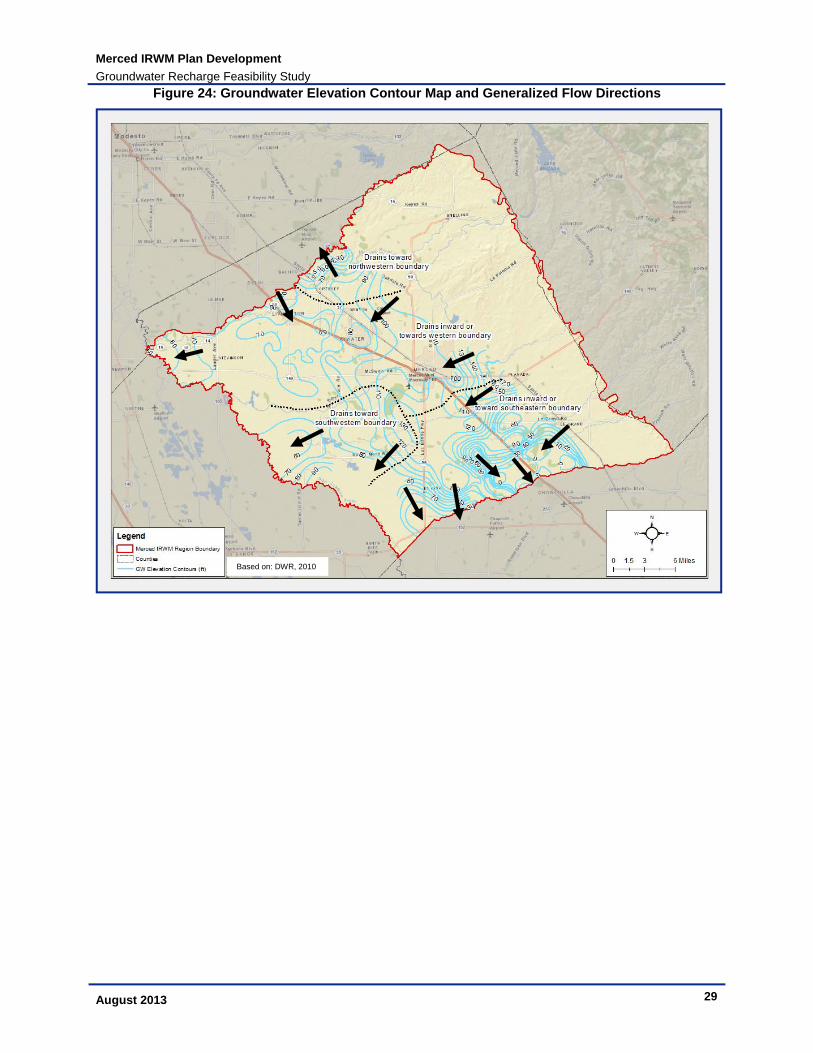
Groundwater flow direction is based on groundwater elevation data available from DWR (DWR, 2010). The 2010 data are the most recent available from DWR and show similar regional flow direction as prior years (Figure 23). Generalized flow direction is shown in Figure 24, with flow direction assumed to be perpendicular to the groundwater elevation contours.
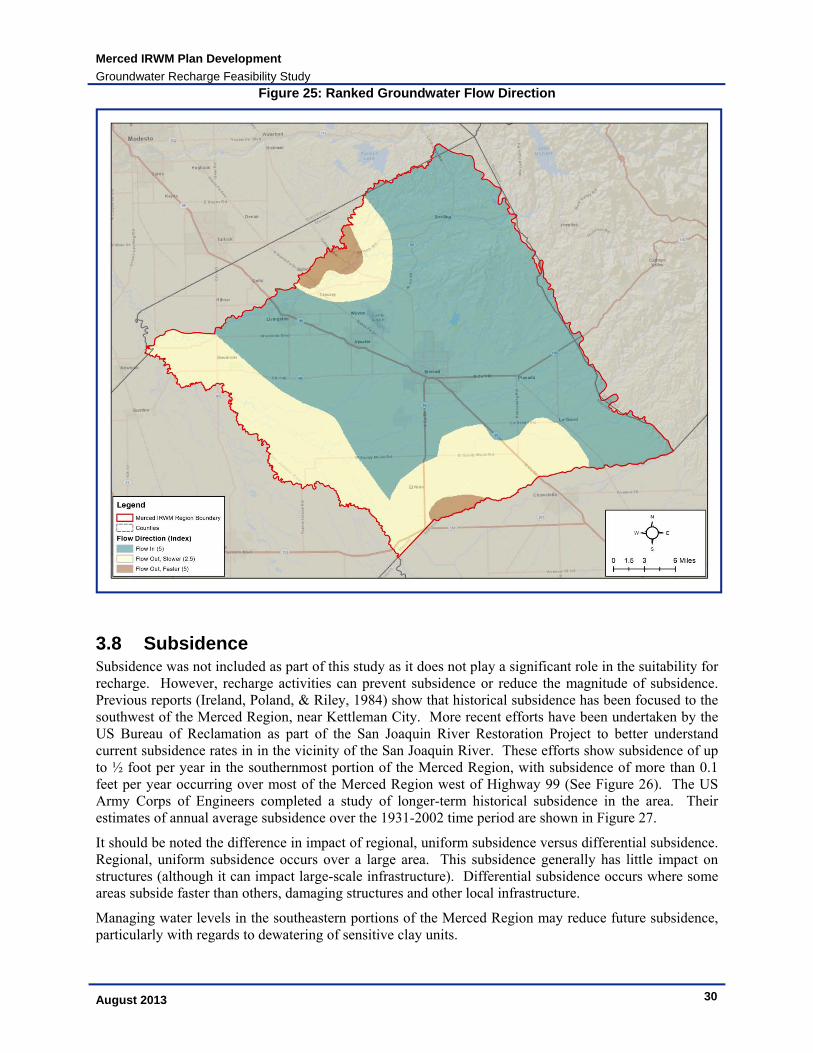
Flow direction was considered only for recharge facility siting, as the need for recovery of recharged water is only relevant to this category. Flow directions were ranked based on whether flow is towards the middle of the basin where recovery is likely, whether flow is of a low to moderate slope allowing for potential capture prior to leaving the Merced Region, or whether flow is out of the basin or toward nearby surface water bodies, making recovery unlikely. The rankings are shown in Figure 25.
Merced IRWM Plan Development
Groundwater Recharge Feasibility Study
August 2013 28
Figure 23: Groundwater Elevation Contour Map
Based on: DWR, 2010
Merced IRWM Plan Development
Groundwater Recharge Feasibility Study
August 2013 29
Figure 24: Groundwater Elevation Contour Map and Generalized Flow Directions
Based on: DWR, 2010
Merced IRWM Plan Development
Groundwater Recharge Feasibility Study
August 2013 30
Figure 25: Ranked Groundwater Flow Direction
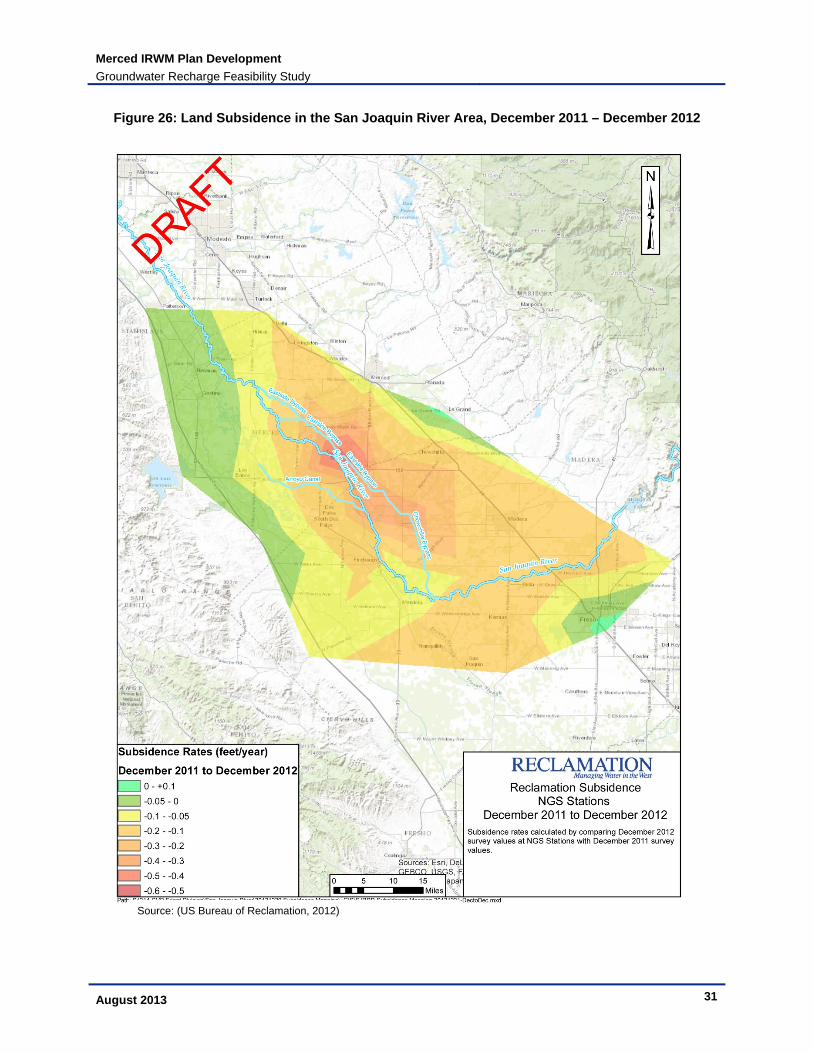
3.8 Subsidence Subsidence was not included as part of this study as it does not play a significant role in the suitability for recharge. However, recharge activities can prevent subsidence or reduce the magnitude of subsidence. Previous reports (Ireland, Poland, & Riley, 1984) show that historical subsidence has been focused to the southwest of the Merced Region, near Kettleman City. More recent efforts have been undertaken by the US Bureau of Reclamation as part of the San Joaquin River Restoration Project to better understand current subsidence rates in in the vicinity of the San Joaquin River. These efforts show subsidence of up to ½ foot per year in the southernmost portion of the Merced Region, with subsidence of more than 0.1 feet per year occurring over most of the Merced Region west of Highway 99 (See Figure 26). The US Army Corps of Engineers completed a study of longer-term historical subsidence in the area. Their estimates of annual average subsidence over the 1931-2002 time period are shown in Figure 27.
It should be noted the difference in impact of regional, uniform subsidence versus differential subsidence. Regional, uniform subsidence occurs over a large area. This subsidence generally has little impact on structures (although it can impact large-scale infrastructure). Differential subsidence occurs where some areas subside faster than others, damaging structures and other local infrastructure.
Managing water levels in the southeastern portions of the Merced Region may reduce future subsidence, particularly with regards to dewatering of sensitive clay units.
Merced IRWM Plan Development
Groundwater Recharge Feasibility Study
August 2013 31
Figure 26: Land Subsidence in the San Joaquin River Area, December 2011 – December 2012
Source: (US Bureau of Reclamation, 2012)

Merced IRWM Plan Development
Groundwater Recharge Feasibility Study
August 2013 32
Figure 27: Average Annual Land Subsidence in the San Joaquin River Area, 1931 – 2001
Source: (US Bureau of Reclamation, 2012)
Merced IRWM Plan Development
Groundwater Recharge Feasibility Study
August 2013 33
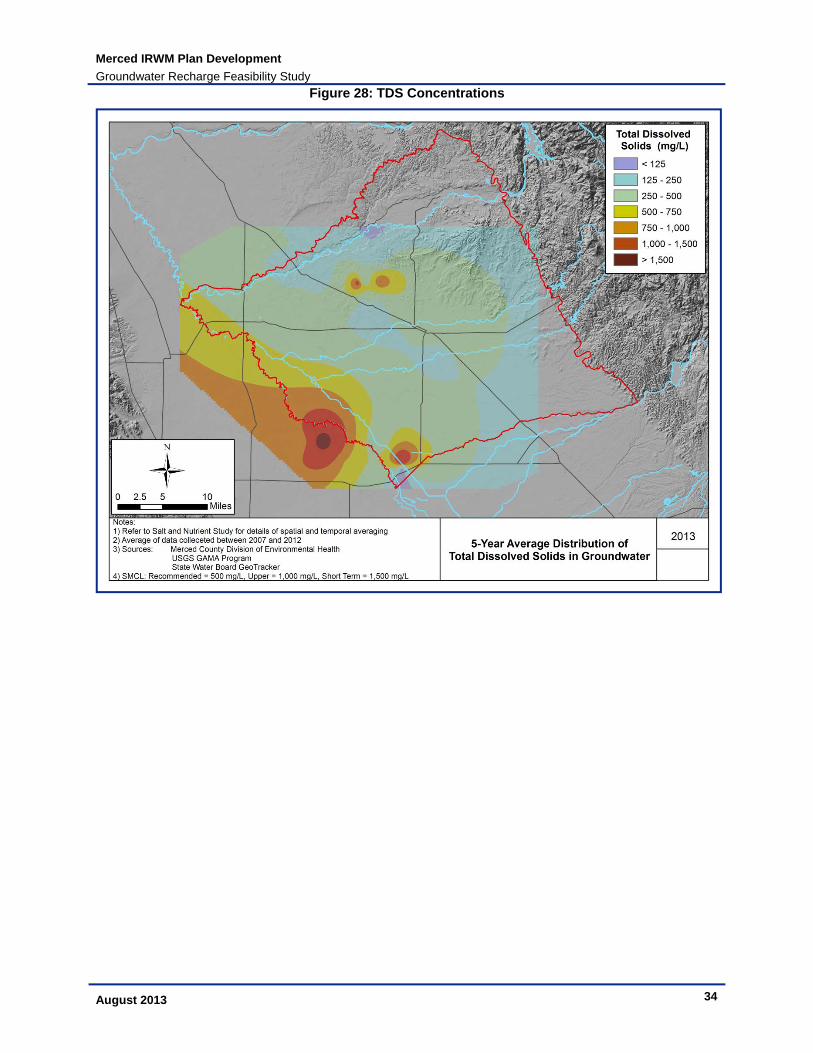
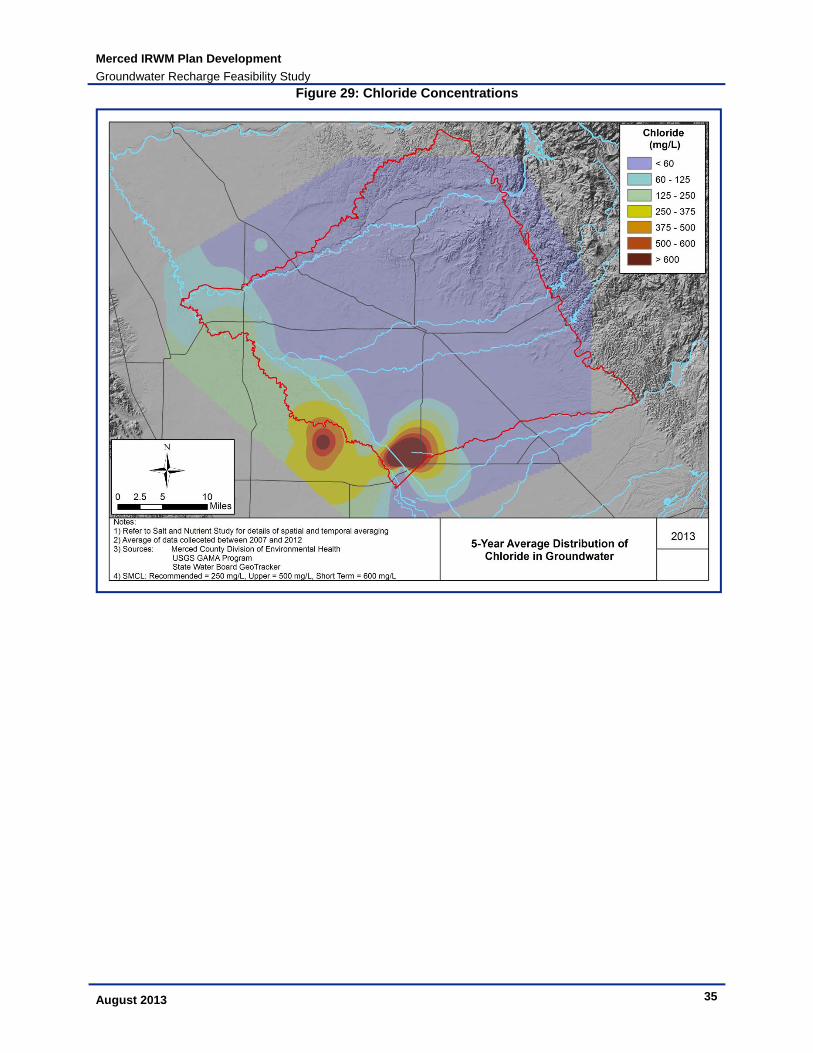
3.9 Groundwater Quality Groundwater quality was not included in the ranking analysis as water quality is highly variable and regional water quality data is typically insufficient for understanding the local conditions around a recharge basin. In general, groundwater quality in the Merced Region is good. Maps of regional groundwater conditions based on averaged data from the past 5 years are shown for the primary regional (i.e., non-point source) contaminants in the basin, based on information in the Salt and Nutrient Study (AMEC and RMC, 2013). Note that, to protect the privacy of groundwater supply well owners, the data were composited by Township and Range or by assessor’s parcel number, thus the results are averaged across space and time and should be used for regional perspective rather than to identify concentrations at any individual location.
TDS (Figure 28). Values can be compared to the secondary maximum contamination level (SMCL)
o 500 mg/l (recommended)
o 1,000 mg/l (upper) and
o 1,500 mg/l (short term)
Chloride (Figure 29). Values can be compared to the SMCL
o 250 mg/l (recommended)
o 500 mg/l (upper) and
o 600 mg/l (short term)
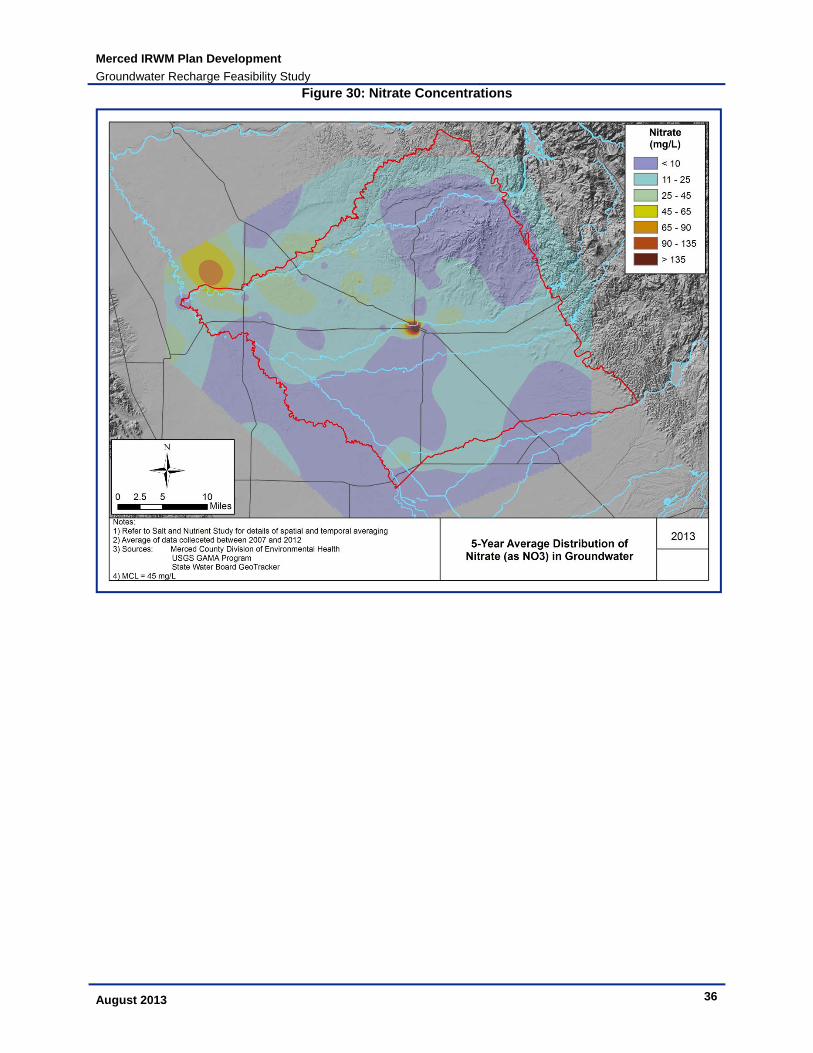
Nitrate (Figure 30). Values can be compared to the maximum contamination level (MCL), 45 mg/l (as nitrate)
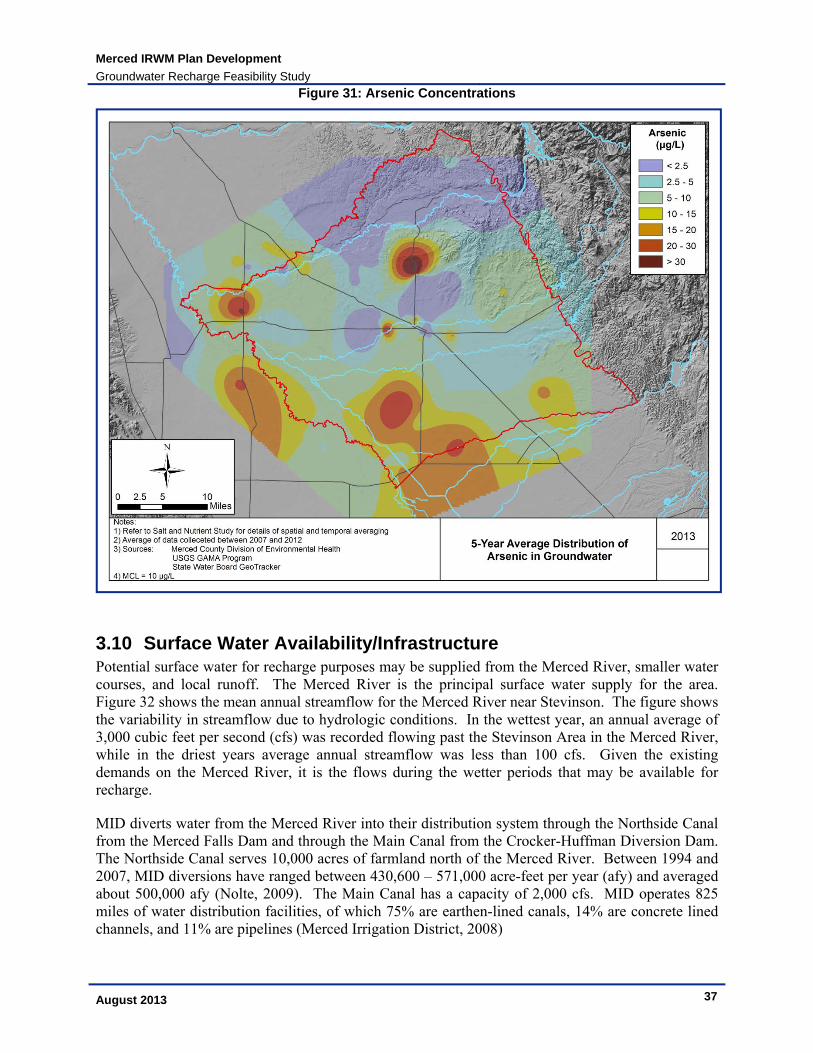
Arsenic (Figure 31). Values can be compared to the MCL, 10 ug/l
Individual contaminated sites can also impact the drinking water aquifer. The water quality data should be taken into consideration when siting recharge facilities, but localized studies will be necessary to obtain the proper level of detail spatially and with depth.
Merced IRWM Plan Development
Groundwater Recharge Feasibility Study
August 2013 34
Figure 28: TDS Concentrations
Merced IRWM Plan Development
Groundwater Recharge Feasibility Study
August 2013 35
Figure 29: Chloride Concentrations
Merced IRWM Plan Development
Groundwater Recharge Feasibility Study
August 2013 36
Figure 30: Nitrate Concentrations
Merced IRWM Plan Development
Groundwater Recharge Feasibility Study
August 2013 37
Figure 31: Arsenic Concentrations
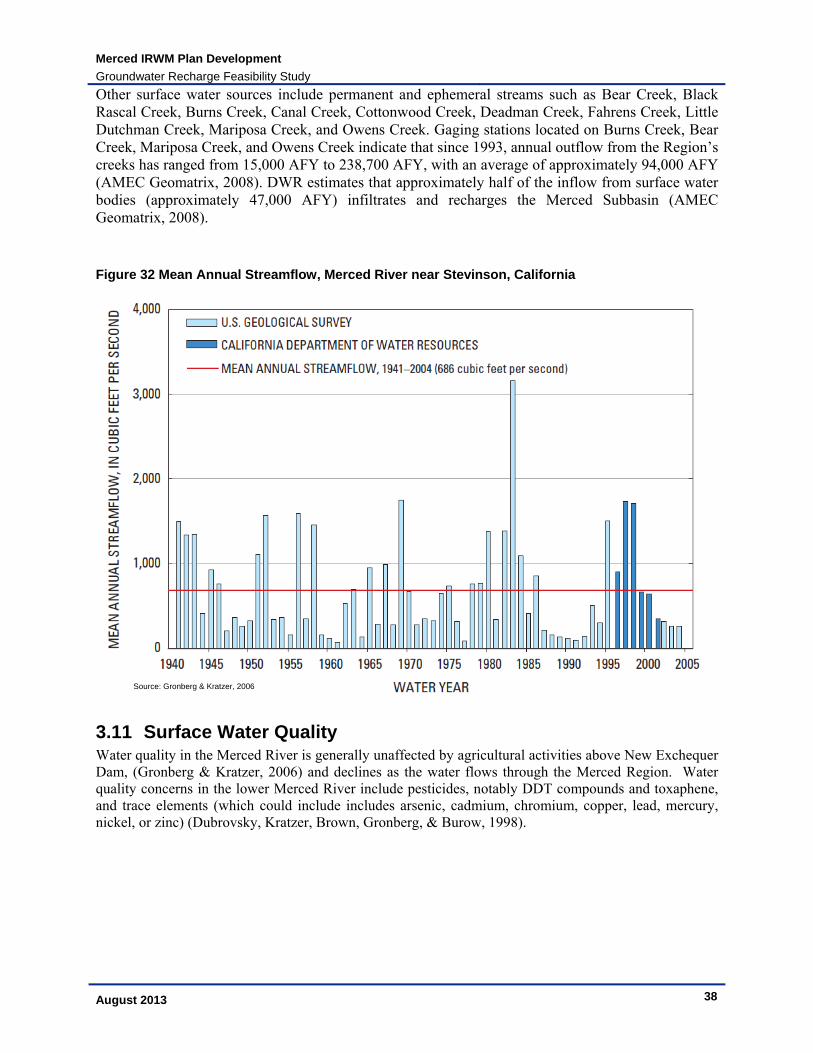
3.10 Surface Water Availability/Infrastructure Potential surface water for recharge purposes may be supplied from the Merced River, smaller water courses, and local runoff. The Merced River is the principal surface water supply for the area. Figure 32 shows the mean annual streamflow for the Merced River near Stevinson. The figure shows the variability in streamflow due to hydrologic conditions. In the wettest year, an annual average of 3,000 cubic feet per second (cfs) was recorded flowing past the Stevinson Area in the Merced River, while in the driest years average annual streamflow was less than 100 cfs. Given the existing demands on the Merced River, it is the flows during the wetter periods that may be available for recharge.
MID diverts water from the Merced River into their distribution system through the Northside Canal from the Merced Falls Dam and through the Main Canal from the Crocker-Huffman Diversion Dam. The Northside Canal serves 10,000 acres of farmland north of the Merced River. Between 1994 and 2007, MID diversions have ranged between 430,600 – 571,000 acre-feet per year (afy) and averaged about 500,000 afy (Nolte, 2009). The Main Canal has a capacity of 2,000 cfs. MID operates 825 miles of water distribution facilities, of which 75% are earthen-lined canals, 14% are concrete lined channels, and 11% are pipelines (Merced Irrigation District, 2008)
Merced IRWM Plan Development
Groundwater Recharge Feasibility Study
August 2013 38
Other surface water sources include permanent and ephemeral streams such as Bear Creek, Black Rascal Creek, Burns Creek, Canal Creek, Cottonwood Creek, Deadman Creek, Fahrens Creek, Little Dutchman Creek, Mariposa Creek, and Owens Creek. Gaging stations located on Burns Creek, Bear Creek, Mariposa Creek, and Owens Creek indicate that since 1993, annual outflow from the Region’s creeks has ranged from 15,000 AFY to 238,700 AFY, with an average of approximately 94,000 AFY (AMEC Geomatrix, 2008). DWR estimates that approximately half of the inflow from surface water bodies (approximately 47,000 AFY) infiltrates and recharges the Merced Subbasin (AMEC Geomatrix, 2008).
Figure 32 Mean Annual Streamflow, Merced River near Stevinson, California
3.11 Surface Water Quality Water quality in the Merced River is generally unaffected by agricultural activities above New Exchequer Dam, (Gronberg & Kratzer, 2006) and declines as the water flows through the Merced Region. Water quality concerns in the lower Merced River include pesticides, notably DDT compounds and toxaphene, and trace elements (which could include includes arsenic, cadmium, chromium, copper, lead, mercury, nickel, or zinc) (Dubrovsky, Kratzer, Brown, Gronberg, & Burow, 1998).
Source: Gronberg & Kratzer, 2006
Merced IRWM Plan Development
Groundwater Recharge Feasibility Study
August 2013 39
3.12 Recharge Suitability Indices A Geographic Information System (GIS) overlay method is used to analyze available spatial data and integrate the information to interpret physical conditions and produce index maps. The process involves multiple steps which include:
Obtaining or creating GIS datasets that influence groundwater recharge;
Applying ranking criteria and weights to each dataset;
Overlaying and analyzing the data layers and conducting calculations to aggregate data to produce index maps showing preferred areas for groundwater recharge.
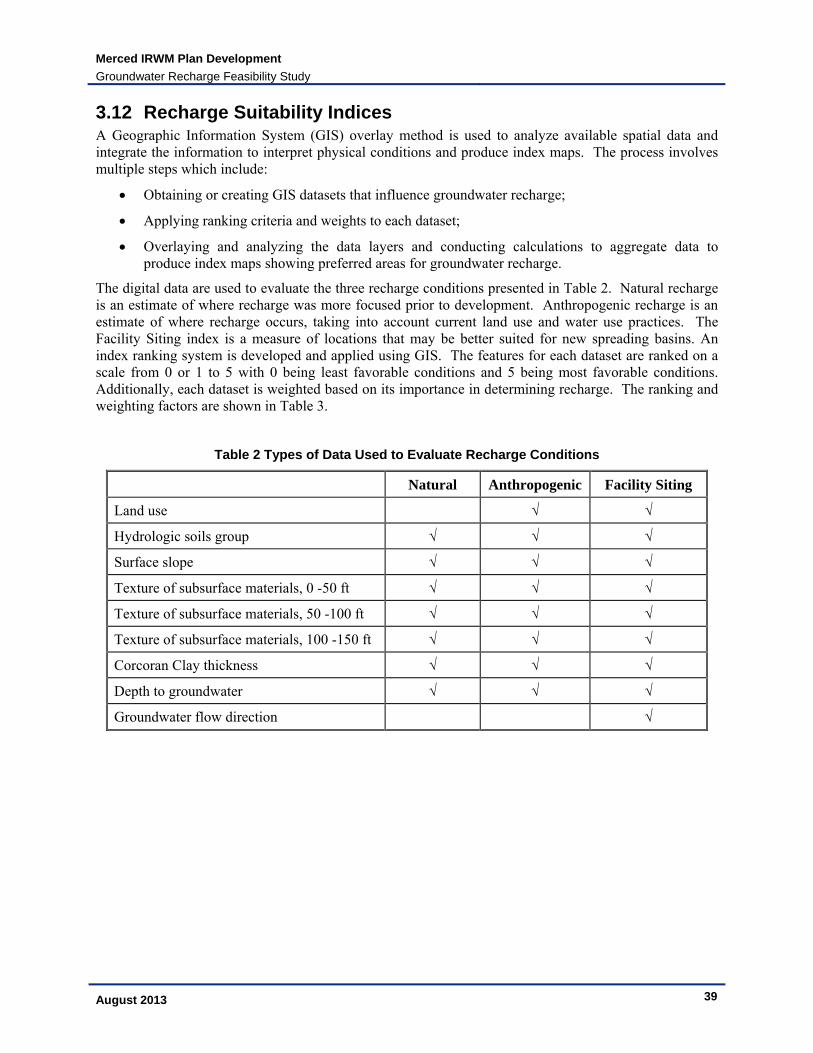
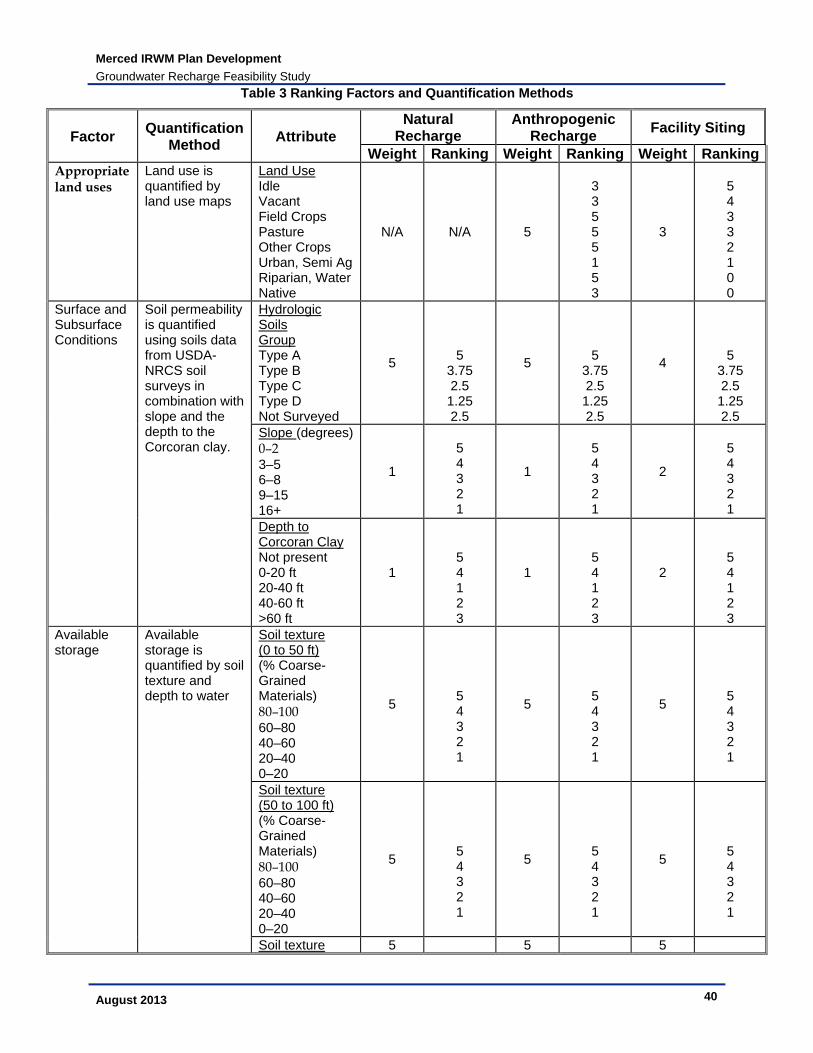
The digital data are used to evaluate the three recharge conditions presented in Table 2. Natural recharge is an estimate of where recharge was more focused prior to development. Anthropogenic recharge is an estimate of where recharge occurs, taking into account current land use and water use practices. The Facility Siting index is a measure of locations that may be better suited for new spreading basins. An index ranking system is developed and applied using GIS. The features for each dataset are ranked on a scale from 0 or 1 to 5 with 0 being least favorable conditions and 5 being most favorable conditions. Additionally, each dataset is weighted based on its importance in determining recharge. The ranking and weighting factors are shown in Table 3.
Table 2 Types of Data Used to Evaluate Recharge Conditions
Natural Anthropogenic Facility Siting
Land use √ √
Hydrologic soils group √ √ √
Surface slope √ √ √
Texture of subsurface materials, 0 -50 ft √ √ √
Texture of subsurface materials, 50 -100 ft √ √ √
Texture of subsurface materials, 100 -150 ft √ √ √
Corcoran Clay thickness √ √ √
Depth to groundwater √ √ √
Groundwater flow direction √
Merced IRWM Plan Development
Groundwater Recharge Feasibility Study
August 2013 40
Table 3 Ranking Factors and Quantification Methods
Factor Quantification
Method Attribute
Natural Recharge
Anthropogenic Recharge
Facility Siting
Weight Ranking Weight Ranking Weight RankingAppropriate land uses
Land use is quantified by land use maps
Land Use Idle Vacant Field Crops Pasture Other Crops Urban, Semi Ag Riparian, Water Native
N/A N/A 5
3 3 5 5 5 1 5 3
3
5 4 3 3 2 1 0 0
Surface and Subsurface Conditions
Soil permeability is quantified using soils data from USDA-NRCS soil surveys in combination with slope and the depth to the Corcoran clay.
Hydrologic Soils Group Type A Type B Type C Type D Not Surveyed
5
5
3.75 2.5 1.25 2.5
5
5
3.75 2.5 1.25 2.5
4
5
3.75 2.5 1.25 2.5
Slope (degrees)0–2 3–5 6–8 9–15 16+
1
5 4 3 2 1
1
5 4 3 2 1
2
5 4 3 2 1
Depth to Corcoran Clay Not present 0-20 ft 20-40 ft 40-60 ft >60 ft
1
5 4 1 2 3
1
5 4 1 2 3
2
5 4 1 2 3
Available storage
Available storage is quantified by soil texture and depth to water
Soil texture (0 to 50 ft) (% Coarse-Grained Materials) 80–100 60–80 40–60 20–40 0–20
5
5 4 3 2 1
5
5 4 3 2 1
5
5 4 3 2 1
Soil texture (50 to 100 ft) (% Coarse-Grained Materials) 80–100 60–80 40–60 20–40 0–20
5
5 4 3 2 1
5
5 4 3 2 1
5
5 4 3 2 1
Soil texture 5 5 5
Merced IRWM Plan Development
Groundwater Recharge Feasibility Study
August 2013 41
(100 to 150 ft) (% Coarse-Grained Materials) 80–100 60–80 40–60 20–40 0–20
5 4 3 2 1
5 4 3 2 1
5 4 3 2 1
Depth to Water (feet) >80 ft 60–80 ft 40–60 ft 20–40 ft 10–20 ft 0–10 ft
5
5 5 5 5
2.5 1
5
5 5 5 5
2.5 1
5
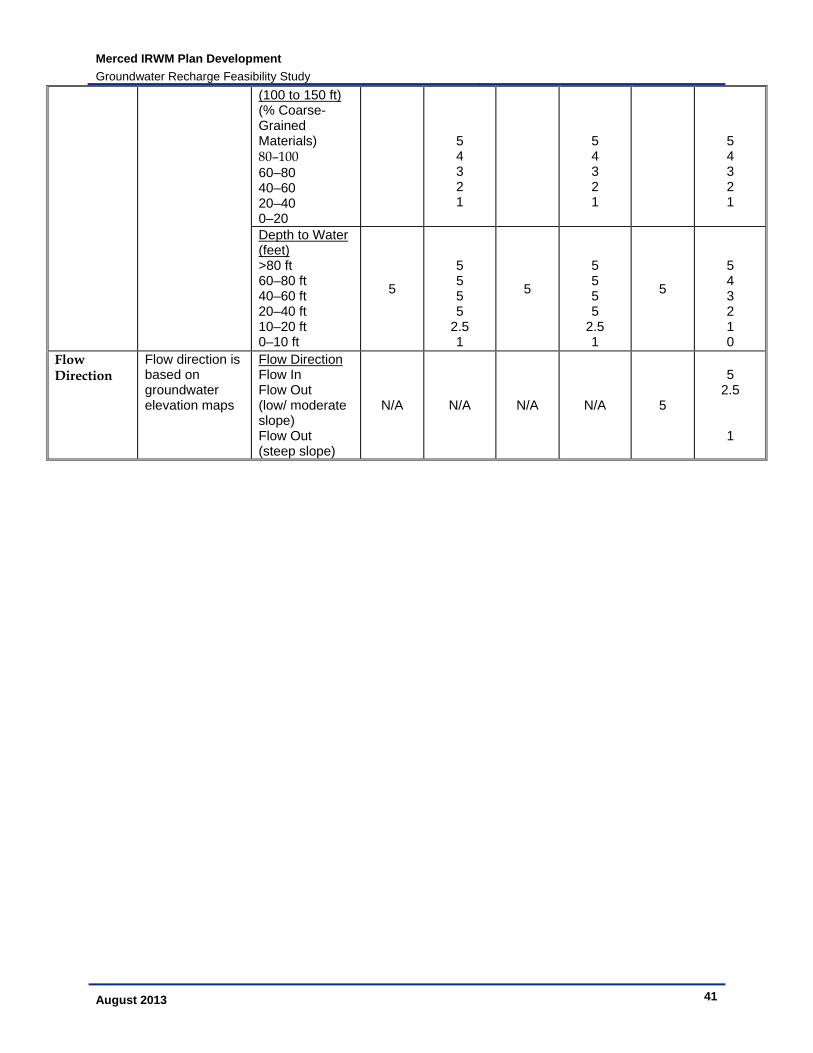
5 4 3 2 1 0
Flow Direction
Flow direction is based on groundwater elevation maps
Flow Direction Flow In Flow Out (low/ moderate slope) Flow Out (steep slope)
N/A N/A N/A N/A 5
5
2.5 1
Merced IRWM Plan Development
Groundwater Recharge Feasibility Study
August 2013 42
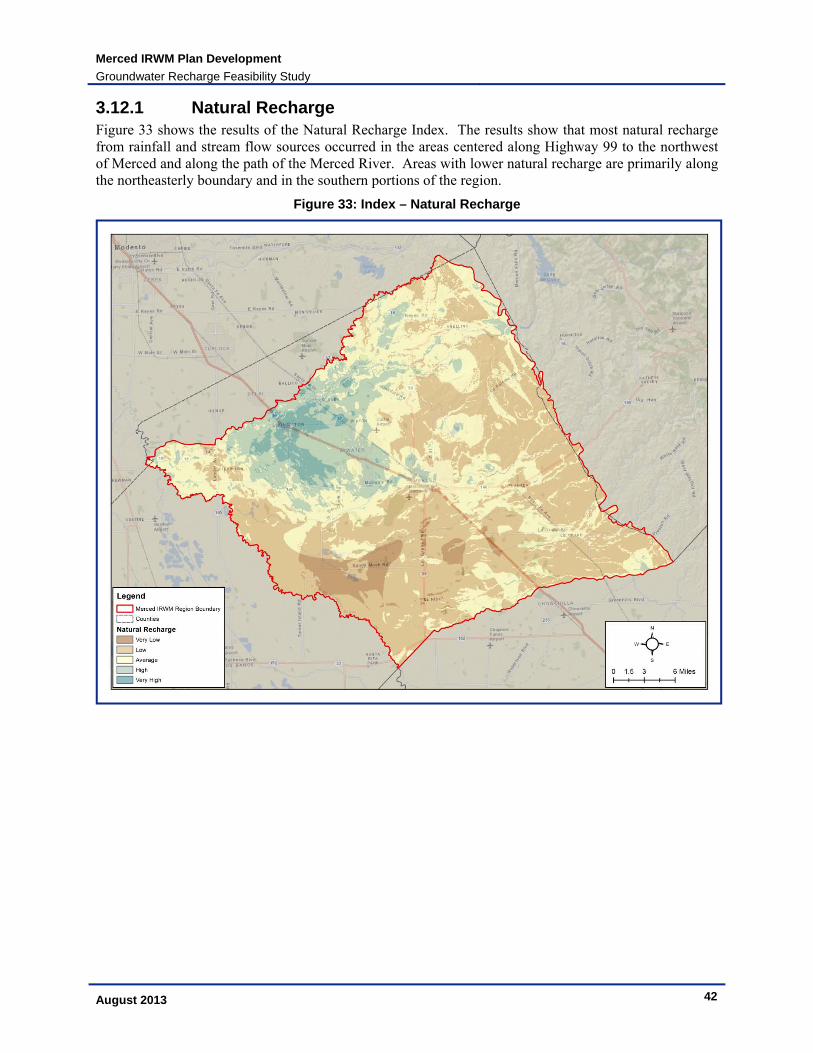
3.12.1 Natural Recharge Figure 33 shows the results of the Natural Recharge Index. The results show that most natural recharge from rainfall and stream flow sources occurred in the areas centered along Highway 99 to the northwest of Merced and along the path of the Merced River. Areas with lower natural recharge are primarily along the northeasterly boundary and in the southern portions of the region.
Figure 33: Index – Natural Recharge
Merced IRWM Plan Development
Groundwater Recharge Feasibility Study
August 2013 43
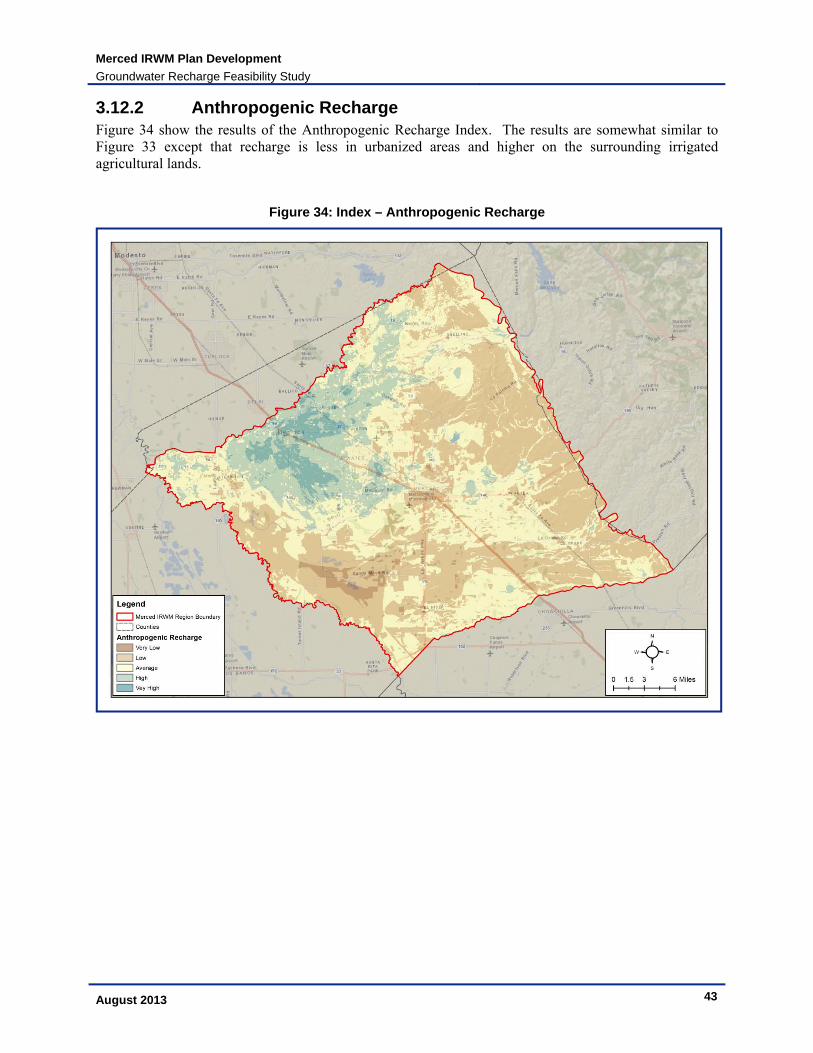
3.12.2 Anthropogenic Recharge Figure 34 show the results of the Anthropogenic Recharge Index. The results are somewhat similar to Figure 33 except that recharge is less in urbanized areas and higher on the surrounding irrigated agricultural lands.
Figure 34: Index – Anthropogenic Recharge
Merced IRWM Plan Development
Groundwater Recharge Feasibility Study
August 2013 44
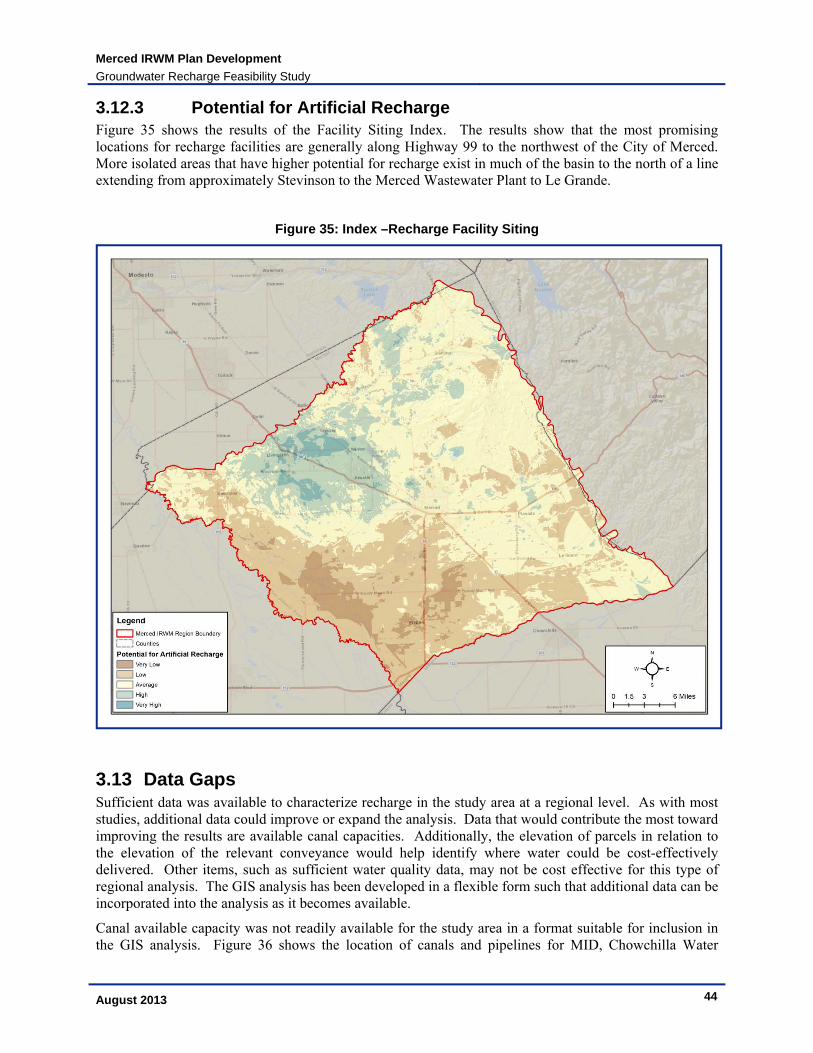
3.12.3 Potential for Artificial Recharge Figure 35 shows the results of the Facility Siting Index. The results show that the most promising locations for recharge facilities are generally along Highway 99 to the northwest of the City of Merced. More isolated areas that have higher potential for recharge exist in much of the basin to the north of a line extending from approximately Stevinson to the Merced Wastewater Plant to Le Grande.
Figure 35: Index –Recharge Facility Siting
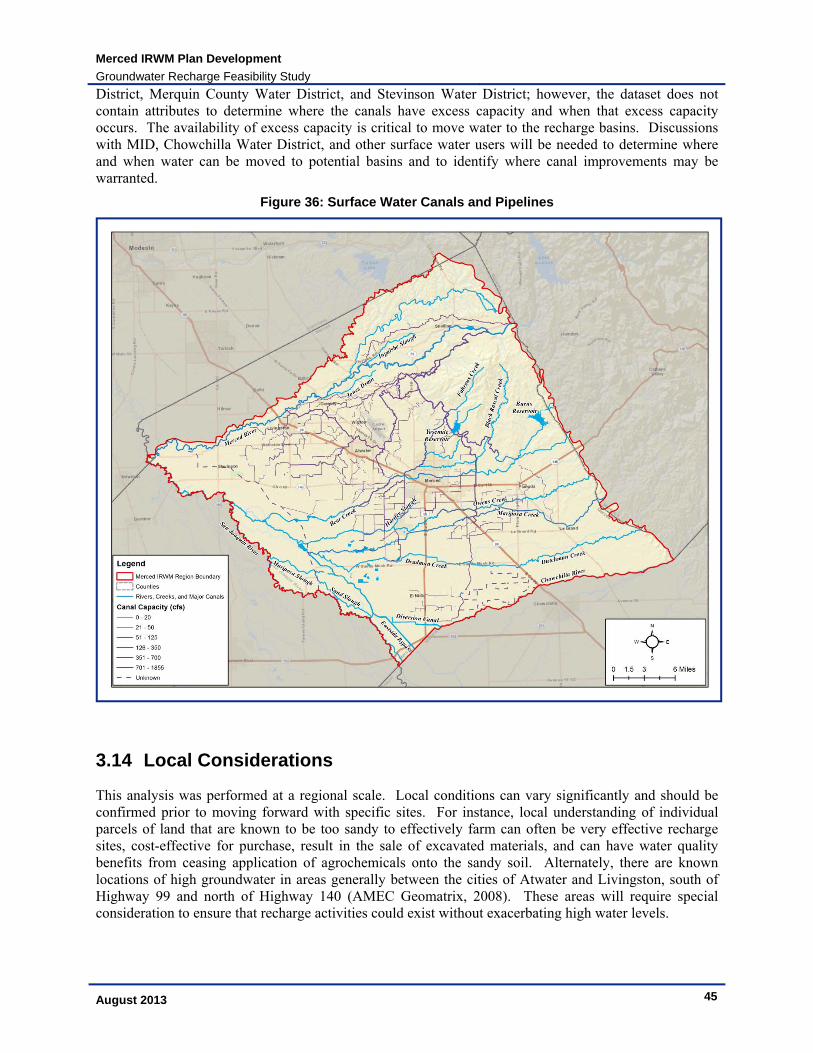
3.13 Data Gaps Sufficient data was available to characterize recharge in the study area at a regional level. As with most studies, additional data could improve or expand the analysis. Data that would contribute the most toward improving the results are available canal capacities. Additionally, the elevation of parcels in relation to the elevation of the relevant conveyance would help identify where water could be cost-effectively delivered. Other items, such as sufficient water quality data, may not be cost effective for this type of regional analysis. The GIS analysis has been developed in a flexible form such that additional data can be incorporated into the analysis as it becomes available.
Canal available capacity was not readily available for the study area in a format suitable for inclusion in the GIS analysis. Figure 36 shows the location of canals and pipelines for MID, Chowchilla Water
Merced IRWM Plan Development
Groundwater Recharge Feasibility Study
August 2013 45
District, Merquin County Water District, and Stevinson Water District; however, the dataset does not contain attributes to determine where the canals have excess capacity and when that excess capacity occurs. The availability of excess capacity is critical to move water to the recharge basins. Discussions with MID, Chowchilla Water District, and other surface water users will be needed to determine where and when water can be moved to potential basins and to identify where canal improvements may be warranted.
Figure 36: Surface Water Canals and Pipelines
3.14 Local Considerations
This analysis was performed at a regional scale. Local conditions can vary significantly and should be confirmed prior to moving forward with specific sites. For instance, local understanding of individual parcels of land that are known to be too sandy to effectively farm can often be very effective recharge sites, cost-effective for purchase, result in the sale of excavated materials, and can have water quality benefits from ceasing application of agrochemicals onto the sandy soil. Alternately, there are known locations of high groundwater in areas generally between the cities of Atwater and Livingston, south of Highway 99 and north of Highway 140 (AMEC Geomatrix, 2008). These areas will require special consideration to ensure that recharge activities could exist without exacerbating high water levels.
Merced IRWM Plan Development
Groundwater Recharge Feasibility Study
August 2013 46
Additionally, local conditions can vary considerably from what can be shown in a regional analysis. For this reason, local studies should be performed to determine the suitability of a site prior to design and construction. These local studies should include collection of information on lithology, groundwater levels, presence of perched aquifers, groundwater quality, surface water availability and quality, and other locally relevant issues.
3.15 Conclusions
Understanding recharge is important for effective management of groundwater. This analysis characterized recharge in three ways: natural, anthropogenic, and for purposes of locating recharge facilities.
The analysis method selected is relatively straightforward, transparent, and repeatable. The details of the analysis, the ranking and weighting of the datasets, should help improve the awareness of the Merced Region stakeholders of the importance of the recharge areas to the overall management and operation of the groundwater basin. This awareness is intended to facilitate further discussion regarding how to best manage the local resources.
The results from the analysis presented herein show the relative capability for recharge or suitability for recharge projects. Based on these results, the location of historical and current recharge areas, the impacts of current and future land use changes, and where to concentrate efforts at determining feasibility for development of recharge facilities can be better understood and put to use for future groundwater management activities. The results of this effort are also suitable for compliance with new groundwater management plan requirements of AB359, which, among other requirements, requires inclusion of a recharge map in groundwater management plans.
The results of the study indicate that the best recharge areas are focused in a relatively small portion of the basin, near Livingston and Atwater. Many of these areas are near the Merced River and more detailed analysis is warranted for potential projects to estimate the volume of recharged water that could be lost to the surface water system. While benefits may be accrued from direct recharge projects, in-lieu recharge should be used extensively to provide recharge benefits across the Merced Region. In-lieu projects do not require permeable materials above the aquifer for success and thus can be widely implemented across the region, where available surface water can be delivered to substitute for groundwater pumping.
Recommendations for future work include identifying potential sites through stakeholder coordination, performing site specific analyses and field work, identifying source water and water rights, and confirming conveyance capacity. In-lieu projects can be advanced through identification of additional water supplies, water delivery infrastructure, and/or water users.
4 Codes and Regulations There are numerous codes and regulations that are relevant to the development of an artificial recharge basin. The applicable codes and regulations and the related permits will vary depending on the specifics of the project. Table 4 provides a summary of relevant codes and regulations. Not all of these will be required for all projects, and additional needs may arise for other projects. Specifically, several of the items in Table 4 relate to alterations of streams, which will likely not be relevant to the majority of potential projects in the Merced Region.
The timing of the permits will depend on the permits required by the specific project. The initial step should be to define the project. The project description can then be used to determine the necessary permits. For example, many projects would not require a Section 404 Permit, Streambed Alteration Agreement, CVFPB Encroachment Permit, or a Mining Permit. However, a project may require additional unlisted permits. For example, a project recharging recycled water would require significantly more analysis and additional permits.
Merced IRWM Plan Development
Groundwater Recharge Feasibility Study
August 2013 47
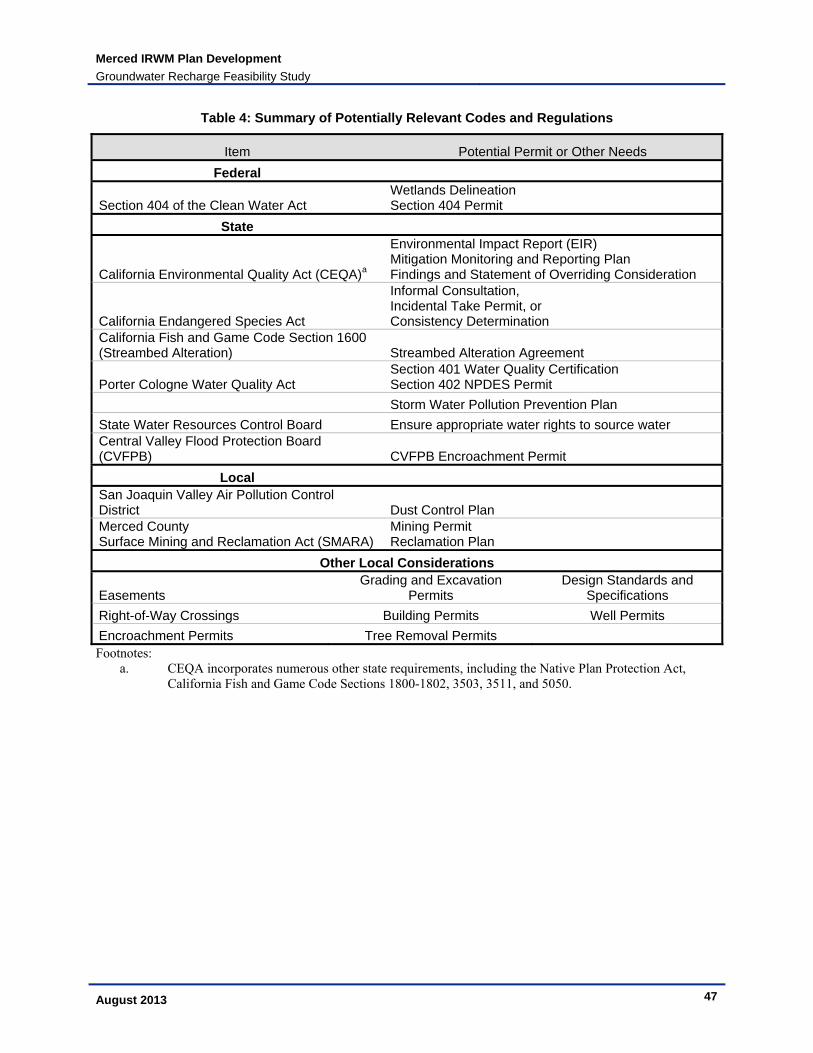
Table 4: Summary of Potentially Relevant Codes and Regulations
Item Potential Permit or Other Needs
Federal
Section 404 of the Clean Water Act Wetlands Delineation Section 404 Permit
State
California Environmental Quality Act (CEQA)a
Environmental Impact Report (EIR) Mitigation Monitoring and Reporting Plan Findings and Statement of Overriding Consideration
California Endangered Species Act
Informal Consultation, Incidental Take Permit, or Consistency Determination
California Fish and Game Code Section 1600 (Streambed Alteration) Streambed Alteration Agreement
Porter Cologne Water Quality Act Section 401 Water Quality Certification Section 402 NPDES Permit
Storm Water Pollution Prevention Plan
State Water Resources Control Board Ensure appropriate water rights to source water Central Valley Flood Protection Board (CVFPB) CVFPB Encroachment Permit
Local San Joaquin Valley Air Pollution Control District Dust Control Plan Merced County Surface Mining and Reclamation Act (SMARA)
Mining Permit Reclamation Plan
Other Local Considerations
Easements Grading and Excavation
Permits Design Standards and
Specifications
Right-of-Way Crossings Building Permits Well Permits
Encroachment Permits Tree Removal Permits Footnotes:
a. CEQA incorporates numerous other state requirements, including the Native Plan Protection Act, California Fish and Game Code Sections 1800-1802, 3503, 3511, and 5050.
Merced IRWM Plan Development
Groundwater Recharge Feasibility Study
August 2013 48
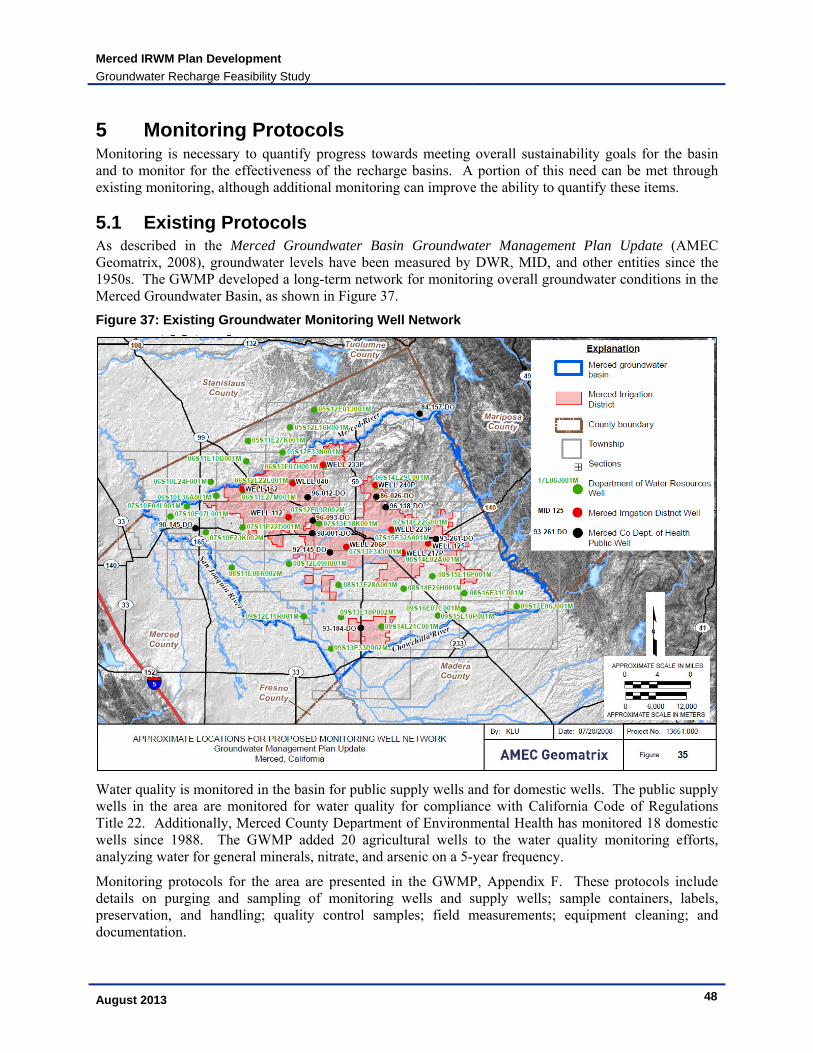
5 Monitoring Protocols Monitoring is necessary to quantify progress towards meeting overall sustainability goals for the basin and to monitor for the effectiveness of the recharge basins. A portion of this need can be met through existing monitoring, although additional monitoring can improve the ability to quantify these items.
5.1 Existing Protocols As described in the Merced Groundwater Basin Groundwater Management Plan Update (AMEC Geomatrix, 2008), groundwater levels have been measured by DWR, MID, and other entities since the 1950s. The GWMP developed a long-term network for monitoring overall groundwater conditions in the Merced Groundwater Basin, as shown in Figure 37.
Figure 37: Existing Groundwater Monitoring Well Network
Water quality is monitored in the basin for public supply wells and for domestic wells. The public supply wells in the area are monitored for water quality for compliance with California Code of Regulations Title 22. Additionally, Merced County Department of Environmental Health has monitored 18 domestic wells since 1988. The GWMP added 20 agricultural wells to the water quality monitoring efforts, analyzing water for general minerals, nitrate, and arsenic on a 5-year frequency.
Monitoring protocols for the area are presented in the GWMP, Appendix F. These protocols include details on purging and sampling of monitoring wells and supply wells; sample containers, labels, preservation, and handling; quality control samples; field measurements; equipment cleaning; and documentation.
Merced IRWM Plan Development
Groundwater Recharge Feasibility Study
August 2013 49
5.2 Recommendations Existing networks and protocols are designed to provide basin-level assessments of water levels and water quality. This existing network should be sufficient to track progress towards meeting basin sustainability goals. However, additional monitoring is needed for individual recharge basins. This monitoring will require site-specific information, but will need to address the following needs:
Monitoring groundwater levels near the basin
o To track water in the subsurface and its progress migrating towards aquifers where it can be extracted (monitor for project success). Monitoring would be through nested, multi-level groundwater wells.
o To identify potential for harm due to waterlogging at adjacent properties. This need will depend on the presence of relatively shallow fine-grained layers or relatively high groundwater levels. Monitoring will be through shallow groundwater wells or piezometers.
Monitoring groundwater quality near the basin
o To identify at an early time if there are water quality problems, such as mobilization of arsenic, uranium, or nitrate. Monitoring may be performed through the same wells utilized for groundwater level monitoring if appropriately located.
The extent of monitoring should be based on a qualitative cost-benefit analysis. If the conditions near a recharge basin are well understood and there are few potential issues, there may not be substantial benefit from expensive monitoring. However, if there is the potential to harm adjacent property owners or if there is the potential that recharged water may not be recoverable, then the cost of monitoring may be justifiable.
6 Analytical Tools
6.1 Existing Tools Existing analytical tools include groundwater models and monitoring databases.
6.1.1 Groundwater Models and Integrated Hydrologic Models Previous groundwater models related to the Merced Basin were identified as part of this task. Following are the models that were identified in the Basin and/or in the vicinity of the project area.
New Regional Integrated Water Resources Model
California Central Valley Groundwater-Surface Water Simulation Model (C2VSIM)
Central Valley Hydrologic Model (CVHM)
Castle Air Force Base Groundwater Model
WESTSIM
MercedSIM
Land Use and Water Demand Model (LUWDM)
Merced Area Groundwater Model (MAGM)
Summary information on the following three models are available and are presented below.
New Regional Integrated Water Resources Model
The Merced Area Groundwater Pool Interests (MAGPI) are embarking on the development of a new integrated water resources model that will serve as an analytical tool for the quantification of the regional
Merced IRWM Plan Development
Groundwater Recharge Feasibility Study
August 2013 50
water budget, planning and analysis of conjunctive use management strategies, design and evaluation of specific water supply projects, evaluation of groundwater recharge and banking operations, evaluation of recycled water and storm water projects, evaluation of flood control studies, and development of financing mechanisms and cost sharing arrangements among MAGPI members. Development of the new model will improve the understanding of the surface water and groundwater flow system and response characteristics in the Basin, and aid in the evaluation of the state of the Merced Region in terms of rate and amount of potential overdrafts in the Basin, as well as rate and extent of regional water quality problems in the Basin. With regards to groundwater recharge, the model will be suitable for regional analysis of the impacts and benefits of groundwater recharge, including the net gain in groundwater storage and any potential to raise regional groundwater levels to unacceptable depths.
MAGPI has identified the following goals for development of the integrated water resources model:
Develop the model in a participatory and transparent manner to facilitate outreach and build technical understanding among basin stakeholders.
Document the model thoroughly to make it accessible to interested parties.
Determine the level of model spatial and temporal resolution needed to satisfy basin water planning objectives.
Establish the capability to evaluate alternative conjunctive water management strategies, including construction of recharge basins or injection wells, and implementation of initiatives to increase surface water sales (in lieu water programs).
Establish the capability to identify beneficiaries of alternative conjunctive water management initiatives and support development and evaluation of alternative cost sharing formulae.
Provide assistance to individual MAGPI member agencies in their planning efforts.
Develop better understanding of basin operations by the public.
Address specific issues, including:
o Possible effects on the movement of contaminant sites at Castle Airport
o Impacts of groundwater pumping in the vicinity of the Merced River on Merced River flows
o Urban growth impacts
Establish the ability to add water quality modeling capability to the model, or based on the model, in the future.
MAGPI has also identified the following specific objectives for the model to develop an analytical tool that can:
Evaluate the natural recharge rates
Simulate surface water systems operations and also dynamically compute the stream-aquifer interactions as well as unlined canal-aquifer interactions
Simulate reservoir operations of Lake McClure
Assists in better understanding the groundwater flow system characteristics and behavior in the Merced Groundwater Basin area, as well as within local sub-areas of interest
Provide a measure of meeting the goals and objectives of the GWMP and the IRWMP
Assist in quantifying the effects of use of storm water and recycled water
Quantify the effects of groundwater storage and banking
Simulate the groundwater and surface water system responses to different pumping and recharge programs in the model area
Merced IRWM Plan Development
Groundwater Recharge Feasibility Study
August 2013 51
Quantify the impacts of various land use and water supply strategies on groundwater and surface water resources in the Basin
The new model is anticipated to be completed in 2014.
California Central Valley Groundwater-Surface Water Simulation Model (C2VSIM)
The California Department of Water Resources (DWR) developed the California Central Valley Groundwater-Surface Water Simulation Model (C2VSIM) as a tool to aid in water management planning. C2VSIM simulates the response of the groundwater and surface water flow systems to surface and ground water stresses based on hydrologic data beginning in 1921 using a grid with more than 30,000 nodes. Simulation includes groundwater flow coupled with land surface, river, lake, unsaturated zone and small watershed processes. Water demands are also simulated based on land use, soil and climatic conditions, and agricultural management parameters. C2VSIM is developed using version 3.02 of DWR’s Integrated Water Flow Model (IWFM).
Central Valley Hydrologic Model (CVHM)
The Central Valley Hydrologic Model (CVHM) was developed in 2009 by the USGS to model Central Valley water supply and water demand, and simulates surface water and groundwater flow. CVHM includes a geospatial database, a texture model, and is simulated using MODFLOW and the Farm Process. The model utilizes 20,000 uniform model cells with an area of 1 mi2 each and divides the aquifer horizontally into 10 layers (U. S. Geological Survey - California Water Science Center, 2012).
Castle Air Force Base Groundwater Model
A model was developed in 1988 by Lizanne Avon titled "A contaminant transport model of trichloroethylene movement in groundwater at Castle Air Force Base, California" No additional data are currently available. Any localized model around the Castle Airport Aviation and Development Center would be focus on contaminants and would likely not cover areas that are well suited for recharge due to that contamination.
WESTSIM
WESTSIM is an IWFM-based groundwater and surface water simulation model of the west-side of the San Joaquin Valley. The model was developed in 2006 by the U.S Bureau of Reclamation largely to assist in addressing subsidence, climate change, streamflow, and TMDL issues.
MercedSIM
MercedSIM is a Lawrence Berkeley National Laboratory application that simulates the hydrology of east and west‐side of Merced County. MercedSim incorporates WESTSIM and expands to the east, utilizing the same 7-layer structure as WESTSIM. Additional data from the east of the San Joaquin River was incorporated from DWR, MID, and Geomatrix to create a model with a 10-year simulation period of 1990-2000. The model is not currently available for use.
Land Use and Water Demand Model (LUWDM)
The Land Use and Water Demand Model (LUWDM) was used in 2001 to calculate monthly demand for Merced River diversions and water demand for agricultural and municipal use.
Merced Area Groundwater Model (MAGM) The Merced Area Groundwater Model (MAGM) was used in in 2001 in conjunction with LUWDM and MRSIM to simulate groundwater levels and flow directions for the project area. It is not currently known what software or algorithms were used for this model.
6.1.2 Surface Water Models Previous surface water models related to the Merced Basin were identified as part of this task. Following are the models that were identified in the Basin and/or in the vicinity of the project area.

Merced IRWM Plan Development
Groundwater Recharge Feasibility Study
August 2013 52
Merced River Simulation Model (MRSIM)
CalSim II
CalSim III
Summary information on the following three models are available and are presented below.
Merced River Simulation Model (MRSIM)
Merced River Simulation Model (MRSIM) is a mass balance sequential simulation model that operates Lake McClure on a monthly basis to satisfy irrigation needs within MID boundaries. MRSIM is written in FORTRAN and is designed specifically to simulate Lake McClure and the Merced River downstream to Cressey. The algorithms for this model are not currently known.
CalSim II
CalSim II is a planning model developed by the Department of Water Resources (DWR) and the U.S. Bureau of Reclamation (Reclamation). It simulates the State Water Project (SWP) and the Central Valley Project (CVP) and areas tributary to the Sacramento-San Joaquin Delta. CalSim II provides quantitative hydrologic-based information to those responsible for planning, managing and operating the SWP and the CVP. As the official model of those projects, CalSim II is typically the system model that is used for any interregional or statewide analysis in California. CalSim II uses described optimization techniques to route water through a CVP-SWP system network representation. The network includes over 300 nodes and over 900 arcs, representing 24 surface reservoirs and the interconnected flow system.
The model operates on a monthly time step from water year 1922 through 2003. Using historical rainfall and runoff data, which has been adjusted for changes in water and land use that have occurred or may occur in the future, the model simulates the operation of the water resources infrastructure in the Sacramento and San Joaquin river basins on a month-to-month basis during this 82-year period. In the model, the reservoirs and pumping facilities of the SWP and CVP are operated to assure the flow and water quality requirements for these systems are met. The model assumes that facilities, land use, water supply contracts, and regulatory requirements are constant over 82 years from 1922 to 2003, representing a fixed level of development (U.S. Bureau of Reclamation, 2008).
CalSIM III
CalSIM III is currently under development to address weaknesses identified in CalSim II. Goals for CalSim III development include:
Improve accuracy of water supply estimates
Create finer model spatial resolution
Update agricultural demand calculations and water use efficiencies
Associate agricultural demand with the correct water supply source
Reconcile differences between C2VSIM and CalSim
Improve the representation of groundwater (Yin & Arora, 2007)
CalSim III has not been publically released.
6.1.3 Data Management Tools The Merced Groundwater Basin Groundwater Management Plan Update (AMEC Geomatrix, 2008) indicates that the member agencies upload data into a centralized repository for storage and analysis. As part of the IRWMP development, a data management tool, HydroDMS, will be developed and implemented. This will allow data to be available to member agencies and the public through an internet website.
Merced IRWM Plan Development
Groundwater Recharge Feasibility Study
August 2013 53
6.2 Recommended Tools The basic tools needs for developing and implementing a recharge program are the ability to estimate the benefits and impacts of recharge project and the ability to share information with stakeholders. Existing tools and tools under development meet the bulk of those needs. Recommendations for additional tools include:
Water Availability Tool. A water availability tool would include information on streamflow, water rights, and available canal capacities. This could be based on historical data or could be a more dynamically driven model based on the datasets of the integrated hydrologic model. The purpose of the tool would be to indicate when and where there is the ability to move water through existing infrastructure and to identify where small cost-effective infrastructure changes can be made to increase the ability to recharge water.
Water Accounting Tool. A water accounting tool would account for surface water and groundwater use throughout the region. The tool would allow for the analysis of net water use, taking into consideration the connectivity between the surface water system and the groundwater system.
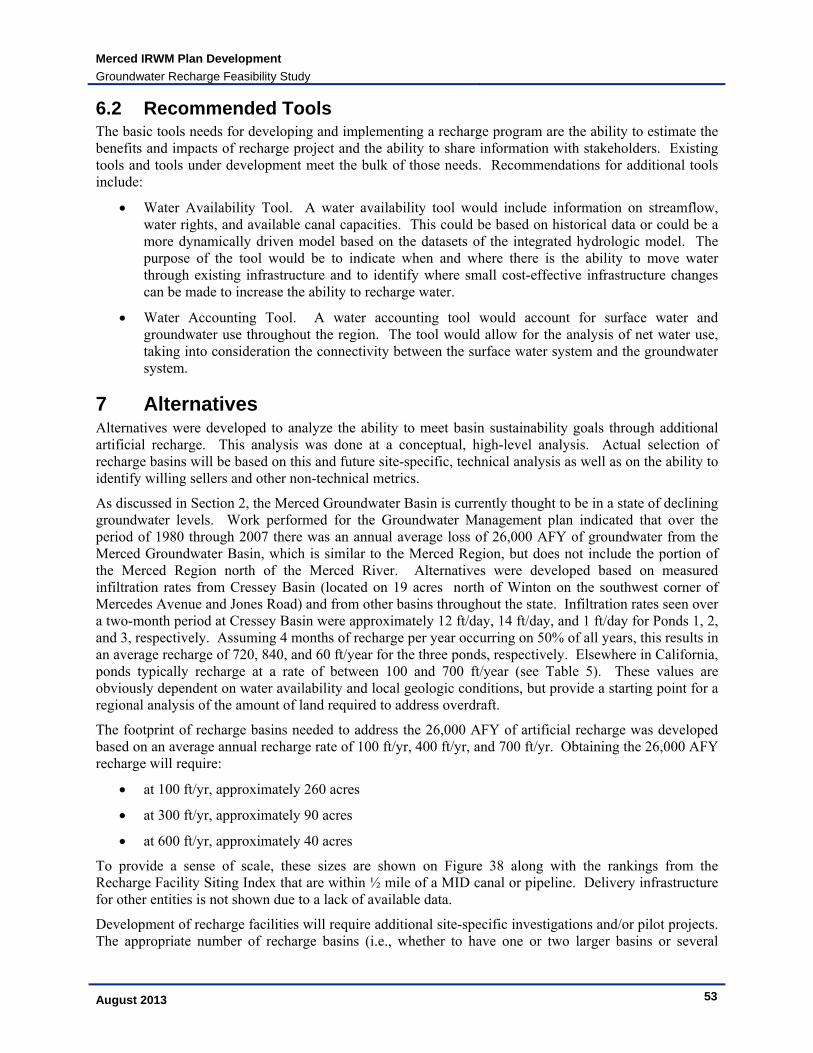
7 Alternatives Alternatives were developed to analyze the ability to meet basin sustainability goals through additional artificial recharge. This analysis was done at a conceptual, high-level analysis. Actual selection of recharge basins will be based on this and future site-specific, technical analysis as well as on the ability to identify willing sellers and other non-technical metrics.
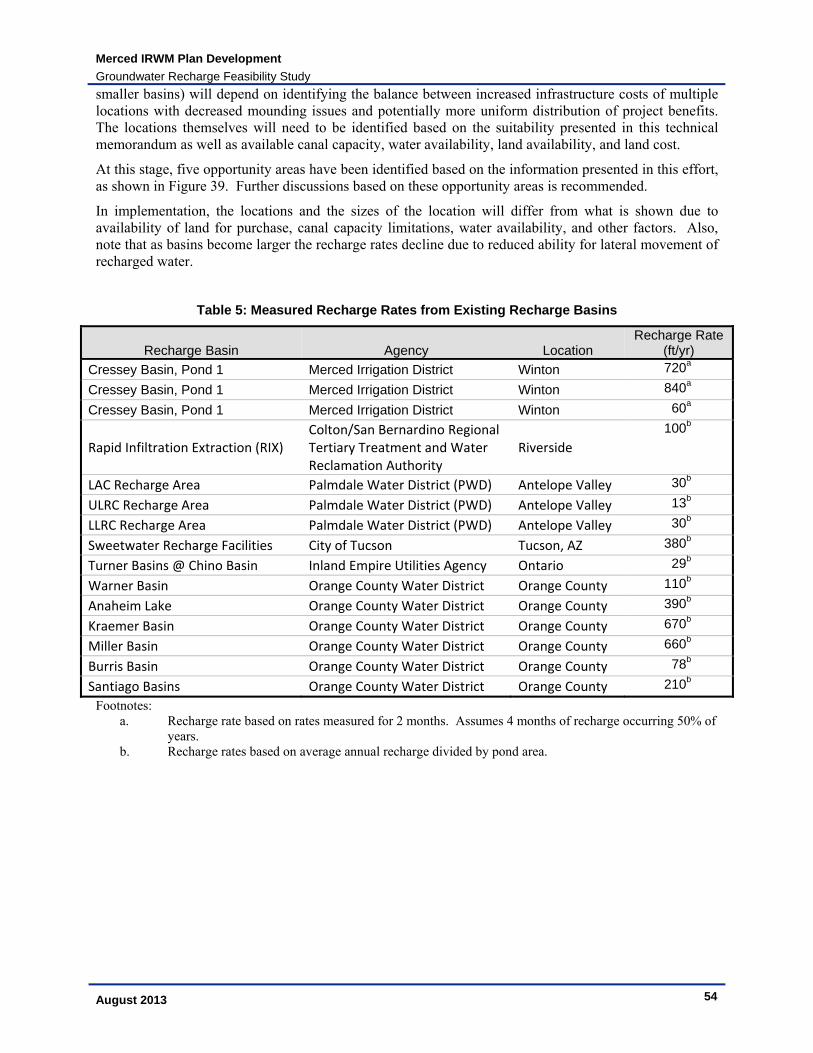
As discussed in Section 2, the Merced Groundwater Basin is currently thought to be in a state of declining groundwater levels. Work performed for the Groundwater Management plan indicated that over the period of 1980 through 2007 there was an annual average loss of 26,000 AFY of groundwater from the Merced Groundwater Basin, which is similar to the Merced Region, but does not include the portion of the Merced Region north of the Merced River. Alternatives were developed based on measured infiltration rates from Cressey Basin (located on 19 acres north of Winton on the southwest corner of Mercedes Avenue and Jones Road) and from other basins throughout the state. Infiltration rates seen over a two-month period at Cressey Basin were approximately 12 ft/day, 14 ft/day, and 1 ft/day for Ponds 1, 2, and 3, respectively. Assuming 4 months of recharge per year occurring on 50% of all years, this results in an average recharge of 720, 840, and 60 ft/year for the three ponds, respectively. Elsewhere in California, ponds typically recharge at a rate of between 100 and 700 ft/year (see Table 5). These values are obviously dependent on water availability and local geologic conditions, but provide a starting point for a regional analysis of the amount of land required to address overdraft.
The footprint of recharge basins needed to address the 26,000 AFY of artificial recharge was developed based on an average annual recharge rate of 100 ft/yr, 400 ft/yr, and 700 ft/yr. Obtaining the 26,000 AFY recharge will require:
at 100 ft/yr, approximately 260 acres
at 300 ft/yr, approximately 90 acres
at 600 ft/yr, approximately 40 acres
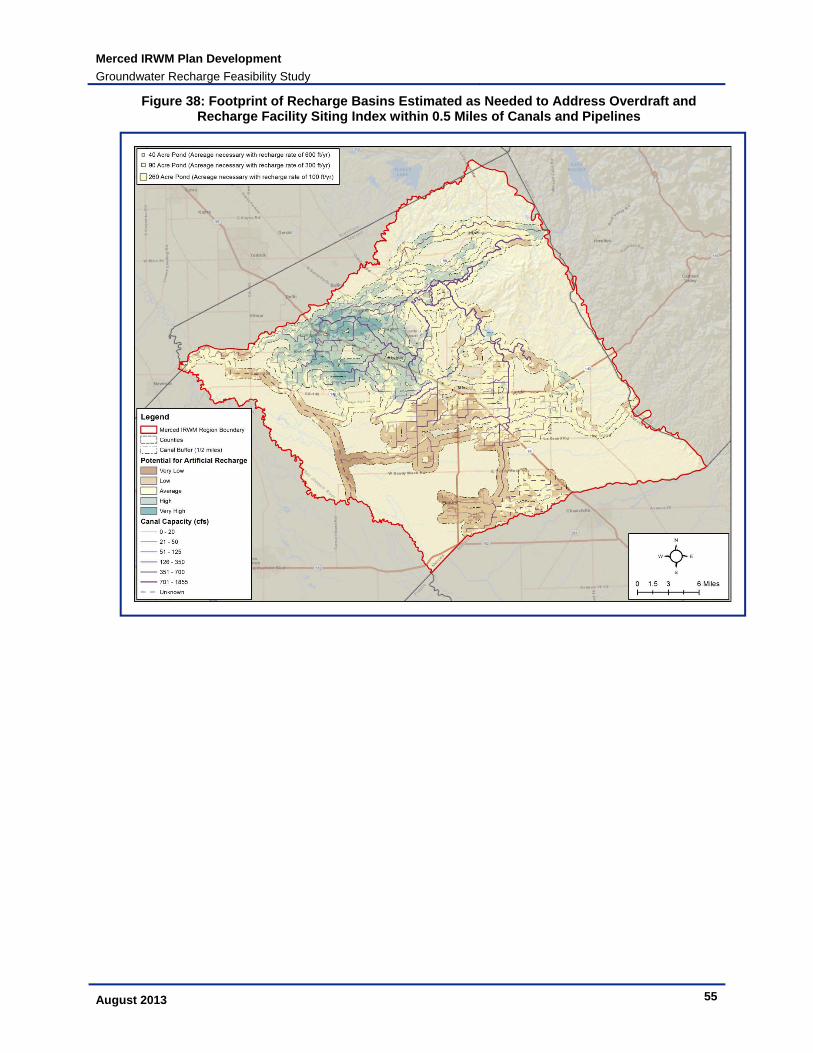
To provide a sense of scale, these sizes are shown on Figure 38 along with the rankings from the Recharge Facility Siting Index that are within ½ mile of a MID canal or pipeline. Delivery infrastructure for other entities is not shown due to a lack of available data.
Development of recharge facilities will require additional site-specific investigations and/or pilot projects. The appropriate number of recharge basins (i.e., whether to have one or two larger basins or several
Merced IRWM Plan Development
Groundwater Recharge Feasibility Study
August 2013 54
smaller basins) will depend on identifying the balance between increased infrastructure costs of multiple locations with decreased mounding issues and potentially more uniform distribution of project benefits. The locations themselves will need to be identified based on the suitability presented in this technical memorandum as well as available canal capacity, water availability, land availability, and land cost.
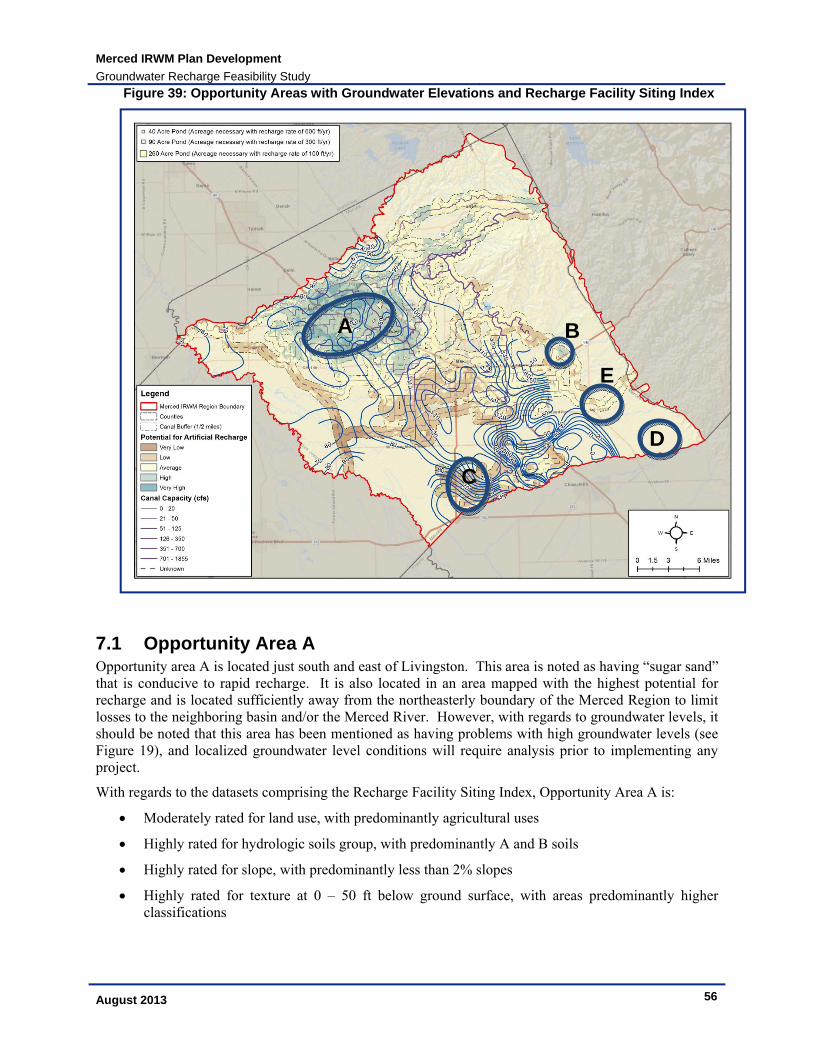
At this stage, five opportunity areas have been identified based on the information presented in this effort, as shown in Figure 39. Further discussions based on these opportunity areas is recommended.
In implementation, the locations and the sizes of the location will differ from what is shown due to availability of land for purchase, canal capacity limitations, water availability, and other factors. Also, note that as basins become larger the recharge rates decline due to reduced ability for lateral movement of recharged water.
Table 5: Measured Recharge Rates from Existing Recharge Basins
Recharge Basin Agency Location Recharge Rate
(ft/yr)
Cressey Basin, Pond 1 Merced Irrigation District Winton 720a
Cressey Basin, Pond 1 Merced Irrigation District Winton 840a
Cressey Basin, Pond 1 Merced Irrigation District Winton 60a
Rapid Infiltration Extraction (RIX) Colton/San Bernardino Regional Tertiary Treatment and Water Reclamation Authority
Riverside 100b
LAC Recharge Area Palmdale Water District (PWD) Antelope Valley 30b
ULRC Recharge Area Palmdale Water District (PWD) Antelope Valley 13b
LLRC Recharge Area Palmdale Water District (PWD) Antelope Valley 30b
Sweetwater Recharge Facilities City of Tucson Tucson, AZ 380b
Turner Basins @ Chino Basin Inland Empire Utilities Agency Ontario 29b
Warner Basin Orange County Water District Orange County 110b
Anaheim Lake Orange County Water District Orange County 390b
Kraemer Basin Orange County Water District Orange County 670b
Miller Basin Orange County Water District Orange County 660b
Burris Basin Orange County Water District Orange County 78b
Santiago Basins Orange County Water District Orange County 210b
Footnotes: a. Recharge rate based on rates measured for 2 months. Assumes 4 months of recharge occurring 50% of
years. b. Recharge rates based on average annual recharge divided by pond area.
Merced IRWM Plan Development
Groundwater Recharge Feasibility Study
August 2013 55
Figure 38: Footprint of Recharge Basins Estimated as Needed to Address Overdraft and Recharge Facility Siting Index within 0.5 Miles of Canals and Pipelines
Merced IRWM Plan Development
Groundwater Recharge Feasibility Study
August 2013 56
Figure 39: Opportunity Areas with Groundwater Elevations and Recharge Facility Siting Index
7.1 Opportunity Area A Opportunity area A is located just south and east of Livingston. This area is noted as having “sugar sand” that is conducive to rapid recharge. It is also located in an area mapped with the highest potential for recharge and is located sufficiently away from the northeasterly boundary of the Merced Region to limit losses to the neighboring basin and/or the Merced River. However, with regards to groundwater levels, it should be noted that this area has been mentioned as having problems with high groundwater levels (see Figure 19), and localized groundwater level conditions will require analysis prior to implementing any project.
With regards to the datasets comprising the Recharge Facility Siting Index, Opportunity Area A is:
Moderately rated for land use, with predominantly agricultural uses
Highly rated for hydrologic soils group, with predominantly A and B soils
Highly rated for slope, with predominantly less than 2% slopes
Highly rated for texture at 0 – 50 ft below ground surface, with areas predominantly higher classifications
A B
C
D
E
Merced IRWM Plan Development
Groundwater Recharge Feasibility Study
August 2013 57
Variably rated for texture at 50 – 100 ft below ground surface, with areas in all but the lowest classification
Variably rated for texture at 100 – 150 ft below ground surface, with areas in all classifications
Highly rated for thickness of Corcoran Clay, with 0 – 20 feet of Corcoran Clay
Moderately rated for depth to groundwater, with areas in the middle classifications
Highly rated for flow direction, with predominantly flow inward toward pumping depressions
While not included in the index, the area is away from subsidence indicated in previous studies and would not have a significant benefit in reducing subsidence
While not included in the index water quality is generally good, with TDS, chloride, nitrate, and arsenic below regulatory limits.
7.2 Opportunity Area B Opportunity Area B is located north of Planada. This area has been noted as having existing local analysis that could provide local data necessary for recharge siting, the Southeast Quadrant Well Field Feasibility Study. It is also located in an area mapped as having average to high potential for recharge and is located along major water delivery infrastructure.
With regards to the datasets comprising the Recharge Facility Siting Index, Opportunity Area B is:
Highly rated for land use, with predominantly agricultural uses.
Moderately to poorly rated for hydrologic soils group, with predominantly B and C soils
Variably rated for slope, with generally less than 2% slopes
Variably rated for texture at 0 – 50 ft below ground surface, with areas in all classifications
Variably rated for texture at 50 – 100 ft below ground surface, with areas in all classifications
Poorly rated for texture at 100 – 150 ft below ground surface, with areas in the lower classifications
Highly rated for thickness of Corcoran Clay, no Corcoran Clay present
Highly to moderately rated for depth to groundwater, with areas in the top three classification
Highly rated for flow direction, with predominantly flow toward the middle of the basin
While not included in the index, the area is away from subsidence indicated in previous studies and would not have a significant benefit in reducing subsidence
While not included in the index water quality is generally good, with TDS, chloride, nitrate, and arsenic below regulatory limits.
7.3 Opportunity Area C Opportunity Area C is located in the southern corner of the Merced Region, near El Nido. While the area as mapped as having a low potential for recharge, the proximity to major water delivery infrastructure and the need for equitable distribution of recharge benefits makes this location an opportunity area.
With regards to the datasets comprising the Recharge Facility Siting Index, Opportunity Area C is:
Highly rated for land use, with predominantly agricultural uses.
Variably rated for hydrologic soils group, with all soil types
Merced IRWM Plan Development
Groundwater Recharge Feasibility Study
August 2013 58
Highly rated for slope, with less than 2% slopes
Poorly rated for texture at 0 – 50 ft below ground surface, with areas in the lowest two classifications
Moderately to poorly rated for texture at 50 – 100 ft below ground surface, with areas in the lower three classifications
Poorly rated for texture at 100 – 150 ft below ground surface, with areas predominantly in the lowest classification
Variably rated for thickness of Corcoran Clay, with all classification present
Highly rated for depth to groundwater, with areas in the top three classifications
Moderately to poorly rated for flow direction, with predominantly flow toward the basin boundary to the south.
While not included in the index, the area is the most impacted by historical subsidence and additional recharge could reduce the risk of future subsidence.
While not included in the index water quality is generally good, with TDS, chloride, nitrate, and arsenic below regulatory limits.
7.4 Opportunity Area D Opportunity Area D is located in the eastern corner of the Merced Region, east-northeast of Chowchilla. While away from MID delivery infrastructure, this area may represent an opportunity to work with Chowchilla Water District to implement a project to improve groundwater conditions in both the Merced and Chowchilla Subbasins. It is located in an area mapped as having average to high potential for recharge and is located along the Chowchilla River.
With regards to the datasets comprising the Recharge Facility Siting Index, Opportunity Area D is:
Variably rated for land use, with a mix of agricultural uses and native vegetation.
Variably rated for hydrologic soils group, with B, C, and D soils
Variably rated for slope, with generally less than 2% slopes
Variably rated for texture at 0 – 50 ft below ground surface, with areas in all classifications
Moderately to poorly rated for texture at 50 – 100 ft below ground surface, with areas in the lower three classifications
Variably rated for texture at 100 – 150 ft below ground surface, with areas in all classifications
Highly rated for thickness of Corcoran Clay, no Corcoran Clay present
Highly rated for depth to groundwater, in the top classification
Highly rated for flow direction, with predominantly flow along the basin boundary (noting that this project will require collaboration with Chowchilla Water District and any potential losses to Chowchilla Subbasin would thus be a benefit to the project partner)
While not included in the index, the area is away from subsidence indicated in previous studies and would not have a significant benefit in reducing subsidence
While not included in the index water quality is generally good, with TDS, chloride, nitrate, and arsenic below regulatory limits.
Merced IRWM Plan Development
Groundwater Recharge Feasibility Study
August 2013 59
7.5 Opportunity Area E Opportunity Area E is located in the eastern portion of the Merced Region, near Le Grand. It is located in an area with relatively fewer recharge opportunities, with the bulk of the most suitable land located in and around Opportunity Area A.
With regards to the datasets comprising the Recharge Facility Siting Index, Opportunity Area E is:
Variably rated for land use, with a mix of uses.
Highly rated for hydrologic soils group, with B, C, and D soils
Highly rated for slope, with generally less than 2% slopes
Moderately to poorly rated for texture at 0 – 50 ft below ground surface, with areas in the lower three classifications
Poorly rated for texture at 50 – 100 ft below ground surface, with areas in the lower two classifications
Poorly rated for texture at 100 – 150 ft below ground surface, with areas in the lower two classifications
Highly rated for thickness of Corcoran Clay, no Corcoran Clay present
Highly rated for depth to groundwater, in the top classification
Highly to moderately rated for flow direction, with some groundwater flow towards the southeastern boundary or internal sinks near that boundary. Note that some losses here could be a benefit to Chowchilla Water District and maybe an opportunity for partnering on this effort.
While not included in the index, the area on the edge subsidence indicated in previous studies and could potentially have a small significant benefit in reducing subsidence
Regional analysis shows that arsenic concentrations in the area may be elevated. This warrants additional study, particularly if the water is intended for drinking water purposes.
8 Implementation Implementation of recharge activities requires:
Identification of the role recharge is expected to play in meeting the overall sustainability goal of the basin, as opposed to other options such as conservation.
Identification of non-basin infrastructure needs, such as canal improvements.
Identification of potential regional partnerships, such as with Chowchilla Water District
Identification of parcels for projects, which should include
o Owner willing to sell at no more than market price
o Adequate size for a feasible project
o High score on the Recharge Facility Siting Index
o Close proximity to a canal with available capacity and the ability to deliver water via gravity or low-head booster pumps.
o Sufficiently far from point source contaminants
o Above aquifer with suitable quality for beneficial use of extracted water
Merced IRWM Plan Development
Groundwater Recharge Feasibility Study
August 2013 60
o Ability to extract water for beneficial use, through new or existing facilities
Identification of benefits and impacts through use of modeling tools.
Identification of funding for development of the projects as well as operation and maintenance
Development of permits and other items required by regulation
Construction
Monitoring
Operation and Maintenance
9 Works Cited AMEC and RMC. (2013). Salt and Nutrient Study. In RMC, Merced Integrated Regional Water
Management Plan. AMEC Geomatrix. (2008). Merced Groundwater Basin Groundwater Management Plan Update,
Merced County, CA. Bertoldi, G. L., Johnston, R. H., & Evenston, K. D. (1991). Ground water in the Central Valley: a
summary report. USGS professional paper 1401-A. Dubrovsky, N. M., Kratzer, C. R., Brown, L. R., Gronberg, J. M., & Burow, K. R. (1998). Water
Quality in the San Joaquin-Tulare Basins, California, 1992-95. U.S. Geologic Survey Circular 1159.
DWR. (1981). Depth to the Top of the Corcoran Clay - 1981. DWR. (2004, April 27). 2002 Merced County Land Use Survey Data. Retrieved September 24,
2012, from DWR Web site: http://www.water.ca.gov/landwateruse/docs/landusedata/shapes/02me.zip
DWR. (2010). South Central Region, Groundwater Basin Contour Map, Merced Groundwater Basin, Spring 2010, Lines of Equal Depth to Water in Wells, Unconfined Aquifer. Retrieved September 25, 2012, from DWR Web site: http://www.water.ca.gov/groundwater/data_and_monitoring/south_central_region/GroundwaterLevel/basin_contour.cfm?map=merc_d10.gif
DWR. (2010). South Central Region, Groundwater Basin Contour Map, Merced Groundwater Basin, Spring 2010, Lines of Equal Elevation of Water in Wells, Unconfined Aquifer. Retrieved Septemebr 25, 2012, from DWR Web site: http://www.water.ca.gov/groundwater/data_and_monitoring/south_central_region/images/groundwater/merc_e10.gif
Faunt, C. C., Belitz, K., & Hanson, R. T. (2010). Development of a three-dimensional model of sedimentary texture in valley-fill deposits of Central Valley, California, USA. Hydrogeology Journal(18), 625-649.
Faunt, C. C., Hanson, R. T., & Belitz, K. (2009). Chapter A. Introduction, Overview of Hydrogeology, and Taxtural Model of California's Central Valley. In C. C. Faunt, Groundwater Availability of the Central Valley Aquifer, California (p. 225). U.S. Geological Survey Professional Paper 1766.
Gronberg, J. M., & Kratzer, C. R. (2006). Environmental Setting of the Lower Merced River Basin, California. U.S. Geological Survey Scientific Investigations Report 2006-5152.
Ireland, R. L., Poland, J. F., & Riley, F. S. (1984). Land Subsidence in the San Joaquin Valley, California, as of 1980. USGS Professional Paper 437-I.
Merced Irrigation District. (2008). About MID. Retrieved 10 22, 2012, from Merced Irrigation District Web Site: http://www.mercedid.org/aboutmid
Nolte. (2009). Qualitative Comparison of Water Supply and Demands in Merced County.
Merced IRWM Plan Development
Groundwater Recharge Feasibility Study
August 2013 61
Page, R. W., & Balding, G. O. (1973). Geology and quality of water in the Modesto-Merced area, San Joaquin Valley, California, with a brief section on hydrology. U.S. Geological Survey Water-Resources Investigations Report 73-6.
Soil Survey Division Staff. (1993). Soil Survey Manual. Soil Conservation Service, US Department of Agriculture Handbook 18.
U. S. Geological Survey - California Water Science Center. (2012, September 7). Retrieved September 26, 2012, from Central Valley Hydrologic Model: http://ca.water.usgs.gov/projects/central-valley/central-valley-hydrologic-model.html
U.S. Bureau of Reclamation. (2008). Central Valley Project and State Water Project Operations Criteria and Plan, Biological Assessment, Appendix D.
U.S. Department of Agriculture, Natural Resources Conservation Service. (2008, 03 31). Soil Survey Geographic (SSURGO) database for Merced Area, California. Forth Worth, TX. Retrieved from http://SoilDataMart.nrcs.usda.gov/
U.S. Geological Survey. (2009). National Elevation Dataset (NED) for Merced Area, California. Sioux Falls, SD. Retrieved from http://ned.usgs.gov
US Bureau of Reclamation. (2012). DRAFT Reclamation Subsidence, NGS Stations, December 2011 to December 2012.
US Bureau of Reclamation. (2012). DRAFT USACE Subsidence, 1931 to 2001. USDA-NRCS. (2007). National Engineering Handbook, Part 630 Hydrology, Chapter 7,
Hydrologic Soils Groups. USDA-NRCS. (2012, February 17). Web Soil Survey. Retrieved September 24, 2012, from Web
Soil Survey: http://websoilsurvey.nrcs.usda.gov/app/WebSoilSurvey.aspx WRIME, Inc. (2003). MAGPI Conjunctive Use Assessment. Yin, H., & Arora, S. (2007). Joint DWR and Reclamation CalSim-III Hydrology Development
Project, A Brief Overview. Presentation to the California Water and Environmental Modeling Forum (CWEMF), February 26-28.