appendix b - medicaljournals.se · should community services (hospital at home) vs. hospital...
TRANSCRIPT

1
Appendix B ContentsGRADE and Summary of Findings Tables for PICO Question ..................................................... 2
a) Community rehabilitation services compared to hospital/ clinic or facility based rehabilitation ..................................................................................................................................................... 2b) Integrated and decentralized services compared to centralized services .............................. 37c) Multidisciplinary rehabilitation (including 2 or more professions) compared to non multidisciplinary rehabilitation ................................................................................................. 44d) Specialized hospitals and units for rehabilitation for complex conditions compared to Rehabilitation for complex conditions in general wards or non-specialized units ................... 69e) Rehabilitation services integrated into the health service compared to rehabilitation services integrated into the social or welfare service .............................................................................. 80
2
GRADEandSummaryofFindingsTables
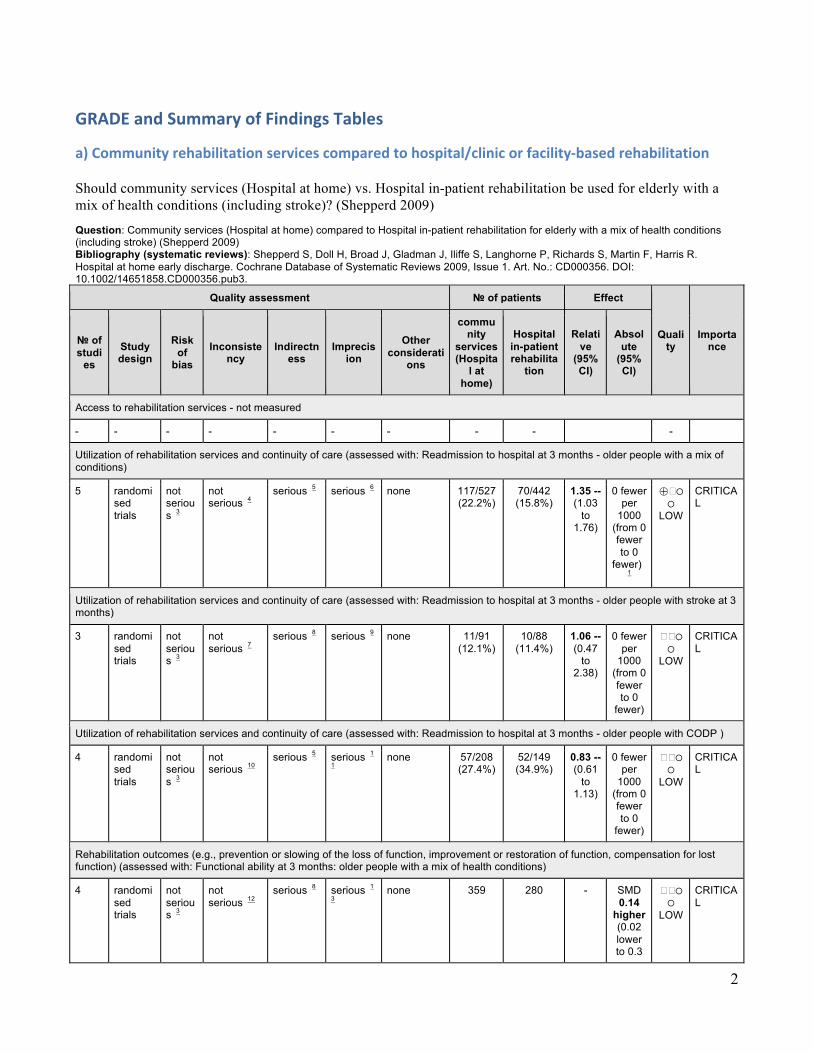
a)Communityrehabilitationservicescomparedtohospital/clinicorfacility-basedrehabilitation Should community services (Hospital at home) vs. Hospital in-patient rehabilitation be used for elderly with a mix of health conditions (including stroke)? (Shepperd 2009) Question: Community services (Hospital at home) compared to Hospital in-patient rehabilitation for elderly with a mix of health conditions (including stroke) (Shepperd 2009) Bibliography (systematic reviews): Shepperd S, Doll H, Broad J, Gladman J, Iliffe S, Langhorne P, Richards S, Martin F, Harris R. Hospital at home early discharge. Cochrane Database of Systematic Reviews 2009, Issue 1. Art. No.: CD000356. DOI: 10.1002/14651858.CD000356.pub3.
Quality assessment № of patients Effect
Quality
Importance № of
studies
Study design
Risk of
bias Inconsiste
ncy Indirectn
ess Imprecis
ion
Other considerati
ons
community
services (Hospita
l at home)
Hospital in-patient rehabilita
tion
Relative
(95% CI)
Absolute
(95% CI)
Access to rehabilitation services - not measured
- - - - - - - - - -
Utilization of rehabilitation services and continuity of care (assessed with: Readmission to hospital at 3 months - older people with a mix of conditions)
5 randomised trials
not serious 3
not serious 4
serious 5 serious 6 none 117/527 (22.2%)
70/442 (15.8%)
1.35 -- (1.03
to 1.76)
0 fewer per
1000 (from 0 fewer to 0
fewer)
1
⨁�◯◯
LOW
CRITICAL
Utilization of rehabilitation services and continuity of care (assessed with: Readmission to hospital at 3 months - older people with stroke at 3 months)
3 randomised trials
not serious 3
not serious 7
serious 8 serious 9 none 11/91 (12.1%)
10/88 (11.4%)
1.06 -- (0.47
to 2.38)
0 fewer per
1000 (from 0 fewer to 0
fewer)
��◯◯
LOW
CRITICAL
Utilization of rehabilitation services and continuity of care (assessed with: Readmission to hospital at 3 months - older people with CODP )
4 randomised trials
not serious 3
not serious 10
serious 5 serious 1
1 none 57/208
(27.4%) 52/149 (34.9%)
0.83 -- (0.61
to 1.13)
0 fewer per
1000 (from 0 fewer to 0
fewer)
��◯◯
LOW
CRITICAL
Rehabilitation outcomes (e.g., prevention or slowing of the loss of function, improvement or restoration of function, compensation for lost function) (assessed with: Functional ability at 3 months: older people with a mix of health conditions)
4 randomised trials
not serious 3
not serious 12
serious 8 serious 1
3 none 359 280 - SMD
0.14 higher (0.02 lower to 0.3
��◯◯
LOW
CRITICAL

3
Quality assessment № of patients Effect
Quality
Importance № of
studies
Study design
Risk of
bias
Inconsistency
Indirectness
Imprecision
Other considerati
ons
community
services (Hospita
l at home)
Hospital in-patient rehabilita
tion
Relative
(95% CI)
Absolute
(95% CI)
higher)
Health outcomes (e.g., mortality, morbidity, and quality of life) (assessed with: Mortality at 3 months: older people with a mix of conditions)
6 randomised trials
not serious 3
not serious 14
serious 5 serious 1
5 none 54/580
(9.3%) 43/504 (8.5%)
1.12 -- (0.77
to 1.63)
0 fewer per
1000 (from 0 fewer to 0
fewer)
��◯◯
LOW
CRITICAL
Health outcomes (e.g., mortality, morbidity, and quality of life) (assessed with: Mortality at 3 months: older people with stroke)
6 randomised trials
not serious 3
not serious 16
serious 8 serious 1
7 none 11/212
(5.2%) 10/207 (4.8%)
1.05 -- (0.48
to 2.34)
0 fewer per
1000 (from 0 fewer to 0
fewer)
��◯◯
LOW
CRITICAL
Health outcomes (e.g., mortality, morbidity, and quality of life) (assessed with: Mortality: older people with COPD (not clear how long follow-up) )
4 randomised trials
not serious 3
not serious 18
serious 5 serious 1
9 none 9/208
(4.3%) 14/208 (6.7%)
0.50 -- (0.23
to 1.09)
0 fewer per
1000 (from 0 fewer to 0
fewer)
��◯◯
LOW
CRITICAL
MD – mean difference, RR – relative risk 1. No explanation was provided 2. No evidence available 3. In 18 trials the method of randomisation and concealment of allocation was clearly described. For the remaining trials it was unclear. 4. I-square=0%; p=0.49 5. There are no randomized trials conducted in LMIC. This type of intervention is very unlikely to be reproduced in LMIC 6. Because the confidence interval includes the null hypothesis and the sample size is small: 969 participants (home: 117/527; in-patients:
70/442) 7. I-square=17%; p=0.30 8. There was one randomized trial conducted in Thailand, however the sample size was very small (111 patients total). This type of intervention
is very unlikely to be reproduced in LMIC 9. Because the confidence interval includes the null hypothesis and the sample size is small: 179 participants (home: 11/91; in-patients=10/88) 10. I-square=11%; p=0.34 11. Because the confidence interval includes the null hypothesis and the sample size is small: 357 participants (home: 57/208; in-patient:
52/149) 12. I-square=50%; p=0.11 13. Because the confidence interval includes the null hypothesis and the sample size is small: 639 participants (home: 359; in-patients:280) 14. I-square=0%; p=0.62 15. Because the confidence interval includes the null hypothesis and the sample size is small: 1084 participants (home: 54/580; in-patient:
43/504) 16. I-square=7%; p=0.37 17. Because the confidence interval includes the null hypothesis and the sample size is small: 419 participants (home: 11/212; in-patient:
10/207) 18. I-square=0%; p=0.62 19. Because the confidence interval includes the null hypothesis and the sample size is small: 357 participants (home: 9/208; in-patients: 14/149

4
Summaryoffindings:Communityservices(Hospitalathome)comparedtoHospitalin-patientrehabilitationforelderlywithamixofhealthconditions(includingstroke).(Shepperd2009)Outcomes Anticipated absolute effects* (95% CI) Relative
effect (95% CI)
№ of participants (Studies)
Quality of the evidence (GRADE)
Comments
Risk with Hospital in-patient rehabilitation
Risk with community services (Hospital at home)
Access to rehabilitation services - not measured
- -
Utilization of rehabilitation services and continuity of care assessed with: Readmission to hospital at 3 months
Study population - older people with a mix of conditions
RR 1.35 (1.03 to 1.76)
969 (5 RCTs)
⨁⨁⨁◯ MODERATE 1 2 3 4
55 more per 1000 (from 5 more to 120 more). Significantly more readmissions with hospital at home. 158 per 1000 214 per 1000
(163 to 279)
Utilization of rehabilitation services and continuity of care assessed with: Readmission to hospital follow up: mean 3 months
Study population (older people with stroke) RR 1.06 (0.47 to 2.38)
179 (3 RCTs)
⨁⨁◯◯ LOW 1 5 6 7
7 more per 1000 (from 60 fewer to 157 more). CI includes both benefit and harm 114 per 1000 120 per 1000
(53 to 270)
Utilization of rehabilitation services and continuity of care (Utilization of rehabilitation services) assessed with: Readmission to hospital at 3 months - older people with COPD
Study population - older people with COPD RR 0.83 (0.61 to 1.13)
357 (4 RCTs)
⨁⨁◯◯ LOW 1 3 8 9
59 fewer per 1000 (from 45 more to 136 fewer). CI includes both benefit and harm 349 per 1000 290 per 1000
(213 to 394)
Rehabilitation outcomes assessed with: Functional ability: older people with a mix of health conditions follow up: mean 3 months
The mean rehabilitation outcomes in the intervention group was 0.14 standard deviations higher (0.02 lower to 0.3 higher)
- 639 (4 RCTs)
⨁⨁◯◯ LOW 1 6 10 11
CI includes both benefit and harm. As a rule of thumb, 0.2 SD is a small difference, 0.5 is moderate, and 0.8 is large.
Health outcomes ( ) assessed with: Mortality: follow up: mean 3 months
Study population - older people with a mix of conditions
RR 1.12 (0.77 to 1.63)
1084 (6 RCTs)
⨁⨁◯◯ LOW 1 3 12 13
10 more per 1000 (from 20 fewer to 54 more). CI includes both benefit and harm.
85 per 1000 96 per 1000 (66 to 139)
Health outcomes assessed with: Mortality. follow up: mean 3 months
Study population - older people with stroke RR 1.05 (0.48 to 2.34)
419 (6 RCTs)
⨁⨁◯◯ LOW 1 6 14 15
2 more per 1000 (from 25 fewer to 65 more). CI includes both benefit and harm. 48 per 1000 51 per 1000
(23 to 113)
Health outcomes assessed with: Mortality (not clear how long follow-up)
Study population - older people with COPD RR 0.5 (0.23 to 1.09)
416 (4 RCTs)
⨁⨁◯◯ LOW 1 3 16 17
34 fewer per 1000 (from 6 more to 52 fewer). CI includes both benefit and harm. 67 per 1000 34 per 1000
(15 to 73)
*The risk in the intervention group (and its 95% confidence interval) is based on the assumed risk in the comparison group and the relative effect of the intervention (and its 95% CI). CI: Confidence interval; RR: Risk ratio; OR: Odds ratio;
1. In many trials the method of randomisation and concealment of allocation was clearly described. For the remaining trials it was unclear. 2. I-square=0%; p=0.49 3. There are no randomized trials conducted in LMIC. This type of intervention is very unlikely to be reproduced in LMIC 4. The confidence interval does not includes the null hypothesis and the sample size is large (969) 5. I-square=17%; p=0.30 6. There was one randomized trial conducted in Thailand, however the sample size was very small (111 patients total). This type of intervention is very unlikely to be
reproduced in LMIC 7. Because the confidence interval includes the null hypothesis and the sample size is small: 179 participants (home: 11/91; in-patients=10/88) 8. I-square=11%; p=0.34 9. Because the confidence interval includes the null hypothesis and the sample size is small: 357 participants (home: 57/208; in-patient: 52/149) 10. I-square=50%; p=0.11 11. Because the confidence interval includes the null hypothesis and the sample size is small: 639 participants (home: 359; in-patients:280) 12. I-square=0%; p=0.62 13. Because the confidence interval includes the null hypothesis and the sample size is small: 1084 participants (home: 54/580; in-patient: 43/504) 14. I-square=7%; p=0.37 15. Because the confidence interval includes the null hypothesis and the sample size is small: 419 participants (home: 11/212; in-patient: 10/207) 16. I-square=0%; p=0.62 17. Because the confidence interval includes the null hypothesis and the sample size is small: 357 participants (home: 9/208; in-patients: 14/149 18. No explanation was provided

5
Should community rehabilitation services vs. hospital, clinic or facility based rehabilitation be used for elderly people with disability? (Forster 2008) Question: Community rehabilitation services compared to hospital, clinic or facility based rehabilitation for elderly people with disability (Forster 2008) Settings: Comparison #2) in this review: Community rehabilitation services (domiciliary care) versus geriatric medical day hospital Bibliography (systematic reviews): 788_ Forster A, Young J, Lambley R, Langhorne P. Medical day hospital care for the elderly versus alternative forms of care. Cochrane Database of Systematic Reviews 2008, Issue 4. Art. No.: CD001730. DOI: 10.1002/14651858.CD001730.pub2.
Quality assessment № of patients Effect
Quality Importance № of studies
Study design
Risk of bias Inconsistency Indirectness Imprecision Other
considerations community
rehabilitation services
hospital, clinic or facility based
rehabilitation
Relative (95% CI)
Absolute (95% CI)
Access to rehabilitation services - not measured
- - - - - - - - - - CRITICAL
Utilization of rehabilitation services and continuity of care (assessed with: Death or institutional care by the end follow-up)
4 randomised trials
not serious 2
serious 3 not serious 4 serious 5 none 6 56/227 (24.7%)
48/216 (22.2%) OR 0.87 (0.54 to
1.4)
23 fewer per 1000 (from 63
more to 89 fewer) ⨁⨁◯◯
LOW
CRITICAL
Functional outcome (Death or deterioration in activity of daily living) (assessed with: end of follow up)
4 randomised trials
not serious
not serious 7 not serious 4 serious 5 none 6 89/227 (39.2%)
98/216 (45.4%) OR 1.34 (0.9 to 1.99)
73 more per 1000 (from 26 fewer to
169 more) ⨁⨁⨁◯
MODERATE
CRITICAL
Health outcomes e.g., mortality, morbidity, and quality of life (Death by the end of follow-up) (assessed with: Number of dead people at end of follow up)
5 randomised trials
not serious 2
not serious 8 not serious 4 serious 9 none 6 41/293 (14.0%)
35/290 (12.1%) OR 0.86 (0.52 to
1.42)
15 fewer per 1000 (from 42
more to 54 fewer) ⨁⨁⨁◯
MODERATE
CRITICAL
MD – mean difference, RR – relative risk 1. No evidence available 2. Method of randomisation A) Five trials reported a clear concealment of treatment allocation: Three used central site blind randomisation by computer generated randomisation schedules (Burch
1999; Hedrick 1993; Roderick 2001), block randomisation was used by Burch 1999 and Hedrick 1993, and three used sealed envelopes (Hui 1995; Gladman 1993; Vetter 1989). B) Six trials reported randomisation procedures which were probably but not clearly concealed: two used reference to random number tables (Tucker 1984;Woodford 1962);two used random permuted blocks (Eagle 1991; Young 1992); the methodology of randomisation was not reported in two trials(Cummings 1985; Weissert 1980).C) One trial (Pitkala 1991) allocated treatment according to the patient’s date of birth. Blinding of follow up This was definitely present in five trials (Burch 1999; Gladman 1993; Hedrick 1993; Roderick 2001; Tucker 1984; Young 1992). Completeness of follow up Incomplete follow up was for a minimum of 156 patients (5.6% of all randomised).
3. I-squre=58%, p=0.09 4. All studies were conducted in HIC. However, reproducing the intervention in LMIC is expected to be feasible and expected to give same results 5. 443 people total The point estimate includes the null hypothesis 6. Publication bias: their search strategy was extensive and included contacting the authors of papers relating to day hospital care around the world. Many of the authors of the published papers or
abstracts were able to provide additional information which has not been published previously. A funnel plot analysis (Egger 1997) did not show any major evidence of missing data. 7. I-square=40%; p=0.17 8. I-square=0%; p=0.44 9. 583 people total. The point estimate includes the null hypothesis

6
Summary of findings:
Community rehabilitation services compared to hospital/clinic or facility based rehabilitation for elderly people with disability (Forster 2008) Outcomes Anticipated absolute effects* (95% CI) Relative
effect (95% CI)
№ of participants (Studies)
Quality of the evidence (GRADE)
Comments
Risk with hospital, clinic or facility based rehabilitation
Risk with community rehabilitation services
Access to rehabilitation services - not measured
- -
Utilization of rehabilitation services and continuity of care assessed with: death or institutional care by the end follow-up
Study population - elderly people with disability OR 0.87 (0.54 to 1.4)
443 (4 RCTs)
⨁⨁◯◯ LOW 1 2 3 4
23 fewer per 1000 (from 63 more to 89 fewer). CI includes both benefit and harm. 222 per 1000 199 per 1000
(134 to 286)
Functional outcome assessed with: death or deterioration in activity of daily living
Study population - elderly people with disability OR 1.34 (0.9 to 1.99)
443 (4 RCTs)
⨁⨁⨁◯ MODERATE 2 3 4 5
73 more per 1000 (from 26 fewer to 169 more). CI includes both benefit and harm. 454 per 1000 527 per 1000
(428 to 623)
Health outcomes (Death) assessed with: number of dead people at end of follow up
Study population - elderly people with disability OR 0.86 (0.52 to 1.42)
583 (5 RCTs)
⨁⨁⨁◯ MODERATE 2 4 6 7
15 fewer per 1000 (from 42 more to 54 fewer). CI includes both benefit and harm. 121 per 1000 106 per 1000
(67 to 163)
*The risk in the intervention group (and its 95% confidence interval) is based on the assumed risk in the comparison group and the relative effect of the intervention (and its 95% CI). CI: Confidence interval; RR: Risk ratio; OR: Odds ratio;
1. I-square=58%, p=0.09 2. All studies were conducted in HIC. However, reproducing the intervention in LMIC is expected to be feasible and expected to give same results 3. 443 people total. The point estimate includes the null hypothesis 4. Publication bias: their search strategy was extensive and included contacting the authors of papers relating to day hospital care around the world. Many of the authors of
the published papers or abstracts were able to provide additional information which has not been published previously. A funnel plot analysis (Egger 1997) did not show any major evidence of missing data.
5. I-square=40%; p=0.17 6. I-square=0%; p=0.44 7. 583 people total. The point estimate includes the null hypothesis

7
Should home based rehabilitation vs. day hospital (clinic based outpatient care) be used for people with acquired brain injury (traumatic brain injury)? (Doig 2010) Question: Home based rehabilitation compared to day hospital (clinic based outpatient care) for people with acquired brain injury (traumatic brain injury) (Doig 2010) Settings: community services and hospitals Bibliography (systematic reviews): 620_Doig E, Fleming J, Kuipers P, Cornwell PL. Comparison of rehabilitation outcomes in day hospital and home settings for people with acquired brain injury - a systematic review. Disabil Rehabil. 2010;32(25):2061-77. doi: 10.3109/09638281003797356. Epub 2010 May 4. Review. PubMed PMID: 20441412.
Quality assessment № of patients
Impact Quality Importance № of studies
Study design
Risk of bias Inconsistency Indirectness Imprecision Other
considerations home based rehabilitation
day hospital (clinic based
outpatient care)
Access to rehabilitation services - not measured
- - - - - - - - - -
Rehabilitation outcomes (assessed with: activity of daily living in traumatic brain injury patients )
2 observational studies
serious 2 serious 4 serious 3 serious 5 none Outpatient rehabilitation programmes delivered at home, of short duration (3 months), recently discharged from hospital, is equivalent to day-hospital based out-patient rehabilitation programmes outcomes
⨁◯
◯
◯ VERY LOW
IMPORTANT
Health outcomes (e.g., mortality, morbidity, and quality of life) - not measured
- - - - - - - - - -
MD – mean difference, RR – relative risk 1. No evidence available 2. High risk of selection, performance and measurement bias (assessed by van Tulder tool) 3. Study conducted in high income countries. Reproducing the intervention in low and middle income countries is expected to be not feasible and not to give the same results 4. Variation in patient population (stroke and TBI), workforce (multidisciplinary and single), content of rehabilitation program, intensity and duration 5. Total number of participants=195; home=94; clinic=101

8
Summary of findings:
Home based rehabilitation compared to day hospital (clinic based outpatient care) for people with acquired brain injury (traumatic brain injury) (Doig 2010) Outcomes Impact № of participants
(Studies) Quality of the evidence (GRADE)
Access to rehabilitation services - not measured
- -
Rehabilitation outcomes assessed with: activity of daily living in traumatic brain injury patients
Outpatient rehabilitation programmes delivered at home, of short duration (3 months), recently discharged from hospital, is equivalent to day-hospital based out-patient rehabilitation programmes outcomes
195 (2 observational studies)
⨁◯◯◯ VERY LOW 2 3 4 5
Health outcomes (e.g., mortality, morbidity, and quality of life) - not measured
- -
*The risk in the intervention group (and its 95% confidence interval) is based on the assumed risk in the comparison group and the relative effect of the intervention (and its 95% CI). CI: Confidence interval; RR: Risk ratio; OR: Odds ratio;
1. No evidence available 2. High risk of selection, performance and measurement bias (assessed by van Tulder tool) 3. Study conducted in high income countries. Reproducing the intervention in low and middle income countries is expected to be not feasible and not to give the same results 4. Variation in patient population (stroke and TBI), workforce (multidisciplinary and single), content of rehabilitation program, intensity and duration 5. Total number of participants=195; home=94; clinic=101

9
Should home-based cardiac rehabilitation vs. centre-based be used for lower risk and stable patient following an acute myocardial infarction and revascularization? (Taylor 2010) Question: Home-based cardiac rehabilitation compared to centre-based for lower risk and stable patient following an acute myocardial infarction and revascularisation (Taylor 2010) Setting: home and hospital based rehabilitation Bibliography (systematic reviews): Taylor RS, Dalal H, Jolly K, Moxham T, Zawada A. Home-based versus centre-based cardiac rehabilitation. Cochrane Database Syst Rev. 2010 Jan 20;(1):CD007130. doi: 10.1002/14651858.CD007130.pub2. Review. PubMed PMID: 20091618; PubMed Central PMCID: PMC4160096. 427_Clark M, Kelly T, Deighan C. A systematic review of the Heart Manual literature. Eur J Cardiovasc Nurs. 2011 Mar;10(1):3-13. doi: 10.1016/j.ejcnurse.2010.03.003. Epub 2010 May 6. Review. PubMed PMID: 20451459. 1194_ Jolly K, Taylor RS, Lip GY, Stevens A. Home-based cardiac rehabilitation compared with centre-based rehabilitation and usual care: a systematic review and meta-analysis. Int J Cardiol. 2006 Aug 8;111(3):343-51. Epub 2005 Nov 28.Review. PubMed PMID: 16316695.
Quality assessment № of patients Effect
Quality Importance № of
studies Study design
Risk of bias Inconsistency Indirectness Imprecision Other
considerations home-based
cardiac rehabilitation
centre-based
Relative (95% CI)
Absolute (95% CI)
Access to rehabilitation services - not measured
- - - - - - - - see comment
not estimable
see comment -
Utilization of rehabilitation services and continuity of care (assessed with: Adherence: Number of participants with outcome data at end of follow-up)
13 randomised trials
serious 2 not serious 3 serious 4 serious 5 none 760/840 (90.5%)
692/780 (88.7%)
RR 1.02 (0.99 to
1.06)
18 more per 1000 (from 9 fewer to 53 more) ⨁◯
◯◯ VERY LOW
IMPORTANT
Rehabilitation outcomes (e.g., prevention or slowing of the loss of function, improvement or restoration of function, compensation for lost function) (assessed with: short-term exercise capacity (3 to 12 months; 1,938 patients))
14 randomised trials
serious 2 serious 6 serious 7 serious 8 none 817 740 - SMD 0.11 lower (0.35 lower to 0.13 higher) ⨁◯
◯◯ VERY LOW
CRITICAL
Rehabilitation outcomes (e.g., prevention or slowing of the loss of function, improvement or restoration of function, compensation for lost function) (assessed with: long-term exercise capacity (12 to 24 months; 1,074 patients))
3 randomised trials
not serious
not serious 9 serious 10 serious 11 none 542 532 - SMD 0.11 higher (0.01 lower to 0.23 higher) ⨁⨁
◯◯ LOW
CRITICAL
Health outcomes (assessed with: Mortality at 3 to 12 months follow up)
4 randomised trials
serious 2 not serious 12 serious 10 serious 13 none 20/490 (4.1%) 11/419 (2.6%)
RR 1.31 (0.65 to
2.66)
8 more per 1000 (from 9 fewer to 44 more) ⨁◯
◯◯ VERY LOW
CRITICAL
MD – mean difference, RR – relative risk 1. No evidence available 2. Risk of performance and attrition bias, uncertain assessment from studies. 3. I-square=0%; p=<0.46 4. All participants are from high (12) and middle high income countries (2). Reproducing the intervention in LMIC is not expected to be feasible and also not expected to give same results. 5. Total number of participants: 1,620 home: 840; centre: 780 6. I-square=79%; p<0.00001 7. All participants are from high and middle high income countries (2). Reproducing the intervention in LMIC is not expected to be feasible and also not expected to give same results. 8. Total number of participants: 1,557. Small effect and null hypothesis 9. I-square=0%; p= 0.62 10. All participants are from high and middle high income countries (2). Reproducing the intervention in LMIC is not expected to be feasible and also not expected to give same results 11. Total number of participants: 1,074 Home: 542; centre: 532 12. I-square=0%; p = 0.8 13. Total number of participants: 909 Home: 490; centre: 419

10
Summary of findings:
Home-based cardiac rehabilitation compared to centre-based for lower risk and stable patient following an acute myocardial infarction and revascularisation (Taylor 2010) Patient or population: lower risk and stable patient following an acute myocardial infarction and revascularisation (Taylor 2010) Setting: home and hospital based rehabilitation Intervention: home-based cardiac rehabilitation Comparison: centre-based
Outcomes Anticipated absolute effects* (95% CI) Relative effect (95% CI)
№ of participants (Studies)
Quality of the evidence (GRADE)
Comments
Risk with centre-based Risk with home-based cardiac rehabilitation
Access to rehabilitation services - not measured
see comment see_comment not estimable
- -
Utilization of rehabilitation services and continuity of care assessed with: Adherence: Number of participants with outcome data at end of follow-up
Study population RR 1.02 (0.99 to 1.06)
1620 (13 RCTs)
⨁◯◯◯ VERY LOW 2 3 4 5
887 per 1000 905 per 1000 (878 to 940)
Rehabilitation outcomes (e.g., prevention or slowing of the loss of function, improvement or restoration of function, compensation for lost function) assessed with: short-term exercise capacity (3 to 12 months; 1,938 patients)
The mean rehabilitation outcomes (e.g., prevention or slowing of the loss of function, improvement or restoration of function, compensation for lost function) in the control group was 0
The mean rehabilitation outcomes (e.g., prevention or slowing of the loss of function, improvement or restoration of function, compensation for lost function) in the intervention group was 0.11 standard deviations lower (0.35 lower to 0.13 higher)
- 1557 (14 RCTs)
⨁◯◯◯ VERY LOW 2 6 7 8
Rehabilitation outcomes (e.g., prevention or slowing of the loss of function, improvement or restoration of function, compensation for lost function) (Rehabilitation outcomes) assessed with: long-term exercise capacity (12 to 24 months; 1,074 patients)
The mean rehabilitation outcomes (e.g., prevention or slowing of the loss of function, improvement or restoration of function, compensation for lost function) in the control group was 0
The mean rehabilitation outcomes (e.g., prevention or slowing of the loss of function, improvement or restoration of function, compensation for lost function) in the intervention group was 0.11 standard deviations higher (0.01 lower to 0.23 higher)
- 1074 (3 RCTs)
⨁⨁◯◯ LOW 9 10 11
Health outcomes assessed with: Mortality at 3 to 12 months follow up
Study population RR 1.31 (0.65 to 2.66)
909 (4 RCTs)
⨁◯◯◯ VERY LOW 2 10 12 13
26 per 1000 34 per 1000 (17 to 70)
*The risk in the intervention group (and its 95% confidence interval) is based on the assumed risk in the comparison group and the relative effect of the intervention (and its 95% CI). CI: Confidence interval; RR: Risk ratio; OR: Odds ratio;
GRADE Working Group grades of evidence

11
Summary of findings:
Home-based cardiac rehabilitation compared to centre-based for lower risk and stable patient following an acute myocardial infarction and revascularisation (Taylor 2010) Patient or population: lower risk and stable patient following an acute myocardial infarction and revascularisation (Taylor 2010) Setting: home and hospital based rehabilitation Intervention: home-based cardiac rehabilitation Comparison: centre-based
Outcomes Anticipated absolute effects* (95% CI) Relative effect (95% CI)
№ of participants (Studies)
Quality of the evidence (GRADE)
Comments
Risk with centre-based Risk with home-based cardiac rehabilitation
High quality: We are very confident that the true effect lies close to that of the estimate of the effect Moderate quality: We are moderately confident in the effect estimate: The true effect is likely to be close to the estimate of the effect, but there is a possibility that it is substantially different Low quality: Our confidence in the effect estimate is limited: The true effect may be substantially different from the estimate of the effect Very low quality: We have very little confidence in the effect estimate: The true effect is likely to be substantially different from the estimate of effect

12
Should multidisciplinary care after hospital discharge vs. usual or routine care be used for stroke patients living in the community? (Fens 2013) Question: Multidisciplinary care after hospital discharge compared to usual or routine care for stroke patients living in the community (Fens 2013) Settings: Community services Bibliography (systematic reviews): 746_Fens M, Vluggen T, van Haastregt JC, Verbunt JA, Beusmans GH, van Heugten CM. Multidisciplinary care for stroke patients living in the community: a systematic review. J Rehabil Med. 2013 Apr;45(4):321-30. doi: 10.2340/16501977-1128. Review. PubMed PMID: 23546307.
Quality assessment № of patients
Impact Quality Importance № of studies
Study design
Risk of bias Inconsistency Indirectness Imprecision Other
considerations
multidisciplinary care after hospital
discharge
usual or
routine care
Access to rehabilitation services - not measured
- - - - - - - - - -
Utilization of health care and continuity of care - not measured
- - - - - - - - - -
Rehabilitation outcomes (e.g., prevention or slowing of the loss of function, improvement or restoration of function, compensation for lost function) (follow up: range 1 to 6 months; assessed with: activities of daily living using the Barthel Index, Frenchay Activities Index,, extended Activities of Daily Activities, Functional Independence Measure, Instrumental Activity Measure, Assessment of Motor and Process Skills, Mental Component Summary/Physical Component Summary, and Katz Index,)
11 randomised trials
serious 2 serious 3 serious 4 serious 5 none None of these studies found an effect of the intervention on daily activities. ⨁
◯
◯
◯ VERY LOW
CRITICAL
Health outcomes (e.g., mortality, morbidity, and quality of life) (assessed with: quality of life, using the Euroqol-5D, Stroke Adapted-Sickness Impact Profile, SF36, Stroke Specific Quality of Life Scale and/or Sickness Impact Profile )
8 randomised trials
serious 2 serious 3 serious 4 serious 6 none Out of 8 RCTs, two reported favourable effects of the assessment followed by intervention on quality of life. There is little evidence for the effectiveness of multidisciplinary care for stroke patients being discharged home. Additional research should provide more insight into potentially effective multidisciplinary care for community living stroke patients.
⨁◯
◯
◯ VERY LOW
CRITICAL
MD – mean difference, RR – relative risk 1. No evidence available 2. High risk of selection bias, measurement bias and attrition bias 3. Authors report on considerable variation in the duration of assessment and follow up visits, outcomes measures and interventions 4. All studies were conducted in HIC: UK, US, Canada, the Netherlands, Sweden. Reproducing the intervention in LMIC is not expected to be feasible nor expected to give same results 5. Number of participants per study group 6. Number of participants per group

13
Summary of findings:
Multidisciplinary care after hospital discharge compared to usual or routine care for stroke patients living in the community (Fens 2013) Outcomes Impact № of
participants (Studies)
Quality of the evidence (GRADE)
Access to rehabilitation services - not measured - -
Utilization of health care and continuity of care - not measured - -
Rehabilitation outcomes (e.g., prevention or slowing of the loss of function, improvement or restoration of function, compensation for lost function) assessed with: activities of daily living using the Barthel Index, Frenchay Activities Index,, extended Activities of Daily Activities, Functional Independence Measure, Instrumental Activity Measure, Assessment of Motor and Process Skills, Mental Component Summary/Physical Component Summary, and Katz Index, follow up: range 1 to 6 months
None of these studies found an effect of the intervention on daily activities.
(11 RCTs) ⨁◯◯◯ VERY LOW 2 3 4 5
Health outcomes (e.g., mortality, morbidity, and quality of life) assessed with: quality of life, using the Euroqol-5D, Stroke Adapted-Sickness Impact Profile, SF36, Stroke Specific Quality of Life Scale and/or Sickness Impact Profile
Out of 8 RCTs, two reported favourable effects of the assessment followed by intervention on quality of life. There is little evidence for the effectiveness of multidisciplinary care for stroke patients being discharged home. Additional research should provide more insight into potentially effective multidisciplinary care for community living stroke patients.
(8 RCTs) ⨁◯◯◯ VERY LOW 2 3 4 6
*The risk in the intervention group (and its 95% confidence interval) is based on the assumed risk in the comparison group and the relative effect of the intervention (and its 95% CI). CI: Confidence interval; RR: Risk ratio; OR: Odds ratio;
1. No evidence available 2. High risk of selection bias, measurement bias and attrition bias 3. Authors report on considerable variation in the duration of assessment and follow up visits, outcomes measures and interventions 4. All studies were conducted in HIC: UK, US, Canada, the Netherlands, Sweden. Reproducing the intervention in LMIC is not expected to be feasible nor expected to give
same results 5. Number of participants per study group 6. Number of participants per group
14
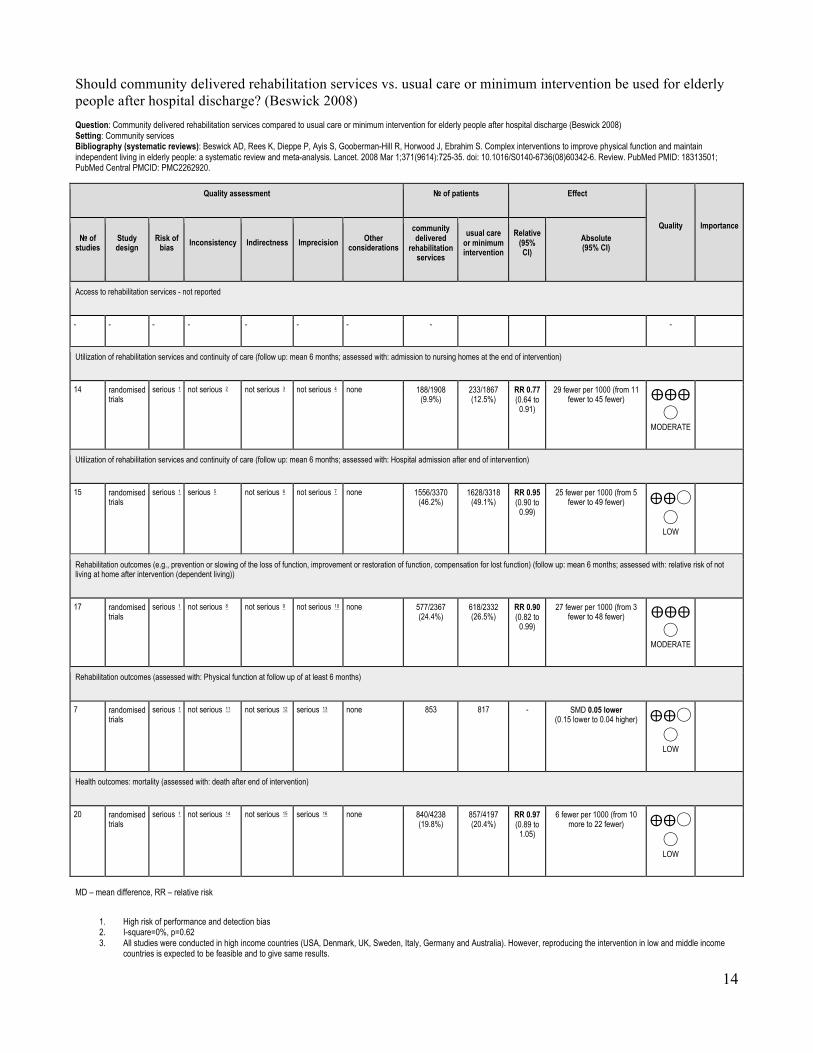
Should community delivered rehabilitation services vs. usual care or minimum intervention be used for elderly people after hospital discharge? (Beswick 2008) Question: Community delivered rehabilitation services compared to usual care or minimum intervention for elderly people after hospital discharge (Beswick 2008) Setting: Community services Bibliography (systematic reviews): Beswick AD, Rees K, Dieppe P, Ayis S, Gooberman-Hill R, Horwood J, Ebrahim S. Complex interventions to improve physical function and maintain independent living in elderly people: a systematic review and meta-analysis. Lancet. 2008 Mar 1;371(9614):725-35. doi: 10.1016/S0140-6736(08)60342-6. Review. PubMed PMID: 18313501; PubMed Central PMCID: PMC2262920.
Quality assessment № of patients Effect
Quality Importance № of
studies Study design
Risk of bias Inconsistency Indirectness Imprecision Other
considerations
community delivered
rehabilitation services
usual care or minimum intervention
Relative (95% CI)
Absolute (95% CI)
Access to rehabilitation services - not reported
- - - - - - - - -
Utilization of rehabilitation services and continuity of care (follow up: mean 6 months; assessed with: admission to nursing homes at the end of intervention)
14 randomised trials
serious 1 not serious 2 not serious 3 not serious 4 none 188/1908 (9.9%)
233/1867 (12.5%)
RR 0.77 (0.64 to
0.91)
29 fewer per 1000 (from 11 fewer to 45 fewer) ⨁⨁⨁
◯ MODERATE
Utilization of rehabilitation services and continuity of care (follow up: mean 6 months; assessed with: Hospital admission after end of intervention)
15 randomised trials
serious 1 serious 5 not serious 6 not serious 7 none 1556/3370 (46.2%)
1628/3318 (49.1%)
RR 0.95 (0.90 to
0.99)
25 fewer per 1000 (from 5 fewer to 49 fewer) ⨁⨁◯
◯ LOW
Rehabilitation outcomes (e.g., prevention or slowing of the loss of function, improvement or restoration of function, compensation for lost function) (follow up: mean 6 months; assessed with: relative risk of not living at home after intervention (dependent living))
17 randomised trials
serious 1 not serious 8 not serious 9 not serious 10 none 577/2367 (24.4%)
618/2332 (26.5%)
RR 0.90 (0.82 to
0.99)
27 fewer per 1000 (from 3 fewer to 48 fewer) ⨁⨁⨁
◯ MODERATE
Rehabilitation outcomes (assessed with: Physical function at follow up of at least 6 months)
7 randomised trials
serious 1 not serious 11 not serious 12 serious 13 none 853 817 - SMD 0.05 lower (0.15 lower to 0.04 higher) ⨁⨁◯
◯ LOW
Health outcomes: mortality (assessed with: death after end of intervention)
20 randomised trials
serious 1 not serious 14 not serious 15 serious 16 none 840/4238 (19.8%)
857/4197 (20.4%)
RR 0.97 (0.89 to
1.05)
6 fewer per 1000 (from 10 more to 22 fewer) ⨁⨁◯
◯ LOW
MD – mean difference, RR – relative risk
1. High risk of performance and detection bias 2. I-square=0%, p=0.62 3. All studies were conducted in high income countries (USA, Denmark, UK, Sweden, Italy, Germany and Australia). However, reproducing the intervention in low and middle income
countries is expected to be feasible and to give same results.

15
4. Total number of participants=3775; community services=1908; usual care=1867. 95% CI does not include the null hypothesis. 5. I-square=57%, p=0.003 6. All studies were conducted in high income countries (USA, UK, Denmark, Sweden, Italy, Germany and Australia). However, this intervention is likely to be replicated in low and middle
income countries. 7. Total number of participants=6688; community services=3370; usual care=3318 8. I-square=2.2%, p=0.43 9. All studies were conducted in high income countries (USA, UK, Denmark, Germany, Australia, Sweden, Italy and Hong Kong). However, reproducing the intervention in low and
middle income countries is expected to be feasible and to give same results 10. Large sample size=4,699; community services=2367; usual care=2332 11. I-square=0%, p=0.72 12. All studies were conducted in high income countries (USA, Australia, Germany, Sweden, Hong Kong). However, reproducing the intervention in low and middle income countries is
expected to be feasible and to give same results 13. Total number of participants=1670; community services=853; usual care=817. The point estimate includes the null hypothesis 14. I-square=5.2%, p=0.43 15. All studies were conducted in high income countries (USA, UK, Australia, Denmark, Germany, Sweden and Italy). However, reproducing the intervention in low and middle income
countries is expected to be feasible and to give similar results 16. Confidence interval includes null hypothesis. Large total sample size=8435
Summary of findings:
Community delivered rehabilitation services compared to usual care or minimum intervention for elderly people after hospital discharge (Beswick 2008) Patient or population: elderly people after hospital discharge (Beswick 2008) Setting: Community services Intervention: community delivered rehabilitation services Comparison: usual care or minimum intervention
Outcomes Anticipated absolute effects* (95% CI) Relative effect (95% CI)
№ of participants (Studies)
Quality of the evidence (GRADE)
Comments
Risk with usual care or minimum intervention
Risk with community delivered rehabilitation services
Access to rehabilitation services - not reported
- -
Utilization of rehabilitation services and continuity of care (Utilization of rehabilitation) assessed with: admission to nursing homes at the end of intervention follow up: mean 6 months
RR 0.77 (0.64 to 0.91)
3775 (14 RCTs)
⨁⨁⨁◯ MODERATE 1 2 3 4
Significant more admissions to nursing homes with usual care.
125 per 1000
96per1000 (80to114)
Utilization of rehabilitation services and continuity of care (Utilization of rehabilitation ) assessed with: Hospital admission after end of intervention follow up: mean 6 months
RR 0.95 (0.90 to 0.99)
6688 (15 RCTs)
⨁⨁◯◯ LOW 1 5 6 7
Significant more hospital admissions with usual care.
491 per 1000
466per1000 (442to486)
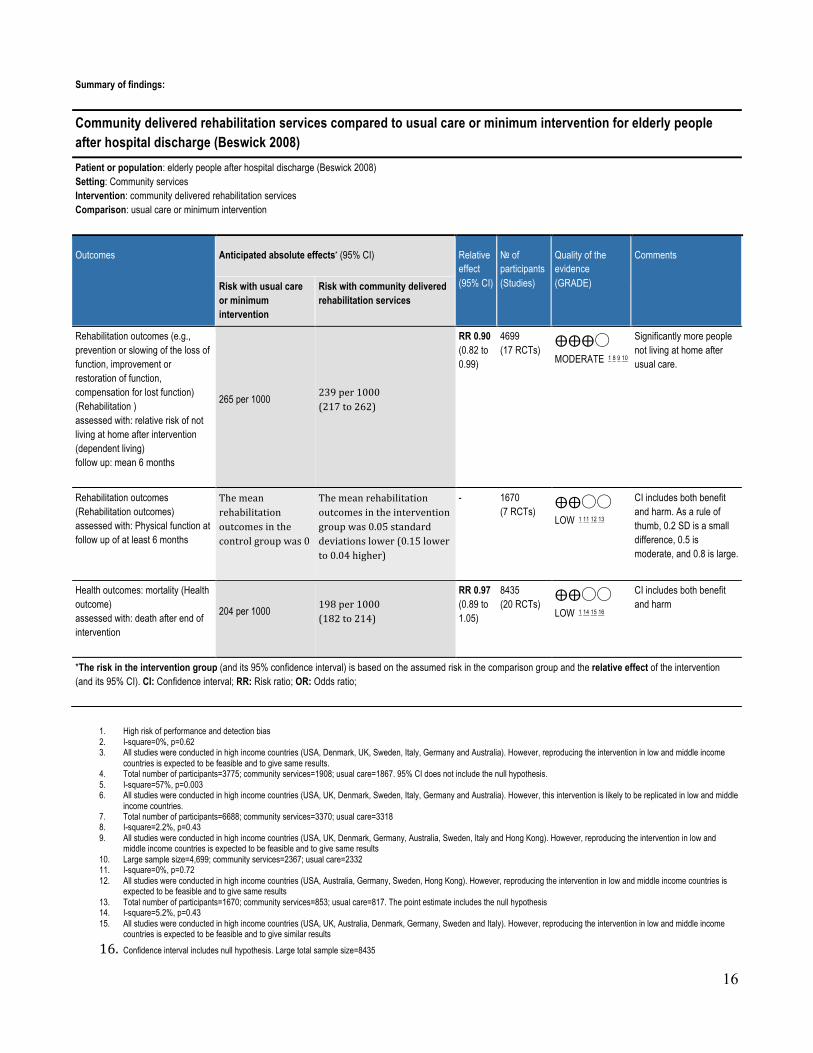
16
Summary of findings:
Community delivered rehabilitation services compared to usual care or minimum intervention for elderly people after hospital discharge (Beswick 2008) Patient or population: elderly people after hospital discharge (Beswick 2008) Setting: Community services Intervention: community delivered rehabilitation services Comparison: usual care or minimum intervention
Outcomes Anticipated absolute effects* (95% CI) Relative effect (95% CI)
№ of participants (Studies)
Quality of the evidence (GRADE)
Comments
Risk with usual care or minimum intervention
Risk with community delivered rehabilitation services
Rehabilitation outcomes (e.g., prevention or slowing of the loss of function, improvement or restoration of function, compensation for lost function) (Rehabilitation ) assessed with: relative risk of not living at home after intervention (dependent living) follow up: mean 6 months
265 per 1000 239per1000 (217to262)
RR 0.90 (0.82 to 0.99)
4699 (17 RCTs)
⨁⨁⨁◯ MODERATE 1 8 9 10
Significantly more people not living at home after usual care.
Rehabilitation outcomes (Rehabilitation outcomes) assessed with: Physical function at follow up of at least 6 months
Themeanrehabilitationoutcomesinthecontrolgroupwas0
Themeanrehabilitationoutcomesintheinterventiongroupwas0.05standarddeviationslower(0.15lowerto0.04higher)
- 1670 (7 RCTs)
⨁⨁◯◯ LOW 1 11 12 13
CI includes both benefit and harm. As a rule of thumb, 0.2 SD is a small difference, 0.5 is moderate, and 0.8 is large.
Health outcomes: mortality (Health outcome) assessed with: death after end of intervention
204 per 1000 198per1000 (182to214)
RR 0.97 (0.89 to 1.05)
8435 (20 RCTs)
⨁⨁◯◯ LOW 1 14 15 16
CI includes both benefit and harm
*The risk in the intervention group (and its 95% confidence interval) is based on the assumed risk in the comparison group and the relative effect of the intervention (and its 95% CI). CI: Confidence interval; RR: Risk ratio; OR: Odds ratio;
1. High risk of performance and detection bias 2. I-square=0%, p=0.62 3. All studies were conducted in high income countries (USA, Denmark, UK, Sweden, Italy, Germany and Australia). However, reproducing the intervention in low and middle income
countries is expected to be feasible and to give same results. 4. Total number of participants=3775; community services=1908; usual care=1867. 95% CI does not include the null hypothesis. 5. I-square=57%, p=0.003 6. All studies were conducted in high income countries (USA, UK, Denmark, Sweden, Italy, Germany and Australia). However, this intervention is likely to be replicated in low and middle
income countries. 7. Total number of participants=6688; community services=3370; usual care=3318 8. I-square=2.2%, p=0.43 9. All studies were conducted in high income countries (USA, UK, Denmark, Germany, Australia, Sweden, Italy and Hong Kong). However, reproducing the intervention in low and
middle income countries is expected to be feasible and to give same results 10. Large sample size=4,699; community services=2367; usual care=2332 11. I-square=0%, p=0.72 12. All studies were conducted in high income countries (USA, Australia, Germany, Sweden, Hong Kong). However, reproducing the intervention in low and middle income countries is
expected to be feasible and to give same results 13. Total number of participants=1670; community services=853; usual care=817. The point estimate includes the null hypothesis 14. I-square=5.2%, p=0.43 15. All studies were conducted in high income countries (USA, UK, Australia, Denmark, Germany, Sweden and Italy). However, reproducing the intervention in low and middle income
countries is expected to be feasible and to give similar results
16. Confidence interval includes null hypothesis. Large total sample size=8435

17
Should Community rehabilitation services (shared care) vs. either primary or specialty care alone be used for a variety of chronic conditions? (Smith 2007) Question: Community rehabilitation services (shared care) compared to either primary or specialty care alone for a variety of chronic conditions (Smith 2007) Settings: Community services Bibliography (systematic reviews): 2259_Smith SM, Allwright S, O’Dowd T. Effectiveness of shared care across the interface between primary and specialty care in chronic disease management. Cochrane Database of Systematic Reviews 2007, Issue 3. Art. No.: CD004910. DOI: 10.1002/14651858.CD004910.pub2.
Quality assessment № of patients Effect
Quality Importance № of studies
Study design
Risk of bias Inconsistency Indirectness Imprecision Other
considerations
Community rehabilitation
services (shared care)
either primary
or specialty
care alone
Relative (95% CI)
Absolute (95% CI)
Access to rehabilitation services (assessed with: perception of met and unmet needs)
1 randomised trials
serious 1 not serious 2 serious 3 serious 4 none /177 /145 Intervention (mean) 1.49 Control group (mean) 1.31 No standard deviation available Absolute difference 0.18 Relative difference 14%
⨁◯◯◯
VERY LOW
IMPORTANT
Utilization of rehabilitation services and continuity of care (assessed with: Proportion of patients attending pulmonary rehabilitation recommended to them as part of the intervention.)
1 randomised trials
serious 1 not serious 2 serious 5 serious 6 none 38/83 (45.8%) 11/52 (21.2%)
OR 0.462 (0.2171 to
0.9834)
10 fewer per 100 (from 0 fewer to 16 fewer) ⨁◯
◯◯ VERY LOW
IMPORTANT
Utilization of rehabilitation services and continuity of care (assessed with: hospital admissions)
6 randomised trials
serious 1 serious 7 serious 8 serious 9 none /834 /834 Mixed results, but consistent with shared care being associated with a reduction in hospital admissions in older patients and in those with higher levels of baseline morbidity.
⨁◯◯◯
VERY LOW
IMPORTANT
Rehabilitation outcomes (e.g., prevention or slowing of the loss of function, improvement or restoration of function, compensation for lost function) (assessed with: Functional impairment and disability)
4 randomised trials
serious 1 serious 7 serious 10 serious 11 none /1438 /1439 One trial found no difference in the mean number of nights of disturbed sleep per week or the mean number of days of restricted activity per month. Two trials found a statistically significant benefit for shared-care in relation to functional impairment. One trial reported on eight dimensions of the SF36 score (but did not include social functioning) and found no significant difference between groups overall.
⨁◯◯◯
VERY LOW
Health outcomes (e.g., mortality, morbidity, and quality of life) (assessed with: Well-being and Quality of Life)
5 randomised trials
serious 1 serious 7 serious 12 serious 13 none /1358 /1359 Five studies reported measures relating to quality of life and wellbeing ; three of these reported significant benefit for shared care. Two trials indicated a statistically significant benefit in favour of shared care. One trial reported a ’lack of well-being’ score and found no significant difference between groups. The fifth study looked at changes in quality of life scores from baseline and reported these as being significantly improved in the shared care group for physical scores with a non-significant difference for emotional scores
⨁◯◯◯
VERY LOW
CRITICAL
MD – mean difference, RR – relative risk 1. High risk of performance, detection and measurement biasses 2. Single study only. Inconsistency does not apply 3. Study conducted in high income country (UK), and reproducing the intervention in low and middle income countries is not expected to be feasible and not to give the same results 4. Small sample size. Total number of participants=322; shared care=177; control=145 5. Study conducted in high income country (New Zealand). Reproducing the intervention in low and middle income countries is not expected to be feasible and not to give the same results 6. Small sample size. Total number of participants=135; shared care=83; control=52 7. Conflicting conclusions

18
8. Studies conducted in high income countries (UK, New Zealand and Sweden). Reproducing the intervention in low and middle income countries is not expected to be feasible and not to give the same results
9. Small sample size. Total number of patients=1668. 10. Studies conducted in high income countries (UK, US, New Zealand). Reproducing the intervention in low and in middle income countries is not expected to be feasible and not to give the same
results 11. Small sample size. Total number of participants=2877 12. Studies conducted in high income countries (UK, New Zealand, US and Ireland). Reproducing the intervention in low and middle income countries is not expected to be feasible and not to give the
same results 13. Small sample size. Total number of participants=2717
Summary of findings:
Community rehabilitation services (shared care) compared to either primary or specialty care alone for a variety of chronic conditions (Smith 2007) Outcomes Anticipated absolute effects* (95% CI) Relative
effect (95% CI)
№ of participants (Studies)
Quality of the evidence (GRADE)
Comments
Risk with either primary or specialty care alone
Risk with Community rehabilitation services (shared care)
Access to rehabilitation services assessed with: perception of met and unmet needs
Intervention (mean) 1.49 Control group (mean) 1.31 No standard deviation available Absolute difference 0.18 Relative difference 14%
322 (1 RCT) ⨁◯◯◯
VERY LOW 1 2 3 4
Utilization of rehabilitation services and continuity of care assessed with: Proportion of patients attending pulmonary rehabilitation recommended to them as part of the intervention.
Study population OR 0.462 (0.2171 to 0.9834)
135 (1 RCT) ⨁◯◯◯
VERY LOW 1 2 5 6
21 per 100 11 per 100 (6 to 21)
Utilization of rehabilitation services and continuity of care assessed with: hospital admissions
Mixed results, but consistent with shared care being associated with a reduction in hospital admissions in older patients and in those with higher levels of baseline morbidity.
1668 (6 RCTs) ⨁◯◯◯
VERY LOW 1 7 8 9
Rehabilitation outcomes (e.g., prevention or slowing of the loss of function, improvement or restoration of function, compensation for lost function) assessed with: Functional impairment and disability
One trial found no difference in the mean number of nights of disturbed sleep per week or the mean number of days of restricted activity per month. Two trials found a statistically significant benefit for shared-care in relation to functional impairment. One trial reported on eight dimensions of the SF36 score (but did not include social functioning) and found no significant difference between groups overall.
2877 (4 RCTs) ⨁◯◯◯
VERY LOW 1 7 10 11
Health outcomes (e.g., mortality, morbidity, and quality of life) assessed with: Well-being and Quality of Life
Five studies reported measures relating to quality of life and wellbeing ; three of these reported significant benefit for shared care. Two trials indicated a statistically significant benefit in favour of shared care. One trial reported a ’lack of well-being’ score and found no significant difference between groups. The fifth study looked at changes in quality of life scores from baseline and reported these as being significantly improved in the shared care group for physical scores with a non-significant difference for emotional scores
2717 (5 RCTs) ⨁◯◯◯
VERY LOW 1 7 12 13
*The risk in the intervention group (and its 95% confidence interval) is based on the assumed risk in the comparison group and the relative effect of the intervention (and its 95% CI). CI: Confidence interval; RR: Risk ratio; OR: Odds ratio;
1. High risk of performance, detection and measurement biasses 2. Single study only. Inconsistency does not apply 3. Study conducted in high income country (UK), and reproducing the intervention in low and middle income countries is not expected to be feasible and not to give the same
results 4. Small sample size. Total number of participants=322; shared care=177; control=145 5. Study conducted in high income country (New Zealand). Reproducing the intervention in low and middle income countries is not expected to be feasible and not to give the
same results 6. Small sample size. Total number of participants=135; shared care=83; control=52 7. Conflicting conclusions 8. Studies conducted in high income countries (UK, New Zealand and Sweden). Reproducing the intervention in low and middle income countries is not expected to be
feasible and not to give the same results

19
9. Small sample size. Total number of patients=1668. 10. Studies conducted in high income countries (UK, US, New Zealand). Reproducing the intervention in low and in middle income countries is not expected to be feasible and
not to give the same results 11. Small sample size. Total number of participants=2877 12. Studies conducted in high income countries (UK, New Zealand, US and Ireland). Reproducing the intervention in low and middle income countries is not expected to be
feasible and not to give the same results 13. Small sample size. Total number of participants=2717

20
Should Community rehabilitation services vs. hospital/clinic or facility based rehabilitation be used for people with major depression? (Bortolotti 2008) Question: Community rehabilitation services compared to hospital/ clinic or facility based rehabilitation for people with major depression (Bortolotti 2008) Bibliography (systematic reviews): 233_Bortolotti B, Menchetti M, Bellini F, Montaguti MB, Berardi D. Psychological interventions for major depression in primary care: a meta-analytic review of randomized controlled trials. Gen Hosp Psychiatry. 2008 Jul-Aug;30(4):293-302. doi: 10.1016/j.genhosppsych.2008.04.001. Review. PubMed PMID: 18585531.
Quality assessment № of patients Effect
Quality Importance № of studies
Study design
Risk of bias Inconsistency Indirectness Imprecision Other
considerations Community
rehabilitation services
hospital/ clinic or facility based rehabilitation
Relative (95% CI)
Absolute (95% CI)
Access to rehabilitation services - not measured
- - - - - - - - - -
Utilization of rehabilitation services and continuity of care - not measured
- - - - - - - - - -
Rehabilitation outcomes (e.g., prevention or slowing of the loss of function, improvement or restauration of function, compensation for lost function) - not measured
- - - - - - - - - -
Short term health outcomes (e.g., mortality, morbidity, and quality of life): depressive symptoms, quality of life and patient satisfaction after follow-up (1-6 months) (assessed with: Depressive symptoms, quality of life and patient satisfaction at 1-6 months)
6 randomised trials
not serious 2
not serious 3 not serious 4 serious 5 none 6 400 247 - SMD 0.42 lower (0.59 lower to
0.26 lower) ⨁⨁⨁◯
MODERATE
CRITICAL
Long term health outcomes (e.g., mortality, morbidity, and quality of life): depressive symptoms, quality of life and patient satisfaction after end of follow-up (>6 months) (assessed with: Depressive symptoms measured > 6 months follow up)
6 randomised trials
not serious 2
serious 7 not serious 4 serious 8 none 6 433 294 - SMD 0.3 lower (0.45 lower to
0.14 lower) ⨁⨁◯◯
LOW
CRITICAL
MD – mean difference, RR – relative risk 1. No evidence available 2. The study's quality scores varied from 24 to 37. Three studies showed a score of < 30 due to several methodological limitations (small sample size; poor description of refusals, withdrawals and
sociodemographic characteristics; and incomplete statistical analyses for dropouts) 3. I-square=0%; p=0.57 4. All studies were conducted in high income countries, however, these effects could be reproduced in LMIC 5. The total sample size is 647, but the point estimate is -0.42 (95% CI: -0.59 to -0.26) 6. No formal assessment for risk of publication bias, however, authors have no suspicion of publication bias 7. I-squre=70.9%; p=0.0004 8. Total sample size is 433+294=727, but the point estimate is very low -0.3

21
Summaryoffindings:Communityrehabilitationservicesversushospital/clinicforpeoplewithseveredepression(Bortolotti2008)Outcomes Anticipated absolute effects* (95% CI) Relative
effect (95% CI)
№ of participants (Studies)
Quality of the evidence (GRADE)
Comments
Risk with hospital/ clinic or facility based rehabilitation
Risk with Community rehabilitation services
Access to rehabilitation services - not measured
- -
Utilization of rehabilitation services and continuity of care - not measured
- -
Rehabilitation outcomes (e.g., prevention or slowing of the loss of function, improvement or restauration of function, compensation for lost function) - not measured
- -
Health outcome assessed with: Depressive symptoms, quality of life and patient satisfaction follow up: range 1 to 6 months
The mean health outcome in the intervention group was 0.42 standard deviations lower (0.59 lower to 0.26 lower)
- 647 (6 RCTs)
⨁⨁⨁◯ MODERATE 1 2 3 4 5
Significant reduction in depressive symptoms with community rehabilitation services. As a rule of thumb, 0.2 SD is a small difference, 0.5 is moderate, and 0.8 is large.
Health outcomes assessed with: Depressive symptoms follow up: mean 6 months
The mean health outcomes in the intervention group was 0.3 standard deviations lower (0.45 lower to 0.14 lower)
- 727 (6 RCTs)
⨁⨁◯◯ LOW 1 3 5 6 7
Significant reduction in depressive symptoms with community rehabilitation services. As a rule of thumb, 0.2 SD is a small difference, 0.5 is moderate, and 0.8 is large.
*The risk in the intervention group (and its 95% confidence interval) is based on the assumed risk in the comparison group and the relative effect of the intervention (and its 95% CI). CI: Confidence interval; RR: Risk ratio; OR: Odds ratio;
1. The studies” quality scores varied from 24 to 37. Three studies showed a score of < 30 due to several methodological limitations (small sample size; poor description of refusals, withdrawals and socio-demographic characteristics; and incomplete statistical analyses for dropouts)
2. I-square=0%; p=0.57 3. All studies were conducted in high income countries, however, these effects could be reproduced in LMIC 4. The total sample size is 647, but the point estimate is -0.42 (95% CI: -0.59 to -0.26) 5. No formal assessment for risk of publication bias, however, authors have no suspicion of publication bias 6. I-square=70.9%; p=0.0004 7. Total sample size is 433+294=727, but the point estimate is very low -0.3
22
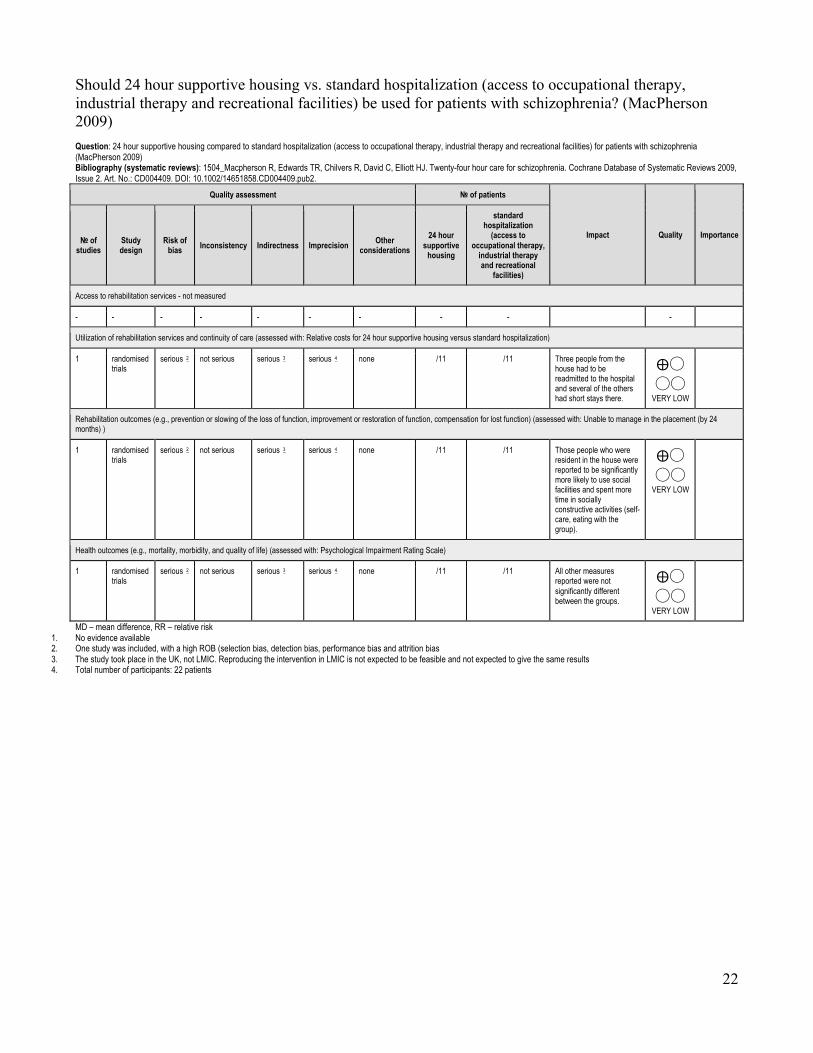
Should 24 hour supportive housing vs. standard hospitalization (access to occupational therapy, industrial therapy and recreational facilities) be used for patients with schizophrenia? (MacPherson 2009) Question: 24 hour supportive housing compared to standard hospitalization (access to occupational therapy, industrial therapy and recreational facilities) for patients with schizophrenia (MacPherson 2009) Bibliography (systematic reviews): 1504_Macpherson R, Edwards TR, Chilvers R, David C, Elliott HJ. Twenty-four hour care for schizophrenia. Cochrane Database of Systematic Reviews 2009, Issue 2. Art. No.: CD004409. DOI: 10.1002/14651858.CD004409.pub2.
Quality assessment № of patients
Impact Quality Importance № of studies
Study design
Risk of bias Inconsistency Indirectness Imprecision Other
considerations 24 hour
supportive housing
standard hospitalization
(access to occupational therapy,
industrial therapy and recreational
facilities)
Access to rehabilitation services - not measured
- - - - - - - - - -
Utilization of rehabilitation services and continuity of care (assessed with: Relative costs for 24 hour supportive housing versus standard hospitalization)
1 randomised trials
serious 2 not serious serious 3 serious 4 none /11 /11 Three people from the house had to be readmitted to the hospital and several of the others had short stays there.
⨁◯◯◯
VERY LOW
Rehabilitation outcomes (e.g., prevention or slowing of the loss of function, improvement or restoration of function, compensation for lost function) (assessed with: Unable to manage in the placement (by 24 months) )
1 randomised trials
serious 2 not serious serious 3 serious 4 none /11 /11 Those people who were resident in the house were reported to be significantly more likely to use social facilities and spent more time in socially constructive activities (self-care, eating with the group).
⨁◯◯◯
VERY LOW
Health outcomes (e.g., mortality, morbidity, and quality of life) (assessed with: Psychological Impairment Rating Scale)
1 randomised trials
serious 2 not serious serious 3 serious 4 none /11 /11 All other measures reported were not significantly different between the groups.
⨁◯◯◯
VERY LOW
MD – mean difference, RR – relative risk 1. No evidence available 2. One study was included, with a high ROB (selection bias, detection bias, performance bias and attrition bias 3. The study took place in the UK, not LMIC. Reproducing the intervention in LMIC is not expected to be feasible and not expected to give the same results 4. Total number of participants: 22 patients

23
Summary of findings:
24 hour supportive housing compared to standard hospitalization (access to occupational therapy, industrial therapy and recreational facilities) for patients with schizophrenia (MacPherson 2009) Outcomes Impact № of
participants (Studies)
Quality of the evidence (GRADE)
Access to rehabilitation services - not measured - -
Utilization of rehabilitation services and continuity of care assessed with: Relative costs for 24 hour supportive housing versus standard hospitalization
Three people from the house had to be readmitted to the hospital and several of the others had short stays there.
22 (1 RCT) ⨁◯◯◯
VERY LOW 2 3 4
Rehabilitation outcomes (e.g., prevention or slowing of the loss of function, improvement or restoration of function, compensation for lost function) (Rehabilitation outcomes) assessed with: Unable to manage in the placement (by 24 months)
Those people who were resident in the house were reported to be significantly more likely to use social facilities and spent more time in socially constructive activities (self-care, eating with the group).
22 (1 RCT) ⨁◯◯◯
VERY LOW 2 3 4
Health outcomes (e.g., mortality, morbidity, and quality of life) assessed with: Psychological Impairment Rating Scale
All other measures reported were not significantly different between the groups.
22 (1 RCT) ⨁◯◯◯
VERY LOW 2 3 4
*The risk in the intervention group (and its 95% confidence interval) is based on the assumed risk in the comparison group and the relative effect of the intervention (and its 95% CI). CI: Confidence interval; RR: Risk ratio; OR: Odds ratio;
1. No evidence available 2. One study was included, with a high ROB (selection bias, detection bias, performance bias and attrition bias 3. The study took place in the UK, not LMIC. Reproducing the intervention in LMIC is not expected to be feasible and not expected to give the same results 4. Total number of participants: 22 patients

24
Should community based intensive case management vs. standard outpatient psychiatric care be used for severely mentally ill people? (Dieterich 2010) Question: Community based intensive case management compared to standard outpatient psychiatric care for severely mentally ill people (Dieterich 2010) Bibliography (systematic reviews): 601_Dieterich M, Irving CB, Park B, Marshall M. Intensive case management for severe mental illness. Cochrane Database of Systematic Reviews 2010, Issue 10. Art. No.: CD007906. DOI: 10.1002/14651858.CD007906.pub2.
Quality assessment № of patients Effect
Quality Importance № of studies
Study design
Risk of bias Inconsistency Indirectness Imprecision Other
considerations
community based
intensive case
management
standard outpatient psychiatric
care
Relative (95% CI)
Absolute (95% CI)
Access to rehabilitation services (assessed with: Not remaining in contact with psychiatric services by short, medium, long term and overall )
9 randomised trials
serious 1 not serious 2 not serious 3 not serious 4
none /822 /811 RR 0.43 (0.3 to 0.61)
0 fewer per 1000 (from 0
fewer to 0 fewer)
⨁⨁⨁◯
MODERATE
IMPORTANT
Utilization of rehabilitation services and continuity of care (assessed with: average number of days in hospital per month, by about 24 months)
24 randomised trials
serious 1 serious 5 not serious 3 not serious 6
none 1846 1749 - MD 0.86 lower (1.37 lower to
0.34 lower) ⨁⨁◯◯
LOW
IMPORTANT
Rehabilitation outcomes (e.g., prevention or slowing of the loss of function, improvement or restoration of function, compensation for lost function) (assessed with: Global Assessment of Functioning Scale (GAF), long-term assessment (> 12 months))
5 randomised trials
serious 1 not serious 7 not serious 8 not serious 9
none 433 385 - MD 3.41 higher (1.66 higher to
5.16 higher) ⨁⨁⨁◯
MODERATE
IMPORTANT
Health outcomes (e.g., mortality, morbidity, and quality of life) (assessed with: Mortality (‘all causes or suicide’))
9 randomised trials
serious 1 not serious 10 not serious 11
serious 12 none /741 /715 RR 0.84 (0.48 to
1.47)
0 fewer per 1000 (from 0
fewer to 0 fewer)
⨁⨁◯◯
MODERATE
CRITICAL
Health outcomes (e.g., mortality, morbidity, and quality of life) (assessed with: Quality of Life Data)
2 randomised trials
serious 1 not serious 13 not serious 14
serious 15 none - MD 3.23 higher (2.31 higher to
4.14 higher) ⨁⨁◯◯
LOW
MD – mean difference, RR – relative risk 1. This meta-analysis included studies with high risk of selection bias (all were randomized, but there were problems with allocation concealment), detection bias (blinding), attrition bias (intention-to-
treat) and selective reporting bias. 2. I-square = 49%; p = 0.05 3. Studies were conducted in high income countries (United States, Canada, Europe and Australia). However, this intervention is likely to be replicated in LMIC 4. Total sample size=1633; community care=822; standard care=811. 95% CI does not include the null hypothesis 5. I-square = 74%; p < 0.00001 6. Total sample size=3595; community care=1846; standard care=1749 7. I-square= 0%; p=0.60 8. Studies were conducted in high income countries (United States, Sweden, UK). However, this intervention is likely to be replicated in LMIC 9. Total number of participants=818; community care=433; standard care=385 10. I-square=0%; p=0.61 11. These studies were conducted in UK, Sweden and US However, this intervention is likely to be replicated in LMIC 12. Total sample size=1456; community care=741; standard care=715. 95% CI includes the null hypothesis 13. I-square=0%; p=0.80 14. These studies were conducted in US and Denmark, . However, this intervention is likely to be replicated in LMIC 15. Total number of participants=423

25
Summaryoffindings:Communitybasedintensivecasemanagement(ICM)comparedtostandardoutpatientpsychiatriccareforseverelymentallyillpeople(Dieterich2010)Outcomes Anticipated absolute effects* (95% CI) Relative
effect (95% CI)
№ of participants (Studies)
Quality of the evidence (GRADE)
Comments
Risk with standard outpatient psychiatric care
Risk with community based intensive case management (ICM)
Access to rehabilitation services: Not remaining in contact with psychiatric services by short, medium, long term and overall
270 per 1000 116 per 1000 (81 to 165)
RR 0.43 (0.3 to 0.61)
1633 (9 RCTs)
⨁⨁⨁◯ MODERATE 1 2 3 4
Significant advantage in the ICM group, where people were less likely to be lost to psychiatric services than people in the standard care group. 154 fewer per 1000 (from 105 fewer to 189 fewer)
Utilization of rehabilitation services and continuity of care: average number of days in hospital per month follow up: mean 24 months
The mean utilization of rehabilitation services and continuity of care in the intervention group was 0.86 lower (1.37 lower to 0.34 lower)
- 3595 (24 RCTs)
⨁⨁◯◯ LOW 1 3 5 6
Significant advantage in the ICM group. But the magnitude of the effects is very small since the outcome is "the number of days in hospital per month".
Rehabilitation outcomes Global Assessment of Functioning Scale (GAF) Scale from: 0 to 100 follow up: mean 12 months
The mean rehabilitation outcomes in the intervention group was 3.41 higher (1.66 higher to 5.16 higher)
- 818 (5 RCTs)
⨁⨁⨁◯ MODERATE 1 7 8 9
Significant advantage in the ICM group. The magnitude of the effects were small (3.4 points on a scale that ranges from 0 to 100 points).
Health outcomes Quality of Life: Client satisfaction questionnaire (CSQ). Scale from: 8 to 32 follow up: mean 12 months
The mean health outcomes in the intervention group was 3.23 higher (2.31 higher to 4.14 higher)
- 423 (2 RCTs)
⨁⨁◯◯ LOW 1 10 11 12
Significant advantage in the ICM group. The magnitude of the effects were large (3.2 points on a scale that ranges from 8 to 32 points)
Health outcomes Mortality (‘all causes or suicide’). follow up: mean 6 months
38 per 1000 32 per 1000 (18 to 56)
RR 0.84 (0.48 to 1.47)
1456 (9 RCTs)
⨁⨁⨁◯ MODERATE 1 13 14 15
6 fewer deaths per 1000 (from 18 more to 20 fewer). CI includes both benefit and harm.
Health outcome assessed with: Mortality (all causes or suicide) follow up: mean 12 months
13 per 1000 10 per 1000 (3 to 35)
RR 0.78 (0.23 to 2.62)
901 (6 RCTs)
⨁⨁◯◯ LOW 1 16 17
3 fewer per 1000 (from 10 fewer to 22 more). CI includes both benefits and harms.
*The risk in the intervention group (and its 95% confidence interval) is based on the assumed risk in the comparison group and the relative effect of the intervention (and its 95% CI). CI: Confidence interval; RR: Risk ratio; OR: Odds ratio;
1. This meta-analysis included studies with high risk of selection bias (all were randomized, but there were problems with allocation concealment), detection bias (blinding), attrition bias (intention-to-treat) and selective reporting bias.
2. I-square = 49%; p = 0.05 3. Studies were conducted in high income countries (United States, Canada, Europe and Australia). However, this intervention is likely to be replicated in LMIC 4. Total sample size=1633; community care=822; standard care=811. 95% CI does not include the null hypothesis 5. I-square = 74%; p < 0.00001 6. Total sample size=3595; community care=1846; standard care=1749 7. I-square= 0%; p=0.60 8. Studies were conducted in high income countries (United States, Sweden, UK). However, this intervention is likely to be replicated in LMIC 9. Total number of participants=818; community care=433; standard care=385 10. I-square=0%; p=0.80 11. These studies were conducted in US and Denmark, . However, this intervention is likely to be replicated in LMIC 12. Total number of participants=423 13. I-square=0%; p=0.61 14. These studies were conducted in UK, Sweden and US However, this intervention is likely to be replicated in LMIC 15. Total sample size=1456; community care=741; standard care=715 16. I-square = 0%, p=0.54 17. Confidence interval includes null hypothesis. Total sample size = 901

26
Should Intensive community based case management vs. non-intensive case management be used for severely mentally ill? (Dieterich 2011) Question: Intensive community based case management compared to non-intensive case management for severely mentally ill (Dieterich 2011) Bibliography (systematic reviews): 601_Dieterich M, Irving CB, Park B, Marshall M. Intensive case management for severe mental illness. Cochrane Database of Systematic Reviews 2010, Issue 10. Art. No.: CD007906. DOI: 10.1002/14651858.CD007906.pub2.
Quality assessment № of patients Effect
Quality Importance № of studies
Study design
Risk of bias Inconsistency Indirectness Imprecision Other
considerations
Intensive community based case
management
non-intensive case
management
Relative (95% CI)
Absolute (95% CI)
Access to rehabilitation services (assessed with: Reducing the Rate of Loss to Follow-Up)
8 randomised trials
serious 1 serious 2 not serious 3 not serious 4
none /1110 /1085 RR 0.72 (0.52 to
0.99)
0 fewer per 1000 (from 0 fewer to 0 fewer) ⨁⨁
◯◯ LOW
IMPORTANT
Utilization of rehabilitation services and continuity of care (assessed with: Reducing the Average Length of Hospitalization)
21 randomised trials
serious 1 not serious 5 not serious 6 not serious 7
none 1128 1092 - MD 0.08 lower (0.37 lower to 0.21
higher) ⨁⨁⨁◯
MODERATE
IMPORTANT
MD – mean difference, RR – relative risk 1. This meta-analysis included studies with high risk of selection bias (all were randomized, but there were problems with description of randomization and allocation concealment), detection bias
(blinding), attrition bias (intention-to-treat) and selective reporting bias. 2. I-square=59%; p= 3. These studies were conducted in UK, Sweden and US However, this intervention is likely to be replicated in LMIC 4. Total sample size=2195; community based=1110; non intensive community based=1085 5. I-square=0%; p= 6. These studies were conducted in UK, Sweden and US However, this intervention is likely to be replicated in LMIC 7. Total Sample= 2220 ICM= 1128 Non-ICM= 1092

27
Summary of findings:
Intensive community based case management compared to non-intensive case management for severely mentally ill (Dieterich 2011) Outcomes Anticipated absolute effects* (95% CI) Relative
effect (95% CI)
№ of participants (Studies)
Quality of the evidence (GRADE)
Comments
Risk with non-intensive case management
Risk with Intensive community based case management
Access to rehabilitation services assessed with: Reducing the Rate of Loss to Follow-Up
Study population RR 0.72 (0.52 to 0.99)
2195 (8 RCTs) ⨁⨁◯◯
LOW 1 2 3 4
Utilization of rehabilitation services and continuity of care assessed with: Reducing the Average Length of Hospitalization
The mean utilization of rehabilitation services and continuity of care in the intervention group was 0.08 lower (0.37 lower to 0.21 higher)
- 2220 (21 RCTs) ⨁⨁⨁◯
MODERATE 1 5 6 7
*The risk in the intervention group (and its 95% confidence interval) is based on the assumed risk in the comparison group and the relative effect of the intervention (and its 95% CI). CI: Confidence interval; RR: Risk ratio; OR: Odds ratio;
1. This meta-analysis included studies with high risk of selection bias (all were randomized, but there were problems with description of randomization and allocation concealment), detection bias (blinding), attrition bias (intention-to-treat) and selective reporting bias.
2. I-square=59%; p= 3. These studies were conducted in UK, Sweden and US However, this intervention is likely to be replicated in LMIC 4. Total sample size=2195; community based=1110; non intensive community based=1085 5. I-square=0%; p= 6. These studies were conducted in UK, Sweden and US However, this intervention is likely to be replicated in LMIC 7. Total Sample= 2220 ICM= 1128 Non-ICM= 1092

28
Should various models of community based settings* vs. compared to each other be used for people with intellectual disability? (Kozma 2009) Question: Various models of community based settings* compared to compared to each other for people with intellectual disability (Kozma 2009) Settings: Community-based settings included a variety of arrangements, such as dispersed or clustered, ordinary or purpose-built group homes, and supported living. Bibliography (systematic reviews): 1340_Kozma A, Mansell J, Beadle-Brown J. Outcomes in different residential settings for people with intellectual disability: a systematic review. Am J Intellect Dev Disabil. 2009 May;114(3):193-222. doi: 10.1352/1944-7558-114.3.193. Review. PubMed PMID: 19374466.
Quality assessment № of patients
Impact Quality Importance № of studies
Study design
Risk of bias Inconsistency Indirectness Imprecision Other
considerations
various models of
community based
settings*
compared to each other
Access to rehabilitation services - not measured
- - - - - - - - - - IMPORTANT
Utilization of rehabilitation services and continuity of care (assessed with: Community presence and participation (social re-integration measured by participation in community-based activities, use of community facilities, use of mainstream community facilities such as services and leisure))
11 observational studies
serious 2 serious 3 not serious 4 serious 5 none semi-independent or supported living arrangements provided more community integration, more use of community facilities than did traditional residential services
⨁◯◯◯
VERY LOW
CRITICAL
Utilization of rehabilitation services and continuity of care (assessed with: Community presence and participation (social re-integration measured by participation in community-based activities, use of community facilities, use of mainstream community facilities such as services and leisure))
2 observational studies 6
serious 2 serious 3 not serious 4 serious 7 none semi-independent or supported living arrangements provided more community integration, more use of community facilities than did traditional residential services
⨁◯◯◯
VERY LOW
Health outcomes (e.g., mortality, morbidity, and quality of life) (assessed with: Mortality )
7 observational studies
serious 2 serious 8 not serious 9 not serious 10
none Results in opposite direction: Resettlement from institutions to community settings was not associated with increased risk of mortality (n=8264) AND greater risk of mortality was found in community settings than in institutions. (n=28562).
⨁◯◯◯
VERY LOW
Health outcomes (e.g., mortality, morbidity, and quality of life) (assessed with: Mortality )
3 observational studies 6
serious 2 serious 8 not serious 9 not serious 11
none Results in opposite direction: Resettlement from institutions to community settings was not associated with increased risk of mortality (n=8264) AND greater risk of mortality was found in community settings than in institutions. (n=28562).
⨁◯◯◯
VERY LOW
Health outcomes (e.g., mortality, morbidity, and quality of life) (assessed with: Quality of life)
2 observational studies
serious 2 serious 12 not serious 13
serious 14 none People experienced better quality of life after moving from a long–stay hospital (95+ residents) to community homes (1–10 residents).
⨁◯◯◯
VERY LOW
Health outcomes (e.g., mortality, morbidity, and quality of life) (assessed with: Quality of life)
4 observational studies 6
serious 2 serious 12 not serious 15
serious 16 none People experienced better quality of life after moving from a long–stay hospital (95+ residents) to community homes (1–10 residents).
⨁◯◯◯
VERY LOW
MD – mean difference, RR – relative risk 1. No evidence available 2. High risk of selection, measurement and performance bias 3. Considerable variation in the duration of assessment and follow up visits, outcomes measures and interventions 4. All studies were conducted in HIC: UK, US, Australia, Ireland, Taiwan. Reproducing the intervention in LMIC is expected to be feasible and expected to give same results 5. Number of participants 6. Quantitative studies 7. Number of participants per study group

29
8. Considerable variation among people and settings, staff practices and service procedures. Conflicting conclusions for this outcome 9. All studies were conducted in HIC: US. Reproducing the intervention in LMIC is expected to be feasible and expected to give same results 10. Number of participants: 26,798 11. Number of study participants 12. Considerable variation among people and settings, staff practices and service procedures 13. All studies were conducted in HIC: US. Reproducing the intervention in LMIC is expected to be feasible and expected to give same results 14. Number of participants 15. All studies were conducted in HIC: UK, Holland and Australia. Reproducing the intervention in LMIC is expected to be feasible and expected to give same results 16. Number of participants
Summary of findings:
Various models of community based settings* compared to compared to each other for people with intellectual disability (Kozma 2009) Outcomes Impact № of
participants (Studies)
Quality of the evidence (GRADE)
Access to rehabilitation services - not measured - -
Utilization of rehabilitation services and continuity of care assessed with: Community presence and participation (social re-integration measured by participation in community-based activities, use of community facilities, use of mainstream community facilities such as services and leisure)
semi-independent or supported living arrangements provided more community integration, more use of community facilities than did traditional residential services
(11 observational studies)
⨁◯◯◯ VERY LOW 2 3 4 5
Utilization of rehabilitation services and continuity of care assessed with: Community presence and participation (social re-integration measured by participation in community-based activities, use of community facilities, use of mainstream community facilities such as services and leisure)
semi-independent or supported living arrangements provided more community integration, more use of community facilities than did traditional residential services
(2 observational studies) 6 ⨁◯◯◯
VERY LOW 2 3 4 7
Health outcomes (e.g., mortality, morbidity, and quality of life) (Health outcome) assessed with: Mortality
Results in opposite direction: Resettlement from institutions to community settings was not associated with increased risk of mortality (n=8264) AND greater risk of mortality was found in community settings than in institutions. (n=28562).
(7 observational studies) ⨁◯◯◯
VERY LOW 2 8 9 10
Health outcomes (e.g., mortality, morbidity, and quality of life) assessed with: Mortality
Results in opposite direction: Resettlement from institutions to community settings was not associated with increased risk of mortality (n=8264) AND greater risk of mortality was found in community settings than in institutions. (n=28562).
(3 observational studies) 6 ⨁◯◯◯
VERY LOW 2 8 9 11
Health outcomes (e.g., mortality, morbidity, and quality of life) assessed with: Quality of life
People experienced better quality of life after moving from a long–stay hospital (95+ residents) to community homes (1–10 residents).
(2 observational studies) ⨁◯◯◯
VERY LOW 2 12 13 14
Health outcomes (e.g., mortality, morbidity, and quality of life) assessed with: Quality of life
People experienced better quality of life after moving from a long–stay hospital (95+ residents) to community homes (1–10 residents).
(4 observational studies) 6 ⨁◯◯◯
VERY LOW 2 12 15 16
*The risk in the intervention group (and its 95% confidence interval) is based on the assumed risk in the comparison group and the relative effect of the intervention (and its 95% CI). CI: Confidence interval; RR: Risk ratio; OR: Odds ratio;
1. No evidence available 2. High risk of selection, measurement and performance bias 3. Considerable variation in the duration of assessment and follow up visits, outcomes measures and interventions 4. All studies were conducted in HIC: UK, US, Australia, Ireland, Taiwan. Reproducing the intervention in LMIC is expected to be feasible and expected to give same results 5. Number of participants 6. Quantitative studies 7. Number of participants per study group 8. Considerable variation among people and settings, staff practices and service procedures. Conflicting conclusions for this outcome 9. All studies were conducted in HIC: US. Reproducing the intervention in LMIC is expected to be feasible and expected to give same results 10. Number of participants: 26,798 11. Number of study participants 12. Considerable variation among people and settings, staff practices and service procedures 13. All studies were conducted in HIC: US. Reproducing the intervention in LMIC is expected to be feasible and expected to give same results 14. Number of participants 15. All studies were conducted in HIC: UK, Holland and Australia. Reproducing the intervention in LMIC is expected to be feasible and expected to give same results

30
16. Number of participants

31
Should outreach distance training program vs. minimal intervention (health and nutritional advice) be used for children with cerebral palsy in rural areas? (McConachie 2000) Question: Outreach distance training program compared to minimal intervention (health and nutritional advice) for children with cerebral palsy in rural areas (McConachie 2000) Settings: Low income country: Bangladesh Bibliography (systematic reviews): McConachie H, Huq S, Munir S, Ferdous S, Zaman S, Khan NZ. A randomized controlled trial of alternative modes of service provision to young children with cerebral palsy in Bangladesh. J Pediatr 2000;137:769-76.
Quality assessment № of patients Effect
Quality Importance № of studies
Study design
Risk of bias Inconsistency Indirectness Imprecision Other
considerations
outreach distance training program
minimal intervention (health and nutritional
advice)
Relative (95% CI)
Absolute (95% CI)
Access to rehabilitation services - not measured
- - - - - - - - - -
Utilization of rehabilitation services and continuity of care - not measured
- - - - - - - - - -
Rehabilitation outcomes (e.g., prevention or slowing of the loss of function, improvement or restoration of function, compensation for lost function) - not measured
- - - - - - - - - -
Health outcomes (e.g., mortality, morbidity, and quality of life) (follow up: range 9 to 12 months; assessed with: (Rural Groups) Child ability using Independent Behaviour Assessment Scale (IBAS) )
1 randomised trials
serious 2 not serious 3 not serious 4 serious 5 none 23 17 - MD 0.21 higher (0.61 lower to 1.02 higher) ⨁⨁
◯◯ LOW
MD – mean difference, RR – relative risk 1. No evidence available 2. High risk of selection, management, performance and attrition bias 3. One study only: Same settings, program content and outcomes 4. Study conducted in LIC: Banguadesh 5. Total number of participants: 85 children with cerebral palsy (only 58 followed-up)

32
Summary of findings:
Outreach distance training program compared to minimal intervention (health and nutritional advice) for children with cerebral palsy in rural areas (McConachie 2000) Outcomes Anticipated absolute effects* (95% CI) Relative
effect (95% CI)
№ of participants (Studies)
Quality of the evidence (GRADE)
Comments
Risk with minimal intervention (health and nutritional advice)
Risk with outreach distance training program
Access to rehabilitation services - not measured
- -
Utilization of rehabilitation services and continuity of care - not measured
- -
Rehabilitation outcomes (e.g., prevention or slowing of the loss of function, improvement or restoration of function, compensation for lost function) - not measured
- -
Health outcomes (e.g., mortality, morbidity, and quality of life) (IBAS) assessed with: (Rural Groups) Child ability using Independent Behaviour Assessment Scale (IBAS) follow up: range 9 to 12 months
The mean health outcomes (e.g., mortality, morbidity, and quality of life) in the control group was 0
The mean health outcomes (e.g., mortality, morbidity, and quality of life) in the intervention group was 0.21 higher (0.61 lower to 1.02 higher)
- 40 (1 RCT) ⨁⨁◯◯
LOW 2 3 4 5
*The risk in the intervention group (and its 95% confidence interval) is based on the assumed risk in the comparison group and the relative effect of the intervention (and its 95% CI). CI: Confidence interval; RR: Risk ratio; OR: Odds ratio;
1. No evidence available 2. High risk of selection, management, performance and attrition bias 3. One study only: Same settings, program content and outcomes 4. Study conducted in LIC: Banguadesh 5. Total number of participants: 85 children with cerebral palsy (only 58 followed-up)

33
Should outreach distance training program vs. center-based mother-child group be used for children with cerebral palsy in urban setting? (McConachie 2000) Question: Outreach distance training program compared to center-based mother-child group for children with cerebral palsy in urban setting (McConachie 2000) Settings: Low income country: Bangladesh Bibliography (systematic reviews): McConachie H, Huq S, Munir S, Ferdous S, Zaman S, Khan NZ. A randomized controlled trial of alternative modes of service provision to young children with cerebral palsy in Bangladesh. J Pediatr 2000;137:769-76.
Quality assessment № of patients Effect
Quality Importance № of studies
Study design
Risk of bias Inconsistency Indirectness Imprecision Other
considerations
outreach distance training program
center-based
mother-child group
Relative (95% CI)
Absolute (95% CI)
Access to rehabilitation services - not measured
- - - - - - - - - -
Utilization of rehabilitation services and continuity of care - not measured
- - - - - - - - - -
Rehabilitation outcomes (e.g., prevention or slowing of the loss of function, improvement or restoration of function, compensation for lost function) - not measured
- - - - - - - - - -
Health outcomes (e.g., mortality, morbidity, and quality of life) (follow up: range 9 to 12 months; assessed with: Child ability using Independent Behaviour Assessment Scale (IBAS))
1 randomised trials
serious 2 not serious 3 not serious 4 serious 5 none 24 21 - MD 0.22 lower (1.02 lower to 0.57 higher) ⨁⨁
◯◯ LOW
CRITICAL
MD – mean difference, RR – relative risk 1. No evidence available 2. High risk of selection bias (children were allocated within the study groups according to their origin: city (centre-based program), rural (minimal advice group). Diagnosis of cerebral palsy was made
by neurodevelopmental pediatrician for the centre-based children and by experienced community workers in the rural areas; management, performance and attrition bias. 3. Same settings, program content and outcomes 4. Low income country (Bangladesh) 5. Total number of participants: 85 children with cerebral palsy (only 58 followed-up)

34
Summary of findings:
Outreach distance training program compared to center-based mother-child group for children with cerebral palsy in urban setting (McConachie 2000) Outcomes Anticipated absolute effects* (95% CI) Relative
effect (95% CI)
№ of participants (Studies)
Quality of the evidence (GRADE)
Comments
Risk with center-based mother-child group
Risk with outreach distance training program
Access to rehabilitation services - not measured
- -
Utilization of rehabilitation services and continuity of care - not measured
- -
Rehabilitation outcomes (e.g., prevention or slowing of the loss of function, improvement or restoration of function, compensation for lost function) - not measured
- -
Health outcomes (e.g., mortality, morbidity, and quality of life) (Health outcomes) assessed with: Child ability using Independent Behaviour Assessment Scale (IBAS) follow up: range 9 to 12 months
The mean health outcomes (e.g., mortality, morbidity, and quality of life) in the intervention group was 0.22 lower (1.02 lower to 0.57 higher)
- 45 (1 RCT) ⨁⨁◯◯
LOW 2 3 4 5
*The risk in the intervention group (and its 95% confidence interval) is based on the assumed risk in the comparison group and the relative effect of the intervention (and its 95% CI). CI: Confidence interval; RR: Risk ratio; OR: Odds ratio;
1. No evidence available 2. High risk of selection bias (children were allocated within the study groups according to their origin: city (centre-based program), rural (minimal advice group). Diagnosis of
cerebral palsy was made by neurodevelopmental pediatrician for the centre-based children and by experienced community workers in the rural areas; management, performance and attrition bias.
3. Same settings, program content and outcomes 4. Low income country (Bangladesh) 5. Total number of participants: 85 children with cerebral palsy (only 58 followed-up)

35
Shouldhomeactivityprogram(HAP)plusinstitutional-basedtherapy(IT)vs.institutional-basedtherapy(IT)alonebeusedforchildrenwithmotororglobaldevelopmentdelay?(Tang2011) Question: Home activity program (HAP) plus institutional-based therapy (IT) compared to institutional-based therapy (IT) alone for children with motor or global developmental delay (Tang 2011) Setting: Community services Bibliography (systematic reviews): Tang MH, Lin CK, Lin WH, Chen CH, Tsai SW, Chang YY. The effect of adding a home program to weekly institutional-based therapy for children with undefined developmental delay: a pilot randomized clinical trial. J Chin Med Assoc. 2011 Jun;74(6):259-66
Quality assessment № of patients Effect
Quality Importance № of
studies Study design
Risk of bias Inconsistency Indirectness Imprecision Other
considerations
home activity
program (HAP) plus
institutional-based
therapy (IT)
institutional-based
therapy (IT) alone
Relative (95% CI)
Absolute (95% CI)
Access to rehabilitation services - not measured
- - - - - - - - not estimable
-
Utilization of rehabilitation services and continuity of care - not measured
- - - - - - - - not estimable
-
Rehabilitation outcomes (follow up: mean 12 weeks; assessed with: The Comprehensive Developmental Inventory for Infants and Toddlers (CDIIT-D))
1 randomised trials
serious 1 not serious not serious 2 serious 3 none 35 35 - MD 1.02 higher (0.4963 higher to 1.5437
higher) ⨁⨁◯◯
LOW
Rehabilitation outcomes (follow up: mean 12 weeks; assessed with: Pediatric Evaluation of Disability Inventory (PEDI) - Caregiver assistance)
1 randomised trials
serious 1 not serious not serious 2 serious 3 none 35 35 - MD 1.86 higher (0.6742 higher to 3.0458
higher) ⨁⨁◯◯
LOW
MD – mean difference, RR – relative risk
1. High risk of selection bias (While an independent nurse performed the randomization, “the sequence of DD children were determined by the date of EI”). High risk of detection bias (Therapists were not blinded, parents completed some of the assessments and they would be aware of whether intervention was institution based or at home.). Unclear risk of attrition bias (No mention of missing data, no dropouts)
2. Study was conducted in Taiwan. However, reproducing the intervention in LMIC is expected to be feasible and expected to give same results 3. Only one randomized trial with a total sample size of 70 people

36
Summary of findings:
Home activity program (HAP) plus institutional-based therapy (IT) compared to institutional-based therapy (IT) alone for children with motor or global developmental delay (Tang 2011) Patient or population: children with motor or global developmental delay (Tang 2011) Setting: Community services Intervention: home activity program (HAP) plus institutional-based therapy (IT) Comparison: institutional-based therapy (IT) alone
Outcomes Anticipated absolute effects* (95% CI) Relative effect (95% CI)
№ of participants (studies)
Quality of the evidence (GRADE)
Comments
Risk with institutional-based therapy (IT) alone
Risk with home activity program (HAP) plus institutional-based therapy (IT)
Access to rehabilitation services - not measured
not estimable
- - Not measured
Utilization of rehabilitation services and continuity of care - not measured
not estimable
- - Not measured
Rehabilitation outcomes assessed with: The Comprehensive Developmental Inventory for Infants and Toddlers (CDIIT-D) follow up: mean 12 weeks
Themeanrehabilitationoutcomesinthecontrolgroupwas15.11points
Themeanrehabilitationoutcomesintheinterventiongroupwas1.02higher(0.4963higherto1.5437higher)
- 70 (1 RCT)
⨁⨁◯◯ LOW 1 2 3
IT + HAP improved from 12 (SD 5.4) to 15.13 (SD 5.5). Pre-post = 3.13 (SD 1.01). IT only improved from 13 (SD 6.4) to 15.11 (SD 6.9). Pre-post = 2.11 (SD 1.18). p=000.
Rehabilitation outcomes assessed with: Pediatric Evaluation of Disability Inventory (PEDI) - Caregiver assistance follow up: mean 12 weeks
Themeanrehabilitationoutcomesinthecontrolgroupwas21.77points
Themeanrehabilitationoutcomesintheinterventiongroupwas1.86higher(0.6742higherto3.0458higher)
- 70 (1 RCT)
⨁⨁◯◯ LOW 1 2 3
IT + HAP improved from 15.34 (SD 16.34) to 20.17 (SD 16.65). Pre-post = 4.83 (SD 2.40). IT only improved from 18.80 (SD 17.78) to 21.77 (SD 18.03). Pre-post =2.97 (SD 2.57). p=003.
*The risk in the intervention group (and its 95% confidence interval) is based on the assumed risk in the comparison group and the relative effect of the intervention (and its 95% CI). CI: Confidence interval; RR: Risk ratio; OR: Odds ratio;

37
b)IntegratedanddecentralizedservicescomparedtocentralizedservicesShould integrated disease management vs. usual care be used for COPD? (Kruis 2013) Question: Integrated disease management compared to Usual care for COPD Setting: Community and hospital-based Bibliography (systematic reviews): Kruis AL, Smidt N, Assendelft WJ, Gussekloo J, Boland MR, Rutten-van Mölken M, Chavannes NH. Integrated disease management interventions for patients with chronic obstructive pulmonary disease. Cochrane Database Syst Rev. 2013 Oct 10;10:CD009437
Quality assessment № of patients Effect
Quality Importance № of
studies Study design
Risk of bias Inconsistency Indirectness Imprecision Other
considerations Integrated
disease management
Usual care
Relative (95% CI)
Absolute (95% CI)
Access to rehabilitation services - not measured
- - - - - - - - see comment
not estimable
see comment -
Utilization of rehabilitation services and continuity of care (follow up: range 3 to 12 months; assessed with: Respiratory-related hospital admissions)
7 randomised trials
serious 1 not serious not serious 2 not serious none 157/748 (21.0%)
196/722 (27.1%)
OR 0.68 (0.47 to
0.99)
69 fewer per 1000 (from 2 fewer to 122 fewer) ⨁⨁⨁
◯ MODERATE
Rehabilitation outcome (follow up: range 3 to 12 months; assessed with: 6MWD)
14 randomised trials
serious 1 serious 3 not serious 4 not serious none 466 405 - MD 43.86 higher (21.83 higher to 65.89 higher) ⨁⨁◯
◯ LOW
Health outcome (quality of life) (follow up: range 3 to 12 months; assessed with: St George's Respiratory Questionnaire)
12 randomised trials
serious 1 not serious not serious 2 not serious none 658 646 - MD 4.22 lower (6.14 lower to 2.3 lower) ⨁⨁⨁
◯ MODERATE
Health outcome (mortality) (follow up: range 3 to 12 months)
4 randomised trials
serious 1 serious 5 not serious 2 serious 6 none 95/553 (17.2%)
103/560 (18.4%)
OR 0.96 (0.52 to
1.74)
6 fewer per 1000 (from 79 fewer to 98 more) ⨁◯
◯◯ VERY LOW
MD – mean difference, RR – relative risk
1. selection bias (unclear allocation concealment); all studies with performance bias (no blinding of participants), and selective reporting bias. 2. All studies were conducted in HIC. However, reproducing the intervention in LMIC is expected to be feasible and expected to give same results 3. I square = 83% 4. One study (Mendes 2010) conducted in Brasil). Sample size 56 in the intervention and 29 in the control group. 5. I square = 59% 6. Effect size includes the null hypothesis

38
Summary of findings:
Integrated disease management compared to Usual care for COPD (Kruis 2013) Patient or population: COPD (Kruis 2013) Setting: Community or hospital-based Intervention: Integrated disease management Comparison: Usual care
Outcomes Anticipated absolute effects* (95% CI) Relative effect (95% CI)
№ of participants (Studies)
Quality of the evidence (GRADE)
Comments
Risk with Usual care
Risk with Integrated disease management
Access to rehabilitation services - not measured
- -
Utilization of rehabilitation services and continuity of care assessed with: Respiratory-related hospital admissions follow up: range 3 to 12 months
OR 0.68 (0.47 to 0.99)
1470 (7 RCTs)
⨁⨁⨁◯ MODERATE 1 2
Statistically significant difference. Moderate effect size.
271 per 1000
202per1000 (149to269)
Rehabilitation outcome assessed with: 6MWD follow up: range 3 to 12 months
Themeanrehabilitationoutcomeintheinterventiongroupwas43.86higher(21.83higherto65.89higher)
- 871 (14 RCTs)
⨁⨁◯◯ LOW 1 3 4
The minimally clinically important difference is 35 meters. There is a clinically and statistically significant difference in favour of integrated care.
Health outcome (quality of life) assessed with: St George's Respiratory Questionnaire follow up: range 3 to 12 months
Themeanhealthoutcome(qualityoflife)intheinterventiongroupwas4.22lower(6.14lowerto2.3lower)
- 1304 (12 RCTs)
⨁⨁⨁◯ MODERATE 1 2
Minimally clinically important difference is 4. Clinically and statistically significant difference in favour of integrated care.
Health outcome (mortality) follow up: range 3 to 12 months
OR 0.96 (0.52 to 1.74)
1113 (4 RCTs)
⨁◯◯◯ VERY LOW 1 2 5 6
No significant difference 184 per 1000
178per1000 (105to282)
*The risk in the intervention group (and its 95% confidence interval) is based on the assumed risk in the comparison group and the relative effect of the intervention (and its 95% CI). CI: Confidence interval; RR: Risk ratio; OR: Odds ratio;
1. Selection bias (unclear allocation concealment); all studies with performance bias (no blinding of participants), and selective reporting bias. 2. All studies were conducted in HIC. However, reproducing the intervention in LMIC is expected to be feasible and expected to give same results 3. I square = 83% 4. One study (Mendes 2010) conducted in Brasil). Sample size 56 in the intervention and 29 in the control group. 5. I square = 59% 6. Effect size includes the null hypothesis
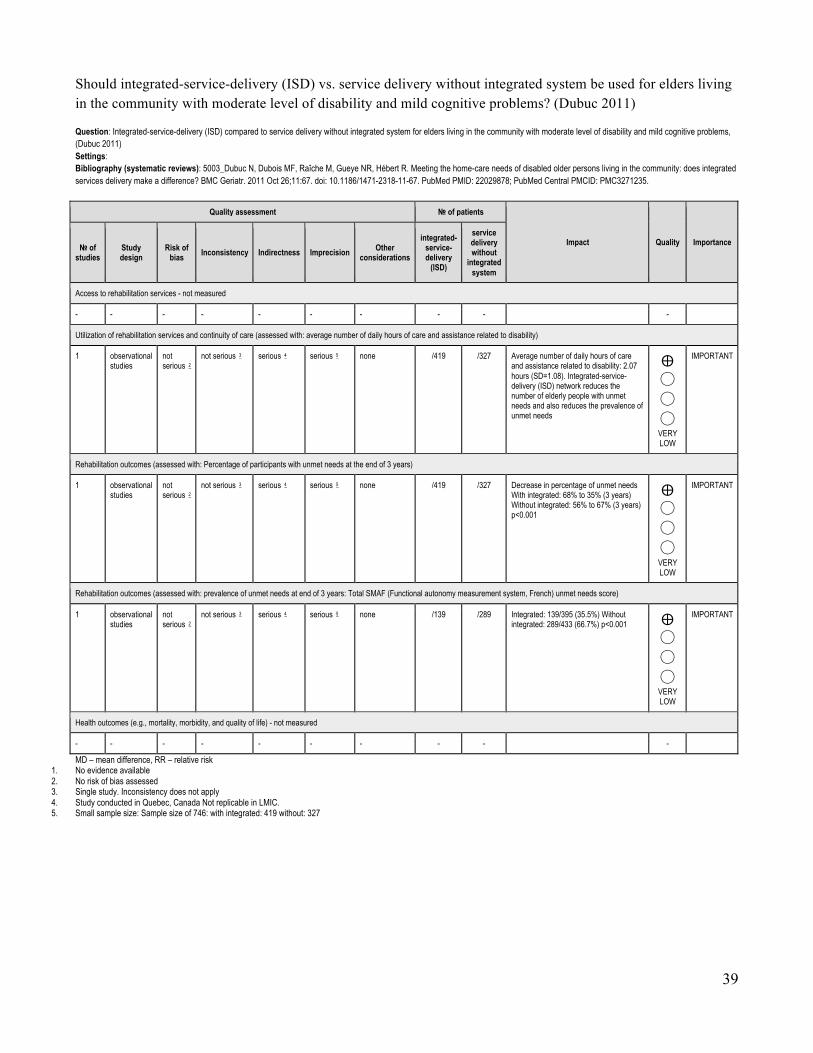
39
Should integrated-service-delivery (ISD) vs. service delivery without integrated system be used for elders living in the community with moderate level of disability and mild cognitive problems? (Dubuc 2011) Question: Integrated-service-delivery (ISD) compared to service delivery without integrated system for elders living in the community with moderate level of disability and mild cognitive problems, (Dubuc 2011) Settings: Bibliography (systematic reviews): 5003_Dubuc N, Dubois MF, Raîche M, Gueye NR, Hébert R. Meeting the home-care needs of disabled older persons living in the community: does integrated services delivery make a difference? BMC Geriatr. 2011 Oct 26;11:67. doi: 10.1186/1471-2318-11-67. PubMed PMID: 22029878; PubMed Central PMCID: PMC3271235.
Quality assessment № of patients
Impact Quality Importance № of studies
Study design
Risk of bias Inconsistency Indirectness Imprecision Other
considerations
integrated-service-delivery
(ISD)
service delivery without
integrated system
Access to rehabilitation services - not measured
- - - - - - - - - -
Utilization of rehabilitation services and continuity of care (assessed with: average number of daily hours of care and assistance related to disability)
1 observational studies
not serious 2
not serious 3 serious 4 serious 5 none /419 /327 Average number of daily hours of care and assistance related to disability: 2.07 hours (SD=1.08). Integrated-service-delivery (ISD) network reduces the number of elderly people with unmet needs and also reduces the prevalence of unmet needs
⨁◯
◯
◯ VERY LOW
IMPORTANT
Rehabilitation outcomes (assessed with: Percentage of participants with unmet needs at the end of 3 years)
1 observational studies
not serious 2
not serious 3 serious 4 serious 5 none /419 /327 Decrease in percentage of unmet needs With integrated: 68% to 35% (3 years) Without integrated: 56% to 67% (3 years) p<0.001
⨁◯
◯
◯ VERY LOW
IMPORTANT
Rehabilitation outcomes (assessed with: prevalence of unmet needs at end of 3 years: Total SMAF (Functional autonomy measurement system, French) unmet needs score)
1 observational studies
not serious 2
not serious 3 serious 4 serious 5 none /139 /289 Integrated: 139/395 (35.5%) Without integrated: 289/433 (66.7%) p<0.001 ⨁
◯
◯
◯ VERY LOW
IMPORTANT
Health outcomes (e.g., mortality, morbidity, and quality of life) - not measured
- - - - - - - - - -
MD – mean difference, RR – relative risk 1. No evidence available 2. No risk of bias assessed 3. Single study. Inconsistency does not apply 4. Study conducted in Quebec, Canada Not replicable in LMIC. 5. Small sample size: Sample size of 746: with integrated: 419 without: 327

40
Summary of findings:
Integrated-service-delivery (ISD) compared to service delivery without integrated system for elders living in the community with moderate level of disability and mild cognitive problems, (Dubuc 2011) Outcomes Impact № of
participants (Studies)
Quality of the evidence (GRADE)
Access to rehabilitation services - not measured - -
Utilization of rehabilitation services and continuity of care assessed with: average number of daily hours of care and assistance related to disability
Average number of daily hours of care and assistance related to disability: 2.07 hours (SD=1.08). Integrated-service-delivery (ISD) network reduces the number of elderly people with unmet needs and also reduces the prevalence of unmet needs
746 (1 observational study)
⨁◯◯◯ VERY LOW 2 3 4 5
Rehabilitation outcomes assessed with: Percentage of participants with unmet needs at the end of 3 years
Decrease in percentage of unmet needs With integrated: 68% to 35% (3 years) Without integrated: 56% to 67% (3 years) p<0.001
746 (1 observational study)
⨁◯◯◯ VERY LOW 2 3 4 5
Rehabilitation outcomes assessed with: prevalence of unmet needs at end of 3 years: Total SMAF (Functional autonomy measurement system, French) unmet needs score
Integrated: 139/395 (35.5%) Without integrated: 289/433 (66.7%) p<0.001 428 (1 observational study)
⨁◯◯◯ VERY LOW 2 3 4 5
Health outcomes (e.g., mortality, morbidity, and quality of life) - not measured
- -
*The risk in the intervention group (and its 95% confidence interval) is based on the assumed risk in the comparison group and the relative effect of the intervention (and its 95% CI). CI: Confidence interval; RR: Risk ratio; OR: Odds ratio;
1. No evidence available 2. No risk of bias assessed 3. Single study. Inconsistency does not apply 4. Study conducted in Quebec, Canada Not replicable in LMIC. 5. Small sample size: Sample size of 746: with integrated: 419 without: 327

41
Should New models of cooperative care vs. usual care be used for people with disabilities? (Binks 2007) Question: New models of cooperative care compared to usual care for people with disabilities (Binks 2007) Bibliography (systematic reviews): 206_Binks JA, Barden WS, Burke TA, Young NL.What do we really know about the transition to adult-centered health care? A focus on cerebral palsy and spina bifida. Arch Phys Med Rehabil 2007;88:1064-73.
Quality assessment № of patients
Impact Quality Importance № of studies
Study design
Risk of bias Inconsistency Indirectness Imprecision Other
considerations
New models of
cooperative care
usual care
Access to rehabilitation services - not measured
- - - - - - - - - -
Utilization of rehabilitation services and continuity of care (assessed with: Transition from pediatric to adult rehabilitation)
2 observational studies
serious 1 not serious not serious serious 2 3 4 none The authors identified 5 key elements that support a positive transition to adult centered health care: preparation, flexible timing, care coordination, transition clinic visits, and interested adult-centered health care providers. Overall, there is limited empirical evidence related to the process and outcomes of the transition to adult-centered health care for CP and SB patients. Most of the empirical evidence relates to the functional status (ie, mobility) and social status (ie, living arrangements) of these populations, and their life expectancy and causes of death
⨁◯
◯
◯ VERY LOW
IMPORTANT
Rehabilitation outcomes (e.g., prevention or slowing of the loss of function, improvement or restoration of function, compensation for lost function) - not measured
- - - - - - - - - -
Health outcomes (e.g., mortality, morbidity, and quality of life) - not measured
- - - - - - - - - -
Health outcomes (e.g. mortality, morbidity, and quality of life) - not measured
- - - - - - - - - -
MD – mean difference, RR – relative risk 1. Unclear moderator bias. Unclear if there were biased questions, answers, sample and reporting bias 2. No meta-analysis performed 3. Stevenson et al assessed the use of health services, welfare, and social functioning before and after leaving school for youths and adults with CP. They identified fragmentation of services after
adolescence. General health was considered poor in 21% of their “older” group (20 and 22 years of age), and in 9% of their “younger” group (15 to 18 years of age). Their “older” group also felt more socially isolated than the “younger” group. Morgan et al assessed the decline in contact with health and social service departments for young adults with SB. It was clear from their evaluation that more than half of the young people had unmet medical needs and were grateful for the offer of an annual assessment in the adult setting.
4. Conclusions: We identified 5 key elements that support a positive transition to adultcentered health care: preparation, flexible timing, care coordination, transition clinic visits, and interested adult-centered health care providers. Overall, there is limited empirical evidence related to the process and outcomes of the transition to adult-centered health care for CP and SB patients. Most of the empirical evidence relates to the functional status (ie, mobility) and social status (ie, living arrangements) of these populations, and their life expectancy and causes of death
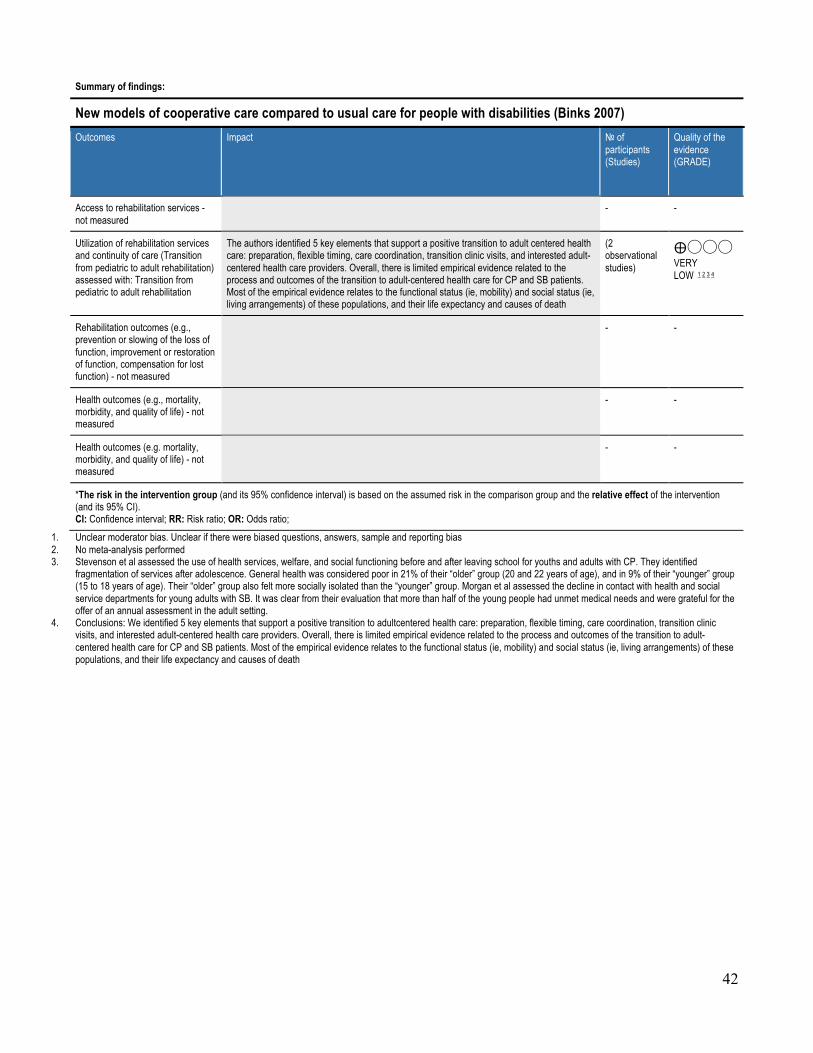
42
Summary of findings:
New models of cooperative care compared to usual care for people with disabilities (Binks 2007) Outcomes Impact № of
participants (Studies)
Quality of the evidence (GRADE)
Access to rehabilitation services - not measured
- -
Utilization of rehabilitation services and continuity of care (Transition from pediatric to adult rehabilitation) assessed with: Transition from pediatric to adult rehabilitation
The authors identified 5 key elements that support a positive transition to adult centered health care: preparation, flexible timing, care coordination, transition clinic visits, and interested adult-centered health care providers. Overall, there is limited empirical evidence related to the process and outcomes of the transition to adult-centered health care for CP and SB patients. Most of the empirical evidence relates to the functional status (ie, mobility) and social status (ie, living arrangements) of these populations, and their life expectancy and causes of death
(2 observational studies)
⨁◯◯◯ VERY LOW 1 2 3 4
Rehabilitation outcomes (e.g., prevention or slowing of the loss of function, improvement or restoration of function, compensation for lost function) - not measured
- -
Health outcomes (e.g., mortality, morbidity, and quality of life) - not measured
- -
Health outcomes (e.g. mortality, morbidity, and quality of life) - not measured
- -
*The risk in the intervention group (and its 95% confidence interval) is based on the assumed risk in the comparison group and the relative effect of the intervention (and its 95% CI). CI: Confidence interval; RR: Risk ratio; OR: Odds ratio;
1. Unclear moderator bias. Unclear if there were biased questions, answers, sample and reporting bias 2. No meta-analysis performed 3. Stevenson et al assessed the use of health services, welfare, and social functioning before and after leaving school for youths and adults with CP. They identified
fragmentation of services after adolescence. General health was considered poor in 21% of their “older” group (20 and 22 years of age), and in 9% of their “younger” group (15 to 18 years of age). Their “older” group also felt more socially isolated than the “younger” group. Morgan et al assessed the decline in contact with health and social service departments for young adults with SB. It was clear from their evaluation that more than half of the young people had unmet medical needs and were grateful for the offer of an annual assessment in the adult setting.
4. Conclusions: We identified 5 key elements that support a positive transition to adultcentered health care: preparation, flexible timing, care coordination, transition clinic visits, and interested adult-centered health care providers. Overall, there is limited empirical evidence related to the process and outcomes of the transition to adult-centered health care for CP and SB patients. Most of the empirical evidence relates to the functional status (ie, mobility) and social status (ie, living arrangements) of these populations, and their life expectancy and causes of death
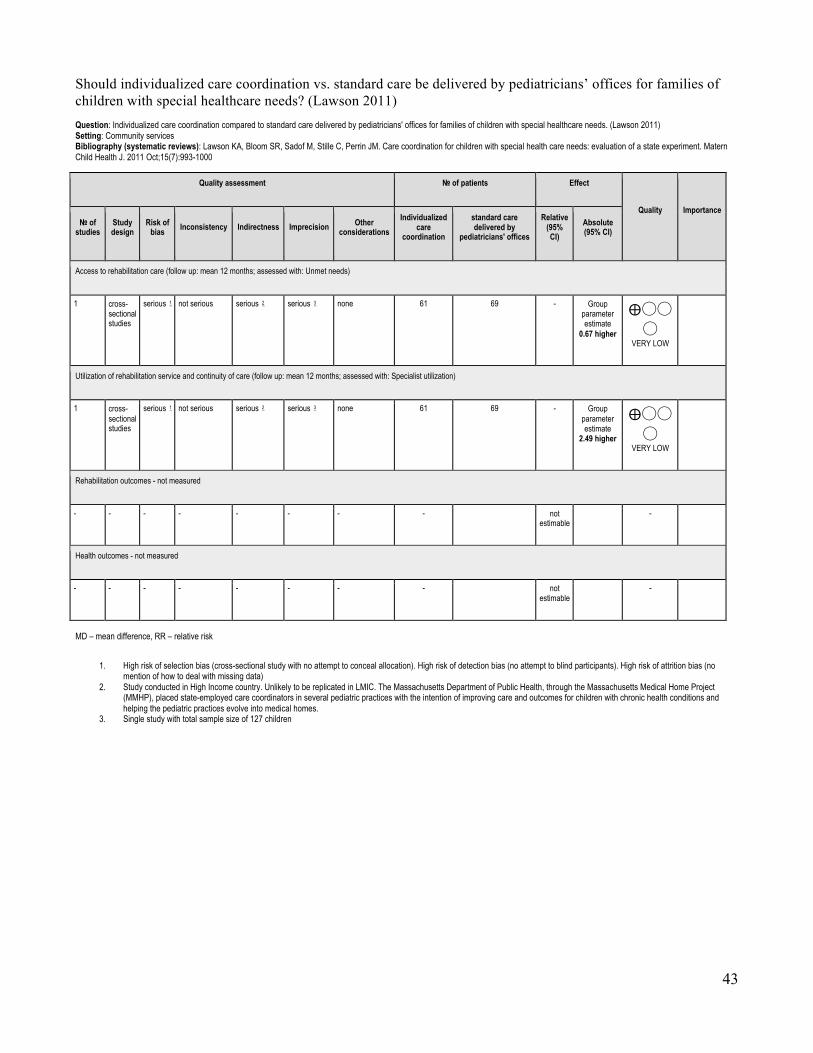
43
Should individualized care coordination vs. standard care be delivered by pediatricians’ offices for families of children with special healthcare needs? (Lawson 2011) Question: Individualized care coordination compared to standard care delivered by pediatricians' offices for families of children with special healthcare needs. (Lawson 2011) Setting: Community services Bibliography (systematic reviews): Lawson KA, Bloom SR, Sadof M, Stille C, Perrin JM. Care coordination for children with special health care needs: evaluation of a state experiment. Matern Child Health J. 2011 Oct;15(7):993-1000
Quality assessment № of patients Effect
Quality Importance № of
studies Study design
Risk of bias Inconsistency Indirectness Imprecision Other
considerations Individualized
care coordination
standard care delivered by
pediatricians' offices
Relative (95% CI)
Absolute (95% CI)
Access to rehabilitation care (follow up: mean 12 months; assessed with: Unmet needs)
1 cross-sectional studies
serious 1 not serious serious 2 serious 3 none 61 69 - Group parameter estimate
0.67 higher
⨁◯◯◯
VERY LOW
Utilization of rehabilitation service and continuity of care (follow up: mean 12 months; assessed with: Specialist utilization)
1 cross-sectional studies
serious 1 not serious serious 2 serious 3 none 61 69 - Group parameter estimate
2.49 higher
⨁◯◯◯
VERY LOW
Rehabilitation outcomes - not measured
- - - - - - - - not estimable
-
Health outcomes - not measured
- - - - - - - - not estimable
-
MD – mean difference, RR – relative risk
1. High risk of selection bias (cross-sectional study with no attempt to conceal allocation). High risk of detection bias (no attempt to blind participants). High risk of attrition bias (no mention of how to deal with missing data)
2. Study conducted in High Income country. Unlikely to be replicated in LMIC. The Massachusetts Department of Public Health, through the Massachusetts Medical Home Project (MMHP), placed state-employed care coordinators in several pediatric practices with the intention of improving care and outcomes for children with chronic health conditions and helping the pediatric practices evolve into medical homes.
3. Single study with total sample size of 127 children
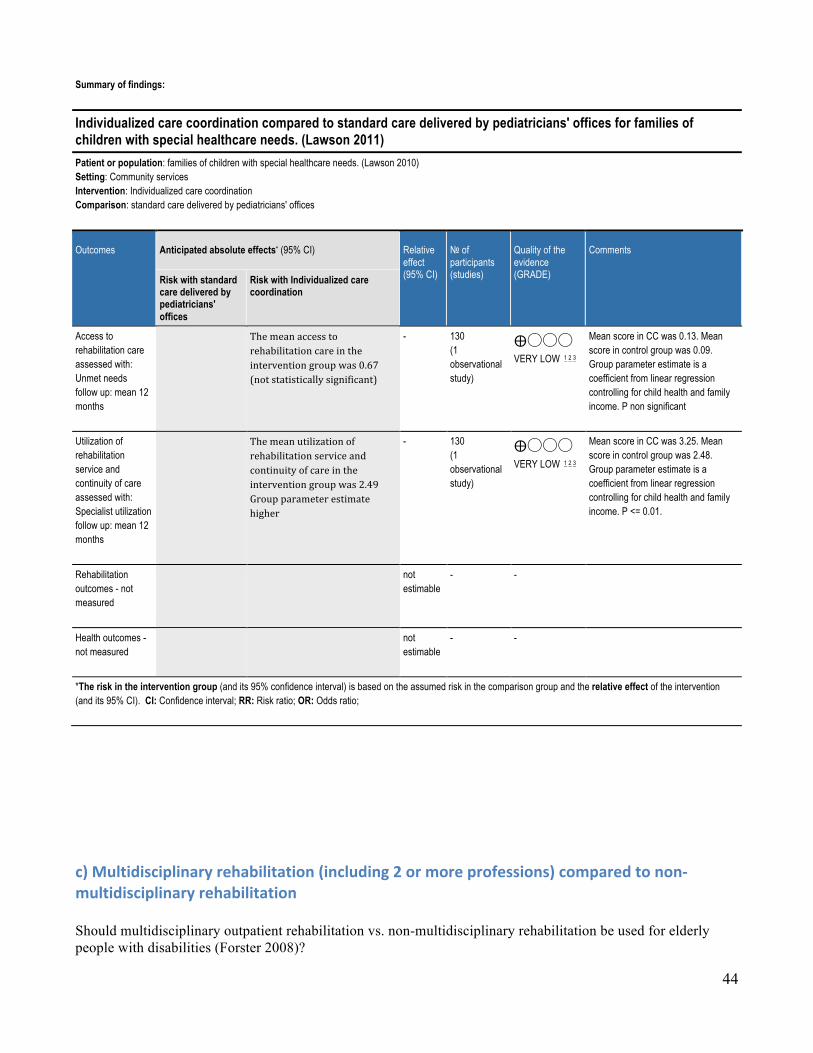
44
Summary of findings:
Individualized care coordination compared to standard care delivered by pediatricians' offices for families of children with special healthcare needs. (Lawson 2011) Patient or population: families of children with special healthcare needs. (Lawson 2010) Setting: Community services Intervention: Individualized care coordination Comparison: standard care delivered by pediatricians' offices
Outcomes Anticipated absolute effects* (95% CI) Relative effect (95% CI)
№ of participants (studies)
Quality of the evidence (GRADE)
Comments
Risk with standard care delivered by pediatricians' offices
Risk with Individualized care coordination
Access to rehabilitation care assessed with: Unmet needs follow up: mean 12 months
Themeanaccesstorehabilitationcareintheinterventiongroupwas0.67(notstatisticallysignificant)
- 130 (1 observational study)
⨁◯◯◯ VERY LOW 1 2 3
Mean score in CC was 0.13. Mean score in control group was 0.09. Group parameter estimate is a coefficient from linear regression controlling for child health and family income. P non significant
Utilization of rehabilitation service and continuity of care assessed with: Specialist utilization follow up: mean 12 months
Themeanutilizationofrehabilitationserviceandcontinuityofcareintheinterventiongroupwas2.49Groupparameterestimatehigher
- 130 (1 observational study)
⨁◯◯◯ VERY LOW 1 2 3
Mean score in CC was 3.25. Mean score in control group was 2.48. Group parameter estimate is a coefficient from linear regression controlling for child health and family income. P <= 0.01.
Rehabilitation outcomes - not measured
not estimable
- -
Health outcomes - not measured
not estimable
- -
*The risk in the intervention group (and its 95% confidence interval) is based on the assumed risk in the comparison group and the relative effect of the intervention (and its 95% CI). CI: Confidence interval; RR: Risk ratio; OR: Odds ratio;
c)Multidisciplinaryrehabilitation(including2ormoreprofessions)comparedtonon-multidisciplinaryrehabilitationShould multidisciplinary outpatient rehabilitation vs. non-multidisciplinary rehabilitation be used for elderly people with disabilities (Forster 2008)?
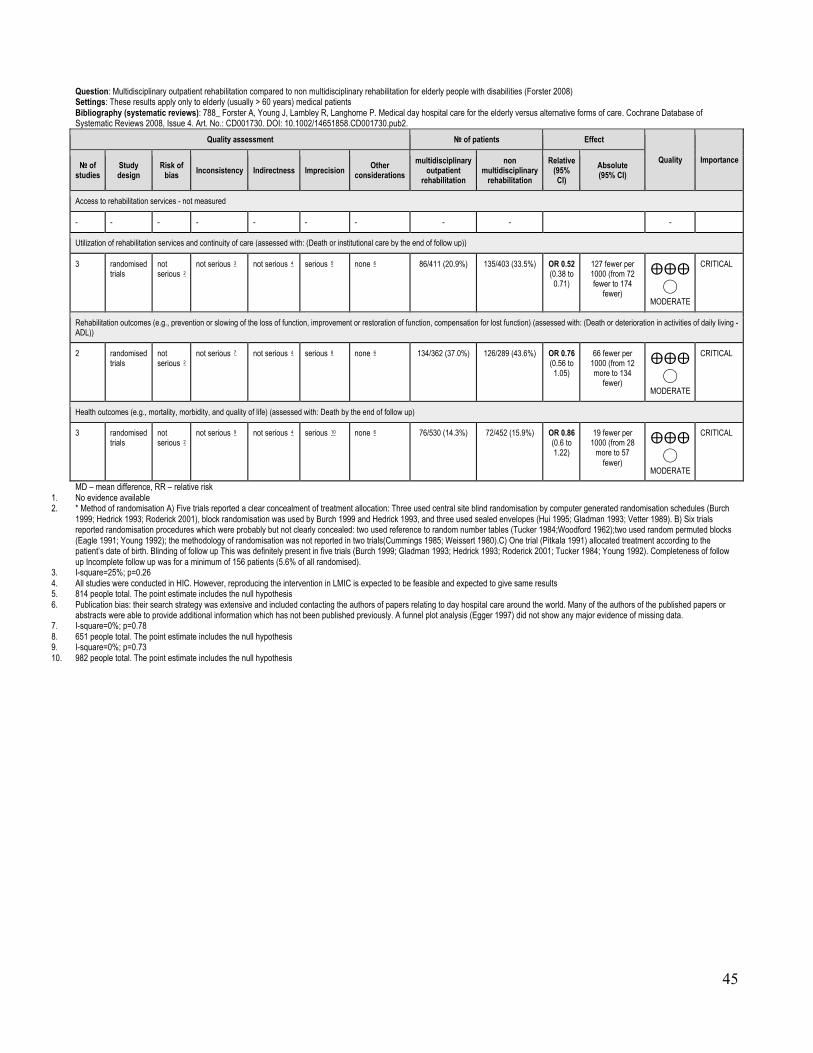
45
Question: Multidisciplinary outpatient rehabilitation compared to non multidisciplinary rehabilitation for elderly people with disabilities (Forster 2008) Settings: These results apply only to elderly (usually > 60 years) medical patients Bibliography (systematic reviews): 788_ Forster A, Young J, Lambley R, Langhorne P. Medical day hospital care for the elderly versus alternative forms of care. Cochrane Database of Systematic Reviews 2008, Issue 4. Art. No.: CD001730. DOI: 10.1002/14651858.CD001730.pub2.
Quality assessment № of patients Effect
Quality Importance № of studies
Study design
Risk of bias Inconsistency Indirectness Imprecision Other
considerations multidisciplinary
outpatient rehabilitation
non multidisciplinary
rehabilitation
Relative (95% CI)
Absolute (95% CI)
Access to rehabilitation services - not measured
- - - - - - - - - -
Utilization of rehabilitation services and continuity of care (assessed with: (Death or institutional care by the end of follow up))
3 randomised trials
not serious 2
not serious 3 not serious 4 serious 5 none 6 86/411 (20.9%) 135/403 (33.5%) OR 0.52 (0.38 to
0.71)
127 fewer per 1000 (from 72 fewer to 174
fewer)
⨁⨁⨁◯
MODERATE
CRITICAL
Rehabilitation outcomes (e.g., prevention or slowing of the loss of function, improvement or restoration of function, compensation for lost function) (assessed with: (Death or deterioration in activities of daily living - ADL))
2 randomised trials
not serious 2
not serious 7 not serious 4 serious 8 none 6 134/362 (37.0%) 126/289 (43.6%) OR 0.76 (0.56 to
1.05)
66 fewer per 1000 (from 12 more to 134
fewer)
⨁⨁⨁◯
MODERATE
CRITICAL
Health outcomes (e.g., mortality, morbidity, and quality of life) (assessed with: Death by the end of follow up)
3 randomised trials
not serious 2
not serious 9 not serious 4 serious 10 none 6 76/530 (14.3%) 72/452 (15.9%) OR 0.86 (0.6 to 1.22)
19 fewer per 1000 (from 28
more to 57 fewer)
⨁⨁⨁◯
MODERATE
CRITICAL
MD – mean difference, RR – relative risk 1. No evidence available 2. * Method of randomisation A) Five trials reported a clear concealment of treatment allocation: Three used central site blind randomisation by computer generated randomisation schedules (Burch
1999; Hedrick 1993; Roderick 2001), block randomisation was used by Burch 1999 and Hedrick 1993, and three used sealed envelopes (Hui 1995; Gladman 1993; Vetter 1989). B) Six trials reported randomisation procedures which were probably but not clearly concealed: two used reference to random number tables (Tucker 1984;Woodford 1962);two used random permuted blocks (Eagle 1991; Young 1992); the methodology of randomisation was not reported in two trials(Cummings 1985; Weissert 1980).C) One trial (Pitkala 1991) allocated treatment according to the patient’s date of birth. Blinding of follow up This was definitely present in five trials (Burch 1999; Gladman 1993; Hedrick 1993; Roderick 2001; Tucker 1984; Young 1992). Completeness of follow up Incomplete follow up was for a minimum of 156 patients (5.6% of all randomised).
3. I-square=25%; p=0.26 4. All studies were conducted in HIC. However, reproducing the intervention in LMIC is expected to be feasible and expected to give same results 5. 814 people total. The point estimate includes the null hypothesis 6. Publication bias: their search strategy was extensive and included contacting the authors of papers relating to day hospital care around the world. Many of the authors of the published papers or
abstracts were able to provide additional information which has not been published previously. A funnel plot analysis (Egger 1997) did not show any major evidence of missing data. 7. I-square=0%; p=0.78 8. 651 people total. The point estimate includes the null hypothesis 9. I-square=0%; p=0.73 10. 982 people total. The point estimate includes the null hypothesis

46
SummaryofFindings:Multidisciplinaryout-patientrehabilitationcomparedtonon-multidisciplinaryrehabilitationforelderlypeoplewithdisabilities.(Forster2008)Outcomes Anticipated absolute effects (95% CI) Relative
effect (95% CI)
№ of participants (Studies)
Quality of the evidence (GRADE)
Comments
Risk with non-multidisciplinary rehabilitation
Risk with multidisciplinary out-patient rehabilitation
Access to rehabilitation services
not estimable
(0 Studies) 1
Utilization of rehabilitation services and continuity of care - Death or institutional care by the end of follow up
Study population elderly (usually > 60 years) medical patients
OR 0.52 (0.38 to 0.71)
814 (3 RCTs)
⨁⨁⨁◯ MODERATE 2 3 4 5 6
Significantly 127 fewer per 1000 (from 72 fewer to 174 fewer)
335 per 1000 208 per 1000 (161 to 263)
Rehabilitation outcomes - Death or deterioration in activities of daily living - ADL
Study population elderly (usually > 60 years) medical patients
OR 0.76 (0.56 to 1.05)
651 (2 RCTs)
⨁⨁⨁◯ MODERATE 2 4 6 7 8
66 fewer per 1000 (from 12 more to 134 fewer). CI includes both benefit and harm 436 per 1000 370 per 1000
(302 to 448)
Health outcomes - Death by the end of follow up
Study population elderly (usually > 60 years) medical patients
OR 0.86 (0.6 to 1.22)
982 (3 RCTs)
⨁⨁⨁◯ MODERATE 2 4 6 9 10
19 fewer per 1000 (from 28 more to 57 fewer). CI includes both benefit and harm 159 per 1000 140 per 1000
(102 to 188)
*The risk in the intervention group (and its 95% confidence interval) is based on the assumed risk in the comparison group and the relative effect of the intervention (and its 95% CI). CI: Confidence interval; OR: Odds ratio;
1. No evidence available 2. Not serious risk of bias 3. I-square=25%; p=0.26 4. All studies were conducted in HIC. However, reproducing the intervention in LMIC is expected to be feasible and expected to give same results 5. 814 people total. The point estimate includes the null hypothesis 6. Publication bias: their search strategy was extensive and included contacting the authors of papers relating to day hospital care around the world. Many of the authors of
the published papers or abstracts were able to provide additional information which has not been published previously. A funnel plot analysis (Egger 1997) did not show any major evidence of missing data.
7. I-square=0%; p=0.78 8. 651 people total. The point estimate includes the null hypothesis 9. I-square=0%; p=0.73 10. 982 people total. The point estimate includes the null hypothesis

47
Should specific in-patient rehabilitation vs. usual care without rehabilitation be used for geriatric patients with disability? (Bachmann 2010) Settings: General hospitals, community hospitals, community based medical centre, Bibliography (systematic reviews): Bachmann S, Finger C, Huss A, Egger M, Stuck AE, Clough-Gorr KM. Inpatient rehabilitation specifically designed for geriatric patients: systematic review and meta-analysis of randomised controlled trials. BMJ. 2010 Apr 20;340:c1718. doi: 10.1136/bmj.c1718. Review. PubMed PMID: 20406866; PubMed Central PMCID: PMC2857746.
Quality assessment № of patients Effect
Quality Importance № of studies
Study design
Risk of bias Inconsistency Indirectness Imprecision Other
considerations specific in-
patient rehabilitation
usual care without
rehabilitation
Relative (95% CI)
Absolute (95% CI)
Assess to rehabilitation services - not measured
- - - - - - - - - -
Utilization of rehabilitation services and continuity of care (assessed with: admission to nursing homes)
13 randomised trials
not serious 1
not serious 2 not serious 3 not serious 4
none 5 364/1995 (18.2%)
431/2038 (21.1%)
RR 0.84 (0.72 to
0.99)
34 fewer per 1000 (from 2 fewer to 59
fewer) ⨁⨁⨁⨁
HIGH
CRITICAL
Rehabilitation outcome: Functional status (assessed with: using Barthel Index or Katz Index at hospital discharge and at 3-12 month follow-up)
12 randomised trials
not serious 1
not serious 8 not serious 3 not serious 9
none 5 /1997 /2042 OR 1.36 (1.07 to
1.71)
0 fewer per 1000 (from 0 fewer to 0
fewer) ⨁⨁⨁⨁
HIGH
CRITICAL
Health outcomes (assessed with: Mortality at hospital discharge and 3-12 month follow-up)
15 randomised trials
not serious 1
not serious 6 not serious 3 not serious 7
none 5 434/2206 (19.7%)
498/2281 (21.8%)
RR 0.87 (0.77 to
0.97)
28 fewer per 1000 (from 7 fewer to 50
fewer) ⨁⨁⨁⨁
HIGH
CRITICAL
MD – mean difference, RR – relative risk 1. low risk of selection bias, measurement bias and attrition bias 2. I-square=22.6%: p=0.215 3. All studies were conducted in HIC. However, reproducing the intervention in LMIC is expected to be feasible and expected to give same results 4. Large sample size: Inpatient rehabilitation: 1,995, usual care: 2,038; TOTAL=4,033 5. Funnel plots and bias tests indicate little evidence of risk of publication bias 6. I-square=0%; p=0.601 7. Large sample size: Inpatient rehabilitation: 2,206, usual care: 2,281; TOTAL=4,487 8. I-square=51.4%; p=0.020. 9. Large sample size: Inpatient rehabilitation: 1,997, usual care: 2,142; TOTAL=4,139 10. No evidence identified
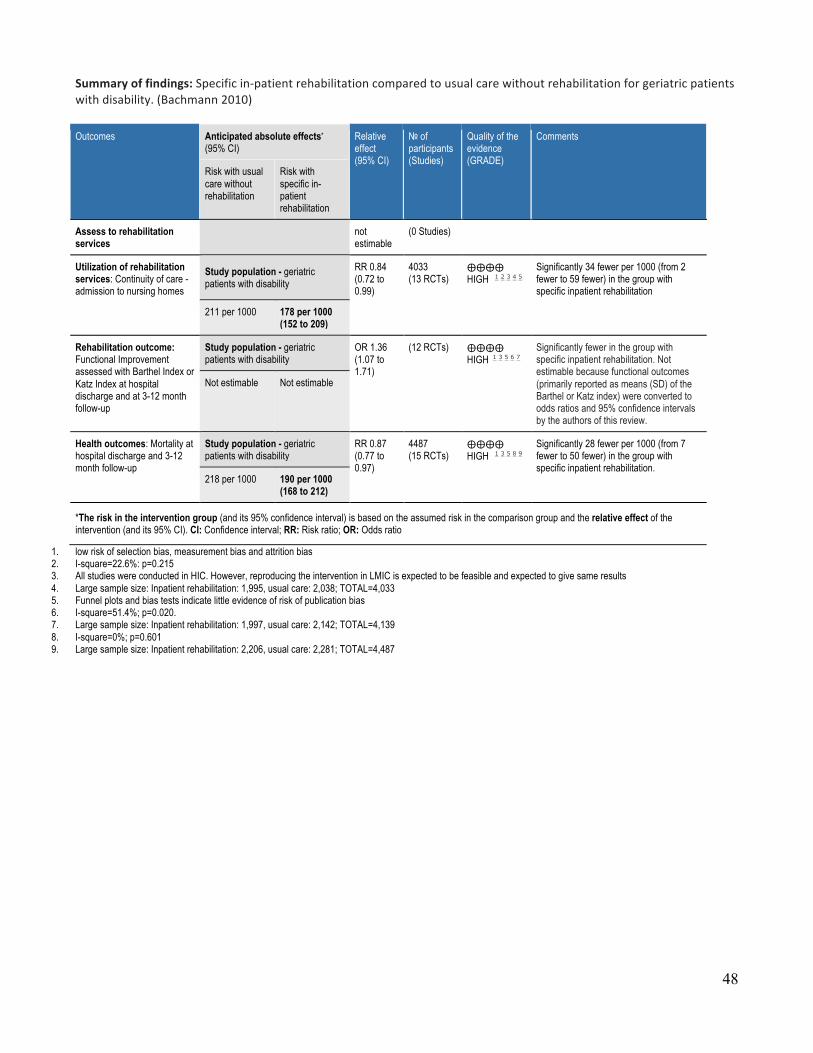
48
Summaryoffindings:Specificin-patientrehabilitationcomparedtousualcarewithoutrehabilitationforgeriatricpatientswithdisability.(Bachmann2010)
1. Outcomes Anticipated absolute effects* (95% CI)
Relative effect (95% CI)
№ of participants (Studies)
Quality of the evidence (GRADE)
Comments
Risk with usual care without rehabilitation
Risk with specific in-patient rehabilitation
Assess to rehabilitation services not
estimable (0 Studies)
Utilization of rehabilitation services: Continuity of care - admission to nursing homes
Study population - geriatric patients with disability
RR 0.84 (0.72 to 0.99)
4033 (13 RCTs)
⨁⨁⨁⨁ HIGH 1 2 3 4 5
Significantly 34 fewer per 1000 (from 2 fewer to 59 fewer) in the group with specific inpatient rehabilitation
211 per 1000 178 per 1000 (152 to 209)
Rehabilitation outcome: Functional Improvement assessed with Barthel Index or Katz Index at hospital discharge and at 3-12 month follow-up
Study population - geriatric patients with disability
OR 1.36 (1.07 to 1.71)
(12 RCTs) ⨁⨁⨁⨁ HIGH 1 3 5 6 7
Significantly fewer in the group with specific inpatient rehabilitation. Not estimable because functional outcomes (primarily reported as means (SD) of the Barthel or Katz index) were converted to odds ratios and 95% confidence intervals by the authors of this review.
Not estimable Not estimable
Health outcomes: Mortality at hospital discharge and 3-12 month follow-up
Study population - geriatric patients with disability
RR 0.87 (0.77 to 0.97)
4487 (15 RCTs)
⨁⨁⨁⨁ HIGH 1 3 5 8 9
Significantly 28 fewer per 1000 (from 7 fewer to 50 fewer) in the group with specific inpatient rehabilitation.
218 per 1000 190 per 1000 (168 to 212)
*The risk in the intervention group (and its 95% confidence interval) is based on the assumed risk in the comparison group and the relative effect of the intervention (and its 95% CI). CI: Confidence interval; RR: Risk ratio; OR: Odds ratio
1. low risk of selection bias, measurement bias and attrition bias 2. I-square=22.6%: p=0.215 3. All studies were conducted in HIC. However, reproducing the intervention in LMIC is expected to be feasible and expected to give same results 4. Large sample size: Inpatient rehabilitation: 1,995, usual care: 2,038; TOTAL=4,033 5. Funnel plots and bias tests indicate little evidence of risk of publication bias 6. I-square=51.4%; p=0.020. 7. Large sample size: Inpatient rehabilitation: 1,997, usual care: 2,142; TOTAL=4,139 8. I-square=0%; p=0.601 9. Large sample size: Inpatient rehabilitation: 2,206, usual care: 2,281; TOTAL=4,487

49
Should coordinated multidisciplinary, specialized inpatient rehabilitation vs. usual (orthopaedic) care be used for elderly with hip fracture (Handoll 2009)? Question: Coordinated multidisciplinary, specialized inpatient rehabilitation compared to usual (orthopaedic) care for elderly with hip fracture (Handoll 2009) Settings: Hospital Bibliography (systematic reviews): Handoll HHG, Cameron ID, Mak JCS, Finnegan TP. Multidisciplinary rehabilitation for older people with hip fractures.Cochrane Database of Systematic Reviews 2009, Issue 4. Art. No.: CD007125. DOI: 10.1002/14651858.CD007125.pub2. (Cochrane Review).
Quality assessment № of patients Effect
Quality Importance № of studies
Study design
Risk of bias Inconsistency Indirectness Imprecision Other
considerations
coordinated multidisciplinary,
specialized inpatient
rehabilitation
usual (orthopaedic)
care
Relative (95% CI)
Absolute (95% CI)
Access to rehabilitation services - not measured
- - - - - - - - - -
Utilization of rehabilitation services and continuity of care (assessed with: length of hospital days (admission to discharge))
8 randomised trials
serious 2 serious 3 not serious 4 serious 5 none /817 /846 There was considerable heterogeneity among the studies for this outcome. No conclusions are provided for this outcome.
⨁◯◯◯
VERY LOW
IMPORTANT
Utilization of rehabilitation services and continuity of care (assessed with: Readmission to hospital during follow -up)
6 randomised trials
serious 2 not serious 6 not serious 4 serious 7 none 160/629 (25.4%) 165/640 (25.8%)
Risk Ratio 0.99
(0.82 to 1.19)
0 fewer per 1000 (from 0 fewer to 0
fewer) ⨁⨁◯◯
LOW
IMPORTANT
Rehabilitation outcomes (assessed with: Barthel Scores at long-term follow up (minimum follow-up of six months from time of injury))
2 randomised trials
serious 2 not serious 8 not serious 4 serious 9 none The results for each study is given separately: Chinese barthel index (SD) – 90.53(19.4) Modified barthel index – 95.3(9.8) Barthel scores at long term follow-up: mean difference (95% CI): 6.17 (-0.86 to 13,20) mean difference (95% CI): 6.30 (-0.53 to 13.13)
⨁⨁◯◯
LOW
IMPORTANT
Health outcomes (assessed with: ’poor outcome-long term’ (defined as death or deterioration of functional status leading to increased dependency in the community or admission to institutional care within one year follow-up )
8 randomised trials
serious 2 not serious 10 not serious 4 not serious 11
none 272/817 (33.3%) 306/816 (37.5%)
Risk Ratio 0.89
(0.78 to 1.01)
0 fewer per 1000 (from 0 fewer to 0
fewer) ⨁⨁⨁◯
MODERATE
IMPORTANT
Health outcomes (e.g., mortality, morbidity, and quality of life) (assessed with: mortality at the end of scheduled follow-up)
11 randomised trials
serious 2 not serious 12 not serious 4 serious 13 none 194/1143 (17.0%) 225/1191 (18.9%)
Risk Ratio
0.9 (0.76 to
1.07)
0 fewer per 1000 (from 0 fewer to 0
fewer) ⨁⨁◯◯
LOW
CRITICAL
MD – mean difference, RR – relative risk 1. No evidence available 2. High risk of measurement and performance bias 3. No meta-analyses, and the criteria above is not met: 4. All studies were conducted in high income countries (Australia, UK, Canada, Spain, Sweden and aiwan, however reproducing the intervention in low and middle income countries is expected to be
feasible and to give the same results. 5. Small sample size. Total number of participants=1663; multidisciplinary = 817; usual care = 846 6. I-square=28%; p=0.22 7. total N= 1269, but 95% CI includes null hypothesis 8. The two studies do not appear heterogeneous 9. Small sample size. Total=208; multidisciplinary=106; usual care=102 10. I-square=22%; p= 11. total N= 1633 but 95% CI includes null hypothesis 12. I-square=0%; p= 13. Total number of participants=2334; multidisciplinary=1143; control=1191. 95% CI includes the null hypothesis

50
Summary of findings:
Coordinated multidisciplinary, specialized inpatient rehabilitation compared to usual (orthopaedic) care for elderly with hip fracture (Handoll 2009) Outcomes Anticipated absolute effects* (95% CI) Relative
effect (95% CI)
№ of participants (Studies)
Quality of the evidence (GRADE)
Comments
Risk with usual (orthopaedic) care
Risk with coordinated multidisciplinary, specialized inpatient rehabilitation
Access to rehabilitation services - not measured
- -
Utilization of rehabilitation services and continuity of care assessed with: length of hospital days (admission to discharge)
There was considerable heterogeneity among the studies for this outcome. No conclusions are provided for this outcome.
1663 (8 RCTs) ⨁◯◯◯
VERY LOW 2 3 4 5
Utilization of rehabilitation services and continuity of care assessed with: Readmission to hospital during follow -up
Risk Ratio 0.99 (0.82 to 1.19)
1269 (6 RCTs) ⨁⨁◯◯
LOW 2 4 6 7
258 per 1000 255 per 1000
(211 to 307)
Rehabilitation outcomes assessed with: Barthel Scores at long-term follow up (minimum follow-up of six months from time of injury)
The results for each study is given separately: Chinese barthel index (SD) – 90.53(19.4) Modified barthel index – 95.3(9.8) Barthel scores at long term follow-up: mean difference (95% CI): 6.17 (-0.86 to 13,20) mean difference (95% CI): 6.30 (-0.53 to 13.13)
(2 RCTs) ⨁⨁◯◯ LOW 2 4 8 9
Health outcomes assessed with: ’poor outcome-long term’ (defined as death or deterioration of functional status leading to increased dependency in the community or admission to institutional care within one year follow-up
Risk Ratio 0.89 (0.78 to 1.01)
1633 (8 RCTs) ⨁⨁⨁◯
MODERATE 2 4 10 11
375 per 1000 334 per 1000
(293 to 379)
Health outcomes (e.g., mortality, morbidity, and quality of life) assessed with: mortality at the end of scheduled follow-up
Risk Ratio 0.9 (0.76 to 1.07)
2334 (11 RCTs) ⨁⨁◯◯
LOW 2 4 12 13
189 per 1000 170 per 1000
(144 to 202)
*The risk in the intervention group (and its 95% confidence interval) is based on the assumed risk in the comparison group and the relative effect of the intervention (and its 95% CI). CI: Confidence interval; RR: Risk ratio; OR: Odds ratio;
1. No evidence available 2. High risk of measurement and performance bias 3. No meta-analyses, and the criteria above is not met: 4. All studies were conducted in high income countries (Australia, UK, Canada, Spain, Sweden and aiwan, however reproducing the intervention in low and middle income
countries is expected to be feasible and to give the same results. 5. Small sample size. Total number of participants=1663; multidisciplinary = 817; usual care = 846 6. I-square=28%; p=0.22 7. total N= 1269, but 95% CI includes null hypothesis 8. The two studies do not appear heterogeneous 9. Small sample size. Total=208; multidisciplinary=106; usual care=102 10. I-square=22%; p= 11. total N= 1633 but 95% CI includes null hypothesis 12. I-square=0%; p= 13. Total number of participants=2334; multidisciplinary=1143; control=1191. 95% CI includes the null hypothesis

51
Should accelerated discharge and multidisciplinary home-based rehabilitation vs. usual inpatient rehabilitation be used for older people with hip fracture? (Handoll 2009) Question: Accelerated discharge and multidisciplinary home-based rehabilitation compared to usual inpatient rehabilitation for older people with hip fracture (Handoll 2009) Settings: hospital and home based rehabilitation with multidisciplinary team Bibliography (systematic reviews): 327_Handoll HHG, Cameron ID, Mak JCS, Finnegan TP. Multidisciplinary rehabilitation for older people with hip fractures.Cochrane Database of Systematic Reviews 2009, Issue 4. Art. No.: CD007125. DOI: 10.1002/14651858.CD007125.pub2.
Quality assessment № of patients Effect
Quality Importance № of studies
Study design
Risk of bias Inconsistency Indirectness Imprecision Other
considerations accelerated discharge and multidisciplinary
home-based rehabilitation
usual inpatient
rehabilitation
Relative (95% CI)
Absolute (95% CI)
Access to rehabilitation services - not measured
- - - - - - - - - -
Utilization of rehabilitation services and continuity of care (assessed with: length of hospital stay)
1 randomised trials
serious 2 not serious 3 not serious 4 serious 5 none 32 34 - MD 6.5 higher
(11.3 lower to 1.7 lower)
⨁⨁◯
◯ LOW
IMPORTANT
Rehabilitation outcomes (e.g., prevention or slowing of the loss of function, improvement or restoration of function, compensation for lost function) (assessed with: SF-36 (physical component) at 12 months )
1 randomised trials
serious 2 not serious 3 not serious 4 serious 6 none 28 28 - MD 4.7 higher
(0.43 lower to 9.83 higher)
⨁⨁◯
◯ LOW
IMPORTANT
Health outcomes (e.g., mortality, morbidity, and quality of life) (assessed with: ’poor outcome’ (defined as mortality, institutional care and unable to walk (1 year follow up). )
1 randomised trials
serious 2 not serious 3 not serious 4 serious 7 none 3/34 (8.8%) 4/32 (12.5%) Risk Ratio 0.71
(0.17 to 2.91)
0 fewer per 1000 (from 0
fewer to 0 fewer)
⨁⨁◯
◯ LOW
IMPORTANT
MD – mean difference, RR – relative risk 1. No evidence available for this outcome 2. Unclear risk of measurement and attrition bias 3. A single study only. Inconsistency not applicable 4. Study conducted in Australia. However, reproducing the intervention in low and middle income countries is expected to be feasible and to give the same results 5. Small sample size. Total number of participants=66; home multidisciplinary rehabilitation=32; in-patient multidisciplinary rehabilitation=32. 95%CI null hypothesis 6. Small sample size: total number of participants=56; multidisciplinary home rehabilitation=28; multidisciplianry in-patient rehabilitation=28. 95%CI null hypothesis 7. Small sample size. Total number of participants=66; home multidisciplinary=34; in-patient multidisciplinary=32

52
Summary of findings:
Accelerated discharge and multidisciplinary home-based rehabilitation compared to usual inpatient rehabilitation for older people with hip fracture (Handoll 2009) Outcomes Anticipated absolute effects* (95% CI) Relative
effect (95% CI)
№ of participants (Studies)
Quality of the evidence (GRADE)
Comments
Risk with usual inpatient rehabilitation
Risk with accelerated discharge and multidisciplinary home-based rehabilitation
Access to rehabilitation services - not measured
- -
Utilization of rehabilitation services and continuity of care assessed with: length of hospital stay
The mean utilization of rehabilitation services and continuity of care in the intervention group was 6.5 higher (11.3 lower to 1.7 lower)
- 66 (1 RCT) ⨁⨁◯◯
LOW 2 3 4 5
Rehabilitation outcomes (e.g., prevention or slowing of the loss of function, improvement or restoration of function, compensation for lost function) assessed with: SF-36 (physical component) at 12 months
The mean rehabilitation outcomes (e.g., prevention or slowing of the loss of function, improvement or restoration of function, compensation for lost function) in the intervention group was 4.7 higher (0.43 lower to 9.83 higher)
- 56 (1 RCT) ⨁⨁◯◯
LOW 2 3 4 6
Health outcomes (e.g., mortality, morbidity, and quality of life) assessed with: ’poor outcome’ (defined as mortality, institutional care and unable to walk (1 year follow up).
Risk Ratio 0.71 (0.17 to 2.91)
66 (1 RCT) ⨁⨁◯◯
LOW 2 3 4 7
125 per 1000 89 per 1000
(21 to 364)
*The risk in the intervention group (and its 95% confidence interval) is based on the assumed risk in the comparison group and the relative effect of the intervention (and its 95% CI). CI: Confidence interval; RR: Risk ratio; OR: Odds ratio;
1. No evidence available for this outcome 2. Unclear risk of measurement and attrition bias 3. A single study only. Inconsistency not applicable 4. Study conducted in Australia. However, reproducing the intervention in low and middle income countries is expected to be feasible and to give the same results 5. Small sample size. Total number of participants=66; home multidisciplinary rehabilitation=32; in-patient multidisciplinary rehabilitation=32. 95%CI null hypothesis 6. Small sample size: total number of participants=56; multidisciplinary home rehabilitation=28; multidisciplianry in-patient rehabilitation=28. 95%CI null hypothesis 7. Small sample size. Total number of participants=66; home multidisciplinary=34; in-patient multidisciplinary=32

53
Should low-intensity multidisciplinary rehabilitation vs. general neurology clinics be used for adults with amyotrophic lateral sclerosis or motor neuron disease? (Ng 2009) Question: Low-intensity multidisciplinary rehabilitation compared to general neurology clinics for adults with amyotrophic lateral sclerosis or motor neuron disease (Ng 2009) Settings: Bibliography (systematic reviews): 1767_Ng L, Khan F. Multidisciplinary care for adults with amyotrophic lateral sclerosis or motor neuron disease. Cochrane Database if Systematic Reviews 2009, Issue 4. Art. #: CD007425. DOI: 10.1002/14651858. CD007425 Pub 2.
Quality assessment № of patients
Impact Quality Importance № of studies
Study design
Risk of bias Inconsistency Indirectness Imprecision Other
considerations low-intensity
multidisciplinary rehabilitation
general neurology
clinics
Access to rehabilitation services - not measured
- - - - - - - - - -
Utilization of rehabilitation services and continuity of care (assessed with: hospitalization, readmission rates and length of stay)
2 observational studies 1
serious 2 not serious 3 serious 4 serious 5 none The prospective cohort study showed improved hospitalisation (fewer readmissions and shorter length of stay).
⨁◯◯◯
VERY LOW
IMPORTANT
Rehabilitation outcomes - not measured
- - - - - - - - - -
Health outcomes (e.g., mortality, morbidity, and quality of life) (assessed with: quality of Life)
1 observational studies
serious 2 not serious 6 serious 7 serious 8 none Results showed improvement in some mental health domains of quality of life
⨁◯◯◯
VERY LOW
CRITICAL
Health outcomes (e.g., mortality, morbidity, and quality of life) (assessed with: survival)
3 observational studies
serious 2 serious 9 serious 10 serious 11 none Two studies showed improvement in survival and one study did not show improvement in survival
⨁◯◯◯
VERY LOW
MD – mean difference, RR – relative risk 1. One study is a prospective cohort and the other study is a cross sectional study 2. Unclear or high risk of bias for one or more domains (sequence generation, allocation concealment, blinding, incomplete outcome data, selective outcome reporting and other issues) 3. No meta-analysis, but the two studies are not conflicting. 4. Studies were conducted in HIC (Italy, the Netherlands). Reproducing the intervention in low and middle income countries is not expected to be feasible and not to give the same results. 5. No meta-analysis and total sample size = 429 6. Only one study. Inconsistency does not apply 7. The study was conducted in HIC (the Netherlands). Reproducing the intervention in low and middle income countries is not expected to be feasible and not to give the same results. 8. No meta-analysis. Total number of participants=208 9. No meta-analysis, and variability among included studies 10. Studies were conducted in HIC (Italy, Ireland). Reproducing the intervention in low and middle income countries is not expected to be feasible and not to give the same results. 11. No meta-analyses. Total number of participants=691

54
Summary of findings:
Low-intensity multidisciplinary rehabilitation compared to general neurology clinics for adults with amyotrophic lateral sclerosis or motor neuron disease (Ng 2009) Outcomes Impact № of participants
(Studies) Quality of the evidence (GRADE)
Access to rehabilitation services - not measured
- -
Utilization of rehabilitation services and continuity of care assessed with: hospitalization, readmission rates and length of stay
The prospective cohort study showed improved hospitalisation (fewer readmissions and shorter length of stay).
(2 observational studies) 1 ⨁◯◯◯
VERY LOW 2 3 4 5
Rehabilitation outcomes - not measured - -
Health outcomes (e.g., mortality, morbidity, and quality of life) assessed with: quality of Life
Results showed improvement in some mental health domains of quality of life
(1 observational study) ⨁◯◯◯
VERY LOW 2 6 7 8
Health outcomes (e.g., mortality, morbidity, and quality of life) assessed with: survival
Two studies showed improvement in survival and one study did not show improvement in survival
(3 observational studies) ⨁◯◯◯
VERY LOW 2 9 10 11
*The risk in the intervention group (and its 95% confidence interval) is based on the assumed risk in the comparison group and the relative effect of the intervention (and its 95% CI). CI: Confidence interval; RR: Risk ratio; OR: Odds ratio;
1. One study is a prospective cohort and the other study is a cross sectional study 2. Unclear or high risk of bias for one or more domains (sequence generation, allocation concealment, blinding, incomplete outcome data, selective outcome reporting and
other issues) 3. No meta-analysis, but the two studies are not conflicting. 4. Studies were conducted in HIC (Italy, the Netherlands). Reproducing the intervention in low and middle income countries is not expected to be feasible and not to give the
same results. 5. No meta-analysis and total sample size = 429 6. Only one study. Inconsistency does not apply 7. The study was conducted in HIC (the Netherlands). Reproducing the intervention in low and middle income countries is not expected to be feasible and not to give the
same results. 8. No meta-analysis. Total number of participants=208 9. No meta-analysis, and variability among included studies 10. Studies were conducted in HIC (Italy, Ireland). Reproducing the intervention in low and middle income countries is not expected to be feasible and not to give the same
results. 11. No meta-analyses. Total number of participants=691

55
Should high-intensity multidisciplinary care vs. routinely available local services or lower levels of intervention be used for adults with amyotrophic lateral sclerosis or motor neuron disease? (Ng 2009) Question: High-intensity multidisciplinary care compared to routinely available local services or lower levels of intervention for adults with amyotrophic lateral sclerosis or motor neuron disease (Ng 2011) Settings: multidisciplinary clinics Bibliography (systematic reviews): 1767_Ng L, Khan F. Multidisciplinary care for adults with amyotrophic lateral sclerosis or motor neuron disease. Cochrane Database if Systematic Reviews 2009, Issue 4. Art. #: CD007425. DOI: 10.1002/14651858. CD007425 Pub 2.
Quality assessment № of patients
Impact Quality Importance № of studies
Study design
Risk of bias Inconsistency Indirectness Imprecision Other
considerations high-intensity
multidisciplinary care
routinely available local services or lower levels of
intervention
Access to rehabilitation services - not measured
- - - - - - - - - -
Utilization of rehabilitation services and continuity of care - not measured
- - - - - - - - - -
Rehabilitation outcomes (assessed with: Impairment and activity (function) as measured by forced vital capacity (FVC) and Amyotrophic Lateral Sclerosis Functional Rating Scale (ALSFRS))
1 observational studies
very serious 1
not serious 2 not serious 3 serious 4 none - High-intensity rehabilitation showed improvement in impairment and activity limitation.
⨁◯◯◯
VERY LOW
Health outcomes (e.g., mortality, morbidity, and quality of life) - not measured
- - - - - - - - - -
MD – mean difference, RR – relative risk 1. High risk of bias for all domains (sequence generation, allocation concealment, blinding, incomplete outcome data, selective outcome reporting and other issues) 2. Only one study. Inconsistency does not apply 3. Study conducted in low income country: Cuba 4. No meta-analysis. Only one study with total number of participants=6

56
Summary of findings:
High-intensity multidisciplinary care compared to routinely available local services or lower levels of intervention for adults with amyotrophic lateral sclerosis or motor neuron disease (Ng 2009) Outcomes Impact № of participants
(Studies) Quality of the evidence (GRADE)
Access to rehabilitation services - not measured - -
Utilization of rehabilitation services and continuity of care - not measured - -
Rehabilitation outcomes assessed with: Impairment and activity (function) as measured by forced vital capacity (FVC) and Amyotrophic Lateral Sclerosis Functional Rating Scale (ALSFRS)
High-intensity rehabilitation showed improvement in impairment and activity limitation.
(1 observational study) ⨁◯◯◯
VERY LOW 1 2 3 4
Health outcomes (e.g., mortality, morbidity, and quality of life) - not measured - -
*The risk in the intervention group (and its 95% confidence interval) is based on the assumed risk in the comparison group and the relative effect of the intervention (and its 95% CI). CI: Confidence interval; RR: Risk ratio; OR: Odds ratio;
1. High risk of bias for all domains (sequence generation, allocation concealment, blinding, incomplete outcome data, selective outcome reporting and other issues) 2. Only one study. Inconsistency does not apply 3. Study conducted in low income country: Cuba 4. No meta-analysis. Only one study with total number of participants=6

57
Should multidisciplinary inpatient rehabilitation vs. rehabilitation delivered at local non-specialist services in district hospitals or home based rehabilitation be used for traumatic brain injury and stroke? (Turner-Stokes 2005) Question: Multidisciplinary inpatient rehabilitation compared to rehabilitation delivered at local non-specialist services in district hospitals or home based rehabilitation for traumatic brain injury and stroke (Turner-Stokes 2005) Settings: hospitals in HIC Bibliography (systematic reviews): 2462_Turner-Stokes L, Nair A, Sedki I, Disler PB, Wade DT. Multi-disciplinary rehabilitation for acquired brain injury in adults of working age. Cochrane Database of Systematic Reviews 2005, Issue 3. Art.No.: CD004170. DOI: 10.1002/14651858.CD004170.pub2.
Quality assessment № of patients
Impact Quality Importance № of studies
Study design
Risk of bias Inconsistency Indirectness Imprecision Other
considerations multidisciplinary
inpatient rehabilitation
rehabilitation delivered at local non-specialist
services in district
hospitals or home based rehabilitation
Access to rehabilitation services - not measured
- - - - - - - - - -
Utilization of rehabilitation services and continuity of care - not measured
- - - - - - - - - -
Rehabilitation outcomes (assessed with: Activity and independence: Barthel Index, FIM and Newcastle Independence Assessment form (NIAF); care-givers’ health: GHQ-28 measured 1,2,3,6,12 and 24 months after injury; Impairment: Brunnstrom score, Ashworth (spasticity); Activity: FIM, Mini-mental state examination (MMSE) before and after rehabilitation )
1 randomised trials
serious 2 not serious 3 not serious 4 serious 5 none The results support the efficiency of specialized rehabilitation services in achieving lasting gains for patients with more severe disability over similar lengths of stay
⨁⨁◯
◯ LOW
CRITICAL
Rehabilitation outcomes (assessed with: Activity and independence: Barthel Index, FIM and Newcastle Independence Assessment form (NIAF); care-givers’ health: GHQ-28 measured 1,2,3,6,12 and 24 months after injury; Impairment: Brunnstrom score, Ashworth (spasticity); Activity: FIM, Mini-mental state examination (MMSE) before and after rehabilitation )
1 observational studies
serious 2 not serious 3 serious 4 serious 6 none Intensive in-patient rehabilitation provided significant more favorable functional and cognitive outcomes than home based rehabilitation programme. Significant group differences in favor of the in-patient group for change in Brunnstrom, FIM and MMSE scores, but no difference in spasticity: Brunnstrom: (UE) In-patient: Mean (SD)=2.0 (1.2); home-based rehabilitation=0.3 (0.6), p<0.001 Brunnstrom: (LE) In-patient: Mean (SD)=2.4 (1.2); home-based rehabilitation=0.8 (0.6), p<0.001 FIM: In-patient: Mean (SD)=59.6 (14.2); home-based rehabilitation=12.3 (13.4), p<0.001 MMSE: In-patient: Mean (SD)=4.8 (5.0); home-based rehabilitation=2.0 (2.1), p<0.001
⨁◯
◯
◯ VERY LOW
IMPORTANT
outcomes (e.g., mortality, morbidity, and quality of life) - not measured
- - - - - - - - - -
MD – mean difference, RR – relative risk 1. No evidence available 2. high risk of selection, assessment, performance and measurement bias 3. Single study. Inconsistency does not apply 4. All studies were conducted in high income countries (xxxxxx) and reproducing the intervention in low and middle income countries is expected to be feasible and to give the same results. 5. No meta-analysis performed Total participants: 51; in-patient=33; district hospital=18 111 In-patient: 63 Other: 48 6. Small sample size. Total number of participants=60; in-patient=30; home-based=30

58
Summary of findings:
Multidisciplinary inpatient rehabilitation compared to rehabilitation delivered at local non-specialist services in district hospitals or home based rehabilitation for traumatic brain injury and stroke (Turner-Stokes 2005) Outcomes Impact № of
participants (Studies)
Quality of the evidence (GRADE)
Access to rehabilitation services - not measured - -
Utilization of rehabilitation services and continuity of care - not measured
- -
Rehabilitation outcomes assessed with: Activity and independence: Barthel Index, FIM and Newcastle Independence Assessment form (NIAF); care-givers’ health: GHQ-28 measured 1,2,3,6,12 and 24 months after injury; Impairment: Brunnstrom score, Ashworth (spasticity); Activity: FIM, Mini-mental state examination (MMSE) before and after rehabilitation
The results support the efficiency of specialized rehabilitation services in achieving lasting gains for patients with more severe disability over similar lengths of stay
(1 RCT) ⨁⨁◯◯ LOW 2 3 4 5
Rehabilitation outcomes assessed with: Activity and independence: Barthel Index, FIM and Newcastle Independence Assessment form (NIAF); care-givers’ health: GHQ-28 measured 1,2,3,6,12 and 24 months after injury; Impairment: Brunnstrom score, Ashworth (spasticity); Activity: FIM, Mini-mental state examination (MMSE) before and after rehabilitation
Intensive in-patient rehabilitation provided significant more favorable functional and cognitive outcomes than home based rehabilitation programme. Significant group differences in favor of the in-patient group for change in Brunnstrom, FIM and MMSE scores, but no difference in spasticity: Brunnstrom: (UE) In-patient: Mean (SD)=2.0 (1.2); home-based rehabilitation=0.3 (0.6), p<0.001 Brunnstrom: (LE) In-patient: Mean (SD)=2.4 (1.2); home-based rehabilitation=0.8 (0.6), p<0.001 FIM: In-patient: Mean (SD)=59.6 (14.2); home-based rehabilitation=12.3 (13.4), p<0.001 MMSE: In-patient: Mean (SD)=4.8 (5.0); home-based rehabilitation=2.0 (2.1), p<0.001
(1 observational study)
⨁◯◯◯ VERY LOW 2 3 4 6
outcomes (e.g., mortality, morbidity, and quality of life) - not measured
- -
*The risk in the intervention group (and its 95% confidence interval) is based on the assumed risk in the comparison group and the relative effect of the intervention (and its 95% CI). CI: Confidence interval; RR: Risk ratio; OR: Odds ratio;
1. No evidence available 2. high risk of selection, assessment, performance and measurement bias 3. Single study. Inconsistency does not apply 4. All studies were conducted in high income countries (xxxxxx) and reproducing the intervention in low and middle income countries is expected to be feasible and to give the
same results. 5. No meta-analysis performed Total participants: 51; in-patient=33; district hospital=18 111 In-patient: 63 Other: 48 6. Small sample size. Total number of participants=60; in-patient=30; home-based=30

59
Should community team-based rehabilitation vs. day clinic rehabilitation be used for adults with acquired brain injury? (Turner-Stokes 2005) Question: Community team-based rehabilitation compared to day clinic rehabilitation for adults with acquired brain injury (Turner-Stokes 2005) Settings: Bibliography (systematic reviews): 2462_Turner-Stokes L, Nair A, Sedki I, Disler PB, Wade DT. Multi-disciplinary rehabilitation for acquired brain injury in adults of working age. Cochrane Database of Systematic Reviews 2005, Issue 3. Art.No.: CD004170. DOI: 10.1002/14651858.CD004170.pub2.
Quality assessment № of patients
Impact Quality Importance № of studies
Study design
Risk of bias Inconsistency Indirectness Imprecision Other
considerations community team-based
rehabilitation day clinic
rehabilitation
Access to rehabilitation services - not measured
- - - - - - - - - -
Utilization of rehabilitation services and continuity of care - not measured
- - - - - - - - - -
Rehabilitation outcomes (e.g., prevention or slowing of the loss of function, improvement or restoration of function, compensation for lost function) (assessed with: Functional assessment: motor and process skills (AMPS). Secondary measures: mobility (30 metres walking test), FIM, Instrumental activity measure; impairment: NIH scale at end of intervention (3 weeks post discharge), 3 and 12 months.)
1 randomised trials
serious 2 serious 3 not serious 4 serious 5 none Both rehabilitation programmes could be recommended, but further studies are required to define patients who may benefit specifically from home rehabilitation. Costs should also be taken into consideration. General systematic review conclusion: Problems following ABI vary. Consequently, different interventions and combinations of interventions are required to suit the needs of patients with different problems. Patients presenting acutely to hospital with moderate to severe brain injury should be routinely followed up to assess their needs for rehabilitation. Intensive intervention appears to lead to earlier gains. The balance between intensity and cost-effectiveness has yet to be determined. Patients discharged from in-patient rehabilitation should have access to out-patient or community-based services appropriate to their needs. Those with milder brain injury benefit from follow up and appropriate information and advice. Not all questions in rehabilitation can be addressed by randomised controlled trials or other experimental approaches. Some questions include which treatments work best for which patients over the long term, and which models of service represent value for money in the context of life-long care. In future, such questions will need to be set alongside practice-based evidence gathered from large systematic, longitudinal cohort studies conducted in the context of routine clinical practice.
⨁◯
◯
◯ VERY LOW
MD – mean difference, RR – relative risk 1. No evidence available 2. high risk of selection, assessment, performance and measurement bias 3. Heterogeneity of patients, rehabilitation services, and outcomes: Mix causes of acquired brain injury included traumatic brain injury, diffuse acquired brain injury, cerebrovascular accident (stroke),
other causes (neurosurgery operations, radiotherapy, cerebral abscess, bacterial meningitis, gunshots); settings: In-patient settings: where rehabilitation is delivered in the context of 24-hour care, which may be in a hospital ward or a specialized rehabilitation unit; Out-patient or day treatment settings: which maybe in in a hospital environment, a local community venue (day-centre), or a specialist rehabilitation environment; Domiciliary or home-based: focused around the patient’s own home and local community; content of rehabilitation program, intensity and duration
4. Study was conducted in high income country, however reproducing the intervention in low and middle income countries is expected to be feasible and to give the same results. 5. Small sample size: Total participants: 61 Community: 30 No rehab: 29

60
Summary of findings:
Community team-based rehabilitation compared to day clinic rehabilitation for adults with acquired brain injury (Turner-Stokes 2005) Outcomes Impact № of
participants (Studies)
Quality of the evidence (GRADE)
Access to rehabilitation services - not measured
- -
Utilization of rehabilitation services and continuity of care - not measured
- -
Rehabilitation outcomes (e.g., prevention or slowing of the loss of function, improvement or restoration of function, compensation for lost function) assessed with: Functional assessment: motor and process skills (AMPS). Secondary measures: mobility (30 metres walking test), FIM, Instrumental activity measure; impairment: NIH scale at end of intervention (3 weeks post discharge), 3 and 12 months.
Both rehabilitation programmes could be recommended, but further studies are required to define patients who may benefit specifically from home rehabilitation. Costs should also be taken into consideration. General systematic review conclusion: Problems following ABI vary. Consequently, different interventions and combinations of interventions are required to suit the needs of patients with different problems. Patients presenting acutely to hospital with moderate to severe brain injury should be routinely followed up to assess their needs for rehabilitation. Intensive intervention appears to lead to earlier gains. The balance between intensity and cost-effectiveness has yet to be determined. Patients discharged from in-patient rehabilitation should have access to out-patient or community-based services appropriate to their needs. Those with milder brain injury benefit from follow up and appropriate information and advice. Not all questions in rehabilitation can be addressed by randomised controlled trials or other experimental approaches. Some questions include which treatments work best for which patients over the long term, and which models of service represent value for money in the context of life-long care. In future, such questions will need to be set alongside practice-based evidence gathered from large systematic, longitudinal cohort studies conducted in the context of routine clinical practice.
(1 RCT) ⨁◯◯◯ VERY LOW 2 3 4 5
*The risk in the intervention group (and its 95% confidence interval) is based on the assumed risk in the comparison group and the relative effect of the intervention (and its 95% CI). CI: Confidence interval; RR: Risk ratio; OR: Odds ratio;
1. No evidence available 2. high risk of selection, assessment, performance and measurement bias 3. Heterogeneity of patients, rehabilitation services, and outcomes: Mix causes of acquired brain injury included traumatic brain injury, diffuse acquired brain injury,
cerebrovascular accident (stroke), other causes (neurosurgery operations, radiotherapy, cerebral abscess, bacterial meningitis, gunshots); settings: In-patient settings: where rehabilitation is delivered in the context of 24-hour care, which may be in a hospital ward or a specialized rehabilitation unit; Out-patient or day treatment settings: which maybe in in a hospital environment, a local community venue (day-centre), or a specialist rehabilitation environment; Domiciliary or home-based: focused around the patient’s own home and local community; content of rehabilitation program, intensity and duration
4. Study was conducted in high income country, however reproducing the intervention in low and middle income countries is expected to be feasible and to give the same results.
5. Small sample size: Total participants: 61 Community: 30 No rehab: 29

61
Should multidisciplinary rehabilitation (including two or more professionals vs. non multidisciplinary (including only one professional - physical treatment be used for chronic low back pain? (Kamper 2014) Question: Multidisciplinary rehabilitation (including two or more professionals compared to non multidisciplinary (including only one professional - physical treatment for chronic low back pain (Kamper 2014) Settings: Low and middle income countries. Patients with chronic low back pain Bibliography (systematic reviews): 1223_Kamper SJ, Apeldoorn AT, Chiarotto A, Smeets RJ, Ostelo RWJG, Guzman J, van Tulder MW. Multidisciplinary biopsy- chosocial rehabilitation for chronic low back pain. Cochrane Database of Systematic Reviews 2014, Issue 9. Art. No.: CD000963. DOI: 10.1002/14651858.CD000963.pub3.
Quality assessment № of patients Effect
Quality Importance № of studies
Study design
Risk of bias Inconsistency Indirectness Imprecision Other
considerations
multidisciplinary rehabilitation (including two
or more professionals
non multidisciplinary (including only
one professional -
physical treatment
Relative (95% CI)
Absolute (95% CI)
Access to rehabilitation services - not measured
- - - - - - - - - -
Utilization of rehabilitation services and continuity of care: health care utilization at 12 months (assessed with: Heath care utilization: long term 12 months)
2 randomised trials
serious 2 not serious 3 not serious 4 serious 5 none 6 114 112 - SMD 0.06 lower (0.32 lower to 0.2
higher) ⨁⨁◯◯
LOW
CRITICAL
Rehabilitation outcomes (e.g., prevention or slowing of the loss of function, improvement or restoration of function, compensation for lost function): Short term back-specific disability or functional status up to three months after randomization (assessed with: Back-specific disability or functional status up to three months after randomization)
13 randomised trials
very serious 7
serious 8 not serious 4 serious 9 none 6 929 950 - SMD 0.39 lower (0.68 lower to 0.1
lower) ⨁◯◯◯
VERY LOW
CRITICAL
Rehabilitation outcomes (e.g., prevention or slowing of the loss of function, improvement or restoration of function, compensation for lost function): Long term back-specific disability or functional status 12 months or more after after randomization (assessed with: back-specific disability or functional status 12 months or more after after randomization )
10 randomised trials
serious 7 very serious 10 not serious not serious 11
none 6 602 567 - SMD 0.68 lower (1.19 lower to
0.16 lower) ⨁◯◯◯
VERY LOW
CRITICAL
Health outcomes (e.g., mortality, morbidity, and quality of life): work status: return to work 12 months or more after randomization
8 randomised trials
serious 2 not serious 12 not serious 4 not serious 13
none 6 412/528 (78.0%) 315/478 (65.9%) OR 1.87 (1.39 to
2.53)
124 more per 1000 (from 70 more to 171
more)
⨁⨁⨁◯
MODERATE
CRITICAL
MD – mean difference, RR – relative risk 1. No evidence available 2. High risk of performance and measurement biases 3. I-square=0%; p=0.40 4. All studies were conducted in HIC. However, reproducing the intervention in LMIC is expected to be feasible and expected to give same results 5. The total sample size is 226: multidisciplinary (n=114), single disciplinary (n=112), and the point estimate is -0.06 (95% CI: -0.32 to 0.20) 6. Funnel plots were created for comparisons with at least 10 included studies and they were inspected visually to assess the risk of publication bias.Three analyses (pain and disability in the short
term and disability in the long term) in the MBR versus physical treatment comparison met this criterion. None of the plots showed substantial asymmetry aside from one outlying medium-sized study that reported very large effects in favour of MBR (Monticone 2013).
7. igh risk of selection, performance, measurement and attrition biases 8. I-square=88%; p<0.00001 9. The total sample size is 1879: multidisciplinary (n=929), single (n=950), and the point estimate is -0.39 (95% CI: -0.68 to -0.10) 10. I-square=94%; p<0.00001 11. The total sample size is small: 1169 (multidisciplinary: 602), single (n=567), but the point estimate is -0.68 (95% CI: -1.19 to -0.16) 12. I-square=0%; p=0.45 13. The total sample size is 1106 (multidisciplinary: 528; single: 478), but the point estimate is 1.87 (95% CI: -1.39 to 2.53)
SummaryofFindings:Multidisciplinaryrehabilitation(includingtwoormoreprofessionalscomparedtononmultidisciplinary(includingonlyoneprofessional-physicaltreatmentforchroniclowbackpain(Kamper2014)
Outcomes Anticipated absolute effects* (95% CI) Relative effect (95% CI)
№ of participants (Studies)
Quality of the evidence (GRADE)
Comments
Risk with non multidisciplinary (including only one professional - physical treatment
Risk with multidisciplinary rehabilitation (including two or more professionals

62
Outcomes Anticipated absolute effects* (95% CI) Relative effect (95% CI)
№ of participants (Studies)
Quality of the evidence (GRADE)
Comments
Risk with non multidisciplinary (including only one professional - physical treatment
Risk with multidisciplinary rehabilitation (including two or more professionals
Access to rehabilitation services - not measured
- -
Utilization of rehabilitation services and continuity of care assessed with: Heath care utilization (number of visits, surgery, admissions to hospital) follow up: mean 12 months
The mean utilization of rehabilitation services and continuity of care in the intervention group was 0.06 standard deviations lower (0.32 lower to 0.2 higher)
- 226 (2 RCTs)
⨁⨁◯◯ LOW 1 2 3 4 5
Non-significant reduction in healthcare utlization. As a rule of thumb, 0.2 SD is a small difference, 0.5 is moderate, and 0.8 is large.
Rehabilitation outcomes assessed with: Back-specific disability or functional status follow up: mean 3 months
The mean rehabilitation outcomes in the intervention group was 0.39 standard deviations lower (0.68 lower to 0.1 lower)
- 1879 (13 RCTs)
⨁◯◯◯ VERY LOW 3 5 6 7 8
Significant reduction in back-specific disability at 3 months. As a rule of thumb, 0.2 SD is a small difference, 0.5 is moderate, and 0.8 is large.
Rehabilitation outcomes assessed with: back-specific disability or functional status follow up: mean 12 months
The mean rehabilitation outcomes in the intervention group was 0.68 standard deviations lower (1.19 lower to 0.16 lower)
- 1169 (10 RCTs)
⨁◯◯◯ VERY LOW 5 6 9 10
Significant reduction in back-specific disability at 12 months. As a rule of thumb 0.2 SD is a small difference, 0.5 is moderate and 0.8 is large.
Health outcomes assessed with: work status (return to work) follow up: mean 12
659 per 1000 783 per 1000 (729 to 830)
OR 1.87 (1.39 to 2.53)
1006 (8 RCTs)
⨁⨁⨁◯ MODERATE 1 3 5 11 12
Significant improvement in work status at 12 months. 124 more people return to work per 1000 (from 70 more to 171 more)
*The risk in the intervention group (and its 95% confidence interval) is based on the assumed risk in the comparison group and the relative effect of the intervention (and its 95% CI). CI: Confidence interval; RR: Risk ratio; OR: Odds ratio;
1. High risk of performance and measurement biases 2. I-square=0%; p=0.40 3. All studies were conducted in HIC. However, reproducing the intervention in LMIC is expected to be feasible and expected to give same results 4. The total sample size is 226: multidisciplinary (n=114), single disciplinary (n=112), and the point estimate is -0.06 (95% CI: -0.32 to 0.20) 5. Funnel plots were created for comparisons with at least 10 included studies and they were inspected visually to assess the risk of publication bias.Three analyses (pain and
disability in the short term and disability in the long term) in the MBR versus physical treatment comparison met this criterion. None of the plots showed substantial asymmetry aside from one outlying medium-sized study that reported very large effects in favour of MBR (Monticone 2013).
6. High risk of selection, performance, measurement and attrition biases 7. I-square=88%; p<0.00001 8. The total sample size is 1879: multidisciplinary (n=929), single (n=950), and the point estimate is -0.39 (95% CI: -0.68 to -0.10) 9. I-square=0.94%; p<0.00001 10. The total sample size is 1169 (multidisciplinary n=: 602), single n=567), but the point estimate is -0.68 (95% CI: -1.19 to -0.16) 11. I-square=0%; p=0.45 12. The total sample size is 1106 (multidisciplinary: 528; single: 478), but the point estimate is 1.87 (95% CI: -1.39 to 2.53)
Should Multidisciplinary biopsychosocial rehabilitation (psychologist contact setting) vs. no multidisciplinary biopsychosocial rehabilitation (psychological coaching setting) be used for for neck and shoulder pain among working age adults (Karjalainen 2010)? Question: Multidisciplinary biopsychosocial rehabilitation (psychologist contact setting) compared to no multidisciplinary biopsychosocial rehabilitation (psychological coaching setting) for neck and shoulder pain among working age adults (Karjalainen 2010) Settings: In the intervention group, the psychologist administrated the behavioural components of the multimodal approach directly to the patients whereas in the control group, the clinical psychologist participated in the multidisciplinary team as a supervisor. Bibliography (systematic reviews): Karjalainen KA, Malmivaara A, van Tulder MW, Roine R, Jauhiainen M, Hurri H, Koes BW. Multidisciplinary biopsychosocial rehabilitation for neck and shoulder pain among working age adults. Cochrane Database of Systematic Reviews 2003, Issue 2.Art. No.: CD002194. DOI: 10.1002/14651858.CD002194. Publication status and date: Edited (no change to conclusions), published in Issue 3, 2010.
Quality assessment № of patients Effect Quality Importance
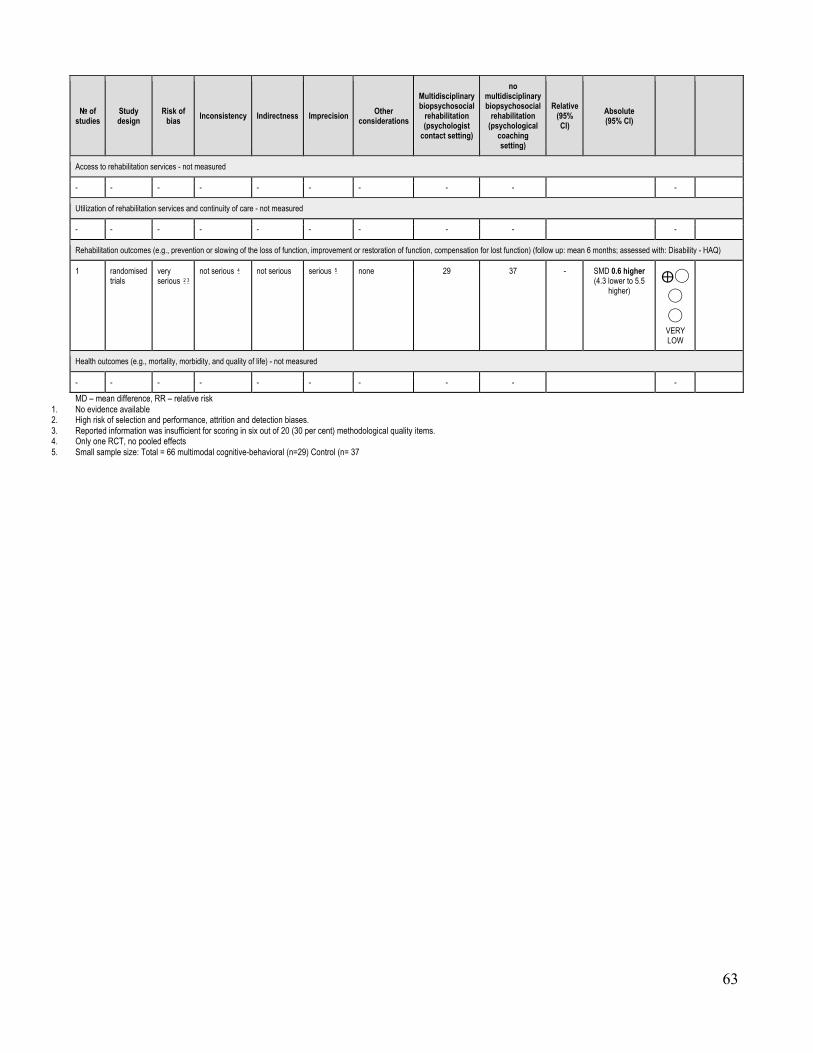
63
№ of studies
Study design
Risk of bias Inconsistency Indirectness Imprecision Other
considerations
Multidisciplinary biopsychosocial
rehabilitation (psychologist
contact setting)
no multidisciplinary biopsychosocial
rehabilitation (psychological
coaching setting)
Relative (95% CI)
Absolute (95% CI)
Access to rehabilitation services - not measured
- - - - - - - - - -
Utilization of rehabilitation services and continuity of care - not measured
- - - - - - - - - -
Rehabilitation outcomes (e.g., prevention or slowing of the loss of function, improvement or restoration of function, compensation for lost function) (follow up: mean 6 months; assessed with: Disability - HAQ)
1 randomised trials
very serious 2 3
not serious 4 not serious serious 5 none 29 37 - SMD 0.6 higher (4.3 lower to 5.5
higher) ⨁◯◯
◯ VERY LOW
Health outcomes (e.g., mortality, morbidity, and quality of life) - not measured
- - - - - - - - - -
MD – mean difference, RR – relative risk 1. No evidence available 2. High risk of selection and performance, attrition and detection biases. 3. Reported information was insufficient for scoring in six out of 20 (30 per cent) methodological quality items. 4. Only one RCT, no pooled effects 5. Small sample size: Total = 66 multimodal cognitive-behavioral (n=29) Control (n= 37

64
Summary of findings:
Multidisciplinary biopsychosocial rehabilitation (psychologist contact setting) compared to no multidisciplinary biopsychosocial rehabilitation (psychological coaching setting) for for neck and shoulder pain among working age adults (Karjalainen 2010) Outcomes Anticipated absolute effects* (95% CI) Relative
effect (95% CI)
№ of participants (Studies)
Quality of the evidence (GRADE)
Comments
Risk with no multidisciplinary biopsychosocial rehabilitation (psychological coaching setting)
Risk with Multidisciplinary biopsychosocial rehabilitation (psychologist contact setting)
Access to rehabilitation services - not measured
- -
Utilization of rehabilitation services and continuity of care - not measured
- -
Rehabilitation outcomes (e.g., prevention or slowing of the loss of function, improvement or restoration of function, compensation for lost function) assessed with: Disability - HAQ follow up: mean 6 months
The mean rehabilitation outcomes (e.g., prevention or slowing of the loss of function, improvement or restoration of function, compensation for lost function) in the intervention group was 0.6 standard deviations higher (4.3 lower to 5.5 higher)
- 66 (1 RCT) ⨁◯◯◯
VERY LOW 2 3 4 5
Health outcomes (e.g., mortality, morbidity, and quality of life) - not measured
- -
*The risk in the intervention group (and its 95% confidence interval) is based on the assumed risk in the comparison group and the relative effect of the intervention (and its 95% CI). CI: Confidence interval; RR: Risk ratio; OR: Odds ratio;
1. No evidence available 2. High risk of selection and performance, attrition and detection biases. 3. Reported information was insufficient for scoring in six out of 20 (30 per cent) methodological quality items. 4. Only one RCT, no pooled effects 5. Small sample size: Total = 66 multimodal cognitive-behavioral (n=29) Control (n= 37
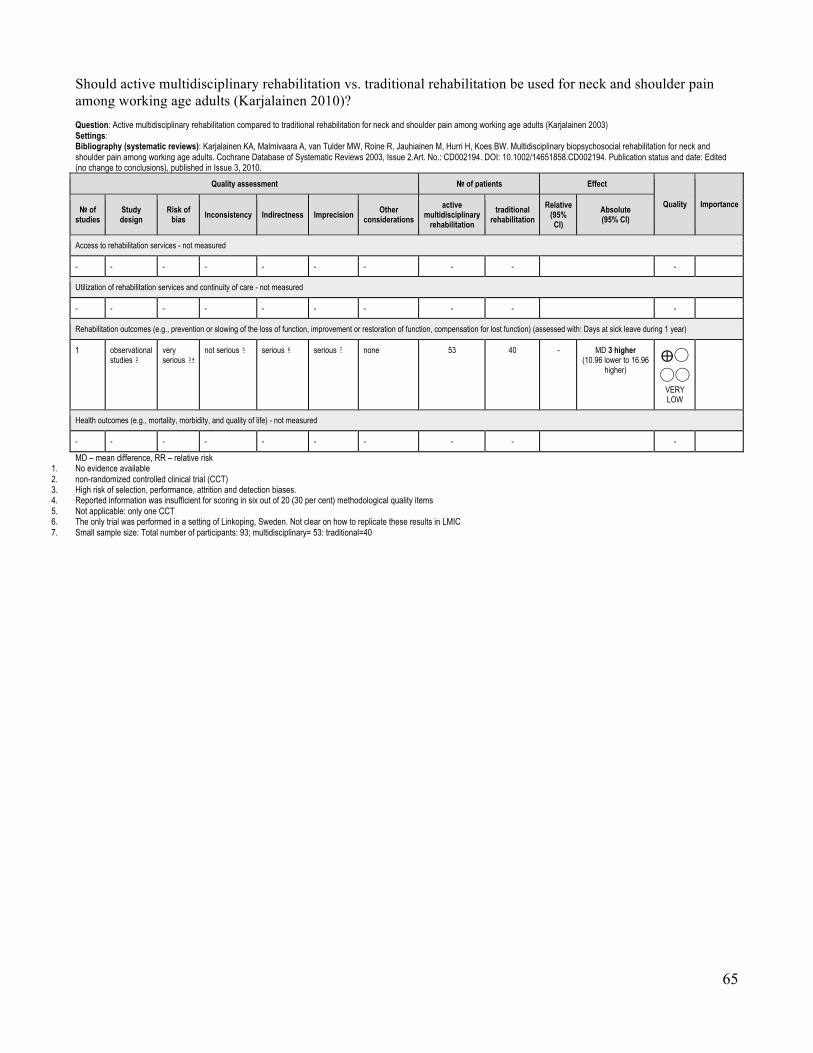
65
Should active multidisciplinary rehabilitation vs. traditional rehabilitation be used for neck and shoulder pain among working age adults (Karjalainen 2010)? Question: Active multidisciplinary rehabilitation compared to traditional rehabilitation for neck and shoulder pain among working age adults (Karjalainen 2003) Settings: Bibliography (systematic reviews): Karjalainen KA, Malmivaara A, van Tulder MW, Roine R, Jauhiainen M, Hurri H, Koes BW. Multidisciplinary biopsychosocial rehabilitation for neck and shoulder pain among working age adults. Cochrane Database of Systematic Reviews 2003, Issue 2.Art. No.: CD002194. DOI: 10.1002/14651858.CD002194. Publication status and date: Edited (no change to conclusions), published in Issue 3, 2010.
Quality assessment № of patients Effect
Quality Importance № of studies
Study design
Risk of bias Inconsistency Indirectness Imprecision Other
considerations active
multidisciplinary rehabilitation
traditional rehabilitation
Relative (95% CI)
Absolute (95% CI)
Access to rehabilitation services - not measured
- - - - - - - - - -
Utilization of rehabilitation services and continuity of care - not measured
- - - - - - - - - -
Rehabilitation outcomes (e.g., prevention or slowing of the loss of function, improvement or restoration of function, compensation for lost function) (assessed with: Days at sick leave during 1 year)
1 observational studies 2
very serious 3 4
not serious 5 serious 6 serious 7 none 53 40 - MD 3 higher (10.96 lower to 16.96
higher) ⨁◯◯◯
VERY LOW
Health outcomes (e.g., mortality, morbidity, and quality of life) - not measured
- - - - - - - - - -
MD – mean difference, RR – relative risk 1. No evidence available 2. non-randomized controlled clinical trial (CCT) 3. High risk of selection, performance, attrition and detection biases. 4. Reported information was insufficient for scoring in six out of 20 (30 per cent) methodological quality items 5. Not applicable: only one CCT 6. The only trial was performed in a setting of Linkoping, Sweden. Not clear on how to replicate these results in LMIC 7. Small sample size: Total number of participants: 93; multidisciplinary= 53: traditional=40
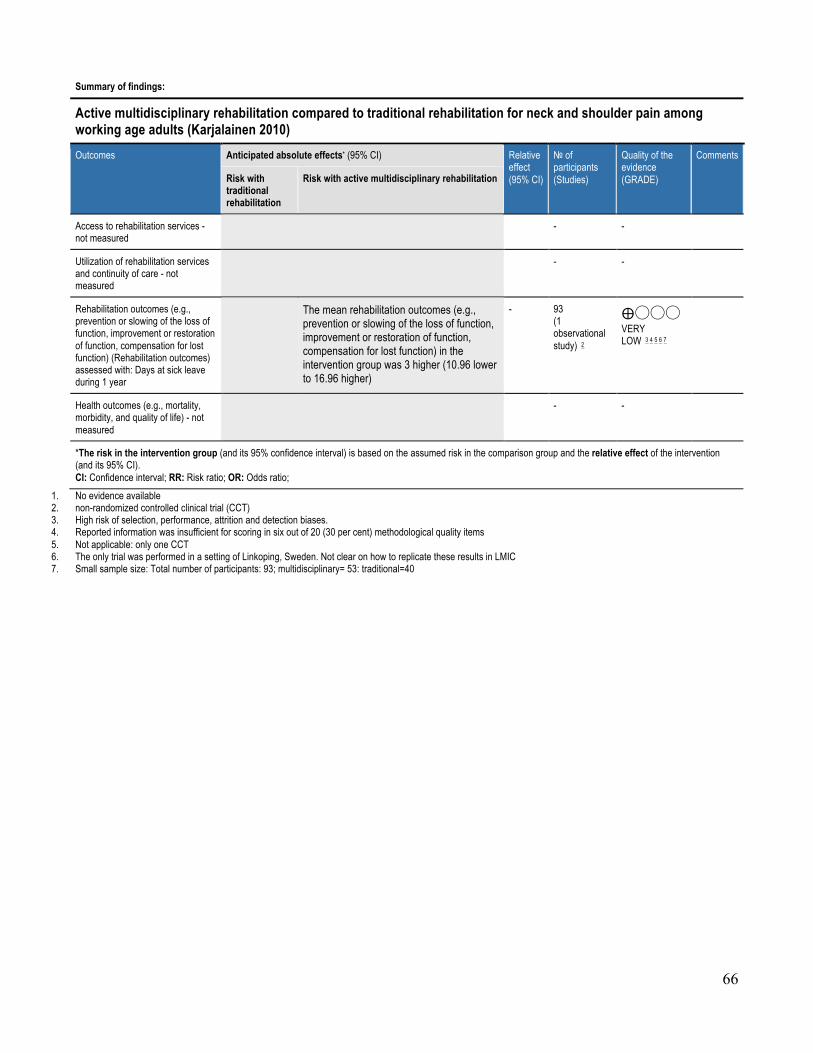
66
Summary of findings:
Active multidisciplinary rehabilitation compared to traditional rehabilitation for neck and shoulder pain among working age adults (Karjalainen 2010) Outcomes Anticipated absolute effects* (95% CI) Relative
effect (95% CI)
№ of participants (Studies)
Quality of the evidence (GRADE)
Comments
Risk with traditional rehabilitation
Risk with active multidisciplinary rehabilitation
Access to rehabilitation services - not measured
- -
Utilization of rehabilitation services and continuity of care - not measured
- -
Rehabilitation outcomes (e.g., prevention or slowing of the loss of function, improvement or restoration of function, compensation for lost function) (Rehabilitation outcomes) assessed with: Days at sick leave during 1 year
The mean rehabilitation outcomes (e.g., prevention or slowing of the loss of function, improvement or restoration of function, compensation for lost function) in the intervention group was 3 higher (10.96 lower to 16.96 higher)
- 93 (1 observational study) 2
⨁◯◯◯ VERY LOW 3 4 5 6 7
Health outcomes (e.g., mortality, morbidity, and quality of life) - not measured
- -
*The risk in the intervention group (and its 95% confidence interval) is based on the assumed risk in the comparison group and the relative effect of the intervention (and its 95% CI). CI: Confidence interval; RR: Risk ratio; OR: Odds ratio;
1. No evidence available 2. non-randomized controlled clinical trial (CCT) 3. High risk of selection, performance, attrition and detection biases. 4. Reported information was insufficient for scoring in six out of 20 (30 per cent) methodological quality items 5. Not applicable: only one CCT 6. The only trial was performed in a setting of Linkoping, Sweden. Not clear on how to replicate these results in LMIC 7. Small sample size: Total number of participants: 93; multidisciplinary= 53: traditional=40

67
Should multidisciplinary rehabilitation vs. traditional care be used for subacute low-back pain among working age adults. (Karjalainen 2008)? Question: Multidisciplinary rehabilitation compared to traditional care for subacute low-back pain among working age adults. (Karjalainen 2008) Settings: Bibliography (systematic reviews): Karjalainen KA, Malmivaara A, van Tulder MW, Roine R, Jauhiainen M, Hurri H, Koes BW. Multidisciplinary biopsychosocial rehabilitation for subacute low-back pain among working age adults. Cochrane Database of Systematic Reviews 2003, Issue 2. Art. No.: CD002193. DOI: 10.1002/14651858.CD002193. Publication status and date: Edited (no change to conclusions), published in Issue 4, 2008.
Quality assessment № of patients Effect
Quality Importance № of studies
Study design
Risk of bias Inconsistency Indirectness Imprecision Other
considerations multidisciplinary
rehabilitation traditional
care Relative
(95% CI)
Absolute (95% CI)
Access to rehabilitation services - not measured
- - - - - - - - - -
Utilization of rehabilitation services and continuity of care - not measured
- - - - - - - - - -
Rehabilitation outcomes (e.g., prevention or slowing of the loss of function, improvement or restoration of function, compensation for lost function) (assessed with: Subjective disability at one year follow-up)
1 randomised trials
serious 2 3 not serious 4 serious 5 serious 6 none 51 52 - MD 1.2 lower (1.98 lower to 0.42 lower) ⨁◯
◯◯ VERY LOW
CRITICAL
Health outcomes (e.g., mortality, morbidity, and quality of life)
1 1 randomised trials
serious 7 not serious serious 7 serious 7 none 51 52 - MD 5.1 lower (10.59 lower to 0.39
higher) ⨁◯◯◯
VERY LOW
MD – mean difference, RR – relative risk 1. No evidence available 2. High risk of performance, attrition and detection biases. 3. The information reported in the articles was insufficient for scoring in seven out of 20 (35 per cent) methodological quality items. 4. Not applicable Only one RCT, no pooled effects. 5. Multidisciplinary activities are not clearly feasible to be replicated as it was done: Strategies for education, visits and recommendations to the workplace and assigned resources to succeed in the
intervention. The only trial was performed in a setting of Goteborg, Sweden. Not clear on how to replicate these results in LMIC 6. Small sample size: Total n =103 19-64 yr old blue-collar workers. Graded 4-part activity program (n=51) Traditional care (n=52) 7. No explanation was provided

68
Summary of findings:
Multidisciplinary rehabilitation compared to traditional care for subacute low-back pain among working age adults. (Karjalainen 2008) Outcomes Anticipated absolute effects* (95% CI) Relative
effect (95% CI)
№ of participants (Studies)
Quality of the evidence (GRADE)
Comments
Risk with traditional care
Risk with multidisciplinary rehabilitation
Access to rehabilitation services - not measured
- -
Utilization of rehabilitation services and continuity of care - not measured
- -
Rehabilitation outcomes (e.g., prevention or slowing of the loss of function, improvement or restoration of function, compensation for lost function) assessed with: Subjective disability at one year follow-up
The mean rehabilitation outcomes (e.g., prevention or slowing of the loss of function, improvement or restoration of function, compensation for lost function) in the intervention group was 1.2 lower (1.98 lower to 0.42 lower)
- 103 (1 RCT) ⨁◯◯◯
VERY LOW 2 3 4 5 6
Health outcomes (e.g., mortality, morbidity, and quality of life)
The mean health outcomes (e.g., mortality, morbidity, and quality of life) in the intervention group was 5.1 lower (10.59 lower to 0.39 higher)
- 103 (1 RCT) 1 ⨁◯◯◯
VERY LOW 7
*The risk in the intervention group (and its 95% confidence interval) is based on the assumed risk in the comparison group and the relative effect of the intervention (and its 95% CI). CI: Confidence interval; RR: Risk ratio; OR: Odds ratio;
1. No evidence available 2. High risk of performance, attrition and detection biases. 3. The information reported in the articles was insufficient for scoring in seven out of 20 (35 per cent) methodological quality items. 4. Not applicable Only one RCT, no pooled effects. 5. Multidisciplinary activities are not clearly feasible to be replicated as it was done: Strategies for education, visits and recommendations to the workplace and assigned
resources to succeed in the intervention. The only trial was performed in a setting of Goteborg, Sweden. Not clear on how to replicate these results in LMIC 6. Small sample size: Total n =103 19-64 yr old blue-collar workers. Graded 4-part activity program (n=51) Traditional care (n=52) 7. No explanation was provided

69
d)SpecializedhospitalsandunitsforrehabilitationforcomplexconditionscomparedtoRehabilitationforcomplexconditionsingeneralwardsornon-specializedunitsShould specialized hospital rehabilitation vs. non-specialized rehabilitation in general wards be used for people with disabilities (SUTC 2013)? Question: Specialized hospital rehabilitation compared to non specialized rehabilitation in general wards for people with disabilities (SUTC 2013) Settings: low and middle income countries Bibliography (systematic reviews): 0006 _Stroke Unit Trialists' Collaboration. Organised inpatient (stroke unit) care for stroke. Cochrane Database Syst Rev. 2013 Sep 11;9:CD000197
Quality assessment № of patients Effect
Quality Importance № of studies
Study design
Risk of bias Inconsistency Indirectness Imprecision Other
considerations specialized
hospital rehabilitation
non specialized
rehabilitation in general
wards
Relative (95% CI)
Absolute (95% CI)
Access to rehabilitation services - not measured
- - - - - - - - - -
Utilization of rehabilitation services and continuity of care (assessed with: discharge of program and follow-up)
22 randomised trials
serious 1 not serious 2 not serious 3 not serious 4
none 718/2046 (35.1%)
766/1894 (40.4%)
OR 0.78 (0.68 to
0.89)
58 fewer per 1000 (from 28 fewer to 89 fewer) ⨁⨁⨁
◯ MODERATE
CRITICAL
Rehabilitation outcomes (e.g., prevention or slowing of the loss of function, improvement or restoration of function, compensation for lost function) (assessed with: functional improvement at end of follow-up)
20 randomised trials
serious 1 not serious 5 not serious 3 not serious 6
none 1027/1829 (56.2%)
1034/1681 (61.5%)
OR 0.79 (0.68 to
0.9)
57 fewer per 1000 (from 25 fewer to 94 fewer) ⨁⨁⨁
◯ MODERATE
CRITICAL
Health outcomes (e.g., mortality, morbidity, and quality of life) (assessed with: death at the end of follow-up)
23 randomised trials
serious 1 not serious 7 not serious 3 not serious 4
none 458/2501 (18.3%)
488/2090 (23.3%)
OR 0.81 (0.69 to
0.94)
36 fewer per 1000 (from 11 fewer to 60 fewer) ⨁⨁⨁
◯ MODERATE
CRITICAL
MD – mean difference, RR – relative risk 1. Detection bias: no outcome assessor blinded 2. I2: 10% 3. 3 studies conducted in LMIC 4. Total sample size: 2046+1894=3940 5. I2=0% 6. Total sample size: 1829+1681=3510 7. I2=30%
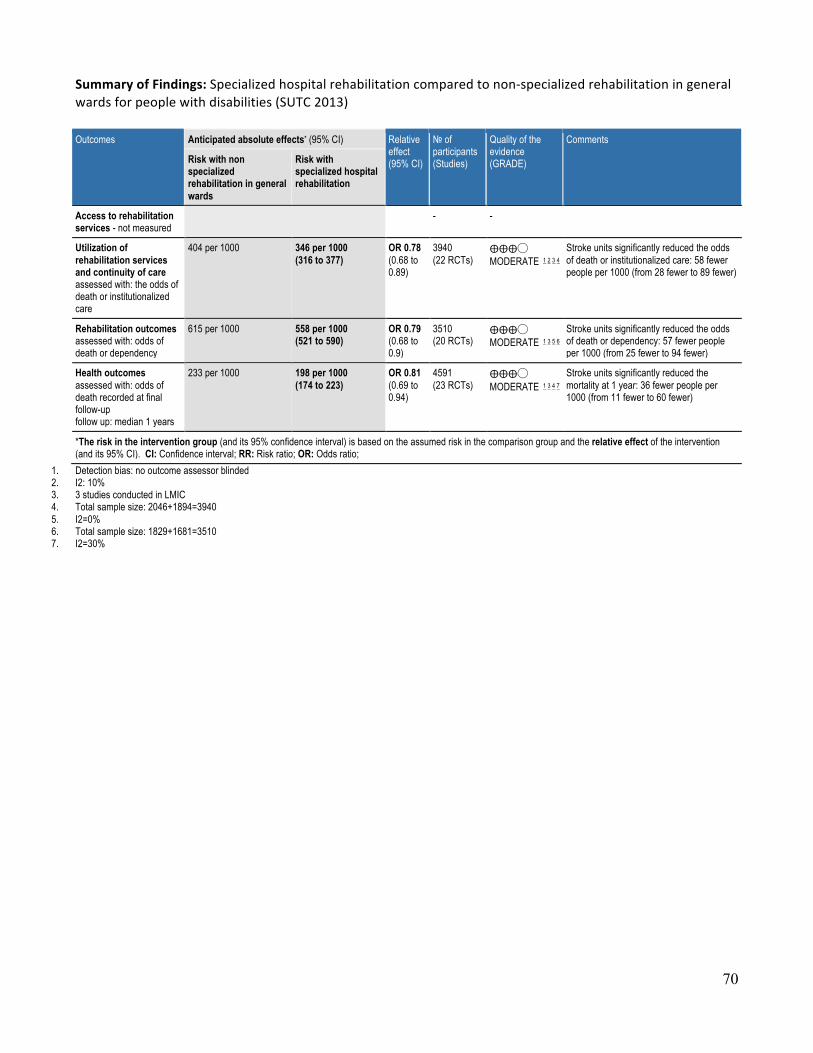
70
SummaryofFindings:Specializedhospitalrehabilitationcomparedtonon-specializedrehabilitationingeneralwardsforpeoplewithdisabilities(SUTC2013)Outcomes Anticipated absolute effects* (95% CI) Relative
effect (95% CI)
№ of participants (Studies)
Quality of the evidence (GRADE)
Comments
Risk with non specialized rehabilitation in general wards
Risk with specialized hospital rehabilitation
Access to rehabilitation services - not measured
- -
Utilization of rehabilitation services and continuity of care assessed with: the odds of death or institutionalized care
404 per 1000 346 per 1000 (316 to 377)
OR 0.78 (0.68 to 0.89)
3940 (22 RCTs)
⨁⨁⨁◯ MODERATE 1 2 3 4
Stroke units significantly reduced the odds of death or institutionalized care: 58 fewer people per 1000 (from 28 fewer to 89 fewer)
Rehabilitation outcomes assessed with: odds of death or dependency
615 per 1000 558 per 1000 (521 to 590)
OR 0.79 (0.68 to 0.9)
3510 (20 RCTs)
⨁⨁⨁◯ MODERATE 1 3 5 6
Stroke units significantly reduced the odds of death or dependency: 57 fewer people per 1000 (from 25 fewer to 94 fewer)
Health outcomes assessed with: odds of death recorded at final follow-up follow up: median 1 years
233 per 1000 198 per 1000 (174 to 223)
OR 0.81 (0.69 to 0.94)
4591 (23 RCTs)
⨁⨁⨁◯ MODERATE 1 3 4 7
Stroke units significantly reduced the mortality at 1 year: 36 fewer people per 1000 (from 11 fewer to 60 fewer)
*The risk in the intervention group (and its 95% confidence interval) is based on the assumed risk in the comparison group and the relative effect of the intervention (and its 95% CI). CI: Confidence interval; RR: Risk ratio; OR: Odds ratio;
1. Detection bias: no outcome assessor blinded 2. I2: 10% 3. 3 studies conducted in LMIC 4. Total sample size: 2046+1894=3940 5. I2=0% 6. Total sample size: 1829+1681=3510 7. I2=30%
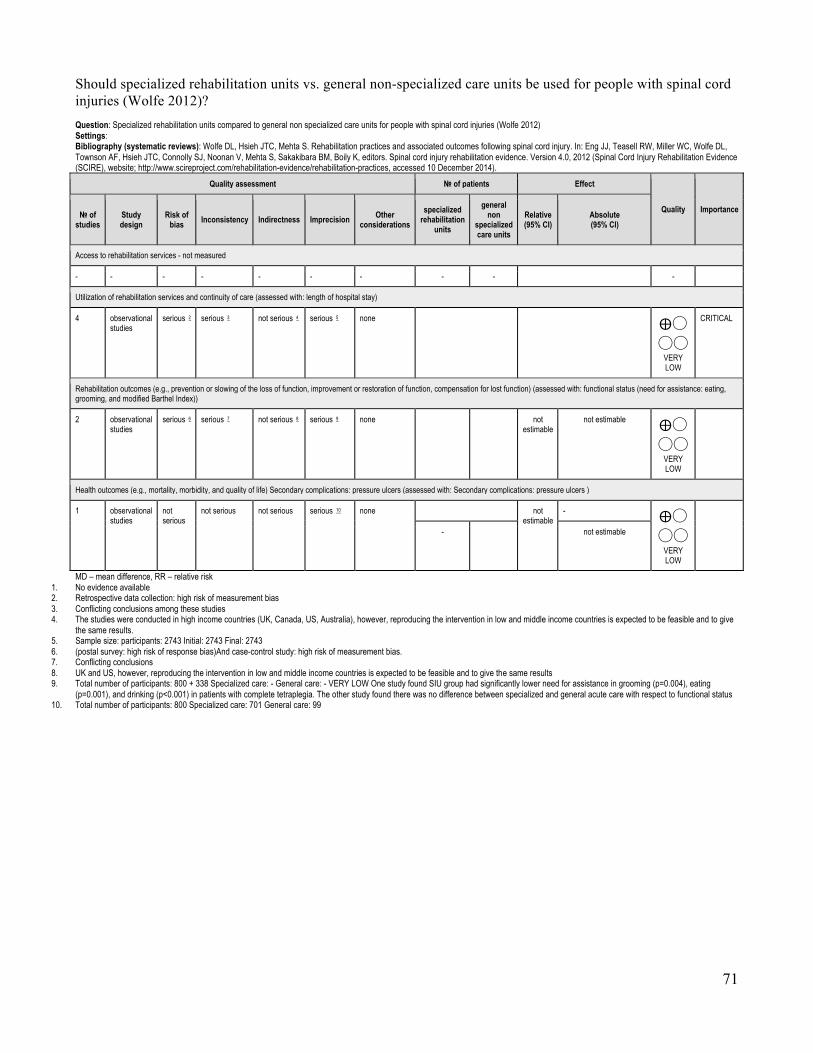
71
Should specialized rehabilitation units vs. general non-specialized care units be used for people with spinal cord injuries (Wolfe 2012)? Question: Specialized rehabilitation units compared to general non specialized care units for people with spinal cord injuries (Wolfe 2012) Settings: Bibliography (systematic reviews): Wolfe DL, Hsieh JTC, Mehta S. Rehabilitation practices and associated outcomes following spinal cord injury. In: Eng JJ, Teasell RW, Miller WC, Wolfe DL, Townson AF, Hsieh JTC, Connolly SJ, Noonan V, Mehta S, Sakakibara BM, Boily K, editors. Spinal cord injury rehabilitation evidence. Version 4.0, 2012 (Spinal Cord Injury Rehabilitation Evidence (SCIRE), website; http://www.scireproject.com/rehabilitation-evidence/rehabilitation-practices, accessed 10 December 2014).
Quality assessment № of patients Effect
Quality Importance № of studies
Study design
Risk of bias Inconsistency Indirectness Imprecision Other
considerations specialized
rehabilitation units
general non
specialized care units
Relative (95% CI)
Absolute (95% CI)
Access to rehabilitation services - not measured
- - - - - - - - - -
Utilization of rehabilitation services and continuity of care (assessed with: length of hospital stay)
4 observational studies
serious 2 serious 3 not serious 4 serious 5 none ⨁◯◯◯
VERY LOW
CRITICAL
Rehabilitation outcomes (e.g., prevention or slowing of the loss of function, improvement or restoration of function, compensation for lost function) (assessed with: functional status (need for assistance: eating, grooming, and modified Barthel Index))
2 observational studies
serious 6 serious 7 not serious 8 serious 9 none not estimable
not estimable ⨁◯◯◯
VERY LOW
Health outcomes (e.g., mortality, morbidity, and quality of life) Secondary complications: pressure ulcers (assessed with: Secondary complications: pressure ulcers )
1 observational studies
not serious
not serious not serious serious 10 none not estimable
- ⨁◯◯◯
VERY LOW
- not estimable
MD – mean difference, RR – relative risk 1. No evidence available 2. Retrospective data collection: high risk of measurement bias 3. Conflicting conclusions among these studies 4. The studies were conducted in high income countries (UK, Canada, US, Australia), however, reproducing the intervention in low and middle income countries is expected to be feasible and to give
the same results. 5. Sample size: participants: 2743 Initial: 2743 Final: 2743 6. (postal survey: high risk of response bias)And case-control study: high risk of measurement bias. 7. Conflicting conclusions 8. UK and US, however, reproducing the intervention in low and middle income countries is expected to be feasible and to give the same results 9. Total number of participants: 800 + 338 Specialized care: - General care: - VERY LOW One study found SIU group had significantly lower need for assistance in grooming (p=0.004), eating
(p=0.001), and drinking (p<0.001) in patients with complete tetraplegia. The other study found there was no difference between specialized and general acute care with respect to functional status 10. Total number of participants: 800 Specialized care: 701 General care: 99
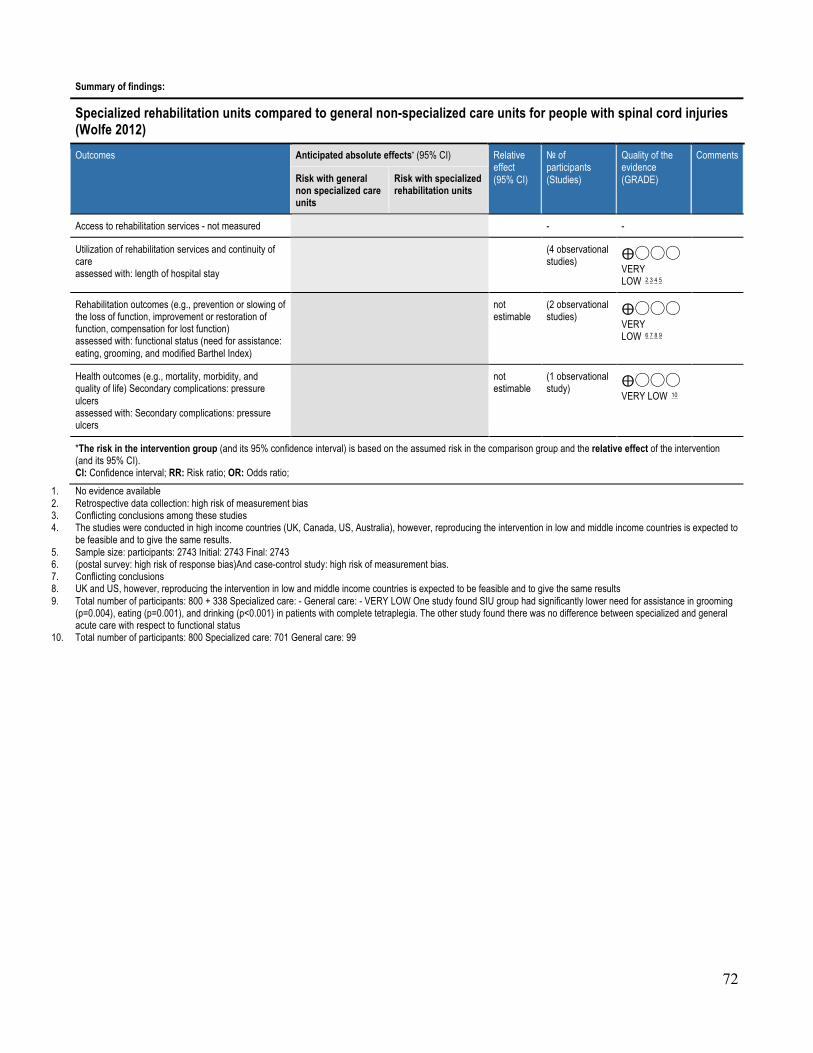
72
Summary of findings:
Specialized rehabilitation units compared to general non-specialized care units for people with spinal cord injuries (Wolfe 2012) Outcomes Anticipated absolute effects* (95% CI) Relative
effect (95% CI)
№ of participants (Studies)
Quality of the evidence (GRADE)
Comments
Risk with general non specialized care units
Risk with specialized rehabilitation units
Access to rehabilitation services - not measured - -
Utilization of rehabilitation services and continuity of care assessed with: length of hospital stay
(4 observational studies) ⨁◯◯◯
VERY LOW 2 3 4 5
Rehabilitation outcomes (e.g., prevention or slowing of the loss of function, improvement or restoration of function, compensation for lost function) assessed with: functional status (need for assistance: eating, grooming, and modified Barthel Index)
not estimable
(2 observational studies) ⨁◯◯◯
VERY LOW 6 7 8 9
Health outcomes (e.g., mortality, morbidity, and quality of life) Secondary complications: pressure ulcers assessed with: Secondary complications: pressure ulcers
not estimable
(1 observational study) ⨁◯◯◯
VERY LOW 10
*The risk in the intervention group (and its 95% confidence interval) is based on the assumed risk in the comparison group and the relative effect of the intervention (and its 95% CI). CI: Confidence interval; RR: Risk ratio; OR: Odds ratio;
1. No evidence available 2. Retrospective data collection: high risk of measurement bias 3. Conflicting conclusions among these studies 4. The studies were conducted in high income countries (UK, Canada, US, Australia), however, reproducing the intervention in low and middle income countries is expected to
be feasible and to give the same results. 5. Sample size: participants: 2743 Initial: 2743 Final: 2743 6. (postal survey: high risk of response bias)And case-control study: high risk of measurement bias. 7. Conflicting conclusions 8. UK and US, however, reproducing the intervention in low and middle income countries is expected to be feasible and to give the same results 9. Total number of participants: 800 + 338 Specialized care: - General care: - VERY LOW One study found SIU group had significantly lower need for assistance in grooming
(p=0.004), eating (p=0.001), and drinking (p<0.001) in patients with complete tetraplegia. The other study found there was no difference between specialized and general acute care with respect to functional status
10. Total number of participants: 800 Specialized care: 701 General care: 99
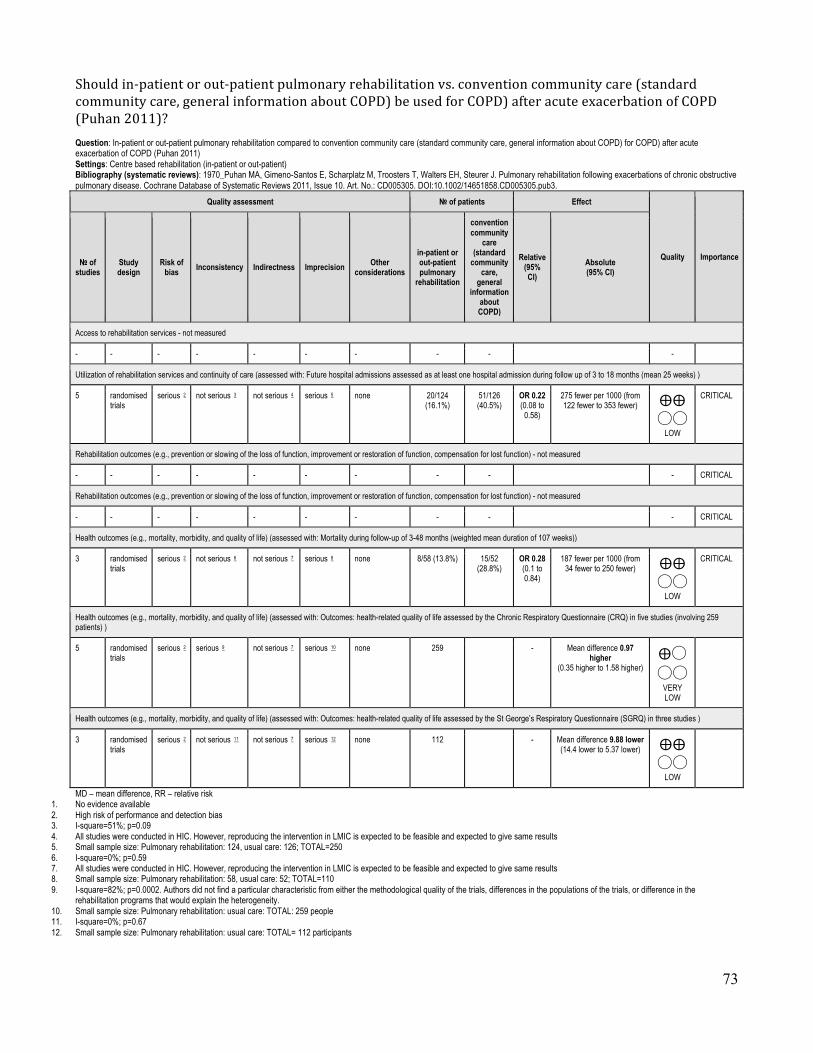
73
Shouldin-patientorout-patientpulmonaryrehabilitationvs.conventioncommunitycare(standardcommunitycare,generalinformationaboutCOPD)beusedforCOPD)afteracuteexacerbationofCOPD(Puhan2011)? Question: In-patient or out-patient pulmonary rehabilitation compared to convention community care (standard community care, general information about COPD) for COPD) after acute exacerbation of COPD (Puhan 2011) Settings: Centre based rehabilitation (in-patient or out-patient) Bibliography (systematic reviews): 1970_Puhan MA, Gimeno-Santos E, Scharplatz M, Troosters T, Walters EH, Steurer J. Pulmonary rehabilitation following exacerbations of chronic obstructive pulmonary disease. Cochrane Database of Systematic Reviews 2011, Issue 10. Art. No.: CD005305. DOI:10.1002/14651858.CD005305.pub3.
Quality assessment № of patients Effect
Quality Importance № of studies
Study design
Risk of bias Inconsistency Indirectness Imprecision Other
considerations
in-patient or out-patient pulmonary
rehabilitation
convention community
care (standard
community care,
general information
about COPD)
Relative (95% CI)
Absolute (95% CI)
Access to rehabilitation services - not measured
- - - - - - - - - -
Utilization of rehabilitation services and continuity of care (assessed with: Future hospital admissions assessed as at least one hospital admission during follow up of 3 to 18 months (mean 25 weeks) )
5 randomised trials
serious 2 not serious 3 not serious 4 serious 5 none 20/124 (16.1%)
51/126 (40.5%)
OR 0.22 (0.08 to
0.58)
275 fewer per 1000 (from 122 fewer to 353 fewer) ⨁⨁
◯◯ LOW
CRITICAL
Rehabilitation outcomes (e.g., prevention or slowing of the loss of function, improvement or restoration of function, compensation for lost function) - not measured
- - - - - - - - - - CRITICAL
Rehabilitation outcomes (e.g., prevention or slowing of the loss of function, improvement or restoration of function, compensation for lost function) - not measured
- - - - - - - - - - CRITICAL
Health outcomes (e.g., mortality, morbidity, and quality of life) (assessed with: Mortality during follow-up of 3-48 months (weighted mean duration of 107 weeks))
3 randomised trials
serious 2 not serious 6 not serious 7 serious 8 none 8/58 (13.8%) 15/52 (28.8%)
OR 0.28 (0.1 to 0.84)
187 fewer per 1000 (from 34 fewer to 250 fewer) ⨁⨁
◯◯ LOW
CRITICAL
Health outcomes (e.g., mortality, morbidity, and quality of life) (assessed with: Outcomes: health-related quality of life assessed by the Chronic Respiratory Questionnaire (CRQ) in five studies (involving 259 patients) )
5 randomised trials
serious 2 serious 9 not serious 7 serious 10 none 259 - Mean difference 0.97 higher
(0.35 higher to 1.58 higher) ⨁◯◯◯
VERY LOW
Health outcomes (e.g., mortality, morbidity, and quality of life) (assessed with: Outcomes: health-related quality of life assessed by the St George’s Respiratory Questionnaire (SGRQ) in three studies )
3 randomised trials
serious 2 not serious 11 not serious 7 serious 12 none 112 - Mean difference 9.88 lower (14.4 lower to 5.37 lower) ⨁⨁
◯◯ LOW
MD – mean difference, RR – relative risk 1. No evidence available 2. High risk of performance and detection bias 3. I-square=51%; p=0.09 4. All studies were conducted in HIC. However, reproducing the intervention in LMIC is expected to be feasible and expected to give same results 5. Small sample size: Pulmonary rehabilitation: 124, usual care: 126; TOTAL=250 6. I-square=0%; p=0.59 7. All studies were conducted in HIC. However, reproducing the intervention in LMIC is expected to be feasible and expected to give same results 8. Small sample size: Pulmonary rehabilitation: 58, usual care: 52; TOTAL=110 9. I-square=82%; p=0.0002. Authors did not find a particular characteristic from either the methodological quality of the trials, differences in the populations of the trials, or difference in the
rehabilitation programs that would explain the heterogeneity. 10. Small sample size: Pulmonary rehabilitation: usual care: TOTAL: 259 people 11. I-square=0%; p=0.67 12. Small sample size: Pulmonary rehabilitation: usual care: TOTAL= 112 participants

74
Summary of findings:
In-patient or out-patient pulmonary rehabilitation compared to convention community care (standard community care, general information about COPD) for COPD) after acute exacerbation of COPD (Puhan 2011) Outcomes Anticipated absolute effects* (95% CI) Relative
effect (95% CI)
№ of participants (Studies)
Quality of the evidence (GRADE)
Comments
Risk with convention community care (standard community care, general information about COPD)
Risk with in-patient or out-patient pulmonary rehabilitation
Access to rehabilitation services - not measured
- -
Utilization of rehabilitation services and continuity of care assessed with: Future hospital admissions assessed as at least one hospital admission during follow up of 3 to 18 months (mean 25 weeks)
OR 0.22 (0.08 to 0.58)
250 (5 RCTs) ⨁⨁◯◯
LOW 2 3 4 5
405 per 1000 130 per 1000
(52 to 283)
Rehabilitation outcomes (e.g., prevention or slowing of the loss of function, improvement or restoration of function, compensation for lost function) - not measured
- -
Rehabilitation outcomes (e.g., prevention or slowing of the loss of function, improvement or restoration of function, compensation for lost function) - not measured
- -
Health outcomes (e.g., mortality, morbidity, and quality of life) (Health outcomes) assessed with: Mortality during follow-up of 3-48 months (weighted mean duration of 107 weeks)
OR 0.28 (0.1 to 0.84)
110 (3 RCTs) ⨁⨁◯◯
LOW 2 6 7 8
288 per 1000 102 per 1000
(39 to 254)
Health outcomes (e.g., mortality, morbidity, and quality of life) assessed with: Outcomes: health-related quality of life assessed by the Chronic Respiratory Questionnaire (CRQ) in five studies (involving 259 patients)
The mean health outcomes (e.g., mortality, morbidity, and quality of life) in the intervention group was 0.97 Mean difference higher (0.35 higher to 1.58 higher)
- 259 (5 RCTs) ⨁◯◯◯
VERY LOW 2 7 9 10
Health outcomes (e.g., mortality, morbidity, and quality of life) (Health outcomes) assessed with: Outcomes: health-related quality of life assessed by the St George’s Respiratory Questionnaire (SGRQ) in three studies
The mean health outcomes (e.g., mortality, morbidity, and quality of life) in the intervention group was 9.88 Mean difference lower (14.4 lower to 5.37 lower)
- 112 (3 RCTs) ⨁⨁◯◯
LOW 2 7 11 12
*The risk in the intervention group (and its 95% confidence interval) is based on the assumed risk in the comparison group and the relative effect of the intervention (and its 95% CI). CI: Confidence interval; RR: Risk ratio; OR: Odds ratio;
1. No evidence available 2. High risk of performance and detection bias 3. I-square=51%; p=0.09 4. All studies were conducted in HIC. However, reproducing the intervention in LMIC is expected to be feasible and expected to give same results 5. Small sample size: Pulmonary rehabilitation: 124, usual care: 126; TOTAL=250 6. I-square=0%; p=0.59 7. All studies were conducted in HIC. However, reproducing the intervention in LMIC is expected to be feasible and expected to give same results 8. Small sample size: Pulmonary rehabilitation: 58, usual care: 52; TOTAL=110 9. I-square=82%; p=0.0002. Authors did not find a particular characteristic from either the methodological quality of the trials, differences in the populations of the trials, or
difference in the rehabilitation programs that would explain the heterogeneity.

75
10. Small sample size: Pulmonary rehabilitation: usual care: TOTAL: 259 people 11. I-square=0%; p=0.67 12. Small sample size: Pulmonary rehabilitation: usual care: TOTAL= 112 participants

76
Should specialized integrated unit for acute and post-acute rehabilitation vs. general medical ward be used for people with acute stroke (Foley 2007)? Question: Specialized integrated unit for acute and post-acute rehabilitation compared to general medical ward for people with acute stroke (Foley 2007) Settings: hospital in HIC Bibliography (systematic reviews): 780_Foley et al. Specialized Stroke Services: A Meta-Analysis Comparing Three Models of Care. Cerebrovasc Dis 2007;23:194–202.
Quality assessment № of patients Effect
Quality Importance № of studies
Study design
Risk of bias Inconsistency Indirectness Imprecision Other
considerations
specialized integrated
unit for acute and post acute
rehabilitation
general medical
ward
Relative (95% CI)
Absolute (95% CI)
Access to rehabilitation services - not measured
- - - - - - - - - -
Utilization of rehabilitation services and continuity of care (assessed with: length of hospital stay )
4 randomised trials
serious 2 very serious 3 serious 4 serious 5 none 583 498 - MD 14.39 lower (27.12 lower to 1.65 lower) ⨁◯
◯◯ VERY LOW
IMPORTANT
Rehabilitation outcomes (e.g., prevention or slowing of the loss of function, improvement or restoration of function, compensation for lost function) (assessed with: combined death/dependency at the end of scheduled follow-up (6-7 months after stroke))
4 randomised trials
serious 2 serious 6 serious 4 serious 7 none 260/583 (44.6%)
283/494 (57.3%)
OR 0.5 (0.39 to
0.65)
171 fewer per 1000 (from 107 fewer to 229 fewer) ⨁◯
◯◯ VERY LOW
CRITICAL
Health outcomes (e.g., mortality, morbidity, and quality of life) (assessed with: mortality at last reported follow-up (6-7 months after stroke))
4 randomised trials
serious 2 serious 8 serious 4 serious 9 none 133/583 (22.8%)
144/494 (29.1%)
OR 0.71 (0.54 to
0.94)
65 fewer per 1000 (from 13 fewer to 110 fewer) ⨁◯
◯◯ VERY LOW
CRITICAL
MD – mean difference, RR – relative risk 1. No evidence available 2. No risk of bias assessment 3. I-square=85.8%; p<0.0001 4. All studies conducted in HIC. Reproducing the intervention in low and middle income countries is excepted to not be feasible and not to give the same results 5. Total number of participants=1081; integrated service=583; general ward=498 6. I-square=64.6%; p=0.04 7. Small sample size. Total number of participants=1077; specialized rehabilitation=583; general ward=494 8. I-square=66.6%; p=0.03 9. Small sample size. Total number of participants=1077; specialized rehabilitation=583; general ward=494

77
Summary of findings:
Specialized integrated unit for acute and post acute rehabilitation compared to general medical ward for people with acute stroke (Foley 2007) Outcomes Anticipated absolute effects* (95% CI) Relative
effect (95% CI)
№ of participants (Studies)
Quality of the evidence (GRADE)
Comments
Risk with general medical ward
Risk with specialized integrated unit for acute and post acute rehabilitation
Access to rehabilitation services - not measured
- -
Utilization of rehabilitation services and continuity of care assessed with: length of hospital stay
The mean utilization of rehabilitation services and continuity of care in the intervention group was 14.39 lower (27.12 lower to 1.65 lower)
- 1081 (4 RCTs) ⨁◯◯◯
VERY LOW 2 3 4 5
Rehabilitation outcomes (e.g., prevention or slowing of the loss of function, improvement or restoration of function, compensation for lost function) assessed with: combined death/dependency at the end of scheduled follow-up (6-7 months after stroke)
OR 0.5 (0.39 to 0.65)
1077 (4 RCTs) ⨁◯◯◯
VERY LOW 2 4 6 7
573 per 1000 401 per 1000
(343 to 466)
Health outcomes (e.g., mortality, morbidity, and quality of life) assessed with: mortality at last reported follow-up (6-7 months after stroke)
OR 0.71 (0.54 to 0.94)
1077 (4 RCTs) ⨁◯◯◯
VERY LOW 2 4 8 9
291 per 1000 226 per 1000
(182 to 279)
*The risk in the intervention group (and its 95% confidence interval) is based on the assumed risk in the comparison group and the relative effect of the intervention (and its 95% CI). CI: Confidence interval; RR: Risk ratio; OR: Odds ratio;
1. No evidence available 2. No risk of bias assessment 3. I-square=85.8%; p<0.0001 4. All studies conducted in HIC. Reproducing the intervention in low and middle income countries is excepted to not be feasible and not to give the same results 5. Total number of participants=1081; integrated service=583; general ward=498 6. I-square=64.6%; p=0.04 7. Small sample size. Total number of participants=1077; specialized rehabilitation=583; general ward=494 8. I-square=66.6%; p=0.03 9. Small sample size. Total number of participants=1077; specialized rehabilitation=583; general ward=494

78
Should specialized post-acute rehabilitation units vs. general medical ward (4 studies) or ad hoc community care (1 study) be used for people with stroke (Foley 2007)? Question: Specialized post acute rehabilitation units compared to general medical ward (4 studies) or ad hoc community care (1 study) for people with stroke (Foley 2007) Settings: hospital (4 studies) and community service (1 study) Bibliography (systematic reviews): 780_Foley et al. Specialized Stroke Services: A Meta-Analysis Comparing Three Models of Care. Cerebrovasc Dis 2007;23:194–202.
Quality assessment № of patients Effect
Quality Importance № of studies
Study design
Risk of bias Inconsistency Indirectness Imprecision Other
considerations
specialized post acute
rehabilitation units
general medical ward (4
studies) or ad hoc
community care (1 study)
Relative (95% CI)
Absolute (95% CI)
Access to rehabilitation services - not measured
- - - - - - - - - -
Utilization of rehabilitation services (assessed with: length of hospital stay)
4 randomised trials
serious 2 very serious 3 serious 4 serious 5 none 446 413 - MD 13.18 lower (48.28 lower to 21.93
higher) ⨁◯◯◯
VERY LOW
CRITICAL
Rehabilitation outcomes (assessed with: combined death/dependency at the end of scheduled follow-up 6-7 months after stroke)
5 randomised trials
serious 2 not serious 6 serious 4 serious 7 none 193/476 (40.5%)
217/433 (50.1%)
OR 0.63 (0.48 to
0.83)
114 fewer per 1000 (from 46 fewer to 176 fewer) ⨁◯
◯◯ VERY LOW
CRITICAL
Health outcomes (e.g., mortality, morbidity, and quality of life (assessed with: Mortality at the end of last scheduled follow-up (6 and 7 months after stroke onset)
5 randomised trials
serious 2 not serious 8 serious 4 serious 9 none 88/577 (15.3%)
125/542 (23.1%)
OR 0.6 (0.44 to
0.81)
78 fewer per 1000 (from 35 fewer to 114 fewer) ⨁◯
◯◯ VERY LOW
CRITICAL
New outcome
not estimable
not estimable
MD – mean difference, RR – relative risk 1. No evidence available 2. Risk of bias not assessed 3. I-square=95.9%; p<0.00001 4. All studies conducted in HIC. Reproducing the intervention in LMIC is not expected to be feasible and also not expected to give same results 5. Total number of participants: 859; specialized post acute rehabilitation=446; general ward=413 6. I-square=18.6%; p=0.30 7. Total number of participants=909; specialized post acute rehabilitation=476; alternative care=433 8. I-square=0%; p=0.66 9. Total number of participants=1119; specialized post rehabilitation=577; alternative care=542

79
Summary of findings:
Specialized post acute rehabilitation units compared to general medical ward (4 studies) or ad hoc community care (1 study) for people with stroke (Foley 2007) Outcomes Anticipated absolute effects* (95% CI) Relative
effect (95% CI)
№ of participants (Studies)
Quality of the evidence (GRADE)
Comments
Risk with general medical ward (4 studies) or ad hoc community care (1 study)
Risk with specialized post acute rehabilitation units
Access to rehabilitation services - not measured
- -
Utilization of rehabilitation services assessed with: length of hospital stay
The mean utilization of rehabilitation services in the intervention group was 13.18 lower (48.28 lower to 21.93 higher)
- 859 (4 RCTs) ⨁◯◯◯
VERY LOW 2 3 4 5
Rehabilitation outcomes assessed with: combined death/dependency at the end of scheduled follow-up 6-7 months after stroke
OR 0.63 (0.48 to 0.83)
909 (5 RCTs) ⨁◯◯◯
VERY LOW 2 4 6 7
501 per 1000 388 per 1000
(325 to 455)
Health outcomes (e.g., mortality, morbidity, and quality of life assessed with: Mortality at the end of last scheduled follow-up (6 and 7 months after stroke onset
OR 0.6 (0.44 to 0.81)
1119 (5 RCTs) ⨁◯◯◯
VERY LOW 2 4 8 9
231 per 1000 152 per 1000
(117 to 195)
New outcome not estimable
( Studies) 0 per 1000 0 per 1000
(0 to 0)
*The risk in the intervention group (and its 95% confidence interval) is based on the assumed risk in the comparison group and the relative effect of the intervention (and its 95% CI). CI: Confidence interval; RR: Risk ratio; OR: Odds ratio;
1. No evidence available 2. Risk of bias not assessed 3. I-square=95.9%; p<0.00001 4. All studies conducted in HIC. Reproducing the intervention in LMIC is not expected to be feasible and also not expected to give same results 5. Total number of participants: 859; specialized post acute rehabilitation=446; general ward=413 6. I-square=18.6%; p=0.30 7. Total number of participants=909; specialized post acute rehabilitation=476; alternative care=433 8. I-square=0%; p=0.66 9. Total number of participants=1119; specialized post rehabilitation=577; alternative care=542

80
e)Rehabilitationservicesintegratedintothehealthservicecomparedtorehabilitationservicesintegratedintothesocialorwelfareservice
Quality assessment № of patients Effect
Quality Importance № of studies
Study design
Risk of
bias Inconsistency Indirectness Imprecision Other
considerations
home rehabilitation visits performed by health professional team
(physiotherapist, public health nurse, nurse, care
manager or social worker, once every 1-3 months)
home visit guidance without
rehabilitation provided by public health nurses (2-3
times a year)
Relative (95% CI)
Absolute (95% CI)
Access to rehabilitation services - not measured
- - - - - - - - - -
Utilization of rehabilitation services and continuity of care - not measured
- - - - - - - - - -
Rehabilitation outcomes: (assessed with: ADL self-sufficient status measured by the modified Barthel Index (Change between baseline and end of intervention )
- - - - - - - - - -
Health OUtcomes
- - - - - - - - - -