appendix b graphing calculator keystrokesgraphing calculator keystrokes • mhr 721function or...
TRANSCRIPT
Graphing Calculator Keystrokes • MHR 717
A P P E N D I X GRAPHING CALCULATOR KEYSTROKESBNote: Unless otherwise stated, all keystrokes are for the TI-83 Plus orTI-83 graphing calculator. Where stated, keystrokes are provided for theTI-92 Plus or TI-92 graphing calculator.
Function or Instructionand Description Keystroke(s), Menu, or Screen
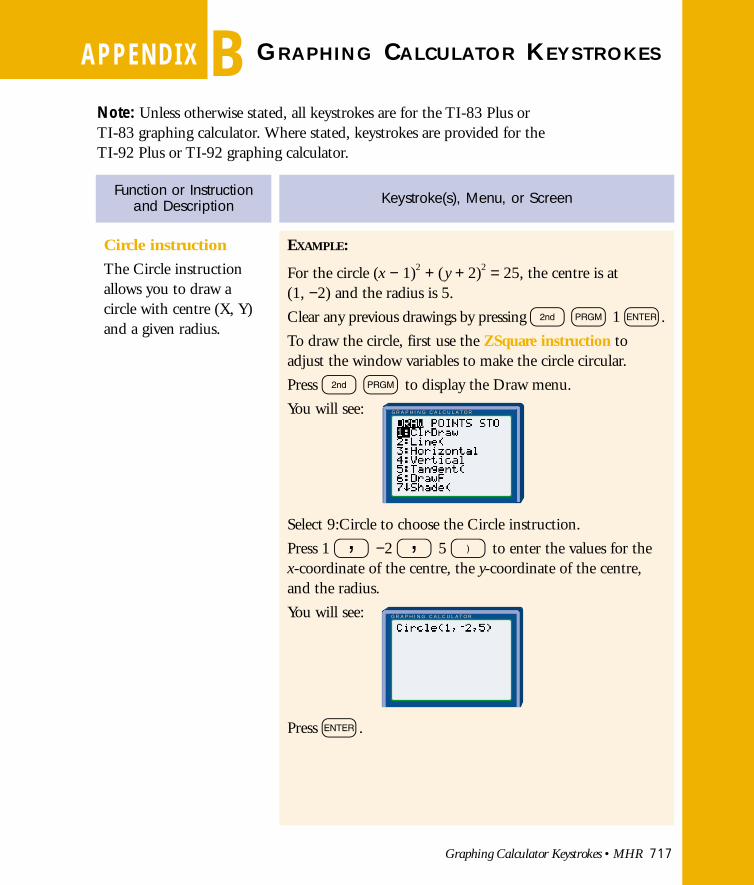
Circle instruction
The Circle instructionallows you to draw acircle with centre (X, Y)and a given radius.
EXAMPLE:
For the circle (x − 1)2 + (y + 2)2 = 25, the centre is at (1, −2) and the radius is 5.
Clear any previous drawings by pressing n p 1 e.
To draw the circle, first use the ZSquare instruction toadjust the window variables to make the circle circular.
Press n p to display the Draw menu.
You will see:
Select 9:Circle to choose the Circle instruction.
Press 1 , −2 , 5 ) to enter the values for thex-coordinate of the centre, the y-coordinate of the centre,and the radius.
You will see:
Press e.
G R A P H I N G C A L C U L A T O RG R A P H I N G C A L C U L A T O R
G R A P H I N G C A L C U L A T O RG R A P H I N G C A L C U L A T O R

718 MHR • Appendix B
Function or Instructionand Description Keystroke(s), Menu, or Screen
cSolve function(TI-92PLUS or TI-92)
The cSolve function, onthe TI-92 Plus or TI-92,solves a polynomialequation for complexsolutions.
You will see:
To select the cSolve function from the Algebra menu, press™ A to display the Complex submenu.
You will see:
Press 1 to select the cSolve function.
Example:
To solve x2 + 2x + 2 = 0 for x,
press ™X ^2 +2 *X +2 =0 ,X )e.
You will see:
G R A P H I N G C A L C U L A T O RG R A P H I N G C A L C U L A T O R
G R A P H I N G C A L C U L A T O RG R A P H I N G C A L C U L A T O R
G R A P H I N G C A L C U L A T O RG R A P H I N G C A L C U L A T O R
Function or Instructionand Description Keystroke(s), Menu, or Screen
Graphing Calculator Keystrokes • MHR 719
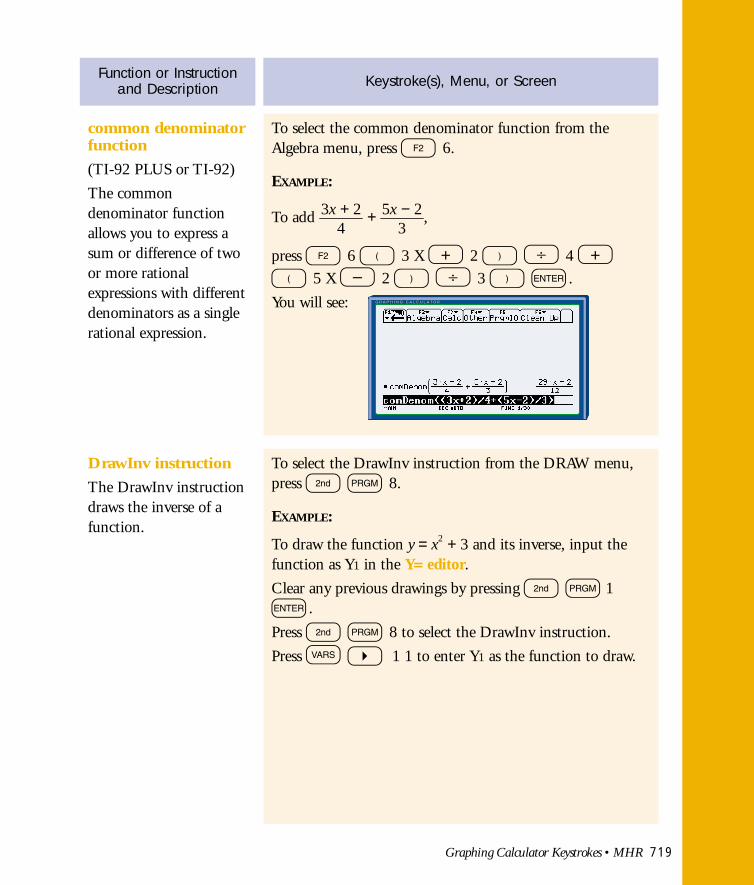
To select the common denominator function from theAlgebra menu, press ™ 6.
EXAMPLE:
To add �3x
4+ 2� + �
5x3− 2�,
press ™ 6 ( 3 X + 2 ) / 4 +( 5 X - 2 ) / 3 ) e.
You will see:
To select the DrawInv instruction from the DRAW menu,press n p 8.
EXAMPLE:
To draw the function y = x2 + 3 and its inverse, input thefunction as Y1 in the Y= editor.
Clear any previous drawings by pressing n p 1e.
Press n p 8 to select the DrawInv instruction.
Press v ] 1 1 to enter Y1 as the function to draw.
common denominatorfunction
(TI-92 PLUS or TI-92)
The commondenominator functionallows you to express asum or difference of twoor more rationalexpressions with differentdenominators as a singlerational expression.
DrawInv instruction
The DrawInv instructiondraws the inverse of afunction.
G R A P H I N G C A L C U L A T O RG R A P H I N G C A L C U L A T O R

720 MHR • Appendix B
Function or Instructionand Description Keystroke(s), Menu, or Screen
Expand function(TI-92 PLUS or TI-92)
The expand function, onthe TI-92 Plus or TI-92,expands and simplifies aproduct of polynomials.
You will see:
Press e.
You will see:
To select the expand function from the Algebra menu, press™ 3.
EXAMPLE:
To expand (4x + 3y)(x − y),
press ™ 3 ( 4 * X + 3 * Y )( X - Y ) ) e.
You will see:
G R A P H I N G C A L C U L A T O RG R A P H I N G C A L C U L A T O R
G R A P H I N G C A L C U L A T O RG R A P H I N G C A L C U L A T O R
G R A P H I N G C A L C U L A T O RG R A P H I N G C A L C U L A T O R

Graphing Calculator Keystrokes • MHR 721
Function or Instructionand Description Keystroke(s), Menu, or Screen
Factor function (TI-92 PLUS or TI-92)
The factor function, onthe TI-92 Plus or TI-92,factors a polynomial.
To select the factor function from the Algebra menu, press™ 2.
EXAMPLE:
To factor 3x2 − 5x + 2,
press ™ 2 3 * X ^ 2 - 5 * X + 2) e.
You will see:
To access the FINANCE menu on the TI-83 Plus, press ∂ 1.
To access the FINANCE menu on the TI-83, press n 1.
You will see:
FINANCE menu
G R A P H I N G C A L C U L A T O RG R A P H I N G C A L C U L A T O R
G R A P H I N G C A L C U L A T O RG R A P H I N G C A L C U L A T O R

722 MHR • Appendix B
Function or Instructionand Description Keystroke(s), Menu, or Screen
Format settings
Format settings definethe appearance of a graphon the display. Formatsettings apply to allgraphing modes.
To display the format settings, press n z.
The default settings are shown here.
To change a format setting, press ', ],;, and [ as necessary, to move the cursor tothe setting you want to select, and press e to select it.
For example, the default setting GridOff means that no gridis displayed on a graph. If you wish to display a grid, press', ', ], and e to selectGridOn.
To display an answer as a fraction, press k to display theMATH menu. Press 1 to select �Frac to convert an answerto a fraction.
EXAMPLE:
To find the exact point of intersection of y = 5x + 3 andy = −2x − 5, enter the functions into the Y= editor andgraph them. Use the intersect operation to find the point ofintersection, x = −1.142857 and y = −2.714286.
To find the exact value of x, press n m x k1 e.
To find the exact value of y, press a 1 k 1 e.
You will see:
�Frac function
The �Frac functiondisplays an answer as afraction.
G R A P H I N G C A L C U L A T O RG R A P H I N G C A L C U L A T O R
G R A P H I N G C A L C U L A T O RG R A P H I N G C A L C U L A T O R

Graphing Calculator Keystrokes • MHR 723
Function or Instructionand Description Keystroke(s), Menu, or Screen
To set the graph style for a function, press y to displaythe Y= editor.
Use the [ key to move the cursor to the left of thefunction to be graphed. Press the e key repeatedly tochoose an appropriate graph style.
Graph styles available may vary depending on whichgraphing mode you are in.
In Func (function) graphing mode, the following styles areavailable.
Line A solid line connects points. This is thedefault style in Connected mode.
Thick A thick solid line connects points.Above Shading covers the area above the graph.Below Shading covers the area below the graph.Path A circular cursor traces the leading edge of
the graph and draws a path.Animate A circular cursor traces the leading edge of
the graph without drawing a path.Dot A small dot represents each point. This is the
default style in dot mode.EXAMPLE:
To graph y = x2 and y = x2 − 3 on the same set of axes, enterthe functions in the Y= editor as Y1 = x2 and Y2 = x2 − 3.The default graph style is line. Leave Y1 as line style. Movethe cursor to the left of Y2 using the arrow keys. Press erepeatedly (6 times) to change the graph style to dot style.
Change the window variables to values such as Xmin = −8,Xmax = 8, Ymin = −5, Ymax = 10. Press the g key todisplay the graphs.
You will see:
graph styles
Varying graph stylesallow you to visuallydifferentiate functionsthat are graphed together.
G R A P H I N G C A L C U L A T O RG R A P H I N G C A L C U L A T O R

724 MHR • Appendix B
Function or Instructionand Description Keystroke(s), Menu, or Screen
Intersect operation
The intersect operationfinds the coordinates of apoint at which two ormore functions intersect.
To find an intersection, display the graphs on the screen.The point of intersection must appear on the display to usethe intersect operation.
EXAMPLE:
To find the point of intersection of y = 3x − 2 and y = −x + 6, use the Y= editor to input both functions andgraph them.
Press n u, to display the CALCULATE menu.
To select the intersect operation, press 5.
You will see:
Press ' or ;, if necessary, to move the cursor to thefirst function, and then press e.
You will see:
Press ' or ;, if necessary, to move the cursor to thesecond function, and then press e.
You will see:
G R A P H I N G C A L C U L A T O RG R A P H I N G C A L C U L A T O R
G R A P H I N G C A L C U L A T O RG R A P H I N G C A L C U L A T O R
G R A P H I N G C A L C U L A T O RG R A P H I N G C A L C U L A T O R

Graphing Calculator Keystrokes • MHR 725
Function or Instructionand Description Keystroke(s), Menu, or Screen
LIST MATH menu
The LIST MATH menuis used to performoperations on one ormore lists of data.
Press ] or [ to move the cursor to the point that isyour guess for the point of intersection, and then press e.
You will see:
Notice that the cursor appears on the solution, and thecoordinates of the solution are displayed.
To display the LIST MATH menu, press n q ]]You will see:
G R A P H I N G C A L C U L A T O RG R A P H I N G C A L C U L A T O R
To display the LIST OPS menu, press n q ]You will see:
LIST OPS menu
The LIST OPS menu isused to performoperations on one ormore lists of data.
G R A P H I N G C A L C U L A T O RG R A P H I N G C A L C U L A T O R
G R A P H I N G C A L C U L A T O RG R A P H I N G C A L C U L A T O R

726 MHR • Appendix B
Maximum operation
The maximum operationfinds the maximum of afunction within aspecified interval.
EXAMPLE:
To find the maximum of y = −2x2 + 6x + 2, input thefunction in the Y= editor.
Press n u to display the CALCULATE menu.Press 4 to select the maximum operation.
You will see:
Press ' or ;, if necessary, to move the cursor ontothe function.
Press ] or [ to move the cursor to the left of themaximum (or enter a value). Select the x-value for the leftbound of the interval by pressing e.
Press ] or [ to move the cursor to the right of themaximum (or enter a value). Select the x-value for the rightbound of the interval by pressing e.
Press ] or [ (or enter a value) to select an x-valuefor a guess at the maximum, and then press e.
You will see:
The vertex of y = −2x2 + 6x + 2 is (1.5, 6.5).
The maximum value of y = −2x2 + 6x + 2 is 6.5 when x = 1.5.
Function or Instructionand Description Keystroke(s), Menu, or Screen
G R A P H I N G C A L C U L A T O RG R A P H I N G C A L C U L A T O R
G R A P H I N G C A L C U L A T O RG R A P H I N G C A L C U L A T O R

Graphing Calculator Keystrokes • MHR 727
Function or Instructionand Description Keystroke(s), Menu, or Screen
EXAMPLE:
To find the minimum of y = 2x2 + 5x − 4, input thefunction in the Y= editor.
Press n u to display the CALCULATE menu.Press 3 to select the minimum operation.
You will see:
Press ' or ;, if necessary, to move the cursor ontothe function.
Press ] or [ to move the cursor to the left of theminimum (or enter a value). Select the x-value for the leftbound of the interval by pressing e.
Press ] or [ to move the cursor to the right of theminimum (or enter a value). Select the x-value for the rightbound of the interval by pressing e.
Press ] or [ (or enter a value) to select an x-valuefor a guess at the minimum, and then press e.
You will see:
The vertex of y = 2x2 + 5x − 4 is (−1.25, −7.125).
The minimum value of y = 2x2 + 5x − 4 is −7.125 whenx = −1.25.
Minimum operation
The minimum operationfinds the minimum of afunction within aspecified interval.
G R A P H I N G C A L C U L A T O RG R A P H I N G C A L C U L A T O R
G R A P H I N G C A L C U L A T O RG R A P H I N G C A L C U L A T O R

728 MHR • Appendix B
Function or Instructionand Description Keystroke(s), Menu, or Screen
To display the mode settings, press m.
The default settings are shown here.
To change a mode setting, press', ], ;, and [ asnecessary, to move the cursor to thesetting you want to select, and presse to select it.
For example, the default setting Radian means that angles aremeasured in radians. If you wish angles to be measured indegrees, press ', ', ], and e to select Degree.
To select the sequence function from the LIST OPS menu,press n q ] 5.
EXAMPLE:
To generate the first 5 terms of the sequence tn = 3n − 2,change the mode settings to Seq(Sequence) mode bypressing m ' ' ' ] ] ].Select the sequence function and input the expression to beused to generate the sequence. The variable, n, can be inputby pressing the x key.
Press , and input the variable to evaluate the expressionfor, in this case, n. Press , and input the term numberto start at, in this case, 1. Press , and input the termnumber to end at, in this case, 5. Press , and input theincrement value for the term numbers, in this case, 1. If theincrement in n is not given, the default value is 1. Press) and then e.
You will see:
Mode settings
Mode settings control theway the calculatordisplays and interpretsnumbers and graphs.
sequence function
The sequence functioncan be used to generateelements of a sequence.
G R A P H I N G C A L C U L A T O RG R A P H I N G C A L C U L A T O R
G R A P H I N G C A L C U L A T O RG R A P H I N G C A L C U L A T O R
Graphing Calculator Keystrokes • MHR 729
Function or Instructionand Description Keystroke(s), Menu, or Screen
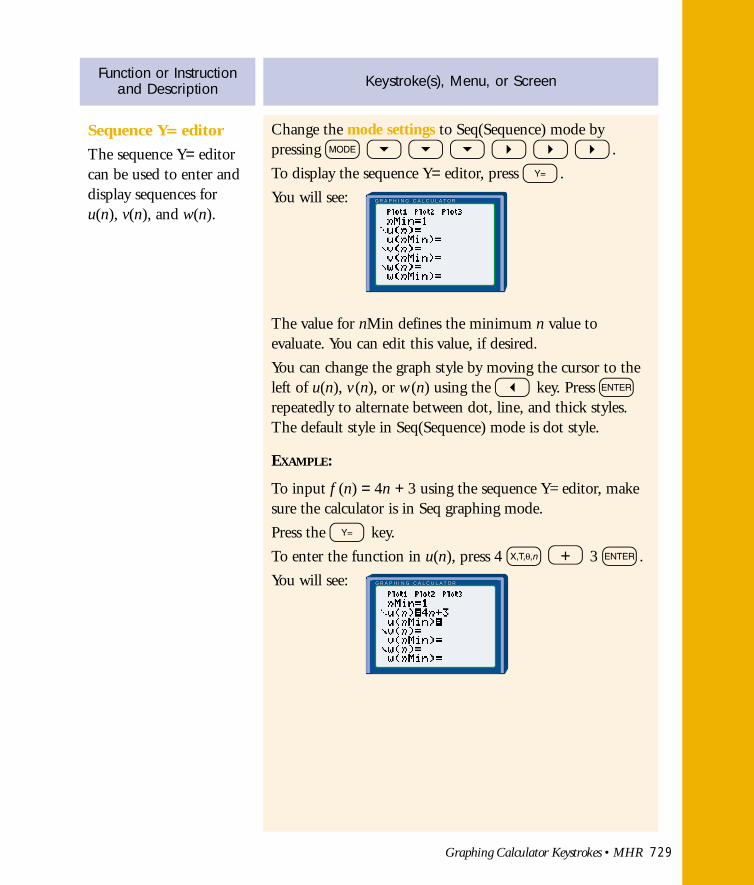
Sequence Y= editor
The sequence Y= editorcan be used to enter anddisplay sequences foru(n), v(n), and w(n).
Change the mode settings to Seq(Sequence) mode bypressing m ' ' ' ] ] ].
To display the sequence Y= editor, press y.
You will see:
The value for nMin defines the minimum n value toevaluate. You can edit this value, if desired.
You can change the graph style by moving the cursor to theleft of u(n), v (n), or w (n) using the [ key. Press erepeatedly to alternate between dot, line, and thick styles.The default style in Seq(Sequence) mode is dot style.
EXAMPLE:
To input f (n) = 4n + 3 using the sequence Y= editor, makesure the calculator is in Seq graphing mode.
Press the y key.
To enter the function in u(n), press 4 x + 3 e.
You will see:
G R A P H I N G C A L C U L A T O RG R A P H I N G C A L C U L A T O R
G R A P H I N G C A L C U L A T O RG R A P H I N G C A L C U L A T O R

730 MHR • Appendix B
Function or Instructionand Description Keystroke(s), Menu, or Screen
SinReg (sinusoidalregression) instruction
The sinusoidal regressioninstruction is used to fitthe equation of atrigonometric function toa given set of data. Thevalues for a, b, c, and dare displayed for afunction of the form y = a sin (bx + c) + d.
To use the sinusoidal regression instruction, enter the datapoints as two lists using the STAT EDIT menu. Choosesuitable window variables using the window editor, or adjustthe window automatically using the ZoomStat instruction.Graph L2 versus L1 on a scatter plot using the STAT PLOTSmenu.
To select the sinusoidal regression instruction, press q] to access the STAT CALC menu. Select C:SinReg.
You will see:
Specify the Xlist name, such as L1, by pressing n 1.
Specify the Ylist name, such as L2, by pressing ,n 2.
Press , v ] 1 to list possible Y= variables.To store the regression equation in Y1, select 1:Y1 andpress e.
You will see:
Press e.
You will see, for example:
The regression equation is stored in the Y= editor. If you wishto view the curve of best fit on your scatter plot, press g.
G R A P H I N G C A L C U L A T O RG R A P H I N G C A L C U L A T O R
G R A P H I N G C A L C U L A T O RG R A P H I N G C A L C U L A T O R
G R A P H I N G C A L C U L A T O RG R A P H I N G C A L C U L A T O R

Graphing Calculator Keystrokes • MHR 731
Solve function(TI-92 PLUS or TI-92)
The solve function, onthe TI-92 Plus or TI-92,solves an algebraicequation for an indicatedvariable.
To select the solve function from the Algebra menu, press ™ 1.
EXAMPLE:
To solve 3x − 4y = −12 for y,
press ™ 1 3 * X - 4 * y – 12, Y ) e.
You will see:
Function or Instructionand Description Keystroke(s), Menu, or Screen
G R A P H I N G C A L C U L A T O RG R A P H I N G C A L C U L A T O R
Press m ' ' ' e to ensure that thecalculator is in Func graphing mode.
To display a graph using the standard viewing window,
press z 6.
To display the current window variables, press w.
You will see:
These are the window variables for the standard viewingwindow.
Standard viewingwindow
The standard viewingwindow is the portion ofthe coordinate planeoften used for graphsshown on the calculatorscreen.
G R A P H I N G C A L C U L A T O RG R A P H I N G C A L C U L A T O R

732 MHR • Appendix B
Function or Instructionand Description Keystroke(s), Menu, or Screen
STAT EDIT menu
The STAT EDIT menuis used when you wish tostore, edit, and view listsof data in the stat listeditor.
To display the STAT EDIT menu, press q.
You will see:
To display the stat list editor, press q 1:Edit.
You will see:
Lists of data can be stored in lists named L1 through L6.
To clear data from a specific list, for example L1,
press q 4:ClrList n 1 e.
To clear data from all lists, press n + 4:ClrAllLists.
EXAMPLE:
Enter the table shown in lists L1
and L2.
Press n + 4:ClrAllListse to clear all data from listsL1 to L6.
Press q 1:Edit to display the stat list editor.
To enter the data in L1, press 2 e 3 e 4 e 5 e.
To enter the data in L2, press ] 0 e 12 e 24e 36 e.
You will see:
G R A P H I N G C A L C U L A T O RG R A P H I N G C A L C U L A T O R
G R A P H I N G C A L C U L A T O RG R A P H I N G C A L C U L A T O R
G R A P H I N G C A L C U L A T O RG R A P H I N G C A L C U L A T O R
L1 L2
2 03 124 245 36

Graphing Calculator Keystrokes • MHR 733
Function or Instructionand Description Keystroke(s), Menu, or Screen
STAT PLOTS menu
The STAT PLOTS menuallows you to plot data ina scatterplot, xyLine,histogram, modified boxplot, regular box plot, ornormal probability plot.
To display the STAT PLOTS menu, press n y.
EXAMPLE:
Plot the data in a scatter plot.
Enter the data in lists L1 and L2 using the STAT EDIT menu.
Press n y to display the STAT PLOTS menu.
You will see:
Press e to select Plot1 or use the ' key to selectPlot2 or Plot3 and press e. To turn on a plot, presse.
You will see:
To select a scatter plot, press ' e.
If the Xlist is not already L1, press ' n 1 e.
If the Ylist is not already L2, press ' n 2 e.
Choose the type of mark for the data points, by pressing
] or [ to highlight the desired mark, and thenpress e.
G R A P H I N G C A L C U L A T O RG R A P H I N G C A L C U L A T O R
G R A P H I N G C A L C U L A T O RG R A P H I N G C A L C U L A T O R
L1 L2
2 03 124 245 36

734 MHR • Appendix B
sum function
The sum function can beused to find the sum ofthe elements of a series.
Change the mode settings to Seq(Sequence) mode bypressing m ' ' ' ] ] ].
To select the sum function from the LIST MATH menu,press n q ] ] 5.
EXAMPLE:
To find the sum of the first 20 terms of the series 5 + 8 + 11 + … , use the sequence function to generate thefirst 20 terms of the series defined by f (n) = 3n + 2 andpress r n 1 e to store the terms in L1.
You will see:
To find the sum of the series, press n q ]] 5 n 1 ) e.
You will see:
Function or Instructionand Description Keystroke(s), Menu, or Screen
To display the plot, press z 9 to select the ZoomStatinstruction.
You will see:
G R A P H I N G C A L C U L A T O RG R A P H I N G C A L C U L A T O R
G R A P H I N G C A L C U L A T O RG R A P H I N G C A L C U L A T O R
G R A P H I N G C A L C U L A T O RG R A P H I N G C A L C U L A T O R

Graphing Calculator Keystrokes • MHR 735
Function or Instructionand Description Keystroke(s), Menu, or Screen
TABLE SETUP screen
A table of values can becalculated and displayedfor any function.
EXAMPLE:
To display a table of values for the function y = 2x2 − 8,enter the function into the Y= editor.
If you wish the table of values to be generated automatically,press n w to display the TABLE SETUP screen. Todefine the initial value for the independent variable, x, setTblStart to the initial value you want for your table ofvalues, for example, −3.
Set �Tbl to the value of the desired increment for theindependent variable, for example, 1.
If you wish the values for both the independent variable, x,and the dependent variable, y, to be displayed automatically,select Indpnt: Auto and Depend: Auto.
For this example, you will see:
Use the U key to display the table of values, by pressingn g.
For this example, you will see:
G R A P H I N G C A L C U L A T O RG R A P H I N G C A L C U L A T O R
G R A P H I N G C A L C U L A T O RG R A P H I N G C A L C U L A T O R

736 MHR • Appendix B
Trace instruction
The TRACE instructionallows you to move thecursor along the graph ofa function. Thecoordinates of points onthe graph are displayedin the viewing window.
For a graph drawn using an equation in the Y= editor, pressthe u key to display the cursor on the graph. Press [or ] to move the cursor along the graph. The x- and y-coordinates of points on the graph will be displayed at thebottom of the screen.
For a scatter plot drawn using the STAT PLOTS menu,
press the u key and [ or ] to move the cursor from one point to the next on the scatter plot. Thecoordinates of each point will be displayed.
Function or Instructionand Description Keystroke(s), Menu, or Screen
TEST menu
The TEST menu allowsyou to use relationaloperators such as =, ≠, >,≥, <, and ≤.
To display the TEST menu, press n k.
You will see:
test submenu
(TI-92 PLUS or TI-92)
The test submenu allowsyou to use relationaloperators such as =, ≠, >,≥, <, and ≤.
To display the test submenu, press n 5 to display theMATH menu. Press 8 or use the arrow keys to highlight8:Test and press e.
You will see:
You can now select the desired operator by using the arrowkeys and pressing e or by pressing the number or letterto the left of the operator.
To cancel the submenu without making a selection, press[ or ÍESC .
G R A P H I N G C A L C U L A T O RG R A P H I N G C A L C U L A T O R
G R A P H I N G C A L C U L A T O RG R A P H I N G C A L C U L A T O R

Graphing Calculator Keystrokes • MHR 737
Function or Instructionand Description Keystroke(s), Menu, or Screen
TVM Solver
The TVM Solver displaysthe time-value-of-money(TVM) variables. Byentering four of thevalues, the TVM Solverwill solve for the fifthvariable.
The five TVM variables are:N - Total number of payment periodsI% - Annual interest ratePV - Present valuePMT - Payment amountFV - Future value or amount
P/Y is the number of payment periods per year in atransaction.
C/Y is the number of compounding periods per year in thesame transaction.
PMT:END BEGIN indicates whether the payment is madeat the end or at the beginning of a payment period.
Change the mode settings to 2 decimal places.
To access the TVM Solver on the TI-83 Plus, press the∂ key and choose 1:Finance to display theFINANCE menu . Choose 1:TVM Solver.
To access the TVM Solver on the TI-83, press n 1to display the FINANCE menu. Choose 1:TVM Solver.
You will see a screen like the following:
Enter the known values for four TVM variables.
You must enter a value or a 0 for the cursor to move to thenext variable.
Enter a value for P/Y and C/Y (if C/Y is not the same as P/Y).
Select END or BEGIN.
Place the cursor on the TVM variable you wish to solve for.
Press a [SOLVE]. [SOLVE] is located above the e key.
G R A P H I N G C A L C U L A T O RG R A P H I N G C A L C U L A T O R

738 MHR • Appendix B
Value operation
The value operationevaluates a function for a specified value of x.
EXAMPLE:
To evaluate the function y = x2 + 3x − 4 for x = −3, inputthe function in the Y= editor.
Press n u to display the CALCULATE menu.
Press e to select the value operation.
You will see:
Enter the value −3 for x.
Press e.
You will see:
Note: The value for which you evaluate a function must liebetween Xmin and Xmax of the viewing window used forthe graph.
Function or Instructionand Description Keystroke(s), Menu, or Screen
You will see, for example:
A square (■ ) in the left column indicates the solutionvariable.
Note: When entering payment values, cash received is inputas a positive number. Cash paid out is input as a negativenumber.
G R A P H I N G C A L C U L A T O RG R A P H I N G C A L C U L A T O R
G R A P H I N G C A L C U L A T O RG R A P H I N G C A L C U L A T O R
G R A P H I N G C A L C U L A T O RG R A P H I N G C A L C U L A T O R
Graphing Calculator Keystrokes • MHR 739
Function or Instructionand Description Keystroke(s), Menu, or Screen
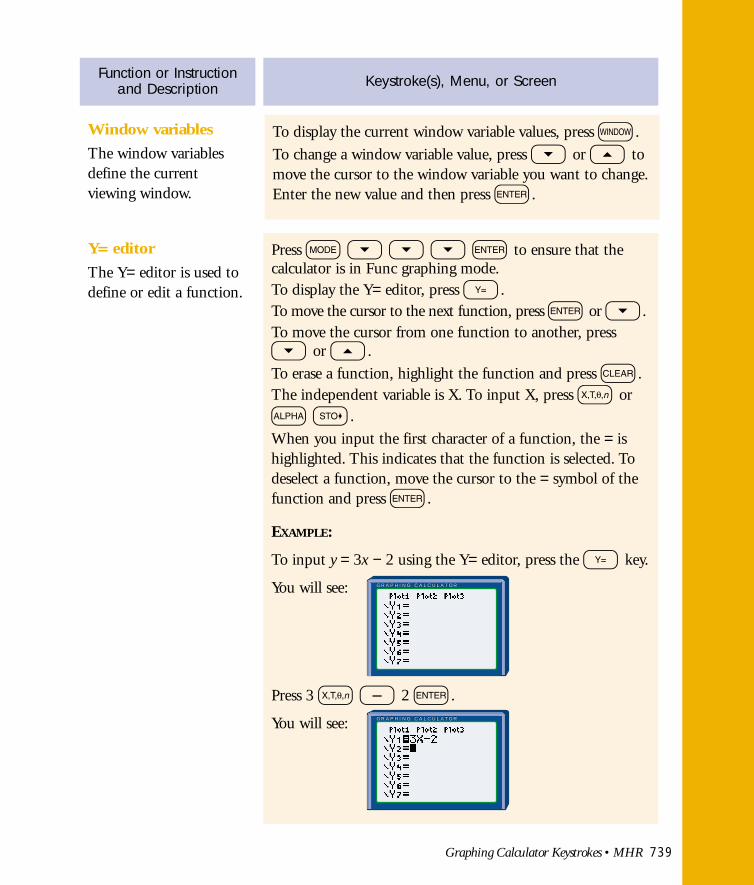
Window variables
The window variablesdefine the currentviewing window.
To display the current window variable values, press w.
To change a window variable value, press ' or ; tomove the cursor to the window variable you want to change.Enter the new value and then press e.
Y= editor
The Y= editor is used todefine or edit a function.
Press m ' ' ' e to ensure that thecalculator is in Func graphing mode.To display the Y= editor, press y.To move the cursor to the next function, press e or '.To move the cursor from one function to another, press' or ;.
To erase a function, highlight the function and press b.The independent variable is X. To input X, press x or
a r.
When you input the first character of a function, the = ishighlighted. This indicates that the function is selected. Todeselect a function, move the cursor to the = symbol of thefunction and press e.
EXAMPLE:
To input y = 3x − 2 using the Y= editor, press the y key.
You will see:
Press 3 x - 2 e.
You will see: G R A P H I N G C A L C U L A T O RG R A P H I N G C A L C U L A T O R
G R A P H I N G C A L C U L A T O RG R A P H I N G C A L C U L A T O R

740 MHR • Appendix B
Function or Instructionand Description Keystroke(s), Menu, or Screen
Zero operation
The zero operation findsthe zeros or x-interceptsof functions. If afunction has two or morex-intercepts, they mustbe found separately byrepeated use of the zerooperation.
EXAMPLE:
To find the x-intercepts of y = x2 + 2x − 8, input thefunction in the Y= editor.
Press n u to display the CALCULATE menu.
Press ' e to select the zero operation.
You will see:
Press ' or ; , if necessary, to move the cursor ontothe function.
To find the left x-intercept, press ] or [ to movethe cursor to the left of the left x-intercept (or enter a value).Select the x-value by pressing e.
Press ] or [ to move the cursor to a locationbetween the left x-intercept and the right x-intercept (orenter a value). Select the x-value by pressing e.
Press ] or [ (or enter a value) to select an x-valuefor a guess at the left x-intercept, and then press e.
You will see:
To find the right x-intercept, press ] or [ to movethe cursor to a location between the left x-intercept and theright x-intercept (or enter a value). Select the x-value bypressing e.
G R A P H I N G C A L C U L A T O RG R A P H I N G C A L C U L A T O R
G R A P H I N G C A L C U L A T O RG R A P H I N G C A L C U L A T O R

Graphing Calculator Keystrokes • MHR 741
Function or Instructionand Description Keystroke(s), Menu, or Screen
Press ] or [ to move the cursor to the right of theright x-intercept (or enter a value). Select the x-value bypressing e.
Press ] or [ (or enter a value) to select an x-valuefor a guess at the right x-intercept, and then press e.
You will see: G R A P H I N G C A L C U L A T O RG R A P H I N G C A L C U L A T O R
Zoom In instruction
The Zoom In instructionallows you to magnifythe part of the graph thatsurrounds the cursorlocation.
Press z to display the ZOOM menu.
Select 2:Zoom In. The zoom cursor (+) is displayed on yourgraph.
Use the arrow keys to move the cursor to the point that is tobe the centre of the new viewing window. Press e.
The viewing window is adjusted and updated and theselected function is replotted, centred on the cursor location.
You can zoom in on the graph again by pressing e tozoom in at the same point or by moving the cursor to thepoint you want as the centre of the new viewing windowand then pressing e.
ZOOM menu
The ZOOM menucontains instructions thatallow you to adjust theviewing window quickly.
To display the ZOOM menu, press z.
You will see: G R A P H I N G C A L C U L A T O RG R A P H I N G C A L C U L A T O R

742 MHR • Appendix B
Function or Instructionand Description Keystroke(s), Menu, or Screen
ZoomStat instruction
The ZoomStatinstruction redefines thewindow variables todisplay all statistical datapoints on the screen.
Press z to display the ZOOM menu.
Press 9 to display all your data using the ZoomStatinstruction.
ZSquare instruction
The ZSquare instructionallow you to adjust theviewing window, so thatgraphs are plotted usingequal-sized-scales onboth the x- and y-axes.
Press z to access the ZOOM menu.
Press 5 to display a graph using the ZSquare instruction.
EXAMPLE:
To graph y = x2 − 4 using the ZSquare instruction, input thefunction using the Y= editor.
Press z to access the ZOOM menu.
You will see:
Press 5 to display the graph using the ZSquare instruction.
You will see:
G R A P H I N G C A L C U L A T O RG R A P H I N G C A L C U L A T O R
G R A P H I N G C A L C U L A T O RG R A P H I N G C A L C U L A T O R