appendix a salem reservoir and pumping ... - city of barrie
TRANSCRIPT

APPENDIX A
Salem Road Water Reservoir & Pumping Station
Technical Memorandum

Salem Road Water Reservoir & Pumping Station
City of Barrie
Technology and Alternative Site Assessment
December 2017 Technical Memorandum
TABLE OF CONTENTS
1.0 INTRODUCTION ................................................................................ 1
Background ............................................................................................................................. 1
Objective .................................................................................................................................. 1
Existing Zone 3S Major Infrastructure Systems ................................................................. 2
Water Storage .......................................................................................................... 2
Pumping Capacity .................................................................................................... 2
Water Distribution Zones 2S & 3S – Critical Infrastructure ..................................... 3
2.0 CONCEPT DESIGN BASIS ............................................................... 4
Reservoir Storage Volume .................................................................................................... 4
Maximum Daily Design Flow .................................................................................... 4
Fire Storage Requirements ...................................................................................... 4
Equalization and Emergency Storage Requirements .............................................. 4
Pressure Zone 3S – 2027 to 2031 Pumping Requirements ............................................... 5
Proposed Salem Pumping Station Design Capacity ............................................... 6
Reservoir and Pumping Station Site Alternatives .............................................................. 7
Site 1: North Side of Salem Road ............................................................................ 9
Site 2: South Side of Salem Road ........................................................................... 9
Reservoir System Alternatives ........................................................................................... 10
Cast-in-Place Concrete In-Ground Reservoir ........................................................ 12
Cylindrical At-Grade Water Storage Reservoirs .................................................... 13
3.0 TECHNOLOGY OPTIONS & SITE LOCATIONS ............................ 17
Salem Road Reservoir and Pumping Station Design Features ...................................... 17
Option 1A – In-Ground Reservoir & Pumping Station – Site 1: North Side Salem Road17
Option 1B – In-Ground Reservoir and Pumping Station – Site 2: South Side Salem Road18
Options 2A & 3A – At-Grade Reservoir and Pumping Station – Site 1: North Side Salem
Road 19
Options 2B & 3B – At-Grade Reservoir and Pumping Station – Site 2: South Side Salem
Road 20
4.0 COST ANALYSIS ............................................................................ 21

Approach ............................................................................................................................... 21
Estimated Capital Costs ...................................................................................................... 21
Maintenance/Refurbishment Costs .................................................................................... 21
Estimated Energy Cost ........................................................................................................ 22
Summary of Cost Analysis .................................................................................................. 24
5.0 EVALUATION PROCESS ............................................................... 26
Technology Evaluation ........................................................................................................ 26
Environmental Impact Evaluation ...................................................................................... 26
6.0 RECOMMENDATIONS .................................................................... 28
7.0 REFERENCES ................................................................................. 29
TABLE OF FIGURE
Figure 2-1 Salem Reservoir and Pumping Station – Site Selection Options ........................................... 8
Figure 3-1 Salem Reservoir and Pumping Station – Site 1, In-Ground Reservoir Option ..................... 18
Figure 3-2 Salem Reservoir and Pumping Station – Site 1, At-Grade Reservoir Option Plan .............. 19
Figure 3-3 Salem Reservoir and Pumping Station – Site 1, At-Grade Reservoir Option 3D Views ...... 20
TABLE OF TABLES
Table 1-1 Existing City of Barrie Water Distribution System Pressure Zones 2S and 3S – Critical
Elevations, Design Pump Heads, Capacities and Storage Volume(2) ...................................................... 3
Table 2-1 Total Storage Capacity Criteria for Salem Reservoir ............................................................ 4
Table 2-2 Pressure Zone 3S Required Pumping Capacity: 2027 - 2031 ............................................... 5
Table 2-3 Existing and Proposed City of Barrie Water Distribution System Pressure Zones 2S
and 3S – Critical Elevations, Design Pump Heads, Capacities and Storage Volume ........................... 6
Table 4-1 Comparison Estimated Construction Cost – Reservoir and Pumping Station Options 24
Table 4-2 Comparison Estimated Life Cycle Costs – Reservoir and Pumping Station Options ..... 24
Table 5-1 Technology Evaluation Matrix ................................................................................................ 27

APPENDICES
Appendix A – Drawings
Appendix B – Capital and Life Cycle Cost Estimates
Appendix C – Evaluation Matrices
1 | P a g e
1.0 INTRODUCTION
Background
The City of Barrie issued an Official Plan Amendment and Secondary Plan for the Annexed Area, south of
the pre-2010 City boundary on January 1, 2010 following the acquisition of 2,350 hectares of land from the
Town of Innisfil pursuant to the Barrie-Innisfil Boundary Adjustment Act, 2009. In determining the future land
use of the transferred lands (“Annexed Lands”), the associated infrastructure requirements and financial
implications, the City commenced a comprehensive Master Planning initiative.
The City of Barrie Drinking Water System 2010 Annual Report identified five major pressure zones
throughout the City consisting of: Zone 1, 2North (2N), 3North (3N), 2South (2S) and 3South (3S). These
primary zones are controlled by elevated tanks and reservoirs. Some zones also have locally reduced or
boosted secondary pressure areas. The Water Storage and Distribution Master Plan, 2013 and Class EA
for the Annexed Area and Intensification Areas within the pre-2010 City boundary, was completed to identify
and evaluate the water storage and distribution requirements of the Study Area for a period of 2011 to 2031
due to anticipated growth. Further, the Master Plan fulfills the requirements of Phases 1 and 2 of the
Municipal Class EA process, the Lake Simcoe Protection Plan process and the Safe Water Drinking Act,
2002 for the expansion of the water storage and distribution system.
The Master Plan concluded that no additional storage was required for pressure Zones 1, 2S and 3N for all
the phases however there was a deficit of storage in Zones 2N and 3S for all phases. To account for the
storage deficit, a new Zone 3S reservoir, Salem Road Reservoir and Pumping Station, was recommended
for implementation in years 2022 to 2026 with an ultimate storage capacity of 20ML before the end of the
20 year planning horizon.
Drawings G01 and G02 in Appendix A provide an overview of the City of Barrie Water Distribution System
Pressure Zones and the Salem and Lockhart Road Study Area covered by this TM.
Objective
The primary purpose of the proposed Salem Water Reservoir and Pumping Station is to provide sufficient
storage and pumping capacity to accommodate future growth in the pressure Zones 2S and 3S.
The objectives of this Technical Memorandum are to evaluate two alternative site locations as well as three
reservoir technology system alternatives taking into consideration of the following considerations:
• Hydraulics and topography
• Site development, drainage and access
• Operation and maintenance
• Capital and Life cycle costs

2 | P a g e
Existing Zone 3S Major Infrastructure Systems
Zone 3S is located on the southwestern boundary of the City of Barrie and is a combination of both pre-
2010 City boundary area as well as a portion of the Annexed Lands. The major existing infrastructure
systems include the Barrie Surface Water Treatment Plant, located in Zone 2S, the Harvie Road Reservoir
and Pumping Station located in Zone 3S, the Mapleview Elevated Tank located in Zone 3S, and the Big Bay
Point Road Pumping Station, located in Zone 3S.
Water Storage
The Mapleview Drive Elevated Tank is located in the Zone 3S boundary between Hwy 400 and Essa Road.
Mapleview Elevated Tank contains floating storage capacity for Zone 3S and is currently the only existing
dedicated reservoir in Zone 3S.
Summary of the Mapleview Elevated Tank is as follows:
• Elevated tank designed for fire storage, equalization storage and emergency storage.
• Total capacity = 5,455 m3 (Reference: City of Barrie, Water Supply Master Plan, Schedule A,
Mapleview Elevated Water Reservoir, Pg. 22)
• Bottom Water Level = 337.7 m (Reference: 2012 InfoWater model)
• Top Water Level = 350.2 m (Reference: 2012 InfoWater model)
Pumping Capacity
The existing pumping capacity available is in Zone 3S consists of two (2) pumping stations detailed below:
1. Harvie Road Pumping Station, which comprises of four (4) pumps each with an approximate
capacity of 133.3 L/s (11.5 MLD) at 47m with a firm capacity of approximately 400 L/s (34.5 MLD)
and a total capacity of approximately 533 L/s (46.1 MLD) (reference: 2012 InfoWater model).
2. Big Bay Point Road Pumping Station, which comprises of four (4) pumps each with an approximate
capacity of 135 L/s (11.5 MLD) at 47.3m with a firm capacity of approximately 405 L/s (35 MLD)
and a total capacity of approximately 540 L/s (46.7 MLD) (reference: 2012 InfoWater model).

3 | P a g e
Water Distribution Zones 2S & 3S – Critical Infrastructure
Refer to Table 1-1 below illustrating the critical elevations, design pump heads, capacities and storage
volume of the existing major infrastructure systems in Zone 2S and 3S.
Table 1-1 Existing City of Barrie Water Distribution System Pressure Zones 2S and 3S – Critical
Elevations, Design Pump Heads, Capacities and Storage Volume(2)
Location Description
Operating
Elevation
(m)
Design
Pump
Head (m)
Equipped
Capacity (L/s)
Firm Capacity
(L/s) (1)
Vol
(ML)
Barrie Surface
Water
Treatment
Plant –
Centreline of
Pump
Discharge
Pumps to
Harvie
Reservoir and
proposed
Salem
Reservoir
255.1 m 65.5 m 1255 L/s 920 L/s N/A(3)
Big Bay Point
Road Pumping
Station –
Centre Line of
Pump
Discharge
Pumps to the
Mapleview
Elevated Tank 281.3 m 47.3 m
Existing Design Cap:
500 L/s (2x100+
2x150 @ 47.3m
TDH)
Existing Firm Cap:
350 L/s (2x100+
1x150)
N/A
Harvie Road
Pumping
Station –
Centreline of
Pump
Discharge
Pumps to the
Mapleview
Elevated Tank 304.8 m 45.0 m
533 L/s (4 Duty
Pumps, at 133.3
L/s)
400 L/s (3 Duty
Pumps at
133.3 L/s)
N/A
Harvie Road
Reservoir –
Operating
Range
Provides
floating
storage at
Pressure Zone
2S and
pumped
storage to
Pressure Zone
3S
302 m –
308 m N/A N/A N/A
27.3
ML
Mapleview
Elevated Tank
– Operating
Range
Provides
floating
storage at
Pressure Zone
3S
337.7 m –
350.2 m N/A N/A N/A
5.4
ML
Notes:
1. Firm pumping capacity = equipped pumping capacity minus largest pump out of service.
2. Reference: 2012 InfoWater model.
3. N/A denotes not applicable.

4 | P a g e
2.0 CONCEPT DESIGN BASIS
Reservoir Storage Volume
The storage volume requirements need to provide for fire storage, maximum day equalization storage and
emergency storage for Zone 3S as per the MOECC Guidelines and the City’s Water Transmission and
Distribution Policies and Design Guidelines. Population growth in Zone 3S has been calculated to be an
equivalent population of 72,717 by 2031 (Water Storage and Distribution Master Plan – Appendix D – Phase
3: 2027 – 2031 Table). This equivalent population will require 20ML water storage volume to meet projected
demand. Refer to Table 2-1 for a detailed breakdown.
Table 2-1 Total Storage Capacity Criteria for Salem Reservoir
Component Criteria Water Storage and Distribution Master
Plan, October 2013
A: Fire Storage Largest expected fire volume
(378 L/s per 6 hours) 8165
B: Equalization Storage 25% of Maximum Day Demand 7881
C: Emergency Storage 25% of (A + B) 4011
Total A + B + C 20063
Notes:
1. Water Storage and Distribution Master Plan – Appendix D – Phase 3: 2027 – 2031 Table.
Maximum Daily Design Flow
The proposed conceptual design for the Salem Water Reservoir and Pumping Station are based on the City
of Barrie Water Storage and Distribution Master Plan – Appendix D – Phase 3: 2027 – 2031 Table, which is
consistent with the Water Transmission and Distribution Policies and Design Guidelines, 2015, as well as
the MOECC Criteria. Based on the Master Plan, the ultimate (2031) Maximum Day flow is 365 L/s (31.5
MLD).
Fire Storage Requirements
The City of Barrie’s Water Transmission and Distribution Policies and Design Guidelines, 2015, indicates
that watermain sizing shall be determined by fire flow plus maximum day use. The total equivalent population
for 2031 in Zone 3S is estimated to be 72,717. As the MOECC recommends a fire flow of 378 L/s for 6
hours, the calculated required volume of fire storage is 8165 m3. (Source: Water Storage and Distribution
Master Plan – Appendix D – Phase 3: 2027 – 2031).
Equalization and Emergency Storage Requirements
In accordance with MOECC Guidelines and the City’s standards, Equalization Storage is 25% of the
maximum day demand and Emergency Storage is 25% of the sum of Fire Storage and Equalization Storage.

5 | P a g e
The equalization storage requirements amounts to approximately 7.9 MLD and 4.0 MLD for emergency
storage.
Pressure Zone 3S – 2027 to 2031 Pumping Requirements
The required 2027 to 2031 required pumping capacity for Pressure Zone 3S has been estimated at
approximately 803 L/s, in accordance with the following design rationale:
• Water Storage and Distribution Master Plan – Appendix D – 2027 to 2031 Maximum Day Demand
(MDD) of 365 L/s.
• Peak Hour Demand of 550 L/s, calculated by multiplying the MDD by 1.5.
• Fire Flow of 378 L/s in accordance with MOECC guidelines and the Water Storage and Distribution
Master Plan – Appendix D – 2027 to 2031.
• Available Fire Flow protection from the existing Mapleview Elevated Tank of 125 L/s, calculated by
50% of the 5,400,000 L capacity of the tank, divided by a 6 hour fire flow.
• The required pumping capacity for Pressure Zone 3S – 2027 to 2031 was calculated by the addition
of the peak hour demand and the fire flow, less the available fire flow from the Mapleview Elevated
Tank to obtain 803 L/s.
Table 2-2 Pressure Zone 3S Required Pumping Capacity: 2027 - 2031
Location Description
Zone 3S
Max Day
Demand
(L/s)
Peak Hour
Demand
(L/s)
Fire Flow
(L/s)
Available
Fire Flow
from
Mapleview
Elevated
Tank (L/s)
Required
Pumping
Capacity
(L/s)
Pressure Zone
3S: Pumping
Stations
Capacity
Requirement:
Pumps to the
Mapleview
Elevated Tank and
Pressure Zone 3S
365 L/s (1) 550 L/s (2) 378 L/s (1) 125 L/s (3) 803 L/s (4,5)
Notes:
1. Water Storage and Distribution Master Plan – Appendix D – Phase 3: 2027 – 2031 Table.
2. Peak Hour Demand = Maximum Day Demand times 1.5.
3. Available fire flow is calculated by 50% of the available storage volume in the Mapleview
Elevated Tank (2,700,000 L) divided by 216,000 seconds (i.e., 6 hour fire duration in accordance
with MOECC Design Guidelines and the Water Storage and Distribution Master Plan).
4. Required pumping capacity is calculated based on Peak Hour demand plus Fire Flow, less the
available Fire Flow from the Mapleview Elevated Tank.
5. Required pumping capacity is based on a combination of two (2) of the three (3) Zone 3S
pumping stations in service (i.e., Big Bay Point Road Pumping Station, Harvie Road Pumping
Station, and the proposed Salem Road Pumping Station)

6 | P a g e
Proposed Salem Pumping Station Design Capacity
The planned 2027 – 2031 pumping capacity for Pressure Zone 3S has been calculated to be approximately
803 L/s. This pumping capacity is required to be achieved based on the City’s required pumping strategy:
Convey the planned pumping capacity via 2 of the 3 pumping stations which service Pressure Zone 3S).
The available firm pumping capacity from each of the existing Zone 3S Pumping Stations (i.e., Harvie Road
Pumping Station and the Big Bay Point Pumping Station) is approximately 400 L/s. With one of these
pumping stations out of service, the pump capacity deficit for Pressure Zone 3S is approximately 403 L/s.
Based on this pumping capacity deficit, it is recommended that three (3) duty pumps and (1) one standby
pump on VFD control are proposed to supply approximately 403 L/s, with the output capacity per pumps
estimated at 135 L/s. Addition design characteristics of the pumping station should include a common
suction header will draw from a depressed sump pit, piping configuration will allow water to bypass the
reservoir complete and be pumped immediately, bi-directional piping that will allow flow to be recirculated
into Zone 2S, as required.
Table 2-3 summarizes the existing and proposed critical elevations, design pump heads, capacities and
storage volumes for Pressure Zones 2S and 3S – 2027 – 2031 planning period.
Table 2-3 Existing and Proposed City of Barrie Water Distribution System Pressure Zones 2S
and 3S – Critical Elevations, Design Pump Heads, Capacities and Storage Volume
Location Description
Operating
Elevation
(m)
Design
Pump Head
(m)
Equipped
Capacity
(L/s)
Firm
Capacity
(L/s) (1)
Volume
(ML)
Barrie Surface
Water Treatment
Plant – Centreline
of Pump
Discharge
Pumps to Harvie
Reservoir and
proposed Salem
Reservoir
255.1 m 65.5 m 1255 L/s 920 L/s N/A3
Big Bay Point
Road Pumping
Station – Centre
Line of Pump
Discharge
Pumps to the
Mapleview
Elevated Tank
281.3 m 47.3 m
Existing
Design Cap:
500 L/s
(2x100+
2x150 @
47.3m TDH)
Proposed
Design Cap:
540 L/s
(4x135L/s @
47.3mTDH)
Existing
Firm Cap:
350 L/s
(2x100+
1x150)
Proposed
Firm Cap:
405 L/s
(3x135L/s
@ 47.3m
TDH)
N/A
Harvie Road
Pumping Station
– Centreline of
Pump Discharge
Pumps to the
Mapleview
Elevated Tank
304.8 m 45.0 m
533 L/s (4
Duty Pumps,
at 133.3 L/s)
400 L/s (3
Duty Pumps
at
133.3 L/s)
N/A

7 | P a g e
Location Description
Operating
Elevation
(m)
Design
Pump Head
(m)
Equipped
Capacity
(L/s)
Firm
Capacity
(L/s) (1)
Volume
(ML)
Harvie Road
Reservoir –
Operating Range
Provides floating
storage at
Pressure Zone 2S
and pumped
storage to
Pressure Zone 3S
302 m –
308 m N/A N/A N/A 27.3 ML
Mapleview
Elevated Tank –
Operating Range
Provides floating
storage at
Pressure Zone 3S 337.7 m –
350.2 m N/A N/A N/A 5.4 ML
Proposed Salem
Pumping Station
– Centreline of
Pump Discharge
Pumps to the
Mapleview
Elevated Tank
± 304.8 m (2) ± 45.0 m (2)
535 L/s
(3 Duty
Pumps, 1
Standby
Pump, each
rated at
±135 L/s)
405 L/s
(3 Duty
Pumps at
±135 L/s)
Proposed Salem
Reservoir –
Operating Range
Provides floating
storage at
Pressure Zone 2S
and pumped
storage to
Pressure Zone 3S
302 m –
308 m N/A N/A N/A 20 ML
Notes:
1. Firm pumping capacity = equipped pumping capacity minus largest pump out of service.
2. Estimated to be approximately equivalent to the existing Harvey Road Pumping Station for
conceptual design and preferred site selection analysis. The final elevation of the pump
discharge header and design pump head is required to be determine at the detailed design
stage.
3. N/A denotes not applicable.
Reservoir and Pumping Station Site Alternatives
Overview of Site Evaluation Process
The City’s Water Storage and Distribution Master Plan (2013) modeling assumed the proposed site for the
Salem Road Reservoir and Pumping station to be located just east of the Veterans Drive and Salem Road
intersection, just west of Highway 400. This is depicted in Drawing G02 in Appendix A. The area was
considered compatible for this infrastructure based on existing land use, topographic features and water
distribution system needs.
Based on the study area proposed in the City’s Water Storage and Distribution Master Plan, the following
site selection options are identified in order to proceed with the conceptual design of the proposed Salem
8 | P a g e
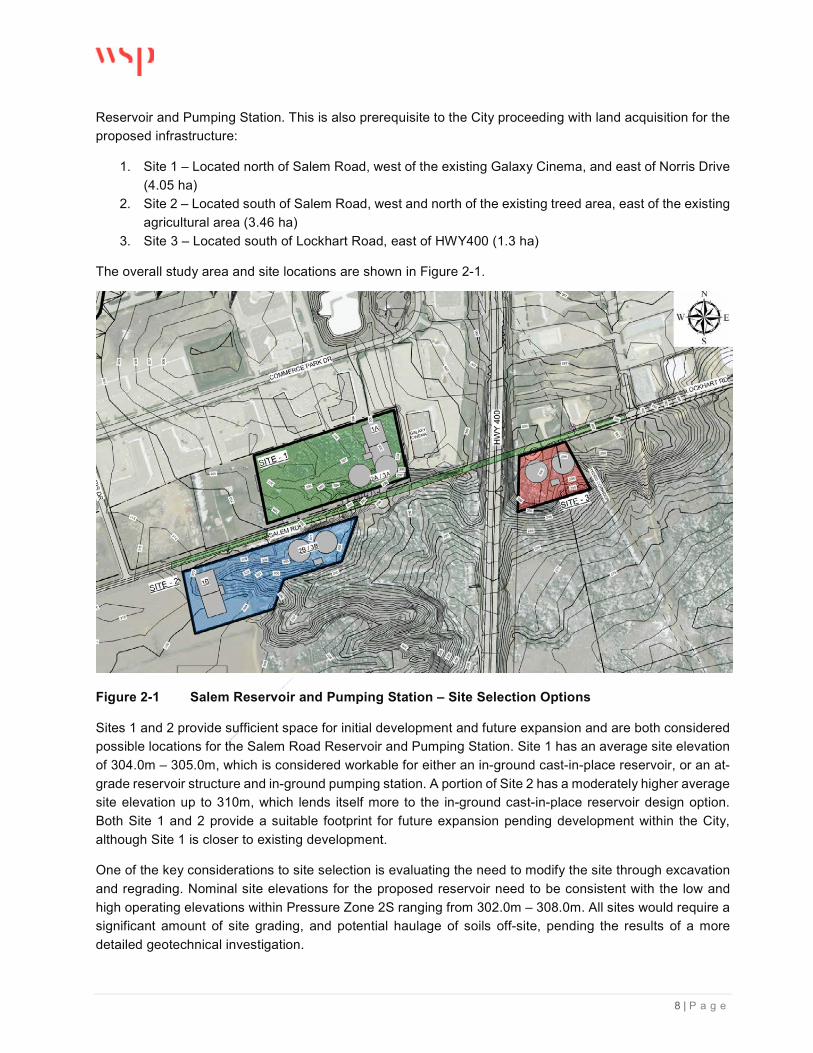
Reservoir and Pumping Station. This is also prerequisite to the City proceeding with land acquisition for the
proposed infrastructure:
1. Site 1 – Located north of Salem Road, west of the existing Galaxy Cinema, and east of Norris Drive
(4.05 ha)
2. Site 2 – Located south of Salem Road, west and north of the existing treed area, east of the existing
agricultural area (3.46 ha)
3. Site 3 – Located south of Lockhart Road, east of HWY400 (1.3 ha)
The overall study area and site locations are shown in Figure 2-1.
Figure 2-1 Salem Reservoir and Pumping Station – Site Selection Options
Sites 1 and 2 provide sufficient space for initial development and future expansion and are both considered
possible locations for the Salem Road Reservoir and Pumping Station. Site 1 has an average site elevation
of 304.0m – 305.0m, which is considered workable for either an in-ground cast-in-place reservoir, or an at-
grade reservoir structure and in-ground pumping station. A portion of Site 2 has a moderately higher average
site elevation up to 310m, which lends itself more to the in-ground cast-in-place reservoir design option.
Both Site 1 and 2 provide a suitable footprint for future expansion pending development within the City,
although Site 1 is closer to existing development.
One of the key considerations to site selection is evaluating the need to modify the site through excavation
and regrading. Nominal site elevations for the proposed reservoir need to be consistent with the low and
high operating elevations within Pressure Zone 2S ranging from 302.0m – 308.0m. All sites would require a
significant amount of site grading, and potential haulage of soils off-site, pending the results of a more
detailed geotechnical investigation.

9 | P a g e
Site 3 provides an appropriate area for the current proposed reservoir and pumping station site, however
offers limited future expansion opportunities due to its small footprint and adjacent constraints including
HWY400 and the Hydro corridor. The average grade of this site is approximately 298.0m which requires
considerable infill to raise the site to accommodate the minimum operating level of 302.0 m within Pressure
Zone 2S.
It is anticipated the development of any of the three (3) sites would not have significant negative impact to
the natural and social/cultural environment although some land use will be changed to suit the approved
zoning of these and adjacent lands as well as the proposed Salem Road redevelopment.
It should be noted that for the selected site and reservoir technology, the City’s hydraulic model and hydraulic
capacity of the Barrie SWTP would need to be reviewed to confirm the final reservoir design and pumping
station capacities for the Salem Reservoir and Pumping Station.
Site 1: North Side of Salem Road
Site 1 is located on a property approximately 293m long by 137m deep covering an area of approximately
4.05 ha, making it suitable for both the proposed reservoir and pumping station, as well as accommodating
future expansion. The southeastern-most quadrant consists of steep sloped terrain ranging in elevations
from 295m to 305m. The northern and southwestern sections are relatively flatter, but still have a notable
elevation variance of 4 meters from 305m to 309m. The site is generally undeveloped green land consisting
of small shrubbery plants over approximately half of the property and offers the greatest flexibility associated
with a future expansion compared to the other sites.
Bordering the site on the north and east side are existing commercial properties accessible from Commerce
Park Drive and consist of surface parking and low rise sprawling commercial plazas. Immediately to the west
and south of the site are mostly green fields and some rural single family dwellings.
The section of Salem Rd just south of the property is currently a dirt road which dead-ends just east of the
site before Highway 400. As noted above, this portion of Salem Rd is proposed for future road upgrade
which is projected to become a major transit corridor crossing over Highway 400 and extending to Lockhart
Rd.
Site 2: South Side of Salem Road
Site 2 is located on a moderately smaller, and narrower, land parcel which measures roughly 365m long by
125m deep covering an extended area of approximately 3.46 ha. The site slopes horizontally from the
northwestern corner to the southeastern corner with quite significant grade variance, generally rising up from
the western most portion at an elevation of approximately 310 m, and then sloping away to the south and
east.
Site 2 is generally undeveloped green land consisting of forested areas, especially within the eastern portion
which has suitable grades for both reservoir storage options. This site is narrower than the Site 1, and does
not offer as much flexibility associated with a future expansion compared to Site 1.
Lands adjacent to the Site 2 are currently undeveloped with nearby areas designated as neighbourhood
mixed use as part of the 2031 Salem Secondary Master Plan. Development beyond 2031 may continue to
increase neighbourhood mixed use lands which directly border this site.

10 | P a g e
Site 3: South Side of Lockhart Rd
Site 3 covers the smallest area of all 3 options, measuring approximately 115m by 115m and consisting of
a total of 1.31 ha. The site is relatively flat and has an average elevation of approximately 298 m. This site
would require some infilling to facilitate reservoir and pumping station construction to accommodate the low
operating level of 302m within Pressure Zone 2S. Given the existing grade, this site is most suitable for the
at-grade reservoir storage option.
Bordering the site, on the north side of Lockhart Rd, are existing low-rise commercial/industrial properties
with surface parking accessible from Lockhart Rd, Bayview Dr and Saunders Rd. Immediately to the west is
Highway 400 with predominantly green fields, forest and a golf course to the south. Passing adjacent and
to the east of the site running through the property in a north-south direction is a hydro corridor.
Lockhart Rd just north of the property currently dead-ends just west of the site before Highway 400. As noted
above, this portion of Lockhart Rd is proposed for future road upgrade which is projected to become a major
transit corridor crossing over Highway 400 and extending to Salem Rd. This development will significantly
limit access to the site.
One of the major contributors for the preferred site selection is the availability of land for future expansion.
Given the steep downward slopes associated with the east, west and south borders of Site 3, as well as the
proximity to the existing Hydro corridor, it is not practical to extend this site beyond the depicted boundaries.
Summary of Site Review
Based on the above evaluation and noting the required infrastructure and existing grading constraints, both
Site 1 and Site 2 are candidate sites worth further evaluation with Site 1 offering the best overall location
considering adjacent development, accessibility, environmental sensitivity and future expansion. However,
there is no significant additional space available on Site 3 to expand water storage capacity in the future
beyond 20ML, the site is sandwiched between Highway 400 and a Hydro Corridor and ultimately offers
limited access. Therefore, Site 3 is excluded from any further analysis.
Reservoir System Alternatives
As described below in more detail, there a variety of materials and technologies that may be employed to
provide potable water storage. For this analysis, the City has requested three alternative reservoir systems
be assessed for implementation; traditional in-ground or partially in-ground cast-in-place concrete structure,
at-grade cylindrical precast concrete, horizontally prestressed tank structure and at grade cylindrical glass-
fused-to-steel bolted steel tank structure. There are significant differences between these approaches which
dictate that a more detailed assessment of each alternative on each of the proposed sites, be completed as
part of this Technical Memorandum.
The large majority of reservoirs currently in use and being specified for new construction are based on steel,
glass-fused-to-steel and concrete materials and technologies. Reservoirs are generally considered to be
ground-supported, flat-bottom tanks with a tank shell height less than its nominal footprint or diameter. This
configuration is generally considered the most economical to construct and maintain.

11 | P a g e
Traditionally, large storage tanks have been either made from steel, which is welded together and finished
onsite, or concrete, which is poured in place onsite. Both types of tanks perform well, but have some distinct
disadvantages when compared to other available reservoir technologies:
• Cast-in-place concrete in-ground reservoirs are generally more complex and time consuming to
construct and require added time and special provisions to properly cure and test before being put
into service as compared to cylindrical steel or precast/prestressed concrete style at-grade
reservoirs.
• Field-welded steel reservoirs generally require a high level of welding and erecting skill and can be
difficult to finish properly at the site. Welding must be thoroughly inspected during and after
completion to ensure that the steel structure will not fail, leak or corrode prematurely.
o Field erected welded steel reservoirs constructed to AWWA specifications provide zero
leakage tolerance and can be fabricated in virtually any size or with any dimensions, in
accordance with the AWWA D100 code basic design. Manual, semi-automatic and fully
automated field welding techniques and processes have constantly improved over the years
offering the potential of increased economy and strength.
o Welded steel reservoirs have minimum roof plate thickness of .1875", a minimum shell plate
thickness of .1875", and a minimum floor plate thickness of .2500".
o All the panel joints are welded, fusing the entire structure into one solid piece, thus making
it very sturdy and durable.
o The projected lifetime of a welded steel tank may be as much as 100 years depending on
operating conditions and normal maintenance.
o Welded steel tanks can be repainted and coating work can be done on-site for easy
inspection. NSF approved lining is provided in accordance with local potable water
standards and MOECC regulations.
o Decorative features are readily available, such as knuckles, pilasters, dome or umbrella
roofs, and special colours, lighting and signage.
In more recent years with the development of improved steel fabrication technologies, field-erected Epoxy
and Glass-Fused-to-Steel Bolted Reservoirs, which use laser or die-cut steel panels that are bolted into
place onsite, offer the strength of welded steel, high corrosion resistance and are comparatively easy to
maintain or repair.
In recent years, the majority of new glass-fused-to-steel bolted tank installations have been supplied by
Greatario Engineered Storage Systems, an authorized, independent dealer for CST Storage (Aquastore®)
and H2Flow Tanks and Systems Inc., a local distributor of Permastore® Tanks and Silos. Both manufacturers
have over 26 years of experience supplying, erecting and servicing glass-fused-to-steel tanks in the
industrial and municipal market place, many in Ontario, for potable water storage. These two manufacturers
directly service the Ontario market such that a competitive bid can be obtained.
In addition, similar improvements in precast concrete reservoir design technologies and construction
techniques offer the advantages of high-strength, abrasion and corrosion resistance concrete structures
utilizing field fabricated precast panels. Construction requires that following placement of the precast panels
and seals, the reservoir wall is circumferentially prestressed with continuous high strength steel wire.
Circumferential prestressing places the reservoir wall in permanent compression resulting in a high strength
and durable cylindrical structure. A high-pH shotcrete is applied over the exterior prestressing, which
passivates the steel, providing permanent bond and corrosion protection. DN Tanks, a firm with extensive

12 | P a g e
experience in the design and construction of AWWA D110 Type III reservoirs, have been consulted. DN
Tanks has built over 3,000 tanks over the past 80 years around the world including the 5 ML precast and
prestressed concrete tank located at the Glenway Reservoir facility in Town of Newmarket. Members of the
Project Team toured this facility September 28, 2016. These types of tanks offer the following benefits:
• The concrete interior of an AWWA D110 tank can eliminate the need for protective coatings which
may reduce downtime associated with periodic coating maintenance.
• Added flexibility in terms of the site development, e.g., they can be constructed at-grade, partially
buried, or fully buried.
• Architectural elements including painted logos, brick veneers, EIFS systems, or other aesthetic
enhancements can be included to compliment nearby buildings and structures.
• Be designed with insulation and heating systems to suit local climate, reducing concerns with
respect to freezing.
• Can accommodate mixing systems.
• The tank is constructed so that the floor and walls are structurally independent, which means that
the wall is permitted to expand and contract without placing excessive bending stressed on the wall
or floor.
• The tank walls are placed into compression by circumferential prestressing. Every prestress wire is
fully encased in shotcrete to provide long term corrosion protection. This ensures the tank walls will
remain in permanent compression, eliminating shrinkage cracks, stress cracks, seepage, and
deterioration.
• Speed of construction to reduce the overall schedule – The method of on-site precasting operation
permits simultaneous construction of the tank walls and floor; resulting in a fast and efficient tank
construction process.
Both glass-fused to steel and precast/prestressed reservoir structures are considered technically sound
choices for potable water storage especially when carefully manufactured, handled, installed and
maintained. Bolted steel reservoirs offer the quickest construction in the field and are the easiest to enlarge
by addition of new bolted panel sections.
Cast-in-Place Concrete In-Ground Reservoir
Cast-in-place concrete reservoir construction is a common approach to reservoir design and has been
employed by the City on previous builds including the Harvie and Sunnidale reservoirs. Design of reinforced
concrete reservoir structures must be carried out in accordance with the requirements of ACI 350R-89 –
Environmental Engineering Concrete Structures and CAN/CSA A23.3 Design of Concrete Structures, and
practical design considerations. The following are the applicable guidelines and standards that would be
used for design of this reservoir technology:
• American Concrete Institute (ACI 350R)
• AWWA Standards
• CSA A23.1, A23.2, A23.3 and A23.4
• Ministry of Environment and Climate Change (MOECC)
• Various codes; Building, Fire and Electrical, NFPA
In-ground or partially in-ground water storage offers the advantage of minimizing temperature loss, reduced
exposure to exterior weather freeze-thaw cycles, potentially more secure access and have footprint and

13 | P a g e
layout that offers space for alternative recreational activities. The following offers a summary of cast-in-place
concrete in-ground reservoir key features:
• No size or configuration restrictions; very flexible design alternatives;
• Cast-in-place concrete requires special design requirements and construction techniques to ensure
a high-performance and watertight containment structure;
• Suitable for site specific terrain, climate and site conditions
• In-ground installation allows for inconspicuous structures with engineered environmental and
landscape features that blend well with the nearby natural environs
• Ease of accessibility to the roof structure by at grade access for valves, gates, instrumentation and
other equipment.
The primary disadvantage to this approach is potential for undetected infiltration or exfiltration and differential
settlement due to the nature and stability of underlying soil and impact on structural cracking and leakage.
Based on our experience in other reservoir assessment and rehabilitation projects, the two main areas of
water loss from these types of reservoirs are from cracks (shrinkage and stress induced) and at expansion
joints. Therefore, the following are some suggested key design features for future consideration:
• Refinement of the Volume of Cement for the Concrete Mix
• Use of ‘slip sheet’ between the base slab and the soil
• Temperature Control during Concrete Curing
• Crack Control Design as per ACI 350R
• Refinement of Expansion Joints
Reservoirs will typically have large footprint with larger surface areas to be maintained and theoretically
higher potential for cracking and leakage than cylindrical reservoirs. Compartmentalization allows taking
various portions of the reservoir offline for maintenance, but requires more complex piping, valves and
controls. Measures to ensure dead zones are minimized and a consistent water age and quality is
maintained in the storage reservoir need to be developed and integrated into the design. Staging
construction for future expansion is considered more complex compared to the at-grade reservoir options.
Cylindrical At-Grade Water Storage Reservoirs
Cylindrical at-grade water storage reservoirs can be constructed employing a variety of techniques and
materials, configured in single or multi-tank arrangements and be designed to operate in our frigid winter
climate. The primary advantage of a cylindrical tank design is ability to store water over greater depth thereby
greatly reducing footprint, site requirements and related costs. The most economical structures are also
mostly above ground surface helping to reduce structural costs and providing ready access for routine
inspection.
There are generally no operating restrictions imposed, nor requirements for minimum turnover to prevent
ice damage notwithstanding active reservoir mixing helps to increase water turnover for improved water
quality maintenance. However, reduced turnover combined with inadequate mixing and extended low
temperature conditions can result in formation of an ice lens, which can become lodged against the reservoir
wall. When this occurs, combined with sudden higher flows such as a fire event and/or a water main failure,
the structure is at risk for extreme forces caused by eccentric loading due to failure of the ice lens. Therefore,
in designing at-grade cylindrical tanks for the City of Barrie, it will be necessary to evaluate the potential for

14 | P a g e
formation of an ice lens and designs for the resulting forces acting on the structure taking into consideration
potential effects of ice abrasion acting on the reservoir wall.
The following sections provide added details on the water storage reservoir technologies reviewed as part
of this TM.
2.4.2.1 Glass-Fused-to-Steel At-Grade Cylindrical Tank Reservoir
Factory coated bolted steel tanks and reservoirs were adapted in the late 1970’s for potable water storage
primarily through the release of Standard AWWA D103 which allows the use of lighter-gauge steel in the
production of tank sheets:
• Normally sold in standard sizes and dimensions employing uniform panel sizes which are readily
transported to and assemble at site.
• Capacity ranges up to approximately 23 ML.
• Shell stress can range up to 21,600 PSI with A36 steel in the AWWA D103 design code.
• Bolted steel reservoirs have a minimum roof plate thickness of .0700" (2 mm), a minimum shell plate
thickness of .0940" (2.5 mm), and a minimum floor plate thickness of .0940" (2.5 mm). In all cases,
thinner than the same requirements for welded steel tank structures
• Factory fused silica glass coating on interior and exterior of steel sections
• Coatings used to protect against weather and corrosion and create a glass shell
• Water-resistant interior and a graffiti-resistant exterior
• Steel sections and joints are lapped and bolted, with gasket material in between, bolted on site,
assembled from the top down with a jacking system that progressively elevates the structure. This
approach permits future addition of extra panels and rings to increase individual tank capacity
• Projected service life of factory coated bolted steel reservoirs to be 45-50 or greater with proper
preventative maintenance, controlled operating conditions and ongoing maintenance of cathodic
protection. As regular inspections indicate, it may be more practical to replace the bolted reservoir
assembly rather than recoat or repair leaks.
• Coatings must be done at remote factory and be NSF certified where required.
• Decorative features are usually not available. The numerous bolted joints discourage painting signs.
Reservoir colour may be limited to a standard manufacturer’s colour.
• Suitable for the local terrain, climate and site conditions
• Tank construction requires specialized construction teams
For example, the factory-applied glass-fused-to-steel coating forms a hard, inert barrier for both the interior
and exterior of surfaces of the tank. It protects the steel core against weather and corrosion. The fusion
process produces a barrier coating on the sheet edges, so that the entire steel panel is encapsulated in a
glass shell. The glass coating provides a water-resistant interior and a graffiti-resistant exterior, ideally suited
to municipal potable water storage applications.
Tank sheets are shipped on protective skids with crated hardware and accessories. At the jobsite, tanks are
installed using specialized equipment.
When choosing a Glass-Fused-to-Steel Storage Reservoir, it is important to take into consideration design
and manufacturing factors which may impact the operating life and associated life cycle costs of the
structure. For example coating thickness impacts the base metal’s mechanical properties, impacting the
15 | P a g e
hardness, flexibility, brittleness and chip resistance of each individual tank panel. Proper coating thickness
application is key to elasticity and longevity of the coating.
The use of proprietary high quality A36 carbon steel specifically manufactured for the fusion process should
also be taken into consideration. Sheet edges also should be properly coated with the same material in
order to avoid electrolysis of dissimilar metals, rust, wakening of the fusion bonding and allowing oxidation
by-products to leak through.
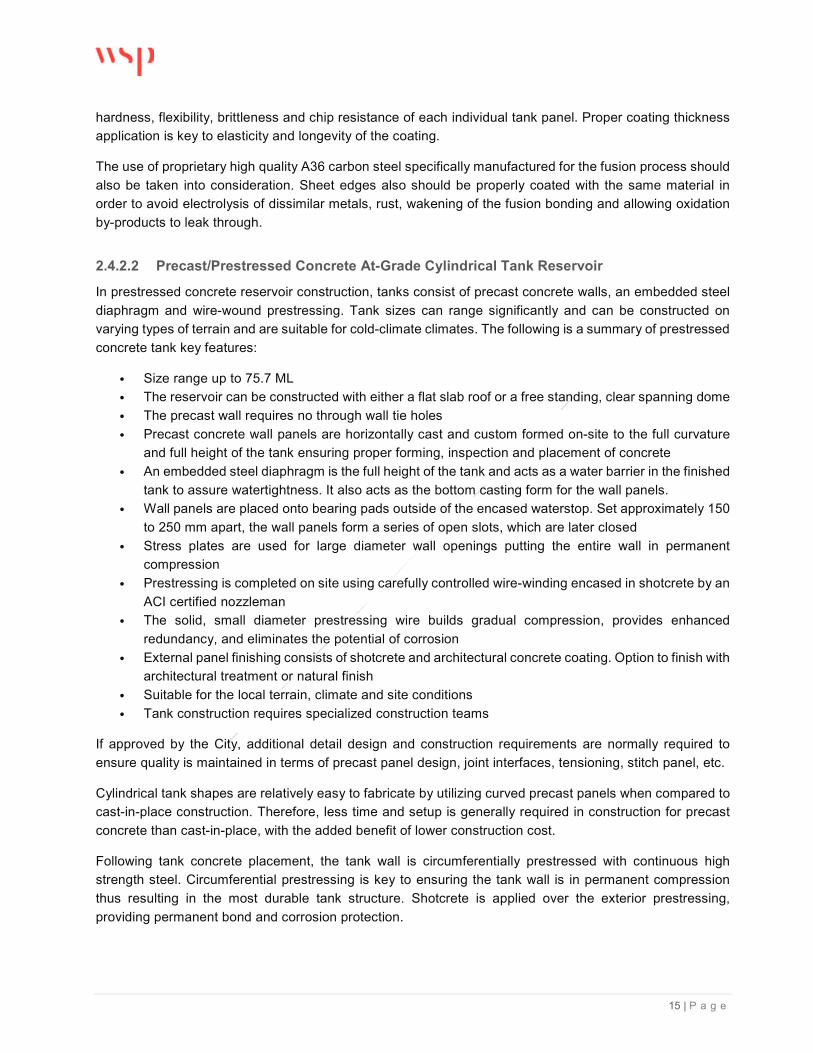
2.4.2.2 Precast/Prestressed Concrete At-Grade Cylindrical Tank Reservoir
In prestressed concrete reservoir construction, tanks consist of precast concrete walls, an embedded steel
diaphragm and wire-wound prestressing. Tank sizes can range significantly and can be constructed on
varying types of terrain and are suitable for cold-climate climates. The following is a summary of prestressed
concrete tank key features:
• Size range up to 75.7 ML
• The reservoir can be constructed with either a flat slab roof or a free standing, clear spanning dome
• The precast wall requires no through wall tie holes
• Precast concrete wall panels are horizontally cast and custom formed on-site to the full curvature
and full height of the tank ensuring proper forming, inspection and placement of concrete
• An embedded steel diaphragm is the full height of the tank and acts as a water barrier in the finished
tank to assure watertightness. It also acts as the bottom casting form for the wall panels.
• Wall panels are placed onto bearing pads outside of the encased waterstop. Set approximately 150
to 250 mm apart, the wall panels form a series of open slots, which are later closed
• Stress plates are used for large diameter wall openings putting the entire wall in permanent
compression
• Prestressing is completed on site using carefully controlled wire-winding encased in shotcrete by an
ACI certified nozzleman
• The solid, small diameter prestressing wire builds gradual compression, provides enhanced
redundancy, and eliminates the potential of corrosion
• External panel finishing consists of shotcrete and architectural concrete coating. Option to finish with
architectural treatment or natural finish
• Suitable for the local terrain, climate and site conditions
• Tank construction requires specialized construction teams
If approved by the City, additional detail design and construction requirements are normally required to
ensure quality is maintained in terms of precast panel design, joint interfaces, tensioning, stitch panel, etc.
Cylindrical tank shapes are relatively easy to fabricate by utilizing curved precast panels when compared to
cast-in-place construction. Therefore, less time and setup is generally required in construction for precast
concrete than cast-in-place, with the added benefit of lower construction cost.
Following tank concrete placement, the tank wall is circumferentially prestressed with continuous high
strength steel. Circumferential prestressing is key to ensuring the tank wall is in permanent compression
thus resulting in the most durable tank structure. Shotcrete is applied over the exterior prestressing,
providing permanent bond and corrosion protection.

16 | P a g e
From a concrete durability approach, the use of high-strength air entrained concrete with specific quality
control measures is generally recommended and would be consistent with appropriate design
methodologies for concrete based water holding structures including the requirements of AWWA D110 Type
III standard for horizontal prestressed concrete water storage tanks and ACI 372R. Concrete should be
plastic wrapped and water cured for 7 days.
There are a large number of established design-build firms including DN Tanks who have designed and
constructed various precast configurations and will work directly with the various equipment suppliers
(mixing systems, piping, etc.) and the City to optimize their design.

17 | P a g e
3.0 TECHNOLOGY OPTIONS & SITE LOCATIONS
Salem Road Reservoir and Pumping Station Design Features
The approximate conceptual design features of the proposed 20 ML Salem Road / 20 ML Reservoir are
summarized as follows:
• Grade Elevation (existing topography): +/- 298 – 307m (Site 1) | +/- 300 – 310m (Site 2) – as
previously noted, Site 3 is excluded from further analysis.
• Minimum Reservoir Operating Level in Pressure Zone 2S – 302.0 m.
• Maximum Reservoir Operating Level in Pressure Zone 2S – 308.0 m.
• Maximum Pumped Hydraulic Grade Line in Pressure Zone 3S - 350.15 m.
• Footprint: (approx.) 90m x 65m (in-ground) | 46m diameter x 2 tanks (cylindrical at-grade) +
pumphouse / valve chamber.
• Duo cell with baffle walls and/or other mixing provisions | dual cylindrical reservoir with active mixing
system.
• Combined valve chamber and pumping station | Separate valve chamber & pumphouse building
• 4 duty, 1 standby pumping system each preliminarily sized at 135 L/s. Final pump sizing is to be
completed at the detailed design stage in combination with verification of the City’s water model.
• Firm pumping capacity of 403 L/s.
• 600mm diameter bi-directional watermain connection from Salem Rd
• Overflow and drains diverted to de-chlorination chamber and stormwater management/overflow
pond on redeveloped property
• 1.8m chain-link fence around perimeter of site
The design of the reservoir, pumping station, watermains and associated infrastructure will comply with City
of Barrie Standards, Canadian Standards Association (CSA), American Water Works Association (AWWA)
standards and MOECC Design Guidelines for Drinking Water Systems
An optimization study can be done at the detailed design stage to determine an operating approach that
minimizes operating costs throughout the lifetime of the reservoir and pumping station as demand in the City
increases.
With exception of site specific access road requirements, specific elevations and overall site plan and layout,
the general arrangement of the in-ground cast-in-place reservoir and pumping station will be similar on either
Site 1 or Site 2. In the case of the at-grade cylindrical reservoir designs, the general arrangement for either
the glass-fused-to-steel bolted steel reservoir or the precast/prestressed reservoir are assumed to be
identical. Refer to the following sections for additional details.
Option 1A – In-Ground Reservoir & Pumping Station – Site 1: North Side Salem Road
A proposed conceptual general arrangement is shown on Drawing Figure 3-1, as well as on Drawings Fig-
2 and Fig-3 in Appendix A. The in-ground structural design is consistent with the existing Sunnidale Park
reservoir with a nominal water storage capacity of 2 x 10 ML (20 ML). The site development shows the
approximate location of the reservoir structure assuming an approximate balanced cut and fill on this site.

18 | P a g e
Based on this location, it is recommended the pumphouse building be located on the west side of the
reservoir structure due to proximity of Salem Rd and the provision of a mildly sloping access road (less than
2%), as shown in Figure 3-1. In this way, it is also possible to maintain a minimum buffer of over 33m from
reservoir to the nearest property line bordering the location of the adjacent Cinema.
Overall, pending suitable soil conditions, this site provides a suitable location for the staged construction of
an in-ground cast-in-place reinforced concrete reservoir and pumping station. Refer to Figure 3-1.
Figure 3-1 Salem Reservoir and Pumping Station – Site 1, In-Ground Reservoir Option
Option 1B – In-Ground Reservoir and Pumping Station – Site 2: South Side Salem Road
The general arrangement is presented at a conceptual level on the aerial site plan presented in Figure 2-1
and on Drawing Fig-1 in Appendix A. The in-ground structural design is identical to Option 1A with a nominal
water storage capacity of 2 x 10 ML (20 ML). The site development shows the approximate location of the
reservoir structure based on an approximate balanced cut and fill of the selected site. Based on this location,
it is recommended the pumphouse building be located on the east side of the reservoir structure. This allows
a mildly sloping access road. Through this conceptual plan, a 30m buffer is maintained around all sides of
the reservoir and pumping station, which is important given future anticipated neighbourhood mixed use
development, along with the planned Salem Road expansion project.
Pending suitable soils conditions, this site provides a suitable location for the staged construction of an in-
ground cast-in-place reinforced concrete reservoir and pumping station although related construction costs
are expected to be higher at Site 2 compared to Site 1 due primarily to existing site conditions.

19 | P a g e
Options 2A & 3A – At-Grade Reservoir and Pumping Station – Site 1: North Side Salem Road
The proposed general arrangement of an at-grade cylindrical reservoir (either as a glass-fused-to-steel or
precast/prestressed configuration) and pumping station design is shown in Figures 3-2 and 3-3, as well as
on Drawings Fig.-1, Fig.-4 and Fig.-5 in Appendix A. The reservoir design and layout is based on each tank
having a nominal diameter of 46m, side water depth (SWD) of 6m and overall effective reservoir depth of
6.5-7m. A separate structure housing a combination valve chamber and pumping station interconnected to
the storage reservoirs would also be provided.
Figure 3-2 Salem Reservoir and Pumping Station – Site 1, At-Grade Reservoir Option Plan
20 | P a g e
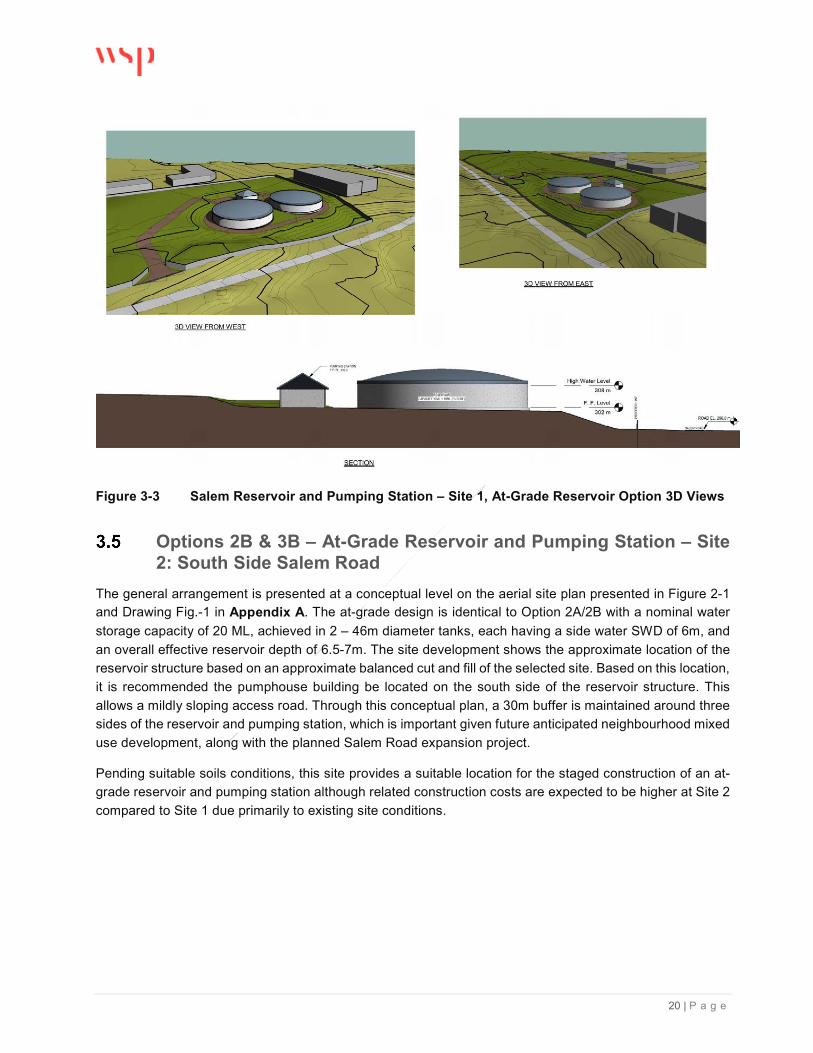
Figure 3-3 Salem Reservoir and Pumping Station – Site 1, At-Grade Reservoir Option 3D Views
Options 2B & 3B – At-Grade Reservoir and Pumping Station – Site 2: South Side Salem Road
The general arrangement is presented at a conceptual level on the aerial site plan presented in Figure 2-1
and Drawing Fig.-1 in Appendix A. The at-grade design is identical to Option 2A/2B with a nominal water
storage capacity of 20 ML, achieved in 2 – 46m diameter tanks, each having a side water SWD of 6m, and
an overall effective reservoir depth of 6.5-7m. The site development shows the approximate location of the
reservoir structure based on an approximate balanced cut and fill of the selected site. Based on this location,
it is recommended the pumphouse building be located on the south side of the reservoir structure. This
allows a mildly sloping access road. Through this conceptual plan, a 30m buffer is maintained around three
sides of the reservoir and pumping station, which is important given future anticipated neighbourhood mixed
use development, along with the planned Salem Road expansion project.
Pending suitable soils conditions, this site provides a suitable location for the staged construction of an at-
grade reservoir and pumping station although related construction costs are expected to be higher at Site 2
compared to Site 1 due primarily to existing site conditions.
21 | P a g e
4.0 COST ANALYSIS
Approach
In order to make a thorough comparison of the proposed technologies, a review and sensitivity analysis of
capital, operating and maintenance costs over a projected 50 year period was carried out. The future costs
are analysed on a yearly basis with estimated current-day construction and maintenance costs and
converted into present values. To further derive fully developed costs, financial assumptions were made as
follows:
• 5% Discount factor
• 3% inflation factor
• $1.00 cost of diesel fuel/litre
• $0.20/kWh cost of electricity
It may be prudent to consider raising the inflation factor, but even an increase of up to 5-8% would not affect
the ranking of cost of the options reviewed as part of this report.
Refer to Appendix B for the detailed cost analysis tables and worksheets adapted for this analysis.
Estimated Capital Costs
The conceptual design drawings presented in Appendix A, along with supplemental process definition
drawings linked to WSP BIM database, were used as a basis for generating construction unit values based
on a Division 1-16 approach. Assumed typical present-day construction costs were in some cases allocated
as unit rates to determine final capital cost estimates. General assumptions applied as part of the analysis
include:
• Reservoir sized at 20MLD, not phased (e.g., by not deferring work to the future even though
only half of ultimate storage may be initially constructed)
• Pumping station configuration is assumed generally consistent for all three reservoir technology
concepts
• Reservoir locations optimized and designed to minimize earthworks cut/fill
• Property acquisition costs are not included as part of this analysis
Maintenance/Refurbishment Costs
Reservoir and pumping station components from each Division 1-16 were further allocated maintenance
and refurbishment costs, as applicable, on a yearly basis. This generally covers inspections, cleaning,
painting and repairs to maintain serviceability. The specific assumptions made are stated in the Life Cycle
Cost Estimate spreadsheet presented in Appendix B. Major maintenance/refurbishment costs identified are
as follows:
• CCTV inspection/ cleaning cost of sewerage/watermain/storm lines
• Landscaping, site maintenance, building repair costs and general upkeep
• Major equipment maintenance costs and instrument calibration
• Equipment and instrumentation end of life replacement costs
The project service life of the cast-in-place in-ground and precast/prestressed reservoirs are expected to
exceed 50 years with appropriate preventative maintenance. The project service life of the glass-fused-to-

22 | P a g e
steel bolted tanks is projected to be 40-50 years and under this analysis the tank, dome and internals are
projected to be replaced in year 45 of this analysis.
Labour costs associated with inspection, operating and maintaining the various water storage reservoir
options reviewed in this TM are assumed to be equivalent would likely be subject to change following
evolving regulatory requirements and City mandated policies and therefore were not carried as part of this
analysis.
Like water quality monitoring, planned reservoir inspections provide information used to identify and evaluate
current and potential water quality problems that may be related to maintenance. Both interior and exterior
inspections are employed to assure the tank’s physical integrity, security, and high water quality. Inspection
type and frequency are driven by many factors specific to each storage facility, including its type (e.g.,
standpipe, reservoir, etc), vandalism potential, age, condition, cleaning program or maintenance history,
water quality history, funding, staffing, and other utility criteria. AWWA Manual M42, Steel Water Storage
Tanks provides information regarding inspection during tank construction and periodic operator inspection
of existing steel tanks.
Specific guidance on the inspection of concrete tanks was not found in the literature. However, the former
AWWA Standard D101 document may be used as a guide to inspect all appurtenances on concrete tanks.
Concrete condition assessments should be performed with guidance from the tank manufacturer.
Routine inspections typically monitor the exterior of the storage facility and grounds for evidence of intrusion,
vandalism, coating failures, security, and operational readiness. Based on a review of reference information,
routine inspections should be conducted on a daily to weekly basis. In jurisdictions where SCADA systems
include electronic surveillance systems are employed, alarm conditions may substitute for daily physical
inspection.
Periodic inspections are designed to review areas of the storage facility not normally accessible from the
ground and hence not evaluated by routine inspections. Based on a literature review and reviewed
references, periodic inspections are typically conducted every 1 to 4 months.
Finally, comprehensive inspections are performed to evaluate the current condition of storage facility
components and will usually require the reservoir be removed from service and drained unless robotic
devices or divers are used. AWWA Manual M42 recommends that tanks be drained and inspected at least
once every 3 years or as otherwise required. Best Industry practices suggest that comprehensive
inspections be conducted every 3 to 5 years for structural condition and possibly more often for water quality
purposes.
Based on utility surveys and industry best practises, it appears that most water utilities that have regular
reservoir cleaning programs employ a cleaning interval of 2 to 5 years and that most tanks are painted
(exterior coating) on an interval of 10 to 15 years.
Estimated Energy Cost
Reservoir and pumping station components from each Division 1-16 were further allocated energy cost, as
applicable, on a yearly basis. The specific assumptions made are identified in the Life Cycle Cost estimate
spreadsheet in Appendix B. Major energy cost items identified were pumps, the diesel engine generator

23 | P a g e
set and ventilation infrastructure. In determining future energy requirements for the pumps, the following
assumptions were made:
• 20MLD Reservoir, with average daily flow capacity of 31.5MLD
• 3 duty, 45KW pumps – estimated average rate of power consumption at +/- 93 kW
• Required annual power rate adjusted to accommodate phased flow (25% of energy required years
1-5, 50% of energy required years 6-10, 75% of energy required years 11-15, 100% of energy
required years 16-50), with a projected 10% additional pumping premium for the at-grade reservoirs
due to the taller tank height
In determining future energy requirements for the generator, the following assumptions were made:
• 250 kW diesel generator size.
• 6 hour / month estimated operational hours.
• 68 L/hr fuel consumption.
In determining future energy requirements for the ventilation infrastructure, the following assumptions were
made:
• Heating load of 20 kW, operating at 6 months / year.
• Ventilation load of 12-15 kW, operating at 9 months /year.
It is noted that in addition to the above, the at-grade circular tanks require some form of active and/or passive
mixing and therefore it is necessary to account for any related energy requirement. Mixing processes within
a water storage reservoir should be carefully designed and controlled to minimize water age and promote
complete mixing. A well-mixed tank achieves more uniform water quality, temperature and age and is easier
to manage. When mixing does not occur throughout the storage facility, stagnant zones can form where
water age will exceed the overall average water age in the facility. Therefore, mixed flow is preferable to
plug flow in distribution system storage.
Mixing can be encouraged through the development of a turbulent jet. Mixing a fluid requires a source of
energy input, and in a storage facility, this energy is normally introduced from the facility’s inflow.
Temperature differences between the inflow and the ambient water temperature within the storage facility
can also cause the water to form stratified layers that do not mix together. Stratification is more common in
tall tanks such as standpipes and tanks with large diameter inlets. It can be avoided by increasing the inflow
rate.
Local power rates are based largely when electricity is used, and therefore it may be cost-effective to control
pumping in an effort to reduce the maximum power demand. In effect, the part-time use of more or larger
pumps and higher efficient motors may be more cost-effective than using constant-rate pumping over the
typical operating day. In other words, to get the best electric power rates, pumping (or power-demand load)
must be reduced during the periods when the maximum electrical demand occurs. A simple way to reduce
rates is to pump more water into storage during off-peak hours when electrical power demand and unit costs
are lowest and to reduce pumping during periods when both demand and power costs are highest. The
tradeoff is this technique generally requires marginally increased storage capacity.

24 | P a g e
Summary of Cost Analysis
The results of this analysis, expressed in Canadian dollars (CAD), are summarized in the following Tables.
Table 4-1 Comparison Estimated Construction Cost – Reservoir and Pumping Station Options
Table 4-2 Comparison Estimated Life Cycle Costs – Reservoir and Pumping Station Options
ITEM DESCRIPTION
Option 1A:
CIP Concrete In-
ground Reservoir
& PS
-
Site 1
North Side Salem
Road
Option 1B:
CIP Concrete In-
ground Reservoir
& PS
-
Site 2
South Side
Salem Road
Option 2A:
Glass Fused to
Steel At-Grade
Reservoir & PS
-
Site 1
North Side Salem
Road
Option 2B:
Glass Fused to
Steel At-Grade
Reservoir & PS
-
Site 2
South Side
Salem Rd
Option 3.A:
Precast,
prestressed
Concrete At-
Grade Reservoir
& PS
-
Site 1
North Side Salem
Rd
Option 3. B:
Precast,
prestressed
Concrete At-
Grade Reservoir
& PS
-
Site 2
South Side
Salem Rd
A.
SUBTOTAL - Div 1-16 $25,967,000 $28,066,000 $17,687,000 $18,145,000 $20,850,000 $21,175,000
B.
ALLOWANCE @ 20% $5,193,400 $5,613,200 $3,537,400 $3,629,000 $4,170,000 $4,235,000
C. $31,160,400 $33,679,200 $21,224,400 $21,774,000 $25,020,000 $25,410,000
ALL COSTS LESS HST
ESTIMATED TOTAL
CONSTRUCTION COSTS
ESTIMATED
CONTINGENCY COSTS
ESTIMATED
CONSTRUCTION COSTS
TECHNOLOGY DESCRIPTION
COMPARISON OF ESTIMATED CONSTRUCTION COSTS
SALEM ROAD RESERVOIR AND PUMPING STATION CONCEPTUAL DESIGN - TECHNOLOGY ASSESSMENT
ITEM DESCRIPTION
Option 1A:
CIP Concrete
In-ground
Reservoir & PS
-
Site 1
North Side
Salem Rd
Option 1B:
CIP Concrete
In-ground
Reservoir & PS
-
Site 2:
South Side
Salem Rd
Option 2A:
Glass Fused
Steel At-Grade
Reservoir & PS
-
Site 1
North Side
Salem Rd
Option 2B:
Glass Fused
Steel At-Grade
Reservoir & PS
-
Site 2
South Side
Salem Rd
Option 3A:
Precast
prestressed At-
Grade
Reservoir & PS
-
Site 1
North Side
Salem Rd
Option 3B:
Precast
prestressed At-
Grade
Reservoir & PS
-
Site 2
South Side
Salem Rd
A.
ESTIMATED 50 YR
OPERATIONS &
MAINTENANCE
COSTS - PRESENT
VALUE
$5,460,000 $5,460,000 $8,644,000 $8,644,000 $6,334,000 $6,334,000
B.
ESTIMATED
CONSTRUCTION
COSTS - PRESENT
VALUE
$31,161,400 $33,679,200 $21,224,400 $21,774,000 $25,020,000 $25,410,000
C.ESTIMATED LIFE
CYCLE COSTS$36,621,400 $39,139,200 $29,868,400 $30,418,000 $31,354,000 $31,744,000
ALL COSTS LESS HST
TECHNOLOGY DESCRIPTION
COMPARISON OF ESTIMATED LIFE CYCLE COSTS
SALEM ROAD RESERVOIR & PUMPING STATION CONCEPTUAL DESIGN - TECHNOLOGY ASSESSMENT

25 | P a g e
The cost analysis indicates the At-Grade Reservoir and Pumping Station options are significantly less costly
to implement than the In-Ground cast-in-place concrete reservoir options. The analysis also shows that site
development costs on Site 1 are projected to be less than Site 2 assuming soil conditions are comparable.
Overall, Option 2A, the bolted cylindrical glass-fused-to-steel reservoir and pumping station located on Site
1 is the least costly to implement over the projected 50-year life cycle cost basis used for this analysis,
followed by Option 3A. As previously noted, the actual service life of the 20 ML storage reservoir and
pumping station will depend on the noted O&M factors and the level of preventative maintenace provided.
Estimated total construction cost including engineering and contingency of the full build of Option 1B is
estimated to be $33.7M CAD, the highest of the six alternatives evaluated. The higher cost compared to
Option 1A is due largely to projected higher site development costs at Site 2.
Estimated construction cost and 50-year life cycle cost of the full build of Option 2A is estimated to be $21.2M
CAD and $29.9M CAD, respectively, the lowest of the alternatives.
Estimated construction cost and 50-year life cycle cost of the full build of Option 3A is estimated to be $25.0M
CAD and $31.3M CAD, respectively, marginally higher than Option 2A.
Based on our preliminary cost review, Option 2A, at-grade glass-fused-to-steel bolted steel reservoir
structure located on Site 1 north of Salem Road, west of Hwy 400 is projected to be the least costly to
construct, operate and maintain. However, when compared to Option 1A, in-ground cast-in-place reinforced
concrete reservoir structure, the cylindrical at-grade reservoirs will be highly visible and therefore strategies
to mitigate and enhance the visual aesthetics should be developed

26 | P a g e
5.0 EVALUATION PROCESS
Technology Evaluation
In order to complete a thorough and defendable evaluation of the technology options for the Salem Road reservoir and pumping station options reviewed in this Technical Memorandum, an evaluation matrix to score the relative attributes of the proposed infrastructure assets was developed. The primary evaluation criteria specific to the different reservoir technologies is organized according to Construction, Financial and Technical attributes with each having the following considerations:
• Construction related evaluation criteria has been assigned a 20/100 (20%) relative importance weighting.This criteria takes into consideration the complexity of design and construction, the ease at which the facility can be expanded beyond 20 ML and the time and relative effort to complete the design, tendering and construction process. Each of the above noted criteria is assigned a relative weighting and then for each technology option ranked 1-3, with 1 being the best and 3 being the worse. When tota
• Financial related evaluation criteria has been assigned a 30/100 (30%) relative importance
weighting. This criteria takes into consideration projected costs associated with Engineering, Construction, Contingencies, Operations and Maintenance Costs and overall Life Cycle Costs as detailed in the previous section of the Technical Memorandum. Each of the above noted criteria is assigned a relative weighting and then for each technology option ranked 1-3 as above.
• Technical related evaluation criteria is considered the most important and has been assigned a
50/100 (50%) relative importance weighting. Technical criteria takes into consideration Occupational Health and Safety factors impacting operations and maintenance staff, Water System Security, Ease of Maintenance, potential for Temperature, Ice and Freeze issues, possibility of Leakage Failure, the relative Complexity of Repairs and Water Quality. As above, each of the noted criteria is assigned a relative weighting and then each technology option ranked 1-3.
The Technology Evaluation matrix with a summary of the scoring and Reservoir Technology weightings and rankings is given in the following Table 5-1 and in Appendix C. Based on the above weighting and ranking methodology, the lowest overall score is considered the optimal (best) Reservoir Technology. Overall, Options 3.A/3.B, precast/prestressed Concrete At-Grade Reservoir & Pumping Station has the lowest score and therefore highest ranking of the technology options reviewed in this Technical Memorandum.
Environmental Impact Evaluation
To complement the Technology Evaluation, a separate tabulation of Environmental Impact criteria and qualitative evaluations and scoring is tabulated and presented in Appendix C. The table itemizes Natural Environment and Socio-Cultural Environment criteria organized by Technology Option and by Site. For the selected Technology Options and Sites 1 and 2, the general conclusion is the CIP in-ground reservoir and pumping station on Site 1 is ranked as having the least environmental impact, whereas both at-grade cylindrical reservoirs on Site 2 are ranked as having the greatest environmental impacts. In all cases, it would be necessary to mitigate and manage the noted environmental impacts through the implementation phase of the project.

27 | P a g e
Table 5-1 Technology Evaluation Matrix

28 | P a g e
6.0 RECOMMENDATIONS
This Technical Memorandum has reviewed the feasibility of implementing three different reservoir
technologies on three separate sites. Summaries of the cost analyses and evaluation matrices are tabulated
in Appendix B and Appendix C, respectively. Some relevant points to highlight:
• All water storage reservoir technologies reviewed in the preparation of this document are equally
suitable for implementation by the City taking into consideration the technology specific design and
construction requirements as well as site specific requirements applicable to either Site 1 or Site 2.
• Site 3 was eliminated from the detailed analysis due to the limited property size and constrained
location.
• The use of an in-ground cast-in-place concrete reservoir is considered a technically viable
alternative at either of the two viable locations although Site 1 is recommended over Site 2. This
acknowledges that both sites can be redeveloped to meet the water system HGL requirements.
However, the topography of both sites have some challenges, drainage will require special attention
and soil conditions are unknown. A geotechnical investigation was not carried out in support of this
analysis.
• The major environmental impact of the reservoir itself is its appearance
o Construction of an in-ground cast-in-place concrete reservoir at either site is considered to
be the least visually disruptive and distractive solution compared to either circular at-grade
reservoir options.
o The visual impact of constructing a highly visible at-grade cylindrical water storage reservoir
can be mitigated by using aesthetically appealing tank designs and exterior coat systems
that either blend the reservoir into the surrounding terrain or promote a theme or other
municipal initiative
• Projected total annual life cycle costs for the two at-grade reservoir options are significantly lower
than the projected costs for the in-ground cast-in-place technology, regardless of which site is
considered.
• Site 1 appears to be more adaptable given the large property size, general condition and topography
of the land and adjacent commercial/industrial development.
• Both sites can be readily linked into the existing water distribution network with no apparent or
significant differences between the two sites.
• There is relatively no difference in the impact on adjacent development during or after construction
when comparing the two evaluated sites.
• Estimated construction costs and present value annualized life cycle cost (LCC) for Option 2A –
Glass-Fused-to-Steel Bolted Steel Reservoir, are projected to be the lowest at $23.6M CAD
On the strength of this analysis and evaluation of related Natural Environment, Socio-Cultural Environment,
Construction, Financial and Technical considerations, site flexibility, mitigatable impacts and highest
Technology Evaluation Score, Option 3A – Precast/Prestressed Concrete Cylindrical Reservoir and
Pumping Station on Site 1, north of Salem Road, west of Highway 400, is recommended.

29 | P a g e
7.0 REFERENCES
In preparation of the conceptual design and recommendations for the Salem Water Reservoir and Pumping
Station, WSP has reviewed the following documents:
• City of Barrie Official Plan, June 2009
• Water Transmission and Distribution Policies and Design Guidelines, City of Barrie, May 25, 2015
• Places to Grown Act, 2005
• Ministry of the Environment Design Guidelines for Drinking Water Systems, 2008
• InfoWater Water, 2013 • Water Storage and Distribution Master Plan, 2013 • Harvie Road Reservoir and Pumping Station Drawings dated March 2008. • Sunnidale Park Reservoir and Pumping Station Drawings dated March 2014.
AWWA Storage Standards applicable to this TM include the following:
• D100-11 Welded Carbon Steel Tanks for Water Storage
• D102-14 Coating Steel Water-Storage Tanks
• D103-09 Factory-Coated Bolted Carbon Steel Tanks for Water Storage
• D103-97 Factory-Coated Bolted Steel Tanks for Water Storage
• D104-11 Automatically Controlled, Impressed-Current Cathodic Protection for the Interior
Submerged Surfaces of Steel Water Storage Tanks
• D106-16 Sacrificial Anode Cathodic Protection Systems for the Interior Submerged Surfaces of
Steel Water Storage Tanks
• D108-10 Aluminum Dome Roofs for Water Storage Facilities
• D110-13 Wire- and Strand-Wound, Circular, Prestressed Concrete Water Tanks
• D115-06 Tendon-Prestressed Concrete Water Tanks

APPENDIX A
DRAWINGS

R
R
R
R
R
R
R
R
R
R
R
R
R
R
R
R
R
R
R
R
R
R
R
T
T
T
T
T
T
T
T
P
P
P
P
P
P
P
P
P
P
P
P
P
P
P
P
P
P
P
P
P
10T
H S
ID
ER
O
AD
10TH LINE
5T
H S
ID
ER
O
AD
10TH LINE
E
S
S
A
R
O
A
D
LOCKHART ROAD
LOCKHART ROAD
HU
RO
NIA
R
OA
D
SAUNDERS ROAD
BA
YV
IE
W
D
RIV
E
SA
UN
DE
RS
R
OA
D
VE
TE
RA
N'S
D
RIV
E
MAPLEVIEW DRIVE EASTMAPLEVIEW DRIVE WEST
E
S
S
A
R
O
A
D
VE
TE
RA
N'S
LN
HARVIE ROAD
BIG BAY POINT ROAD
W
E
L
H
A
M
R
O
A
D
BA
YV
IE
W
D
RIV
E
YO
NG
E S
TR
EE
T
CR
ES
CE
NT
S
T
.
P
A
U
L
'
S
Y
O
N
G
E
S
T
R
E
E
T
ARDAGH ROAD
M
A
P
L
E
T
O
N
TO
W
N LIN
E R
OA
D
C
O
U
N
TY
R
O
A
D
N
o. 27
LITTLE AVENUE
ARDAGH ROAD
TIFFIN STREETTIFFIN STREETCOUNTY ROAD No. 90
LA
K
E
S
H
O
R
E
D
R
IV
E
IN
NIS
FIL S
TR
EE
T
M
IL
L
E
R
D
R
IV
E
M
IL
L
E
R
D
R
IV
E
E
D
G
E
H
IL
L
DRIVE
F
E
R
N
D
A
L
E
D
R
I
V
E
N
O
R
T
H
F
E
R
N
D
A
L
E
D
R
N
O
R
T
H
D
U
N
L
O
P
S
T
R
E
E
T
W
E
S
T
F
E
R
N
D
A
L
E
D
R
IV
E
S
O
U
TH
A
N
N
E
S
T
R
E
E
T
S
O
U
T
H
S
A
N
F
O
R
D
S
T
R
E
E
T
A
N
N
E
S
T
R
E
E
T
N
O
R
T
H
R
O
S
S
S
T
.
C
O
L
L
IE
R
S
T
R
E
E
T
S
U
N
N
I
D
A
L
E
R
O
A
D
L
E
A
C
O
C
K
D
R
C
U
N
D
L
E
S
R
O
A
D
W
E
S
T
S
U
N
N
I
D
A
L
E
R
O
A
D
W
E
L
L
IN
G
T
O
N
S
T
R
E
E
T
W
E
S
T
H
I
G
H
W
A
Y
N
o
.
4
0
0
K
E
M
P
E
N
FELTD
R
IV
E
B
LA
K
E
S
TR
E
E
T
B
L
A
K
E
S
T
R
E
E
T
A
R
R
O
W
R
O
A
D
P
E
N
E
T
A
N
G
U
I
S
H
E
N
E
R
O
A
D
G
E
O
R
G
I
A
N
D
R
I
V
E
G
E
O
R
G
I
A
N
DRIVE
L
I
T
T
L
E
L
A
K
E
D
R
I
V
E
W
E
L
L
IN
G
T
O
N
S
T
R
E
E
T
G
R
O
V
E
S
T
R
E
E
T
E
A
S
T
V
IN
C
E
N
T
S
T
R
E
E
T
D
U
C
K
W
O
R
T
H
S
T
R
E
E
T
S
T
E
E
L
S
T
R
E
E
T
S
T
E
E
L
S
T
R
E
E
T
G
R
O
V
E
S
T
R
E
E
T
E
A
S
T
J
O
H
N
S
O
N
S
T
.
H
IG
H
W
A
Y
N
o
. 4
0
0
H
IG
H
W
A
Y
N
o
. 4
0
0
B
A
Y
F
IE
L
D
S
T
R
E
E
T
P
E
R
E
G
R
IN
E
S
T
L
IV
IN
G
S
T
O
N
E
S
T
. E
A
S
T
L
IV
IN
G
S
T
O
N
E
S
T
R
E
E
T
W
E
S
T
A
V
E
NORTH
PRESSURE ZONES
ZONE 3
SOUTH
ZONE 2
SOUTH
ZONE 3 SOUTH
REDUCED
ZONE 1
CHIEFTAIN
INCREASED
PRESS.
ZONE 3
NORTH
ZONE 2
NORTH
ZONE 2 NORTH
REDUCED
ZONE 3 NORTH
REDUCED
DWG. No.DATE:SCALE:
OCT 2017N.T.S.
CLIENT:
STUDY
AREA
G01
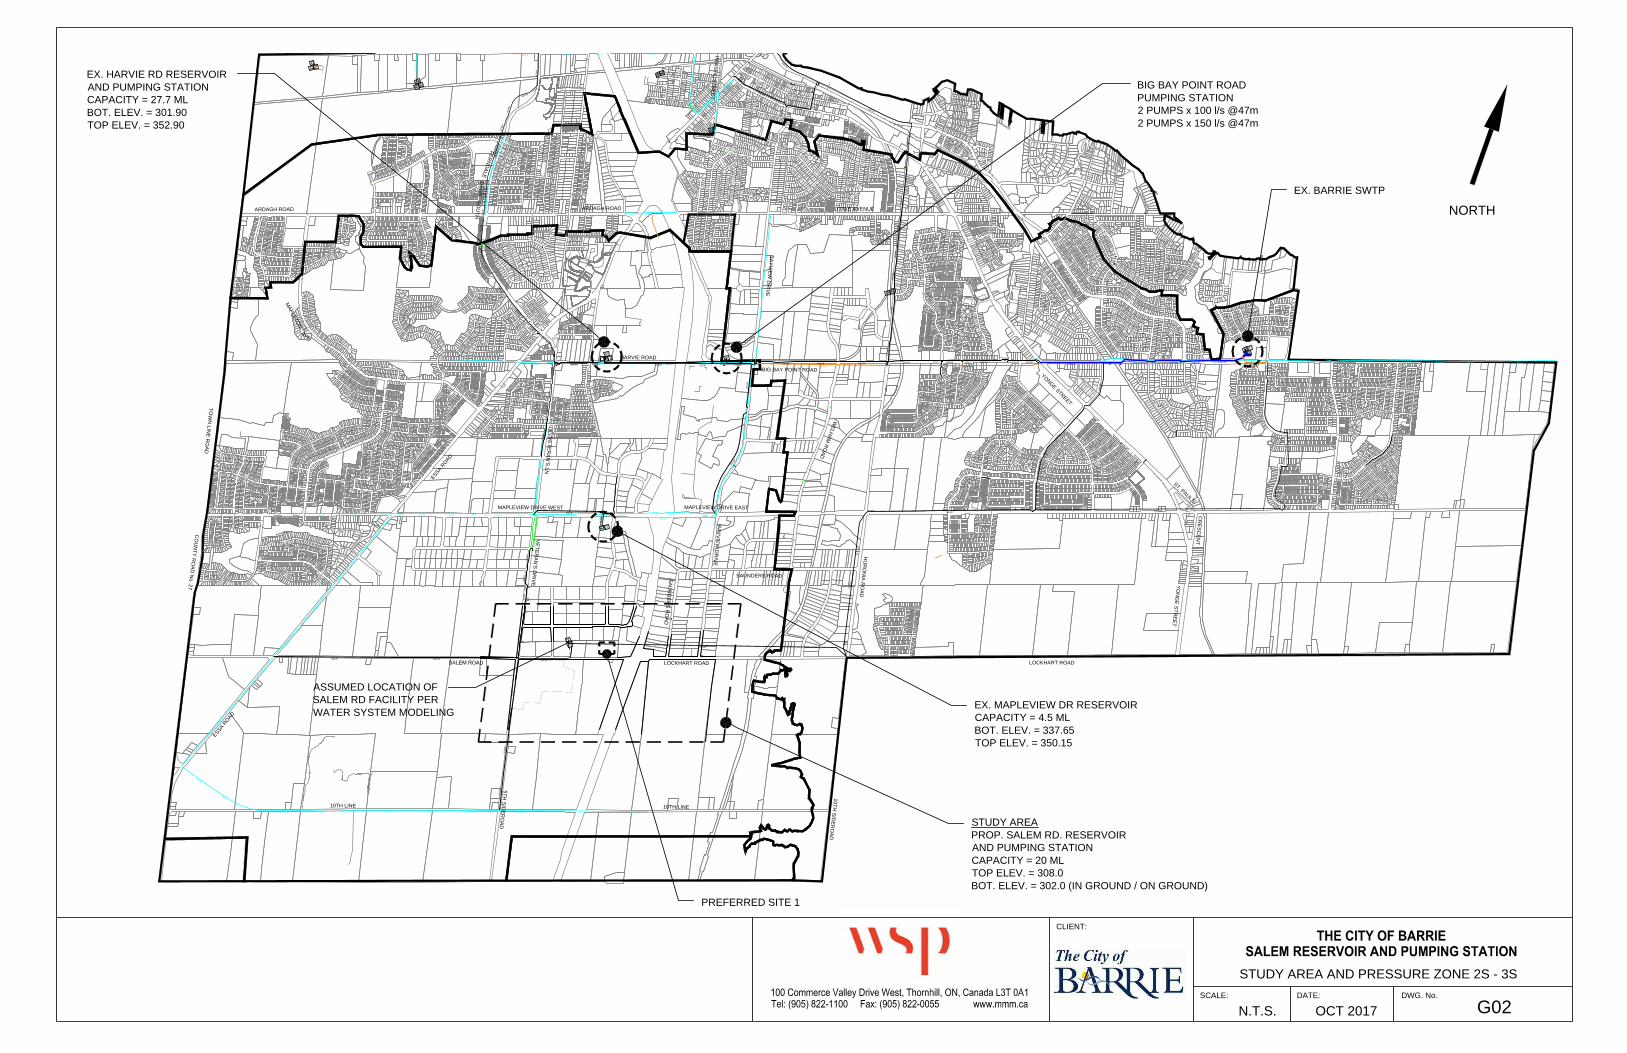
4
0
0
.0
0
400.00400.00
400.00
4
0
0
.
0
0
500.00
400.00
500.00
500.00
400.00400.00
500.00
4
0
0
.
0
0
400.00
400.00
500.00
500.00
500.00
5
0
0
.0
0
600.00
400.00
4
0
0
.0
0
4
0
0
.
0
0
600.00
400.00
600.00
400.00
400.00
400.00
600.00
400.00
400.00
400.00
4
0
0
.0
0
400.00
400.00
4
0
0
.
0
0
6
0
0
.
0
0
4
0
0
.
0
0
4
0
0
.
0
0
400.00
500.00
400.00
400.00
500.00
400.00
400.00
400.00400.00 400.00
400.00 400.00
400.00
5
0
0
.0
0
4
0
0
.0
0
500.00
4
0
0
.0
0
400.00
400.00400.00 400.00 400.00400.00
400.00
500.00
5
0
0
.0
0
400.00
400.00
400.00
400.00
400.00
400.00
400.00
500.00
500.00
500.00
400.00
400.00
500.00
500.00
500.00
500.00
400.00
400.00
500.00500.00
500.00
6
0
0
.
0
0
900.00
600.00
500.00
500.00
400.00
400.00
600.00
500.00
500.00
40
0.0
0
750.00
900.00
900.00
400.00
4
0
0
.
0
0
500.00
600.00
400.00
5
0
0
.0
0
400.00
5
0
0
.
0
0
500.00
5
0
0
.
0
0
4
0
0
.
0
0
750.00
400.00
4
0
0
.
0
0
400.00
400.00400.00
400.00
4
0
0
.
0
0
900.00
500.00
600.00
600.00
6
0
0
.
0
0
6
0
0
.
0
0
6
0
0
.0
0
6
0
0
.0
0
6
0
0
.
0
0
6
0
0
.
0
0
6
0
0
.
0
0
6
0
0
.
0
0
600.00
600.00
6
0
0
.
0
0
6
0
0
.
0
0
6
0
0
.
0
0
6
0
0
.
0
0
6
0
0
.
0
0
6
0
0
.
0
0
750.00
6
0
0
.
0
0
750.00
1200.00
1200.00
1200.00
1200.00
1200.00
600.00
1200.00
1050.00
1
2
0
0
.0
0
400.00
400.00
500.00
400.00
500.00
500.00
4
0
0
.
0
0
4
0
0
.
0
0
400.00400.00
4
0
0
.
0
0
400.00
400.00
400.00
4
0
0
.
0
0
500.00
500.00
400.00
6
0
0
.0
0
750.00
60
0.0
0
600.00
7
5
0
.0
0
7
5
0
.
0
0
600.00
60
0.0
0
600.00
750.00
750.00
500.00
400.00
400.00
400.00
4
0
0
.
0
0
4
0
0
.
0
0
400.00
400.00
400.00
R
R
R
R
R
R
R
R
R
T
T
T
T
P
P
P
P
P
P
P
P
P
10T
H S
ID
ER
O
AD
10TH LINE
5T
H S
ID
ER
OA
D
10TH LINE
E
S
S
A
R
O
A
D
LOCKHART ROAD
LOCKHART ROAD
HU
RO
NIA
R
OA
D
SAUNDERS ROAD
BA
YV
IE
W
D
RIV
E
SA
UN
DE
RS
R
OA
D
VE
TE
RA
N'S
D
RIV
E
MAPLEVIEW DRIVE EASTMAPLEVIEW DRIVE WEST
E
S
S
A
R
O
A
D
VE
TE
RA
N'S
LN
HARVIE ROAD
BIG BAY POINT ROAD
W
E
L
H
A
M
R
O
A
D
BA
YV
IE
W
D
RIV
E
YO
NG
E S
TR
EE
T
CR
ES
CE
NT
S
T
.
P
A
U
L
'
S
Y
O
N
G
E
S
T
R
E
E
T
ARDAGH ROAD
M
A
P
L
E
T
O
N
TO
W
N LIN
E R
OA
D
C
O
U
N
TY
R
O
A
D
N
o. 27
LITTLE AVENUE
ARDAGH ROAD
IN
NIS
FIL S
TR
EE
T
F
E
R
N
D
A
L
E
D
R
IV
E
S
O
U
T
H
A
V
E
S
T
A
N
D
A
R
D
S
C
IT
Y
B
A
R
R
IE
STUDY AREA AND PRESSURE ZONE 2S - 3S
NORTH
EX. HARVIE RD RESERVOIR
AND PUMPING STATION
CAPACITY = 27.7 ML
BOT. ELEV. = 301.90
TOP ELEV. = 352.90
EX. BARRIE SWTP
EX. MAPLEVIEW DR RESERVOIR
CAPACITY = 4.5 ML
BOT. ELEV. = 337.65
TOP ELEV. = 350.15
STUDY AREA
PROP. SALEM RD. RESERVOIR
AND PUMPING STATION
CAPACITY = 20 ML
TOP ELEV. = 308.0
BOT. ELEV. = 302.0 (IN GROUND / ON GROUND)
DWG. No.DATE:SCALE:
OCT 2017N.T.S.
CLIENT:
G02
ASSUMED LOCATION OF
SALEM RD FACILITY PER
WATER SYSTEM MODELING
BIG BAY POINT ROAD
PUMPING STATION
2 PUMPS x 100 l/s @47m
2 PUMPS x 150 l/s @47m
PREFERRED SITE 1
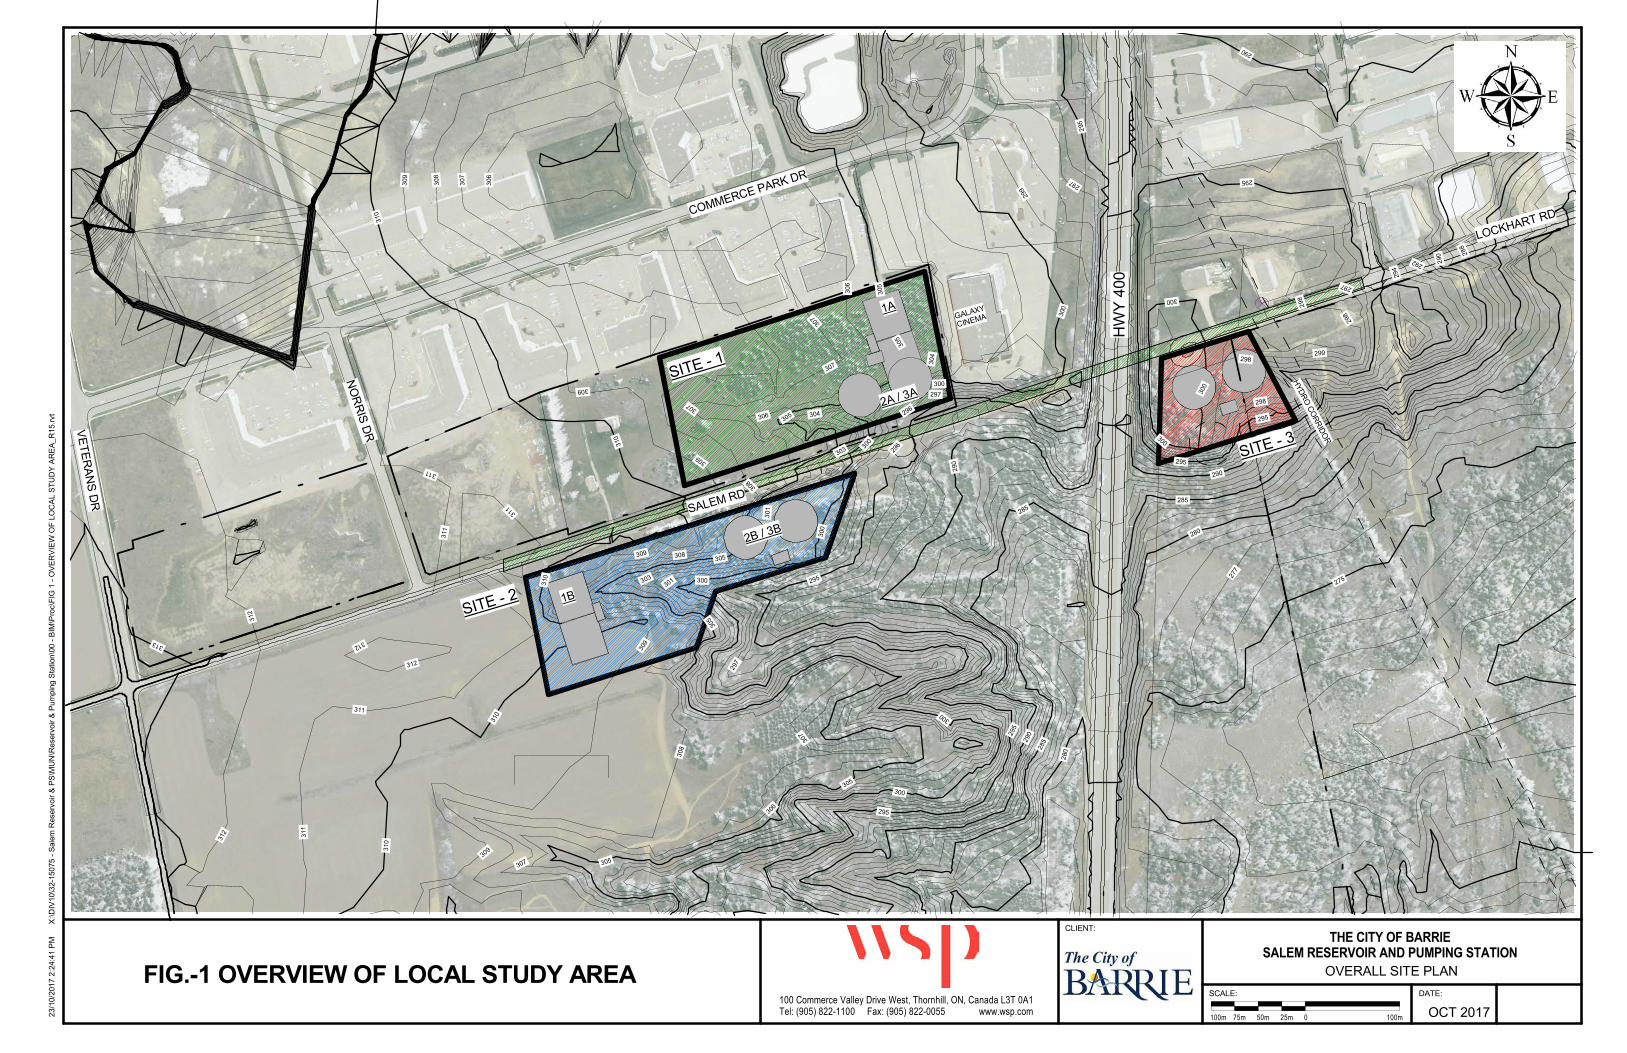
294 292
290
288
297
298
298
308
296
296
304 305
306
303 300
290
307
306
305
300
310
285
300
300
300
295
290
310
305
295
309
299
295
297
290
311
311
311
313
312
312
311
312
310
308
297
305
307
306
305
300
295
280 285
290
295
300
275
280
310
306
307
308
309
309
312
311
310
309
307 305
285
290
295
299
277
298
298
295
300
309 308
301 300 303
301
307
305
297
300
304
307
309
COMMERCE PARK DR
HW
Y 4
00
GALAXY
CINEMA
HY
DR
O C
OR
RID
OR
SALEM RD
LOCKHART RD
SITE - 1
VE
TE
RA
NS
DR
NO
RR
IS D
R
SITE - 3
SITE - 2
1A
2A / 3A
2B / 3B
1B
100m 75m 50m 25m 0 100m
DATE:SCALE:
OCT 2017
THE CITY OF BARRIE
SALEM RESERVOIR AND PUMPING STATION
100 Commerce Valley Drive West, Thornhill, ON, Canada L3T 0A1Tel: (905) 822-1100 Fax: (905) 822-0055 www.wsp.com
CLIENT:
23/1
0/2
017 2
:24:4
1 P
MX
:\D
IV10\3
2-1
5075 -
Sale
m R
eserv
oir &
PS
\MU
N\R
eserv
oir &
Pum
pin
g S
tation\0
0 -
BIM
\Pro
c\F
IG 1
- O
VE
RV
IEW
OF
LO
CA
L S
TU
DY
AR
EA
_R
15.r
vt
OVERALL SITE PLANFIG.-1 OVERVIEW OF LOCAL STUDY AREA

308
310
296
304
305 306
307
308
307
303
300
290
285
300
300
303
301
307
306 3
05
304
SALEM RD
COMMERCE PARK DR
HW
Y 4
00
RESERVOIRTOP.EL. 308.5
PUMPING STATIONF.F.EL. 309.0
PROPERTY LINE
PR
OP
ER
TY
LINE
PR
OP
ER
TY
LINE
GALAXY
CINEMA
1
FIG-04
CAPACITY10ML
FUTURECAPACITY
10ML
OVERFLOW PIPE
305.0 m
30.0 m
30.0 m
40.0 m
DATE:SCALE:
OCT 2017
THE CITY OF BARRIESALEM RESERVOIR AND PUMPING STATION (SITE-1)
100 Commerce Valley Drive West, Thornhill, ON, Canada L3T 0A1Tel: (905) 822-1100 Fax: (905) 822-0055 www.wsp.com
CLIENT:
23/1
0/2
017 2
:44:1
6 P
MX
:\D
IV10\3
2-1
5075 -
Sale
m R
eserv
oir &
PS
\MU
N\R
eserv
oir &
Pum
pin
g S
tation\0
0 -
BIM
\Pro
c\F
IG 2
- S
ITE
PLA
N O
PT
ION
S 1
A_R
15.r
vt
SITE PLAN - OPTION 1AFIG.- 2: SITE-1 PLAN OPTIONS 1A

PR
OP
ER
TY
LIN
E
PR
OP
ER
TY
LIN
E
SALEM RD.
GRADE EL. 309.0 m ±
RD. EL. 296.0 m
RESERVOIRCAPACITY 10ML + 10ML (FUTURE)
RESERVOIRTOP EL. 308.5
H.W.L. 308.0 m
L.W.L. 302.0 m
DATE:SCALE:
OCT 2017
THE CITY OF BARRIESALEM RESERVOIR AND PUMPING STATION (SITE-1)
100 Commerce Valley Drive West, Thornhill, ON, Canada L3T 0A1Tel: (905) 822-1100 Fax: (905) 822-0055 www.wsp.com
CLIENT:
23/1
0/2
017 2
:59:5
6 P
MX
:\D
IV10\3
2-1
5075 -
Sale
m R
eserv
oir &
PS
\MU
N\R
eserv
oir &
Pum
pin
g S
tation\0
0 -
BIM
\Pro
c\F
IG 2
- S
ITE
PLA
N O
PT
ION
S 1
A_R
15.r
vt
SECTION & 3D VIEW - OPTION -1A
3D VIEW FROM EAST
3D VIEW FROM WEST
SECTION
FIG.- 3: SITE-1 OPTION 1A RENDERINGS

294 292
290
288
297
298
298
308
303 300
290
306
300
285
300
300
300
295
290
310
305
295
299
295
297
290
311
311
311
313
312
312
311
312
310
308
297
305
307
306
305
300
295
280 285
290
295
300
275
280
310
306
307
308
309
312
311
310
309
307 305
285
290
295
299
277
298
298
295
300
309 308
301 300 303
301
309
305
COMMERCE PARK DR
HW
Y 4
00
GALAXY
CINEMA
HY
DR
O C
OR
RID
OR
SALEM RD
LOCKHART RD
1
FIG-2
SITE - 1
(30 Salem Road)
VE
TE
RA
NS
DR
NO
RR
IS D
R
PROPOSED RESERVOIRAND BOOSTER PUMPINGSTATION
100m 75m 50m 25m 0 100m
DATE:SCALE:
OCT 2017
THE CITY OF BARRIESALEM RESERVOIR AND PUMPING STATION (SITE-1)
100 Commerce Valley Drive West, Thornhill, ON, Canada L3T 0A1Tel: (905) 822-1100 Fax: (905) 822-0055 www.wsp.com
CLIENT:
23/1
0/2
017 2
:39:4
4 P
MX
:\D
IV10\3
2-1
5075 -
Sale
m R
eserv
oir &
PS
\MU
N\R
eserv
oir &
Pum
pin
g S
tation\0
0 -
BIM
\Pro
c\F
IG 4
- S
ITE
PLA
N O
PT
ION
S 2
A &
3A
_R
15.r
vt
SITE PLAN OPTIONS 2A & 3AFIG.- 4: SITE-1 PLAN OPTIONS 2A & 3A
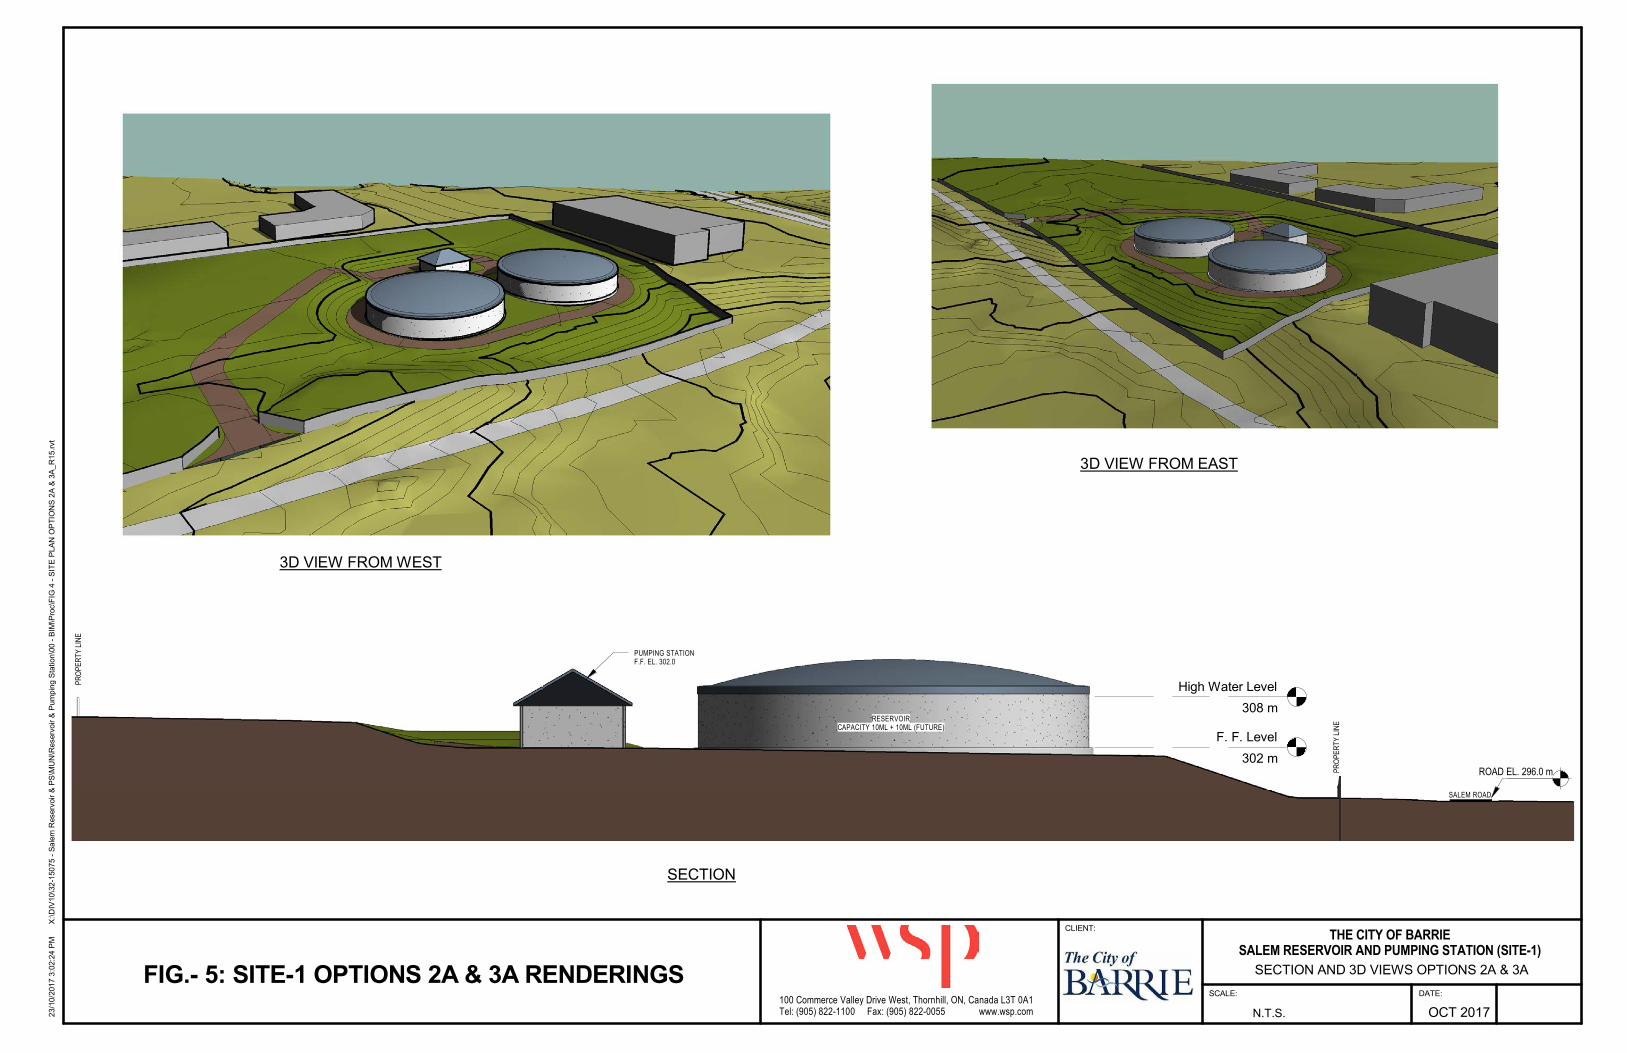
High Water Level
308 m
F. F. Level
302 m
PR
OP
ER
TY
LIN
E
RESERVOIRCAPACITY 10ML + 10ML (FUTURE)
PR
OP
ER
TY
LIN
E
SALEM ROAD
ROAD EL. 296.0 m
PUMPING STATIONF.F. EL. 302.0
DATE:SCALE:
OCT 2017
THE CITY OF BARRIESALEM RESERVOIR AND PUMPING STATION (SITE-1)
100 Commerce Valley Drive West, Thornhill, ON, Canada L3T 0A1Tel: (905) 822-1100 Fax: (905) 822-0055 www.wsp.com
CLIENT:
23/1
0/2
017 3
:02:2
4 P
MX
:\D
IV10\3
2-1
5075 -
Sale
m R
eserv
oir &
PS
\MU
N\R
eserv
oir &
Pum
pin
g S
tation\0
0 -
BIM
\Pro
c\F
IG 4
- S
ITE
PLA
N O
PT
ION
S 2
A &
3A
_R
15.r
vt
SECTION AND 3D VIEWS OPTIONS 2A & 3A
3D VIEW FROM WEST
3D VIEW FROM EAST
SECTION
N.T.S.
FIG.- 5: SITE-1 OPTIONS 2A & 3A RENDERINGS

APPENDIX B
CAPITAL AND LIFE CYCLE COST ESTIMATES

ITEM DESCRIPTION
Option 1A:
CIP Concrete In-
ground Reservoir
& PS
-
Site 1
North Side Salem
Road
Option 1B:
CIP Concrete In-
ground Reservoir
& PS
-
Site 2
South Side
Salem Road
Option 2A:
Glass Fused to
Steel At-Grade
Reservoir & PS
-
Site 1
North Side Salem
Road
Option 2B:
Glass Fused to
Steel At-Grade
Reservoir & PS
-
Site 2
South Side
Salem Rd
Option 3.A:
Precast,
prestressed
Concrete At-
Grade Reservoir
& PS
-
Site 1
North Side Salem
Rd
Option 3. B:
Precast,
prestressed
Concrete At-
Grade Reservoir
& PS
-
Site 2
South Side
Salem Rd
A.
SUBTOTAL - Div 1-16 $25,967,000 $28,066,000 $17,687,000 $18,145,000 $20,850,000 $21,175,000
B.
ALLOWANCE @ 20% $5,193,400 $5,613,200 $3,537,400 $3,629,000 $4,170,000 $4,235,000
C. $31,160,400 $33,679,200 $21,224,400 $21,774,000 $25,020,000 $25,410,000
ALL COSTS LESS HST
ESTIMATED TOTAL
CONSTRUCTION COSTS
ESTIMATED
CONTINGENCY COSTS
ESTIMATED
CONSTRUCTION COSTS
TECHNOLOGY DESCRIPTION
COMPARISON OF ESTIMATED CONSTRUCTION COSTSSALEM ROAD RESERVOIR AND PUMPING STATION CONCEPTUAL DESIGN - TECHNOLOGY ASSESSMENT
Summary m:\2017\salem reservoir and pumping station - august 2017\final_appendices\appendix_b\ref\salem_reservoir_ps_cost_estimate_comparison_technology assessment_mep_dec06_2017.xls

OPTION 1A : In-ground Cast-in-Place Concrete Reservoir - Site 1, North of Salem Rd, West of Hwy 400
Item Estimated Unit Unit Estimate Installation Factor Price per Unit of Qty ($) % ($) ($) ($)
1. 1 Lump Sum 2,360,703.60$ Incl. in Unit Price Incl. in Unit Price 2,360,703.60$ 2,360,703.60$
2. 8,898,496.00$
1 Lump Sum 386,156.00$ Incl. in Unit Price Incl. in Unit Price 386,156.00$
1 Lump Sum 75,000.00$ Incl. in Unit Price Incl. in Unit Price 75,000.00$
3040 m2 1,200.00$ Incl. in Unit Price Incl. in Unit Price 3,648,000.00$
1 Lump Sum 10,000.00$ Incl. in Unit Price Incl. in Unit Price 10,000.00$
19000 m2 50.00$ Incl. in Unit Price Incl. in Unit Price 950,000.00$
30201 m3 100.00$ Incl. in Unit Price Incl. in Unit Price 3,020,120.00$
1 Lump Sum 10,000.00$ Incl. in Unit Price Incl. in Unit Price 10,000.00$
1 Lump Sum 10,000.00$ Incl. in Unit Price Incl. in Unit Price 10,000.00$
100 m 1,100.00$ 50% $ 550.00 165,000.00$
48 m 1,500.00$ 50% $ 750.00 108,000.00$
49 m 450.00$ 50% $ 225.00 33,140.00$
135 m 500.00$ 50% $ 250.00 101,480.00$
40 m 500.00$ 50% $ 250.00 30,000.00$
14 m 500.00$ 50% $ 250.00 10,500.00$
1 Lump Sum 20,000.00$ Incl. in Unit Price Incl. in Unit Price 20,000.00$
1 Lump Sum 8,000.00$ Incl. in Unit Price Incl. in Unit Price 8,000.00$
1 Lump Sum 6,000.00$ Incl. in Unit Price Incl. in Unit Price 6,000.00$
120 m3 500.00$ 50% $ 250.00 90,000.00$
553 m 40.00$ Incl. in Unit Price Incl. in Unit Price 22,100.00$
19000 m2 5.00$ Incl. in Unit Price Incl. in Unit Price 95,000.00$
1 Lump Sum 100,000.00$ Incl. in Unit Price Incl. in Unit Price 100,000.00$
3. 9,767,710.00$
11,468 m2 250.00$ Incl. in Unit Price Incl. in Unit Price 2,866,930.00$
1 Lump Sum -$ Incl. in Unit Price Incl. in Unit Price -$
4897 m3 1,400.00$ Incl. in Unit Price Incl. in Unit Price 6,855,780.00$
1 Lump Sum 25,000.00$ Incl. in Unit Price Incl. in Unit Price 25,000.00$
1 Lump Sum 10,000.00$ Incl. in Unit Price Incl. in Unit Price 10,000.00$
1 Lump Sum 10,000.00$ Incl. in Unit Price Incl. in Unit Price 10,000.00$
4. 156,660.00$
298 m2 25.00$ Incl. in Unit Price Incl. in Unit Price 7,460.00$
298 m2 50.00$ Incl. in Unit Price Incl. in Unit Price 14,920.00$
298 m2 200.00$ Incl. in Unit Price Incl. in Unit Price 59,680.00$
298 m2 250.00$ Incl. in Unit Price Incl. in Unit Price 74,600.00$
5. 250,860.00$
1 Lump Sum 5,000.00$ 33% $ 1,650.00 6,650.00$
1 Lump Sum 5,000.00$ 33% $ 1,650.00 6,650.00$
4 ea 100.00$ 33% $ 33.00 530.00$
1 Lump Sum 25,000.00$ 33% $ 8,250.00 33,250.00$
4 ea 15,000.00$ 33% $ 4,950.00 79,800.00$
1 ea 15,000.00$ 33% $ 4,950.00 19,950.00$
2 ea 15,000.00$ 33% $ 4,950.00 39,900.00$
8 m2 600.00$ 33% $ 198.00 6,480.00$
55 m 200.00$ 33% $ 66.00 14,710.00$
17 m 200.00$ 33% $ 66.00 4,500.00$
9 ea 1,500.00$ 33% $ 495.00 17,960.00$
21 m 150.00$ 33% $ 49.50 4,130.00$
5 m2 500.00$ 33% $ 165.00 3,050.00$
1 Lump Sum 10,000.00$ 33% $ 3,300.00 13,300.00$
6. Includes Div6+7+8+9+10 163,740.00$
1 Lump Sum 10,000.00$ 33% $ 3,300.00 13,300.00$
7.
364 m2 5.00$ 33% $ 1.65 2,420.00$
1 Lump Sum 10,000.00$ 33% $ 3,300.00 13,300.00$
1 Lump Sum 30,000.00$ 33% $ 9,900.00 39,900.00$
8.
Total Cost Estimate
02380 Erosion and Sediment Control
All Wood and Plastics Items
Watertight Drainage Hatch (1219x1219mm) - 2
Roof Access Hatch (1000 x 1000mm) - 1
3200 Concrete Reinforcement
Division 4 - Masonry
4080 Mansonry Reinforcement and Connectors
5501 Metal Fabrications - Architectural
5502 Metal Fabrications - Structural
Steel Bollards
All Other Metal Items
2140 Dewatering
Division 5 - Metals
2701 Aggregates
2511 Watermains
5310 Specialty Items
4200 Unit Masonry
4090 Masonry Accessories
3345 Concrete Curing and Finishing
2311 Site Grading
(i) Pumping Station
3100 Concrete Forms and Accessories
3300 Cast in Place Concrete
(ii) Reservoir
(iii) Retention Chamber
3375 Concrete Floor Toppings
Division 3 - Concrete
Division 8 - Metal Doors and Frames
Division 7 - Building Specialties
Division 6 - Carpentry
3372 Non-shrink Grout
(i) Pumping Station
(ii) Reservoir
(iii) Retention Chamber
2100 General Allowances (5%)
Description
2936 Landscaping
2911 Topsoil and Finish Grading
2821 Chain Link Fences and Gates
2723 Granular Sub-Base
2315 Excavation, Trenching and Backfill (& Disposal)
Division 1 - General Requirements (10%)
2721 Granular Base
Division 2 - Site Work
4060 Mortar and Masonry Grout
FRP Platform
FRP Handrail (Retention+Reservoir)
FRP Ladder
Aluminum Handrail (Staircase)
2150 Shoring Systems
5000 Metals General Requirements
02530 Sewerage Gravity Sanitary Sewer
2741 Asphalt Paving
2200 Site Preparation
02362 Dust Control
02630 Storm Sewers
STM - Landscaping Drainage 450 mm
STM - Overflow Outlet 600 mm
STM - 200 mm
WM - 600mm, steel casing
WM - 500mm
07610 Preformed Metal Standing Seam Roofing System
7200 Insulation
7130 Membrane Waterproofing
Access Hatch (914 x 914 mm) - 4
Staircase (Pumping Station)
Aluminum Handrail (Mezz+Basem't+Bldg)
Aluminum Grating (Pumping Station)
Option 1A - CIP Concrete m:\2017\salem reservoir and pumping station - august 2017\appendices\appendix_b\salem_reservoir_ps_cost_estimate_comparison_technology assessment_mep_oct25_2017.xls

OPTION 1A : In-ground Cast-in-Place Concrete Reservoir - Site 1, North of Salem Rd, West of Hwy 400
Item Estimated Unit Unit Estimate Installation Factor Price per Unit of Qty ($) % ($) ($) ($)
Total Cost EstimateDescription
8 ea 3,000.00$ 25% $ 750.00 30,000.00$
1 Lump Sum 3,000.00$ Incl. in Unit Price Incl. in Unit Price 3,000.00$
1 Lump Sum 20,000.00$ Incl. in Unit Price Incl. in Unit Price 20,000.00$
9.
298 m2 25.00$ 25% $ 6.25 9,320.00$
1 Lump Sum 2,000.00$ 25% $ 500.00 2,500.00$
10.
1 Lump Sum 20,000.00$ 50% $ 10,000.00 30,000.00$
11.
1 Lump Sum 10,000.00$ Incl. in Unit Price Incl. in Unit Price 10,000.00$
1,000,850.00$
4 Each 85,000.00$ 33% $ 28,050.00 452,200.00$
3 Each 60,000.00$ 33% $ 19,800.00 239,400.00$
3 Each 75,000.00$ 33% $ 24,750.00 299,250.00$
2 Each 35,000.00$ 75% $ 26,250.00 122,500.00$ 122,500.00$
26,600.00$ 106,400.00$
1 Each 20,000.00$ 33% $ 6,600.00 39,900.00$
1 Each 30,000.00$ 33% $ 9,900.00 39,900.00$
1 Each 30,000.00$ 33% $ 9,900.00 169,570.00$
12. 5,000.00$
1 Lump Sum 5,000.00$ Incl. in Unit Price Incl. in Unit Price 5,000.00$
1 Lump Sum 5,000.00$ Incl. in Unit Price Incl. in Unit Price 21,950.00$
3 Each 5,500.00$ 33% $ 1,815.00 11,170.00$
14 Each 600.00$ 33% $ 198.00 15,960.00$
2 Each 6,000.00$ 33% $ 1,980.00 2,390.00$
6 Each 300.00$ 33% $ 99.00 26,600.00$
1 Lump Sum 20,000.00$ 33% $ 6,600.00 66,500.00$
1 Each 50,000.00$ 33% $ 16,500.00 15,000.00$
1 Lump Sum 15,000.00$ Incl. in Unit Price Incl. in Unit Price
13. 75,000.00$
1 Lump Sum 50,000.00$ 50% $ 25,000.00 incl Div14+15 2,082,400.00$
14. 15,000.00$
1 Lump Sum 15,000.00$ Incl. in Unit Price Incl. in Unit Price 19,950.00$
1 Lump Sum 15,000.00$ 33% $ 4,950.00 26,600.00$
1 Lump Sum 20,000.00$ 33% $ 6,600.00
20 m 300.00$ 33% $ 99.00 13,300.00$
1 Lump Sum 10,000.00$ 33% $ 3,300.00 19,950.00$
1 Lump Sum 15,000.00$ 33% $ 4,950.00 6,650.00$
1 Lump Sum 5,000.00$ 33% $ 1,650.00 19,950.00$
1 Lump Sum 15,000.00$ 33% $ 4,950.00
3 Each 8,000.00$ 33% $ 2,640.00 7,980.00$
1 Lump Sum 6,000.00$ 33% $ 1,980.00 6,650.00$
1 Lump Sum 5,000.00$ 33% $ 1,650.00 239,400.00$
9 Each 20,000.00$ 33% $ 6,600.00 13,300.00$
1 Lump Sum 10,000.00$ 33% $ 3,300.00 66,500.00$
1 Lump Sum 50,000.00$ 33% $ 16,500.00 33,250.00$
1 Lump Sum 25,000.00$ 33% $ 8,250.00 93,100.00$
1 Lump Sum 70,000.00$ 33% $ 23,100.00 10,000.00$
1 Lump Sum 10,000.00$ Incl. in Unit Price Incl. in Unit Price 5,000.00$
1 Lump Sum 5,000.00$ Incl. in Unit Price Incl. in Unit Price 887,850.00$
16. 30,000.00$
1 Lump Sum 30,000.00$ Incl. in Unit Price Incl. in Unit Price 6,650.00$
1 Lump Sum 5,000.00$ 33% $ 1,650.00 199,500.00$
1 Each 150,000.00$ 33% $ 49,500.00 133,000.00$
1 Each 100,000.00$ 33% $ 33,000.00 26,600.00$
1 Lump Sum 20,000.00$ 33% $ 6,600.00 79,800.00$
4 Each 15,000.00$ 33% $ 4,950.00 66,500.00$
2 Each 25,000.00$ 33% $ 8,250.00 212,800.00$
8 Each 20,000.00$ 33% $ 6,600.00 133,000.00$
1 Lump Sum 100,000.00$ 33% $ 33,000.00
Div 2-16 23,607,036$ 23,607,036$ Total 25,967,740$ 25,967,740$
11260 Chemical Storage and Feed Equipment
Solonoid Valve - 19mm
15204 Process Piping Specialties
All Other Doors and Windows Items
Bi-directional Magnetic Flowmeter - 300mm
Magnetic Flowmeter - 300mm
Magnetic Flowmeter - 200mm
Centrifuge Pumps
Submersible Sump Pump
Vertical Turbine Pump
08710 Door Hardware
09900 Painting and Protective Coatings
Division 11 - Equipment
Division 10 - Miscellaneous Specialties
Division 9 - Dry Wall and Painting
11000 Equipment General Requirements
15060 Pipe Fittings
15010 Mechanical General Requirements
13305 Field Wiring
13141 Pressure Gauge
16461 Dry Type Transformers
16820 Motor Control Centre
16816 Variable Frequency Drives
16811 Motor Starters
16627 Automatic Transfer Switches
16556 Diesel Engine Generator Set
16818 Soft Starter Drives
16560 Emergency Chlorine Scrubber
Division 16 - Electrical
11560 Flowmeter
15100 Plumbing Piping
16000 Electrical General Works
15955 Piping Leakage Testing
15950 HVAC Systems Testing, Adjusting, and Balancing
15900 HVAC Controls
15830 Fans
15810 Metal Ductwork and Accessories
15802 Fiberglass Reinforced Plastic Ductwork
15760 Electric Unit Heaters
15440 Plumbing Equipment
15410 Plumbing Fixtures
11215 Pumps
13140 Pressure Transmitter
15202 Vibration and Noise Control
15201 Piping Support Systems
15200-14 Copper Tubing and Fittings
Division 13 - Instrumentation and Control
150mm dia. Pipe
Division 15 - Mechanical
All Other Finishes Items
10200 Louvres and Vents
Division 14 - Monorail and Hoist
14620 Monorail and Hoist
13130 Float Switch
13110 Ultrasonic Level Transmitter
13105 General Instrumentation Requirements
13010 Process Control - General Requirements
13480 SCADA System Integrator
13400 Programmable Logic Controller
08110 Steel Door Frames
Option 1A - CIP Concrete m:\2017\salem reservoir and pumping station - august 2017\appendices\appendix_b\salem_reservoir_ps_cost_estimate_comparison_technology assessment_mep_oct25_2017.xls

OPTION 1.B: In-ground Cast-in-Place Concrete Reservoir - Site 2, South of Salem Rd, West of Hwy 400
Item Estimated Unit Unit Estimate Installation Factor Price per Unit of Qty ($) % ($) ($) ($)
1. 1 Lump Sum 2,551,459.45$ Incl. in Unit Price Incl. in Unit Price 2,551,459.45$ 2,551,459.45$
2. 10,806,054.50$
1 Lump Sum 482,134.50$ Incl. in Unit Price Incl. in Unit Price 482,134.50$
1 Lump Sum 90,000.00$ Incl. in Unit Price Incl. in Unit Price 90,000.00$
3040 m2 1,200.00$ Incl. in Unit Price Incl. in Unit Price 3,648,000.00$
1 Lump Sum 15,000.00$ Incl. in Unit Price Incl. in Unit Price 15,000.00$
25000 m2 50.00$ Incl. in Unit Price Incl. in Unit Price 1,250,000.00$
46047 m3 100.00$ Incl. in Unit Price Incl. in Unit Price 4,604,690.00$
1 Lump Sum 10,000.00$ Incl. in Unit Price Incl. in Unit Price 10,000.00$
1 Lump Sum 25,000.00$ Incl. in Unit Price Incl. in Unit Price 25,000.00$
80 m 1,100.00$ 50% $ 550.00 132,000.00$
48 m 1,500.00$ 50% $ 750.00 108,000.00$
55 m 450.00$ 50% $ 225.00 37,130.00$
100 m 500.00$ 50% $ 250.00 75,000.00$
20 m 500.00$ 50% $ 250.00 15,000.00$
14 m 500.00$ 50% $ 250.00 10,500.00$
1 Lump Sum 20,000.00$ Incl. in Unit Price Incl. in Unit Price 20,000.00$
1 Lump Sum 8,000.00$ Incl. in Unit Price Incl. in Unit Price 8,000.00$
1 Lump Sum 6,000.00$ Incl. in Unit Price Incl. in Unit Price 6,000.00$
80 m3 500.00$ 50% $ 250.00 60,000.00$
553 m 40.00$ Incl. in Unit Price Incl. in Unit Price 22,100.00$
17500 m2 5.00$ Incl. in Unit Price Incl. in Unit Price 87,500.00$
1 Lump Sum 100,000.00$ Incl. in Unit Price Incl. in Unit Price 100,000.00$
3. 9,767,710.00$
11,468 m2 250.00$ Incl. in Unit Price Incl. in Unit Price 2,866,930.00$
1 Lump Sum -$ Incl. in Unit Price Incl. in Unit Price -$
4897 m3 1,400.00$ Incl. in Unit Price Incl. in Unit Price 6,855,780.00$
1 Lump Sum 25,000.00$ Incl. in Unit Price Incl. in Unit Price 25,000.00$
1 Lump Sum 10,000.00$ Incl. in Unit Price Incl. in Unit Price 10,000.00$
1 Lump Sum 10,000.00$ Incl. in Unit Price Incl. in Unit Price 10,000.00$
4. 156,660.00$
298 m2 25.00$ Incl. in Unit Price Incl. in Unit Price 7,460.00$
298 m2 50.00$ Incl. in Unit Price Incl. in Unit Price 14,920.00$
298 m2 200.00$ Incl. in Unit Price Incl. in Unit Price 59,680.00$
298 m2 250.00$ Incl. in Unit Price Incl. in Unit Price 74,600.00$
5. 250,860.00$
1 Lump Sum 5,000.00$ 33% $ 1,650.00 6,650.00$
1 Lump Sum 5,000.00$ 33% $ 1,650.00 6,650.00$
4 ea 100.00$ 33% $ 33.00 530.00$
1 Lump Sum 25,000.00$ 33% $ 8,250.00 33,250.00$
4 ea 15,000.00$ 33% $ 4,950.00 79,800.00$
1 ea 15,000.00$ 33% $ 4,950.00 19,950.00$
2 ea 15,000.00$ 33% $ 4,950.00 39,900.00$
8 m2 600.00$ 33% $ 198.00 6,480.00$
Aluminum Handrail (Mezz+Basem't+Bldg) 55 m 200.00$ 33% $ 66.00 14,710.00$
17 m 200.00$ 33% $ 66.00 4,500.00$
9 ea 1,500.00$ 33% $ 495.00 17,960.00$
21 m 150.00$ 33% $ 49.50 4,130.00$
5 m2 500.00$ 33% $ 165.00 3,050.00$
1 Lump Sum 10,000.00$ 33% $ 3,300.00 13,300.00$
6. Includes Div6+7+8+9+10 163,740.00$
1 Lump Sum 10,000.00$ 33% $ 3,300.00 13,300.00$
7.
364 m2 5.00$ 33% $ 1.65 2,420.00$
1 Lump Sum 10,000.00$ 33% $ 3,300.00 13,300.00$
1 Lump Sum 30,000.00$ 33% $ 9,900.00 39,900.00$
8.
8 ea 3,000.00$ 25% $ 750.00 30,000.00$
1 Lump Sum 3,000.00$ Incl. in Unit Price Incl. in Unit Price 3,000.00$
1 Lump Sum 20,000.00$ Incl. in Unit Price Incl. in Unit Price 20,000.00$
9.
298 m2 25.00$ 25% $ 6.25 9,320.00$
Total Cost Estimate
Aluminum Handrail (Staircase)
All Wood and Plastics Items
All Other Doors and Windows Items
Watertight Drainage Hatch (1219x1219mm) - 2
Roof Access Hatch (1000 x 1000mm) - 1
Access Hatch (914 x 914 mm) - 4
Staircase (Pumping Station)
Steel Bollards
5501 Metal Fabrications - Architectural
5502 Metal Fabrications - Structural
07610 Preformed Metal Standing Seam Roofing System
Division 8 - Metal Doors and Frames
08110 Steel Door Frames
08710 Door Hardware
Division 9 - Dry Wall and Painting
09900 Painting and Protective Coatings
Division 6 - Carpentry
Division 7 - Building Specialties
7130 Membrane Waterproofing
7200 Insulation
All Other Metal Items
FRP Platform
4060 Mortar and Masonry Grout
FRP Handrail (Retention+Reservoir)
FRP Ladder
Aluminum Grating (Pumping Station)
4080 Mansonry Reinforcement and Connectors
4090 Masonry Accessories
4200 Unit Masonry
Division 5 - Metals
5000 Metals General Requirements
5310 Specialty Items
(ii) Reservoir
(iii) Retention Chamber
3345 Concrete Curing and Finishing
3372 Non-shrink Grout
3375 Concrete Floor Toppings
Division 4 - Masonry
(i) Pumping Station
(ii) Reservoir
(iii) Retention Chamber
3200 Concrete Reinforcement
3300 Cast in Place Concrete
(i) Pumping Station
2821 Chain Link Fences and Gates
2911 Topsoil and Finish Grading
2936 Landscaping
Division 3 - Concrete
3100 Concrete Forms and Accessories
2701 Aggregates
2721 Granular Base
2723 Granular Sub-Base
2741 Asphalt Paving
STM - Landscaping Drainage 450 mm
STM - Overflow Outlet 600 mm
02530 Sewerage Gravity Sanitary Sewer
WM - 600mm, steel casing
WM - 500mm
02380 Erosion and Sediment Control
STM - 200 mm
02630 Storm Sewers
2200 Site Preparation
2311 Site Grading
2315 Excavation, Trenching and Backfill (& Disposal)
02362 Dust Control
2511 Watermains
Description
Division 1 - General Requirements (10%)
Division 2 - Site Work
2100 General Allowances (5%)
2140 Dewatering
2150 Shoring Systems
Option 1B - CIP Concrete \\thfiler1.mmm.ca\wpdocs$\2017\salem reservoir and pumping station - august 2017\2017-08-22 salem reservoir_cost estimate comparison_technology assessment_mep_oct20_2017.xls

OPTION 1.B: In-ground Cast-in-Place Concrete Reservoir - Site 2, South of Salem Rd, West of Hwy 400
Item Estimated Unit Unit Estimate Installation Factor Price per Unit of Qty ($) % ($) ($) ($)
Total Cost EstimateDescription
1 Lump Sum 2,000.00$ 25% $ 500.00 2,500.00$
10.
1 Lump Sum 20,000.00$ 50% $ 10,000.00 30,000.00$
11.
1 Lump Sum 10,000.00$ Incl. in Unit Price Incl. in Unit Price 10,000.00$
1,000,850.00$
4 Each 85,000.00$ 33% $ 28,050.00 452,200.00$
3 Each 60,000.00$ 33% $ 19,800.00 239,400.00$
3 Each 75,000.00$ 33% $ 24,750.00 299,250.00$
2 Each 35,000.00$ 75% $ 26,250.00 122,500.00$ 122,500.00$
106,400.00$
1 Each 20,000.00$ 33% $ 6,600.00 26,600.00$
1 Each 30,000.00$ 33% $ 9,900.00 39,900.00$
Bi-directional Magnetic Flowmeter - 300mm 1 Each 30,000.00$ 33% $ 9,900.00 39,900.00$
12. 169,570.00$
1 Lump Sum 5,000.00$ Incl. in Unit Price Incl. in Unit Price 5,000.00$
1 Lump Sum 5,000.00$ Incl. in Unit Price Incl. in Unit Price 5,000.00$
3 Each 5,500.00$ 33% $ 1,815.00 21,950.00$
14 Each 600.00$ 33% $ 198.00 11,170.00$
2 Each 6,000.00$ 33% $ 1,980.00 15,960.00$
6 Each 300.00$ 33% $ 99.00 2,390.00$
1 Lump Sum 20,000.00$ 33% $ 6,600.00 26,600.00$
1 Each 50,000.00$ 33% $ 16,500.00 66,500.00$
1 Lump Sum 15,000.00$ Incl. in Unit Price Incl. in Unit Price 15,000.00$
13.
1 Lump Sum 50,000.00$ 50% $ 25,000.00 75,000.00$
14. 2,082,400.00$
1 Lump Sum 15,000.00$ Incl. in Unit Price Incl. in Unit Price 15,000.00$
1 Lump Sum 15,000.00$ 33% $ 4,950.00 19,950.00$
1 Lump Sum 20,000.00$ 33% $ 6,600.00 26,600.00$
1 Lump Sum 10,000.00$ 33% $ 3,300.00 13,300.00$
1 Lump Sum 15,000.00$ 33% $ 4,950.00 19,950.00$
1 Lump Sum 5,000.00$ 33% $ 1,650.00 6,650.00$
1 Lump Sum 15,000.00$ 33% $ 4,950.00 19,950.00$
1 Lump Sum 6,000.00$ 33% $ 1,980.00 7,980.00$
1 Lump Sum 5,000.00$ 33% $ 1,650.00 6,650.00$
9 Each 20,000.00$ 33% $ 6,600.00 239,400.00$
1 Lump Sum 10,000.00$ 33% $ 3,300.00 13,300.00$
1 Lump Sum 50,000.00$ 33% $ 16,500.00 66,500.00$
1 Lump Sum 25,000.00$ 33% $ 8,250.00 33,250.00$
1 Lump Sum 70,000.00$ 33% $ 23,100.00 93,100.00$
1 Lump Sum 10,000.00$ Incl. in Unit Price Incl. in Unit Price 10,000.00$
1 Lump Sum 5,000.00$ Incl. in Unit Price Incl. in Unit Price 5,000.00$
16. 887,850.00$
1 Lump Sum 30,000.00$ Incl. in Unit Price Incl. in Unit Price 30,000.00$
1 Lump Sum 5,000.00$ 33% $ 1,650.00 6,650.00$
1 Each 150,000.00$ 33% $ 49,500.00 199,500.00$
1 Each 100,000.00$ 33% $ 33,000.00 133,000.00$
1 Lump Sum 20,000.00$ 33% $ 6,600.00 26,600.00$
4 Each 15,000.00$ 33% $ 4,950.00 79,800.00$
2 Each 25,000.00$ 33% $ 8,250.00 66,500.00$
8 Each 20,000.00$ 33% $ 6,600.00 212,800.00$
1 Lump Sum 100,000.00$ 33% $ 33,000.00 133,000.00$
Div 2-16 25,514,594.50$ 25,514,595$ Total 28,066,053.95$ 28,066,054$
11260 Chemical Storage and Feed Equipment
Magnetic Flowmeter - 300mm
Magnetic Flowmeter - 200mm
Centrifuge Pumps
Submersible Sump Pump
Vertical Turbine Pump
11560 Flowmeters
11215 Pumps
16560 Emergency Chlorine Scrubber
16627 Automatic Transfer Switches
16811 Motor Starters
16816 Variable Frequency Drives
16818 Soft Starter Drives
16820 Motor Control Centre
15950 HVAC Systems Testing, Adjusting, and Balancing
15955 Piping Leakage Testing
Division 16 - Electrical
16000 Electrical General Works
16461 Dry Type Transformers
16556 Diesel Engine Generator Set
15440 Plumbing Equipment
15760 Electric Unit Heaters
15802 Fiberglass Reinforced Plastic Ductwork
15810 Metal Ductwork and Accessories
15830 Fans
15900 HVAC Controls
15200-14 Copper Tubing and Fittings
15201 Piping Support Systems
15202 Vibration and Noise Control
15204 Process Piping Specialties
15205 Process Valves and Operators
15410 Plumbing Fixtures
14620 Monorail and Hoist
Division 15 - Mechanical
15010 Mechanical General Requirements
15060 Pipe Fittings
15100 Plumbing Piping
15200 Process Piping and Fittings
13140 Pressure Transmitter
13141 Pressure Gauge
13305 Field Wiring
13400 Programmable Logic Controller
13480 SCADA System Integrator
Division 14 - Monorail and Hoist
Division 13 - Instrumentation and Control
13010 Process Control - General Requirements
13105 General Instrumentation Requirements
13110 Ultrasonic Level Transmitter
13130 Float Switch
All Other Finishes Items
Division 10 - Miscellaneous Specialties
10200 Louvres and Vents
Division 11 - Equipment
11000 Equipment General Requirements
Option 1B - CIP Concrete \\thfiler1.mmm.ca\wpdocs$\2017\salem reservoir and pumping station - august 2017\2017-08-22 salem reservoir_cost estimate comparison_technology assessment_mep_oct20_2017.xls

OPTION 2A : At-ground Glass Fused to Steel Reservoir & PS - Site 1, North of Salem Rd, West of Hwy 400
Item Estimated Unit Unit Estimate Installation Factor Price per Unit of Qty ($) % ($) ($) ($)
1. 1 Lump Sum 1,607,997.15$ Incl. in Unit Price Incl. in Unit Price 1,607,997.15$ 1,607,997.15$
2. 2,740,171.50$
1 Lump Sum 91,021.50$ Incl. in Unit Price Incl. in Unit Price 91,021.50$
1 Lump Sum 50,000.00$ Incl. in Unit Price Incl. in Unit Price 50,000.00$
485 m2 1,200.00$ Incl. in Unit Price Incl. in Unit Price 581,510.00$
1 Lump Sum 10,000.00$ Incl. in Unit Price Incl. in Unit Price 10,000.00$
19000 m2 50.00$ Incl. in Unit Price Incl. in Unit Price 950,000.00$
2089 m3 100.00$ Incl. in Unit Price Incl. in Unit Price 208,920.00$
1 Lump Sum 10,000.00$ Incl. in Unit Price Incl. in Unit Price 10,000.00$
1 Lump Sum 10,000.00$ Incl. in Unit Price Incl. in Unit Price 10,000.00$
150 m 1,100.00$ 50% $ 550.00 247,500.00$
60 m 1,500.00$ 50% $ 750.00 135,000.00$
49 m 450.00$ 50% $ 225.00 33,140.00$
135 m 500.00$ 50% $ 250.00 101,480.00$
40 m 500.00$ 50% $ 250.00 30,000.00$
14 m 500.00$ 50% $ 250.00 10,500.00$
1 Lump Sum 20,000.00$ Incl. in Unit Price Incl. in Unit Price 20,000.00$
1 Lump Sum 8,000.00$ Incl. in Unit Price Incl. in Unit Price 8,000.00$
1 Lump Sum 6,000.00$ Incl. in Unit Price Incl. in Unit Price 6,000.00$
120 m3 500.00$ 50% $ 250.00 90,000.00$
553 m 40.00$ Incl. in Unit Price Incl. in Unit Price 22,100.00$
19000 m2 5.00$ Incl. in Unit Price Incl. in Unit Price 95,000.00$
1 Lump Sum 30,000.00$ Incl. in Unit Price Incl. in Unit Price 30,000.00$
3. 2,504,590.00$
1,810 m2 250.00$ Incl. in Unit Price Incl. in Unit Price 452,590.00$
1 Lump Sum -$ Incl. in Unit Price Incl. in Unit Price -$
1673 m3 1,200.00$ Incl. in Unit Price Incl. in Unit Price 2,007,000.00$
1 Lump Sum 25,000.00$ Incl. in Unit Price Incl. in Unit Price 25,000.00$
1 Lump Sum 10,000.00$ Incl. in Unit Price Incl. in Unit Price 10,000.00$
1 Lump Sum 10,000.00$ Incl. in Unit Price Incl. in Unit Price 10,000.00$
4. 156,660.00$
298 m2 25.00$ Incl. in Unit Price Incl. in Unit Price 7,460.00$
298 m2 50.00$ Incl. in Unit Price Incl. in Unit Price 14,920.00$
298 m2 200.00$ Incl. in Unit Price Incl. in Unit Price 59,680.00$
298 m2 250.00$ Incl. in Unit Price Incl. in Unit Price 74,600.00$
5. 134,690.00$
1 Lump Sum 5,000.00$ 33% $ 1,650.00 6,650.00$
1 Lump Sum 5,000.00$ 33% $ 1,650.00 6,650.00$
4 ea 100.00$ 33% $ 33.00 530.00$
1 Lump Sum 25,000.00$ 33% $ 8,250.00 33,250.00$
2 ea 15,000.00$ 33% $ 4,950.00 39,900.00$
1 ea 15,000.00$ 33% $ 4,950.00 19,950.00$
8 m2 600.00$ 33% $ 198.00 6,480.00$
20 m 200.00$ 33% $ 66.00 5,320.00$
10 m 200.00$ 33% $ 66.00 2,660.00$
1 Lump Sum 10,000.00$ 33% $ 3,300.00 13,300.00$
6. Includes Div6+7+8+9+10 6,041,290.00$
1 Lump Sum 10,000.00$ 33% $ 3,300.00 13,300.00$
7.
277 m2 5.00$ 33% $ 1.65 1,840.00$
1 Lump Sum 10,000.00$ 33% $ 3,300.00 13,300.00$
1 Lump Sum 30,000.00$ 33% $ 9,900.00 39,900.00$
20000 m3 165.00$ 50% $ 82.50 4,950,000.00$
1 Lump Sum 742,500.00$ 25% $ 185,625.00 928,130.00$
8.
8 ea 3,000.00$ 25% $ 750.00 30,000.00$
1 Lump Sum 3,000.00$ Incl. in Unit Price Incl. in Unit Price 3,000.00$
1 Lump Sum 20,000.00$ Incl. in Unit Price Incl. in Unit Price 20,000.00$
9.
298 m2 25.00$ 25% $ 6.25 9,320.00$
1 Lump Sum 2,000.00$ 25% $ 500.00 2,500.00$
10.
1 Lump Sum 20,000.00$ 50% $ 10,000.00 30,000.00$
11.
1 Lump Sum 10,000.00$ Incl. in Unit Price Incl. in Unit Price 10,000.00$
1,000,850.00$
4 Each 85,000.00$ 33% $ 28,050.00 452,200.00$
3 Each 60,000.00$ 33% $ 19,800.00 239,400.00$
3 Each 75,000.00$ 33% $ 24,750.00 299,250.00$
Total Cost Estimate
(ii) Reservoir
(iii) Retention Chamber
(ii) Reservoir
(iii) Retention Chamber
11000 Equipment General Requirements
11215 Pumps
Vertical Turbine Pump
Submersible Sump Pump
Centrifuge Pumps
Division 9 - Dry Wall and Painting
09900 Painting and Protective Coatings
All Other Finishes Items
Division 10 - Miscellaneous Specialties
10200 Louvres and Vents
Division 11 - Equipment
Glass-Fused Geodoesic Dome (10 000 m3 x 2)
Accessories and Appurtenances
Division 8 - Metal Doors and Frames
08110 Steel Door Frames
08710 Door Hardware
All Other Doors and Windows Items
All Wood and Plastics Items
Division 7 - Building Specialties
7130 Membrane Waterproofing
7200 Insulation
07610 Preformed Metal Standing Seam Roofing System
7150 Glass-Fused Steel Reservoir (10 000 m3 x 2)
Roof Access Hatch (1000 x 1000mm) - 1
Aluminum Grating (Pumping Station)
Aluminum Handrail (Mezz+Basem't+Bldg)
Aluminum Handrail (Staircase)
All Other Metal Items
Division 6 - Carpentry
5310 Specialty Items
5501 Metal Fabrications - Architectural
Steel Bollards
Staircase (Pumping Station)
5502 Metal Fabrications - Structural
Access Hatch (914 x 914 mm) - 2
4060 Mortar and Masonry Grout
4080 Mansonry Reinforcement and Connectors
4090 Masonry Accessories
4200 Unit Masonry
Division 5 - Metals
5000 Metals General Requirements
3300 Cast in Place Concrete
(i) Pumping Station
3345 Concrete Curing and Finishing
3372 Non-shrink Grout
3375 Concrete Floor Toppings
Division 4 - Masonry
2911 Topsoil and Finish Grading
2936 Landscaping
Division 3 - Concrete
3100 Concrete Forms and Accessories
(i) Pumping Station
3200 Concrete Reinforcement
STM - Landscaping Drainage 450 mm
2701 Aggregates
2721 Granular Base
2723 Granular Sub-Base
2741 Asphalt Paving
2821 Chain Link Fences and Gates
WM - 500mm
WM - 600mm, steel casing
02530 Sewerage Gravity Sanitary Sewer
02630 Storm Sewers
STM - 200 mm
STM - Overflow Outlet 600 mm
2200 Site Preparation
2311 Site Grading
2315 Excavation, Trenching and Backfill (& Disposal)
02362 Dust Control
02380 Erosion and Sediment Control
2511 Watermains
Description
Division 1 - General Requirements (10%)
Division 2 - Site Work
2100 General Allowances (5%)
2140 Dewatering
2150 Shoring Systems
Option 2A - Glass Fused Steel \\thfiler1.mmm.ca\wpdocs$\2017\salem reservoir and pumping station - august 2017\2017-08-22 salem reservoir_cost estimate comparison_technology assessment_mep_oct20_2017.xls
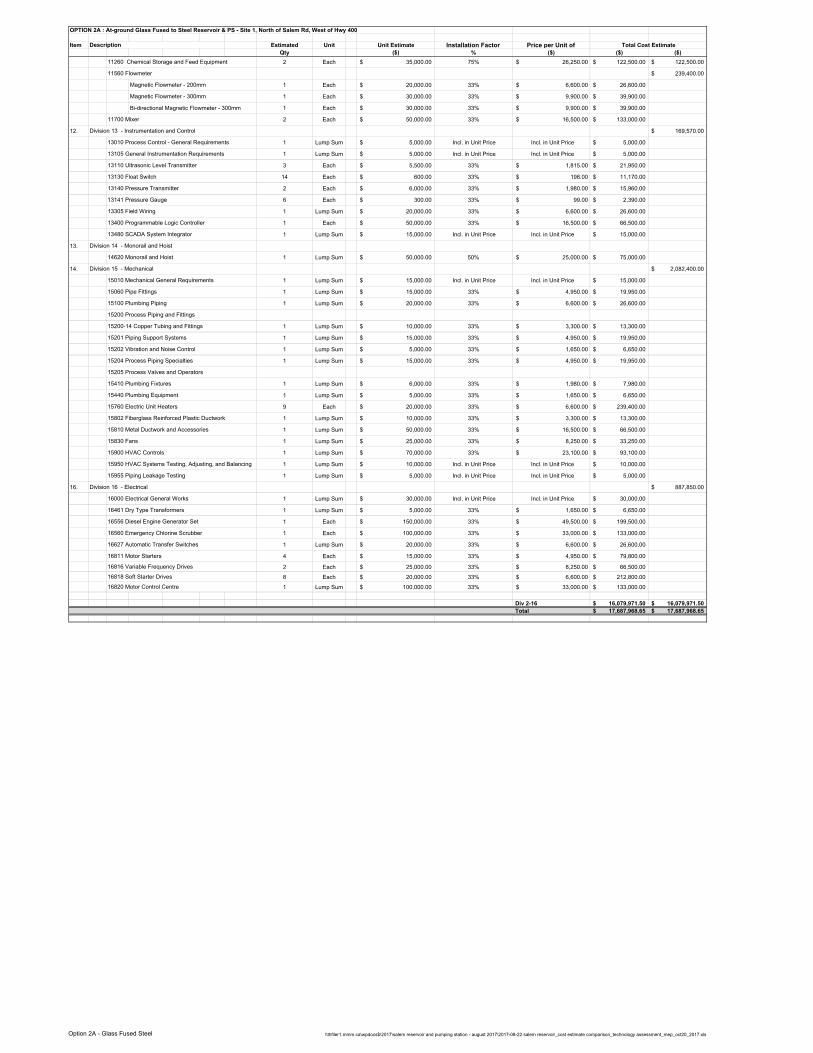
OPTION 2A : At-ground Glass Fused to Steel Reservoir & PS - Site 1, North of Salem Rd, West of Hwy 400
Item Estimated Unit Unit Estimate Installation Factor Price per Unit of Qty ($) % ($) ($) ($)
Total Cost EstimateDescription
2 Each 35,000.00$ 75% $ 26,250.00 122,500.00$ 122,500.00$
239,400.00$
1 Each 20,000.00$ 33% $ 6,600.00 26,600.00$
1 Each 30,000.00$ 33% $ 9,900.00 39,900.00$
Bi-directional Magnetic Flowmeter - 300mm 1 Each 30,000.00$ 33% $ 9,900.00 39,900.00$
2 Each 50,000.00$ 33% $ 16,500.00 133,000.00$
12. 169,570.00$
1 Lump Sum 5,000.00$ Incl. in Unit Price Incl. in Unit Price 5,000.00$
1 Lump Sum 5,000.00$ Incl. in Unit Price Incl. in Unit Price 5,000.00$
3 Each 5,500.00$ 33% $ 1,815.00 21,950.00$
14 Each 600.00$ 33% $ 198.00 11,170.00$
2 Each 6,000.00$ 33% $ 1,980.00 15,960.00$
6 Each 300.00$ 33% $ 99.00 2,390.00$
1 Lump Sum 20,000.00$ 33% $ 6,600.00 26,600.00$
1 Each 50,000.00$ 33% $ 16,500.00 66,500.00$
1 Lump Sum 15,000.00$ Incl. in Unit Price Incl. in Unit Price 15,000.00$
13.
1 Lump Sum 50,000.00$ 50% $ 25,000.00 75,000.00$
14. 2,082,400.00$
1 Lump Sum 15,000.00$ Incl. in Unit Price Incl. in Unit Price 15,000.00$
1 Lump Sum 15,000.00$ 33% $ 4,950.00 19,950.00$
1 Lump Sum 20,000.00$ 33% $ 6,600.00 26,600.00$
1 Lump Sum 10,000.00$ 33% $ 3,300.00 13,300.00$
1 Lump Sum 15,000.00$ 33% $ 4,950.00 19,950.00$
1 Lump Sum 5,000.00$ 33% $ 1,650.00 6,650.00$
1 Lump Sum 15,000.00$ 33% $ 4,950.00 19,950.00$
1 Lump Sum 6,000.00$ 33% $ 1,980.00 7,980.00$
1 Lump Sum 5,000.00$ 33% $ 1,650.00 6,650.00$
9 Each 20,000.00$ 33% $ 6,600.00 239,400.00$
1 Lump Sum 10,000.00$ 33% $ 3,300.00 13,300.00$
1 Lump Sum 50,000.00$ 33% $ 16,500.00 66,500.00$
1 Lump Sum 25,000.00$ 33% $ 8,250.00 33,250.00$
1 Lump Sum 70,000.00$ 33% $ 23,100.00 93,100.00$
1 Lump Sum 10,000.00$ Incl. in Unit Price Incl. in Unit Price 10,000.00$
1 Lump Sum 5,000.00$ Incl. in Unit Price Incl. in Unit Price 5,000.00$
16. 887,850.00$
1 Lump Sum 30,000.00$ Incl. in Unit Price Incl. in Unit Price 30,000.00$
1 Lump Sum 5,000.00$ 33% $ 1,650.00 6,650.00$
1 Each 150,000.00$ 33% $ 49,500.00 199,500.00$
1 Each 100,000.00$ 33% $ 33,000.00 133,000.00$
1 Lump Sum 20,000.00$ 33% $ 6,600.00 26,600.00$
4 Each 15,000.00$ 33% $ 4,950.00 79,800.00$
2 Each 25,000.00$ 33% $ 8,250.00 66,500.00$
8 Each 20,000.00$ 33% $ 6,600.00 212,800.00$
1 Lump Sum 100,000.00$ 33% $ 33,000.00 133,000.00$
Div 2-16 16,079,971.50$ 16,079,971.50$
Total 17,687,968.65$ 17,687,968.65$
11260 Chemical Storage and Feed Equipment
16627 Automatic Transfer Switches
16811 Motor Starters
16816 Variable Frequency Drives
16818 Soft Starter Drives
16820 Motor Control Centre
15955 Piping Leakage Testing
Division 16 - Electrical
16000 Electrical General Works
16461 Dry Type Transformers
16556 Diesel Engine Generator Set
16560 Emergency Chlorine Scrubber
15760 Electric Unit Heaters
15802 Fiberglass Reinforced Plastic Ductwork
15810 Metal Ductwork and Accessories
15830 Fans
15900 HVAC Controls
15950 HVAC Systems Testing, Adjusting, and Balancing
15410 Plumbing Fixtures
15440 Plumbing Equipment
15204 Process Piping Specialties
15205 Process Valves and Operators
15200-14 Copper Tubing and Fittings
15201 Piping Support Systems
15202 Vibration and Noise Control
15100 Plumbing Piping
15200 Process Piping and Fittings
13480 SCADA System Integrator
Division 14 - Monorail and Hoist
14620 Monorail and Hoist
Division 15 - Mechanical
15010 Mechanical General Requirements
15060 Pipe Fittings
13110 Ultrasonic Level Transmitter
13130 Float Switch
13140 Pressure Transmitter
13141 Pressure Gauge
13305 Field Wiring
13400 Programmable Logic Controller
Magnetic Flowmeter - 200mm
Magnetic Flowmeter - 300mm
11700 Mixer
Division 13 - Instrumentation and Control
13010 Process Control - General Requirements
13105 General Instrumentation Requirements
11560 Flowmeter
Option 2A - Glass Fused Steel \\thfiler1.mmm.ca\wpdocs$\2017\salem reservoir and pumping station - august 2017\2017-08-22 salem reservoir_cost estimate comparison_technology assessment_mep_oct20_2017.xls

OPTION 2B : At-ground Glass Fused to Steel Reservoir & PS - Site 2, South of Salem Rd, West of Hwy 400
Item Estimated Unit Unit Estimate Installation Factor Price per Unit of Qty ($) % ($) ($) ($)
1. 1 Lump Sum 1,649,582.15$ Incl. in Unit Price Incl. in Unit Price 1,649,582.15$ 1,649,582.15$
2. 2,959,171.50$
1 Lump Sum 104,521.50$ Incl. in Unit Price Incl. in Unit Price 104,521.50$
1 Lump Sum 50,000.00$ Incl. in Unit Price Incl. in Unit Price 50,000.00$
485 m2 1,200.00$ Incl. in Unit Price Incl. in Unit Price 581,510.00$
1 Lump Sum 15,000.00$ Incl. in Unit Price Incl. in Unit Price 15,000.00$
25000 m2 50.00$ Incl. in Unit Price Incl. in Unit Price 1,250,000.00$
1589 m3 100.00$ Incl. in Unit Price Incl. in Unit Price 158,920.00$
1 Lump Sum 10,000.00$ Incl. in Unit Price Incl. in Unit Price 10,000.00$
1 Lump Sum 25,000.00$ Incl. in Unit Price Incl. in Unit Price 25,000.00$
100 m 1,100.00$ 50% $ 550.00 165,000.00$
48 m 1,500.00$ 50% $ 750.00 108,000.00$
49 m 450.00$ 50% $ 225.00 33,140.00$
135 m 500.00$ 50% $ 250.00 101,480.00$
40 m 500.00$ 50% $ 250.00 30,000.00$
14 m 500.00$ 50% $ 250.00 10,500.00$
1 Lump Sum 20,000.00$ Incl. in Unit Price Incl. in Unit Price 20,000.00$
1 Lump Sum 8,000.00$ Incl. in Unit Price Incl. in Unit Price 8,000.00$
1 Lump Sum 6,000.00$ Incl. in Unit Price Incl. in Unit Price 6,000.00$
80 m3 500.00$ 50% $ 250.00 60,000.00$
553 m 40.00$ Incl. in Unit Price Incl. in Unit Price 22,100.00$
25000 m2 5.00$ Incl. in Unit Price Incl. in Unit Price 125,000.00$
1 Lump Sum 75,000.00$ Incl. in Unit Price Incl. in Unit Price 75,000.00$
3. 2,504,590.00$
1,810 m2 250.00$ Incl. in Unit Price Incl. in Unit Price 452,590.00$
1 Lump Sum -$ Incl. in Unit Price Incl. in Unit Price -$
1673 m3 1,200.00$ Incl. in Unit Price Incl. in Unit Price 2,007,000.00$
1 Lump Sum 25,000.00$ Incl. in Unit Price Incl. in Unit Price 25,000.00$
1 Lump Sum 10,000.00$ Incl. in Unit Price Incl. in Unit Price 10,000.00$
1 Lump Sum 10,000.00$ Incl. in Unit Price Incl. in Unit Price 10,000.00$
4. 156,660.00$
298 m2 25.00$ Incl. in Unit Price Incl. in Unit Price 7,460.00$
298 m2 50.00$ Incl. in Unit Price Incl. in Unit Price 14,920.00$
298 m2 200.00$ Incl. in Unit Price Incl. in Unit Price 59,680.00$
298 m2 250.00$ Incl. in Unit Price Incl. in Unit Price 74,600.00$
5. 145,920.00$
1 Lump Sum 5,000.00$ 33% $ 1,650.00 6,650.00$
1 Lump Sum 5,000.00$ 33% $ 1,650.00 6,650.00$
4 ea 100.00$ 33% $ 33.00 530.00$
1 Lump Sum 25,000.00$ 33% $ 8,250.00 33,250.00$
2 ea 15,000.00$ 33% $ 4,950.00 39,900.00$
1 ea 15,000.00$ 33% $ 4,950.00 19,950.00$
8 m2 600.00$ 33% $ 198.00 6,480.00$
55 m 200.00$ 33% $ 66.00 14,710.00$
17 m 200.00$ 33% $ 66.00 4,500.00$
1 Lump Sum 10,000.00$ 33% $ 3,300.00 13,300.00$
6. 6,226,910.00$
1 Lump Sum 10,000.00$ 33% $ 3,300.00 13,300.00$
7.
277 m2 5.00$ 33% $ 1.65 1,840.00$
1 Lump Sum 10,000.00$ 33% $ 3,300.00 13,300.00$
1 Lump Sum 30,000.00$ 33% $ 9,900.00 39,900.00$
20000 m3 165.00$ 50% $ 82.50 4,950,000.00$
1 Lump Sum 742,500.00$ 50% $ 371,250.00 1,113,750.00$
8.
8 ea 3,000.00$ 25% $ 750.00 30,000.00$
1 Lump Sum 3,000.00$ Incl. in Unit Price Incl. in Unit Price 3,000.00$
1 Lump Sum 20,000.00$ Incl. in Unit Price Incl. in Unit Price 20,000.00$
9.
298 m2 25.00$ 25% $ 6.25 9,320.00$
1 Lump Sum 2,000.00$ 25% $ 500.00 2,500.00$
(ii) Reservoir
(iii) Retention Chamber
(ii) Reservoir
(iii) Retention Chamber
Total Cost Estimate
WM - 600mm, steel casing
WM - 500mm
All Wood and Plastics Items
All Other Metal Items
Aluminum Handrail (Staircase)
Aluminum Handrail (Mezz+Basem't+Bldg)
Aluminum Grating (Pumping Station)
Roof Access Hatch (1000 x 1000mm) - 1
Access Hatch (914 x 914 mm) - 2
5000 Metals General Requirements
5310 Specialty Items
5501 Metal Fabrications - Architectural
5502 Metal Fabrications - Structural
STM - Landscaping Drainage 450 mm
STM - Overflow Outlet 600 mm
08710 Door Hardware
Division 9 - Dry Wall and Painting
09900 Painting and Protective Coatings
All Other Finishes Items
All Other Doors and Windows Items
7130 Membrane Waterproofing
7200 Insulation
07610 Preformed Metal Standing Seam Roofing System
7150 Glass-Fused Steel Reservoir (10 000 m3 x 2)
Division 8 - Metal Doors and Frames
08110 Steel Door Frames
Accessories and Appurtenances
Glass-Fused + Geodoesic Dome (10 000 m3 x 2)
Division 6 - Carpentry
Division 7 - Building Specialties
Steel Bollards
Staircase (Pumping Station)
Division 4 - Masonry
4060 Mortar and Masonry Grout
4080 Mansonry Reinforcement and Connectors
4090 Masonry Accessories
4200 Unit Masonry
Division 5 - Metals
3200 Concrete Reinforcement
3300 Cast in Place Concrete
(i) Pumping Station
3345 Concrete Curing and Finishing
3372 Non-shrink Grout
3375 Concrete Floor Toppings
2821 Chain Link Fences and Gates
2911 Topsoil and Finish Grading
2936 Landscaping
Division 3 - Concrete
3100 Concrete Forms and Accessories
(i) Pumping Station
02530 Sewerage Gravity Sanitary Sewer
02630 Storm Sewers
2701 Aggregates
2721 Granular Base
2723 Granular Sub-Base
2741 Asphalt Paving
STM - 200 mm
2200 Site Preparation
2311 Site Grading
2315 Excavation, Trenching and Backfill (& Disposal)
02362 Dust Control
2511 Watermains
02380 Erosion and Sediment Control
Description
Division 1 - General Requirements (10%)
Division 2 - Site Work
2100 General Allowances (5%)
2140 Dewatering
2150 Shoring Systems
Option 2B - Glass Fused Steel c:\users\whittakerd\documents\projects\salem reservoir and pumping station\revisions - august 2017\2017-08-22 salem reservoir_cost estimate comparison_technology assessment.xls

OPTION 2B : At-ground Glass Fused to Steel Reservoir & PS - Site 2, South of Salem Rd, West of Hwy 400
Item Estimated Unit Unit Estimate Installation Factor Price per Unit of Qty ($) % ($) ($) ($)
Total Cost EstimateDescription
10.
1 Lump Sum 20,000.00$ 50% $ 10,000.00 30,000.00$
11.
1 Lump Sum 10,000.00$ Incl. in Unit Price Incl. in Unit Price 10,000.00$
1,000,850.00$
4 Each 85,000.00$ 33% $ 28,050.00 452,200.00$
3 Each 60,000.00$ 33% $ 19,800.00 239,400.00$
3 Each 75,000.00$ 33% $ 24,750.00 299,250.00$
2 Each 35,000.00$ 75% $ 26,250.00 122,500.00$ 122,500.00$
239,400.00$
1 Each 20,000.00$ 33% $ 6,600.00 26,600.00$
1 Each 30,000.00$ 33% $ 9,900.00 39,900.00$
Bi-directional Magnetic Flowmeter - 300mm 1 Each 30,000.00$ 33% $ 9,900.00 39,900.00$
2 Each 50,000.00$ 33% $ 16,500.00 133,000.00$
12. 169,570.00$
1 Lump Sum 5,000.00$ Incl. in Unit Price Incl. in Unit Price 5,000.00$
1 Lump Sum 5,000.00$ Incl. in Unit Price Incl. in Unit Price 5,000.00$
3 Each 5,500.00$ 33% $ 1,815.00 21,950.00$
14 Each 600.00$ 33% $ 198.00 11,170.00$
2 Each 6,000.00$ 33% $ 1,980.00 15,960.00$
6 Each 300.00$ 33% $ 99.00 2,390.00$
1 Lump Sum 20,000.00$ 33% $ 6,600.00 26,600.00$
1 Each 50,000.00$ 33% $ 16,500.00 66,500.00$
1 Lump Sum 15,000.00$ Incl. in Unit Price Incl. in Unit Price 15,000.00$
13.
1 Lump Sum 50,000.00$ 50% $ 25,000.00 75,000.00$
14. 2,082,400.00$
1 Lump Sum 15,000.00$ Incl. in Unit Price Incl. in Unit Price 15,000.00$
1 Lump Sum 15,000.00$ 33% $ 4,950.00 19,950.00$
1 Lump Sum 20,000.00$ 33% $ 6,600.00 26,600.00$
1 Lump Sum 10,000.00$ 33% $ 3,300.00 13,300.00$
1 Lump Sum 15,000.00$ 33% $ 4,950.00 19,950.00$
1 Lump Sum 5,000.00$ 33% $ 1,650.00 6,650.00$
1 Lump Sum 15,000.00$ 33% $ 4,950.00 19,950.00$
1 Lump Sum 6,000.00$ 33% $ 1,980.00 7,980.00$
1 Lump Sum 5,000.00$ 33% $ 1,650.00 6,650.00$
9 Each 20,000.00$ 33% $ 6,600.00 239,400.00$
1 Lump Sum 10,000.00$ 33% $ 3,300.00 13,300.00$
1 Lump Sum 50,000.00$ 33% $ 16,500.00 66,500.00$
1 Lump Sum 25,000.00$ 33% $ 8,250.00 33,250.00$
1 Lump Sum 70,000.00$ 33% $ 23,100.00 93,100.00$
1 Lump Sum 10,000.00$ Incl. in Unit Price Incl. in Unit Price 10,000.00$
1 Lump Sum 5,000.00$ Incl. in Unit Price Incl. in Unit Price 5,000.00$
16. 887,850.00$
1 Lump Sum 30,000.00$ Incl. in Unit Price Incl. in Unit Price 30,000.00$
1 Lump Sum 5,000.00$ 33% $ 1,650.00 6,650.00$
1 Each 150,000.00$ 33% $ 49,500.00 199,500.00$
1 Each 100,000.00$ 33% $ 33,000.00 133,000.00$
1 Lump Sum 20,000.00$ 33% $ 6,600.00 26,600.00$
4 Each 15,000.00$ 33% $ 4,950.00 79,800.00$
2 Each 25,000.00$ 33% $ 8,250.00 66,500.00$
8 Each 20,000.00$ 33% $ 6,600.00 212,800.00$
1 Lump Sum 100,000.00$ 33% $ 33,000.00 133,000.00$
Div 2-16 16,495,821.50$ 16,495,821.50$
Total 18,145,403.65$ 18,145,403.65$
11260 Chemical Storage and Feed Equipment
16816 Variable Frequency Drives
16818 Soft Starter Drives
16820 Motor Control Centre
16461 Dry Type Transformers
16556 Diesel Engine Generator Set
16560 Emergency Chlorine Scrubber
16627 Automatic Transfer Switches
Magnetic Flowmeter - 300mm
Magnetic Flowmeter - 200mm
16000 Electrical General Works
15204 Process Piping Specialties
15205 Process Valves and Operators
15410 Plumbing Fixtures
15440 Plumbing Equipment
16811 Motor Starters
15810 Metal Ductwork and Accessories
15830 Fans
15900 HVAC Controls
15950 HVAC Systems Testing, Adjusting, and Balancing
15955 Piping Leakage Testing
Division 16 - Electrical
15760 Electric Unit Heaters
15802 Fiberglass Reinforced Plastic Ductwork
15060 Pipe Fittings
15100 Plumbing Piping
15200 Process Piping and Fittings
15200-14 Copper Tubing and Fittings
15201 Piping Support Systems
15202 Vibration and Noise Control
13400 Programmable Logic Controller
13480 SCADA System Integrator
Division 14 - Monorail and Hoist
14620 Monorail and Hoist
Division 15 - Mechanical
15010 Mechanical General Requirements
13105 General Instrumentation Requirements
13110 Ultrasonic Level Transmitter
13130 Float Switch
13140 Pressure Transmitter
13141 Pressure Gauge
13305 Field Wiring
Division 11 - Equipment
11000 Equipment General Requirements
11215 Pumps
11560 Flowmeter
Division 13 - Instrumentation and Control
13010 Process Control - General Requirements
Centrifuge Pumps
Submersible Sump Pump
Vertical Turbine Pump
11700 Mixer
Division 10 - Miscellaneous Specialties
10200 Louvres and Vents
Option 2B - Glass Fused Steel c:\users\whittakerd\documents\projects\salem reservoir and pumping station\revisions - august 2017\2017-08-22 salem reservoir_cost estimate comparison_technology assessment.xls

OPTION 3A: At-ground Pre-Cast/Pre-Stressed Concrete Reservoir & PS - Site 1, North of Salem Rd, West of Hwy 400
Item Estimated Unit Unit Estimate Installation Factor Price per Unit of Qty ($) % ($) ($) ($)
1. 1 Lump Sum 1,895,507.15$ Incl. in Unit Price Incl. in Unit Price 1,895,507.15$ 1,895,507.15$
2. 2,658,421.50$
1 Lump Sum 88,521.50$ Incl. in Unit Price Incl. in Unit Price 88,521.50$
1 Lump Sum 50,000.00$ Incl. in Unit Price Incl. in Unit Price 50,000.00$
485 m2 1,200.00$ Incl. in Unit Price Incl. in Unit Price 581,510.00$
1 Lump Sum 10,000.00$ Incl. in Unit Price Incl. in Unit Price 10,000.00$
19000 m2 50.00$ Incl. in Unit Price Incl. in Unit Price 950,000.00$
1589 m3 100.00$ Incl. in Unit Price Incl. in Unit Price 158,920.00$
1 Lump Sum 10,000.00$ Incl. in Unit Price Incl. in Unit Price 10,000.00$
1 Lump Sum 10,000.00$ Incl. in Unit Price Incl. in Unit Price 10,000.00$
150 m 1,100.00$ 50% $ 550.00 247,500.00$
60 m 1,500.00$ 50% $ 750.00 135,000.00$
49 m 450.00$ 50% $ 225.00 33,140.00$
135 m 500.00$ 50% $ 250.00 101,480.00$
40 m 500.00$ 50% $ 250.00 30,000.00$
14 m 500.00$ 50% $ 250.00 10,500.00$
1 Lump Sum 20,000.00$ Incl. in Unit Price Incl. in Unit Price 20,000.00$
1 Lump Sum 8,000.00$ Incl. in Unit Price Incl. in Unit Price 8,000.00$
1 Lump Sum 6,000.00$ Incl. in Unit Price Incl. in Unit Price 6,000.00$
81 m3 500.00$ 50% $ 250.00 60,750.00$
553 m 40.00$ Incl. in Unit Price Incl. in Unit Price 22,100.00$
19000 m2 5.00$ Incl. in Unit Price Incl. in Unit Price 95,000.00$
1 Lump Sum 30,000.00$ Incl. in Unit Price Incl. in Unit Price 30,000.00$
3. 2,839,090.00$
1,810 m2 250.00$ Incl. in Unit Price Incl. in Unit Price 452,590.00$
1 Lump Sum -$ Incl. in Unit Price Incl. in Unit Price -$
1673 m3 1,400.00$ Incl. in Unit Price Incl. in Unit Price 2,341,500.00$
1 Lump Sum 25,000.00$ Incl. in Unit Price Incl. in Unit Price 25,000.00$
1 Lump Sum 10,000.00$ Incl. in Unit Price Incl. in Unit Price 10,000.00$
1 Lump Sum 10,000.00$ Incl. in Unit Price Incl. in Unit Price 10,000.00$
8,489,250.00$
1 Lump Sum 3,920,000.00$ 65% $ 2,548,000.00 6,468,000.00$
1 Lump Sum 1,617,000.00$ 25% $ 404,250.00 2,021,250.00$
4. 156,660.00$
298 m2 25.00$ Incl. in Unit Price Incl. in Unit Price 7,460.00$
298 m2 50.00$ Incl. in Unit Price Incl. in Unit Price 14,920.00$
298 m2 200.00$ Incl. in Unit Price Incl. in Unit Price 59,680.00$
298 m2 250.00$ Incl. in Unit Price Incl. in Unit Price 74,600.00$
5. 145,920.00$
1 Lump Sum 5,000.00$ 33% $ 1,650.00 6,650.00$
1 Lump Sum 5,000.00$ 33% $ 1,650.00 6,650.00$
4 ea 100.00$ 33% $ 33.00 530.00$
1 Lump Sum 25,000.00$ 33% $ 8,250.00 33,250.00$
2 ea 15,000.00$ 33% $ 4,950.00 39,900.00$
1 ea 15,000.00$ 33% $ 4,950.00 19,950.00$
8 m2 600.00$ 33% $ 198.00 6,480.00$
55 m 200.00$ 33% $ 66.00 14,710.00$
17 m 200.00$ 33% $ 66.00 4,500.00$
1 Lump Sum 10,000.00$ 33% $ 3,300.00 13,300.00$
6. Includes Div6+7+8+9+10 163,160.00$
1 Lump Sum 10,000.00$ 33% $ 3,300.00 13,300.00$
7.
277 m2 5.00$ 33% $ 1.65 1,840.00$
1 Lump Sum 10,000.00$ 33% $ 3,300.00 13,300.00$
1 Lump Sum 30,000.00$ 33% $ 9,900.00 39,900.00$
8.
8 ea 3,000.00$ 25% $ 750.00 30,000.00$
1 Lump Sum 3,000.00$ Incl. in Unit Price Incl. in Unit Price 3,000.00$
1 Lump Sum 20,000.00$ Incl. in Unit Price Incl. in Unit Price 20,000.00$
9.
298 m2 25.00$ 25% $ 6.25 9,320.00$
1 Lump Sum 2,000.00$ 25% $ 500.00 2,500.00$
Total Cost Estimate
Division 9 - Dry Wall and Painting
09900 Painting and Protective Coatings
All Other Finishes Items
7200 Insulation
07610 Preformed Metal Standing Seam Roofing System
Division 8 - Metal Doors and Frames
08110 Steel Door Frames
08710 Door Hardware
All Other Doors and Windows Items
Aluminum Handrail (Staircase)
All Other Metal Items
Division 6 - Carpentry
All Wood and Plastics Items
Division 7 - Building Specialties
7130 Membrane Waterproofing
Staircase (Pumping Station)
5502 Metal Fabrications - Structural
Access Hatch (914 x 914 mm) - 2
Roof Access Hatch (1000 x 1000mm) - 1
Aluminum Grating (Pumping Station)
Aluminum Handrail (Mezz+Basem't+Bldg)
4200 Unit Masonry
Division 5 - Metals
5000 Metals General Requirements
5310 Specialty Items
5501 Metal Fabrications - Architectural
Steel Bollards
10ML x 2 Pre-Stressed Conc. Reservoir
Accessories and Appurtenances
Division 4 - Masonry
4060 Mortar and Masonry Grout
4080 Mansonry Reinforcement and Connectors
4090 Masonry Accessories
3300 Cast in Place Concrete
(i) Pumping Station
3345 Concrete Curing and Finishing
3372 Non-shrink Grout
3375 Concrete Floor Toppings
3380 Pre-Stressed Conc. Reservoir (34m x 11m)
(ii) Reservoir
(iii) Retention Chamber
2911 Topsoil and Finish Grading
2936 Landscaping
Division 3 - Concrete
3100 Concrete Forms and Accessories
(i) Pumping Station
3200 Concrete Reinforcement
(ii) Reservoir
(iii) Retention Chamber
STM - Landscaping Drainage 450 mm
2701 Aggregates
2721 Granular Base
2723 Granular Sub-Base
2741 Asphalt Paving
2821 Chain Link Fences and Gates
WM - 500mm
WM - 600mm, steel casing
02530 Sewerage Gravity Sanitary Sewer
02630 Storm Sewers
STM - 200 mm
STM - Overflow Outlet 600 mm
2200 Site Preparation
2311 Site Grading
2315 Excavation, Trenching and Backfill (& Disposal)
02362 Dust Control
02380 Erosion and Sediment Control
2511 Watermains
Description
Division 1 - General Requirements (10%)
Division 2 - Site Work
2100 General Allowances (5%)
2140 Dewatering
2150 Shoring Systems
Option 3A - Pre-Stressed Conc c:\users\whittakerd\documents\projects\salem reservoir and pumping station\revisions - august 2017\2017-08-22 salem reservoir_cost estimate comparison_technology assessment.xls

OPTION 3A: At-ground Pre-Cast/Pre-Stressed Concrete Reservoir & PS - Site 1, North of Salem Rd, West of Hwy 400
Item Estimated Unit Unit Estimate Installation Factor Price per Unit of Qty ($) % ($) ($) ($)
Total Cost EstimateDescription
10.
1 Lump Sum 20,000.00$ 50% $ 10,000.00 30,000.00$
11.
1 Lump Sum 10,000.00$ Incl. in Unit Price Incl. in Unit Price 10,000.00$
1,000,850.00$
4 Each 85,000.00$ 33% $ 28,050.00 452,200.00$
3 Each 60,000.00$ 33% $ 19,800.00 239,400.00$
3 Each 75,000.00$ 33% $ 24,750.00 299,250.00$
2 Each 35,000.00$ 75% $ 26,250.00 122,500.00$ 122,500.00$
239,400.00$
1 Each 20,000.00$ 33% $ 6,600.00 26,600.00$
1 Each 30,000.00$ 33% $ 9,900.00 39,900.00$
Bi-directional Magnetic Flowmeter - 300mm 1 Each 30,000.00$ 33% $ 9,900.00 39,900.00$
2 Each 50,000.00$ 33% $ 16,500.00 133,000.00$
12. 169,570.00$
1 Lump Sum 5,000.00$ Incl. in Unit Price Incl. in Unit Price 5,000.00$
1 Lump Sum 5,000.00$ Incl. in Unit Price Incl. in Unit Price 5,000.00$
3 Each 5,500.00$ 33% $ 1,815.00 21,950.00$
14 Each 600.00$ 33% $ 198.00 11,170.00$
2 Each 6,000.00$ 33% $ 1,980.00 15,960.00$
6 Each 300.00$ 33% $ 99.00 2,390.00$
1 Lump Sum 20,000.00$ 33% $ 6,600.00 26,600.00$
1 Each 50,000.00$ 33% $ 16,500.00 66,500.00$
1 Lump Sum 15,000.00$ Incl. in Unit Price Incl. in Unit Price 15,000.00$
13.
1 Lump Sum 50,000.00$ 50% $ 25,000.00 75,000.00$
14. 2,082,400.00$
1 Lump Sum 15,000.00$ Incl. in Unit Price Incl. in Unit Price 15,000.00$
1 Lump Sum 15,000.00$ 33% $ 4,950.00 19,950.00$
1 Lump Sum 20,000.00$ 33% $ 6,600.00 26,600.00$
1 Lump Sum 10,000.00$ 33% $ 3,300.00 13,300.00$
1 Lump Sum 15,000.00$ 33% $ 4,950.00 19,950.00$
1 Lump Sum 5,000.00$ 33% $ 1,650.00 6,650.00$
1 Lump Sum 15,000.00$ 33% $ 4,950.00 19,950.00$
1 Lump Sum 6,000.00$ 33% $ 1,980.00 7,980.00$
1 Lump Sum 5,000.00$ 33% $ 1,650.00 6,650.00$
9 Each 20,000.00$ 33% $ 6,600.00 239,400.00$
1 Lump Sum 10,000.00$ 33% $ 3,300.00 13,300.00$
1 Lump Sum 50,000.00$ 33% $ 16,500.00 66,500.00$
1 Lump Sum 25,000.00$ 33% $ 8,250.00 33,250.00$
1 Lump Sum 70,000.00$ 33% $ 23,100.00 93,100.00$
1 Lump Sum 10,000.00$ Incl. in Unit Price Incl. in Unit Price 10,000.00$
1 Lump Sum 5,000.00$ Incl. in Unit Price Incl. in Unit Price 5,000.00$
16. 887,850.00$
1 Lump Sum 30,000.00$ Incl. in Unit Price Incl. in Unit Price 30,000.00$
1 Lump Sum 5,000.00$ 33% $ 1,650.00 6,650.00$
1 Each 150,000.00$ 33% $ 49,500.00 199,500.00$
1 Each 100,000.00$ 33% $ 33,000.00 133,000.00$
1 Lump Sum 20,000.00$ 33% $ 6,600.00 26,600.00$
4 Each 15,000.00$ 33% $ 4,950.00 79,800.00$
2 Each 25,000.00$ 33% $ 8,250.00 66,500.00$
8 Each 20,000.00$ 33% $ 6,600.00 212,800.00$
1 Lump Sum 100,000.00$ 33% $ 33,000.00 133,000.00$
Div 2-16 18,955,071.50$ 18,955,071.50$
Total 20,850,578.65$ 20,850,578.65$
16627 Automatic Transfer Switches
16811 Motor Starters
16816 Variable Frequency Drives
16818 Soft Starter Drives
16820 Motor Control Centre
15955 Piping Leakage Testing
Division 16 - Electrical
16000 Electrical General Works
16461 Dry Type Transformers
16556 Diesel Engine Generator Set
16560 Emergency Chlorine Scrubber
15760 Electric Unit Heaters
15802 Fiberglass Reinforced Plastic Ductwork
15810 Metal Ductwork and Accessories
15830 Fans
15900 HVAC Controls
15950 HVAC Systems Testing, Adjusting, and Balancing
15410 Plumbing Fixtures
15440 Plumbing Equipment
15204 Process Piping Specialties
15205 Process Valves and Operators
15200-14 Copper Tubing and Fittings
15201 Piping Support Systems
15202 Vibration and Noise Control
15100 Plumbing Piping
15200 Process Piping and Fittings
13480 SCADA System Integrator
Division 14 - Monorail and Hoist
14620 Monorail and Hoist
Division 15 - Mechanical
15010 Mechanical General Requirements
15060 Pipe Fittings
13110 Ultrasonic Level Transmitter
13130 Float Switch
13140 Pressure Transmitter
13141 Pressure Gauge
13305 Field Wiring
13400 Programmable Logic Controller
Magnetic Flowmeter - 200mm
Magnetic Flowmeter - 300mm
11700 Mixer
Division 13 - Instrumentation and Control
13010 Process Control - General Requirements
13105 General Instrumentation Requirements
11000 Equipment General Requirements
11215 Pumps
Vertical Turbine Pump
Submersible Sump Pump
Centrifuge Pumps
11560 Flowmeter
11260 Chemical Storage and Feed Equipment
Division 10 - Miscellaneous Specialties
10200 Louvres and Vents
Division 11 - Equipment
Option 3A - Pre-Stressed Conc c:\users\whittakerd\documents\projects\salem reservoir and pumping station\revisions - august 2017\2017-08-22 salem reservoir_cost estimate comparison_technology assessment.xls

OPTION 3B: At-ground Pre-Cast/Pre-Stressed Concrete Reservoir & PS - Site 2, South of Salem Rd, West of Hwy 400
Item Estimated Unit Unit Estimate Installation Factor Price per Unit of Qty ($) % ($) ($) ($)
1. 1 Lump Sum 1,925,057.15$ Incl. in Unit Price Incl. in Unit Price 1,925,057.15$ 1,925,057.15$
2. 2,953,921.50$
1 Lump Sum 104,271.50$ Incl. in Unit Price Incl. in Unit Price 104,271.50$
1 Lump Sum 50,000.00$ Incl. in Unit Price Incl. in Unit Price 50,000.00$
485 m2 1,200.00$ Incl. in Unit Price Incl. in Unit Price 581,510.00$
1 Lump Sum 10,000.00$ Incl. in Unit Price Incl. in Unit Price 10,000.00$
25000 m2 50.00$ Incl. in Unit Price Incl. in Unit Price 1,250,000.00$
1589 m3 100.00$ Incl. in Unit Price Incl. in Unit Price 158,920.00$
1 Lump Sum 10,000.00$ Incl. in Unit Price Incl. in Unit Price 10,000.00$
1 Lump Sum 25,000.00$ Incl. in Unit Price Incl. in Unit Price 25,000.00$
100 m 1,100.00$ 50% $ 550.00 165,000.00$
48 m 1,500.00$ 50% $ 750.00 108,000.00$
49 m 450.00$ 50% $ 225.00 33,140.00$
135 m 500.00$ 50% $ 250.00 101,480.00$
40 m 500.00$ 50% $ 250.00 30,000.00$
14 m 500.00$ 50% $ 250.00 10,500.00$
1 Lump Sum 20,000.00$ Incl. in Unit Price Incl. in Unit Price 20,000.00$
1 Lump Sum 8,000.00$ Incl. in Unit Price Incl. in Unit Price 8,000.00$
1 Lump Sum 6,000.00$ Incl. in Unit Price Incl. in Unit Price 6,000.00$
80 m3 500.00$ 50% $ 250.00 60,000.00$
553 m 40.00$ Incl. in Unit Price Incl. in Unit Price 22,100.00$
25000 m2 5.00$ Incl. in Unit Price Incl. in Unit Price 125,000.00$
1 Lump Sum 75,000.00$ Incl. in Unit Price Incl. in Unit Price 75,000.00$
3. 2,839,090.00$
1,810 m2 250.00$ Incl. in Unit Price Incl. in Unit Price 452,590.00$
1 Lump Sum -$ Incl. in Unit Price Incl. in Unit Price -$
1673 m3 1,400.00$ Incl. in Unit Price Incl. in Unit Price 2,341,500.00$
1 Lump Sum 25,000.00$ Incl. in Unit Price Incl. in Unit Price 25,000.00$
1 Lump Sum 10,000.00$ Incl. in Unit Price Incl. in Unit Price 10,000.00$
1 Lump Sum 10,000.00$ Incl. in Unit Price Incl. in Unit Price 10,000.00$
8,489,250.00$
1 Lump Sum 3,920,000.00$ 65% $ 2,548,000.00 6,468,000.00$
1 Lump Sum 1,617,000.00$ 25% $ 404,250.00 2,021,250.00$
4. 156,660.00$
298 m2 25.00$ Incl. in Unit Price Incl. in Unit Price 7,460.00$
298 m2 50.00$ Incl. in Unit Price Incl. in Unit Price 14,920.00$
298 m2 200.00$ Incl. in Unit Price Incl. in Unit Price 59,680.00$
298 m2 250.00$ Incl. in Unit Price Incl. in Unit Price 74,600.00$
5. 145,920.00$
1 Lump Sum 5,000.00$ 33% $ 1,650.00 6,650.00$
1 Lump Sum 5,000.00$ 33% $ 1,650.00 6,650.00$
4 ea 100.00$ 33% $ 33.00 530.00$
1 Lump Sum 25,000.00$ 33% $ 8,250.00 33,250.00$
2 ea 15,000.00$ 33% $ 4,950.00 39,900.00$
1 ea 15,000.00$ 33% $ 4,950.00 19,950.00$
8 m2 600.00$ 33% $ 198.00 6,480.00$
55 m 200.00$ 33% $ 66.00 14,710.00$
17 m 200.00$ 33% $ 66.00 4,500.00$
1 Lump Sum 10,000.00$ 33% $ 3,300.00 13,300.00$
6. 163,160.00$
1 Lump Sum 10,000.00$ 33% $ 3,300.00 13,300.00$
7.
277 m2 5.00$ 33% $ 1.65 1,840.00$
1 Lump Sum 10,000.00$ 33% $ 3,300.00 13,300.00$
1 Lump Sum 30,000.00$ 33% $ 9,900.00 39,900.00$
8.
8 ea 3,000.00$ 25% $ 750.00 30,000.00$
1 Lump Sum 3,000.00$ Incl. in Unit Price Incl. in Unit Price 3,000.00$
1 Lump Sum 20,000.00$ Incl. in Unit Price Incl. in Unit Price 20,000.00$
9.
298 m2 25.00$ 25% $ 6.25 9,320.00$
1 Lump Sum 2,000.00$ 25% $ 500.00 2,500.00$
Total Cost Estimate
08110 Steel Door Frames
08710 Door Hardware
All Other Doors and Windows Items
Division 9 - Dry Wall and Painting
09900 Painting and Protective Coatings
All Other Finishes Items
All Wood and Plastics Items
Division 7 - Building Specialties
7130 Membrane Waterproofing
7200 Insulation
07610 Preformed Metal Standing Seam Roofing System
Division 8 - Metal Doors and Frames
Roof Access Hatch (1000 x 1000mm) - 1
Aluminum Grating (Pumping Station)
Aluminum Handrail (Mezz+Basem't+Bldg)
Aluminum Handrail (Staircase)
All Other Metal Items
Division 6 - Carpentry
5310 Specialty Items
5501 Metal Fabrications - Architectural
Steel Bollards
Staircase (Pumping Station)
5502 Metal Fabrications - Structural
Access Hatch (914 x 914 mm) - 2
4060 Mortar and Masonry Grout
4080 Mansonry Reinforcement and Connectors
4090 Masonry Accessories
4200 Unit Masonry
Division 5 - Metals
5000 Metals General Requirements
(i) Pumping Station
3345 Concrete Curing and Finishing
3372 Non-shrink Grout
3375 Concrete Floor Toppings
3380 Pre-Stressed Conc. Reservoir (34m x 11m)
Division 4 - Masonry
10ML x 2 Pre-Stressed Conc. Reservoir
Accessories and Appurtenances
(ii) Reservoir
(iii) Retention Chamber
2936 Landscaping
Division 3 - Concrete
3100 Concrete Forms and Accessories
(i) Pumping Station
3200 Concrete Reinforcement
3300 Cast in Place Concrete
(ii) Reservoir
(iii) Retention Chamber
2701 Aggregates
2721 Granular Base
2723 Granular Sub-Base
2741 Asphalt Paving
2821 Chain Link Fences and Gates
2911 Topsoil and Finish Grading
WM - 600mm, steel casing
02530 Sewerage Gravity Sanitary Sewer
02630 Storm Sewers
STM - 200 mm
STM - Overflow Outlet 600 mm
STM - Landscaping Drainage 450 mm
2311 Site Grading
2315 Excavation, Trenching and Backfill (& Disposal)
02362 Dust Control
02380 Erosion and Sediment Control
2511 Watermains
WM - 500mm
2200 Site Preparation
Description
Division 1 - General Requirements (10%)
Division 2 - Site Work
2100 General Allowances (5%)
2140 Dewatering
2150 Shoring Systems
Option 3B - Pre-Stressed Conc c:\users\whittakerd\documents\projects\salem reservoir and pumping station\revisions - august 2017\2017-08-22 salem reservoir_cost estimate comparison_technology assessment.xls

OPTION 3B: At-ground Pre-Cast/Pre-Stressed Concrete Reservoir & PS - Site 2, South of Salem Rd, West of Hwy 400
Item Estimated Unit Unit Estimate Installation Factor Price per Unit of Qty ($) % ($) ($) ($)
Total Cost EstimateDescription
10.
1 Lump Sum 20,000.00$ 50% $ 10,000.00 30,000.00$
11.
1 Lump Sum 10,000.00$ Incl. in Unit Price Incl. in Unit Price 10,000.00$
1,000,850.00$
4 Each 85,000.00$ 33% $ 28,050.00 452,200.00$
3 Each 60,000.00$ 33% $ 19,800.00 239,400.00$
3 Each 75,000.00$ 33% $ 24,750.00 299,250.00$
2 Each 35,000.00$ 75% $ 26,250.00 122,500.00$ 122,500.00$
239,400.00$
1 Each 20,000.00$ 33% $ 6,600.00 26,600.00$
1 Each 30,000.00$ 33% $ 9,900.00 39,900.00$
Bi-directional Magnetic Flowmeter - 300mm 1 Each 30,000.00$ 33% $ 9,900.00 39,900.00$
2 Each 50,000.00$ 33% $ 16,500.00 133,000.00$
12. 169,570.00$
1 Lump Sum 5,000.00$ Incl. in Unit Price Incl. in Unit Price 5,000.00$
1 Lump Sum 5,000.00$ Incl. in Unit Price Incl. in Unit Price 5,000.00$
3 Each 5,500.00$ 33% $ 1,815.00 21,950.00$
14 Each 600.00$ 33% $ 198.00 11,170.00$
2 Each 6,000.00$ 33% $ 1,980.00 15,960.00$
6 Each 300.00$ 33% $ 99.00 2,390.00$
1 Lump Sum 20,000.00$ 33% $ 6,600.00 26,600.00$
1 Each 50,000.00$ 33% $ 16,500.00 66,500.00$
1 Lump Sum 15,000.00$ Incl. in Unit Price Incl. in Unit Price 15,000.00$
13.
1 Lump Sum 50,000.00$ 50% $ 25,000.00 75,000.00$
14. 2,082,400.00$
1 Lump Sum 15,000.00$ Incl. in Unit Price Incl. in Unit Price 15,000.00$
1 Lump Sum 15,000.00$ 33% $ 4,950.00 19,950.00$
1 Lump Sum 20,000.00$ 33% $ 6,600.00 26,600.00$
1 Lump Sum 10,000.00$ 33% $ 3,300.00 13,300.00$
1 Lump Sum 15,000.00$ 33% $ 4,950.00 19,950.00$
1 Lump Sum 5,000.00$ 33% $ 1,650.00 6,650.00$
1 Lump Sum 15,000.00$ 33% $ 4,950.00 19,950.00$
1 Lump Sum 6,000.00$ 33% $ 1,980.00 7,980.00$
1 Lump Sum 5,000.00$ 33% $ 1,650.00 6,650.00$
9 Each 20,000.00$ 33% $ 6,600.00 239,400.00$
1 Lump Sum 10,000.00$ 33% $ 3,300.00 13,300.00$
1 Lump Sum 50,000.00$ 33% $ 16,500.00 66,500.00$
1 Lump Sum 25,000.00$ 33% $ 8,250.00 33,250.00$
1 Lump Sum 70,000.00$ 33% $ 23,100.00 93,100.00$
1 Lump Sum 10,000.00$ Incl. in Unit Price Incl. in Unit Price 10,000.00$
1 Lump Sum 5,000.00$ Incl. in Unit Price Incl. in Unit Price 5,000.00$
16. 887,850.00$
1 Lump Sum 30,000.00$ Incl. in Unit Price Incl. in Unit Price 30,000.00$
1 Lump Sum 5,000.00$ 33% $ 1,650.00 6,650.00$
1 Each 150,000.00$ 33% $ 49,500.00 199,500.00$
1 Each 100,000.00$ 33% $ 33,000.00 133,000.00$
1 Lump Sum 20,000.00$ 33% $ 6,600.00 26,600.00$
4 Each 15,000.00$ 33% $ 4,950.00 79,800.00$
2 Each 25,000.00$ 33% $ 8,250.00 66,500.00$
8 Each 20,000.00$ 33% $ 6,600.00 212,800.00$
1 Lump Sum 100,000.00$ 33% $ 33,000.00 133,000.00$
Div 2-16 19,250,571.50$ 19,250,571.50$
Total 21,175,628.65$ 21,175,628.65$
16820 Motor Control Centre
16461 Dry Type Transformers
16556 Diesel Engine Generator Set
16560 Emergency Chlorine Scrubber
16627 Automatic Transfer Switches
16811 Motor Starters
16816 Variable Frequency Drives
15900 HVAC Controls
15950 HVAC Systems Testing, Adjusting, and Balancing
15955 Piping Leakage Testing
Division 16 - Electrical
16000 Electrical General Works
16818 Soft Starter Drives
15410 Plumbing Fixtures
15440 Plumbing Equipment
15760 Electric Unit Heaters
15802 Fiberglass Reinforced Plastic Ductwork
15810 Metal Ductwork and Accessories
15830 Fans
15201 Piping Support Systems
15202 Vibration and Noise Control
15204 Process Piping Specialties
15205 Process Valves and Operators
15200-14 Copper Tubing and Fittings
15010 Mechanical General Requirements
15060 Pipe Fittings
15100 Plumbing Piping
15200 Process Piping and Fittings
13305 Field Wiring
13400 Programmable Logic Controller
13480 SCADA System Integrator
Division 14 - Monorail and Hoist
14620 Monorail and Hoist
Division 15 - Mechanical
13010 Process Control - General Requirements
13105 General Instrumentation Requirements
13110 Ultrasonic Level Transmitter
13130 Float Switch
13140 Pressure Transmitter
13141 Pressure Gauge
Submersible Sump Pump
Centrifuge Pumps
11560 Flowmeter
Magnetic Flowmeter - 200mm
Magnetic Flowmeter - 300mm
Division 13 - Instrumentation and Control
11700 Mixer
11260 Chemical Storage and Feed Equipment
Division 10 - Miscellaneous Specialties
10200 Louvres and Vents
Division 11 - Equipment
11000 Equipment General Requirements
11215 Pumps
Vertical Turbine Pump
Option 3B - Pre-Stressed Conc c:\users\whittakerd\documents\projects\salem reservoir and pumping station\revisions - august 2017\2017-08-22 salem reservoir_cost estimate comparison_technology assessment.xls

ITEM DESCRIPTION
Option 1A:
CIP Concrete In-
ground
Reservoir & PS
-
Site 1
North Side
Salem Rd
Option 1B:
CIP Concrete In-
ground
Reservoir & PS
-
Site 2:
South Side
Salem Rd
Option 2A:
Glass Fused
Steel At-Grade
Reservoir & PS
-
Site 1
North Side
Salem Rd
Option 2B:
Glass Fused
Steel At-Grade
Reservoir & PS
-
Site 2
South Side
Salem Rd
Option 3A:
Precast
prestressed At-
Grade Reservoir
& PS
-
Site 1
North Side
Salem Rd
Option 3B:
Precast
prestressed At-
Grade Reservoir
& PS
-
Site 2
South Side
Salem Rd
A.
ESTIMATED 50 YR
OPERATIONS &
MAINTENANCE
COSTS - PRESENT
VALUE
$5,460,000 $5,460,000 $8,644,000 $8,644,000 $6,334,000 $6,334,000
B.
ESTIMATED
CONSTRUCTION
COSTS - PRESENT
VALUE
$31,161,400 $33,679,200 $21,224,400 $21,774,000 $25,020,000 $25,410,000
C.ESTIMATED LIFE
CYCLE COSTS$36,621,400 $39,139,200 $29,868,400 $30,418,000 $31,354,000 $31,744,000
ALL COSTS LESS HST
TECHNOLOGY DESCRIPTION
COMPARISON OF ESTIMATED LIFE CYCLE COSTS
SALEM ROAD RESERVOIR & PUMPING STATION CONCEPTUAL DESIGN - TECHNOLOGY ASSESSMENT

Location: North of Salem, West of Hwy 400
Capital and Life Cycle Cost AnalysisPumping Station:
CIP Concrete, 4 pumps
(133L/s@60m, each)
Salem Rd Reservoir and PS Reservoir Type: CIP Concrete, In-Ground, 20MLD
Discount Factor 5.0% Heating Load - Estimated kW 20
Inflation Factor 3.0% Estimated Operation (Months) 6
Study Period 50 Estimated Operation (Days) 180
Estimated Cost of Diesel Fuel per Litre1.00$
Estimated Operation in Hours (50% On/Off
Cycle)2,160
Estimated Electricity Cost $ per kWh 0.20$ Estimated Operation in kWh/yr 43,200
Reservoir Capacity (ML) 20 Ventilation Load - Estimated kW 15
Average Daily Flow Capacity (L/s):
Zone 3 Max Day Demand / Max Day Peaking
Factor - 1.75 / 2 (i.e., No. of Duty Pumping
Stations)
104.3 Estimated Operation (Months) 9
Total Firm Pumping Capacity
(L/s)403 Estimated Operation (Days) 270
Annual Station Flow (m3/year) 3,288,754
Estimated Operation in Hours
(50% On/Off Cycle)3,240
Pump Operating Flow - per Pump (L/s) 133 Estimated Operation in kWh/yr 48,600
No. of Duty Pumps 3
Total No. of Pump Operating Hours per Year
(hr/year)6869
Pump Power (KW) 93 Diesel Generator Size (Prime) - kW 250
Required Power per Year at Ultimate Flowrate
(kW-h/year)638,793
Fuel Consumption - L/hr
(dieselserviceandsupply.com)68
Estimated Operational Hours per Month (hrs) 6
Estimated Realization of Ultimate Flowrate Estimated Operation per Year (hours) 72
Years 1 - 5 25% Estimated Annual Fuel Consumption (L)/yr 4,905
Years 6 - 10 50%
Years 11 - 15 75%
Years 16 - 50 100%
Maintenance/
Refurbish'tEnergy Costs
Maintenance/
Refurbish'tEnergy Costs
Maintenance/
Refurbish'tEnergy Costs
Maintenance/
Refurbish'tEnergy Costs
Maintenance/
Refurbish'tEnergy Costs
Maintenance/
Refurbish'tEnergy Costs
Maintenance/
Refurbish'tEnergy Costs
Maintenance/
Refurbish'tEnergy Costs
Maintenance/
Refurbish'tEnergy Costs
Maintenance/
Refurbish'tEnergy Costs
Specification No. Specification / Asset Description Maintenance Cost Rationale Energy Cost Rationale
Div 2 Site Works2315
2511
2530
2630
Sewerage, Watermain, Storm
1. 10 year maintenance costs including allowance of $10,000 for
CCTV inspection and cleaning/ flushing costs.
1. Not applicable
- - - - - - - - - - - - - - - - - - 10,000$ -
2741
2821
2911
2936
Asphalt, Fences, Finish Grading, Landscaping
1. 15 year maintenance cost of asphalt - $10,000.
2. 20 Year fence maintenance costs - $5,000.
3. Annual landscaping/snow cost estimate - $5,000.1. Not applicable. 5,000$ - 5,000$ - 5,000$ - 5,000$ - 5,000$ - 5,000$ - 5,000$ - 5,000$ - 5,000$ - 5,000$ -
Div 3 Concrete Works
3200
3300Cast-In-Place Concrete
1. Concrete repair and resurfacing work estimated at $5/m3 of CIP
concrete. Total estimated concrete volume is 4,897 m3. Costs
estimated every 10 years for crack repair and resurfacing..
1. Not applicable.
- - - - - - - - - - - - - - - - - 24,485$ -
Div 7 Building Specialties
7000 Membrane Waterproofing 1. 20 year refurbishment costs estimated at $20,000 1. Not applicable. - - - - - - - - - - - - - - - - - - - -
Div 8 Metal Doors and Frames
8110
8710All Doors and Window Items
1. 20 year refurbishment costs of $5,000 1. Not applicable.- - - - - - - - - - - - - - - - - - - -
Div 9 Dry Wall and Painting
9900 All Finishing Items1. 20 Year Painting and wall refurbishment costs estimated at
$10,000.
1. Not applicable.- - - - - - - - - - - - - - - - - - - -
Div 10 Miscellaneous Specialties
10200 Louvres and Vents 1. 20 Year refurbishment costs estimated at $10,000. 1. Not applicable. - - - - - - - - - - - - - - - - - - - -
Div 11 Equipment
11000
11215
11560
Pumps
1. Estimated annual maintenance costs - $1,500 per pump. Total of
4 pumps.
2. Estimated 20 year refurbishment costs - $10,000 per pump.
1. Refer to pump electricity cost
calcuations, above.
6,000$ 32,000$ 6,000$ 32,000$ 6,000$ 32,000$ 6,000$ 32,000$ 6,000$ 32,000$ 6,000$ 64,000$ 6,000$ 64,000$ 6,000$ 64,000$ 6,000$ 64,000$ 6,000$ 64,000$
11260 Chemical Storage and Feed Equipment Estimated annual costs at $20,000 1. Not applicable. 20,000$ 20,000$ 20,000$ 20,000$ 20,000$ 20,000$ 20,000$ 20,000$ 20,000$ 20,000$
Div 13 Insrumentation and Control
13000 Instrumentation and Control Infrastructure
1. Annual instrumentation calibration costs estimated at $2,500.
15 year instrumentation replacement and refurbishment costs
estimated at $50,000.
2,500$ - 2,500$ - 2,500$ - 2,500$ - 2,500$ - 2,500$ - 2,500$ - 2,500$ - 2,500$ - 2,500$ -
Div 14 Monorail
14620 Metal Fabrication General1. 5 year maintenance check-up and refurbishment - $1,500. 1. Not applicable/
- - - - - - - - 1,500$ - - - - - - - - - 1,500$ -
Div 15 Mechanical15200
15200-14
15201
15202
15204
Process Piping and Fittings
1. 10 year cleaning and labelling costs at $5,000. 1. Not applicable.
- - - - - - - - - - - - - - - - - - 5,000$ -
15205 Valves 1. 20 year refurbishment costs estimated at $15,000. 1. Not applicable. - - - - - - - - - - - - - - - - - - - -
15760 Unit Heaters 1. 20 year refurbishment costs estimated at $15,000. 1. Not applicable. - - - - - - - - - - - - - - - - - - -
15830
15900
15950
15955
Ventilation Infrastructure
10 year refurbishment costs - $5,000. 1. Refer to heating and ventilation
consumption costs calculations, above.- 18,000$ - 18,000$ - 18,000$ - 18,000$ 18,000$ - 18,000$ - 18,000$ - 18,000$ - 18,000$ 5,000$ 18,000$
Div 16 Electrical
16556 Diesel Engine Generator Set1. Annual maintenance costs estimated at $2,500. Five year
refurbishment costs estimated at $5,000.
1. Refer to diesel fuel consumption costs
calculation, above.2,500$ 5,000$ 2,500$ 5,000$ 2,500$ 5,000$ 2,500$ 5,000$ 5,000$ 5,000$ 2,500$ 5,000$ 2,500$ 5,000$ 2,500$ 5,000$ 2,500$ 5,000$ 5,000$ 5,000$
16820 MCC and associated Infrastructure 1. 10 year maintenance costs estimated at $10,000. 1. Not applicable. - - - - - - - - - - - - - - - - - - 10,000$ -
16xxx Cathodic Protection 1. Not applicable.
55,000$ 55,000$ 55,000$ 55,000$ 55,000$ 87,000$ 87,000$ 87,000$ 87,000$ 87,000$
Note: O&M costs are assumed to be the same between Site 1 and Site 2 56,650$ 58,350$ 60,100$ 61,903$ 63,760$ 103,883$ 106,999$ 110,209$ 113,515$ 116,921$
54,000$ 53,000$ 52,000$ 51,000$ 50,000$ 78,000$ 76,000$ 75,000$ 73,000$ 72,000$
36,000$ 36,000$ 36,000$ 36,000$ 40,000$ 36,000$ 36,000$ 36,000$ 36,000$ 94,485$
37,080$ 38,192$ 39,338$ 40,518$ 46,371$ 42,986$ 44,275$ 45,604$ 46,972$ 126,980$
35,000$ 35,000$ 34,000$ 33,000$ 36,000$ 32,000$ 31,000$ 31,000$ 30,000$ 78,000$
5,460,000$
31,161,400$ *obtained from Capital Cost Estimate Spreadsheet
36,621,400$
Sub-Total - Estimated Construction Cost - Present Value
5 7 8
Grand Total - Estimated 50 Yr Life Cycle Cost - Present Value
110,000$ 86,000$ 84,000$ 86,000$ 107,000$ 89,000$ 88,000$
Sub-Total - Estimated Annual Energy Cost - Adjusted Annually for Inflation Factor
Sub-Total - Estimated Energy Cost Annual - Simple Cost
Sub-Total - Estimated Annual O&M Cost - Present Value
Sub-Total - Estimated Annual M/R Cost - Present Value - Adjusted Annually for Discount Factor
621
Sub-Total - Estimated 50 Yr O&M Costs - Present Value
Sub-Total - Estimated Annual M/R Cost - Adjusted Annually for Inflation Factor
Sub-Total - Estimated Annual Maintenance / Refurbishment Cost - Simple Cost
Sub-Total - Estimated Annual Energy Cost - Present Value - Adjusted Annually for Discount Factor
106,000$
Pump Electricity Cost Calculation, Assumptions:
Financial Calculation Assumptions: Heating Cost Calculation, Assumptions:
Ventilation Cost Calculation, Assumptions:
Diesel Fuel Cost Calculation, Assumptions:
9
150,000$ 103,000$
Design Alternative No. 1A
3 4 10
Page 1 of 5

Location: North of Salem, West of Hwy 400
Capital and Life Cycle Cost AnalysisPumping Station:
CIP Concrete, 4 pumps
(133L/s@60m, each)
Salem Rd Reservoir and PS Reservoir Type: CIP Concrete, In-Ground, 20MLD
Discount Factor 5.0% Heating Load - Estimated kW 20
Inflation Factor 3.0% Estimated Operation (Months) 6
Study Period 50 Estimated Operation (Days) 180
Estimated Cost of Diesel Fuel per Litre1.00$
Estimated Operation in Hours (50% On/Off
Cycle)2,160
Estimated Electricity Cost $ per kWh 0.20$ Estimated Operation in kWh/yr 43,200
Reservoir Capacity (ML) 20 Ventilation Load - Estimated kW 15
Average Daily Flow Capacity (L/s):
Zone 3 Max Day Demand / Max Day Peaking
Factor - 1.75 / 2 (i.e., No. of Duty Pumping
Stations)
104.3 Estimated Operation (Months) 9
Total Firm Pumping Capacity
(L/s)403 Estimated Operation (Days) 270
Annual Station Flow (m3/year) 3,288,754
Estimated Operation in Hours
(50% On/Off Cycle)3,240
Pump Operating Flow - per Pump (L/s) 133 Estimated Operation in kWh/yr 48,600
No. of Duty Pumps 3
Total No. of Pump Operating Hours per Year
(hr/year)6869
Pump Power (KW) 93 Diesel Generator Size (Prime) - kW 250
Required Power per Year at Ultimate Flowrate
(kW-h/year)638,793
Fuel Consumption - L/hr
(dieselserviceandsupply.com)68
Estimated Operational Hours per Month (hrs) 6
Estimated Realization of Ultimate Flowrate Estimated Operation per Year (hours) 72
Years 1 - 5 25% Estimated Annual Fuel Consumption (L)/yr 4,905
Years 6 - 10 50%
Years 11 - 15 75%
Years 16 - 50 100%
Specification No. Specification / Asset Description Maintenance Cost Rationale Energy Cost Rationale
Div 2 Site Works2315
2511
2530
2630
Sewerage, Watermain, Storm
1. 10 year maintenance costs including allowance of $10,000 for
CCTV inspection and cleaning/ flushing costs.
1. Not applicable
2741
2821
2911
2936
Asphalt, Fences, Finish Grading, Landscaping
1. 15 year maintenance cost of asphalt - $10,000.
2. 20 Year fence maintenance costs - $5,000.
3. Annual landscaping/snow cost estimate - $5,000.1. Not applicable.
Div 3 Concrete Works
3200
3300Cast-In-Place Concrete
1. Concrete repair and resurfacing work estimated at $5/m3 of CIP
concrete. Total estimated concrete volume is 4,897 m3. Costs
estimated every 10 years for crack repair and resurfacing..
1. Not applicable.
Div 7 Building Specialties
7000 Membrane Waterproofing 1. 20 year refurbishment costs estimated at $20,000 1. Not applicable.
Div 8 Metal Doors and Frames
8110
8710All Doors and Window Items
1. 20 year refurbishment costs of $5,000 1. Not applicable.
Div 9 Dry Wall and Painting
9900 All Finishing Items1. 20 Year Painting and wall refurbishment costs estimated at
$10,000.
1. Not applicable.
Div 10 Miscellaneous Specialties
10200 Louvres and Vents 1. 20 Year refurbishment costs estimated at $10,000. 1. Not applicable.
Div 11 Equipment
11000
11215
11560
Pumps
1. Estimated annual maintenance costs - $1,500 per pump. Total of
4 pumps.
2. Estimated 20 year refurbishment costs - $10,000 per pump.
1. Refer to pump electricity cost
calcuations, above.
11260 Chemical Storage and Feed Equipment Estimated annual costs at $20,000 1. Not applicable.
Div 13 Insrumentation and Control
13000 Instrumentation and Control Infrastructure
1. Annual instrumentation calibration costs estimated at $2,500.
15 year instrumentation replacement and refurbishment costs
estimated at $50,000.
Div 14 Monorail
14620 Metal Fabrication General1. 5 year maintenance check-up and refurbishment - $1,500. 1. Not applicable/
Div 15 Mechanical15200
15200-14
15201
15202
15204
Process Piping and Fittings
1. 10 year cleaning and labelling costs at $5,000. 1. Not applicable.
15205 Valves 1. 20 year refurbishment costs estimated at $15,000. 1. Not applicable.
15760 Unit Heaters 1. 20 year refurbishment costs estimated at $15,000. 1. Not applicable.15830
15900
15950
15955
Ventilation Infrastructure
10 year refurbishment costs - $5,000. 1. Refer to heating and ventilation
consumption costs calculations, above.
Div 16 Electrical
16556 Diesel Engine Generator Set1. Annual maintenance costs estimated at $2,500. Five year
refurbishment costs estimated at $5,000.
1. Refer to diesel fuel consumption costs
calculation, above.
16820 MCC and associated Infrastructure 1. 10 year maintenance costs estimated at $10,000. 1. Not applicable.
16xxx Cathodic Protection 1. Not applicable.
Note: O&M costs are assumed to be the same between Site 1 and Site 2
Sub-Total - Estimated Construction Cost - Present Value
Grand Total - Estimated 50 Yr Life Cycle Cost - Present Value
Sub-Total - Estimated Annual Energy Cost - Adjusted Annually for Inflation Factor
Sub-Total - Estimated Energy Cost Annual - Simple Cost
Sub-Total - Estimated Annual O&M Cost - Present Value
Sub-Total - Estimated Annual M/R Cost - Present Value - Adjusted Annually for Discount Factor
Sub-Total - Estimated 50 Yr O&M Costs - Present Value
Sub-Total - Estimated Annual M/R Cost - Adjusted Annually for Inflation Factor
Sub-Total - Estimated Annual Maintenance / Refurbishment Cost - Simple Cost
Sub-Total - Estimated Annual Energy Cost - Present Value - Adjusted Annually for Discount Factor
Pump Electricity Cost Calculation, Assumptions:
Financial Calculation Assumptions: Heating Cost Calculation, Assumptions:
Ventilation Cost Calculation, Assumptions:
Diesel Fuel Cost Calculation, Assumptions:
Design Alternative No. 1A
Maintenance/
Refurbish'tEnergy Costs
Maintenance/
Refurbish'tEnergy Costs
Maintenance/
Refurbish'tEnergy Costs
Maintenance/
Refurbish'tEnergy Costs
Maintenance/
Refurbish'tEnergy Costs
Maintenance/
Refurbish'tEnergy Costs
Maintenance/
Refurbish'tEnergy Costs
Maintenance/
Refurbish'tEnergy Costs
Maintenance/
Refurbish'tEnergy Costs
Maintenance/
Refurbish'tEnergy Costs
- - - - - - - - - - - - - - - - - - 10,000$ -
5,000$ - 5,000$ - 5,000$ - 5,000$ - 15,000$ - 5,000$ - 5,000$ - 5,000$ - 5,000$ - 10,000$ -
- - - - - - - - - - - - - - - - - 24,485$ -
- - - - - - - - - - - - - - - - - - 20,000$ -
- - - - - - - - - - - - - - - - - - 5,000$ -
- - - - - - - - - - - - - - - - - - 10,000$ -
- - - - - - - - - - - - - - - - - - 10,000$ -
6,000$ 96,000$ 6,000$ 96,000$ 6,000$ 96,000$ 6,000$ 96,000$ 6,000$ 96,000$ 6,000$ 128,000$ 6,000$ 128,000$ 6,000$ 128,000$ 6,000$ 128,000$ 40,000$ 128,000$
20,000$ 20,000$ 20,000$ 20,000$ 20,000$ 20,000$ 20,000$ 20,000$ 20,000$ 20,000$
2,500$ - 2,500$ - 2,500$ - 2,500$ - 50,000$ - 2,500$ - 2,500$ - 2,500$ - 2,500$ - 2,500$ -
- - - - - - - - 1,500$ - - - - - - - - - 1,500$ -
- - - - - - - - - - - - - - - - - - 5,000$ -
- - - - - - - - - - - - - - - - - - 15,000$ -
- - - - - - - - - - - - - - - - - - 15,000$ -
- 18,000$ - 18,000$ - 18,000$ - 18,000$ 18,000$ - 18,000$ - 18,000$ - 18,000$ - 18,000$ 5,000$ 18,000$
2,500$ 5,000$ 2,500$ 5,000$ 2,500$ 5,000$ 2,500$ 5,000$ 5,000$ 5,000$ 2,500$ 5,000$ 2,500$ 5,000$ 2,500$ 5,000$ 2,500$ 5,000$ 5,000$ 5,000$
- - - - - - - - - - - - - - - - - - 10,000$ -
119,000$ 119,000$ 119,000$ 119,000$ 119,000$ 151,000$ 151,000$ 151,000$ 151,000$ 151,000$
164,724$ 169,666$ 174,756$ 179,998$ 185,398$ 242,311$ 249,580$ 257,067$ 264,779$ 272,723$
96,000$ 94,000$ 93,000$ 91,000$ 89,000$ 111,000$ 109,000$ 107,000$ 105,000$ 103,000$
36,000$ 36,000$ 36,000$ 36,000$ 97,500$ 36,000$ 36,000$ 36,000$ 36,000$ 208,485$
49,832$ 51,327$ 52,867$ 54,453$ 151,902$ 57,769$ 59,503$ 61,288$ 63,126$ 376,547$
29,000$ 29,000$ 28,000$ 28,000$ 73,000$ 26,000$ 26,000$ 25,000$ 25,000$ 142,000$
130,000$ 245,000$ 119,000$ 162,000$ 137,000$ 135,000$ 132,000$
141312 15
121,000$ 123,000$
11
125,000$
2019181716
Page 2 of 5
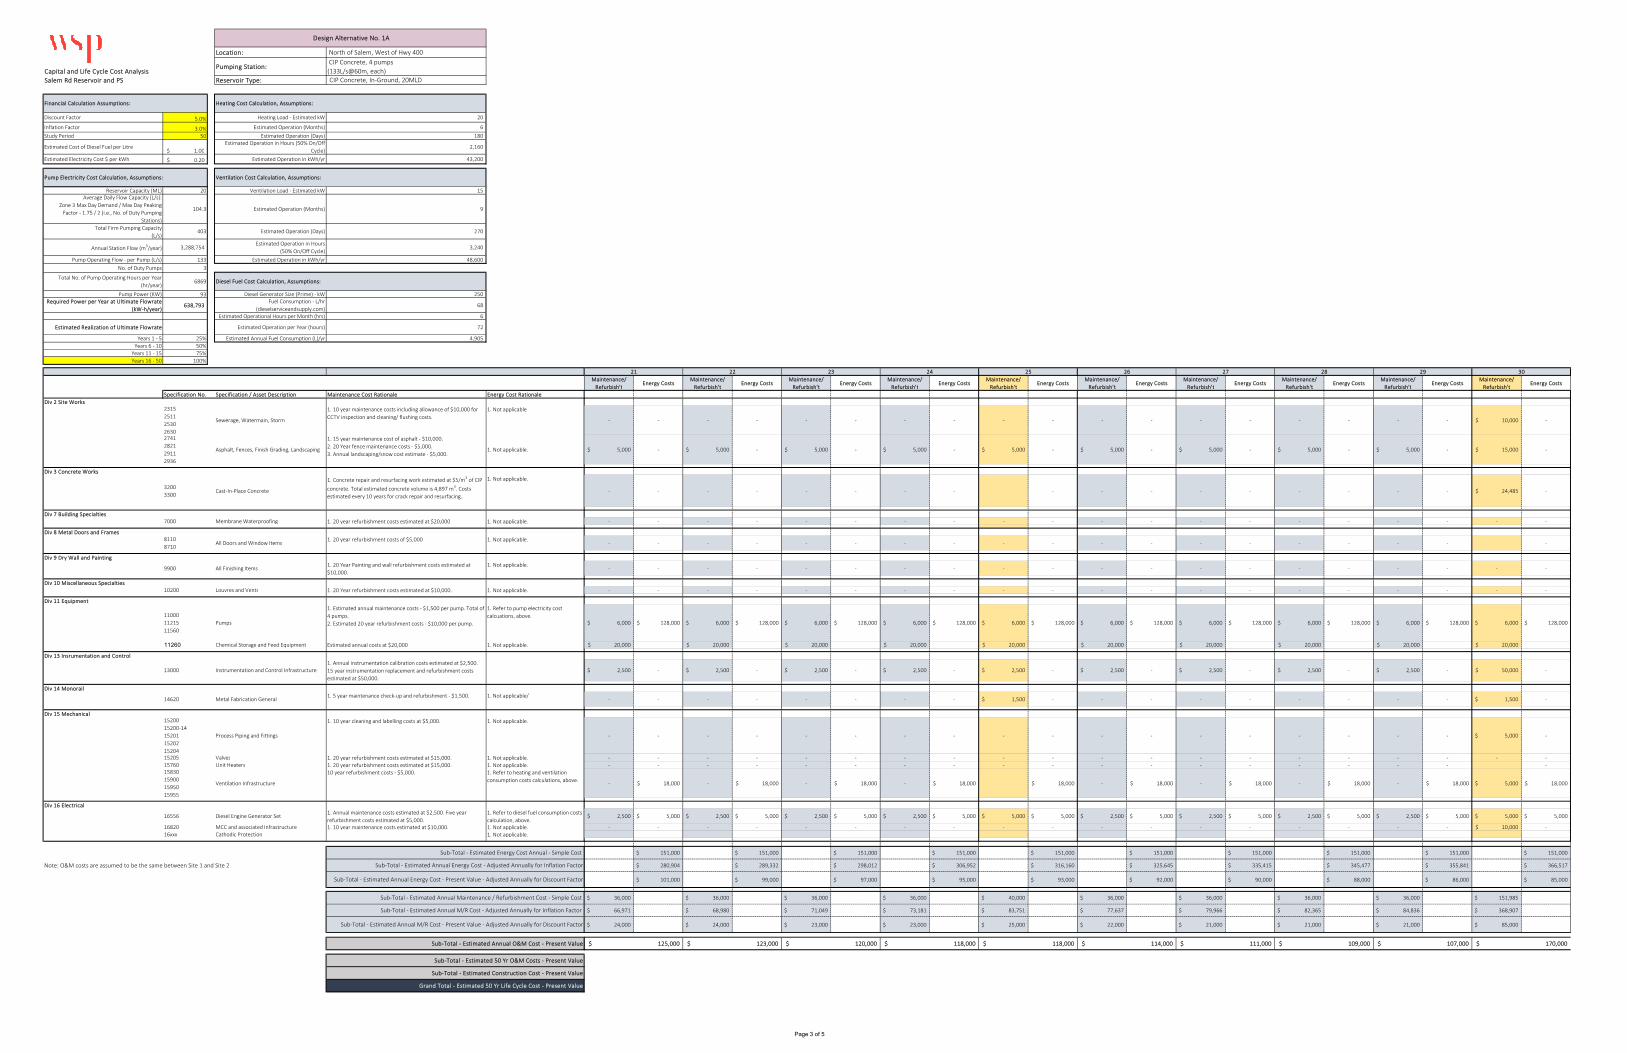
Location: North of Salem, West of Hwy 400
Capital and Life Cycle Cost AnalysisPumping Station:
CIP Concrete, 4 pumps
(133L/s@60m, each)
Salem Rd Reservoir and PS Reservoir Type: CIP Concrete, In-Ground, 20MLD
Discount Factor 5.0% Heating Load - Estimated kW 20
Inflation Factor 3.0% Estimated Operation (Months) 6
Study Period 50 Estimated Operation (Days) 180
Estimated Cost of Diesel Fuel per Litre1.00$
Estimated Operation in Hours (50% On/Off
Cycle)2,160
Estimated Electricity Cost $ per kWh 0.20$ Estimated Operation in kWh/yr 43,200
Reservoir Capacity (ML) 20 Ventilation Load - Estimated kW 15
Average Daily Flow Capacity (L/s):
Zone 3 Max Day Demand / Max Day Peaking
Factor - 1.75 / 2 (i.e., No. of Duty Pumping
Stations)
104.3 Estimated Operation (Months) 9
Total Firm Pumping Capacity
(L/s)403 Estimated Operation (Days) 270
Annual Station Flow (m3/year) 3,288,754
Estimated Operation in Hours
(50% On/Off Cycle)3,240
Pump Operating Flow - per Pump (L/s) 133 Estimated Operation in kWh/yr 48,600
No. of Duty Pumps 3
Total No. of Pump Operating Hours per Year
(hr/year)6869
Pump Power (KW) 93 Diesel Generator Size (Prime) - kW 250
Required Power per Year at Ultimate Flowrate
(kW-h/year)638,793
Fuel Consumption - L/hr
(dieselserviceandsupply.com)68
Estimated Operational Hours per Month (hrs) 6
Estimated Realization of Ultimate Flowrate Estimated Operation per Year (hours) 72
Years 1 - 5 25% Estimated Annual Fuel Consumption (L)/yr 4,905
Years 6 - 10 50%
Years 11 - 15 75%
Years 16 - 50 100%
Specification No. Specification / Asset Description Maintenance Cost Rationale Energy Cost Rationale
Div 2 Site Works2315
2511
2530
2630
Sewerage, Watermain, Storm
1. 10 year maintenance costs including allowance of $10,000 for
CCTV inspection and cleaning/ flushing costs.
1. Not applicable
2741
2821
2911
2936
Asphalt, Fences, Finish Grading, Landscaping
1. 15 year maintenance cost of asphalt - $10,000.
2. 20 Year fence maintenance costs - $5,000.
3. Annual landscaping/snow cost estimate - $5,000.1. Not applicable.
Div 3 Concrete Works
3200
3300Cast-In-Place Concrete
1. Concrete repair and resurfacing work estimated at $5/m3 of CIP
concrete. Total estimated concrete volume is 4,897 m3. Costs
estimated every 10 years for crack repair and resurfacing..
1. Not applicable.
Div 7 Building Specialties
7000 Membrane Waterproofing 1. 20 year refurbishment costs estimated at $20,000 1. Not applicable.
Div 8 Metal Doors and Frames
8110
8710All Doors and Window Items
1. 20 year refurbishment costs of $5,000 1. Not applicable.
Div 9 Dry Wall and Painting
9900 All Finishing Items1. 20 Year Painting and wall refurbishment costs estimated at
$10,000.
1. Not applicable.
Div 10 Miscellaneous Specialties
10200 Louvres and Vents 1. 20 Year refurbishment costs estimated at $10,000. 1. Not applicable.
Div 11 Equipment
11000
11215
11560
Pumps
1. Estimated annual maintenance costs - $1,500 per pump. Total of
4 pumps.
2. Estimated 20 year refurbishment costs - $10,000 per pump.
1. Refer to pump electricity cost
calcuations, above.
11260 Chemical Storage and Feed Equipment Estimated annual costs at $20,000 1. Not applicable.
Div 13 Insrumentation and Control
13000 Instrumentation and Control Infrastructure
1. Annual instrumentation calibration costs estimated at $2,500.
15 year instrumentation replacement and refurbishment costs
estimated at $50,000.
Div 14 Monorail
14620 Metal Fabrication General1. 5 year maintenance check-up and refurbishment - $1,500. 1. Not applicable/
Div 15 Mechanical15200
15200-14
15201
15202
15204
Process Piping and Fittings
1. 10 year cleaning and labelling costs at $5,000. 1. Not applicable.
15205 Valves 1. 20 year refurbishment costs estimated at $15,000. 1. Not applicable.
15760 Unit Heaters 1. 20 year refurbishment costs estimated at $15,000. 1. Not applicable.15830
15900
15950
15955
Ventilation Infrastructure
10 year refurbishment costs - $5,000. 1. Refer to heating and ventilation
consumption costs calculations, above.
Div 16 Electrical
16556 Diesel Engine Generator Set1. Annual maintenance costs estimated at $2,500. Five year
refurbishment costs estimated at $5,000.
1. Refer to diesel fuel consumption costs
calculation, above.
16820 MCC and associated Infrastructure 1. 10 year maintenance costs estimated at $10,000. 1. Not applicable.
16xxx Cathodic Protection 1. Not applicable.
Note: O&M costs are assumed to be the same between Site 1 and Site 2
Sub-Total - Estimated Construction Cost - Present Value
Grand Total - Estimated 50 Yr Life Cycle Cost - Present Value
Sub-Total - Estimated Annual Energy Cost - Adjusted Annually for Inflation Factor
Sub-Total - Estimated Energy Cost Annual - Simple Cost
Sub-Total - Estimated Annual O&M Cost - Present Value
Sub-Total - Estimated Annual M/R Cost - Present Value - Adjusted Annually for Discount Factor
Sub-Total - Estimated 50 Yr O&M Costs - Present Value
Sub-Total - Estimated Annual M/R Cost - Adjusted Annually for Inflation Factor
Sub-Total - Estimated Annual Maintenance / Refurbishment Cost - Simple Cost
Sub-Total - Estimated Annual Energy Cost - Present Value - Adjusted Annually for Discount Factor
Pump Electricity Cost Calculation, Assumptions:
Financial Calculation Assumptions: Heating Cost Calculation, Assumptions:
Ventilation Cost Calculation, Assumptions:
Diesel Fuel Cost Calculation, Assumptions:
Design Alternative No. 1A
Maintenance/
Refurbish'tEnergy Costs
Maintenance/
Refurbish'tEnergy Costs
Maintenance/
Refurbish'tEnergy Costs
Maintenance/
Refurbish'tEnergy Costs
Maintenance/
Refurbish'tEnergy Costs
Maintenance/
Refurbish'tEnergy Costs
Maintenance/
Refurbish'tEnergy Costs
Maintenance/
Refurbish'tEnergy Costs
Maintenance/
Refurbish'tEnergy Costs
Maintenance/
Refurbish'tEnergy Costs
- - - - - - - - - - - - - - - - - - 10,000$ -
5,000$ - 5,000$ - 5,000$ - 5,000$ - 5,000$ - 5,000$ - 5,000$ - 5,000$ - 5,000$ - 15,000$ -
- - - - - - - - - - - - - - - - - 24,485$ -
- - - - - - - - - - - - - - - - - - - -
- - - - - - - - - - - - - - - - - - -
- - - - - - - - - - - - - - - - - - - -
- - - - - - - - - - - - - - - - - - - -
6,000$ 128,000$ 6,000$ 128,000$ 6,000$ 128,000$ 6,000$ 128,000$ 6,000$ 128,000$ 6,000$ 128,000$ 6,000$ 128,000$ 6,000$ 128,000$ 6,000$ 128,000$ 6,000$ 128,000$
20,000$ 20,000$ 20,000$ 20,000$ 20,000$ 20,000$ 20,000$ 20,000$ 20,000$ 20,000$
2,500$ - 2,500$ - 2,500$ - 2,500$ - 2,500$ - 2,500$ - 2,500$ - 2,500$ - 2,500$ - 50,000$ -
- - - - - - - - 1,500$ - - - - - - - - - 1,500$ -
- - - - - - - - - - - - - - - - - - 5,000$ -
- - - - - - - - - - - - - - - - - - - -
- - - - - - - - - - - - - - - - - - -
- 18,000$ - 18,000$ - 18,000$ - 18,000$ 18,000$ - 18,000$ - 18,000$ - 18,000$ - 18,000$ 5,000$ 18,000$
2,500$ 5,000$ 2,500$ 5,000$ 2,500$ 5,000$ 2,500$ 5,000$ 5,000$ 5,000$ 2,500$ 5,000$ 2,500$ 5,000$ 2,500$ 5,000$ 2,500$ 5,000$ 5,000$ 5,000$
- - - - - - - - - - - - - - - - - - 10,000$ -
151,000$ 151,000$ 151,000$ 151,000$ 151,000$ 151,000$ 151,000$ 151,000$ 151,000$ 151,000$
280,904$ 289,332$ 298,012$ 306,952$ 316,160$ 325,645$ 335,415$ 345,477$ 355,841$ 366,517$
101,000$ 99,000$ 97,000$ 95,000$ 93,000$ 92,000$ 90,000$ 88,000$ 86,000$ 85,000$
36,000$ 36,000$ 36,000$ 36,000$ 40,000$ 36,000$ 36,000$ 36,000$ 36,000$ 151,985$
66,971$ 68,980$ 71,049$ 73,181$ 83,751$ 77,637$ 79,966$ 82,365$ 84,836$ 368,907$
24,000$ 24,000$ 23,000$ 23,000$ 25,000$ 22,000$ 21,000$ 21,000$ 21,000$ 85,000$
125,000$ 123,000$ 120,000$ 118,000$ 170,000$ 118,000$ 114,000$ 111,000$ 109,000$ 107,000$
30292825 26 2721 22 23 24
Page 3 of 5

Location: North of Salem, West of Hwy 400
Capital and Life Cycle Cost AnalysisPumping Station:
CIP Concrete, 4 pumps
(133L/s@60m, each)
Salem Rd Reservoir and PS Reservoir Type: CIP Concrete, In-Ground, 20MLD
Discount Factor 5.0% Heating Load - Estimated kW 20
Inflation Factor 3.0% Estimated Operation (Months) 6
Study Period 50 Estimated Operation (Days) 180
Estimated Cost of Diesel Fuel per Litre1.00$
Estimated Operation in Hours (50% On/Off
Cycle)2,160
Estimated Electricity Cost $ per kWh 0.20$ Estimated Operation in kWh/yr 43,200
Reservoir Capacity (ML) 20 Ventilation Load - Estimated kW 15
Average Daily Flow Capacity (L/s):
Zone 3 Max Day Demand / Max Day Peaking
Factor - 1.75 / 2 (i.e., No. of Duty Pumping
Stations)
104.3 Estimated Operation (Months) 9
Total Firm Pumping Capacity
(L/s)403 Estimated Operation (Days) 270
Annual Station Flow (m3/year) 3,288,754
Estimated Operation in Hours
(50% On/Off Cycle)3,240
Pump Operating Flow - per Pump (L/s) 133 Estimated Operation in kWh/yr 48,600
No. of Duty Pumps 3
Total No. of Pump Operating Hours per Year
(hr/year)6869
Pump Power (KW) 93 Diesel Generator Size (Prime) - kW 250
Required Power per Year at Ultimate Flowrate
(kW-h/year)638,793
Fuel Consumption - L/hr
(dieselserviceandsupply.com)68
Estimated Operational Hours per Month (hrs) 6
Estimated Realization of Ultimate Flowrate Estimated Operation per Year (hours) 72
Years 1 - 5 25% Estimated Annual Fuel Consumption (L)/yr 4,905
Years 6 - 10 50%
Years 11 - 15 75%
Years 16 - 50 100%
Specification No. Specification / Asset Description Maintenance Cost Rationale Energy Cost Rationale
Div 2 Site Works2315
2511
2530
2630
Sewerage, Watermain, Storm
1. 10 year maintenance costs including allowance of $10,000 for
CCTV inspection and cleaning/ flushing costs.
1. Not applicable
2741
2821
2911
2936
Asphalt, Fences, Finish Grading, Landscaping
1. 15 year maintenance cost of asphalt - $10,000.
2. 20 Year fence maintenance costs - $5,000.
3. Annual landscaping/snow cost estimate - $5,000.1. Not applicable.
Div 3 Concrete Works
3200
3300Cast-In-Place Concrete
1. Concrete repair and resurfacing work estimated at $5/m3 of CIP
concrete. Total estimated concrete volume is 4,897 m3. Costs
estimated every 10 years for crack repair and resurfacing..
1. Not applicable.
Div 7 Building Specialties
7000 Membrane Waterproofing 1. 20 year refurbishment costs estimated at $20,000 1. Not applicable.
Div 8 Metal Doors and Frames
8110
8710All Doors and Window Items
1. 20 year refurbishment costs of $5,000 1. Not applicable.
Div 9 Dry Wall and Painting
9900 All Finishing Items1. 20 Year Painting and wall refurbishment costs estimated at
$10,000.
1. Not applicable.
Div 10 Miscellaneous Specialties
10200 Louvres and Vents 1. 20 Year refurbishment costs estimated at $10,000. 1. Not applicable.
Div 11 Equipment
11000
11215
11560
Pumps
1. Estimated annual maintenance costs - $1,500 per pump. Total of
4 pumps.
2. Estimated 20 year refurbishment costs - $10,000 per pump.
1. Refer to pump electricity cost
calcuations, above.
11260 Chemical Storage and Feed Equipment Estimated annual costs at $20,000 1. Not applicable.
Div 13 Insrumentation and Control
13000 Instrumentation and Control Infrastructure
1. Annual instrumentation calibration costs estimated at $2,500.
15 year instrumentation replacement and refurbishment costs
estimated at $50,000.
Div 14 Monorail
14620 Metal Fabrication General1. 5 year maintenance check-up and refurbishment - $1,500. 1. Not applicable/
Div 15 Mechanical15200
15200-14
15201
15202
15204
Process Piping and Fittings
1. 10 year cleaning and labelling costs at $5,000. 1. Not applicable.
15205 Valves 1. 20 year refurbishment costs estimated at $15,000. 1. Not applicable.
15760 Unit Heaters 1. 20 year refurbishment costs estimated at $15,000. 1. Not applicable.15830
15900
15950
15955
Ventilation Infrastructure
10 year refurbishment costs - $5,000. 1. Refer to heating and ventilation
consumption costs calculations, above.
Div 16 Electrical
16556 Diesel Engine Generator Set1. Annual maintenance costs estimated at $2,500. Five year
refurbishment costs estimated at $5,000.
1. Refer to diesel fuel consumption costs
calculation, above.
16820 MCC and associated Infrastructure 1. 10 year maintenance costs estimated at $10,000. 1. Not applicable.
16xxx Cathodic Protection 1. Not applicable.
Note: O&M costs are assumed to be the same between Site 1 and Site 2
Sub-Total - Estimated Construction Cost - Present Value
Grand Total - Estimated 50 Yr Life Cycle Cost - Present Value
Sub-Total - Estimated Annual Energy Cost - Adjusted Annually for Inflation Factor
Sub-Total - Estimated Energy Cost Annual - Simple Cost
Sub-Total - Estimated Annual O&M Cost - Present Value
Sub-Total - Estimated Annual M/R Cost - Present Value - Adjusted Annually for Discount Factor
Sub-Total - Estimated 50 Yr O&M Costs - Present Value
Sub-Total - Estimated Annual M/R Cost - Adjusted Annually for Inflation Factor
Sub-Total - Estimated Annual Maintenance / Refurbishment Cost - Simple Cost
Sub-Total - Estimated Annual Energy Cost - Present Value - Adjusted Annually for Discount Factor
Pump Electricity Cost Calculation, Assumptions:
Financial Calculation Assumptions: Heating Cost Calculation, Assumptions:
Ventilation Cost Calculation, Assumptions:
Diesel Fuel Cost Calculation, Assumptions:
Design Alternative No. 1A
Maintenance/
Refurbish'tEnergy Costs
Maintenance/
Refurbish'tEnergy Costs
Maintenance/
Refurbish'tEnergy Costs
Maintenance/
Refurbish'tEnergy Costs
Maintenance/
Refurbish'tEnergy Costs
Maintenance/
Refurbish'tEnergy Costs
Maintenance/
Refurbish'tEnergy Costs
Maintenance/
Refurbish'tEnergy Costs
Maintenance/
Refurbish'tEnergy Costs
Maintenance/
Refurbish'tEnergy Costs
- - - - - - - - - - - - - - - - - 10,000$ -
5,000$ - 5,000$ - 5,000$ - 5,000$ - 5,000$ - 5,000$ - 5,000$ - 5,000$ - 5,000$ - 10,000$ -
- - - - - - - - - - - - - - - - - 24,485$ -
- - - - - - - - - - - - - - - - - 20,000$ -
- - - - - - - - - - - - - - - - - 5,000$ -
- - - - - - - - - - - - - - - - - 10,000$ -
- - - - - - - - - - - - - - - - - 10,000$ -
6,000$ 128,000$ 6,000$ 128,000$ 6,000$ 128,000$ 6,000$ 128,000$ 6,000$ 128,000$ 6,000$ 128,000$ 6,000$ 128,000$ 6,000$ 128,000$ 6,000$ 128,000$ 40,000$ 128,000$
20,000$ 20,000$ 20,000$ 20,000$ 20,000$ 20,000$ 20,000$ 20,000$ 20,000$ 20,000$
2,500$ - 2,500$ - 2,500$ - 2,500$ - 2,500$ - 2,500$ - 2,500$ - 2,500$ - 2,500$ - 2,500$ -
- - - - - - - - 1,500$ - - - - - - - - - 1,500$ -
- - - - - - - - - - - - - - - - - 5,000$ -
- - - - - - - - - - - - - - - - - 15,000$ -
- - - - - - - - - - - - - - - - - 15,000$ -
- 18,000$ - 18,000$ - 18,000$ - 18,000$ 18,000$ - 18,000$ - 18,000$ - 18,000$ - 18,000$ 5,000$ 18,000$
2,500$ -$ 2,500$ -$ 2,500$ -$ 2,500$ -$ 5,000$ -$ 2,500$ -$ 2,500$ -$ 2,500$ -$ 2,500$ -$ 5,000$ -$
- - - - - - - - - - - - - - - - - 10,000$ -
146,000$ 146,000$ 146,000$ 146,000$ 146,000$ 146,000$ 146,000$ 146,000$ 146,000$ 146,000$
365,012$ 375,962$ 387,241$ 398,858$ 410,824$ 423,149$ 435,843$ 448,918$ 462,386$ 476,258$
80,000$ 79,000$ 77,000$ 76,000$ 74,000$ 73,000$ 72,000$ 70,000$ 69,000$ 68,000$
36,000$ 36,000$ 36,000$ 36,000$ 40,000$ 36,000$ 36,000$ 36,000$ 36,000$ 208,485$
90,003$ 92,703$ 95,484$ 98,349$ 112,554$ 104,338$ 107,468$ 110,692$ 114,013$ 680,086$
20,000$ 19,000$ 19,000$ 19,000$ 20,000$ 18,000$ 18,000$ 17,000$ 17,000$ 97,000$
36 37 38 39 4031 32 33 34 35
100,000$ 98,000$ 96,000$ 95,000$ 94,000$ 91,000$ 90,000$ 87,000$ 86,000$ 165,000$
Page 4 of 5

Location: North of Salem, West of Hwy 400
Capital and Life Cycle Cost AnalysisPumping Station:
CIP Concrete, 4 pumps
(133L/s@60m, each)
Salem Rd Reservoir and PS Reservoir Type: CIP Concrete, In-Ground, 20MLD
Discount Factor 5.0% Heating Load - Estimated kW 20
Inflation Factor 3.0% Estimated Operation (Months) 6
Study Period 50 Estimated Operation (Days) 180
Estimated Cost of Diesel Fuel per Litre1.00$
Estimated Operation in Hours (50% On/Off
Cycle)2,160
Estimated Electricity Cost $ per kWh 0.20$ Estimated Operation in kWh/yr 43,200
Reservoir Capacity (ML) 20 Ventilation Load - Estimated kW 15
Average Daily Flow Capacity (L/s):
Zone 3 Max Day Demand / Max Day Peaking
Factor - 1.75 / 2 (i.e., No. of Duty Pumping
Stations)
104.3 Estimated Operation (Months) 9
Total Firm Pumping Capacity
(L/s)403 Estimated Operation (Days) 270
Annual Station Flow (m3/year) 3,288,754
Estimated Operation in Hours
(50% On/Off Cycle)3,240
Pump Operating Flow - per Pump (L/s) 133 Estimated Operation in kWh/yr 48,600
No. of Duty Pumps 3
Total No. of Pump Operating Hours per Year
(hr/year)6869
Pump Power (KW) 93 Diesel Generator Size (Prime) - kW 250
Required Power per Year at Ultimate Flowrate
(kW-h/year)638,793
Fuel Consumption - L/hr
(dieselserviceandsupply.com)68
Estimated Operational Hours per Month (hrs) 6
Estimated Realization of Ultimate Flowrate Estimated Operation per Year (hours) 72
Years 1 - 5 25% Estimated Annual Fuel Consumption (L)/yr 4,905
Years 6 - 10 50%
Years 11 - 15 75%
Years 16 - 50 100%
Specification No. Specification / Asset Description Maintenance Cost Rationale Energy Cost Rationale
Div 2 Site Works2315
2511
2530
2630
Sewerage, Watermain, Storm
1. 10 year maintenance costs including allowance of $10,000 for
CCTV inspection and cleaning/ flushing costs.
1. Not applicable
2741
2821
2911
2936
Asphalt, Fences, Finish Grading, Landscaping
1. 15 year maintenance cost of asphalt - $10,000.
2. 20 Year fence maintenance costs - $5,000.
3. Annual landscaping/snow cost estimate - $5,000.1. Not applicable.
Div 3 Concrete Works
3200
3300Cast-In-Place Concrete
1. Concrete repair and resurfacing work estimated at $5/m3 of CIP
concrete. Total estimated concrete volume is 4,897 m3. Costs
estimated every 10 years for crack repair and resurfacing..
1. Not applicable.
Div 7 Building Specialties
7000 Membrane Waterproofing 1. 20 year refurbishment costs estimated at $20,000 1. Not applicable.
Div 8 Metal Doors and Frames
8110
8710All Doors and Window Items
1. 20 year refurbishment costs of $5,000 1. Not applicable.
Div 9 Dry Wall and Painting
9900 All Finishing Items1. 20 Year Painting and wall refurbishment costs estimated at
$10,000.
1. Not applicable.
Div 10 Miscellaneous Specialties
10200 Louvres and Vents 1. 20 Year refurbishment costs estimated at $10,000. 1. Not applicable.
Div 11 Equipment
11000
11215
11560
Pumps
1. Estimated annual maintenance costs - $1,500 per pump. Total of
4 pumps.
2. Estimated 20 year refurbishment costs - $10,000 per pump.
1. Refer to pump electricity cost
calcuations, above.
11260 Chemical Storage and Feed Equipment Estimated annual costs at $20,000 1. Not applicable.
Div 13 Insrumentation and Control
13000 Instrumentation and Control Infrastructure
1. Annual instrumentation calibration costs estimated at $2,500.
15 year instrumentation replacement and refurbishment costs
estimated at $50,000.
Div 14 Monorail
14620 Metal Fabrication General1. 5 year maintenance check-up and refurbishment - $1,500. 1. Not applicable/
Div 15 Mechanical15200
15200-14
15201
15202
15204
Process Piping and Fittings
1. 10 year cleaning and labelling costs at $5,000. 1. Not applicable.
15205 Valves 1. 20 year refurbishment costs estimated at $15,000. 1. Not applicable.
15760 Unit Heaters 1. 20 year refurbishment costs estimated at $15,000. 1. Not applicable.15830
15900
15950
15955
Ventilation Infrastructure
10 year refurbishment costs - $5,000. 1. Refer to heating and ventilation
consumption costs calculations, above.
Div 16 Electrical
16556 Diesel Engine Generator Set1. Annual maintenance costs estimated at $2,500. Five year
refurbishment costs estimated at $5,000.
1. Refer to diesel fuel consumption costs
calculation, above.
16820 MCC and associated Infrastructure 1. 10 year maintenance costs estimated at $10,000. 1. Not applicable.
16xxx Cathodic Protection 1. Not applicable.
Note: O&M costs are assumed to be the same between Site 1 and Site 2
Sub-Total - Estimated Construction Cost - Present Value
Grand Total - Estimated 50 Yr Life Cycle Cost - Present Value
Sub-Total - Estimated Annual Energy Cost - Adjusted Annually for Inflation Factor
Sub-Total - Estimated Energy Cost Annual - Simple Cost
Sub-Total - Estimated Annual O&M Cost - Present Value
Sub-Total - Estimated Annual M/R Cost - Present Value - Adjusted Annually for Discount Factor
Sub-Total - Estimated 50 Yr O&M Costs - Present Value
Sub-Total - Estimated Annual M/R Cost - Adjusted Annually for Inflation Factor
Sub-Total - Estimated Annual Maintenance / Refurbishment Cost - Simple Cost
Sub-Total - Estimated Annual Energy Cost - Present Value - Adjusted Annually for Discount Factor
Pump Electricity Cost Calculation, Assumptions:
Financial Calculation Assumptions: Heating Cost Calculation, Assumptions:
Ventilation Cost Calculation, Assumptions:
Diesel Fuel Cost Calculation, Assumptions:
Design Alternative No. 1A
Maintenance/
Refurbish'tEnergy Costs
Maintenance/
Refurbish'tEnergy Costs
Maintenance/
Refurbish'tEnergy Costs
Maintenance/
Refurbish'tEnergy Costs
Maintenance/
Refurbish'tEnergy Costs
Maintenance/
Refurbish'tEnergy Costs
Maintenance/
Refurbish'tEnergy Costs
Maintenance/
Refurbish'tEnergy Costs
Maintenance/
Refurbish'tEnergy Costs
Maintenance/
Refurbish'tEnergy Costs
- - - - - - - - - - - - - - - - - 10,000$ -
5,000$ - 5,000$ - 5,000$ - 5,000$ - 15,000$ - 5,000$ - 5,000$ - 5,000$ - 5,000$ - 5,000$ -
- - - - - - - - - - - - - - - - - 24,485$ -
- - - - - - - - - - - - - - - - - -
- - - - - - - - - - - - - - - - - -
- - - - - - - - - - - - - - - - - -
- - - - - - - - - - - - - - - - - -
6,000$ 128,000$ 6,000$ 128,000$ 6,000$ 128,000$ 6,000$ 128,000$ 6,000$ 128,000$ 6,000$ 128,000$ 6,000$ 128,000$ 6,000$ 128,000$ 6,000$ 128,000$ 6,000$ 128,000$
20,000$ 20,000$ 20,000$ 20,000$ 20,000$ 20,000$ 20,000$ 20,000$ 20,000$ 20,000$
2,500$ - 2,500$ - 2,500$ - 2,500$ - 50,000$ - 2,500$ - 2,500$ - 2,500$ - 2,500$ - 2,500$ -
- - - - - - - - 1,500$ - - - - - - - - - 1,500$ -
- - - - - - - - - - - - - - - - - 5,000$ -
- - - - - - - - - - - - - - - - - -
- - - - - - - - - - - - - - - - - -
- 18,000$ - 18,000$ - 18,000$ - 18,000$ 18,000$ - 18,000$ - 18,000$ - 18,000$ - 18,000$ 18,000$
2,500$ -$ 2,500$ -$ 2,500$ -$ 2,500$ -$ 5,000$ -$ 2,500$ -$ 2,500$ -$ 2,500$ -$ 2,500$ -$ 5,000$ -$
- - - - - - - - - - - - - - - - - 10,000$ -
146,000$ 146,000$ 146,000$ 146,000$ 146,000$ 146,000$ 146,000$ 146,000$ 146,000$ 146,000$
490,545$ 505,262$ 520,419$ 536,032$ 552,113$ 568,676$ 585,737$ 603,309$ 621,408$ 640,050$
66,000$ 65,000$ 64,000$ 63,000$ 61,000$ 60,000$ 59,000$ 58,000$ 57,000$ 56,000$
36,000$ 36,000$ 36,000$ 36,000$ 97,500$ 36,000$ 36,000$ 36,000$ 36,000$ 89,485$
120,956$ 124,585$ 128,323$ 132,172$ 368,706$ 140,222$ 144,428$ 148,761$ 153,224$ 392,294$
16,000$ 16,000$ 16,000$ 15,000$ 41,000$ 15,000$ 15,000$ 14,000$ 14,000$ 34,000$
46 47 48 49 5041 42 43 44 45
71,000$ 90,000$ 82,000$ 81,000$ 80,000$ 78,000$ 102,000$ 75,000$ 74,000$ 72,000$
Page 5 of 5

Location: North or South of Salem, West of Hwy 400
Capital and Life Cycle Cost AnalysisPumping Station:
CIP Concrete, 4 pumps
(133L/s@60m, each)
Salem Rd Reservoir and PSReservoir Type:
Glass-Fused-to-Steel Reservoir, At-Grade,
20MLD
Discount Factor 5.0% Heating Load - Estimated kW 20
Inflation Factor 3.0% Estimated Operation (Months) 6
Study Period 50 Estimated Operation (Days) 180
Estimated Cost of Diesel Fuel per Litre1.00$
Estimated Operation in Hours (50% On/Off
Cycle)2,160
Estimated Electricity Cost $ per kWh 0.20$ Estimated Operation in kWh/yr 43,200
Reservoir Capacity (ML) 20 Ventilation Load - Estimated kW 12
Average Daily Flow Capacity (L/s):
Zone 3 Max Day Demand / Max Day Peaking
Factor - 1.75 / 2 (i.e., No. of Duty Pumping
Stations)
104.3 Estimated Operation (Months) 9
Total Firm Pumping Capacity (L/s) 403 Estimated Operation (Days) 270
Annual Station Flow (m3/year) 3,288,754
Estimated Operation in Hours
(50% On/Off Cycle)3,240
Pump Operating Flow - per Pump (L/s) 133 Estimated Operation in kWh/yr 38,880
No. of Duty Pumps 3
Total No. of Pump Operating Hours per Year
(hr/year)6869
Pump Power (KW) 93 Diesel Generator Size (Prime) - kW 250
Required Pump Power per Year at Ultimate
Flowrate (kW-h/year)638,793
Fuel Consumption - L/hr
(dieselserviceandsupply.com)68
Total No. of Mixer Operating Hours per Year @
50% for 6 months and 25% for 6 months
(hr/year)
19710 Estimated Operational Hours per Month (Hrs) 6
Pump Power (KW) 2.5 Estimated Operation per Year (Hours) 72
No. of Mixers 2 Estimated Annual Fuel Consumption (L)/yr 4,905
Required Mixer Power per Year at Ultimate
Flowrate (kW-h/year)98,550
Estimated Realization of Ultimate Flowrate
Years 1 - 5 25%
Years 6 - 10 50%
i Years 11 - 15 75%
Years 16 - 50 100%
Maintenance/
Refurbish'tEnergy Costs
Maintenance/
Refurbish'tEnergy Costs
Maintenance/
Refurbish'tEnergy Costs
Maintenance/
Refurbish'tEnergy Costs
Maintenance/
Refurbish'tEnergy Costs
Maintenance/
Refurbish'tEnergy Costs
Maintenance/
Refurbish'tEnergy Costs
Maintenance/
Refurbish'tEnergy Costs
Maintenance/
Refurbish'tEnergy Costs
Maintenance/
Refurbish'tEnergy Costs
Maintenance/
Refurbish'tEnergy Costs
Maintenance/
Refurbish'tEnergy Costs
Maintenance/
Refurbish'tEnergy Costs
Specification No. Specification / Asset Description Maintenance Cost Rationale Energy Cost Rationale
Div 2 Site Works
2315
2511
2530
2630
Sewerage, Watermain, Storm
1. 10 year maintenance costs including allowance of
$10,000 for CCTV inspection and cleaning/ flushing costs.
1. Not applicable
- - - - - - - - - - - - - - - - - - 10,000$ - - - - - - -
2741
2821
2911
2936
Asphalt, Fences, Finish Grading, Landscaping
1. 15 year maintenance cost of asphalt - $10,000.
2. 20 Year fence maintenance costs - $5,000.
3. Annual landscaping/snow cost estimate - $5,000.1. Not applicable. 5,000$ - 5,000$ - 5,000$ - 5,000$ - 5,000$ - 5,000$ - 5,000$ - 5,000$ - 5,000$ - 5,000$ - 5,000$ - 5,000$ - 5,000$ -
Div 3 Concrete Works
3200
3300Cast-In-Place Concrete
1. Concrete repair and resurfacing work estimated at
$5/m3 of CIP concrete. Total estimated concrete volume is
1,735 m3. Costs estimated every 15 years for crack repair
and resurfacing..
1. Not applicable.
- - - - - - - - - - - - - - - - - - - - - - - -
Div 7 Building Specialties
7000 Membrane Waterproofing 1. 20 year refurbishment costs estimated at $20,000 1. Not applicable. - - - - - - - - - - - - - - - - - - - - - - - - - -
Div 8 Metal Doors and Frames
8110
8710All Doors and Window Items
1. 20 year refurbishment costs of $5,000 1. Not applicable.- - - - - - - - - - - - - - - - - - - - - - - - - -
Div 9 Dry Wall and Painting
9900 All Finishing Items1. 20 Year Painting and wall refurbishment costs estimated
at $10,000.
1. Not applicable.- - - - - - - - - - - - - - - - - - - - - - - - - -
Div 10 Miscellaneous Specialties
10200 Louvres and Vents 1. 20 Year refurbishment costs estimated at $10,000. 1. Not applicable. - - - - - - - - - - - - - - - - - - - - - - - - - -
Div 11 Equipment
11000
11215
11560
11700
Pumps and Mixers
1. Estimated annual maintenance costs - $1,500 per pump.
Total of 4 pumps.
2. Estimated 20 year refurbishment costs - $10,000 per
pump.
1. Refer to pump electricity cost
calcuations, above.
6,000$ 55,200$ 6,000$ 55,200$ 6,000$ 55,200$ 6,000$ 55,200$ 6,000$ 55,200$ 6,000$ 90,400$ 6,000$ 90,400$ 6,000$ 90,400$ 6,000$ 90,400$ 6,000$ 90,400$ 6,000$ 125,600$ 6,000$ 125,600$ 6,000$ 125,600$
11260 Chemical Storage and Feed Equipment Estimated annual costs at $20,000 1. Not applicable. 20,000$ 20,000$ 20,000$ 20,000$ 20,000$ 20,000$ 20,000$ 20,000$ 20,000$ 20,000$ 20,000$ 20,000$ 20,000$
11xxx Glass-fused-Steel Bolted Tank and Cover Estimated bolted tank replacement at yr 45 1. Not applicable.
Div 13 Insrumentation and Control
13000 Instrumentation and Control Infrastructure
1. Annual instrumentation calibration costs estimated at
$2,500. 15 year instrumentation replacement and
refurbishment costs estimated at $50,000.
2,500$ - 2,500$ - 2,500$ - 2,500$ - 2,500$ - 2,500$ - 2,500$ - 2,500$ - 2,500$ - 2,500$ - 2,500$ - 2,500$ - 2,500$ -
Div 14 Monorail
14620 Metal Fabrication General1. 5 year maintenance check-up and refurbishment -
$1,500.
1. Not applicable/- - - - - - - - 1,500$ - - - - - - - - - 1,500$ - - - - - - -
Div 15 Mechanical
15200
15200-14
15201
15202
15204
Process Piping and Fittings
1. 10 year cleaning and labelling costs at $5,000. 1. Not applicable.
- - - - - - - - - - - - - - - - - - 5,000$ - - - - - - -
15205 Valves 1. 20 year refurbishment costs estimated at $15,000. 1. Not applicable. - - - - - - - - - - - - - - - - - - - - - - - - - -
15760 Unit Heaters 1. 20 year refurbishment costs estimated at $15,000. 1. Not applicable. - - - - - - - - - - - - - - - - - - - - - - - - -
15830
15900
15950
15955
Ventilation Infrastructure
10 year refurbishment costs - $5,000. 1. Refer to heating and ventilation
consumption costs calculations,
above.- 16,000$ - 16,000$ - 16,000$ - 16,000$ 16,000$ - 16,000$ - 16,000$ - 16,000$ - 16,000$ 5,000$ 16,000$ - 16,000$ - 16,000$ - 16,000$
Div 16 Electrical
16556 Diesel Engine Generator Set1. Annual maintenance costs estimated at $2,500. Five
year refurbishment costs estimated at $5,000.
1. Refer to diesel fuel consumption
costs calculation, above.2,500$ 5,000$ 2,500$ 5,000$ 2,500$ 5,000$ 2,500$ 5,000$ 7,500$ 5,000$ 2,500$ 5,000$ 2,500$ 5,000$ 2,500$ 5,000$ 2,500$ 5,000$ 7,500$ 5,000$ 2,500$ 5,000$ 2,500$ 5,000$ 2,500$ 5,000$
16820 MCC and associated Infrastructure 1. 10 year maintenance costs estimated at $10,000. 1. Not applicable. - - - - - - - - - - - - - - - - - - 10,000$ - - - - - - -
16xxx Cathodic Protection 1. 10 year sacraficial anode replacement at $10,000. 1. Not applicable. 10,000$
76,000$ 76,000$ 76,000$ 76,000$ 76,000$ 111,000$ 111,000$ 111,000$ 111,000$ 111,000$ 147,000$ 147,000$ 147,000$
Note: O&M costs are assumed to be the same between Site 1 and Site 2 78,280$ 80,628$ 83,047$ 85,539$ 88,105$ 132,540$ 136,516$ 140,611$ 144,830$ 149,175$ 203,482$ 209,587$ 215,874$
75,000$ 73,000$ 72,000$ 70,000$ 69,000$ 99,000$ 97,000$ 95,000$ 93,000$ 92,000$ 119,000$ 117,000$ 114,000$
36,000$ 36,000$ 36,000$ 36,000$ 42,500$ 36,000$ 36,000$ 36,000$ 36,000$ 82,500$ 36,000$ 36,000$ 36,000$
37,080$ 38,192$ 39,338$ 40,518$ 49,269$ 42,986$ 44,275$ 45,604$ 46,972$ 110,873$ 49,832$ 51,327$ 52,867$
35,000$ 35,000$ 34,000$ 33,000$ 39,000$ 32,000$ 31,000$ 31,000$ 30,000$ 68,000$ 29,000$ 29,000$ 28,000$
8,644,000$
21,224,400$ *obtained from Capital Cost Estimate Spreadsheet
29,868,400$
21,774,000$
30,418,000$
2 3 4 5
Design Alternatives No. 2A & 2B
Financial Calculation Assumptions: Heating Cost Calculation, Assumptions:
Pump & Mixer Electricity Cost Calculation, Assumptions: Ventilation Cost Calculation, Assumptions:
Diesel Fuel Cost Calculation, Assumptions:
12 13
Sub-Total - Estimated Annual M/R Cost - Adjusted Annually for Inflation Factor
Sub-Total - Estimated Annual M/R Cost - Present Value - Adjusted Annually for Discount
Factor
Sub-Total - Estimated Annual O&M Cost - Present Value 110,000$ 108,000$
Sub-Total - Estimated Energy Cost Annual - Simple Cost
Sub-Total - Estimated Annual Energy Cost - Adjusted Annually for Inflation Factor
Sub-Total - Estimated Annual Energy Cost - Present Value - Adjusted Annually for
Discount Factor
6 7 8 9 10 111
Sub-Total - Estimated Annual Maintenance / Refurbishment Cost - Simple Cost
Grand Total - Estimated 50 Yr Life Cycle Cost - 2B Present Value
160,000$ 148,000$ 146,000$ 142,000$
Sub-Total - Estimated Construction Cost - 2B Present Value
Grand Total - Estimated 50 Yr Life Cycle Cost - 2A Present Value
Sub-Total - Estimated 50 Yr O&M Costs - Present Value
Sub-Total - Estimated Construction Cost - 2A Present Value
103,000$ 108,000$ 131,000$ 128,000$ 126,000$ 123,000$ 106,000$
Page 1 of 4

Location: North or South of Salem, West of Hwy 400
Capital and Life Cycle Cost AnalysisPumping Station:
CIP Concrete, 4 pumps
(133L/s@60m, each)
Salem Rd Reservoir and PSReservoir Type:
Glass-Fused-to-Steel Reservoir, At-Grade,
20MLD
Discount Factor 5.0% Heating Load - Estimated kW 20
Inflation Factor 3.0% Estimated Operation (Months) 6
Study Period 50 Estimated Operation (Days) 180
Estimated Cost of Diesel Fuel per Litre1.00$
Estimated Operation in Hours (50% On/Off
Cycle)2,160
Estimated Electricity Cost $ per kWh 0.20$ Estimated Operation in kWh/yr 43,200
Reservoir Capacity (ML) 20 Ventilation Load - Estimated kW 12
Average Daily Flow Capacity (L/s):
Zone 3 Max Day Demand / Max Day Peaking
Factor - 1.75 / 2 (i.e., No. of Duty Pumping
Stations)
104.3 Estimated Operation (Months) 9
Total Firm Pumping Capacity (L/s) 403 Estimated Operation (Days) 270
Annual Station Flow (m3/year) 3,288,754
Estimated Operation in Hours
(50% On/Off Cycle)3,240
Pump Operating Flow - per Pump (L/s) 133 Estimated Operation in kWh/yr 38,880
No. of Duty Pumps 3
Total No. of Pump Operating Hours per Year
(hr/year)6869
Pump Power (KW) 93 Diesel Generator Size (Prime) - kW 250
Required Pump Power per Year at Ultimate
Flowrate (kW-h/year)638,793
Fuel Consumption - L/hr
(dieselserviceandsupply.com)68
Total No. of Mixer Operating Hours per Year @
50% for 6 months and 25% for 6 months
(hr/year)
19710 Estimated Operational Hours per Month (Hrs) 6
Pump Power (KW) 2.5 Estimated Operation per Year (Hours) 72
No. of Mixers 2 Estimated Annual Fuel Consumption (L)/yr 4,905
Required Mixer Power per Year at Ultimate
Flowrate (kW-h/year)98,550
Estimated Realization of Ultimate Flowrate
Years 1 - 5 25%
Years 6 - 10 50%
i Years 11 - 15 75%
Years 16 - 50 100%
Specification No. Specification / Asset Description Maintenance Cost Rationale Energy Cost Rationale
Div 2 Site Works
2315
2511
2530
2630
Sewerage, Watermain, Storm
1. 10 year maintenance costs including allowance of
$10,000 for CCTV inspection and cleaning/ flushing costs.
1. Not applicable
2741
2821
2911
2936
Asphalt, Fences, Finish Grading, Landscaping
1. 15 year maintenance cost of asphalt - $10,000.
2. 20 Year fence maintenance costs - $5,000.
3. Annual landscaping/snow cost estimate - $5,000.1. Not applicable.
Div 3 Concrete Works
3200
3300Cast-In-Place Concrete
1. Concrete repair and resurfacing work estimated at
$5/m3 of CIP concrete. Total estimated concrete volume is
1,735 m3. Costs estimated every 15 years for crack repair
and resurfacing..
1. Not applicable.
Div 7 Building Specialties
7000 Membrane Waterproofing 1. 20 year refurbishment costs estimated at $20,000 1. Not applicable.
Div 8 Metal Doors and Frames
8110
8710All Doors and Window Items
1. 20 year refurbishment costs of $5,000 1. Not applicable.
Div 9 Dry Wall and Painting
9900 All Finishing Items1. 20 Year Painting and wall refurbishment costs estimated
at $10,000.
1. Not applicable.
Div 10 Miscellaneous Specialties
10200 Louvres and Vents 1. 20 Year refurbishment costs estimated at $10,000. 1. Not applicable.
Div 11 Equipment
11000
11215
11560
11700
Pumps and Mixers
1. Estimated annual maintenance costs - $1,500 per pump.
Total of 4 pumps.
2. Estimated 20 year refurbishment costs - $10,000 per
pump.
1. Refer to pump electricity cost
calcuations, above.
11260 Chemical Storage and Feed Equipment Estimated annual costs at $20,000 1. Not applicable.
11xxx Glass-fused-Steel Bolted Tank and Cover Estimated bolted tank replacement at yr 45 1. Not applicable.
Div 13 Insrumentation and Control
13000 Instrumentation and Control Infrastructure
1. Annual instrumentation calibration costs estimated at
$2,500. 15 year instrumentation replacement and
refurbishment costs estimated at $50,000.
Div 14 Monorail
14620 Metal Fabrication General1. 5 year maintenance check-up and refurbishment -
$1,500.
1. Not applicable/
Div 15 Mechanical
15200
15200-14
15201
15202
15204
Process Piping and Fittings
1. 10 year cleaning and labelling costs at $5,000. 1. Not applicable.
15205 Valves 1. 20 year refurbishment costs estimated at $15,000. 1. Not applicable.
15760 Unit Heaters 1. 20 year refurbishment costs estimated at $15,000. 1. Not applicable.
15830
15900
15950
15955
Ventilation Infrastructure
10 year refurbishment costs - $5,000. 1. Refer to heating and ventilation
consumption costs calculations,
above.
Div 16 Electrical
16556 Diesel Engine Generator Set1. Annual maintenance costs estimated at $2,500. Five
year refurbishment costs estimated at $5,000.
1. Refer to diesel fuel consumption
costs calculation, above.
16820 MCC and associated Infrastructure 1. 10 year maintenance costs estimated at $10,000. 1. Not applicable.
16xxx Cathodic Protection 1. 10 year sacraficial anode replacement at $10,000. 1. Not applicable.
Note: O&M costs are assumed to be the same between Site 1 and Site 2
Design Alternatives No. 2A & 2B
Financial Calculation Assumptions: Heating Cost Calculation, Assumptions:
Pump & Mixer Electricity Cost Calculation, Assumptions: Ventilation Cost Calculation, Assumptions:
Diesel Fuel Cost Calculation, Assumptions:
Sub-Total - Estimated Annual M/R Cost - Adjusted Annually for Inflation Factor
Sub-Total - Estimated Annual M/R Cost - Present Value - Adjusted Annually for Discount
Factor
Sub-Total - Estimated Annual O&M Cost - Present Value
Sub-Total - Estimated Energy Cost Annual - Simple Cost
Sub-Total - Estimated Annual Energy Cost - Adjusted Annually for Inflation Factor
Sub-Total - Estimated Annual Energy Cost - Present Value - Adjusted Annually for
Discount Factor
Sub-Total - Estimated Annual Maintenance / Refurbishment Cost - Simple Cost
Grand Total - Estimated 50 Yr Life Cycle Cost - 2B Present Value
Sub-Total - Estimated Construction Cost - 2B Present Value
Grand Total - Estimated 50 Yr Life Cycle Cost - 2A Present Value
Sub-Total - Estimated 50 Yr O&M Costs - Present Value
Sub-Total - Estimated Construction Cost - 2A Present Value
Maintenance/
Refurbish'tEnergy Costs
Maintenance/
Refurbish'tEnergy Costs
Maintenance/
Refurbish'tEnergy Costs
Maintenance/
Refurbish'tEnergy Costs
Maintenance/
Refurbish'tEnergy Costs
Maintenance/
Refurbish'tEnergy Costs
Maintenance/
Refurbish'tEnergy Costs
Maintenance/
Refurbish'tEnergy Costs
Maintenance/
Refurbish'tEnergy Costs
Maintenance/
Refurbish'tEnergy Costs
Maintenance/
Refurbish'tEnergy Costs
Maintenance/
Refurbish'tEnergy Costs
Maintenance/
Refurbish'tEnergy Costs
- - - - - - - - - - - - 10,000$ - - - - - - - - - - - - -
5,000$ - 15,000$ - 5,000$ - 5,000$ - 5,000$ - 5,000$ - 10,000$ - 5,000$ - 5,000$ - 5,000$ - 5,000$ - 5,000$ - 5,000$ -
- - 8,750$ - - - - - - - - - - - - - - - - - - - - -
- - - - - - - - - - - - 20,000$ - - - - - - - - - - - - -
- - - - - - - - - - - - 5,000$ - - - - - - - - - - - - -
- - - - - - - - - - - - 10,000$ - - - - - - - - - - - - -
- - - - - - - - - - - - 10,000$ - - - - - - - - - - - - -
6,000$ 125,600$ 6,000$ 125,600$ 6,000$ 160,800$ 6,000$ 160,800$ 6,000$ 160,800$ 6,000$ 160,800$ 40,000$ 160,800$ 6,000$ 160,800$ 6,000$ 160,800$ 6,000$ 160,800$ 6,000$ 160,800$ 6,000$ 160,800$ 6,000$ 160,800$
20,000$ 20,000$ 20,000$ 20,000$ 20,000$ 20,000$ 20,000$ 20,000$ 20,000$ 20,000$ 20,000$ 20,000$ 20,000$
2,500$ - 50,000$ - 2,500$ - 2,500$ - 2,500$ - 2,500$ - 2,500$ - 2,500$ - 2,500$ - 2,500$ - 2,500$ - 2,500$ - 2,500$ -
- - 1,500$ - - - - - - - - - 1,500$ - - - - - - - - - 1,500$ - - -
- - - - - - - - - - - - 5,000$ - - - - - - - - - - - - -
- - - - - - - - - - - - 15,000$ - - - - - - - - - - - - -
- - - - - - - - - - - - 15,000$ - - - - - - - - - - - - -
- 16,000$ 16,000$ - 16,000$ - 16,000$ - 16,000$ - 16,000$ 5,000$ 16,000$ - 16,000$ - 16,000$ - 16,000$ - 16,000$ 16,000$ - 16,000$
2,500$ 5,000$ 7,500$ 5,000$ 2,500$ 5,000$ 2,500$ 5,000$ 2,500$ 5,000$ 2,500$ 5,000$ 7,500$ 5,000$ 2,500$ 5,000$ 2,500$ 5,000$ 2,500$ 5,000$ 2,500$ 5,000$ 7,500$ 5,000$ 2,500$ 5,000$
- - - - - - - - - - - - 10,000$ - - - - - - - - - - - - -
10,000$
147,000$ 147,000$ 182,000$ 182,000$ 182,000$ 182,000$ 182,000$ 182,000$ 182,000$ 182,000$ 182,000$ 182,000$ 182,000$
222,351$ 229,021$ 292,057$ 300,818$ 309,843$ 319,138$ 328,712$ 338,574$ 348,731$ 359,193$ 369,969$ 381,068$ 392,500$
112,000$ 110,000$ 134,000$ 131,000$ 129,000$ 126,000$ 124,000$ 122,000$ 119,000$ 117,000$ 115,000$ 113,000$ 110,000$
36,000$ 108,750$ 36,000$ 36,000$ 36,000$ 36,000$ 196,500$ 36,000$ 36,000$ 36,000$ 36,000$ 42,500$ 36,000$
54,453$ 169,429$ 57,769$ 59,503$ 61,288$ 63,126$ 354,901$ 66,971$ 68,980$ 71,049$ 73,181$ 88,986$ 77,637$
28,000$ 81,000$ 26,000$ 26,000$ 25,000$ 25,000$ 134,000$ 24,000$ 24,000$ 23,000$ 23,000$ 26,000$ 22,000$
2618 19 20 21 22 2314 15 16 17 24 25
143,000$ 140,000$ 138,000$ 140,000$ 160,000$ 157,000$ 154,000$ 151,000$ 258,000$ 146,000$ 132,000$ 191,000$ 139,000$
Page 2 of 4

Location: North or South of Salem, West of Hwy 400
Capital and Life Cycle Cost AnalysisPumping Station:
CIP Concrete, 4 pumps
(133L/s@60m, each)
Salem Rd Reservoir and PSReservoir Type:
Glass-Fused-to-Steel Reservoir, At-Grade,
20MLD
Discount Factor 5.0% Heating Load - Estimated kW 20
Inflation Factor 3.0% Estimated Operation (Months) 6
Study Period 50 Estimated Operation (Days) 180
Estimated Cost of Diesel Fuel per Litre1.00$
Estimated Operation in Hours (50% On/Off
Cycle)2,160
Estimated Electricity Cost $ per kWh 0.20$ Estimated Operation in kWh/yr 43,200
Reservoir Capacity (ML) 20 Ventilation Load - Estimated kW 12
Average Daily Flow Capacity (L/s):
Zone 3 Max Day Demand / Max Day Peaking
Factor - 1.75 / 2 (i.e., No. of Duty Pumping
Stations)
104.3 Estimated Operation (Months) 9
Total Firm Pumping Capacity (L/s) 403 Estimated Operation (Days) 270
Annual Station Flow (m3/year) 3,288,754
Estimated Operation in Hours
(50% On/Off Cycle)3,240
Pump Operating Flow - per Pump (L/s) 133 Estimated Operation in kWh/yr 38,880
No. of Duty Pumps 3
Total No. of Pump Operating Hours per Year
(hr/year)6869
Pump Power (KW) 93 Diesel Generator Size (Prime) - kW 250
Required Pump Power per Year at Ultimate
Flowrate (kW-h/year)638,793
Fuel Consumption - L/hr
(dieselserviceandsupply.com)68
Total No. of Mixer Operating Hours per Year @
50% for 6 months and 25% for 6 months
(hr/year)
19710 Estimated Operational Hours per Month (Hrs) 6
Pump Power (KW) 2.5 Estimated Operation per Year (Hours) 72
No. of Mixers 2 Estimated Annual Fuel Consumption (L)/yr 4,905
Required Mixer Power per Year at Ultimate
Flowrate (kW-h/year)98,550
Estimated Realization of Ultimate Flowrate
Years 1 - 5 25%
Years 6 - 10 50%
i Years 11 - 15 75%
Years 16 - 50 100%
Specification No. Specification / Asset Description Maintenance Cost Rationale Energy Cost Rationale
Div 2 Site Works
2315
2511
2530
2630
Sewerage, Watermain, Storm
1. 10 year maintenance costs including allowance of
$10,000 for CCTV inspection and cleaning/ flushing costs.
1. Not applicable
2741
2821
2911
2936
Asphalt, Fences, Finish Grading, Landscaping
1. 15 year maintenance cost of asphalt - $10,000.
2. 20 Year fence maintenance costs - $5,000.
3. Annual landscaping/snow cost estimate - $5,000.1. Not applicable.
Div 3 Concrete Works
3200
3300Cast-In-Place Concrete
1. Concrete repair and resurfacing work estimated at
$5/m3 of CIP concrete. Total estimated concrete volume is
1,735 m3. Costs estimated every 15 years for crack repair
and resurfacing..
1. Not applicable.
Div 7 Building Specialties
7000 Membrane Waterproofing 1. 20 year refurbishment costs estimated at $20,000 1. Not applicable.
Div 8 Metal Doors and Frames
8110
8710All Doors and Window Items
1. 20 year refurbishment costs of $5,000 1. Not applicable.
Div 9 Dry Wall and Painting
9900 All Finishing Items1. 20 Year Painting and wall refurbishment costs estimated
at $10,000.
1. Not applicable.
Div 10 Miscellaneous Specialties
10200 Louvres and Vents 1. 20 Year refurbishment costs estimated at $10,000. 1. Not applicable.
Div 11 Equipment
11000
11215
11560
11700
Pumps and Mixers
1. Estimated annual maintenance costs - $1,500 per pump.
Total of 4 pumps.
2. Estimated 20 year refurbishment costs - $10,000 per
pump.
1. Refer to pump electricity cost
calcuations, above.
11260 Chemical Storage and Feed Equipment Estimated annual costs at $20,000 1. Not applicable.
11xxx Glass-fused-Steel Bolted Tank and Cover Estimated bolted tank replacement at yr 45 1. Not applicable.
Div 13 Insrumentation and Control
13000 Instrumentation and Control Infrastructure
1. Annual instrumentation calibration costs estimated at
$2,500. 15 year instrumentation replacement and
refurbishment costs estimated at $50,000.
Div 14 Monorail
14620 Metal Fabrication General1. 5 year maintenance check-up and refurbishment -
$1,500.
1. Not applicable/
Div 15 Mechanical
15200
15200-14
15201
15202
15204
Process Piping and Fittings
1. 10 year cleaning and labelling costs at $5,000. 1. Not applicable.
15205 Valves 1. 20 year refurbishment costs estimated at $15,000. 1. Not applicable.
15760 Unit Heaters 1. 20 year refurbishment costs estimated at $15,000. 1. Not applicable.
15830
15900
15950
15955
Ventilation Infrastructure
10 year refurbishment costs - $5,000. 1. Refer to heating and ventilation
consumption costs calculations,
above.
Div 16 Electrical
16556 Diesel Engine Generator Set1. Annual maintenance costs estimated at $2,500. Five
year refurbishment costs estimated at $5,000.
1. Refer to diesel fuel consumption
costs calculation, above.
16820 MCC and associated Infrastructure 1. 10 year maintenance costs estimated at $10,000. 1. Not applicable.
16xxx Cathodic Protection 1. 10 year sacraficial anode replacement at $10,000. 1. Not applicable.
Note: O&M costs are assumed to be the same between Site 1 and Site 2
Design Alternatives No. 2A & 2B
Financial Calculation Assumptions: Heating Cost Calculation, Assumptions:
Pump & Mixer Electricity Cost Calculation, Assumptions: Ventilation Cost Calculation, Assumptions:
Diesel Fuel Cost Calculation, Assumptions:
Sub-Total - Estimated Annual M/R Cost - Adjusted Annually for Inflation Factor
Sub-Total - Estimated Annual M/R Cost - Present Value - Adjusted Annually for Discount
Factor
Sub-Total - Estimated Annual O&M Cost - Present Value
Sub-Total - Estimated Energy Cost Annual - Simple Cost
Sub-Total - Estimated Annual Energy Cost - Adjusted Annually for Inflation Factor
Sub-Total - Estimated Annual Energy Cost - Present Value - Adjusted Annually for
Discount Factor
Sub-Total - Estimated Annual Maintenance / Refurbishment Cost - Simple Cost
Grand Total - Estimated 50 Yr Life Cycle Cost - 2B Present Value
Sub-Total - Estimated Construction Cost - 2B Present Value
Grand Total - Estimated 50 Yr Life Cycle Cost - 2A Present Value
Sub-Total - Estimated 50 Yr O&M Costs - Present Value
Sub-Total - Estimated Construction Cost - 2A Present Value
Maintenance/
Refurbish'tEnergy Costs
Maintenance/
Refurbish'tEnergy Costs
Maintenance/
Refurbish'tEnergy Costs
Maintenance/
Refurbish'tEnergy Costs
Maintenance/
Refurbish'tEnergy Costs
Maintenance/
Refurbish'tEnergy Costs
Maintenance/
Refurbish'tEnergy Costs
Maintenance/
Refurbish'tEnergy Costs
Maintenance/
Refurbish'tEnergy Costs
Maintenance/
Refurbish'tEnergy Costs
Maintenance/
Refurbish'tEnergy Costs
Maintenance/
Refurbish'tEnergy Costs
Maintenance/
Refurbish'tEnergy Costs
- - - - - - 10,000$ - - - - - - - - - - - - - - - - -
5,000$ - 5,000$ - 5,000$ - 15,000$ - 5,000$ - 5,000$ - 5,000$ - 5,000$ - 5,000$ 5,000$ - 5,000$ - 5,000$ - 5,000$ -
- - - - - - 8,750$ - - - - - - - - - - - - - - - - -
- - - - - - - - - - - - - - - - - - - - - - - -
- - - - - - - - - - - - - - - - - - - - - - -
- - - - - - - - - - - - - - - - - - - - - - - -
- - - - - - - - - - - - - - - - - - - - - - - -
6,000$ 160,800$ 6,000$ 160,800$ 6,000$ 160,800$ 6,000$ 160,800$ 6,000$ 160,800$ 6,000$ 160,800$ 6,000$ 160,800$ 6,000$ 160,800$ 6,000$ 160,800$ 6,000$ 160,800$ 6,000$ 160,800$ 6,000$ 160,800$ 6,000$ 160,800$
20,000$ 20,000$ 20,000$ 20,000$ 20,000$ 20,000$ 20,000$ 20,000$ 20,000$ 20,000$ 20,000$ 20,000$ 20,000$
2,500$ - 2,500$ - 2,500$ - 50,000$ - 2,500$ - 2,500$ - 2,500$ - 2,500$ - 2,500$ 2,500$ - 2,500$ - 2,500$ - 2,500$ -
- - - - - - 1,500$ - - - - - - - - - 1,500$ - - - - - - - -
- - - - - - 5,000$ - - - - - - ` - - - - - - - - - -
- - - - - - - - - - - - - - - - - - - - - - - -
- - - - - - - - - - - - - - - - - - - - - - -
- 16,000$ - 16,000$ - 16,000$ 5,000$ 16,000$ - 16,000$ - 16,000$ - 16,000$ - 16,000$ 16,000$ - 16,000$ - 16,000$ - 16,000$ - 16,000$
2,500$ 5,000$ 2,500$ 5,000$ 2,500$ 5,000$ 7,500$ 5,000$ 2,500$ -$ 2,500$ -$ 2,500$ -$ 2,500$ -$ 7,500$ 2,500$ -$ 2,500$ -$ 2,500$ -$ 2,500$ -$
- - - - - - 10,000$ - - - - - - - - - - - - - - - - -
10,000$
182,000$ 182,000$ 182,000$ 182,000$ 177,000$ 177,000$ 177,000$ 177,000$ 177,000$ 177,000$ 177,000$ 177,000$ 177,000$
404,275$ 416,403$ 428,895$ 441,762$ 442,514$ 455,790$ 469,463$ 483,547$ 498,054$ 512,995$ 528,385$ 544,237$ 560,564$
108,000$ 106,000$ 104,000$ 102,000$ 98,000$ 96,000$ 94,000$ 92,000$ 90,000$ 89,000$ 87,000$ 85,000$ 84,000$
36,000$ 36,000$ 36,000$ 148,750$ 36,000$ 36,000$ 36,000$ 36,000$ 42,500$ 36,000$ 36,000$ 36,000$ 36,000$
79,966$ 82,365$ 84,836$ 361,055$ 90,003$ 92,703$ 95,484$ 98,349$ 119,589$ 104,338$ 107,468$ 110,692$ 114,013$
21,000$ 21,000$ 21,000$ 84,000$ 20,000$ 19,000$ 19,000$ 19,000$ 22,000$ 18,000$ 18,000$ 17,000$ 17,000$
27 3028 29
127,000$ 125,000$ 186,000$ 129,000$
36 37 38 3931 32 33 34 35
107,000$ 105,000$ 102,000$ 101,000$ 118,000$ 115,000$ 113,000$ 111,000$ 112,000$
Page 3 of 4

Location: North or South of Salem, West of Hwy 400
Capital and Life Cycle Cost AnalysisPumping Station:
CIP Concrete, 4 pumps
(133L/s@60m, each)
Salem Rd Reservoir and PSReservoir Type:
Glass-Fused-to-Steel Reservoir, At-Grade,
20MLD
Discount Factor 5.0% Heating Load - Estimated kW 20
Inflation Factor 3.0% Estimated Operation (Months) 6
Study Period 50 Estimated Operation (Days) 180
Estimated Cost of Diesel Fuel per Litre1.00$
Estimated Operation in Hours (50% On/Off
Cycle)2,160
Estimated Electricity Cost $ per kWh 0.20$ Estimated Operation in kWh/yr 43,200
Reservoir Capacity (ML) 20 Ventilation Load - Estimated kW 12
Average Daily Flow Capacity (L/s):
Zone 3 Max Day Demand / Max Day Peaking
Factor - 1.75 / 2 (i.e., No. of Duty Pumping
Stations)
104.3 Estimated Operation (Months) 9
Total Firm Pumping Capacity (L/s) 403 Estimated Operation (Days) 270
Annual Station Flow (m3/year) 3,288,754
Estimated Operation in Hours
(50% On/Off Cycle)3,240
Pump Operating Flow - per Pump (L/s) 133 Estimated Operation in kWh/yr 38,880
No. of Duty Pumps 3
Total No. of Pump Operating Hours per Year
(hr/year)6869
Pump Power (KW) 93 Diesel Generator Size (Prime) - kW 250
Required Pump Power per Year at Ultimate
Flowrate (kW-h/year)638,793
Fuel Consumption - L/hr
(dieselserviceandsupply.com)68
Total No. of Mixer Operating Hours per Year @
50% for 6 months and 25% for 6 months
(hr/year)
19710 Estimated Operational Hours per Month (Hrs) 6
Pump Power (KW) 2.5 Estimated Operation per Year (Hours) 72
No. of Mixers 2 Estimated Annual Fuel Consumption (L)/yr 4,905
Required Mixer Power per Year at Ultimate
Flowrate (kW-h/year)98,550
Estimated Realization of Ultimate Flowrate
Years 1 - 5 25%
Years 6 - 10 50%
i Years 11 - 15 75%
Years 16 - 50 100%
Specification No. Specification / Asset Description Maintenance Cost Rationale Energy Cost Rationale
Div 2 Site Works
2315
2511
2530
2630
Sewerage, Watermain, Storm
1. 10 year maintenance costs including allowance of
$10,000 for CCTV inspection and cleaning/ flushing costs.
1. Not applicable
2741
2821
2911
2936
Asphalt, Fences, Finish Grading, Landscaping
1. 15 year maintenance cost of asphalt - $10,000.
2. 20 Year fence maintenance costs - $5,000.
3. Annual landscaping/snow cost estimate - $5,000.1. Not applicable.
Div 3 Concrete Works
3200
3300Cast-In-Place Concrete
1. Concrete repair and resurfacing work estimated at
$5/m3 of CIP concrete. Total estimated concrete volume is
1,735 m3. Costs estimated every 15 years for crack repair
and resurfacing..
1. Not applicable.
Div 7 Building Specialties
7000 Membrane Waterproofing 1. 20 year refurbishment costs estimated at $20,000 1. Not applicable.
Div 8 Metal Doors and Frames
8110
8710All Doors and Window Items
1. 20 year refurbishment costs of $5,000 1. Not applicable.
Div 9 Dry Wall and Painting
9900 All Finishing Items1. 20 Year Painting and wall refurbishment costs estimated
at $10,000.
1. Not applicable.
Div 10 Miscellaneous Specialties
10200 Louvres and Vents 1. 20 Year refurbishment costs estimated at $10,000. 1. Not applicable.
Div 11 Equipment
11000
11215
11560
11700
Pumps and Mixers
1. Estimated annual maintenance costs - $1,500 per pump.
Total of 4 pumps.
2. Estimated 20 year refurbishment costs - $10,000 per
pump.
1. Refer to pump electricity cost
calcuations, above.
11260 Chemical Storage and Feed Equipment Estimated annual costs at $20,000 1. Not applicable.
11xxx Glass-fused-Steel Bolted Tank and Cover Estimated bolted tank replacement at yr 45 1. Not applicable.
Div 13 Insrumentation and Control
13000 Instrumentation and Control Infrastructure
1. Annual instrumentation calibration costs estimated at
$2,500. 15 year instrumentation replacement and
refurbishment costs estimated at $50,000.
Div 14 Monorail
14620 Metal Fabrication General1. 5 year maintenance check-up and refurbishment -
$1,500.
1. Not applicable/
Div 15 Mechanical
15200
15200-14
15201
15202
15204
Process Piping and Fittings
1. 10 year cleaning and labelling costs at $5,000. 1. Not applicable.
15205 Valves 1. 20 year refurbishment costs estimated at $15,000. 1. Not applicable.
15760 Unit Heaters 1. 20 year refurbishment costs estimated at $15,000. 1. Not applicable.
15830
15900
15950
15955
Ventilation Infrastructure
10 year refurbishment costs - $5,000. 1. Refer to heating and ventilation
consumption costs calculations,
above.
Div 16 Electrical
16556 Diesel Engine Generator Set1. Annual maintenance costs estimated at $2,500. Five
year refurbishment costs estimated at $5,000.
1. Refer to diesel fuel consumption
costs calculation, above.
16820 MCC and associated Infrastructure 1. 10 year maintenance costs estimated at $10,000. 1. Not applicable.
16xxx Cathodic Protection 1. 10 year sacraficial anode replacement at $10,000. 1. Not applicable.
Note: O&M costs are assumed to be the same between Site 1 and Site 2
Design Alternatives No. 2A & 2B
Financial Calculation Assumptions: Heating Cost Calculation, Assumptions:
Pump & Mixer Electricity Cost Calculation, Assumptions: Ventilation Cost Calculation, Assumptions:
Diesel Fuel Cost Calculation, Assumptions:
Sub-Total - Estimated Annual M/R Cost - Adjusted Annually for Inflation Factor
Sub-Total - Estimated Annual M/R Cost - Present Value - Adjusted Annually for Discount
Factor
Sub-Total - Estimated Annual O&M Cost - Present Value
Sub-Total - Estimated Energy Cost Annual - Simple Cost
Sub-Total - Estimated Annual Energy Cost - Adjusted Annually for Inflation Factor
Sub-Total - Estimated Annual Energy Cost - Present Value - Adjusted Annually for
Discount Factor
Sub-Total - Estimated Annual Maintenance / Refurbishment Cost - Simple Cost
Grand Total - Estimated 50 Yr Life Cycle Cost - 2B Present Value
Sub-Total - Estimated Construction Cost - 2B Present Value
Grand Total - Estimated 50 Yr Life Cycle Cost - 2A Present Value
Sub-Total - Estimated 50 Yr O&M Costs - Present Value
Sub-Total - Estimated Construction Cost - 2A Present Value
Maintenance/
Refurbish'tEnergy Costs
Maintenance/
Refurbish'tEnergy Costs
Maintenance/
Refurbish'tEnergy Costs
Maintenance/
Refurbish'tEnergy Costs
Maintenance/
Refurbish'tEnergy Costs
Maintenance/
Refurbish'tEnergy Costs
Maintenance/
Refurbish'tEnergy Costs
Maintenance/
Refurbish'tEnergy Costs
Maintenance/
Refurbish'tEnergy Costs
Maintenance/
Refurbish'tEnergy Costs
Maintenance/
Refurbish'tEnergy Costs
10,000$ - - - - - - - - - - - - - - - - 10,000$
10,000$ 5,000$ - 5,000$ - 5,000$ - 5,000$ - 15,000$ 5,000$ - 5,000$ - 5,000$ - 5,000$ - 5,000$
- - - - - - - - 8,750$ - - - - - - - -
20,000$ - - - - - - - - - - - - - - - -
5,000$ - - - - - - - - - - - - - - - -
10,000$ - - - - - - - - - - - - - - - -
10,000$ - - - - - - - - - - - - - - - -
40,000$ 160,800$ 6,000$ 160,800$ 6,000$ 160,800$ 6,000$ 160,800$ 6,000$ 160,800$ 160,800$ 6,000$ 160,800$ 6,000$ 160,800$ 6,000$ 160,800$ 6,000$ 160,800$ 6,000$ 160,800$
20,000$ 20,000$ 20,000$ 20,000$ 20,000$ 20,000$ 20,000$ 20,000$ 20,000$
5,500,000$
2,500$ 2,500$ - 2,500$ - 2,500$ - 2,500$ - 50,000$ 2,500$ - 2,500$ - 2,500$ - 2,500$ - 2,500$
1,500$ - - - - - - - - 1,500$ - - - - - - - - 1,500$
5,000$ - - - - - - - - - - - - - - - - 5,000$
15,000$ - - - - - - - - - - - - - - - -
15,000$ - - - - - - - - - - - - - - - -
5,000$ 16,000$ - 16,000$ - 16,000$ - 16,000$ - 16,000$ 16,000$ - 16,000$ - 16,000$ - 16,000$ - 16,000$ 5,000$ 16,000$
7,500$ 2,500$ -$ 2,500$ -$ 2,500$ -$ 2,500$ -$ 7,500$ 2,500$ -$ 2,500$ -$ 2,500$ -$ 2,500$ -$ 7,500$
10,000$ - - - - - - - - - - - - - - - - 10,000$
10,000$ 10,000$
177,000$ 177,000$ 177,000$ 177,000$ 177,000$ 177,000$ 177,000$ 177,000$ 177,000$ 177,000$ 177,000$
577,381$ 594,702$ 612,543$ 630,919$ 649,847$ 669,342$ 689,423$ 710,105$ 731,409$ 753,351$ 775,951$
82,000$ 80,000$ 79,000$ 77,000$ 76,000$ 74,000$ 73,000$ 72,000$ 70,000$ 69,000$ 68,000$
176,500$ 36,000$ 36,000$ 36,000$ 36,000$ 5,582,750$ 36,000$ 36,000$ 36,000$ 36,000$ 82,500$
575,750$ 120,956$ 124,585$ 128,323$ 132,172$ 21,111,704$ 140,222$ 144,428$ 148,761$ 153,224$ 361,672$
82,000$ 16,000$ 16,000$ 16,000$ 15,000$ 2,350,000$ 15,000$ 15,000$ 14,000$ 14,000$ 32,000$
40 46 47 48 49 5041 42 43 44 45
164,000$ 88,000$ 87,000$ 84,000$ 83,000$ 100,000$ 96,000$ 95,000$ 93,000$ 91,000$ 2,424,000$
Page 4 of 4
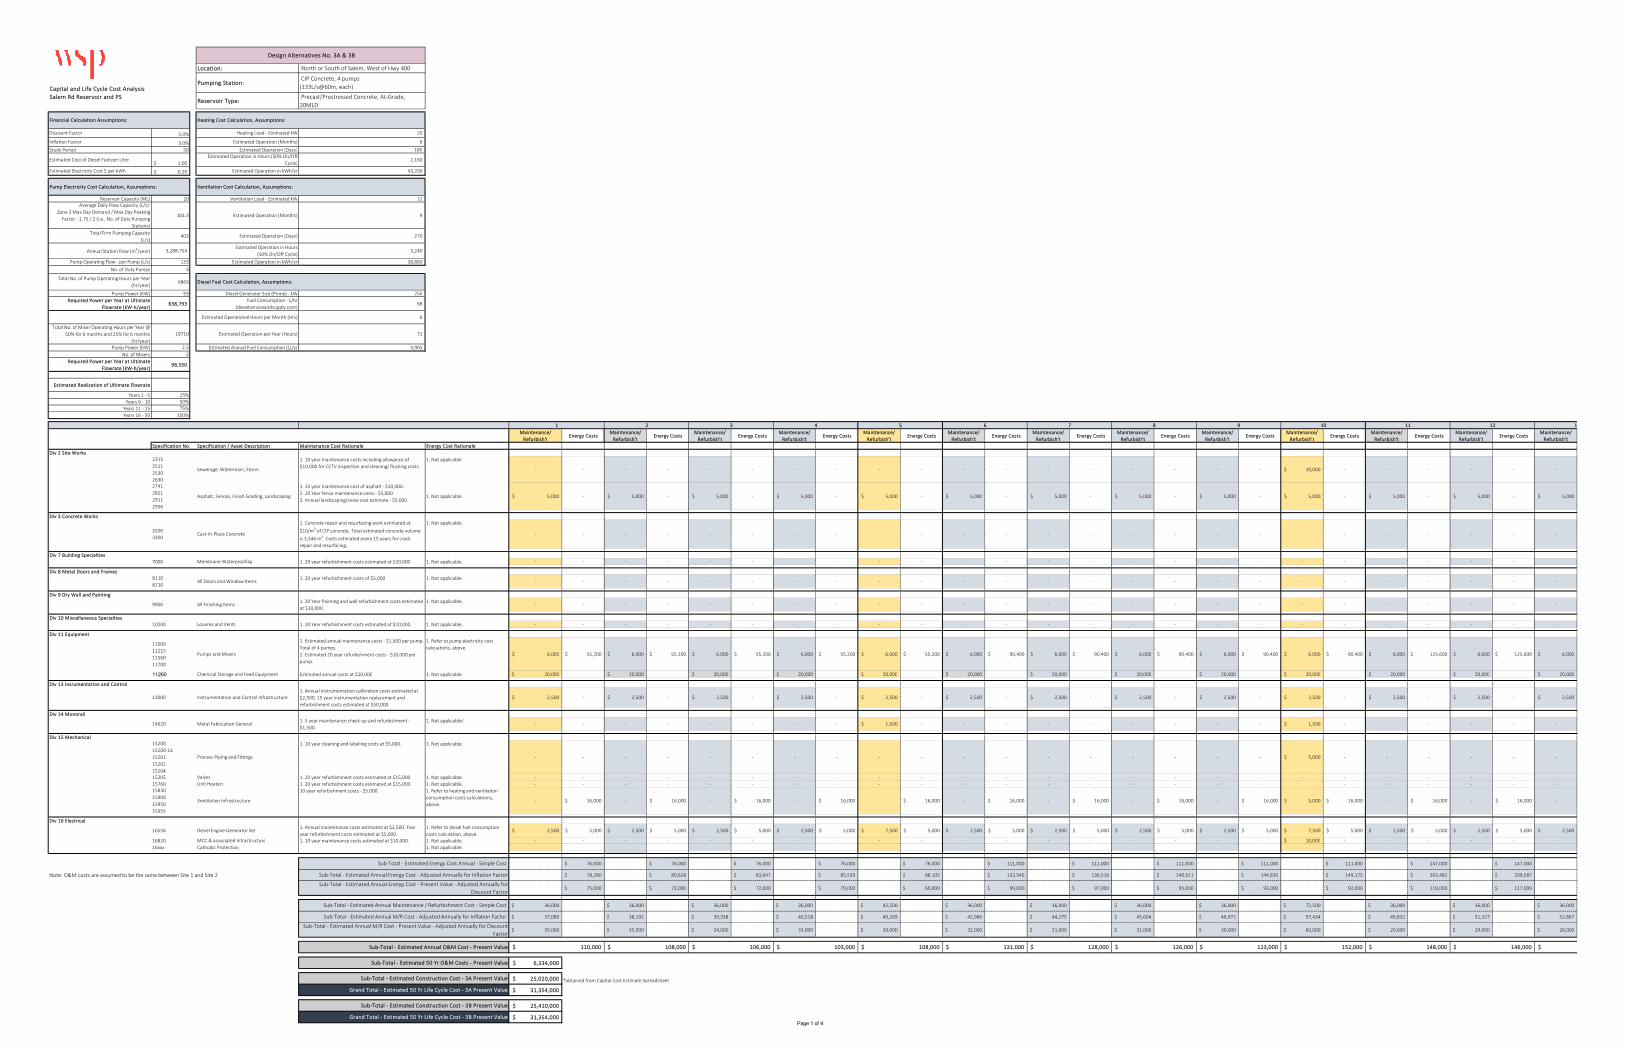
Location: North or South of Salem, West of Hwy 400
Capital and Life Cycle Cost AnalysisPumping Station:
CIP Concrete, 4 pumps
(133L/s@60m, each)
Salem Rd Reservoir and PSReservoir Type:
Precast/Prestressed Concrete, At-Grade,
20MLD
Discount Factor 5.0% Heating Load - Estimated kW 20
Inflation Factor 3.0% Estimated Operation (Months) 6
Study Period 50 Estimated Operation (Days) 180
Estimated Cost of Diesel Fuel per Litre1.00$
Estimated Operation in Hours (50% On/Off
Cycle)2,160
Estimated Electricity Cost $ per kWh 0.20$ Estimated Operation in kWh/yr 43,200
Reservoir Capacity (ML) 20 Ventilation Load - Estimated kW 12
Average Daily Flow Capacity (L/s):
Zone 3 Max Day Demand / Max Day Peaking
Factor - 1.75 / 2 (i.e., No. of Duty Pumping
Stations)
104.3 Estimated Operation (Months) 9
Total Firm Pumping Capacity
(L/s)403 Estimated Operation (Days) 270
Annual Station Flow (m3/year) 3,288,754
Estimated Operation in Hours
(50% On/Off Cycle)3,240
Pump Operating Flow - per Pump (L/s) 133 Estimated Operation in kWh/yr 38,880
No. of Duty Pumps 3
Total No. of Pump Operating Hours per Year
(hr/year)6869
Pump Power (KW) 93 Diesel Generator Size (Prime) - kW 250
Required Power per Year at Ultimate
Flowrate (kW-h/year)638,793
Fuel Consumption - L/hr
(dieselserviceandsupply.com)68
Estimated Operational Hours per Month (Hrs) 6
Total No. of Mixer Operating Hours per Year @
50% for 6 months and 25% for 6 months
(hr/year)
19710 Estimated Operation per Year (Hours) 72
Pump Power (KW) 2.5 Estimated Annual Fuel Consumption (L)/yr 4,905
No. of Mixers 2
Required Power per Year at Ultimate
Flowrate (kW-h/year)98,550
Estimated Realization of Ultimate Flowrate
Years 1 - 5 25%
Years 6 - 10 50%
Years 11 - 15 75%
Years 16 - 50 100%
Maintenance/
Refurbish'tEnergy Costs
Maintenance/
Refurbish'tEnergy Costs
Maintenance/
Refurbish'tEnergy Costs
Maintenance/
Refurbish'tEnergy Costs
Maintenance/
Refurbish'tEnergy Costs
Maintenance/
Refurbish'tEnergy Costs
Maintenance/
Refurbish'tEnergy Costs
Maintenance/
Refurbish'tEnergy Costs
Maintenance/
Refurbish'tEnergy Costs
Maintenance/
Refurbish'tEnergy Costs
Maintenance/
Refurbish'tEnergy Costs
Maintenance/
Refurbish'tEnergy Costs
Maintenance/
Refurbish't
Specification No. Specification / Asset Description Maintenance Cost Rationale Energy Cost Rationale
Div 2 Site Works
2315
2511
2530
2630
Sewerage, Watermain, Storm
1. 10 year maintenance costs including allowance of
$10,000 for CCTV inspection and cleaning/ flushing costs.
1. Not applicable
- - - - - - - - - - - - - - - - - - 10,000$ - - - - - -
2741
2821
2911
2936
Asphalt, Fences, Finish Grading, Landscaping
1. 15 year maintenance cost of asphalt - $10,000.
2. 20 Year fence maintenance costs - $5,000.
3. Annual landscaping/snow cost estimate - $5,000.1. Not applicable. 5,000$ - 5,000$ - 5,000$ - 5,000$ - 5,000$ - 5,000$ - 5,000$ - 5,000$ - 5,000$ - 5,000$ - 5,000$ - 5,000$ - 5,000$
Div 3 Concrete Works
3200
3300Cast-In-Place Concrete
1. Concrete repair and resurfacing work estimated at
$10/m3 of CIP concrete. Total estimated concrete volume
is 3,346 m3. Costs estimated every 15 years for crack
repair and resurfacing..
1. Not applicable.
- - - - - - - - - - - - - - - - - - - - - - -
Div 7 Building Specialties
7000 Membrane Waterproofing 1. 20 year refurbishment costs estimated at $20,000 1. Not applicable. - - - - - - - - - - - - - - - - - - - - - - - - -
Div 8 Metal Doors and Frames
8110
8710All Doors and Window Items
1. 20 year refurbishment costs of $5,000 1. Not applicable.- - - - - - - - - - - - - - - - - - - - - - - - -
Div 9 Dry Wall and Painting
9900 All Finishing Items1. 20 Year Painting and wall refurbishment costs estimated
at $10,000.
1. Not applicable.- - - - - - - - - - - - - - - - - - - - - - - - -
Div 10 Miscellaneous Specialties
10200 Louvres and Vents 1. 20 Year refurbishment costs estimated at $10,000. 1. Not applicable. - - - - - - - - - - - - - - - - - - - - - - - - -
Div 11 Equipment
11000
11215
11560
11700
Pumps and Mixers
1. Estimated annual maintenance costs - $1,500 per pump.
Total of 4 pumps.
2. Estimated 20 year refurbishment costs - $10,000 per
pump.
1. Refer to pump electricity cost
calcuations, above.
6,000$ 55,200$ 6,000$ 55,200$ 6,000$ 55,200$ 6,000$ 55,200$ 6,000$ 55,200$ 6,000$ 90,400$ 6,000$ 90,400$ 6,000$ 90,400$ 6,000$ 90,400$ 6,000$ 90,400$ 6,000$ 125,600$ 6,000$ 125,600$ 6,000$
11260 Chemical Storage and Feed Equipment Estimated annual costs at $20,000 1. Not applicable. 20,000$ 20,000$ 20,000$ 20,000$ 20,000$ 20,000$ 20,000$ 20,000$ 20,000$ 20,000$ 20,000$ 20,000$ 20,000$
Div 13 Insrumentation and Control
13000 Instrumentation and Control Infrastructure
1. Annual instrumentation calibration costs estimated at
$2,500. 15 year instrumentation replacement and
refurbishment costs estimated at $50,000.
2,500$ - 2,500$ - 2,500$ - 2,500$ - 2,500$ - 2,500$ - 2,500$ - 2,500$ - 2,500$ - 2,500$ - 2,500$ - 2,500$ - 2,500$
Div 14 Monorail
14620 Metal Fabrication General1. 5 year maintenance check-up and refurbishment -
$1,500.
1. Not applicable/- - - - - - - - 1,500$ - - - - - - - - - 1,500$ - - - - - -
Div 15 Mechanical
15200
15200-14
15201
15202
15204
Process Piping and Fittings
1. 10 year cleaning and labelling costs at $5,000. 1. Not applicable.
- - - - - - - - - - - - - - - - - - 5,000$ - - - - - -
15205 Valves 1. 20 year refurbishment costs estimated at $15,000. 1. Not applicable. - - - - - - - - - - - - - - - - - - - - - - - - -
15760 Unit Heaters 1. 20 year refurbishment costs estimated at $15,000. 1. Not applicable. - - - - - - - - - - - - - - - - - - - - - - - -
15830
15900
15950
15955
Ventilation Infrastructure
10 year refurbishment costs - $5,000. 1. Refer to heating and ventilation
consumption costs calculations,
above.- 16,000$ - 16,000$ - 16,000$ - 16,000$ 16,000$ - 16,000$ - 16,000$ - 16,000$ - 16,000$ 5,000$ 16,000$ - 16,000$ - 16,000$ -
Div 16 Electrical
16556 Diesel Engine Generator Set1. Annual maintenance costs estimated at $2,500. Five
year refurbishment costs estimated at $5,000.
1. Refer to diesel fuel consumption
costs calculation, above.2,500$ 5,000$ 2,500$ 5,000$ 2,500$ 5,000$ 2,500$ 5,000$ 7,500$ 5,000$ 2,500$ 5,000$ 2,500$ 5,000$ 2,500$ 5,000$ 2,500$ 5,000$ 7,500$ 5,000$ 2,500$ 5,000$ 2,500$ 5,000$ 2,500$
16820 MCC & associated Infrastructure 1. 10 year maintenance costs estimated at $10,000. 1. Not applicable. - - - - - - - - - - - - - - - - - - 10,000$ - - - - - -
16xxx Cathodic Protection 1. Not applicable.
76,000$ 76,000$ 76,000$ 76,000$ 76,000$ 111,000$ 111,000$ 111,000$ 111,000$ 111,000$ 147,000$ 147,000$
Note: O&M costs are assumed to be the same between Site 1 and Site 2 78,280$ 80,628$ 83,047$ 85,539$ 88,105$ 132,540$ 136,516$ 140,611$ 144,830$ 149,175$ 203,482$ 209,587$
75,000$ 73,000$ 72,000$ 70,000$ 69,000$ 99,000$ 97,000$ 95,000$ 93,000$ 92,000$ 119,000$ 117,000$
36,000$ 36,000$ 36,000$ 36,000$ 42,500$ 36,000$ 36,000$ 36,000$ 36,000$ 72,500$ 36,000$ 36,000$ 36,000$
37,080$ 38,192$ 39,338$ 40,518$ 49,269$ 42,986$ 44,275$ 45,604$ 46,972$ 97,434$ 49,832$ 51,327$ 52,867$
35,000$ 35,000$ 34,000$ 33,000$ 39,000$ 32,000$ 31,000$ 31,000$ 30,000$ 60,000$ 29,000$ 29,000$ 28,000$
6,334,000$
25,020,000$ *obtained from Capital Cost Estimate Spreadsheet
31,354,000$
25,410,000$
31,354,000$
2 3 4 5
Design Alternatives No. 3A & 3B
Financial Calculation Assumptions: Heating Cost Calculation, Assumptions:
Pump Electricity Cost Calculation, Assumptions: Ventilation Cost Calculation, Assumptions:
Diesel Fuel Cost Calculation, Assumptions:
12 13
Sub-Total - Estimated Annual M/R Cost - Adjusted Annually for Inflation Factor
Sub-Total - Estimated Annual M/R Cost - Present Value - Adjusted Annually for Discount
Factor
Sub-Total - Estimated Annual O&M Cost - Present Value 110,000$ 108,000$
Sub-Total - Estimated Energy Cost Annual - Simple Cost
Sub-Total - Estimated Annual Energy Cost - Adjusted Annually for Inflation Factor
Sub-Total - Estimated Annual Energy Cost - Present Value - Adjusted Annually for
Discount Factor
6 7 8 9 10 111
Sub-Total - Estimated Annual Maintenance / Refurbishment Cost - Simple Cost
Grand Total - Estimated 50 Yr Life Cycle Cost - 3B Present Value
152,000$ 148,000$ 146,000$ $
Grand Total - Estimated 50 Yr Life Cycle Cost - 3A Present Value
Sub-Total - Estimated Construction Cost - 3B Present Value
Sub-Total - Estimated 50 Yr O&M Costs - Present Value
Sub-Total - Estimated Construction Cost - 3A Present Value
103,000$ 108,000$ 131,000$ 128,000$ 126,000$ 123,000$ 106,000$
Page 1 of 4

Location: North or South of Salem, West of Hwy 400
Capital and Life Cycle Cost AnalysisPumping Station:
CIP Concrete, 4 pumps
(133L/s@60m, each)
Salem Rd Reservoir and PSReservoir Type:
Precast/Prestressed Concrete, At-Grade,
20MLD
Discount Factor 5.0% Heating Load - Estimated kW 20
Inflation Factor 3.0% Estimated Operation (Months) 6
Study Period 50 Estimated Operation (Days) 180
Estimated Cost of Diesel Fuel per Litre1.00$
Estimated Operation in Hours (50% On/Off
Cycle)2,160
Estimated Electricity Cost $ per kWh 0.20$ Estimated Operation in kWh/yr 43,200
Reservoir Capacity (ML) 20 Ventilation Load - Estimated kW 12
Average Daily Flow Capacity (L/s):
Zone 3 Max Day Demand / Max Day Peaking
Factor - 1.75 / 2 (i.e., No. of Duty Pumping
Stations)
104.3 Estimated Operation (Months) 9
Total Firm Pumping Capacity
(L/s)403 Estimated Operation (Days) 270
Annual Station Flow (m3/year) 3,288,754
Estimated Operation in Hours
(50% On/Off Cycle)3,240
Pump Operating Flow - per Pump (L/s) 133 Estimated Operation in kWh/yr 38,880
No. of Duty Pumps 3
Total No. of Pump Operating Hours per Year
(hr/year)6869
Pump Power (KW) 93 Diesel Generator Size (Prime) - kW 250
Required Power per Year at Ultimate
Flowrate (kW-h/year)638,793
Fuel Consumption - L/hr
(dieselserviceandsupply.com)68
Estimated Operational Hours per Month (Hrs) 6
Total No. of Mixer Operating Hours per Year @
50% for 6 months and 25% for 6 months
(hr/year)
19710 Estimated Operation per Year (Hours) 72
Pump Power (KW) 2.5 Estimated Annual Fuel Consumption (L)/yr 4,905
No. of Mixers 2
Required Power per Year at Ultimate
Flowrate (kW-h/year)98,550
Estimated Realization of Ultimate Flowrate
Years 1 - 5 25%
Years 6 - 10 50%
Years 11 - 15 75%
Years 16 - 50 100%
Specification No. Specification / Asset Description Maintenance Cost Rationale Energy Cost Rationale
Div 2 Site Works
2315
2511
2530
2630
Sewerage, Watermain, Storm
1. 10 year maintenance costs including allowance of
$10,000 for CCTV inspection and cleaning/ flushing costs.
1. Not applicable
2741
2821
2911
2936
Asphalt, Fences, Finish Grading, Landscaping
1. 15 year maintenance cost of asphalt - $10,000.
2. 20 Year fence maintenance costs - $5,000.
3. Annual landscaping/snow cost estimate - $5,000.1. Not applicable.
Div 3 Concrete Works
3200
3300Cast-In-Place Concrete
1. Concrete repair and resurfacing work estimated at
$10/m3 of CIP concrete. Total estimated concrete volume
is 3,346 m3. Costs estimated every 15 years for crack
repair and resurfacing..
1. Not applicable.
Div 7 Building Specialties
7000 Membrane Waterproofing 1. 20 year refurbishment costs estimated at $20,000 1. Not applicable.
Div 8 Metal Doors and Frames
8110
8710All Doors and Window Items
1. 20 year refurbishment costs of $5,000 1. Not applicable.
Div 9 Dry Wall and Painting
9900 All Finishing Items1. 20 Year Painting and wall refurbishment costs estimated
at $10,000.
1. Not applicable.
Div 10 Miscellaneous Specialties
10200 Louvres and Vents 1. 20 Year refurbishment costs estimated at $10,000. 1. Not applicable.
Div 11 Equipment
11000
11215
11560
11700
Pumps and Mixers
1. Estimated annual maintenance costs - $1,500 per pump.
Total of 4 pumps.
2. Estimated 20 year refurbishment costs - $10,000 per
pump.
1. Refer to pump electricity cost
calcuations, above.
11260 Chemical Storage and Feed Equipment Estimated annual costs at $20,000 1. Not applicable.
Div 13 Insrumentation and Control
13000 Instrumentation and Control Infrastructure
1. Annual instrumentation calibration costs estimated at
$2,500. 15 year instrumentation replacement and
refurbishment costs estimated at $50,000.
Div 14 Monorail
14620 Metal Fabrication General1. 5 year maintenance check-up and refurbishment -
$1,500.
1. Not applicable/
Div 15 Mechanical
15200
15200-14
15201
15202
15204
Process Piping and Fittings
1. 10 year cleaning and labelling costs at $5,000. 1. Not applicable.
15205 Valves 1. 20 year refurbishment costs estimated at $15,000. 1. Not applicable.
15760 Unit Heaters 1. 20 year refurbishment costs estimated at $15,000. 1. Not applicable.
15830
15900
15950
15955
Ventilation Infrastructure
10 year refurbishment costs - $5,000. 1. Refer to heating and ventilation
consumption costs calculations,
above.
Div 16 Electrical
16556 Diesel Engine Generator Set1. Annual maintenance costs estimated at $2,500. Five
year refurbishment costs estimated at $5,000.
1. Refer to diesel fuel consumption
costs calculation, above.
16820 MCC & associated Infrastructure 1. 10 year maintenance costs estimated at $10,000. 1. Not applicable.
16xxx Cathodic Protection 1. Not applicable.
Note: O&M costs are assumed to be the same between Site 1 and Site 2
Design Alternatives No. 3A & 3B
Financial Calculation Assumptions: Heating Cost Calculation, Assumptions:
Pump Electricity Cost Calculation, Assumptions: Ventilation Cost Calculation, Assumptions:
Diesel Fuel Cost Calculation, Assumptions:
Sub-Total - Estimated Annual M/R Cost - Adjusted Annually for Inflation Factor
Sub-Total - Estimated Annual M/R Cost - Present Value - Adjusted Annually for Discount
Factor
Sub-Total - Estimated Annual O&M Cost - Present Value
Sub-Total - Estimated Energy Cost Annual - Simple Cost
Sub-Total - Estimated Annual Energy Cost - Adjusted Annually for Inflation Factor
Sub-Total - Estimated Annual Energy Cost - Present Value - Adjusted Annually for
Discount Factor
Sub-Total - Estimated Annual Maintenance / Refurbishment Cost - Simple Cost
Grand Total - Estimated 50 Yr Life Cycle Cost - 3B Present Value
Grand Total - Estimated 50 Yr Life Cycle Cost - 3A Present Value
Sub-Total - Estimated Construction Cost - 3B Present Value
Sub-Total - Estimated 50 Yr O&M Costs - Present Value
Sub-Total - Estimated Construction Cost - 3A Present Value
Energy CostsMaintenance/
Refurbish'tEnergy Costs
Maintenance/
Refurbish'tEnergy Costs
Maintenance/
Refurbish'tEnergy Costs
Maintenance/
Refurbish'tEnergy Costs
Maintenance/
Refurbish'tEnergy Costs
Maintenance/
Refurbish'tEnergy Costs
Maintenance/
Refurbish'tEnergy Costs
Maintenance/
Refurbish'tEnergy Costs
Maintenance/
Refurbish'tEnergy Costs
Maintenance/
Refurbish'tEnergy Costs
Maintenance/
Refurbish'tEnergy Costs
Maintenance/
Refurbish'tEnergy Costs
- - - - - - - - - - - - - 10,000$ - - - - - - - - - - -
- 5,000$ - 15,000$ - 5,000$ - 5,000$ - 5,000$ - 5,000$ - 15,000$ - 5,000$ - 5,000$ - 5,000$ - 5,000$ - 15,000$ -
- - - 33,460$ - - - - - - - - - - - - - - - - - - -
- - - - - - - - - - - - - 20,000$ - - - - - - - - - - -
- - - - - - - - - - - - - 5,000$ - - - - - - - - - - -
- - - - - - - - - - - - - 10,000$ - - - - - - - - - - -
- - - - - - - - - - - - - 10,000$ - - - - - - - - - - -
125,600$ 6,000$ 125,600$ 6,000$ 125,600$ 6,000$ 160,800$ 6,000$ 160,800$ 6,000$ 160,800$ 6,000$ 160,800$ 40,000$ 160,800$ 6,000$ 160,800$ 6,000$ 160,800$ 6,000$ 160,800$ 6,000$ 160,800$ 6,000$ 160,800$
20,000$ 20,000$ 20,000$ 20,000$ 20,000$ 20,000$ 20,000$ 20,000$ 20,000$ 20,000$ 20,000$ 20,000$
- 2,500$ - 50,000$ - 2,500$ - 2,500$ - 2,500$ - 2,500$ - 2,500$ - 2,500$ - 2,500$ - 2,500$ - 2,500$ - 2,500$ -
- - - 1,500$ - - - - - - - - - 1,500$ - - - - - - - - - 1,500$ -
- - - - - - - - - - - - - 5,000$ - - - - - - - - - - -
- - - - - - - - - - - - 15,000$ - - - - - - - - - - -
- - - - - - - - - - - - 15,000$ - - - - - - - - - - -
16,000$ - 16,000$ 16,000$ - 16,000$ - 16,000$ - 16,000$ - 16,000$ 5,000$ 16,000$ - 16,000$ - 16,000$ - 16,000$ - 16,000$ 16,000$
5,000$ 2,500$ 5,000$ 7,500$ 5,000$ 2,500$ 5,000$ 2,500$ 5,000$ 2,500$ 5,000$ 2,500$ 5,000$ 7,500$ 5,000$ 2,500$ 5,000$ 2,500$ 5,000$ 2,500$ 5,000$ 2,500$ 5,000$ 7,500$ 5,000$
- - - - - - - - - - - - - 10,000$ - - - - - - - - - - -
147,000$ 147,000$ 147,000$ 182,000$ 182,000$ 182,000$ 182,000$ 182,000$ 182,000$ 182,000$ 182,000$ 182,000$ 182,000$
215,874$ 222,351$ 229,021$ 292,057$ 300,818$ 309,843$ 319,138$ 328,712$ 338,574$ 348,731$ 359,193$ 369,969$ 381,068$
114,000$ 112,000$ 110,000$ 134,000$ 131,000$ 129,000$ 126,000$ 124,000$ 122,000$ 119,000$ 117,000$ 115,000$ 113,000$
36,000$ 133,460$ 36,000$ 36,000$ 36,000$ 36,000$ 191,500$ 36,000$ 36,000$ 36,000$ 36,000$ 52,500$
54,453$ 207,926$ 57,769$ 59,503$ 61,288$ 63,126$ 345,870$ 66,971$ 68,980$ 71,049$ 73,181$ 109,923$
28,000$ 100,000$ 26,000$ 26,000$ 25,000$ 25,000$ 130,000$ 24,000$ 24,000$ 23,000$ 23,000$ 32,000$
18 19 20 21 22 2313 14 15 16 17 24 25
143,000$ 140,000$ 138,000$ 142,000$ 140,000$ 160,000$ 157,000$ 154,000$ 151,000$ 254,000$ 146,000$ 210,000$ 145,000$
Page 2 of 4

Location: North or South of Salem, West of Hwy 400
Capital and Life Cycle Cost AnalysisPumping Station:
CIP Concrete, 4 pumps
(133L/s@60m, each)
Salem Rd Reservoir and PSReservoir Type:
Precast/Prestressed Concrete, At-Grade,
20MLD
Discount Factor 5.0% Heating Load - Estimated kW 20
Inflation Factor 3.0% Estimated Operation (Months) 6
Study Period 50 Estimated Operation (Days) 180
Estimated Cost of Diesel Fuel per Litre1.00$
Estimated Operation in Hours (50% On/Off
Cycle)2,160
Estimated Electricity Cost $ per kWh 0.20$ Estimated Operation in kWh/yr 43,200
Reservoir Capacity (ML) 20 Ventilation Load - Estimated kW 12
Average Daily Flow Capacity (L/s):
Zone 3 Max Day Demand / Max Day Peaking
Factor - 1.75 / 2 (i.e., No. of Duty Pumping
Stations)
104.3 Estimated Operation (Months) 9
Total Firm Pumping Capacity
(L/s)403 Estimated Operation (Days) 270
Annual Station Flow (m3/year) 3,288,754
Estimated Operation in Hours
(50% On/Off Cycle)3,240
Pump Operating Flow - per Pump (L/s) 133 Estimated Operation in kWh/yr 38,880
No. of Duty Pumps 3
Total No. of Pump Operating Hours per Year
(hr/year)6869
Pump Power (KW) 93 Diesel Generator Size (Prime) - kW 250
Required Power per Year at Ultimate
Flowrate (kW-h/year)638,793
Fuel Consumption - L/hr
(dieselserviceandsupply.com)68
Estimated Operational Hours per Month (Hrs) 6
Total No. of Mixer Operating Hours per Year @
50% for 6 months and 25% for 6 months
(hr/year)
19710 Estimated Operation per Year (Hours) 72
Pump Power (KW) 2.5 Estimated Annual Fuel Consumption (L)/yr 4,905
No. of Mixers 2
Required Power per Year at Ultimate
Flowrate (kW-h/year)98,550
Estimated Realization of Ultimate Flowrate
Years 1 - 5 25%
Years 6 - 10 50%
Years 11 - 15 75%
Years 16 - 50 100%
Specification No. Specification / Asset Description Maintenance Cost Rationale Energy Cost Rationale
Div 2 Site Works
2315
2511
2530
2630
Sewerage, Watermain, Storm
1. 10 year maintenance costs including allowance of
$10,000 for CCTV inspection and cleaning/ flushing costs.
1. Not applicable
2741
2821
2911
2936
Asphalt, Fences, Finish Grading, Landscaping
1. 15 year maintenance cost of asphalt - $10,000.
2. 20 Year fence maintenance costs - $5,000.
3. Annual landscaping/snow cost estimate - $5,000.1. Not applicable.
Div 3 Concrete Works
3200
3300Cast-In-Place Concrete
1. Concrete repair and resurfacing work estimated at
$10/m3 of CIP concrete. Total estimated concrete volume
is 3,346 m3. Costs estimated every 15 years for crack
repair and resurfacing..
1. Not applicable.
Div 7 Building Specialties
7000 Membrane Waterproofing 1. 20 year refurbishment costs estimated at $20,000 1. Not applicable.
Div 8 Metal Doors and Frames
8110
8710All Doors and Window Items
1. 20 year refurbishment costs of $5,000 1. Not applicable.
Div 9 Dry Wall and Painting
9900 All Finishing Items1. 20 Year Painting and wall refurbishment costs estimated
at $10,000.
1. Not applicable.
Div 10 Miscellaneous Specialties
10200 Louvres and Vents 1. 20 Year refurbishment costs estimated at $10,000. 1. Not applicable.
Div 11 Equipment
11000
11215
11560
11700
Pumps and Mixers
1. Estimated annual maintenance costs - $1,500 per pump.
Total of 4 pumps.
2. Estimated 20 year refurbishment costs - $10,000 per
pump.
1. Refer to pump electricity cost
calcuations, above.
11260 Chemical Storage and Feed Equipment Estimated annual costs at $20,000 1. Not applicable.
Div 13 Insrumentation and Control
13000 Instrumentation and Control Infrastructure
1. Annual instrumentation calibration costs estimated at
$2,500. 15 year instrumentation replacement and
refurbishment costs estimated at $50,000.
Div 14 Monorail
14620 Metal Fabrication General1. 5 year maintenance check-up and refurbishment -
$1,500.
1. Not applicable/
Div 15 Mechanical
15200
15200-14
15201
15202
15204
Process Piping and Fittings
1. 10 year cleaning and labelling costs at $5,000. 1. Not applicable.
15205 Valves 1. 20 year refurbishment costs estimated at $15,000. 1. Not applicable.
15760 Unit Heaters 1. 20 year refurbishment costs estimated at $15,000. 1. Not applicable.
15830
15900
15950
15955
Ventilation Infrastructure
10 year refurbishment costs - $5,000. 1. Refer to heating and ventilation
consumption costs calculations,
above.
Div 16 Electrical
16556 Diesel Engine Generator Set1. Annual maintenance costs estimated at $2,500. Five
year refurbishment costs estimated at $5,000.
1. Refer to diesel fuel consumption
costs calculation, above.
16820 MCC & associated Infrastructure 1. 10 year maintenance costs estimated at $10,000. 1. Not applicable.
16xxx Cathodic Protection 1. Not applicable.
Note: O&M costs are assumed to be the same between Site 1 and Site 2
Design Alternatives No. 3A & 3B
Financial Calculation Assumptions: Heating Cost Calculation, Assumptions:
Pump Electricity Cost Calculation, Assumptions: Ventilation Cost Calculation, Assumptions:
Diesel Fuel Cost Calculation, Assumptions:
Sub-Total - Estimated Annual M/R Cost - Adjusted Annually for Inflation Factor
Sub-Total - Estimated Annual M/R Cost - Present Value - Adjusted Annually for Discount
Factor
Sub-Total - Estimated Annual O&M Cost - Present Value
Sub-Total - Estimated Energy Cost Annual - Simple Cost
Sub-Total - Estimated Annual Energy Cost - Adjusted Annually for Inflation Factor
Sub-Total - Estimated Annual Energy Cost - Present Value - Adjusted Annually for
Discount Factor
Sub-Total - Estimated Annual Maintenance / Refurbishment Cost - Simple Cost
Grand Total - Estimated 50 Yr Life Cycle Cost - 3B Present Value
Grand Total - Estimated 50 Yr Life Cycle Cost - 3A Present Value
Sub-Total - Estimated Construction Cost - 3B Present Value
Sub-Total - Estimated 50 Yr O&M Costs - Present Value
Sub-Total - Estimated Construction Cost - 3A Present Value
Maintenance/
Refurbish'tEnergy Costs
Maintenance/
Refurbish'tEnergy Costs
Maintenance/
Refurbish'tEnergy Costs
Maintenance/
Refurbish'tEnergy Costs
Maintenance/
Refurbish'tEnergy Costs
Maintenance/
Refurbish'tEnergy Costs
Maintenance/
Refurbish'tEnergy Costs
Maintenance/
Refurbish'tEnergy Costs
Maintenance/
Refurbish'tEnergy Costs
Maintenance/
Refurbish'tEnergy Costs
Maintenance/
Refurbish'tEnergy Costs
Maintenance/
Refurbish'tEnergy Costs
Maintenance/
Refurbish't
- - - - - - - - 10,000$ -
5,000$ - 5,000$ - 5,000$ - 5,000$ - 15,000$ - 5,000$ - 5,000$ - 5,000$ - 5,000$ 5,000$ 5,000$ - 5,000$ - 5,000$
- - - - - - - - 33,460$ -
- - - - - - - - - -
- - - - - - - - -
- - - - - - - - - -
- - - - - - - - - -
6,000$ 160,800$ 6,000$ 160,800$ 6,000$ 160,800$ 6,000$ 160,800$ 6,000$ 160,800$ 6,000$ 160,800$ 6,000$ 160,800$ 6,000$ 160,800$ 6,000$ 160,800$ 6,000$ 160,800$ 6,000$ 160,800$ 6,000$ 160,800$ 6,000$
20,000$ 20,000$ 20,000$ 20,000$ 20,000$ 20,000$ 20,000$ 20,000$ 20,000$ 20,000$ 20,000$ 20,000$ 20,000$
2,500$ - 2,500$ - 2,500$ - 2,500$ - 50,000$ - 2,500$ - 2,500$ - 2,500$ - 2,500$ 2,500$ 2,500$ - 2,500$ - 2,500$
- - - - - - - - 1,500$ - 1,500$
- - - - - - - - 5,000$ -
- - - - - - - - - -
- - - - - - - - -
- 16,000$ - 16,000$ - 16,000$ - 16,000$ 5,000$ 16,000$ 16,000$ 16,000$ 16,000$ 16,000$ 16,000$ 16,000$ 16,000$
2,500$ 5,000$ 2,500$ 5,000$ 2,500$ 5,000$ 2,500$ 5,000$ 7,500$ 5,000$ 7,500$
- - - - - - - - 10,000$ -
182,000$ 182,000$ 182,000$ 182,000$ 182,000$ 177,000$ 177,000$ 177,000$ 177,000$ 177,000$ 177,000$ 177,000$
392,500$ 404,275$ 416,403$ 428,895$ 441,762$ 442,514$ 455,790$ 469,463$ 483,547$ 498,054$ 512,995$ 528,385$
110,000$ 108,000$ 106,000$ 104,000$ 102,000$ 98,000$ 96,000$ 94,000$ 92,000$ 90,000$ 89,000$ 87,000$
36,000$ 36,000$ 36,000$ 36,000$ 163,460$ 33,500$ 33,500$ 33,500$ 33,500$ 42,500$ 33,500$ 33,500$ 33,500$
77,637$ 79,966$ 82,365$ 84,836$ 396,760$ 83,753$ 86,265$ 88,853$ 91,519$ 119,589$ 97,092$ 100,005$ 103,005$
22,000$ 21,000$ 21,000$ 21,000$ 92,000$ 18,000$ 18,000$ 18,000$ 17,000$ 22,000$ 17,000$ 16,000$ 16,000$
26 27 3028 29
127,000$ 125,000$ 194,000$ 132,000$ 129,000$
36 37 3831 32 33 34 35
106,000$ 103,000$ $ 116,000$ 114,000$ 112,000$ 109,000$ 112,000$
Page 3 of 4

Location: North or South of Salem, West of Hwy 400
Capital and Life Cycle Cost AnalysisPumping Station:
CIP Concrete, 4 pumps
(133L/s@60m, each)
Salem Rd Reservoir and PSReservoir Type:
Precast/Prestressed Concrete, At-Grade,
20MLD
Discount Factor 5.0% Heating Load - Estimated kW 20
Inflation Factor 3.0% Estimated Operation (Months) 6
Study Period 50 Estimated Operation (Days) 180
Estimated Cost of Diesel Fuel per Litre1.00$
Estimated Operation in Hours (50% On/Off
Cycle)2,160
Estimated Electricity Cost $ per kWh 0.20$ Estimated Operation in kWh/yr 43,200
Reservoir Capacity (ML) 20 Ventilation Load - Estimated kW 12
Average Daily Flow Capacity (L/s):
Zone 3 Max Day Demand / Max Day Peaking
Factor - 1.75 / 2 (i.e., No. of Duty Pumping
Stations)
104.3 Estimated Operation (Months) 9
Total Firm Pumping Capacity
(L/s)403 Estimated Operation (Days) 270
Annual Station Flow (m3/year) 3,288,754
Estimated Operation in Hours
(50% On/Off Cycle)3,240
Pump Operating Flow - per Pump (L/s) 133 Estimated Operation in kWh/yr 38,880
No. of Duty Pumps 3
Total No. of Pump Operating Hours per Year
(hr/year)6869
Pump Power (KW) 93 Diesel Generator Size (Prime) - kW 250
Required Power per Year at Ultimate
Flowrate (kW-h/year)638,793
Fuel Consumption - L/hr
(dieselserviceandsupply.com)68
Estimated Operational Hours per Month (Hrs) 6
Total No. of Mixer Operating Hours per Year @
50% for 6 months and 25% for 6 months
(hr/year)
19710 Estimated Operation per Year (Hours) 72
Pump Power (KW) 2.5 Estimated Annual Fuel Consumption (L)/yr 4,905
No. of Mixers 2
Required Power per Year at Ultimate
Flowrate (kW-h/year)98,550
Estimated Realization of Ultimate Flowrate
Years 1 - 5 25%
Years 6 - 10 50%
Years 11 - 15 75%
Years 16 - 50 100%
Specification No. Specification / Asset Description Maintenance Cost Rationale Energy Cost Rationale
Div 2 Site Works
2315
2511
2530
2630
Sewerage, Watermain, Storm
1. 10 year maintenance costs including allowance of
$10,000 for CCTV inspection and cleaning/ flushing costs.
1. Not applicable
2741
2821
2911
2936
Asphalt, Fences, Finish Grading, Landscaping
1. 15 year maintenance cost of asphalt - $10,000.
2. 20 Year fence maintenance costs - $5,000.
3. Annual landscaping/snow cost estimate - $5,000.1. Not applicable.
Div 3 Concrete Works
3200
3300Cast-In-Place Concrete
1. Concrete repair and resurfacing work estimated at
$10/m3 of CIP concrete. Total estimated concrete volume
is 3,346 m3. Costs estimated every 15 years for crack
repair and resurfacing..
1. Not applicable.
Div 7 Building Specialties
7000 Membrane Waterproofing 1. 20 year refurbishment costs estimated at $20,000 1. Not applicable.
Div 8 Metal Doors and Frames
8110
8710All Doors and Window Items
1. 20 year refurbishment costs of $5,000 1. Not applicable.
Div 9 Dry Wall and Painting
9900 All Finishing Items1. 20 Year Painting and wall refurbishment costs estimated
at $10,000.
1. Not applicable.
Div 10 Miscellaneous Specialties
10200 Louvres and Vents 1. 20 Year refurbishment costs estimated at $10,000. 1. Not applicable.
Div 11 Equipment
11000
11215
11560
11700
Pumps and Mixers
1. Estimated annual maintenance costs - $1,500 per pump.
Total of 4 pumps.
2. Estimated 20 year refurbishment costs - $10,000 per
pump.
1. Refer to pump electricity cost
calcuations, above.
11260 Chemical Storage and Feed Equipment Estimated annual costs at $20,000 1. Not applicable.
Div 13 Insrumentation and Control
13000 Instrumentation and Control Infrastructure
1. Annual instrumentation calibration costs estimated at
$2,500. 15 year instrumentation replacement and
refurbishment costs estimated at $50,000.
Div 14 Monorail
14620 Metal Fabrication General1. 5 year maintenance check-up and refurbishment -
$1,500.
1. Not applicable/
Div 15 Mechanical
15200
15200-14
15201
15202
15204
Process Piping and Fittings
1. 10 year cleaning and labelling costs at $5,000. 1. Not applicable.
15205 Valves 1. 20 year refurbishment costs estimated at $15,000. 1. Not applicable.
15760 Unit Heaters 1. 20 year refurbishment costs estimated at $15,000. 1. Not applicable.
15830
15900
15950
15955
Ventilation Infrastructure
10 year refurbishment costs - $5,000. 1. Refer to heating and ventilation
consumption costs calculations,
above.
Div 16 Electrical
16556 Diesel Engine Generator Set1. Annual maintenance costs estimated at $2,500. Five
year refurbishment costs estimated at $5,000.
1. Refer to diesel fuel consumption
costs calculation, above.
16820 MCC & associated Infrastructure 1. 10 year maintenance costs estimated at $10,000. 1. Not applicable.
16xxx Cathodic Protection 1. Not applicable.
Note: O&M costs are assumed to be the same between Site 1 and Site 2
Design Alternatives No. 3A & 3B
Financial Calculation Assumptions: Heating Cost Calculation, Assumptions:
Pump Electricity Cost Calculation, Assumptions: Ventilation Cost Calculation, Assumptions:
Diesel Fuel Cost Calculation, Assumptions:
Sub-Total - Estimated Annual M/R Cost - Adjusted Annually for Inflation Factor
Sub-Total - Estimated Annual M/R Cost - Present Value - Adjusted Annually for Discount
Factor
Sub-Total - Estimated Annual O&M Cost - Present Value
Sub-Total - Estimated Energy Cost Annual - Simple Cost
Sub-Total - Estimated Annual Energy Cost - Adjusted Annually for Inflation Factor
Sub-Total - Estimated Annual Energy Cost - Present Value - Adjusted Annually for
Discount Factor
Sub-Total - Estimated Annual Maintenance / Refurbishment Cost - Simple Cost
Grand Total - Estimated 50 Yr Life Cycle Cost - 3B Present Value
Grand Total - Estimated 50 Yr Life Cycle Cost - 3A Present Value
Sub-Total - Estimated Construction Cost - 3B Present Value
Sub-Total - Estimated 50 Yr O&M Costs - Present Value
Sub-Total - Estimated Construction Cost - 3A Present Value
Energy CostsMaintenance/
Refurbish'tEnergy Costs
Maintenance/
Refurbish'tEnergy Costs
Maintenance/
Refurbish'tEnergy Costs
Maintenance/
Refurbish'tEnergy Costs
Maintenance/
Refurbish'tEnergy Costs
Maintenance/
Refurbish'tEnergy Costs
Maintenance/
Refurbish'tEnergy Costs
Maintenance/
Refurbish'tEnergy Costs
Maintenance/
Refurbish'tEnergy Costs
Maintenance/
Refurbish'tEnergy Costs
Maintenance/
Refurbish'tEnergy Costs
Maintenance/
Refurbish'tEnergy Costs
10,000$ 10,000$
- 5,000$ 10,000$ 5,000$ - 5,000$ - 5,000$ - 5,000$ 15,000$ 5,000$ - 5,000$ - 5,000$ - 5,000$ 5,000$
33,460$
20,000$
5,000$
10,000$
10,000$
160,800$ 6,000$ 160,800$ 40,000$ 160,800$ 6,000$ 160,800$ 6,000$ 160,800$ 6,000$ 160,800$ 6,000$ 160,800$ 6,000$ 160,800$ 6,000$ 160,800$ 6,000$ 160,800$ 6,000$ 160,800$ 6,000$ 160,800$ 6,000$ 160,800$
20,000$ 20,000$ 20,000$ 20,000$ 20,000$ 20,000$ 20,000$ 20,000$ 20,000$ 20,000$
- 2,500$ 2,500$ 2,500$ - 2,500$ - 2,500$ - 2,500$ 50,000$ 2,500$ - 2,500$ - 2,500$ - 2,500$ 2,500$
1,500$ 1,500$ 1,500$
5,000$ 5,000$
15,000$
15,000$
16,000$ 16,000$ 5,000$ 16,000$ 16,000$ 16,000$ 16,000$ 16,000$ 16,000$ 16,000$ 16,000$ 16,000$ 16,000$ 16,000$
7,500$ 7,500$ 7,500$
10,000$ 10,000$
177,000$ 177,000$ 177,000$ 177,000$ 177,000$ 177,000$ 177,000$ 177,000$ 177,000$ 177,000$ 177,000$ 177,000$ 177,000$
544,237$ 560,564$ 577,381$ 594,702$ 612,543$ 630,919$ 649,847$ 669,342$ 689,423$ 710,105$ 731,409$ 753,351$ 775,951$
85,000$ 84,000$ 82,000$ 80,000$ 79,000$ 77,000$ 76,000$ 74,000$ 73,000$ 72,000$ 70,000$ 69,000$ 68,000$
33,500$ 186,500$ 33,500$ 33,500$ 33,500$ 33,500$ 113,460$ 33,500$ 33,500$ 33,500$ 33,500$ 47,500$
106,095$ 608,370$ 112,557$ 115,933$ 119,411$ 122,994$ 429,060$ 130,484$ 134,398$ 138,430$ 142,583$ 208,236$
16,000$ 86,000$ 15,000$ 15,000$ 15,000$ 14,000$ 48,000$ 14,000$ 14,000$ 13,000$ 13,000$ 18,000$
38 39 40 46 47 48 49 5041 42 43 44 45
101,000$ 100,000$ 168,000$ 87,000$ 86,000$ 83,000$ 82,000$ 86,000$ 95,000$ 94,000$ 92,000$ 90,000$ 122,000$
Page 4 of 4

APPENDIX C
EVALUATION MATRICES

Evaluation Criteria
Relative
Importance
By Criteria Overall
Construction 20%
Relative Complexity 30% 6% 3 0.18 1 0.06 1 0.06
Expandability 60% 12% 3 0.36 1 0.12 1 0.12
Implementation Schedule 10% 2% 3 0.06 1 0.02 1 0.02
100% 20% 0.60 0.20 0.20
Financial 30%
Engineering+Construction+Contingencies 60% 18% 3 0.54 1 0.18 2 0.36
Operations & Maintenance Costs 20% 6% 1 0.06 3 0.18 2 0.12
Life Cycle Costs 20% 6% 1 0.06 3 0.18 2 0.12
100% 30% 0.66 0.54 0.60
Technical 50%
Occupational Health and Safety 20% 10% 3 0.30 1 0.10 1 0.10
Water System Security 20% 10% 1 0.10 3 0.30 2 0.20
Ease of maintenance 15% 8% 3 0.23 2 0.15 1 0.08
Ice/Freeze Issues 10% 5% 1 0.05 3 0.15 2 0.10
Leakage Failure 10% 5% 3 0.15 2 0.10 1 0.05
Complexity of Repairs 10% 5% 3 0.15 1 0.05 2 0.10
Demonstrated technology in colder climates 5% 3% 1 0.03 3 0.08 2 0.05
Water Quality 10% 5% 1 0.05 3 0.15 2 0.10
100% 50% 1.05 1.08 0.78
TOTALS 100% 100% 3.57 2.56 2.38
Relative Rankings: 1,2,3 with 1 best, 3 worse. Lowest score has highest ranking.
In-Ground Cast-in-Place Glass-Fused-to-SteelPrecast-Prestressed
Concrete
SALEM ROAD RESERVOIR AND PUMPNG STATION CONCEPTUAL DESIGN - TECHNOLOGY EVALUATION MATRIX
Reservoir Technology Ranking and ScoreRelative Weighting
m:\2017\salem reservoir and pumping station - august 2017\final_appendices\appendix_b\ref\salem reservoir_cost_final_ranking_comparison_technology assessment_dw_mep_dec05_2017.xls

Salem Road Reservoir & Pumping Station Environmental Evaluation Matrix Page 1 of 4
Do Nothing Option 1
Cast-in-Place Concrete In-Ground Reservoir
Option 2
Glass-Fused-to-Steel At-Grade Reservoir
Option 3
Precast/prestressed Concrete At-Grade Reservoir
No servicing to support future
development
1A
Site 1
North side Salem Rd, West of Hwy 400
1B
Site 2
South side Salem Rd, West of Hwy 400
2A
Site 1
North side Salem Rd, West of Hwy 400
2B
Site 2
South side Salem Rd, West of Hwy 400
3A
Site 1
North side Salem Rd, West of Hwy 400
3B
Site 2
South side Salem Rd, West of Hwy 400
(Most to Least Preferred)
Natural Environment
Impact on designated natural areas (e.g. ESPAs and PSWs)
During
construction
N/A
No designated natural areas in the vicinity,
therefore minimum impacts anticipated.
Lover’s Creek Swamp PSW and a Core Area
that is part of the City of Barrie’s Natural
Heritage System are located to the south of
this area. Potential for sediment release to
adjacent features during construction.
No designated natural areas in the vicinity,
therefore minimum impacts anticipated.
Lover’s Creek Swamp PSW and a Core Area
that is part of the City of Barrie’s Natural
Heritage System are located to the south
of this area. Potential for sediment release
to adjacent features during construction.
No designated natural areas in the vicinity,
therefore minimum impacts anticipated.
Lover’s Creek Swamp PSW and a Core Area
that is part of the City of Barrie’s Natural
Heritage System are located to the south
of this area. Potential for sediment
release to adjacent features during
construction.
During
operation
N/A
No impacts during regular operation are
anticipated.
No impacts during regular operation are
anticipated.
No impacts during regular operation are
anticipated.
No impacts during regular operation are
anticipated.
No impacts during regular operation are
anticipated.
No impacts during regular operation are
anticipated.
Impact on natural heritage features (e.g. wetlands, woodlands, valleylands, wildlife and wildlife habitat)
During
construction
N/A
Construction of the reservoir will remove a
portion of a cultural vegetation mosaic (cultural
meadow / plantation / woodland) that likely
supports a typical suite of wildlife. No wetland
impacts.
Construction of the reservoir will remove a
portion of a cultural vegetation mosaic
(cultural meadow / woodland) as well as the
edge of a deciduous forest. Vegetation
communities likely support a typical suite of
wildlife. No direct wetland impacts
anticipated.
Construction of the reservoir will remove a
portion of a cultural vegetation mosaic
(cultural meadow / plantation / woodland)
that likely supports a typical suite of
wildlife. No wetland impacts.
Construction of the reservoir will remove a
portion of a cultural vegetation mosaic
(cultural meadow / woodland) as well as
the edge of a deciduous forest. Vegetation
communities likely support a typical suite
of wildlife. No direct wetland impacts
anticipated.
Construction of the reservoir will remove a
portion of a cultural vegetation mosaic
(cultural meadow / plantation / woodland)
that likely supports a typical suite of
wildlife. No wetland impacts.
Construction of the reservoir will remove
a portion of a cultural vegetation mosaic
(cultural meadow / woodland) as well as
the edge of a deciduous forest.
Vegetation communities likely support a
typical suite of wildlife. No direct wetland
impacts anticipated.
During
operation
N/A
No impacts during regular operation are
anticipated.
No impacts during regular operation are
anticipated.
No impacts during regular operation are
anticipated.
No impacts during regular operation are
anticipated.
No impacts during regular operation are
anticipated.
No impacts during regular operation are
anticipated.
Impact on fisheries and aquatic habitat
During
construction
N/A
No watercourses in the vicinity of Option A
therefore no impacts anticipated.
Lover’s Creek is located to the south of this
area. No impacts during construction are
anticipated.
No watercourses in the vicinity of Option A
therefore no impacts anticipated.
Lover’s Creek is located to the south of this
area. No impacts during construction are
anticipated.
No watercourses in the vicinity of Option A
therefore no impacts anticipated.
Lover’s Creek is located to the south of
this area. No impacts during construction
are anticipated.
During
operation
N/A
No impacts during regular operation are
anticipated.
No impacts during regular operation are
anticipated.
No impacts during regular operation are
anticipated.
No impacts during regular operation are
anticipated.
No impacts during regular operation are
anticipated.
No impacts during regular operation are
anticipated.
Impact on Species at Risk (SAR) or SAR habitat
During
construction

Salem Road Reservoir & Pumping Station Environmental Evaluation Matrix Page 2 of 4
Do Nothing Option 1
Cast-in-Place Concrete In-Ground Reservoir
Option 2
Glass-Fused-to-Steel At-Grade Reservoir
Option 3
Precast/prestressed Concrete At-Grade Reservoir
No servicing to support future
development
1A
Site 1
North side Salem Rd, West of Hwy 400
1B
Site 2
South side Salem Rd, West of Hwy 400
2A
Site 1
North side Salem Rd, West of Hwy 400
2B
Site 2
South side Salem Rd, West of Hwy 400
3A
Site 1
North side Salem Rd, West of Hwy 400
3B
Site 2
South side Salem Rd, West of Hwy 400
(Most to Least Preferred)
N/A SAR habitat potential is considered low-moderate
based on fall field review.
Low potential for SAR bats in cultural plantation
(cavity trees).
Low-moderate potential for two SAR birds (Whip-
poor-will [Threatened] and Common Nighthawk
[Threatened]). Follow-up surveys are
recommended.
Low potential for Eastern Hog-nosed Snake
(Threatened).
SAR habitat potential is considered low-
moderate based on fall field review.
Low potential for SAR bats in cultural
plantation / deciduous forest (cavity trees).
Low-moderate potential for two SAR birds
(Whip-poor-will [Threatened] and Common
Nighthawk [Threatened]). Follow-up surveys
are recommended.
Low potential for Eastern Hog-nosed Snake
(Threatened).
SAR habitat potential is considered low-
moderate based on fall field review.
Low potential for SAR bats in cultural
plantation (cavity trees).
Low-moderate potential for two SAR birds
(Whip-poor-will [Threatened] and Common
Nighthawk [Threatened]). Follow-up
surveys are recommended.
Low potential for Eastern Hog-nosed Snake
(Threatened).
SAR habitat potential is considered low-
moderate based on fall field review.
Low potential for SAR bats in cultural
plantation / deciduous forest (cavity trees).
Low-moderate potential for two SAR birds
(Whip-poor-will [Threatened] and
Common Nighthawk [Threatened]). Follow-
up surveys are recommended.
Low potential for Eastern Hog-nosed Snake
(Threatened).
SAR habitat potential is considered low-
moderate based on fall field review.
Low potential for SAR bats in cultural
plantation (cavity trees).
Low-moderate potential for two SAR birds
(Whip-poor-will [Threatened] and Common
Nighthawk [Threatened]). Follow-up
surveys are recommended.
Low potential for Eastern Hog-nosed Snake
(Threatened).
SAR habitat potential is considered low-
moderate based on fall field review.
Low potential for SAR bats in cultural
plantation / deciduous forest (cavity
trees).
Low-moderate potential for two SAR birds
(Whip-poor-will [Threatened] and
Common Nighthawk [Threatened]).
Follow-up surveys are recommended.
Low potential for Eastern Hog-nosed
Snake (Threatened).
During
operation
N/A
No impacts during regular operation are
anticipated.
No impacts during regular operation are
anticipated.
No impacts during regular operation are
anticipated.
No impacts during regular operation are
anticipated.
No impacts during regular operation are
anticipated.
No impacts during regular operation are
anticipated.
Overall ability
to meet
regulatory
constraints
No works therefore no impacts to
natural environment features.
All works appear to be outside of LSRCA regulation
limits – confirmed with LSRCA. SAR potential
needs to be addressed.
All works appear to be outside of LSRCA
regulation limits – confirmed with LSRCA. SAR
potential needs to be addressed.
All works appear to be outside of LSRCA
regulation limits – confirmed with LSRCA.
SAR potential needs to be addressed.
All works appear to be outside of LSRCA
regulation limits – confirmed with LSRCA.
SAR potential needs to be addressed.
All works appear to be outside of LSRCA
regulation limits – confirmed with LSRCA.
SAR potential needs to be addressed.
All works appear to be outside of LSRCA
regulation limits – confirmed with LSRCA.
SAR potential needs to be addressed.
Socio-Cultural Environment
Effectiveness
and reliability
in achieving EA
objectives
Does not achieve study objectives
Meets study objectives
Meets study objectives
Meets study objectives
Meets study objectives
Meets study objectives
Meets study objectives
Potential for disruption / inconvenience to adjacent properties and buildings
During
construction
N/A
Limited low potential for minor/temporary
disruption to adjacent properties
Limited low potential for minor/temporary
disruption to adjacent properties
Limited low potential for minor/temporary
disruption to adjacent properties
Limited low potential for minor/temporary
disruption to adjacent properties
Limited low potential for minor/temporary
disruption to adjacent properties
Limited low potential for minor/
temporary disruption to adjacent
properties
Impact on
existing utilities
and services
(e.g. mains
sewers, gas,
electric etc.)
N/A
Salem Rd will be reconstructed as part of works.
No significant constraints identified.
Lockhart Rd will be reconstructed as part of
works. No significant constraints identified.
Salem Rd will be reconstructed as part of
works No significant constraints identified.
Lockhart Rd will be reconstructed as part
of works. No significant constraints
identified.
Salem Rd will be reconstructed as part of
works. No significant constraints identified.
Lockhart Rd will be reconstructed as part
of works. No significant constraints
identified.
Access to site;
present and
future
N/A
Access available from Salem Rd.
Access available from Salem Rd.
Access available from Salem Rd.
Access available from Selem Rd.
Access available from Salem Rd.
Access available from Salem Rd.
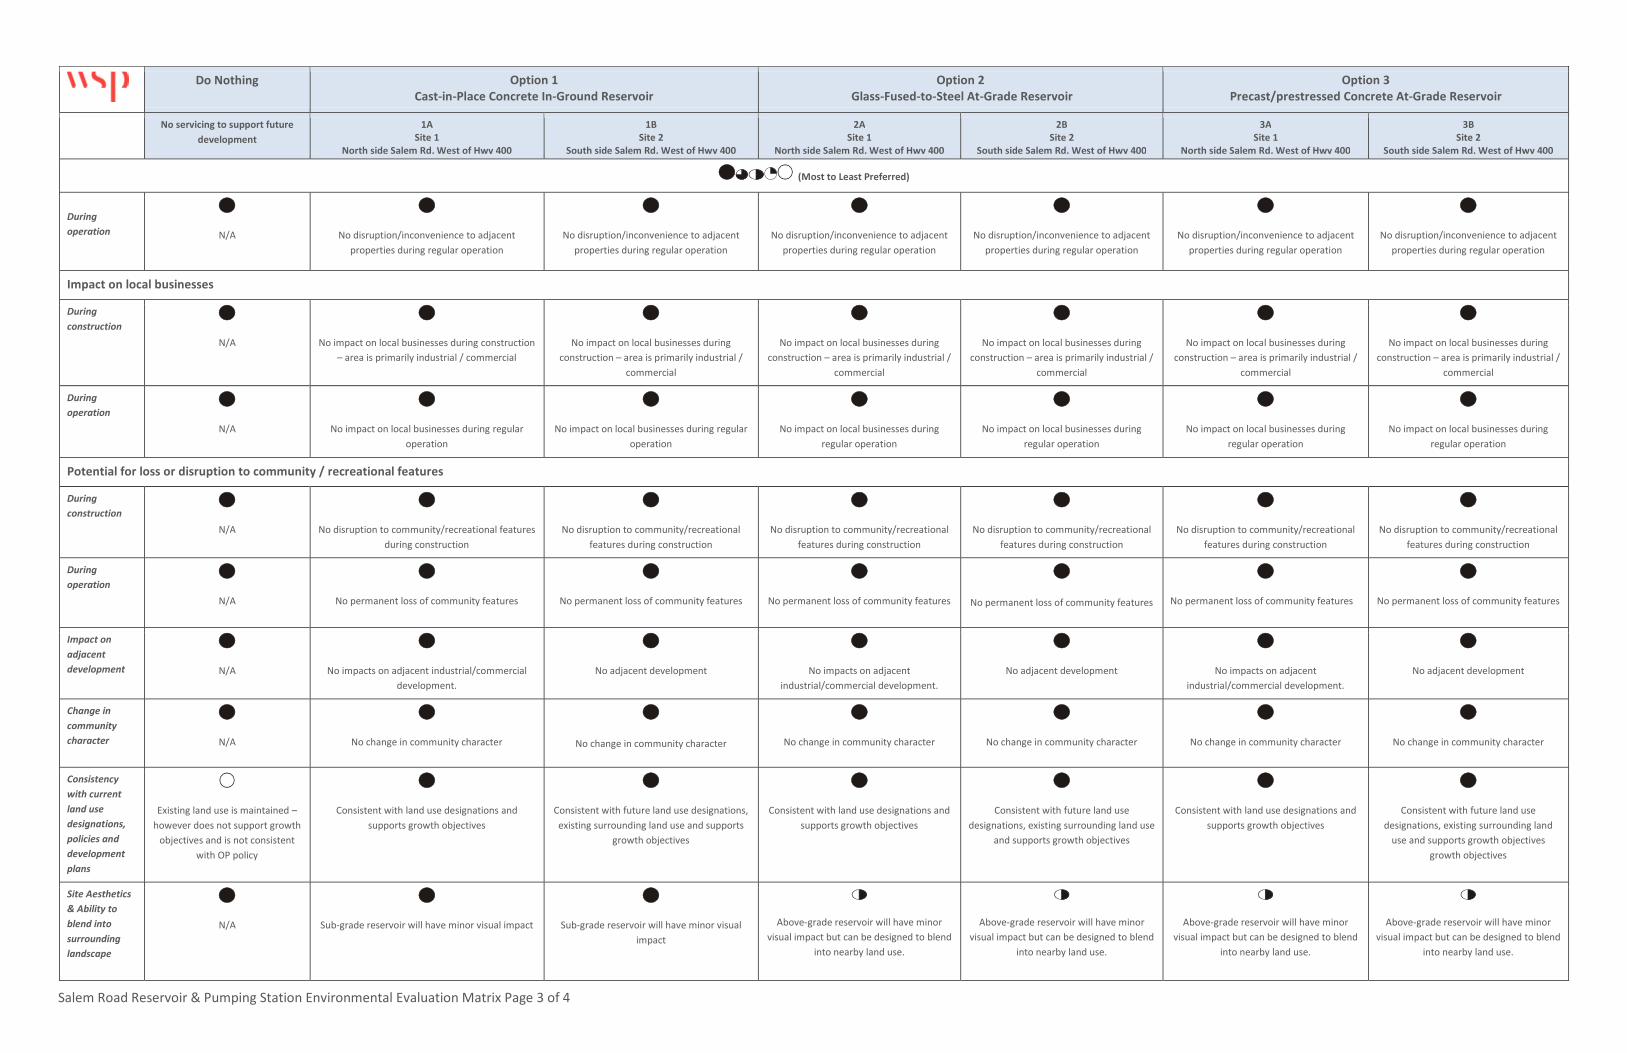
Salem Road Reservoir & Pumping Station Environmental Evaluation Matrix Page 3 of 4
Do Nothing Option 1
Cast-in-Place Concrete In-Ground Reservoir
Option 2
Glass-Fused-to-Steel At-Grade Reservoir
Option 3
Precast/prestressed Concrete At-Grade Reservoir
No servicing to support future
development
1A
Site 1
North side Salem Rd, West of Hwy 400
1B
Site 2
South side Salem Rd, West of Hwy 400
2A
Site 1
North side Salem Rd, West of Hwy 400
2B
Site 2
South side Salem Rd, West of Hwy 400
3A
Site 1
North side Salem Rd, West of Hwy 400
3B
Site 2
South side Salem Rd, West of Hwy 400
(Most to Least Preferred)
During
operation
N/A
No disruption/inconvenience to adjacent
properties during regular operation
No disruption/inconvenience to adjacent
properties during regular operation
No disruption/inconvenience to adjacent
properties during regular operation
No disruption/inconvenience to adjacent
properties during regular operation
No disruption/inconvenience to adjacent
properties during regular operation
No disruption/inconvenience to adjacent
properties during regular operation
Impact on local businesses
During
construction
N/A
No impact on local businesses during construction
– area is primarily industrial / commercial
No impact on local businesses during
construction – area is primarily industrial /
commercial
No impact on local businesses during
construction – area is primarily industrial /
commercial
No impact on local businesses during
construction – area is primarily industrial /
commercial
No impact on local businesses during
construction – area is primarily industrial /
commercial
No impact on local businesses during
construction – area is primarily industrial /
commercial
During
operation
N/A
No impact on local businesses during regular
operation
No impact on local businesses during regular
operation
No impact on local businesses during
regular operation
No impact on local businesses during
regular operation
No impact on local businesses during
regular operation
No impact on local businesses during
regular operation
Potential for loss or disruption to community / recreational features
During
construction
N/A
No disruption to community/recreational features
during construction
No disruption to community/recreational
features during construction
No disruption to community/recreational
features during construction
No disruption to community/recreational
features during construction
No disruption to community/recreational
features during construction
No disruption to community/recreational
features during construction
During
operation
N/A
No permanent loss of community features
No permanent loss of community features
No permanent loss of community features
No permanent loss of community features
No permanent loss of community features
No permanent loss of community features
Impact on
adjacent
development
N/A
No impacts on adjacent industrial/commercial
development.
No adjacent development
No impacts on adjacent
industrial/commercial development.
No adjacent development
No impacts on adjacent
industrial/commercial development.
No adjacent development
Change in
community
character
N/A
No change in community character
No change in community character
No change in community character
No change in community character
No change in community character
No change in community character
Consistency
with current
land use
designations,
policies and
development
plans
Existing land use is maintained –
however does not support growth
objectives and is not consistent
with OP policy
Consistent with land use designations and
supports growth objectives
Consistent with future land use designations,
existing surrounding land use and supports
growth objectives
Consistent with land use designations and
supports growth objectives
Consistent with future land use
designations, existing surrounding land use
and supports growth objectives
Consistent with land use designations and
supports growth objectives
Consistent with future land use
designations, existing surrounding land
use and supports growth objectives
growth objectives
Site Aesthetics
& Ability to
blend into
surrounding
landscape
N/A
Sub-grade reservoir will have minor visual impact
Sub-grade reservoir will have minor visual
impact
Above-grade reservoir will have minor
visual impact but can be designed to blend
into nearby land use.
Above-grade reservoir will have minor
visual impact but can be designed to blend
into nearby land use.
Above-grade reservoir will have minor
visual impact but can be designed to blend
into nearby land use.
Above-grade reservoir will have minor
visual impact but can be designed to blend
into nearby land use.

Salem Road Reservoir & Pumping Station Environmental Evaluation Matrix Page 4 of 4
Do Nothing Option 1
Cast-in-Place Concrete In-Ground Reservoir
Option 2
Glass-Fused-to-Steel At-Grade Reservoir
Option 3
Precast/prestressed Concrete At-Grade Reservoir
No servicing to support future
development
1A
Site 1
North side Salem Rd, West of Hwy 400
1B
Site 2
South side Salem Rd, West of Hwy 400
2A
Site 1
North side Salem Rd, West of Hwy 400
2B
Site 2
South side Salem Rd, West of Hwy 400
3A
Site 1
North side Salem Rd, West of Hwy 400
3B
Site 2
South side Salem Rd, West of Hwy 400
(Most to Least Preferred)
Potential for
disruption to
local traffic
during
construction
N/A
Site near industrial area and minimal local traffic.
Site near industrial area and minimal local
traffic.
Site near industrial area and minimal local
traffic.
Site near industrial area and minimal local
traffic.
Site near industrial area and minimal local
traffic.
Site near industrial area and minimal local
traffic.
Potential for
noise, dust and
vibration
during
construction
N/A
Hwy 400 in near proximity of property. No
significant issues identified.
Hwy 400 in near proximity of property. No
significant issues identified.
Hwy 400 in near proximity of property. No
significant issues identified.
Hwy 400 in near proximity of property. No
significant issues identified.
Hwy 400 in near proximity of property. No
significant issues identified.
Hwy 400 in near proximity of property. No
significant issues identified.
Impact on heritage resources (e.g. archaeological, built heritage and cultural heritage landscapes)
During
construction
N/A
No impacts to built heritage resources. A Stage 1 –
2 Archaeological Assessment required.
No impacts to built heritage resources. Stage
1 – 2 Archaeological Assessment required.
No impacts to built heritage resources.
Stage 1 – 2 Archaeological Assessment
required.
No impacts to built heritage resources.
Stage 1 – 2 Archaeological Assessment
required.
No impacts to built heritage resources.
Stage 1 – 2 Archaeological Assessment
required.
No impacts to built heritage resources.
Stage 1 – 2 Archaeological Assessment
required.
During
operation
N/A
No impacts, provided archaeological clearance is
obtained prior to construction.
No impacts, provided archaeological
clearance is obtained prior to construction.
No impacts, provided archaeological
clearance is obtained prior to construction.
No impacts, provided archaeological
clearance is obtained prior to construction.
No impacts, provided archaeological
clearance is obtained prior to construction.
No impacts, provided archaeological
clearance is obtained.
Impact on agricultural and rural areas
During
construction
N/A
N/A – area designated as General Industrial
Area is currently designated Rural Area. It is
not under agricultural production. The area is
designated Industrial Business Park in the
Ultimate Land Use Concept Plan.
N/A – area designated as General Industrial
Area is currently designated Rural Area. It
is not under agricultural production. The
area is designated Industrial Business Park
in the Ultimate Land Use Concept Plan.
N/A – area designated as General Industrial
Area is currently designated Rural Area. It
is not under agricultural production. The
area is designated Industrial Business Park
in the Ultimate Land Use Concept Plan.
During
operation
N/A
N/A – area designated as General Industrial
Area is currently designated Rural Area. It is
not under agricultural production. The area is
designated Industrial Business Park in the
Ultimate Land Use Concept Plan.
N/A – area designated as General Industrial
Area is currently designated Rural Area. It
is not under agricultural production. The
area is designated Industrial Business Park
in the Ultimate Land Use Concept Plan.
N/A – area designated as General Industrial
Area is currently designated Rural Area. It
is not under agricultural production. The
area is designated Industrial Business Park
in the Ultimate Land Use Concept Plan.
OVERALL
Does not provide the required
servicing infrastructure to meet
growth objectives
Ranked to have lowest environmental impact
Ranked to have the fourth lowest
environmental impact
Ranked as the second lowest
environmental impact
Considered to have greatest environmental
impact
Ranked to have the third lowest
environmental impact
Considered to have greatest
environmental impact