appendix a nassco pacp condition grading … planning/pages from... · institutional central...
TRANSCRIPT

APPENDIX A
NASSCO PACP Condition Grading System Code Matrix
NASSCO PACP Condition Grading System Code Matrix
1
Family Group Descriptor Modifier Code Structural Grade O&M Grade
Structural Crack (C) Circumferential (C) CC 1
Longitudinal (L) CL 2
Multiple (M) CM 3
Spiral (S) CS 2
Structural Fracture (F) Circumferential (C) FC 2
Longitudinal (L) FL 3
Multiple (M) FM 4
Spiral (S) FS 3
Structural Pipe Failures (Silent) Broken (B) B 1 clock pos – 3.2 clock pos
– 4 >=3 clock pos – 5
Broken (B) Soil Visible (SV) BSV 5
Broken (B) Void Visible (VV) BVV 5
Hole (H) H 1 clock pos – 3.2 clock pos
– 4, >=3 clock pos – 5
Hole (H) Soil Visible (SV) HSV 5
Hole (H) Void Visible (VV) HVV 5
Structural Collapse (X) Pipe (P) XP 5
Brick (B) XB 5
Structural Deformed (D) (Pipe) (P) D <=10% - 4.>10% - 5
Brick (B) Horizontally (H) DH 5
Brick (B) Vertically (V) DV 5
Structural Joint (J) Offset (displaced) (O) Med (M) JOM 1
Large (L) JOL 2
Separated (open) (S) Med (M) JSM 1
Large (L) JSL 2
Angular (A) Med (M) JAM 1
Large (L) JAL 2
Surface Damage Chemical (S) Roughness Increased (R) C SRIC 1
Surface Spalling (SS) C SSSC 2
Aggregate Visible (AV) C SAVC 3
Aggregate Projecting (AP) C SAPC 3
Aggregate Missing (AM) C SAMC 4
Reinforcement Visible (RV) C SRVC 5
Reinforcement Corroded (RC) C SRCC 5
Missing Wall (MW) C SMWC 5
Other (Z) C SZC
NASSCO PACP Condition Grading System Code Matrix
2
Family Group Descriptor Modifier Code Structural Grade O&M Grade
Surface Damage Mechanical (M) Roughness Increased (R) M SRIM 1
Surface Spalling (SS) M SSSM 2
Aggregate Visible (AV) M SAVM 3
Aggregate Projecting (AP) M SAPM 3
Aggregate Missing (AM) M SAMM 4
Reinforcement Visible (RV) M SRVM 5
Reinforcement Corroded (RC) M SRCM 5
Missing Wall (MW) M SMWM 5
Other (Z) M SZM N/A
Surface Damage Not Evident (Z) Roughness Increased (R) Z SRIZ 1
Surface Spalling (SS) Z SSSZ 2
Aggregate Visible (AV) Z SAVZ 3
Aggregate Projecting (AP) Z SAPZ 3
Aggregate Missing (AM) Z SAMZ 4
Reinforcement Visible (RV) Z SRVZ 5
Reinforcement Corroded (RC) Z SRCZ 5
Missing Wall (MW) Z SMWZ 5
Other (Z) Z SZZ N/A
Structural Surface Damage (Metal Pipes) Corrosion (CP) SCP 3
Lining Failure (LF) Detached (D) LFD 3
Defective End (DE) LFDE 3
Blistered (B) LFB 3
Service Cut Shifted (CS) LFCS 3
Abandoned Connection (AC) LFAC
Overcut Service (OC) LFOC 3
Undercut Service (UC) LFUC 3
Buckled (BK) LFBK 3
Wrinkled (W) LFW 3
Other (Z) LFZ
Structural Weld Failure (WF) Circumferential (C) WFC 2
Longitudinal (L) WFL 2
Multiple (M) WFM 3
Spiral (S) WFS 2
Structural Point Repair (RP) Localized Lining (L) RPL
Localized Lining (L) Defective (D) RPLD 4
Patch Repair (P) RPP

NASSCO PACP Condition Grading System Code Matrix
3
Family Group Descriptor Modifier Code Structural Grade O&M Grade
Patch Repair (P) Defective (D) RPPD 4
Pipe Replaced (R) RPR
Pipe Replaced (R) Defective (D) RPRD 4
Other (Z) RPRZ
Other (Z) RPRZD Structural Brickwork (Silent) Displaced (DB) DB 3
Missing (MB) MB 4
Dropped Invert (DI) DI 5
Slight MMS 2
Medium MMM 3
Large MML 3
O&M Deposits Attached (DA) Encrustation (E) DAE <=10% - 2, <=20% - 3, <=30% - 4, >30% - 5
Grease (G) DAGS <=10% - 2, <=20% - 3, <=30% - 4, >30% - 5
Ragging (R) DAR <=10% - 2, <=20% - 3, <=30% - 4, >30% - 5
Other (Z) DAZ <=10% - 2, <=20% - 3, <=30% - 4, >30% - 5
Deposits Settled (DS) Hard/Compacted (C) DSC <=10% - 2, <=20% - 3, <=30% - 4, >30% - 5
Fine (F) DSF <=10% - 2, <=20% - 3, <=30% - 4, >30% - 5
Gravel (G) DSGV <=10% - 2, <=20% - 3, <=30% - 4, >30% - 5
Other (Z) DSZ <=10% - 2, <=20% - 3, <=30% - 4, >30% - 5
Deposits Ingress (DN) Fines silt/sand (F) DNF <=10% - 2, <=20% - 3, <=30% - 4, >30% - 5
Gravel (GV) DNGV <=10% - 2, <=20% - 3, <=30% - 4, >30% - 5
Other (Z) DNZ <=10% - 2, <=20% - 3, <=30% - 4, >30% - 5
O&M Roots (R) Fine (F) Barrel (B) RFB 2
Lateral (L) RFL 1
Connection (C) RFC 1
Roots (R) at a Joint N/A RF 1
Tap (T) Barrel (B) RTB 3
NASSCO PACP Condition Grading System Code Matrix
4
Family Group Descriptor Modifier Code Structural Grade O&M Grade
Lateral (L) RTL 2
Connection (C) RTC 2
Roots (R) at a Joint N/A RT 2
Medium (M) Barrel (B) RMB 4
Lateral (L) RML 3
Connection (C) RMC 3
Roots (R) at a Joint N/A RM 3
Ball (B) Barrel (B) RBB 5
Lateral (L) RBL 4
Connection (C) RBC 4
Roots (R) at a Joint N/A RB 4
O&M Infiltration (I) Weeper (W) IW 2
Dripper (D) ID 3
Runner (R) IR 4
Gusher (G) IB 5
O&M Obstacles/Obstructions (OB) Brick or Masonry (B) OBB <=10% - 2, <=20% - 3, <=30% - 4, >30% - 5
Pipe Material in Invert (M) OBM <=10% - 2, <=20% - 3, <=30% - 4, >30% - 5
Object Protruding Thru Wall (I) OBI <=10% - 2, <=20% - 3, <=30% - 4, >30% - 5
Object Wedged in Joint (J) OBJ <=10% - 2, <=20% - 3, <=30% - 4, >30% - 5
Object Thru Connection (C) OBC <=10% - 2, <=20% - 3, <=30% - 4, >30% - 5
External Pipe or Cable in Sewer (P)
OBP <=10% - 2, <=20% - 3, <=30% - 4, >30% - 5
Built into Structure (S) OBS <=10% - 2, <=20% - 3, <=30% - 4, >30% - 5
Construction Debris (N) OBN <=10% - 2, <=20% - 3, <=30% - 4, >30% - 5
Rocks (R) OBR <=10% - 2, <=20% - 3, <=30% - 4, >30% - 5
Other Objects (Z) OBZ <=10% - 2, <=20% - 3, <=30% - 4, >30% - 5
O&M Vermin (V) Rat (R) VR 2
Cockroach (C) VC 1
Other (Z) VZ 1 Construction Features
Tap (T) Factory Made (F) TF
NASSCO PACP Condition Grading System Code Matrix
5
Family Group Descriptor Modifier Code Structural Grade O&M Grade
Capped (C) TFC
Defective (D) TFD 2
Intruding (I) TFI <=10% - 2, <=20% - 3, <=30% - 4, >30% - 5
Active (A) TFA
Break-In/Hammer (B) TB
Capped (C) TBC 2
Defective (D) TBD 3
Intruding (I) TBI <=10% - 2, <=20% - 3, <=30% - 4, >30% - 5
Active (A) TBA
Saddle (S) TS
Capped (C) TSC
Defective (D) TSD 2
Intruding (I) TSI <=10% - 2, <=20% - 3, <=30% - 4, >30% - 5
Active (A) TSA Construction Features
Intruding Seal Material (IS) IS
Sealing Ring (SR) ISSR <=10% - 2, <=20% - 3, <=30% - 4, >30% - 5
Hanging ISSRH <=10% - 2, <=20% - 3, <=30% - 4, >30% - 5
Broken ISSRB <=10% - 2, <=20% - 3, <=30% - 4, >30% - 5
Grout (GT) ISGT <=10% - 2, <=20% - 3, <=30% - 4, >30% - 5
Other (Z) ISZ <=10% - 2, <=20% - 3, <=30% - 4, >30% - 5
Construction Features
Line (L) Left (L) LL <=10 Deg – 1, <=20 Deg
2, >20 Deg – 4
Left/Up (LU) LLU <=10 Deg – 1, <=20 Deg
2, >20 Deg – 4
Left/Down (LD) LLD <=10 Deg – 1, <=20 Deg
2, >20 Deg – 4
Right (R) LR <=10 Deg – 1, <=20 Deg
2, >20 Deg – 4
Right/Up (RU) LRU <=10 Deg – 1, <=20 Deg
2, >20 Deg – 4
Right/Down (RD) LRD <=10 Deg – 1, <=20 Deg
2, >20 Deg – 4
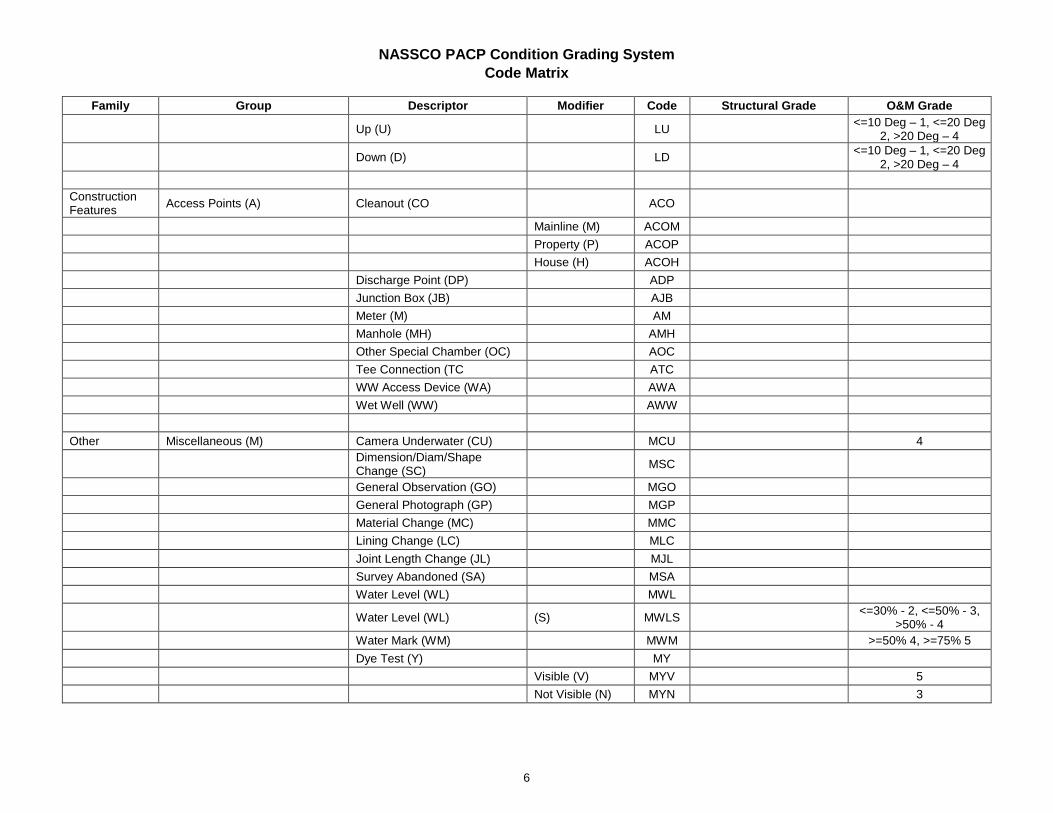
NASSCO PACP Condition Grading System Code Matrix
6
Family Group Descriptor Modifier Code Structural Grade O&M Grade
Up (U) LU <=10 Deg – 1, <=20 Deg
2, >20 Deg – 4
Down (D) LD <=10 Deg – 1, <=20 Deg
2, >20 Deg – 4 Construction Features
Access Points (A) Cleanout (CO ACO
Mainline (M) ACOM
Property (P) ACOP
House (H) ACOH
Discharge Point (DP) ADP
Junction Box (JB) AJB
Meter (M) AM
Manhole (MH) AMH
Other Special Chamber (OC) AOC
Tee Connection (TC ATC
WW Access Device (WA) AWA
Wet Well (WW) AWW
Other Miscellaneous (M) Camera Underwater (CU) MCU 4
Dimension/Diam/Shape Change (SC)
MSC
General Observation (GO) MGO
General Photograph (GP) MGP
Material Change (MC) MMC
Lining Change (LC) MLC
Joint Length Change (JL) MJL
Survey Abandoned (SA) MSA
Water Level (WL) MWL
Water Level (WL) (S) MWLS <=30% - 2, <=50% - 3,
>50% - 4 Water Mark (WM) MWM >=50% 4, >=75% 5
Dye Test (Y) MY
Visible (V) MYV 5
Not Visible (N) MYN 3

APPENDIX B
Town of Oakville Official Land Use Plan
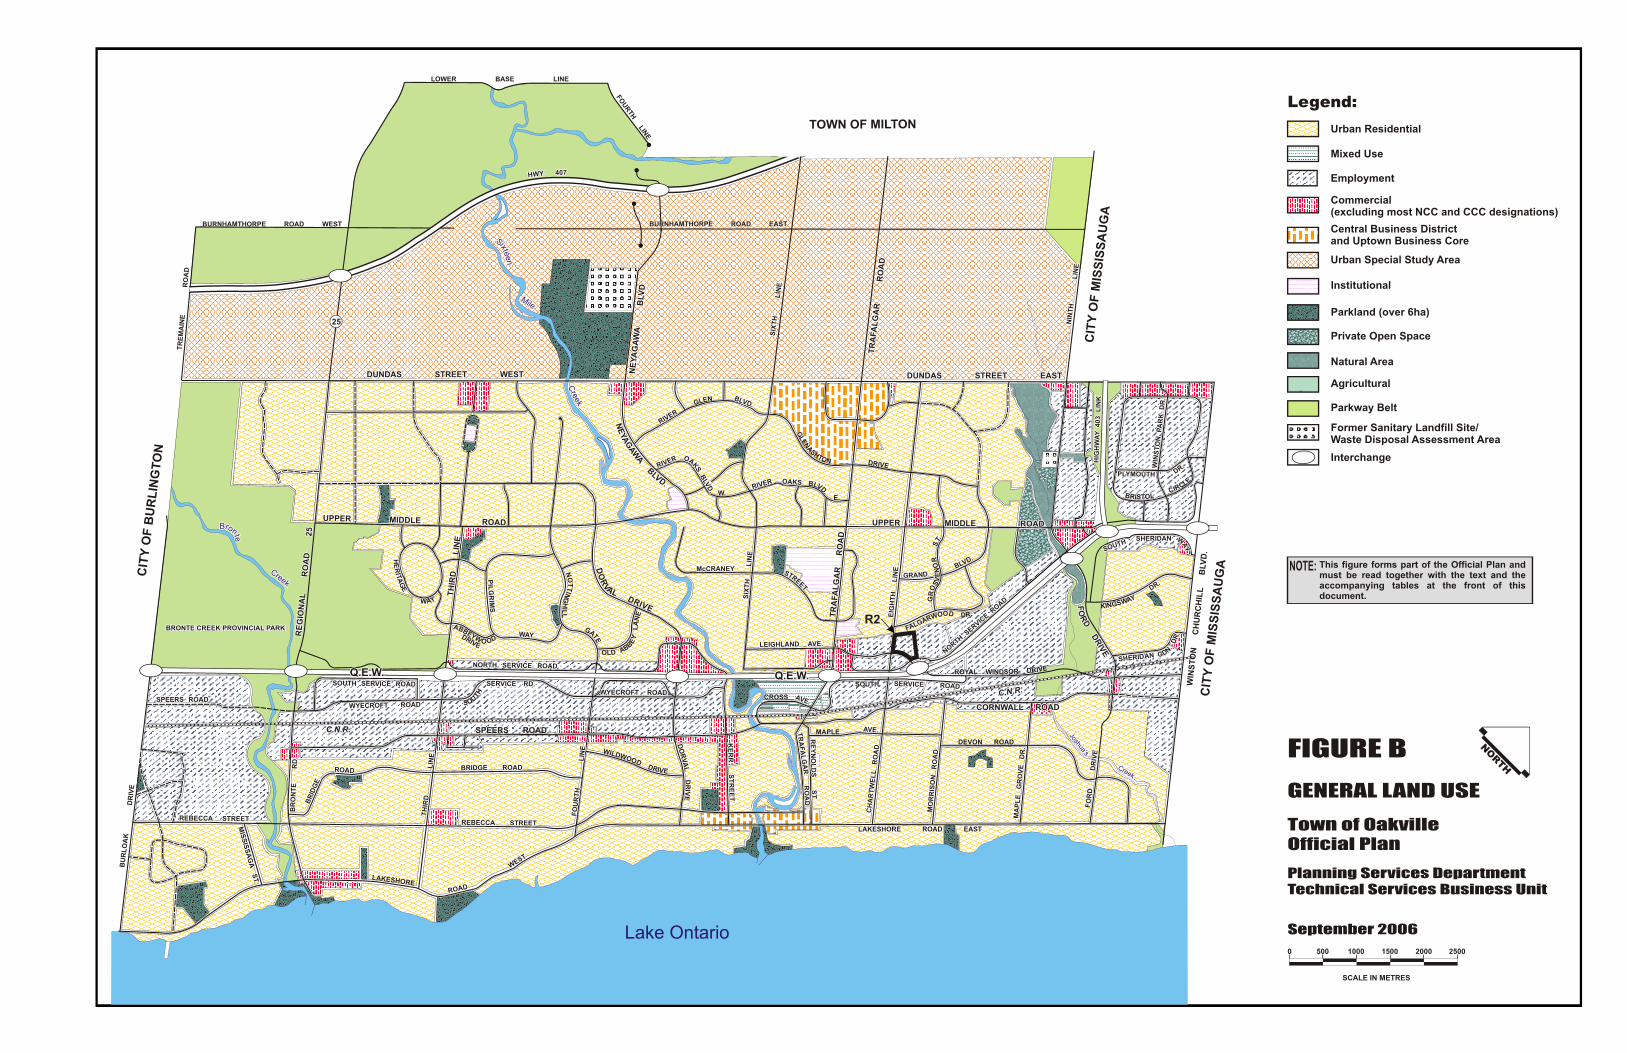

APPENDIX C
Schedule A1 to Liveable Oakville Plan

Q.E.W. Q.E.W.
Q.E.W.
403
Q.E.W.
403403
407
407
407
Lake Ontario
Bronte Cre ek
S ix t een
Mile
Creek
Fourt een Mile
Creek
LEIGHLAND AVE.
FORD DRIVE
NORTH SERVICE RD. E.
SPEERS ROAD
WYECROFT ROAD
LAKESHORE ROAD WEST
BURL
OAK
DRI
VE
DORVALDRIVE
LAKESHORE ROAD EAST
REYNOLDS ST.
CORNWALL ROADCROSS AVE.
TRAFALGAR
REBECCA STREET
RD.
FORD
DRI
VE
ROYAL WINDSOR ROAD
UPPER MIDDLE ROAD EAST
DUNDAS STREET EAST
NINT
H L
INE
EIGHT
H L
INE
TRAF
ALGA
R R
OAD
DUNDAS STREET WESTDUNDAS STREET WEST
SIXTH
LIN
E
DORVAL DRIVE
UPPER MIDDLE ROAD WEST
THIR
D L
INE
THIR
D L
INE
BRONTE ROAD
BRON
TE R
OAD
REGI
ONAL
ROAD
25
TREM
AINE
ROA
D
NEYA
GAWA
BLV
D.
TRAF
ALGA
R R
OAD
WINS
TON
CHU
RCHI
LL B
LVD.
PROUDFOOT TRAIL
NOTTINGHIL L GATE
NEYAGAWA BLVD.
Town of MiltonCi
ty o
f Bu
rlingto
n
City
of
Miss
issau
ga
River Oaks
UptownCore
CollegePark
Iroquois RidgeNorth
Iroquois RidgeSouth
WinstonParkWest
WinstonPark
Clearview
QEW East
OldOakville Eastlake
QEW West
Bronte
Burloak
PalermoWest
PalermoVillage
West OakTrails
Glen Abbey
407 WestSixteen Hollow
Glenorchy Joshua's Meadows
DowntownOakville
KerrVillage
Midtown Oakville
Bronte Village
SCHEDULE A1URBAN STRUCTURE
RESIDENTIAL AREAS
EMPLOYMENT AREAS
GROWTH AREAS
PARKWAY BELT
GREENBELT
LANDS NOT SUBJECT TOTHE POLICIES OF THIS PLAN
RAILWAY LINE
MAJOR COMMERCIAL AREAS
NOTE: This Schedule does not represent land use designations
MAJOR TRANSIT STATION
S:\DEPARTME\PLANNING\GIS DATA DEVELOPMENT\OFFICIAL PLAN\OP2008\LIVABLE OAKVILLE MXD...SCHEDULE A1.mxd
±
1:50,000September 7, 2012

APPENDIX D
Surveyed Storm Sewer Outfalls
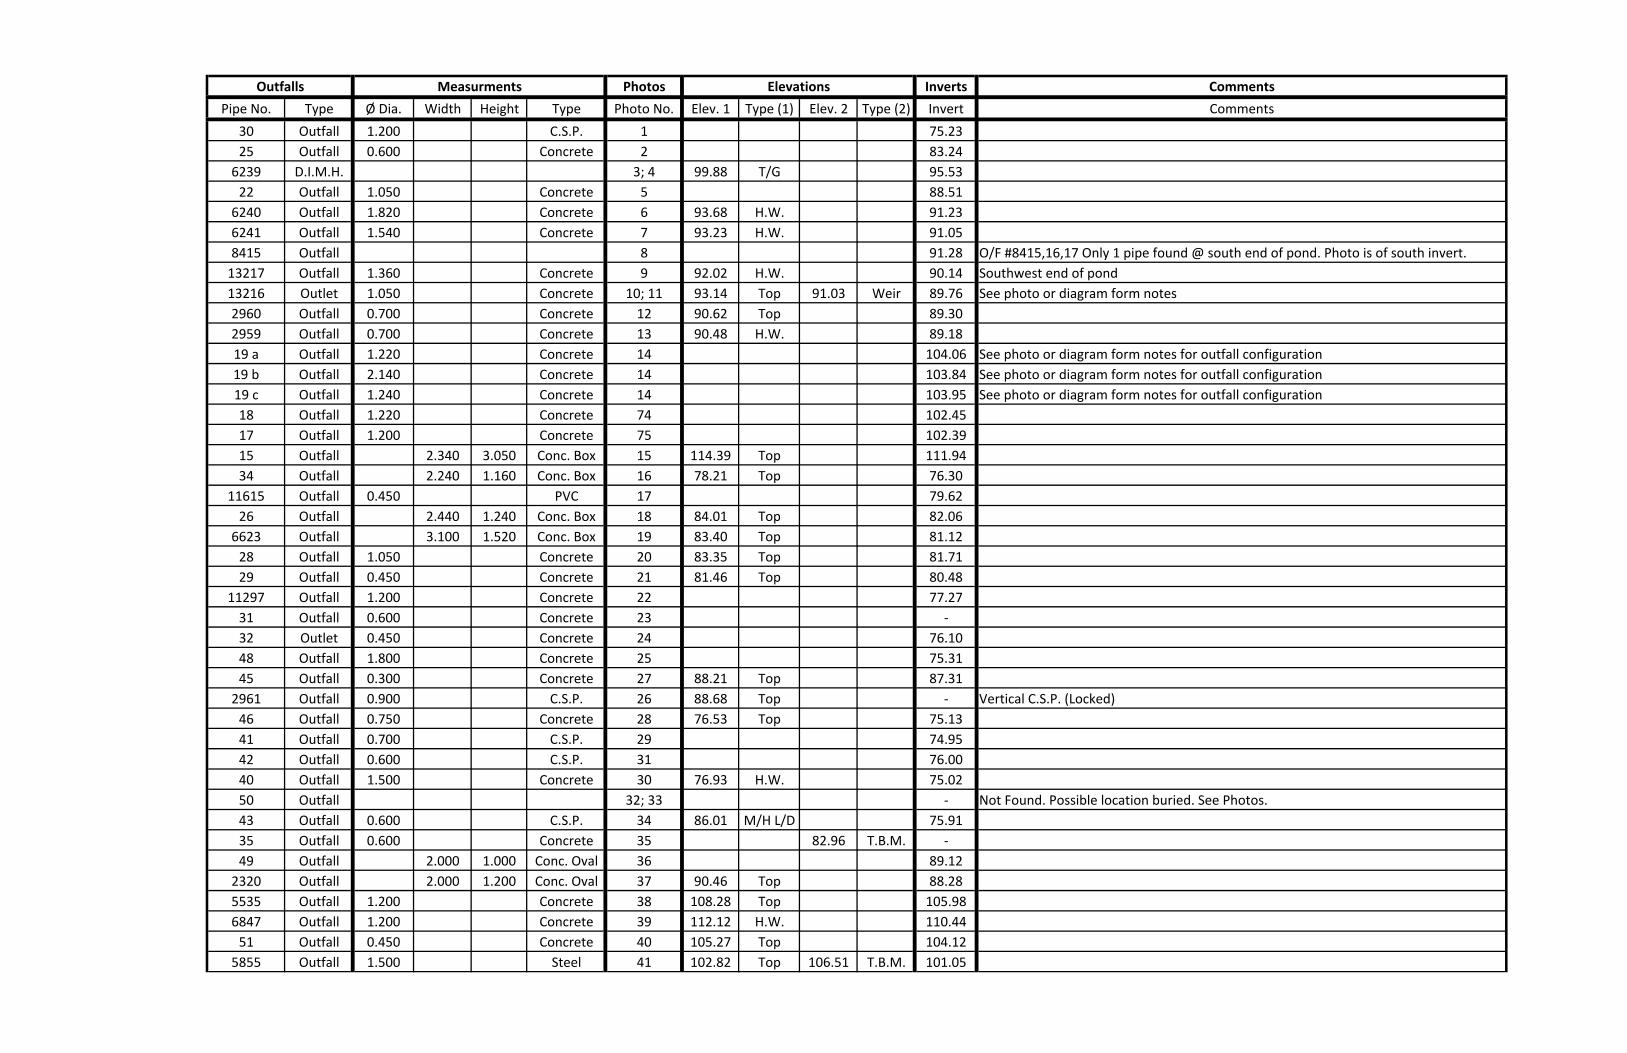
Photos Inverts Comments
Pipe No. Type Ø Dia. Width Height Type Photo No. Elev. 1 Type (1) Elev. 2 Type (2) Invert Comments
30 Outfall 1.200 C.S.P. 1 75.23
25 Outfall 0.600 Concrete 2 83.24
6239 D.I.M.H. 3; 4 99.88 T/G 95.53
22 Outfall 1.050 Concrete 5 88.51
6240 Outfall 1.820 Concrete 6 93.68 H.W. 91.23
6241 Outfall 1.540 Concrete 7 93.23 H.W. 91.05
8415 Outfall 8 91.28 O/F #8415,16,17 Only 1 pipe found @ south end of pond. Photo is of south invert.
13217 Outfall 1.360 Concrete 9 92.02 H.W. 90.14 Southwest end of pond
13216 Outlet 1.050 Concrete 10; 11 93.14 Top 91.03 Weir 89.76 See photo or diagram form notes
2960 Outfall 0.700 Concrete 12 90.62 Top 89.30
2959 Outfall 0.700 Concrete 13 90.48 H.W. 89.18
19 a Outfall 1.220 Concrete 14 104.06 See photo or diagram form notes for outfall configuration
19 b Outfall 2.140 Concrete 14 103.84 See photo or diagram form notes for outfall configuration
19 c Outfall 1.240 Concrete 14 103.95 See photo or diagram form notes for outfall configuration
18 Outfall 1.220 Concrete 74 102.45
17 Outfall 1.200 Concrete 75 102.39
15 Outfall 2.340 3.050 Conc. Box 15 114.39 Top 111.94
34 Outfall 2.240 1.160 Conc. Box 16 78.21 Top 76.30
11615 Outfall 0.450 PVC 17 79.62
26 Outfall 2.440 1.240 Conc. Box 18 84.01 Top 82.06
6623 Outfall 3.100 1.520 Conc. Box 19 83.40 Top 81.12
28 Outfall 1.050 Concrete 20 83.35 Top 81.71
29 Outfall 0.450 Concrete 21 81.46 Top 80.48
11297 Outfall 1.200 Concrete 22 77.27
31 Outfall 0.600 Concrete 23 -
32 Outlet 0.450 Concrete 24 76.10
48 Outfall 1.800 Concrete 25 75.31
45 Outfall 0.300 Concrete 27 88.21 Top 87.31
2961 Outfall 0.900 C.S.P. 26 88.68 Top - Vertical C.S.P. (Locked)
46 Outfall 0.750 Concrete 28 76.53 Top 75.13
41 Outfall 0.700 C.S.P. 29 74.95
42 Outfall 0.600 C.S.P. 31 76.00
40 Outfall 1.500 Concrete 30 76.93 H.W. 75.02
50 Outfall 32; 33 - Not Found. Possible location buried. See Photos.
43 Outfall 0.600 C.S.P. 34 86.01 M/H L/D 75.91
35 Outfall 0.600 Concrete 35 82.96 T.B.M. -
49 Outfall 2.000 1.000 Conc. Oval 36 89.12
2320 Outfall 2.000 1.200 Conc. Oval 37 90.46 Top 88.28
5535 Outfall 1.200 Concrete 38 108.28 Top 105.98
6847 Outfall 1.200 Concrete 39 112.12 H.W. 110.44
51 Outfall 0.450 Concrete 40 105.27 Top 104.12
5855 Outfall 1.500 Steel 41 102.82 Top 106.51 T.B.M. 101.05
Outfalls Measurments Elevations

Photos Inverts Comments
Pipe No. Type Ø Dia. Width Height Type Photo No. Elev. 1 Type (1) Elev. 2 Type (2) Invert Comments
Outfalls Measurments Elevations
299 Outfall 0.300 Big 'O' 42 108.23 T.B.M. 101.20
300 Outfall 0.900 C.S.P. 43 102.18
301 Outfall 0.450 Concrete 44 102.06
302 Outfall 0.450 Concrete 45 102.43 Top 101.42
7151 Outfall 1.200 Concrete 47 98.66
303 Outfall 1.400 Concrete 46 98.07 T.B.M. 94.79
44 Outfall 0.300 Concrete 48 76.13
35 Outfall 0.600 Concrete 49 82.96 T.B.M. 79.91
36 Outfall 0.600 C.S.P. 50 75.82
37 Outfall 0.200 C.S.P. 51 78.45 Only pipe visable, see photo.
4258 Dutch Inlet 0.450 PVC 52 105.70
329 Outfall 0.550 Concrete 53 85.32 T.B.M. 81.59
328 Outfall 0.900 Concrete 54 80.70
331 Outfall 1.800 Concrete 55 81.56
3297 Outlet 56 - Outlet not found See Photo for Location
3298 Outfall 0.370 PVC 57 87.45
335 Outfall 1.800 1.050 Conc. Oval 58 90.50
338 Outfall 0.800 Concrete 59 95.30
6831 Outfall 0.750 Concrete 60 77.67
39 Outfall 0.250 PVC 61 75.41
316 Outfall 0.400 Concrete 62 76.51
317 Outfall 0.450 C.S.P. 63 76.70
318 Outfall 2.120 1.340 Conc. Oval 64 77.19 Top 75.44 See Photo to Confirm type of pipe
319 Outfall 0.600 Concrete 65 75.51 East of #318
321 Outfall 0.350 Big 'O' 66 75.69
320 Outfall 0.850 Concrete 67 75.23
314 Outfall 0.900 Concrete 68 75.47
315 Outfall 0.450 C.S.P. 69 75.71
313 Outfall 1.200 1.000 Conc. Box 70 77.02 See Photo
4256 Outfall 0.650 Concrete 71 82.96
308 Outfall 1.700 1.040 C.S.P.A. 72 84.80
323 Outfall 0.750 Concrete 73 77.70
311 Outfall 0.450 Big 'O' 76 80.87
312 Outfall - - Only 1 pipe found
399 Outfall 0.400 PVC 77 80.21
310 Outfall 0.450 Concrete 78 86.02
307 Outfall 0.900 C.S.P. 79 90.26
306 Outfall 0.600 C.S.P. 80 90.50
309 Outfall 0.700 Concrete 81 88.21
3295 Outfall 1.200 Concrete 82 82.61
327 Outfall 0.450 Concrete 83 81.85
324 Outfall 0.450 Concrete 84 78.11

Photos Inverts Comments
Pipe No. Type Ø Dia. Width Height Type Photo No. Elev. 1 Type (1) Elev. 2 Type (2) Invert Comments
Outfalls Measurments Elevations
5231 Outfall 0.450 PVC 85 109.03
229 Outfall 86 - No outlet found, c.basin @ corner of property line. See Photo.
3938 Outfall 87 - No outlet found @ south end of Dorval Road, See Photo
234 Outfall 0.250 PVC 88 85.14
1375 Outfall 0.375 PVC 89 85.85
334 Outfall 0.840 Concrete 90 82.85
11616 Outfall 0.650 Concrete 91 81.61
4575 Outfall 0.300 Concrete 92 77.30
4576 Outfall 93 - No outlet found at bend in road. See Photo. Must connect to new DW4 culvert
332 Outfall 94 - With #333. Not found. New Devepolement present. See Photo.
333 Outfall 94 - With #332. Not found. New Devepolement present.See Photo.
2976 Outfall 0.600 Concrete 96 79.53 With #2977. 2 outlets @ south side of road inlet north side.
2977 Outfall 1.220 Concrete 95 79.57 With #2976. 2 outlets @ south side of road inlet north side.
11 Outfall 1.220 Concrete 97 126.84
4895 Outfall 0.300 PVC 98 79.21
4896 Outfall 0.400 Concrete 99 79.00
222 Outfall 100 - Not Found (Buried?) Possible Location, see photo.
223 Outfall 1.220 Concrete 101 79.42
226 Outfall 1.220 Concrete 102 77.65
227 Outfall 0.600 Concrete 103 77.69
228 Outfall 1.220 Concrete 104 -
12 Outfall 1.220 Concrete 105 76.75
133 Outfall 0.450 PVC 106; 108 75.55 (Ice/Snow). Looks like flow has been diverted to here, see photo 108.
134 Outfall 1.220 Concrete 107 75.02
157 Outfall 1.200 Concrete 109 98.67 May be oval (iced over). Height and witdh = ±1.200

APPENDIX E
Climate Change Synopsis

AMEC Environment & Infrastructure A division of AMEC Americas Limited 3215 North Service Road Burlington, Ontario L7N 3G2 Tel +(905) 335-2353 Fax +(905) 335-1414 www.amec.com
P:\Work\111018\Corr\Report\14-12-08 Oakville-KParker- PN v001 App E.docx
Appendix E
Climate Change Synopsis Subject: Town of Oakville Storm Sewer Master Plan
Discussion Paper for Climate Change Assessment Introduction The Town of Oakville, like other Municipalities across the Province, has recognized climate change as an emerging issue which could potentially affect the design of new and performance of existing Municipal infrastructure. Town staff has worked with ICLEI (Local Governments for Sustainability) since 2011 to create and implement a town-wide Climate Change Adaptation Strategy through ICLEI’s Canada’s Changing Climates, Changing Communities municipal climate change adaptation program. This effort has resulted in the Town’s Climate Change Strategy1 (the “Strategy”) published in September 2014. The Strategy seeks to build the Town’s resiliency to the impacts of a changing climate by:
1. increasing the Town’s capacity to protect against and respond to projected climate change impacts;
2. educating through effective and efficient means of communication; and,
3. monitoring the implementation of adaptation actions and goals in order to make continuous operational improvements.
Consequently, as a component of Objective #1 above, an assessment has been included in this report (i.e. Town of Oakville Storm Sewer Master Plan Phase 1 Report), to evaluate the performance of the existing Municipal storm sewers under the influence of climate change. To further the discussion regarding the approaches toward assessing the influence of climate change in the planning and design of Municipal storm infrastructure, the following information has been prepared to summarize the direction provided by the Province of Ontario, and AMEC’s experience with the practices of other Provinces and Municipalities in addressing this emerging issue, as specifically related to storm infrastructure to convey and control runoff.
1 Available via http://www.oakville.ca/assets/general%20-20environment/FINAL_Climate_Change_Strategy.pdf

Town of Oakville Appendix E
P:\Work\111018\Corr\Report\14-12-08 Oakville-KParker- PN v001 App E.docx
2
CANADIAN National Municipal Adaptation Project (NMAP) (abstracted from http://www.localadaptation.ca/)
NMAP is a university-based research group that works to assess the state of planning for adaptation and resiliency in Canadian local governments, develop case studies, and generate applied knowledge that can help advance adaptation planning.
NMAP recently facilitated a survey of Canadian municipal governments to obtain a broad image of the state of municipal adaptation planning in Canada; some details are offered as follows:
o Prolonged high temperature and extreme rainfall causing flooding ranked highest amongst a variety of weather related events municipalities have had to deal with over the past 10 years
o About 70% of respondents do not have a community adaptation plan or are only now beginning to discuss formation of a plan
o Adaptation planning by Ontario local governments has included the following:
o campaigns to provide public information and improve public knowledge about adaptation
o community engagement planning processes o seeking new internal and external revenue sources for adaptation o planning for new and improving existing public infrastructure o land use zoning changes o bylaws aimed at changing public behaviour (for example, water use restrictions) o risk management/risk assessment o examining insurance costs and other potential liabilities
Province of Ontario
Various initiatives have been undertaken by the Ontario Ministry of the Environment and Climate Change (MOECC) and Ministry of Natural Resources and Forestry (MNRF) related to climate change.
Papers and reports have been prepared regarding policy conformance and impacts to ecology and biota.
Web-based tools have been developed by the MTO and MNRF which, respectively, provide updated IDF relationships using the latest Environment Canada data, and IDF curves which incorporate projected climate change impacts.
To-date, no consistent standard has been provided by the Province to account for the potential influence of climate change in the planning and design of Municipal storm infrastructure.
Town of Oakville Appendix E
P:\Work\111018\Corr\Report\14-12-08 Oakville-KParker- PN v001 App E.docx
3
The Provincial Policy Statement (June 2014) now includes requirements for incorporating climate change into natural hazards assessments stating that “Planning authorities shall consider the potential impacts of climate change that may increase the risk associated with natural hazards.”
The Water Opportunities Act will require that municipalities evaluate water infrastructure risks in light of climate change. Specifically, the Water Opportunities Act provides the Province with the authority to make regulations requiring municipalities to prepare Municipal Water Sustainability Plan that may require the development of asset management plans and an assessment of risks that may impact future delivery of municipal service, including climate change.
Province of Newfoundland and Labrador
The Department of Environment and Conservation is tasked with preparation of flood plain mapping in the Province. The Department began incorporating climate change projections into flood risk mapping in 2008/2009.
Floodline mapping is delineated for the 1:20 year and 1:100 year annual exceedence probability (AEP) using the current IDF relationships in order to establish current flood risk.
In the early projects, projected IDF relationships were developed for the years 2020, 2050, and 2080 based upon Global Climate Model results and statistical modelling of extreme precipitation events; the projected IDF relationships were then used to estimate the 1:20 and 1:100 year AEP for the 2020, 2050, and 2080 scenarios, to assess the potential influence of climate change.
The Province recently developed a suite of climate change datasets for the entire Province. One of these datasets is projected IDF data for 12 hour and 24 hour rainfall events. The Province has also recently concluded that projected future rainfall peaks in 2050 and sees reductions thereafter. As such, presently floodplain mapping assignments focus only on 2050 for representation of future flood risk.
The Province has also developed policies for land development which use the future flood risk assessments to inform placement of critical infrastructure.
City of Welland – Public Infrastructure Engineering Vulnerability Committee (PIEVC) Protocol
The PIEVC Protocol was applied by the City of Welland to identify those components of the City’s wastewater and stormwater collection systems that are at risk of failure, damage and/or deterioration from extreme climatic events or significant changes to baseline climate design values.
Anticipated impacts to infrastructure were determined based upon estimates of probable climate change effects and professional judgement to determine likely effects on individual components of the infrastructure.
Town of Oakville Appendix E
P:\Work\111018\Corr\Report\14-12-08 Oakville-KParker- PN v001 App E.docx
4
IDF relationships for future scenarios corresponding to projected 2020 and 2050 conditions were developed using changes in temperature and precipitation from 112 GCM runs and a statistical model of extreme precipitation was run against each of these adjusted records to obtain estimates of climate-impacted extreme precipitation intensities.
The projected IDF relationships were used to update synthetic design storms and hydrologic modelling was completed to assess the performance of a stormwater management facility under projected climate change conditions and re-design of the stormwater management facility under future conditions.
A similar assessment was also completed for two examples of Welland’s storm sewer infrastructure (associated with residential developments) to assess performance of these systems under future projected rainfall conditions and the construction cost implications had the systems been designed based on future projected rainfall conditions. It was concluded that the cost implications were low to moderate (in the range of 10% to 25%).
The assessments were completed to assist the City in the decision to adopt a new IDF relationship for design of municipal infrastructure.
City of Cambridge IDF Update
As part of the City of Cambridge Stormwater Management Master Plan, additional rainfall data were collected to update the City’s IDF relationships.
The rainfall dataset from the nearest Environment Canada station (Waterloo Wellington) was extended using data collected locally within the City of Cambridge, since it was observed that the Waterloo Wellington station did not capture the formative events which occurred in the City in recent years.
The comparison of the updated IDF relationships with the previous IDF relationships indicated a shift in storm frequency, whereby higher depth storms would be anticipated to occur more frequently.
City of Markham Standards
The City of Markham Design Storms have been established using the IDF relationships for the Bloor Street Gauge, rather than the nearby Buttonville Airport Gauge.
Analyses completed by City staff indicate that the depths generated by both relationships suggest that the depths for the Bloor Street gauge are up to 30% greater than those for the Buttonville Airport gauge
The City of Markham thus concluded that the current IDF relationships provide a “buffer” against uncertainties in rainfall conditions, including those resulting from climate change.

Town of Oakville Appendix E
P:\Work\111018\Corr\Report\14-12-08 Oakville-KParker- PN v001 App E.docx
5
City of Barrie
The City’s current “Storm Drainage and Stormwater Management Policies and Design Guidelines” (November 30 2009) identify that stormwater management facilities should be designed based on the most current IDF tables developed by Environment Canada for Barrie including a 15% increase in rainfall intensity data to account for impacts due to climate change.
City of Sarnia
The City’s current “Site Plan Approval, Policy Guidelines and Standards” (October 2013) identifies that all rainfall runoff analysis should be completed using the City’s climate change Modified Return Period Rainfall Amounts. It is not explicitly noted in the guidelines as to what modifications were made to the IDF relationship, however, it is indicated that the modified IDF data is applicable over the period from 2012 to 2042.
Lake Simcoe Region Conservation Authority
As documented in the current LSRCA Technical Guidelines for Stormwater Management Submissions (April 26, 2013): “The Province of Ontario set up a committee in 2008 led by the Ministry of Environment to review stormwater management in light of climate change. The objective is to make recommendations on whether legislation, or regulations or policies need to be written to regulate SWM practices to account for climate change. Some changes could also be made to the MOE SWM manual as a result of this review. This work is ongoing. When changes are made to provincial guidance, then the LSRCA technical guidelines can be modified accordingly.”
City of Halifax, Nova Scotia (abstracted from http://www.halifax.ca/climate/)
In its Climate Change Risk Management Strategy, completed in December 2007 and released in April 2008, the Halifax Regional Municipality (HRM) identified a wide range of climate change vulnerabilities and prioritized them based on the probability of their occurrence and the severity of the likely impact.
Climate SMART is the HRM’s Integrated Strategy for Climate Change Mitigation and Impact & Adaptation Preparedness and Planning - the Climate Sustainable Mitigation and Adaptation Risk Toolkit.
HRM partnered with all levels of government and the private sector to develop Climate SMART, a fully integrated planning approach that addresses the impacts of climate change.
Climate SMART is the first initiative of its kind at the municipal level that integrates and mainstreams greenhouse gas emission reduction and climate change impacts and adaptation considerations into its overall corporate-decision making process.

Town of Oakville Appendix E
P:\Work\111018\Corr\Report\14-12-08 Oakville-KParker- PN v001 App E.docx
6
The goal of Climate SMART is to help municipalities integrate "greenhouse gas" emission reduction and climate change impact and adaptation issues into the decision-making process for policy makers, practitioners and vulnerable communities. With HRM as the prototype municipality, lessons learned can be replicated in other municipalities across Canada and overseas. Climate SMART is helping HRM and its partners to develop management and planning tools to prepare for climate change impacts, and to develop strategies to reduce practices that contribute to global warming through the reduction of greenhouse gas emissions.
Climate SMART is reinforcing HRM's leadership on climate change priorities on the ground and helping fulfill Nova Scotia's commitment to address climate change adaptation and support the Federal and Provincial Governments' Climate Change priorities. Further, it is a framework for an enabling environment to leverage Federal-Provincial mitigation and adaptation funding for integrated climate change actions.
Climate SMART is a public-private initiative which addresses mitigation and adaptation opportunities from a cost-benefit perspective, with special consideration given to the long-term sustainability of the measures to be implemented. The plan encompasses all of HRM's corporate and community assets and activities, and includes a series of tools that are used to incorporate climate change information into its municipal decision-making processes. Climate SMART was formally launched in March, 2004 and includes several key deliverables:
1. Vulnerability assessments and sustainability analyses
2. Cost-benefit assessments
3. Emissions management and mitigation tool
4. Climate change risk management plan
5. An emissions management and adaptation methodology, which includes methodologies for each sector of the community
6. Communications and outreach
City of London, Ontario
The municipality has a two-phase (short term and long term) Climate Change Adaptation Strategy
o Phase 1 - Short-term Strategy:
Review Ontario municipalities practices and standards
Update the City’s current IDF curves, using data from London Airport
Develop rainfall IDF Curves incorporating changing climate
Difference between Environment Canada IDF curves and the projected IDF curves ranged from 11% to 35%
Town of Oakville Appendix E
P:\Work\111018\Corr\Report\14-12-08 Oakville-KParker- PN v001 App E.docx
7
City adopted an upward shift of 21% (applied to current IDF curves) to represent future rainfall conditions
Conduct general risk and consequence analyses across the City
Based on flood risk assessment using the 100 year and 250 year design events
Climate change postulated to increase flood damages resulting from a 250 year flood by approximately 70%
o Phase 2 - Long-term Strategy:
Update key elements of London’s Subwatershed studies
Preliminary estimate of direct increase on SWM footprint is 10-15% assuming IDF increases of 21%
Develop Green Infrastructure Plan fundamental principles
Develop a Stormwater Adaptation Strategy to Climate Change
INTERNATIONAL (abstracted from http://insideclimatenews.org/news/20130620/6-worlds-most-extensive-climate-adaptation-plans) New York City, New York, USA
The City’s $19.5 billion plan to adapt to climate change may be the world's most ambitious
The plan, initiated in June 2013, was developed in response to Superstorm Sandy.
The report "A Stronger, More Resilient New York,"2 proposes more than 250 initiatives to reduce the city’s vulnerability to coastal flooding and storm surge. About 80 percent of the $19.5 billion plan will go to repairing homes and streets damaged by Sandy, retrofitting hospitals and nursing homes, elevating electrical infrastructure, improving ferry and subway systems and fixing leaky drinking water systems. Other initiatives will focus on building and researching floodwalls, restoring swamplands and sand dunes, and other coastal flood protections.
London, England (UK)
The adaptation strategy was developed in response to rising concerns about persistent flooding, drought and extreme heat waves in the city; adopted in October 2011.
The final report, "Managing Risks and Increasing Resilience"3, analyzes the threat of global warming impacts to the city and identifies the residents and infrastructure that are
2 Available via http://www.nyc.gov/html/sirr/html/report/report.shtml 3 Available via http://www.london.gov.uk/priorities/environment/publications/managing-risks-and-increasing-resilience-the-mayor-s-
climate
Town of Oakville Appendix E
P:\Work\111018\Corr\Report\14-12-08 Oakville-KParker- PN v001 App E.docx
8
most vulnerable. It also proposes 34 initiatives to protect and strengthen the city, including three key actions: managing the risk of surface water flooding, increasing the amount of parks and vegetation in the city, and retrofitting more than one million homes by 2015 to improve water and energy efficiency.
London's adaptation plan is based on national climate change projections developed in 2009 by the UK Hadley Center.
Chicago, Illinois, USA
The "Chicago Climate Action Plan"4 (2008) is mainly a mitigation strategy for the city, though one chapter is devoted to adaptation.
The adaptation chapter outlines nine initiatives for dealing with intensely hot summers, thick smog, flooding and heavy rains—though most proposals call for further study rather than actual projects. By 2010, however, significant adaptation work was underway on green buildings, storm water management projects, tree planting and green roof installations. Overall, the city developed more than 450 mitigation and adaptation initiatives in the first two years of the climate plan.
Rotterdam, Netherlands
"Rotterdam Climate Proof"5, initiated in 2009, aims to make the city "fully" resilient to climate change impacts by 2025.
The adaptation strategy contains five themes: flood management, accessibility for ships and passengers, adaptive buildings, urban water systems, and quality of life within the city.
The city set aside about $40 million for implementation of the plan’s near-term projects.
By 2010 the initiative was making "full progress" toward its initiatives and broader goals. Perhaps the most notable project to come from the plan is Rotterdam's trio of floating pavilions. The bubble-shaped domes are anchored off the city’s waterfront and measure a total of 12,000 square feet. The project is a pilot for future floating urban districts that will be able to rise with the changing sea levels.
Quito, Ecuador
Development of the Climate Change Strategy started in 2007 and formally approved in October 2009.
The climate change strategy includes both mitigation and adaptation initiatives.
4 Available at http://www.chicagoclimateaction.org/ 5 Available at http://www.rotterdamclimateinitiative.nl/documents/RCP/English/RCP_adaptatie_eng.pdf

Town of Oakville Appendix E
P:\Work\111018\Corr\Report\14-12-08 Oakville-KParker- PN v001 App E.docx
9
Its adaptation component focuses on five key sectors: ecosystems and biodiversity, drinking water supplies, public health, infrastructure and power production, and climate risk management.
It has been noted that Quito has successfully moved climate adaptation into the city's main development agenda.
Durban, South Africa
Development of the climate change strategy was initiated in 2004 with a timeline to 2020
Durban has implemented adaptation initiatives in stages under the Municipal Climate Protection Program.
The program began assessing the local impacts of climate change—namely hotter average temperatures, intense rainfalls and coastal erosion.
The city also created a Headline Adaptation Strategy to study the vulnerability of each municipal agency to such impacts.
In 2008, development of specific adaptation plans began for the health, water and disaster management agencies.
The environmental planning department is tasked with monitoring the implementation of the agencies’ plans on a quarterly basis.
A 2010 report6 outlines the dozens of initiatives underway.
Funding implementation efforts is an on-going issue. Norway Municipalities play an important role regarding guidance and coordination in relation to municipal and regional climate change adaptation plans. The revised Planning and Building Act (2008) strengthens county municipalities' role as planning authorities. The municipalities are in the frontline in carrying out climate change adaptation measures. The Planning and Building Act and the Civil Protection Act obligate the municipalities to carry out risk and vulnerability assessments. These assessments can be important in clarifying issues and areas of risk relevant to each municipality and in recommending initiatives for various players in order to reduce vulnerability. Copenhagen, Denmark The initial work on climate adaptation was done with the drafting of the City of Copenhagen
6 Available at
http://www.durban.gov.za/City_Services/development_planning_management/environmental_planning_climate_protection/Publicati
ons/Documents/Durbans%20Municipal%20Climate%20Protection%20Programme_Climate%20Chan.pdf

Town of Oakville Appendix E
P:\Work\111018\Corr\Report\14-12-08 Oakville-KParker- PN v001 App E.docx
10
Climate Plan7 in 2009, where the principal challenges and five initiatives were identified as essential to climate-adapting the City, namely:
1. Development of methods to discharge during heavy downpours
2. Establishment of green solutions to reduce the risk of flooding
3. Increased use of passive cooling of buildings
4. Protection against flooding from the sea
5. Preparation of a combined climate adaptation strategy which co-ordinates the other elements of this plan.
Climate adaptation is planned by continuously assessing potential risk and opportunities. The aim is to achieve the greatest possible synergy with other plans and projects. Detailed investigation related to initiative #1 has led to the development of the Cloudburst Management Plan8 (2012). This Plan outlines the methods, priorities, and measures recommended for climate adaptation to mitigation potential flooding associated with extreme rainfall. It is estimated that the plan will required an implementation period of about 20 years. Copenhagen is targeting a level of resilience which limits potentially damaging floods from extreme rainfall events to the type which, statistically, occurs only once every 100 years. In Copenhagen, flood damages begin (typically) when water levels in streets reach about 10 cm depth, yet sewerage systems are only required to handle 10-year rainfall events and there are no systems able to handle the extensive flooding caused by an extreme rainfall event.
Adaptive measures must combine solutions which make the city more green and blue by draining off rainwater at ground level. Tunnel solutions will only be used in those parts of the city where no opportunities exist for drainage solely at ground level.
Adaptive measures need to be put in order of priority taking into account both the risk of flooding and the scope for synergies with other projects such as road renovation, urban development etc. A "cloudburst" tool box of urban interventions, such as cloudburst boulevards, cloudburst parks, cloudburst plazas, provided the basis for a dynamic and multifunctional system.
Estimated construction costs up to 2033 amount to a total of DKK 3.8 bn (~$725 million CAN) in present-day prices.
AF/PN/af
7 Available at
http://subsite.kk.dk/sitecore/content/Subsites/CityOfCopenhagen/SubsiteFrontpage/LivingInCopenhagen/ClimateAndEnvironment/Cl
imateAdaptation/~/media/9FC0B33FB4A6403F987A07D5332261A0.ashx 8 Available at http://kk.sites.itera.dk/apps/kk_pub2/pdf/1019_81lSkHGSvS.pdf

APPENDIX F
Drainage Requirements for Redevelopment and Infill Development

APPENDIX G
Flow Monitoring Data

TOWN OF OAKVILLE STORM SEWER MASTER PLAN - FLOW MONITORING SUMMARY
Round Period Site ID Site Description Type UTM X UTM Y
Sept-Dec 2011 3 Yolanda Drive Open Channel 604003 4806455
Sept-Dec 2011 16 South Service Road Open Channel 606846 4812585
Sept-Dec 2011 19 Ford Drive Open Channel 609709 4815263
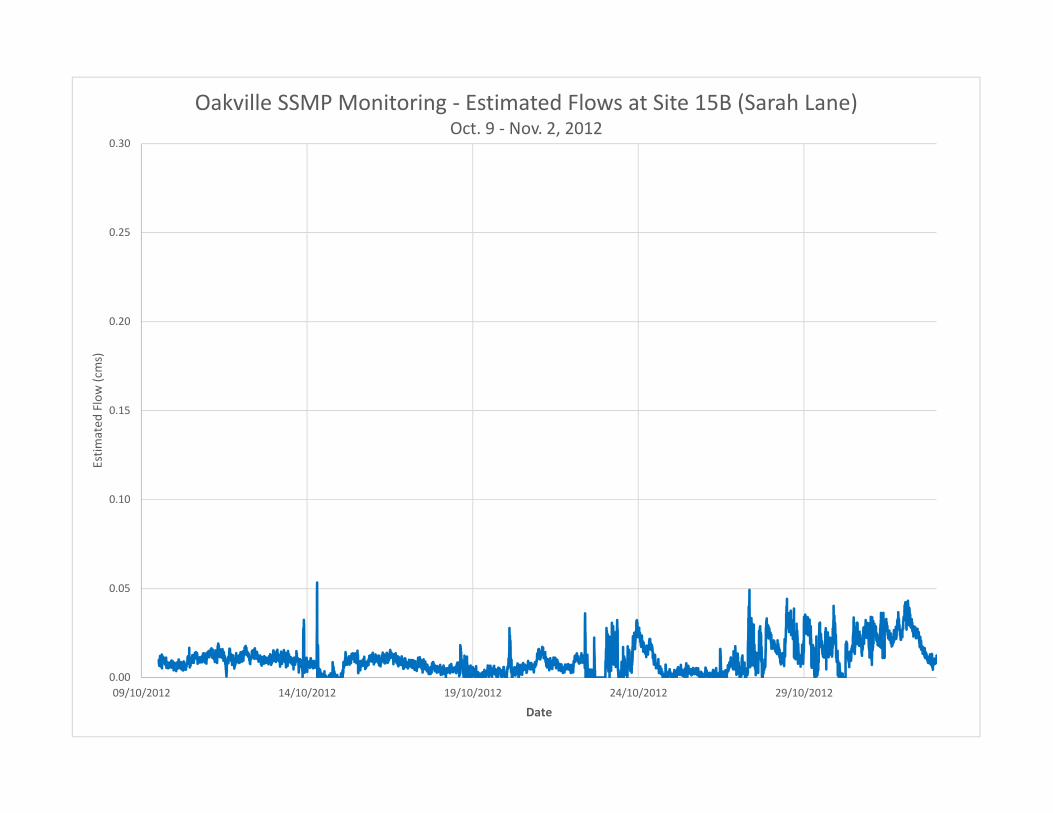
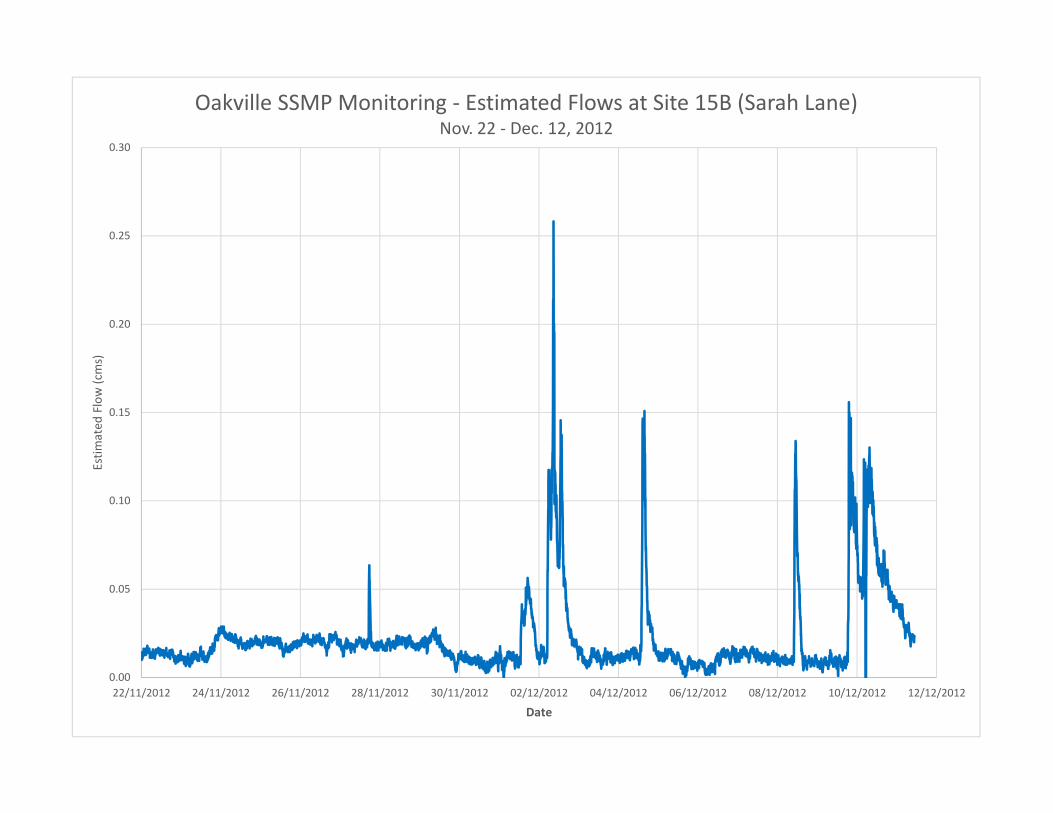
Oct-Dec 2012 15B Sarah Lane Storm Sewer 605154 4806245
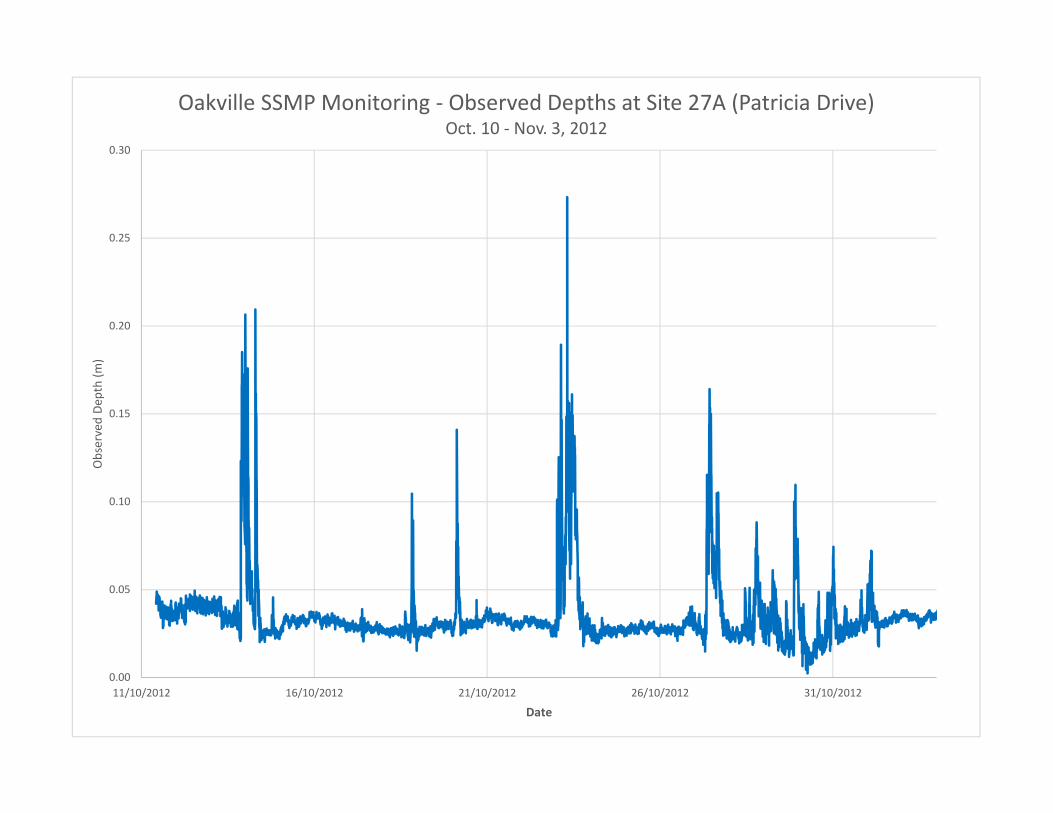
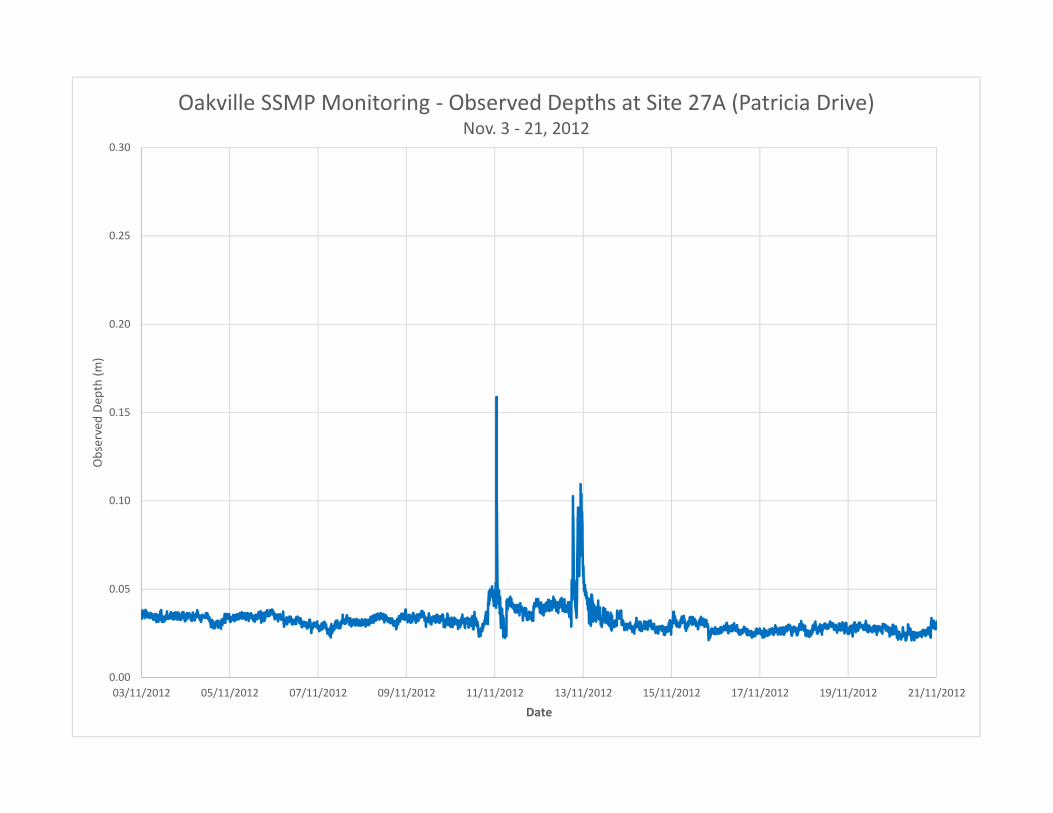
Oct-Dec 2012 27A Patricia Drive Storm Sewer 605900 4809206
Oct-Dec 2012 47B Arbour Drive Storm Sewer 610257 4814297
1
2
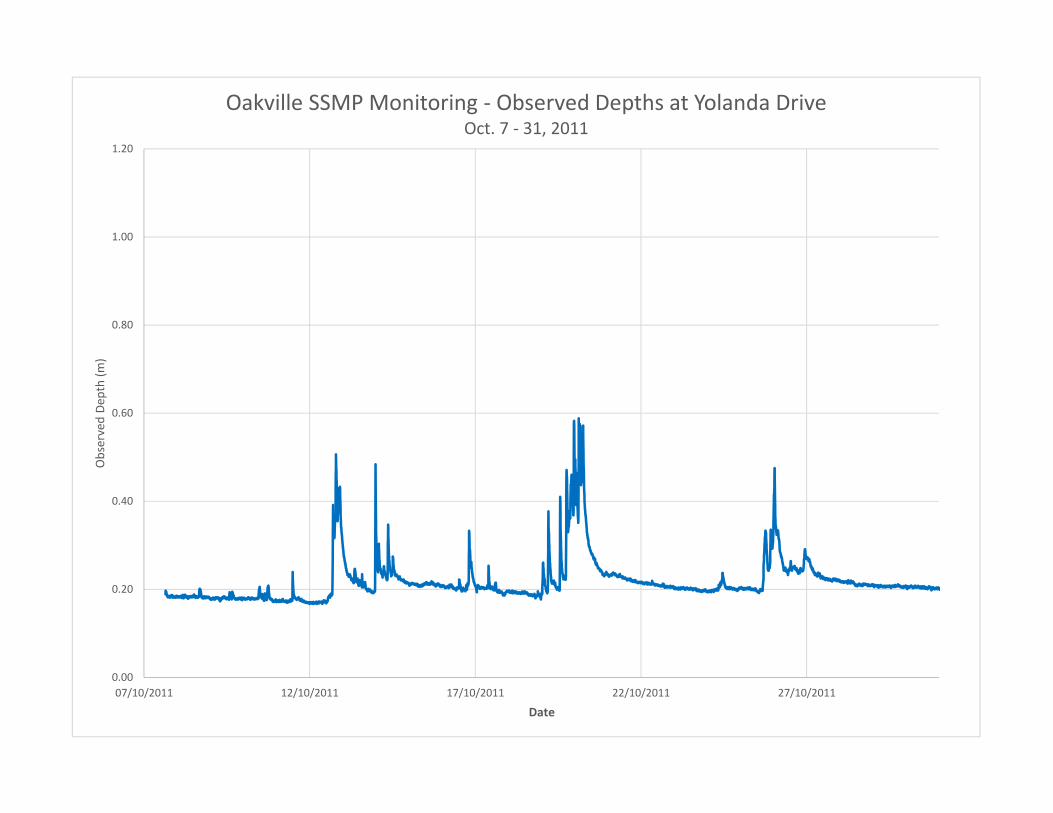
Round 1 Monitoring Site – Yolanda Drive
Yolanda Drive Monitoring Site looking downstream – September 6, 2011
Round 1 Monitoring Site – South Service Road
South Service Road Monitoring Site looking downstream – September 6, 2011
Round 1 Monitoring Site – Ford Drive
Ford Drive Monitoring Site looking downstream – September 6, 2011
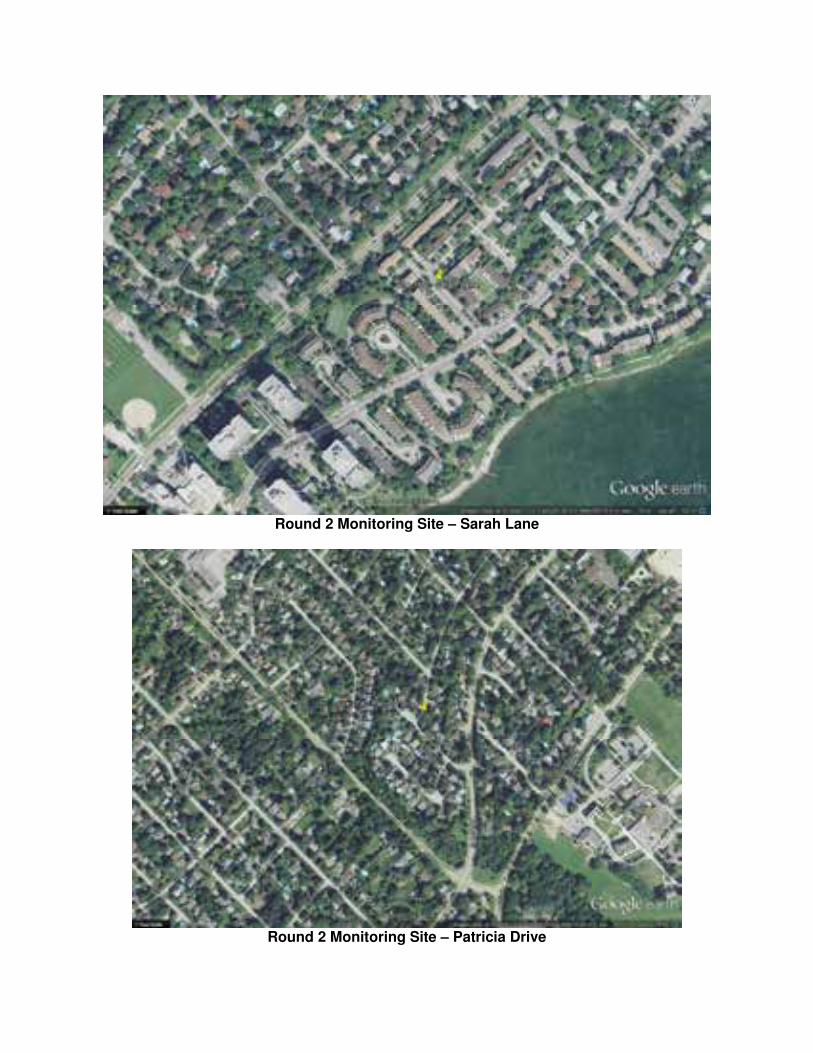
Round 2 Monitoring Site – Sarah Lane
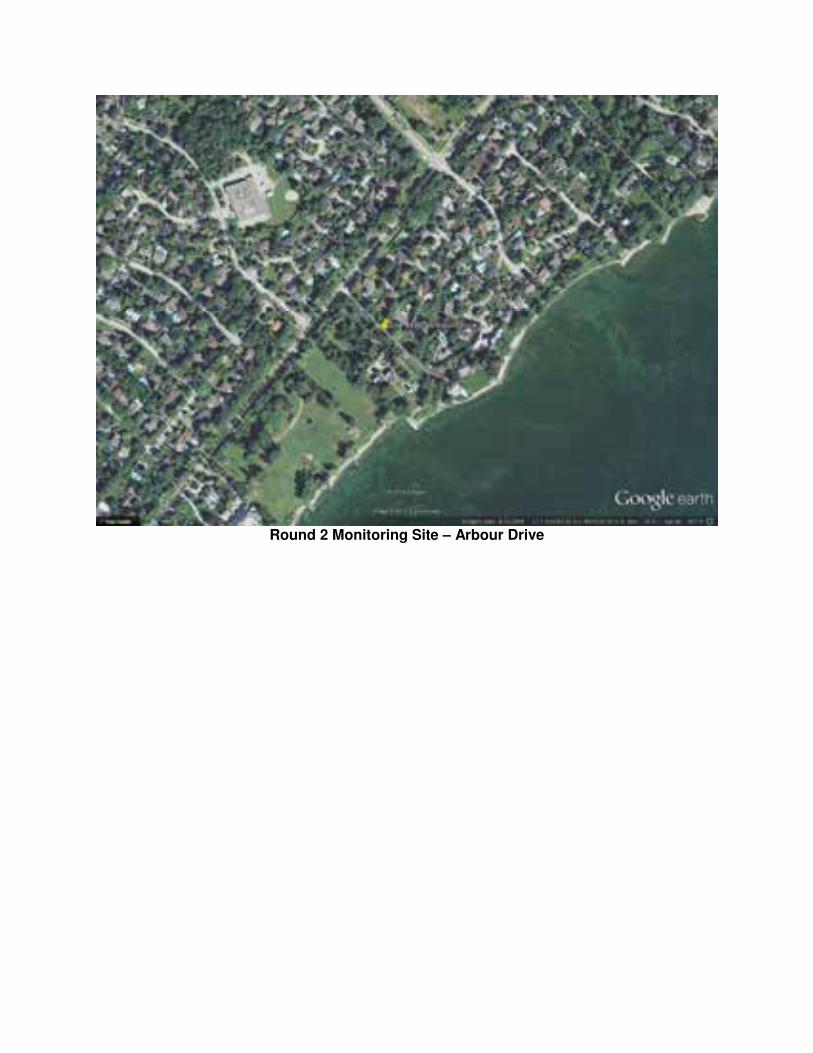
Round 2 Monitoring Site – Patricia Drive
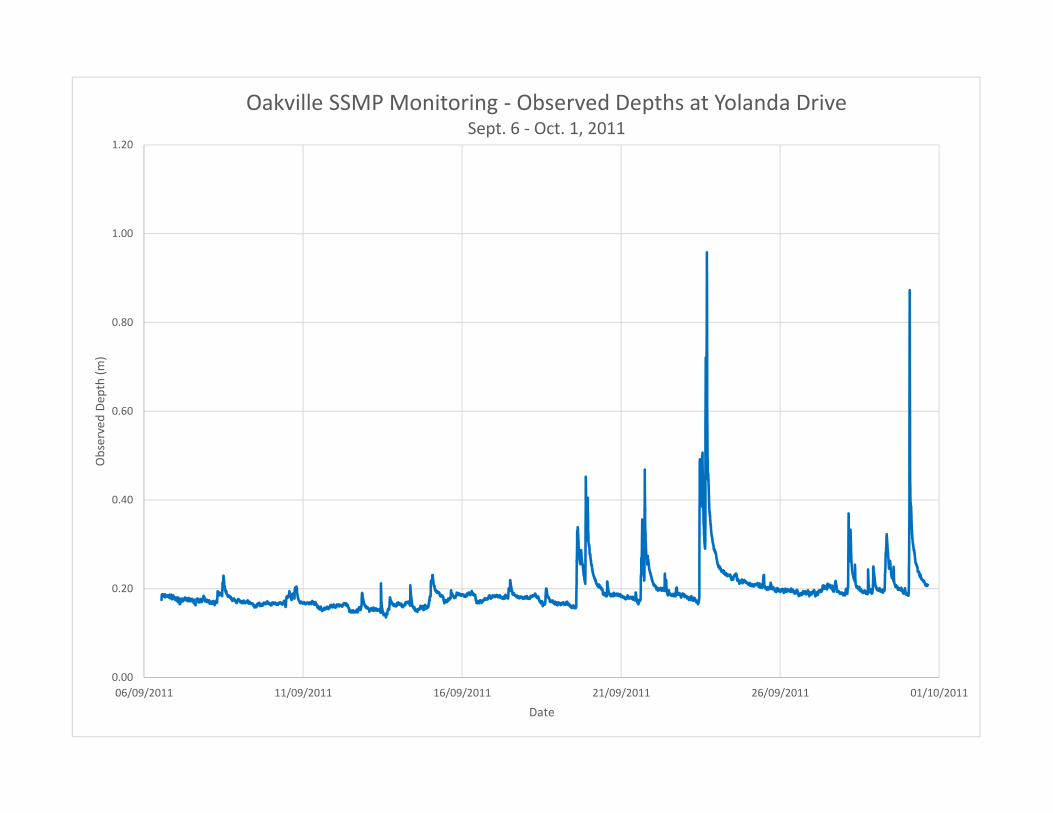
Round 2 Monitoring Site – Arbour Drive
0.00
0.20
0.40
0.60
0.80
1.00
1.20
06/09/2011 11/09/2011 16/09/2011 21/09/2011 26/09/2011 01/10/2011
Ob
serv
ed
De
pth
(m
)
Date
Oakville SSMP Monitoring - Observed Depths at Yolanda Drive Sept. 6 - Oct. 1, 2011
0.00
0.20
0.40
0.60
0.80
1.00
1.20
07/10/2011 12/10/2011 17/10/2011 22/10/2011 27/10/2011
Ob
serv
ed
De
pth
(m
)
Date
Oakville SSMP Monitoring - Observed Depths at Yolanda Drive Oct. 7 - 31, 2011
0.00
0.20
0.40
0.60
0.80
1.00
1.20
31/10/2011 02/11/2011 04/11/2011 06/11/2011 08/11/2011 10/11/2011 12/11/2011 14/11/2011 16/11/2011 18/11/2011
Ob
serv
ed
De
pth
(m
)
Date
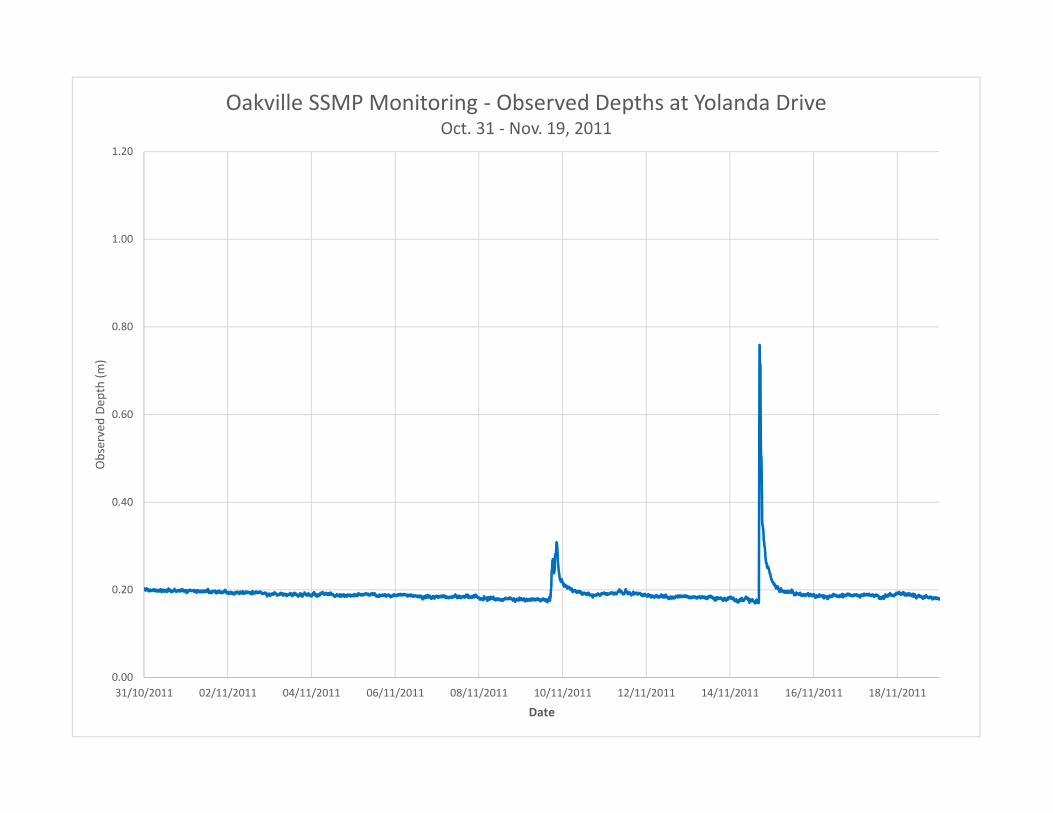
Oakville SSMP Monitoring - Observed Depths at Yolanda Drive Oct. 31 - Nov. 19, 2011
0.00
0.20
0.40
0.60
0.80
1.00
1.20
19/11/2011 21/11/2011 23/11/2011 25/11/2011 27/11/2011 29/11/2011 01/12/2011 03/12/2011 05/12/2011 07/12/2011
Ob
serv
ed
De
pth
(m
)
Date
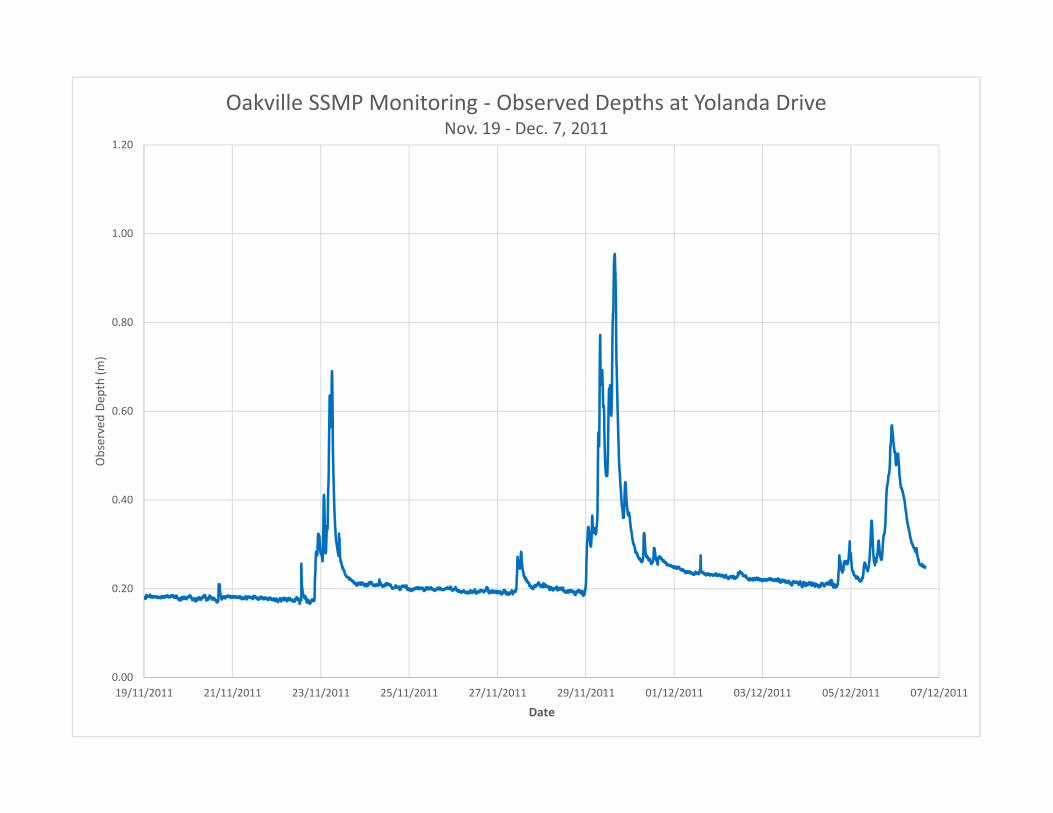
Oakville SSMP Monitoring - Observed Depths at Yolanda Drive Nov. 19 - Dec. 7, 2011

0.0
0.2
0.4
0.6
0.8
1.0
1.2
1.4
1.6
1.8
2.0
0.0 0.1 0.2 0.3 0.4 0.5 0.6 0.7 0.8 0.9 1.0
Flo
w (
cms)
Depth (m)
Round 1 - Yolanda Drive Monitoring Site Rating Curve
Observed Readings
Developed Rating Curves
0.00
0.20
0.40
0.60
0.80
1.00
1.20
1.40
1.60
1.80
05/09/2011 10/09/2011 15/09/2011 20/09/2011 25/09/2011 30/09/2011 05/10/2011
Est
ima
ted
Flo
w (
cms)
Date
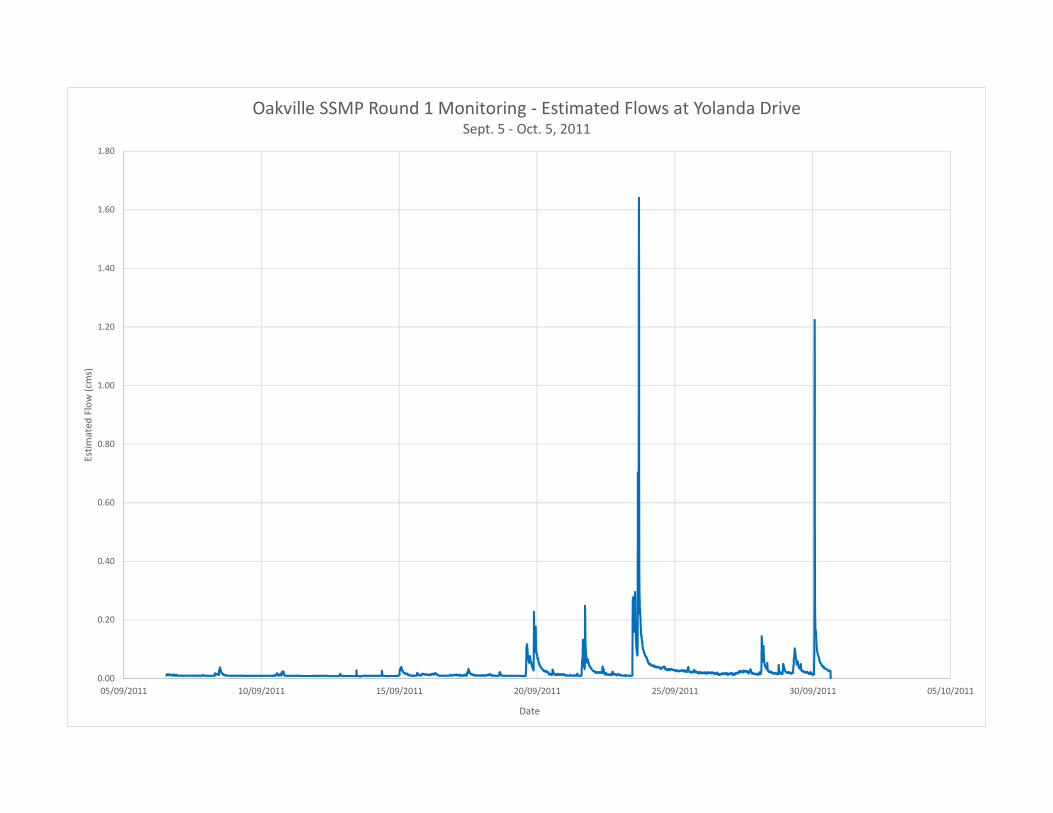
Oakville SSMP Round 1 Monitoring - Estimated Flows at Yolanda Drive Sept. 5 - Oct. 5, 2011
0.00
0.20
0.40
0.60
0.80
1.00
1.20
1.40
1.60
1.80
05/10/2011 10/10/2011 15/10/2011 20/10/2011 25/10/2011 30/10/2011 04/11/2011
Est
ima
ted
Flo
w (
cms)
Date
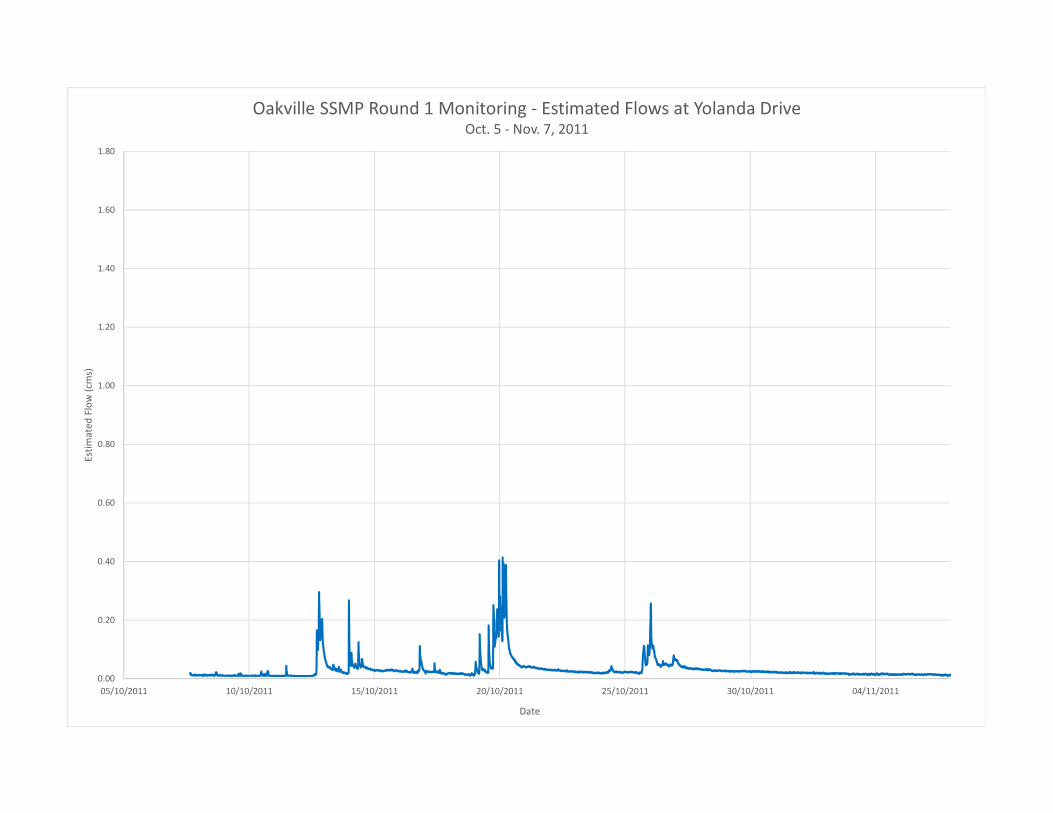
Oakville SSMP Round 1 Monitoring - Estimated Flows at Yolanda Drive Oct. 5 - Nov. 7, 2011
0.00
0.20
0.40
0.60
0.80
1.00
1.20
1.40
1.60
1.80
07/11/2011 12/11/2011 17/11/2011 22/11/2011 27/11/2011 02/12/2011 07/12/2011
Est
ima
ted
Flo
w (
cms)
Date
Oakville SSMP Round 1 Monitoring - Estimated Flows at Yolanda Drive Nov. 7 - Dec. 7, 2011
0.00
0.10
0.20
0.30
0.40
0.50
0.60
06/09/2011 11/09/2011 16/09/2011 21/09/2011 26/09/2011 01/10/2011
Ob
serv
ed
De
pth
(m
)
Date
Oakville SSMP Monitoring - Observed Depths at Ford DriveSept. 6 - Oct. 1, 2011
0.00
0.10
0.20
0.30
0.40
0.50
0.60
02/10/2011 04/10/2011 06/10/2011 08/10/2011 10/10/2011 12/10/2011 14/10/2011 16/10/2011 18/10/2011 20/10/2011 22/10/2011
Ob
serv
ed
De
pth
(m
)
Date
Oakville SSMP Monitoring - Observed Depths at Ford DriveOct. 2 - 22, 2011
0.00
0.10
0.20
0.30
0.40
0.50
0.60
22/10/2011 27/10/2011 01/11/2011 06/11/2011 11/11/2011 16/11/2011
Ob
serv
ed
De
pth
(m
)
Date
Oakville SSMP Monitoring - Observed Depths at Ford DriveOct. 22 - Nov. 20, 2011
0.00
0.10
0.20
0.30
0.40
0.50
0.60
20/11/2011 22/11/2011 24/11/2011 26/11/2011 28/11/2011 30/11/2011 02/12/2011 04/12/2011 06/12/2011
Ob
serv
ed
De
pth
(m
)
Date
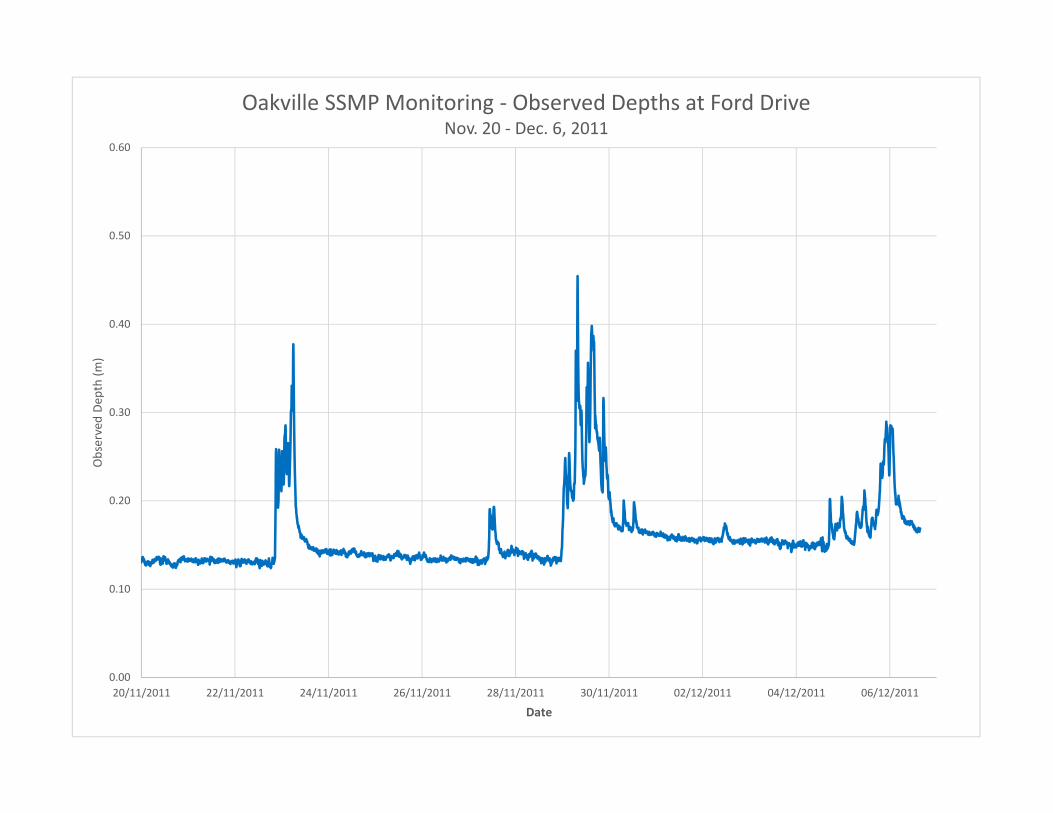
Oakville SSMP Monitoring - Observed Depths at Ford DriveNov. 20 - Dec. 6, 2011
0.0
0.1
0.2
0.3
0.4
0.5
0.6
0.0 0.1 0.2 0.3 0.4 0.5 0.6
Flo
w (
cms)
Depth (m)
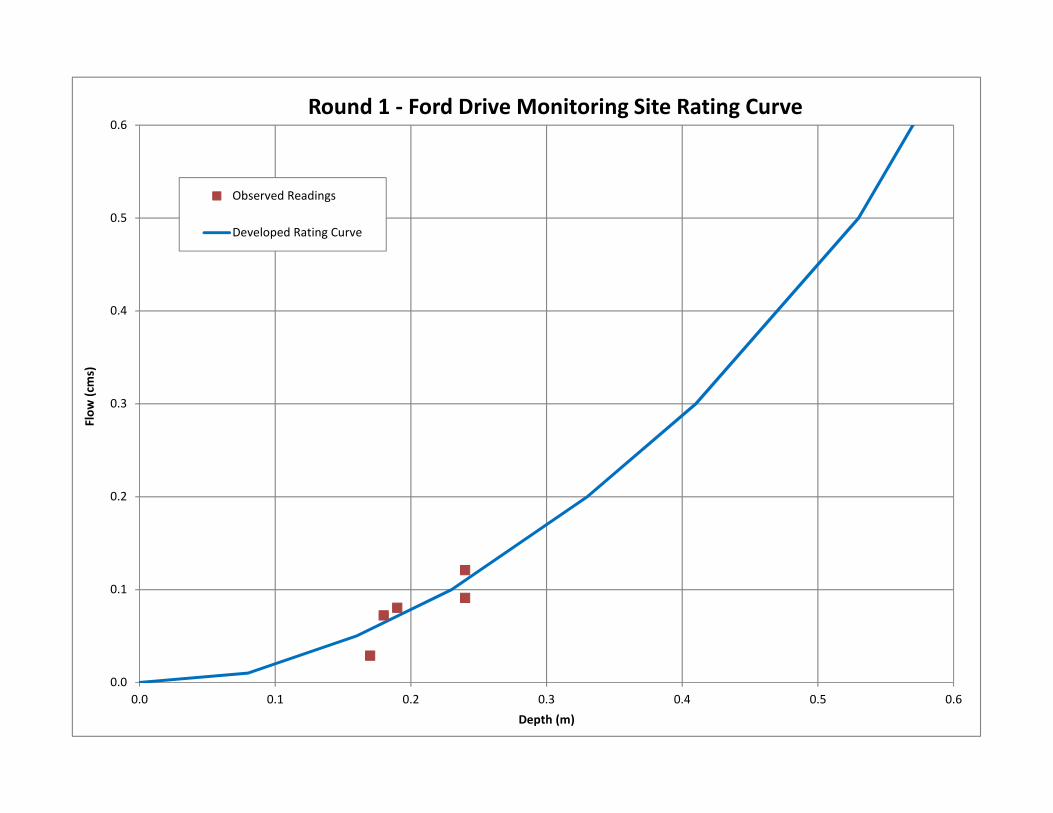
Round 1 - Ford Drive Monitoring Site Rating Curve
Observed Readings
Developed Rating Curve

0.00
0.10
0.20
0.30
0.40
0.50
0.60
0.70
05/09/2011 10/09/2011 15/09/2011 20/09/2011 25/09/2011 30/09/2011 05/10/2011
Est
ima
ted
Flo
w (
cms)
Date
Oakville SSMP Round 1 Monitoring - Estimated Flows at Ford DriveSept. 5 - Oct. 5, 2011
0.00
0.10
0.20
0.30
0.40
0.50
0.60
0.70
05/10/2011 10/10/2011 15/10/2011 20/10/2011 25/10/2011 30/10/2011 04/11/2011
Est
ima
ted
Flo
w (
cms)
Date
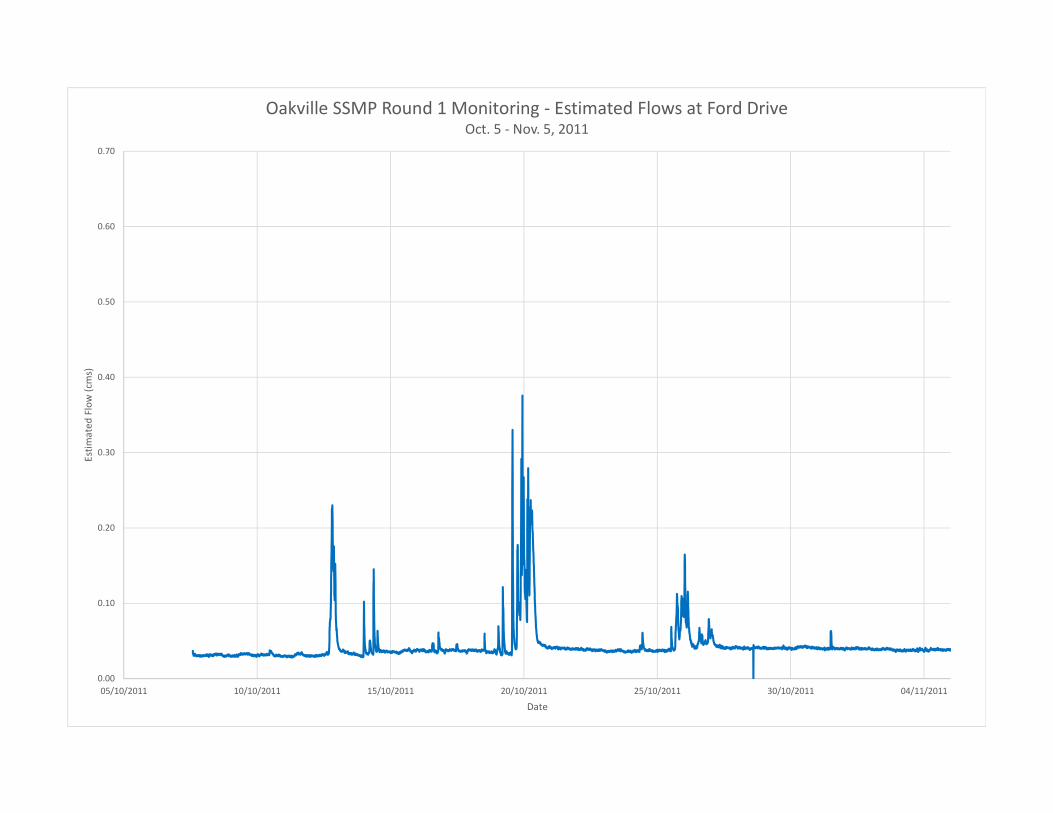
Oakville SSMP Round 1 Monitoring - Estimated Flows at Ford DriveOct. 5 - Nov. 5, 2011
0.00
0.10
0.20
0.30
0.40
0.50
0.60
0.70
05/11/2011 10/11/2011 15/11/2011 20/11/2011 25/11/2011 30/11/2011 05/12/2011
Est
ima
ted
Flo
w (
cms)
Date
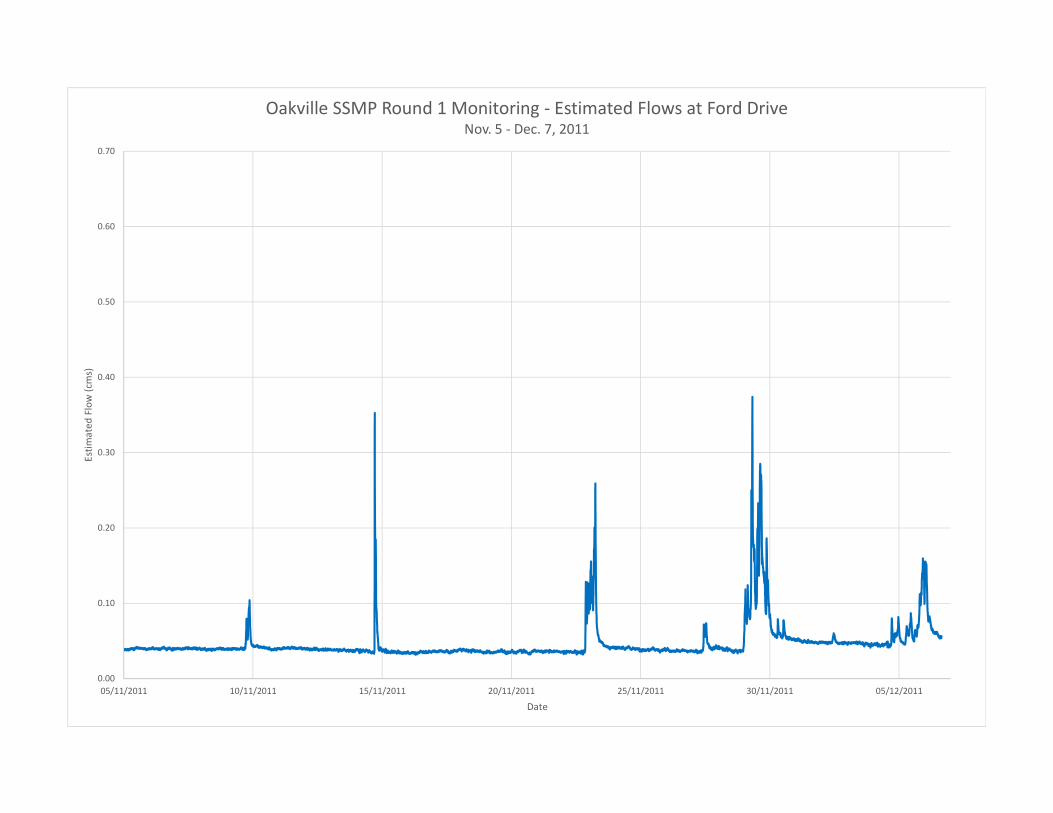
Oakville SSMP Round 1 Monitoring - Estimated Flows at Ford DriveNov. 5 - Dec. 7, 2011
0.00
0.10
0.20
0.30
0.40
0.50
0.60
0.70
0.80
07/10/2011 12/10/2011 17/10/2011 22/10/2011 27/10/2011
Ob
serv
ed
De
pth
(m
)
Date
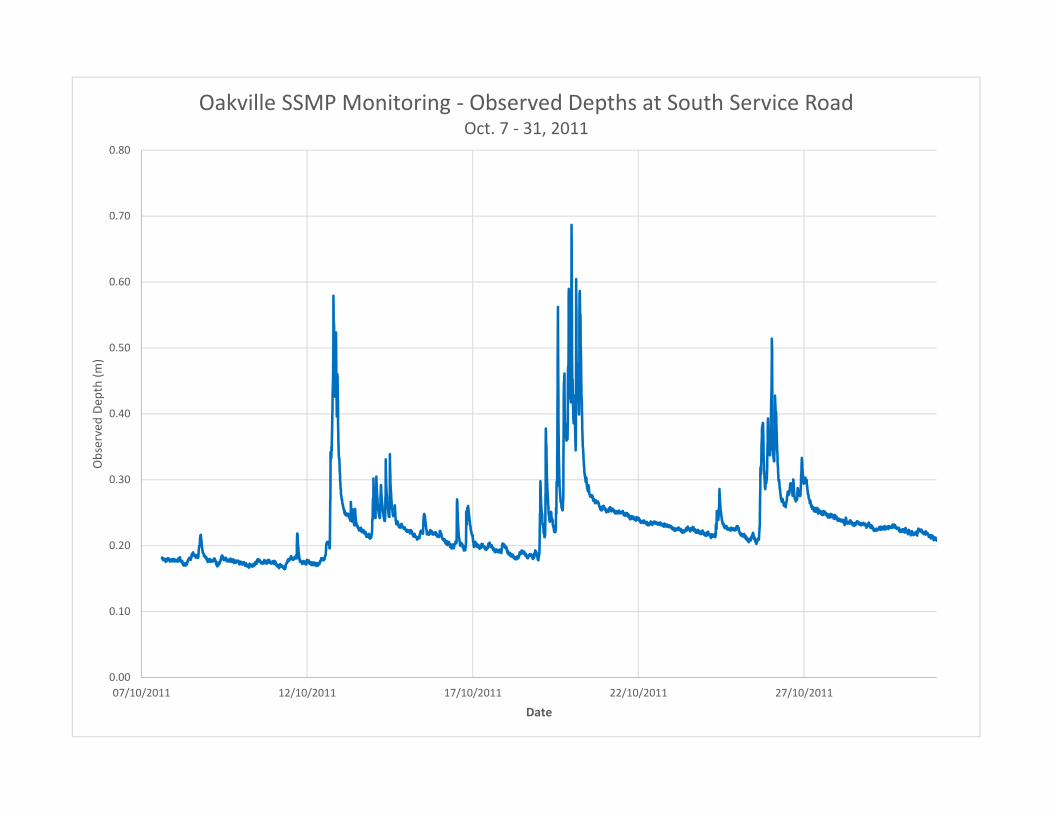
Oakville SSMP Monitoring - Observed Depths at South Service RoadOct. 7 - 31, 2011
0.00
0.10
0.20
0.30
0.40
0.50
0.60
0.70
0.80
31/10/2011 02/11/2011 04/11/2011 06/11/2011 08/11/2011 10/11/2011 12/11/2011 14/11/2011 16/11/2011 18/11/2011 20/11/2011
Ob
serv
ed
De
pth
(m
)
Date
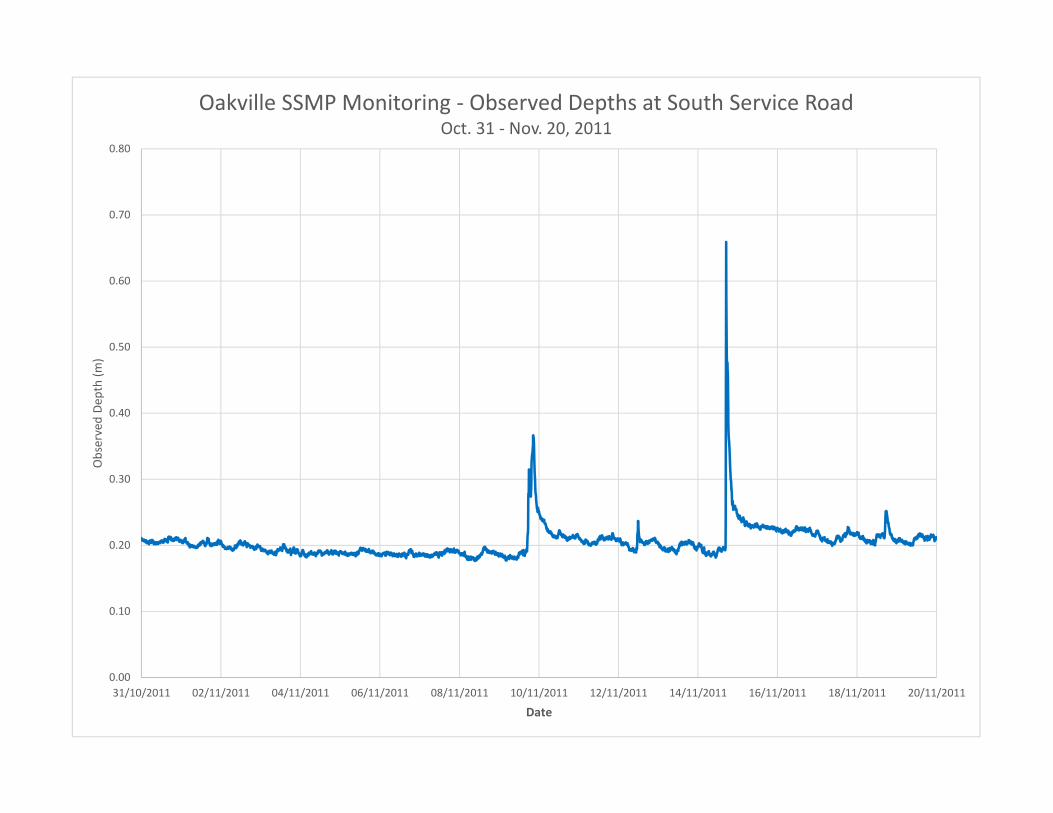
Oakville SSMP Monitoring - Observed Depths at South Service RoadOct. 31 - Nov. 20, 2011
0.00
0.10
0.20
0.30
0.40
0.50
0.60
0.70
0.80
20/11/2011 22/11/2011 24/11/2011 26/11/2011 28/11/2011 30/11/2011 02/12/2011 04/12/2011 06/12/2011
Ob
serv
ed
De
pth
(m
)
Date
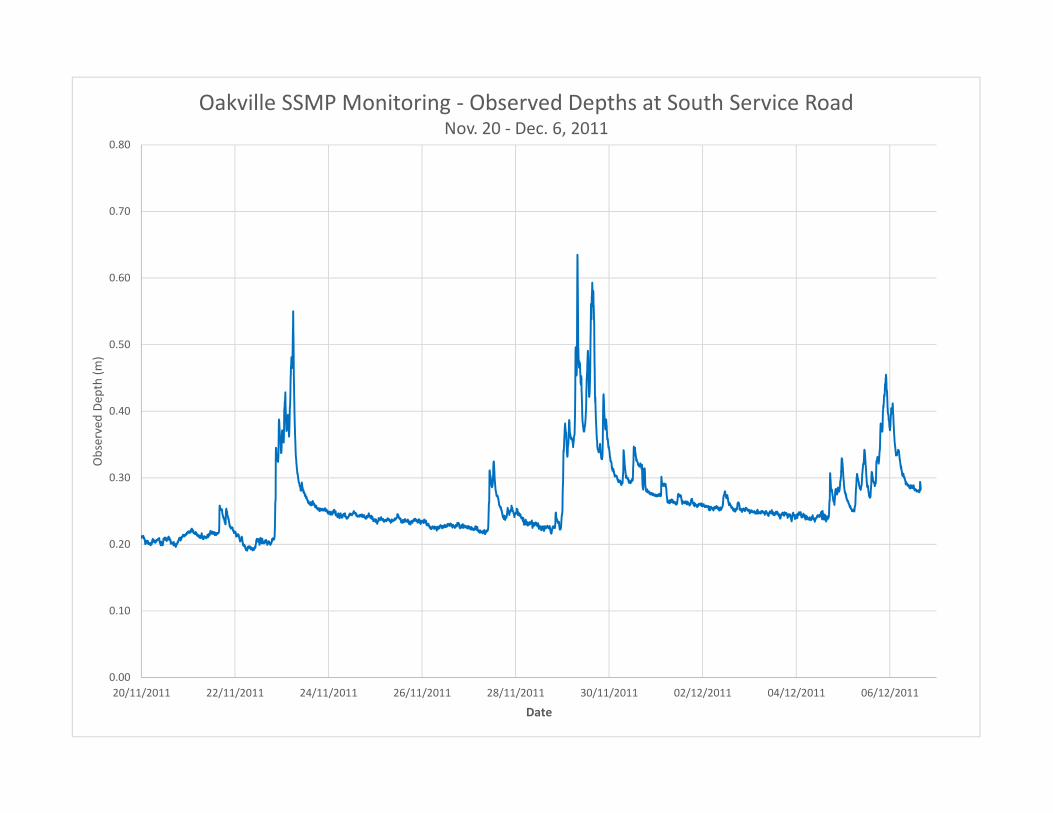
Oakville SSMP Monitoring - Observed Depths at South Service RoadNov. 20 - Dec. 6, 2011
0.0
0.1
0.2
0.3
0.4
0.5
0.6
0.7
0.8
0.9
1.0
0.0 0.1 0.2 0.3 0.4 0.5 0.6 0.7
Flo
w (
cms)
Depth (m)
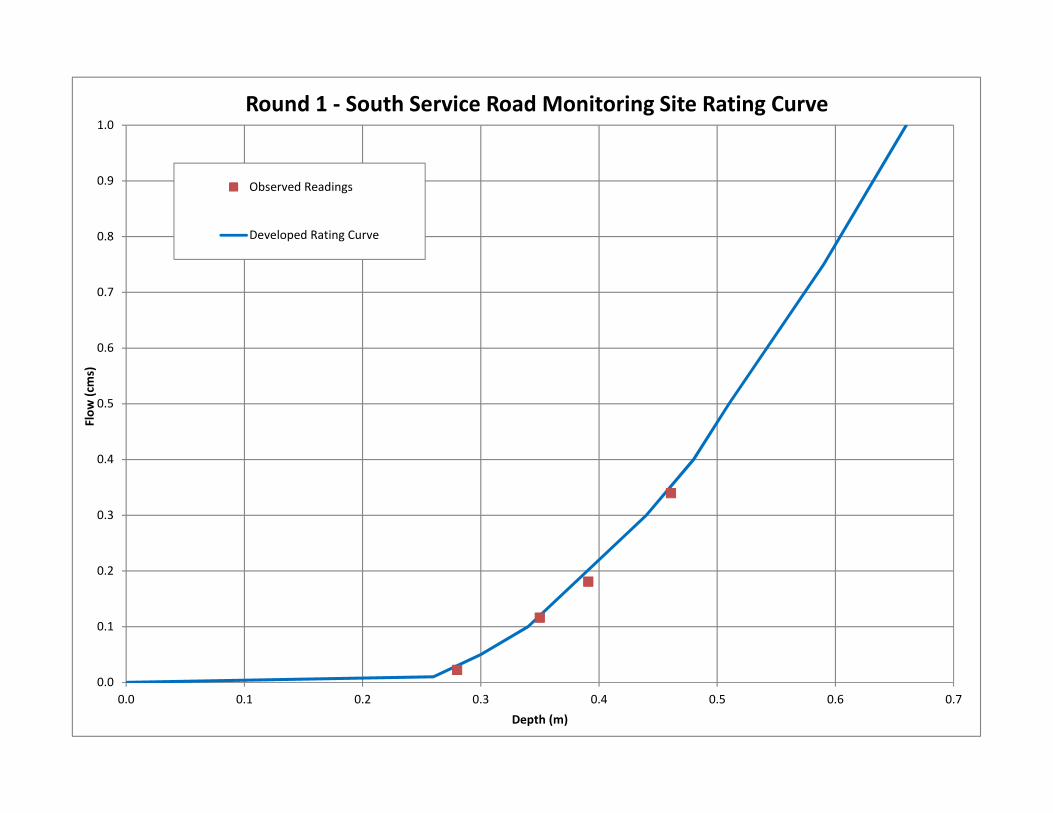
Round 1 - South Service Road Monitoring Site Rating Curve
Observed Readings
Developed Rating Curve
0.00
0.20
0.40
0.60
0.80
1.00
1.20
04/10/2011 14/10/2011 24/10/2011 03/11/2011 13/11/2011 23/11/2011 03/12/2011 13/12/2011
Est
ima
ted
Flo
w (
cms)
Date
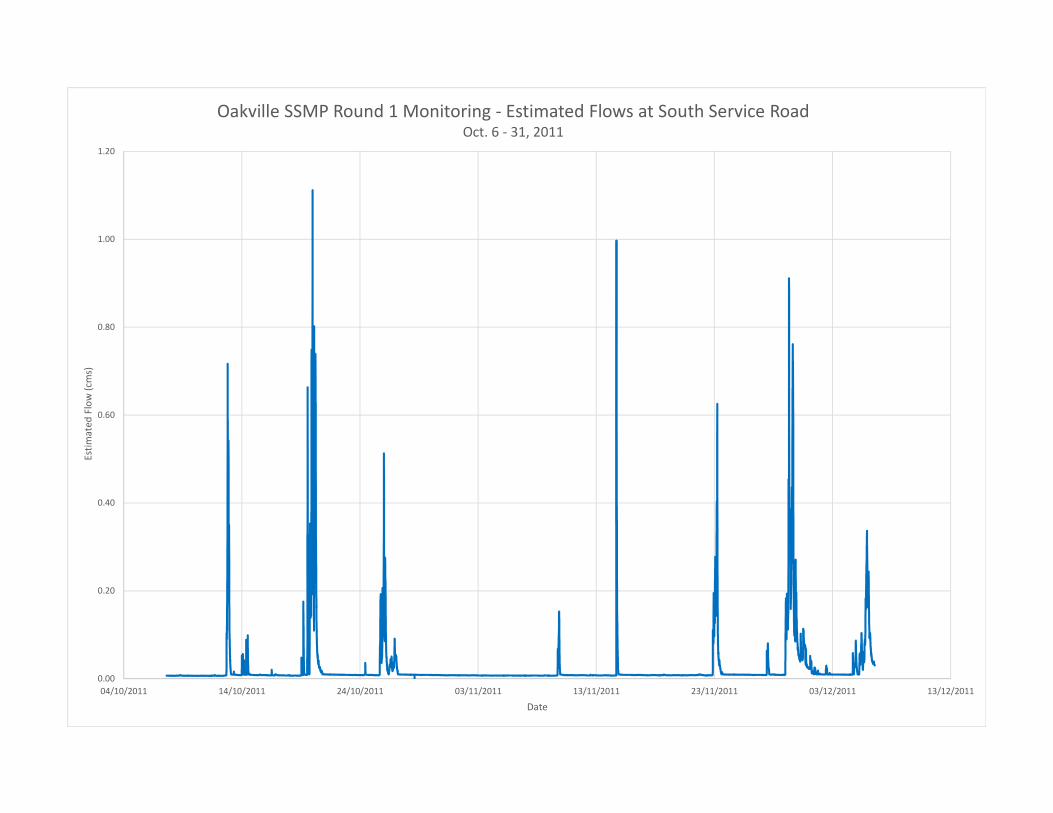
Oakville SSMP Round 1 Monitoring - Estimated Flows at South Service Road Oct. 6 - 31, 2011

0.00
0.20
0.40
0.60
0.80
1.00
1.20
06/10/2011 11/10/2011 16/10/2011 21/10/2011 26/10/2011 31/10/2011
Est
ima
ted
Flo
w (
cms)
Date
Oakville SSMP Round 1 Monitoring - Estimated Flows at South Service RoadOct. 31 - Nov. 20, 2011

0.00
0.20
0.40
0.60
0.80
1.00
1.20
20/11/2011 22/11/2011 24/11/2011 26/11/2011 28/11/2011 30/11/2011 02/12/2011 04/12/2011 06/12/2011
Est
ima
ted
Flo
w (
cms)
Date
Oakville SSMP Round 1 Monitoring - Estimated Flows at South Service RoadNov. 20 - Dec. 7, 2011

0.00
0.05
0.10
0.15
0.20
0.25
09/10/2012 14/10/2012 19/10/2012 24/10/2012 29/10/2012
Ob
serv
ed
De
pth
(m
)
Date
Oakville SSMP Monitoring - Observed Depths at Site 15B (Sarah Lane)
Oct. 9 - Nov. 2, 2012
0.00
0.05
0.10
0.15
0.20
0.25
02/11/2012 07/11/2012 12/11/2012 17/11/2012 22/11/2012
Ob
serv
ed
De
pth
(m
)
Date
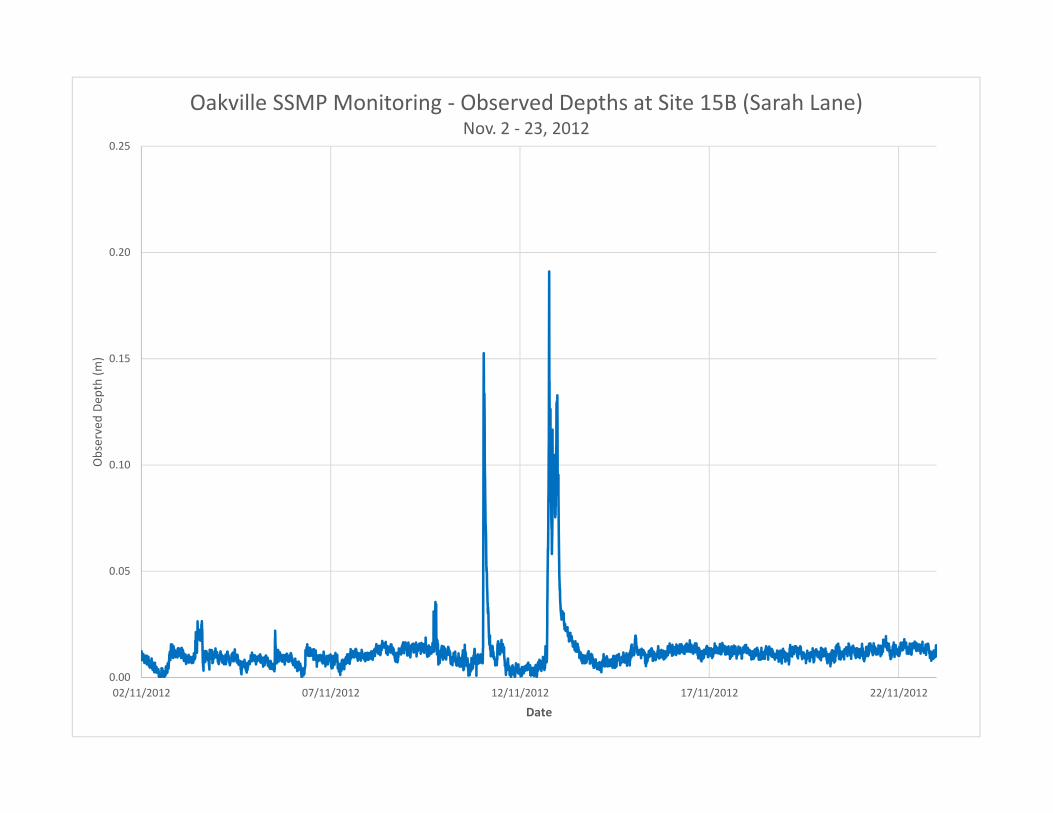
Oakville SSMP Monitoring - Observed Depths at Site 15B (Sarah Lane)Nov. 2 - 23, 2012
0.00
0.05
0.10
0.15
0.20
0.25
23/11/2012 25/11/2012 27/11/2012 29/11/2012 01/12/2012 03/12/2012 05/12/2012 07/12/2012 09/12/2012 11/12/2012
Ob
serv
ed
De
pth
(m
)
Date
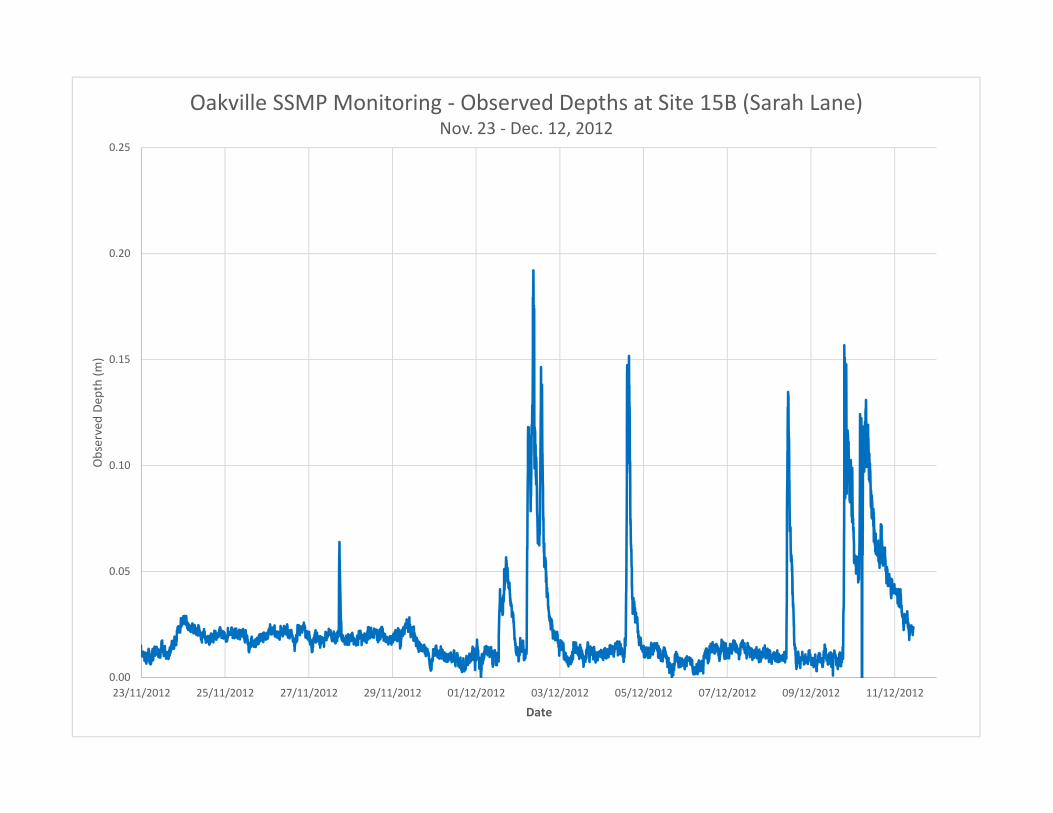
Oakville SSMP Monitoring - Observed Depths at Site 15B (Sarah Lane)Nov. 23 - Dec. 12, 2012
0.0
1.0
2.0
3.0
4.0
5.0
6.0
7.0
8.0
9.0
0.0 0.2 0.4 0.6 0.8 1.0 1.2 1.4 1.6 1.8
Flo
w (
cub
ic m
etr
es
pe
r se
con
d)
Water Level (m)
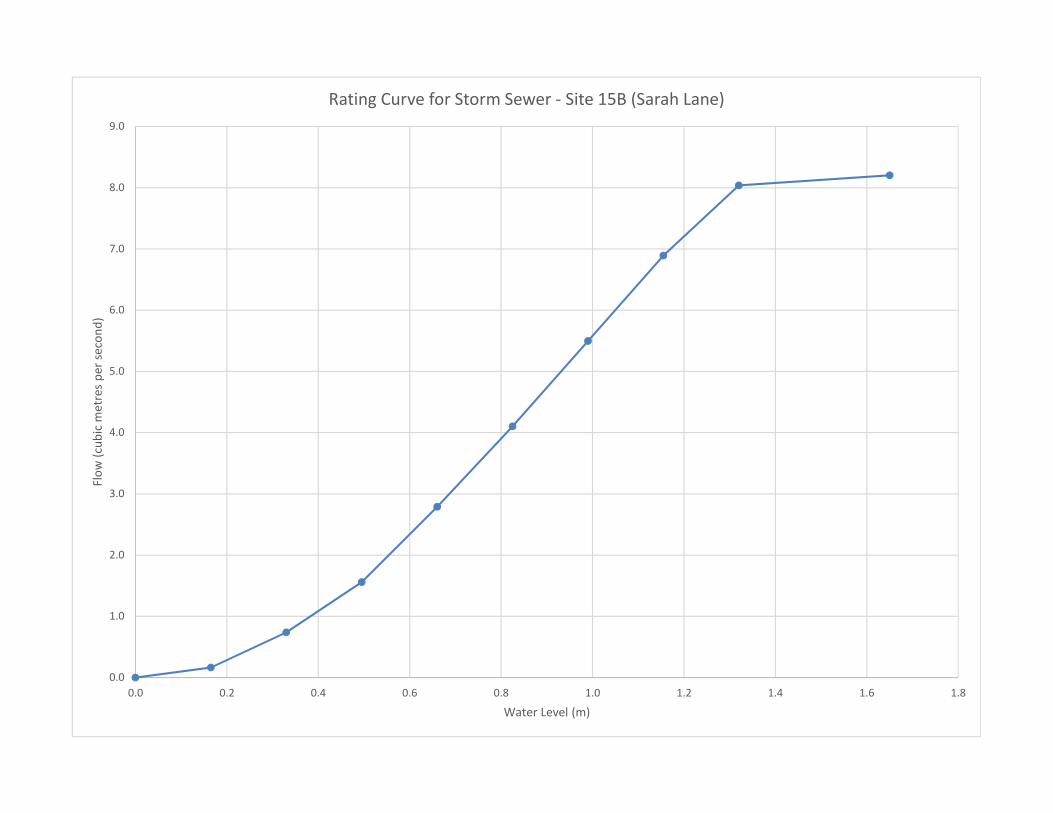
Rating Curve for Storm Sewer - Site 15B (Sarah Lane)
0.00
0.05
0.10
0.15
0.20
0.25
0.30
09/10/2012 14/10/2012 19/10/2012 24/10/2012 29/10/2012
Est
ima
ted
Flo
w (
cms)
Date
Oakville SSMP Monitoring - Estimated Flows at Site 15B (Sarah Lane)Oct. 9 - Nov. 2, 2012

0.00
0.05
0.10
0.15
0.20
0.25
0.30
02/11/2012 07/11/2012 12/11/2012 17/11/2012 22/11/2012
Est
ima
ted
Flo
w (
cms)
Date
Oakville SSMP Monitoring - Estimated Flows at Site 15B (Sarah Lane)Nov. 2- 22, 2012
0.00
0.05
0.10
0.15
0.20
0.25
0.30
22/11/2012 24/11/2012 26/11/2012 28/11/2012 30/11/2012 02/12/2012 04/12/2012 06/12/2012 08/12/2012 10/12/2012 12/12/2012
Est
ima
ted
Flo
w (
cms)
Date
Oakville SSMP Monitoring - Estimated Flows at Site 15B (Sarah Lane)Nov. 22 - Dec. 12, 2012
0.00
0.05
0.10
0.15
0.20
0.25
0.30
11/10/2012 16/10/2012 21/10/2012 26/10/2012 31/10/2012
Ob
serv
ed
De
pth
(m
)
Date
Oakville SSMP Monitoring - Observed Depths at Site 27A (Patricia Drive)Oct. 10 - Nov. 3, 2012
0.00
0.05
0.10
0.15
0.20
0.25
0.30
03/11/2012 05/11/2012 07/11/2012 09/11/2012 11/11/2012 13/11/2012 15/11/2012 17/11/2012 19/11/2012 21/11/2012
Ob
serv
ed
De
pth
(m
)
Date
Oakville SSMP Monitoring - Observed Depths at Site 27A (Patricia Drive)Nov. 3 - 21, 2012
0.00
0.05
0.10
0.15
0.20
0.25
0.30
21/11/2012 26/11/2012 01/12/2012 06/12/2012 11/12/2012
Ob
serv
ed
De
pth
(m
)
Date
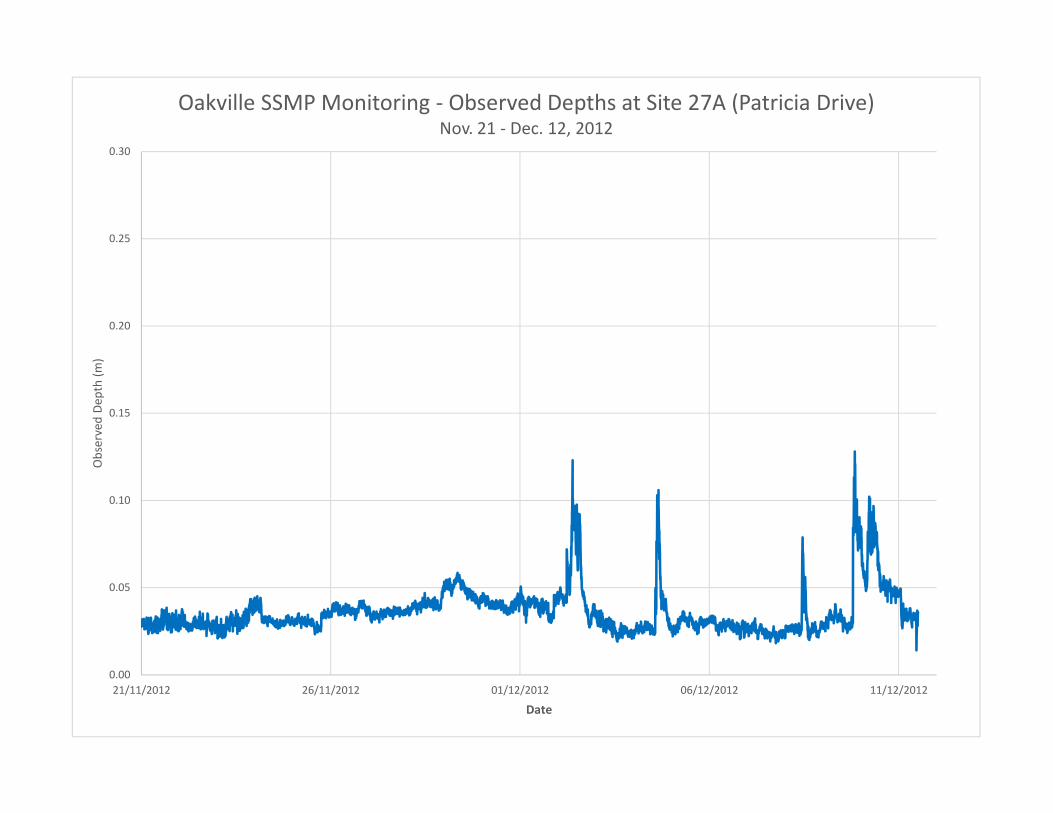
Oakville SSMP Monitoring - Observed Depths at Site 27A (Patricia Drive)Nov. 21 - Dec. 12, 2012
0.0
1.0
2.0
3.0
4.0
5.0
6.0
7.0
8.0
9.0
0.0 0.2 0.4 0.6 0.8 1.0 1.2 1.4 1.6 1.8 2.0
Flo
w (
cub
ic m
etr
es
pe
r se
con
d)
Water Level (m)
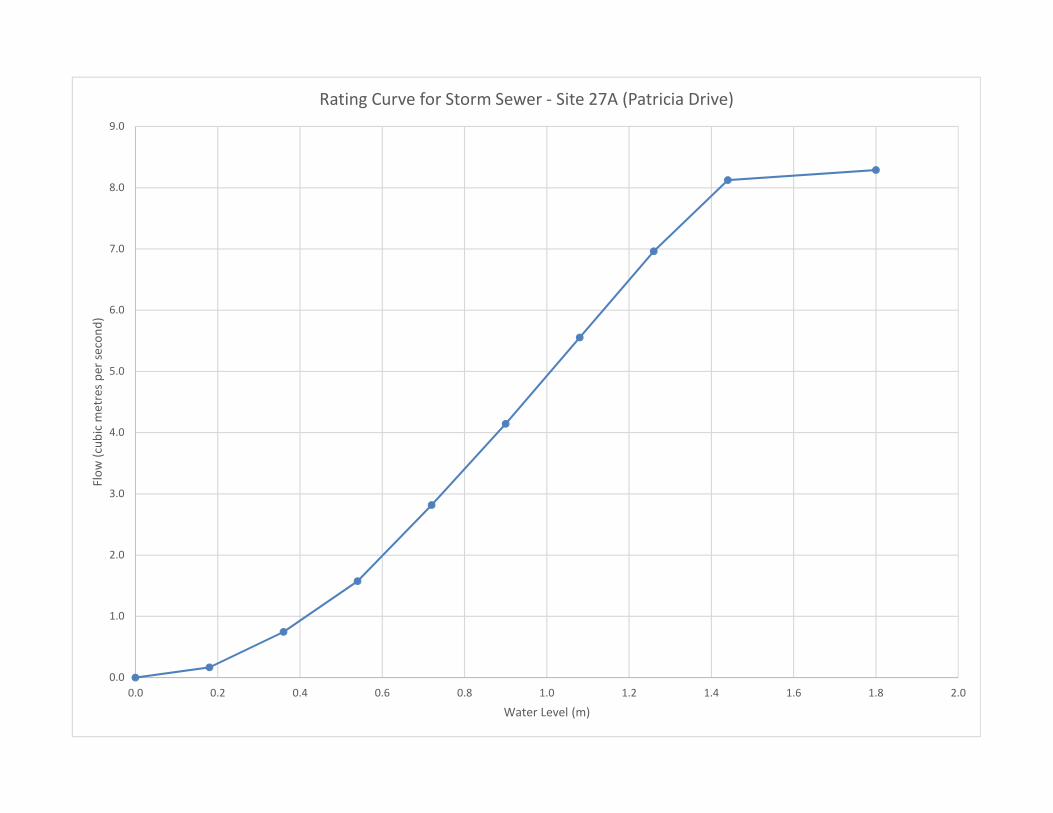
Rating Curve for Storm Sewer - Site 27A (Patricia Drive)
0.00
0.05
0.10
0.15
0.20
0.25
0.30
0.35
0.40
0.45
0.50
11/10/2012 16/10/2012 21/10/2012 26/10/2012 31/10/2012
Est
ima
ted
Flo
w (
cms)
Date
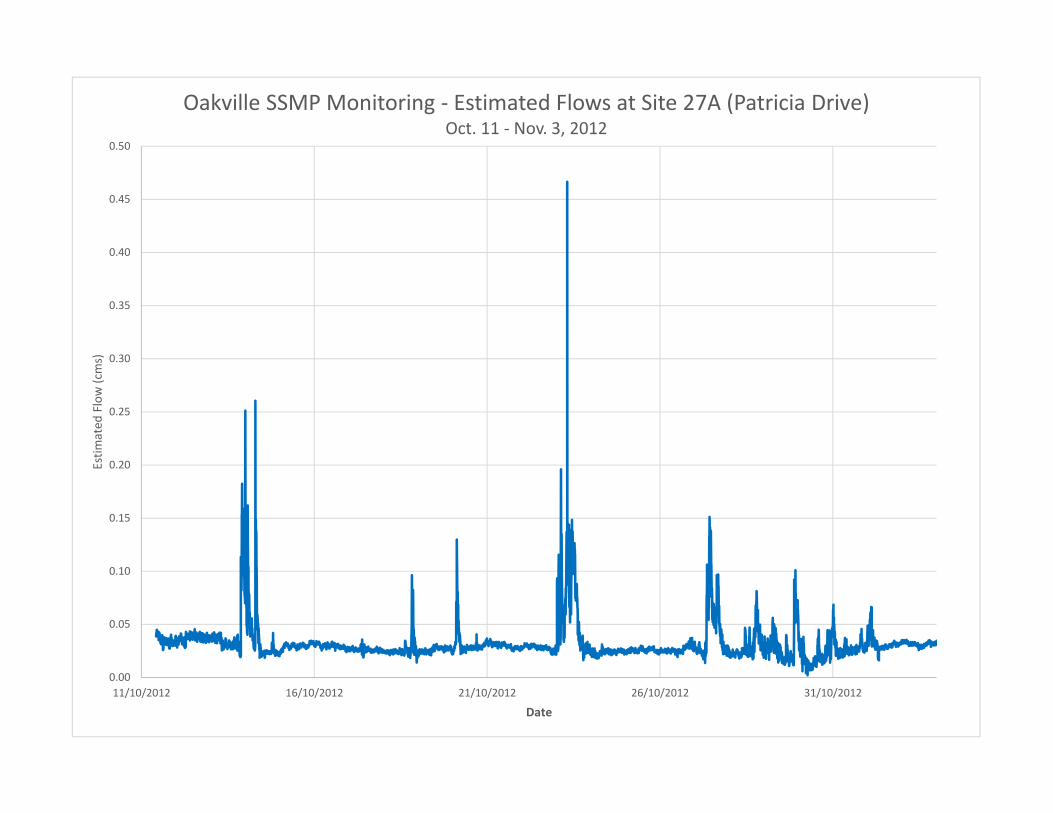
Oakville SSMP Monitoring - Estimated Flows at Site 27A (Patricia Drive)Oct. 11 - Nov. 3, 2012
0.00
0.05
0.10
0.15
0.20
0.25
0.30
0.35
0.40
0.45
0.50
03/11/2012 05/11/2012 07/11/2012 09/11/2012 11/11/2012 13/11/2012 15/11/2012 17/11/2012 19/11/2012 21/11/2012 23/11/2012
Est
ima
ted
Flo
w (
cms)
Date
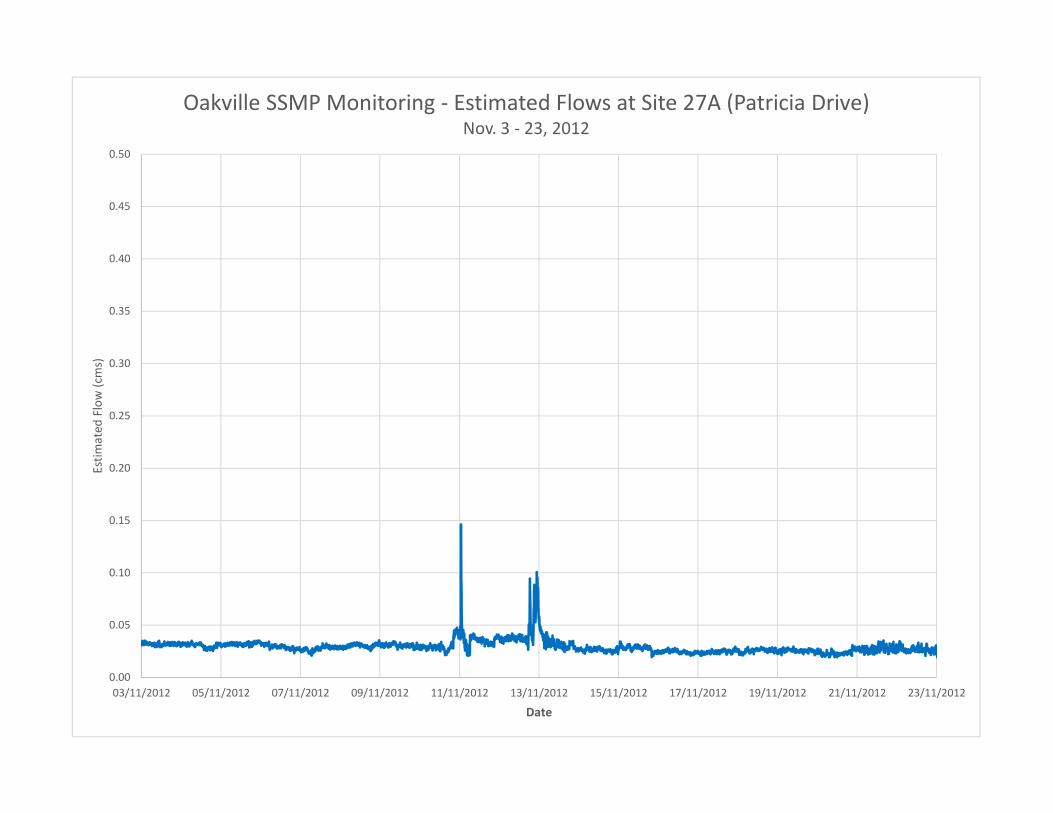
Oakville SSMP Monitoring - Estimated Flows at Site 27A (Patricia Drive)Nov. 3 - 23, 2012

0.00
0.05
0.10
0.15
0.20
0.25
0.30
0.35
0.40
0.45
0.50
23/11/2012 25/11/2012 27/11/2012 29/11/2012 01/12/2012 03/12/2012 05/12/2012 07/12/2012 09/12/2012 11/12/2012
Est
ima
ted
Flo
w (
cms)
Date
Oakville SSMP Monitoring - Estimated Flows at Site 27A (Patricia Drive)Nov. 23 - Dec. 11, 2012
0.00
0.01
0.02
0.03
0.04
0.05
0.06
0.07
0.08
0.09
11/10/2012 16/10/2012 21/10/2012 26/10/2012 31/10/2012
Ob
serv
ed
De
pth
(m
)
Date
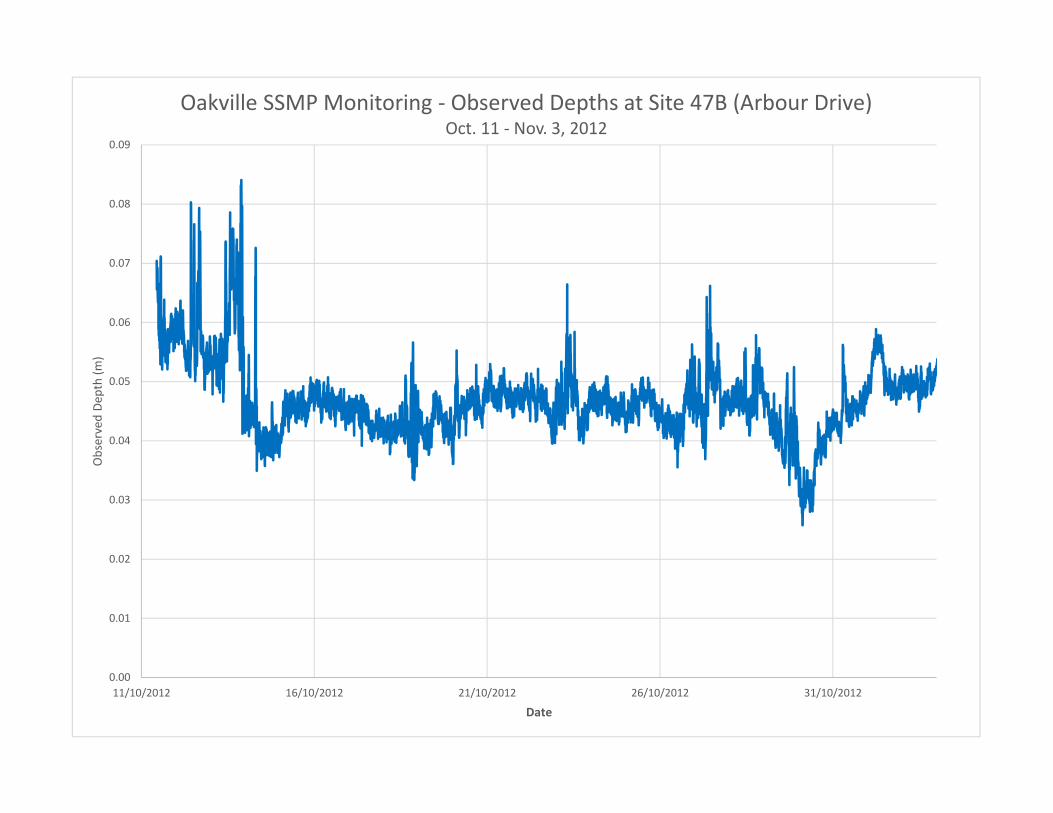
Oakville SSMP Monitoring - Observed Depths at Site 47B (Arbour Drive)Oct. 11 - Nov. 3, 2012
0.00
0.01
0.02
0.03
0.04
0.05
0.06
0.07
0.08
0.09
03/11/2012 05/11/2012 07/11/2012 09/11/2012 11/11/2012 13/11/2012 15/11/2012 17/11/2012 19/11/2012
Ob
serv
ed
De
pth
(m
)
Date
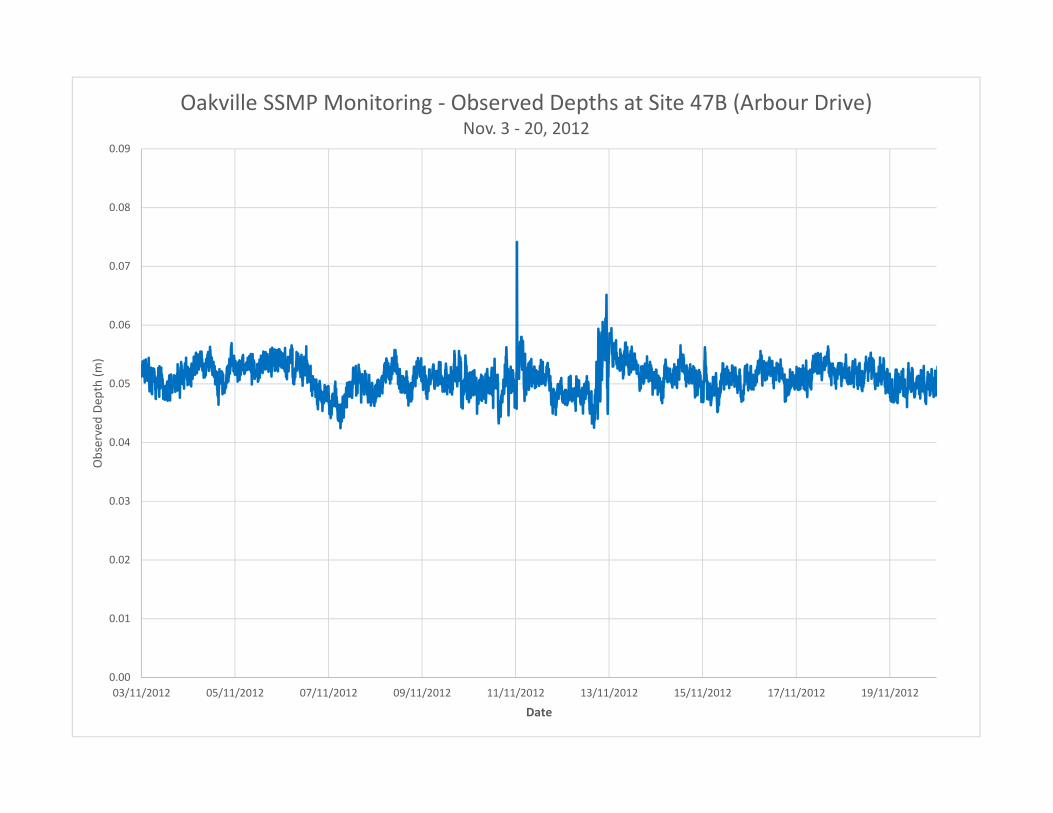
Oakville SSMP Monitoring - Observed Depths at Site 47B (Arbour Drive)Nov. 3 - 20, 2012

0.00
0.01
0.02
0.03
0.04
0.05
0.06
0.07
0.08
0.09
20/11/2012 25/11/2012 30/11/2012 05/12/2012 10/12/2012
Ob
serv
ed
De
pth
(m
)
Date
Oakville SSMP Monitoring - Observed Depths at Site 47B (Arbour Drive)Nov. 20 - Dec. 12, 2012
0.0
0.5
1.0
1.5
2.0
2.5
3.0
3.5
4.0
4.5
5.0
0.0 0.2 0.4 0.6 0.8 1.0 1.2 1.4 1.6
Flo
w (
cub
ic m
etr
es
pe
r se
con
d)
Water Level (m)
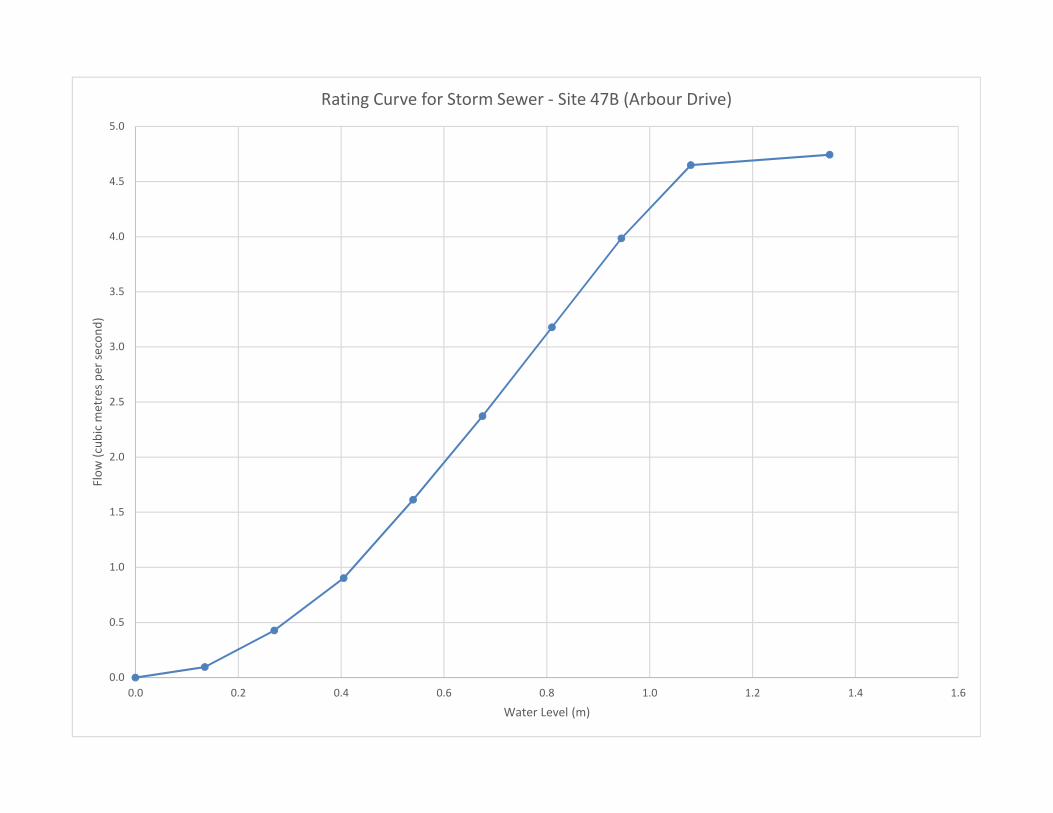
Rating Curve for Storm Sewer - Site 47B (Arbour Drive)
0.00
0.01
0.02
0.03
0.04
0.05
0.06
0.07
11/10/2012 16/10/2012 21/10/2012 26/10/2012 31/10/2012
Est
ima
ted
Flo
w (
cms)
Date
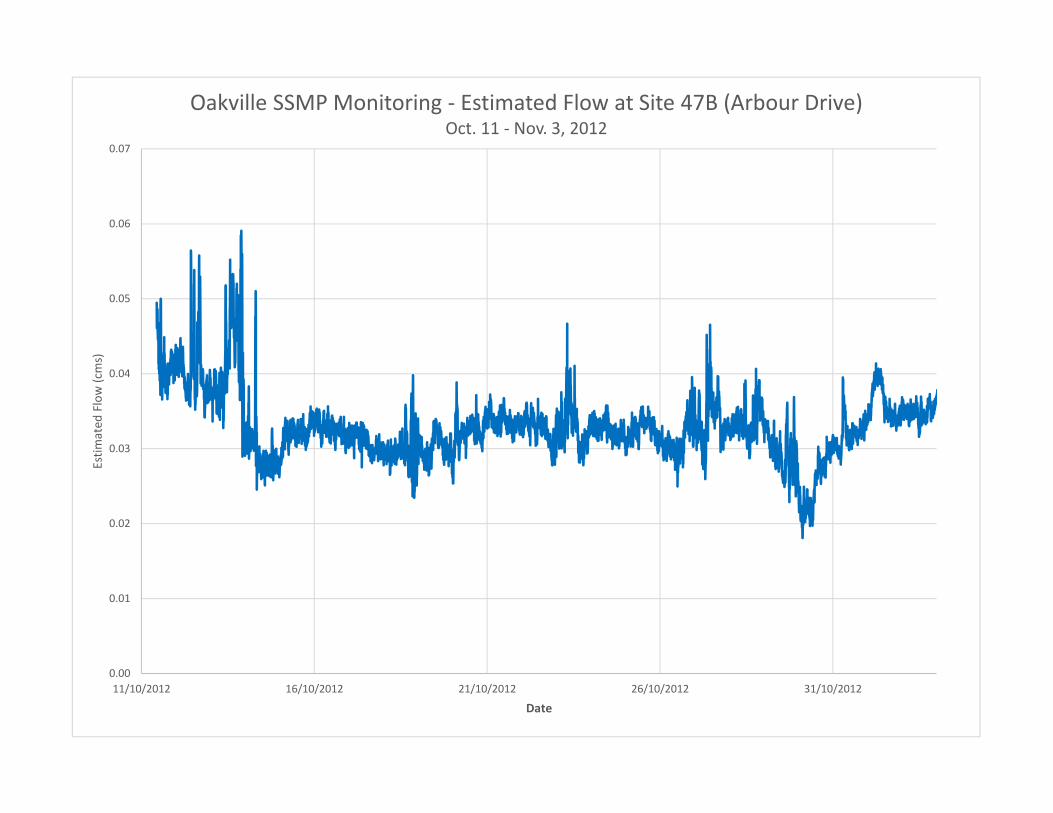
Oakville SSMP Monitoring - Estimated Flow at Site 47B (Arbour Drive)Oct. 11 - Nov. 3, 2012
0.00
0.01
0.02
0.03
0.04
0.05
0.06
0.07
03/11/2012 05/11/2012 07/11/2012 09/11/2012 11/11/2012 13/11/2012 15/11/2012 17/11/2012 19/11/2012 21/11/2012
Est
ima
ted
Flo
w (
cms)
Date
Oakville SSMP Monitoring - Estimated Flow at Site 47B (Arbour Drive)Nov. 3 - 20, 2012
0.00
0.01
0.02
0.03
0.04
0.05
0.06
0.07
21/11/2012 26/11/2012 01/12/2012 06/12/2012 11/12/2012
Est
ima
ted
Flo
w (
cms)
Date
Oakville SSMP Monitoring - Estimated Flow at Site 47B (Arbour Drive)Nov. 20 - Dec. 12, 2012

APPENDIX H
Cost Estimate

Cost Estimates Capital Works, Maintenance Practices and Monitoring of Storm Sewer Pipes
Network
5 Year Cost 10 Year Cost
Replacement Based on Structural
Condition Maintenance Monitoring
Replacement Based on Structural
Condition Maintenance Monitoring
1 $37,806 $0 $10,656 $114,954 $0 $10,440
2 $0 $0 $7,110 $165,100 $0 $6,798
3 $0 $6,998 $11,169 $0 $3,580 $11,298
4 $0 $0 $21,798 $130,008 $0 $21,513
5 $0 $0 $7,203 $0 $12,508 $6,792
6 $0 $0 $2,013 $16,760 $2,309 $1,791
7 $0 $2,784 $3,168 $0 $11,767 $2,904
8 $13,241 $14,369 $13,887 $45,252 $15,696 $13,506
9 $0 $5,875 $10,290 $0 $6,201 $10,272
10 $0 $2,988 $153 $0 $0 $285
11 $0 $1,494 $3,807 $0 $0 $3,873
12 $0 $0 $1,170 $0 $0 $1,170
13 $0 $27,687 $23,859 $9,936 $153,374 $23,190
14 $12,989 $47,802 $46,791 $297,249 $151,182 $46,698
15 $84,638 $36,557 $26,580 $83,128 $28,368 $26,802
16 $0 $0 $1,047 $0 $0 $1,047
17 $0 $0 $4,185 $72,147 $0 $3,816
18 $18,673 $11,511 $13,461 $44,709 $10,764 $13,332
19 $0 $21,908 $6,063 $54,320 $5,746 $5,607
20 $29,245 $2,716 $18,579 $403,496 $245,684 $17,184
21 $0 $0 $4,674 $46,913 $0 $4,452
22 $0 $0 $1,515 $0 $0 $1,515
23 $0 $0 $5,649 $0 $0 $5,649
24 $0 $7,877 $8,976 $305,731 $16,608 $8,601
25 $0 $12,934 $8,721 $0 $14,685 $8,727
26 $0 $4,142 $4,080 $0 $37,787 $3,801
27 $140,875 $28,207 $25,995 $1,683,680 $12,313 $24,369
28 $0 $0 $5,433 $0 $25,197 $4,632
29 $20,310 $3,974 $5,694 $29,876 $6,029 $5,466
30 $52,272 $0 $19,389 $129,019 $9,600 $18,879

Cost Estimates Capital Works, Maintenance Practices and Monitoring of Storm Sewer Pipes
Network
5 Year Cost 10 Year Cost
Replacement Based on Structural
Condition Maintenance Monitoring
Replacement Based on Structural
Condition Maintenance Monitoring
31 $0 $0 $4,002 $36,034 $4,604 $3,642
32 $0 $0 $4,653 $218,588 $33,668 $4,191
33 $0 $6,966 $10,617 $34,024 $13,663 $10,122
34 $0 $41,914 $15,900 $30,216 $0 $16,272
35 $3,395 $8,895 $14,307 $7,469 $11,907 $14,166
36 $0 $5,435 $16,467 $32,253 $59,976 $15,135
37 $0 $10,340 $12,258 $31,006 $37,089 $12,219
38 $0 $2,241 $6,474 $15,084 $5,098 $6,288
39 $0 $24,500 $10,536 $10,879 $42,223 $9,735
40 $0 $0 $4,338 $0 $3,327 $4,191
41 $0 $3,658 $5,085 $26,481 $4,228 $4,809
42 $0 $4,616 $6,198 $0 $0 $6,345
43 $0 $0 $4,683 $0 $0 $4,683
44 $0 $8,971 $11,940 $25,249 $28,563 $11,628
45 $107,952 $11,984 $11,256 $0 $0 $12,042
46 $1,004,402 $0 $24,237 $768,490 $107,622 $22,569
47 $0 $6,383 $23,382 $248,544 $213,942 $20,919
48 $0 $2,377 $9,558 $0 $3,802 $9,495
49 $0 $46,350 $17,220 $0 $121,832 $17,994
50 $0 $0 $11,838 $37,291 $34,797 $11,007
51 $0 $28,279 $5,514 $0 $8,846 $6,348
52 $0 $25,229 $69,414 $104,035 $83,658 $68,625
53 $71,438 $23,001 $24,243 $235,513 $12,905 $23,280
54 $0 $6,566 $38,007 $161,007 $29,788 $37,062
55 $103,422 $6,111 $16,920 $449,781 $3,944 $14,358
56 $0 $91,207 $38,907 $182,821 $10,605 $39,309
Grand Total
$1,700,656 $604,845 $741,069 $6,287,038 $1,645,486 $720,843