appendix a mining industry profile - us epa a mining industry profile. ... the extraction and...
TRANSCRIPT

APPENDIX A
MINING INDUSTRY PROFILE
MINING INDUSTRY PROFILE
September 1997
TABLE OF CONTENTS
1. Overview . . . . . . . . . . . . . . . . . . . . . . . . . . . . . . . . . . . . . . . . . . . . . . . . . . . . . . . . . . . . . . . . . . A-1
2. Location of Mining Activities . . . . . . . . . . . . . . . . . . . . . . . . . . . . . . . . . . . . . . . . . . . . . . . . . . . A-4
3. Mining Practices and Products . . . . . . . . . . . . . . . . . . . . . . . . . . . . . . . . . . . . . . . . . . . . . . . . . A-10
4. Mining and the Economy . . . . . . . . . . . . . . . . . . . . . . . . . . . . . . . . . . . . . . . . . . . . . . . . . . . . . A-17
5. Inactive and Abandoned Mines . . . . . . . . . . . . . . . . . . . . . . . . . . . . . . . . . . . . . . . . . . . . . . . . . A-20
6. Trends . . . . . . . . . . . . . . . . . . . . . . . . . . . . . . . . . . . . . . . . . . . . . . . . . . . . . . . . . . . . . . . . . . . A-21
7. References . . . . . . . . . . . . . . . . . . . . . . . . . . . . . . . . . . . . . . . . . . . . . . . . . . . . . . . . . . . . . . . . A-23
MINING INDUSTRY PROFILE
September1997 A - 1
1. OVERVIEW
This overview provides summary information on 11 commodities (10 non-fuel and uranium) that are
produced from the most important metalliferous and fertilizer ores in the United States. The combined
value of these minerals (copper, gold, iron ore, lead, molybdenum, phosphate rock, platinum, potash, silver,
uranium, and zinc) was $12.15 billion in 1993, accounting for less than 1 percent of gross national product
(GNP) (U.S. Department of Commerce, 1994).
This appendix is intended to provide an overview of mining activities and the mining industry, not a
comprehensive examination. It is necessarily simplistic, but should give a snapshot of the industry as it
existed in 1992. This framework recognizes the dynamic nature of this vital industry and the market,
technological, and other factors that drive its performance, environmental and otherwise.
These metals and minerals are the primary raw materials used in many industrial applications and
thus are essential to the American and world economies. Copper, for example, is essential to the
electronics and construction industries, while iron ore provides the base material for the steel, automotive,
and transportation industries. Molybdenum is used in steel production, machinery, electrical and chemical
manufacturing. Potash and phosphate rock are used in fertilizers and chemical manufacturing. Gold, while
primarily used in jewelry and the decorative arts, is also used in the electronics industry and dentistry.
Table 1 provides a more detailed list of the consumptive uses for these minerals.
The minerals industry also contributes to the national economy by virtue of its production of exports
and its reduction of industrial dependence on certain minerals that the United States would otherwise
import. For example, the U.S. exports 8% of the lead and 75% of the molybdenum it produces.
Conversely, the U.S. imports 22% of the iron ore it consumes (Bureau of Mines, 1995). See Table 2 for
detailed national production data (including import and export information) for these minerals.
The extraction and beneficiation of these minerals necessarily lead to the generation of large quantities
of waste. Total waste (waste rock and tailings) produced during the extraction and beneficiation of
minerals can range from 10% of the total material removed from the earth (potash) to more than 99.99%
(gold). As for total amounts of waste generated in 1992, the gold mining industry generated about
540,661,000 metric tons and the copper mining industry generated 731,065,000 metric tons; potash, on the
other hand, generated 197,000 metric tons (Bureau of Mines, 1992a). To put these quantities in
perspective, about 200,000,000 metric tons of municipal solid waste are generated in the United States
each year.

MINING INDUSTRY PROFILE
September1997 A - 2
TA
BL
E 1
. N
umbe
r of
Min
es, T
otal
Pro
duct
ion
and
Use
s of
Com
mod
itie
s of
Con
cern
, 199
2
Com
mod
ity
Num
ber
of m
ines
1M
ajor
use
sT
otal
U.S
. min
epr
oduc
tion
(m
etri
c to
ns)
Pro
duct
ion
as %
of c
onsu
mpt
ion
Cop
per
50B
uild
ing
cons
truc
tion,
ele
ctri
cal a
nd e
lect
roni
c pr
oduc
ts, I
ndus
tria
lm
achi
nery
and
equ
ipm
ent,
tran
spor
tatio
n eq
uipm
ent,
and
cons
umer
and
gene
ral p
rodu
cts
1,76
5,00
075
%
Gol
d21
2+2
Jew
elry
and
art
s, in
dust
rial
(m
ainl
y el
ectr
onic
), d
enta
l32
930
0%
Iron
Ore
22St
eel
55,5
93,0
0074
%
Lea
d23
Tra
nspo
rtat
ion
(bat
teri
es, f
uel t
anks
, sol
der,
sea
ls, a
nd b
eari
ngs)
;el
ectr
ical
, ele
ctro
nic,
and
com
mun
icat
ions
use
s39
8,00
032
%
Mol
ybde
num
10Ir
on a
nd s
teel
pro
duct
ion,
mac
hine
ry, e
lect
rica
l, tr
ansp
orta
tion,
chem
ical
s, a
nd o
il an
d ga
s in
dust
ry u
ses
49,0
0028
7%
Phos
phat
e R
ock
16W
et-p
roce
ss p
hosp
hori
c ac
id, f
ertil
izer
s46
,965
,000
109%
Plat
inum
gro
upm
etal
s1
Aut
omot
ive,
ele
ctri
cal a
nd e
lect
roni
c, c
hem
ical
, den
tal,
med
ical
8,30
012
%
Pota
sh12
Fert
ilize
rs, c
hem
ical
man
ufac
turi
ng1,
705,
000
32%
Silv
er15
0Ph
otog
raph
ic p
rodu
cts,
ele
ctri
cal a
nd e
lect
roni
c, e
lect
ropl
ated
war
e, s
terl
ingw
are,
and
jew
elry
1,80
0N
A
Ura
nium
17E
nerg
y (f
uel r
ods)
522
NA
Zin
c25
3C
hem
ical
, agr
icul
tura
l, ru
bber
, and
pai
nt in
dust
ries
524,
000
41%
NO
TE
S: 1D
ue to
the
natu
re o
f th
e m
inin
g in
dust
ry, t
he e
xact
num
ber
of m
ines
is d
iffi
cult
to d
isce
rn.
For
inst
ance
, sev
eral
of
the
com
mod
ities
are
pro
duce
das
co-
prod
ucts
or
by-p
rodu
cts
from
oth
er c
omm
odity
min
ing
oper
atio
ns (
e.g.
, gol
d as
a r
esul
t of
copp
er p
rodu
ctio
n).
The
refo
re, t
he n
umbe
r of
min
es f
or in
divi
dual
com
mod
ities
incl
udes
bot
h ac
tual
com
mod
ity m
ines
and
thos
e m
ines
fro
m w
hich
the
com
mod
ity is
a c
o-pr
oduc
t or
by-
prod
uct.
The
se u
ncer
tain
ties
resu
lt in
inco
nsis
tent
num
bers
thro
ugho
ut th
e B
OM
sou
rces
.2
Thi
s in
clud
es 2
00 lo
de m
ines
and
12
larg
e pl
acer
min
es.
It d
oes
not i
nclu
de th
e hu
ndre
ds o
f sm
all p
lace
r m
ines
thro
ugho
ut th
e w
est.
3
Acc
ount
for
99%
of
prod
uctio
n.
Sour
ces:
U
.S. B
urea
u of
Min
es.
Min
eral
Com
mod
ity S
umm
arie
s 19
94.
U.S
. Bur
eau
of M
ines
. M
iner
als
Year
book
, Vol
ume
I: M
etal
s an
d M
iner
als.
199
2U
.S. B
urea
u of
Min
es.
Min
eral
s Ye
arbo
ok, V
olum
e II
: A
rea
Rep
orts
: D
omes
tic.
1992
.
MINING INDUSTRY PROFILE
September1997 A - 3
TA
BL
E 2
. N
atio
nal M
inin
g an
d B
enef
icia
tion
Dat
a (b
y C
omm
odit
y), 1
992
Com
mod
ity
Num
ber
of M
ines
1
Val
ue o
fC
omm
odit
yP
rodu
ced
($1,
000,
000)
Tot
alC
omm
odit
yP
rodu
ced
(1,0
00 m
t)
Tai
lings
Gen
erat
ed2
(1,0
00 m
t)
Oth
erW
aste
Han
dled
(1,0
00 m
t)
Num
ber
ofE
mpl
oyee
s
% o
f G
DP
3
(Val
ue o
fC
omm
odit
yP
rodu
ced/
GD
P)
Con
sum
ptio
n (1
,000
mt)
Exp
orts
(% o
f T
otal
Pro
duce
d)4
Impo
rts
(% o
f T
otal
Pro
duce
d)5
Cop
per
504,
200
1,76
533
7,73
339
3,33
213
,600
.07%
679
(38%
)59
3 (3
4%)
Gol
d21
2+6
3,70
0.3
2924
7,53
229
3,12
814
,700
.06%
0.36
9 (1
12%
)0.
174
(53%
)
Iron
Ore
221,
700
55,5
9380
,204
106,
233
8,00
0.0
04%
5,00
3 (9
%)
12,2
30 (
22%
)
Lea
d23
308
398
6,36
1W
1,70
0.0
05%
72 (
18%
)5
(1%
)
Mol
ybde
num
1019
049
<3,
9267
<6,
7517
750
.003
%36
(73
%)
3 (6
%)
Phos
phat
e ro
ck16
1,10
046
,965
104,
831
-5,
600
.02%
3,72
3 (8
%)
1,53
0 (3
%)
Plat
inum
gro
upm
etal
s 1
388.
3<
3,92
67<
6,75
1750
0.0
01%
57.8
(69
6%)
132
(1,5
88%
)
Pota
sh12
325
1,70
519
7-
1,00
4.0
05%
663
(39%
)4,
227
(248
%)
Silv
er15
022
91.
82,
822.
2W
1,60
0.0
04%
1.7
(97%
)4.
9 (2
77%
)
Ura
nium
1712
.2.5
22N
AN
A68
2 (p
erso
nye
ars)
.000
2%N
AN
A
Zin
c25
867
352
44,
227
W2,
300
.01%
388
(74%
)45
(9%
)
NO
TE
S: 1D
ue to
the
natu
re o
f th
e m
inin
g in
dust
ry, t
he e
xact
num
ber
of m
ines
is d
iffi
cult
to d
isce
rn.
For
inst
ance
, sev
eral
of
the
com
mod
ities
are
pro
duce
d as
co-
prod
ucts
or
by-p
rodu
cts
from
oth
er c
omm
odity
min
ing
oper
atio
ns (
e.g.
, gol
d as
a r
esul
t of
copp
er p
rodu
ctio
n).
The
refo
re, t
he n
umbe
r of
min
es f
or in
divi
dual
com
mod
ities
incl
udes
bot
h ac
tual
com
mod
itym
ines
and
thos
e m
ines
fro
m w
hich
the
com
mod
ity is
a c
o-pr
oduc
t or
by-p
rodu
ct.
The
se u
ncer
tain
ties
resu
lt in
inco
nsis
tent
num
bers
thro
ugho
ut th
e B
OM
sou
rces
.2
Tai
lings
gen
erat
ed =
tota
l cru
de o
re h
andl
ed -
tota
l com
mod
ity p
rodu
ced.
319
92 G
ross
Dom
estic
Pro
duct
(G
DP)
was
$6,
020.
2 bi
llion
.4
Exp
orts
may
incl
ude
nonf
uel m
iner
als
from
U.S
. Gov
ernm
ent s
tock
pile
s.5
Impo
rts
may
incl
ude
nonf
uel m
iner
als
impo
rted
for
pro
cess
ing.
6T
his
incl
udes
abo
ut 2
00 lo
de m
ines
and
abo
ut 1
2 la
rge
plac
er m
ines
. It
doe
s no
t inc
lude
the
hund
reds
of
smal
l pla
cer
min
es th
roug
hout
the
wes
t.
7In
clud
es b
auxi
te, b
eryl
lium
, mol
ybde
num
, nic
kel,
plat
inum
gro
up m
etal
s, a
nd r
are-
eart
h co
ncen
trat
es.
8A
ccou
nt f
or 9
9% o
f pr
oduc
tion.
WIn
form
atio
n w
ithhe
ld b
y th
e B
urea
u of
Min
es f
or p
ropr
ieta
ry r
easo
ns.
NA
Info
rmat
ion
not a
vaila
ble.
SOU
RC
ES:
U.S
. Bur
eau
of M
ines
. Min
eral
Com
mod
ity S
umm
arie
s 19
94U
.S. B
urea
u of
Min
es. M
iner
als
Year
book
, Vol
ume
I: M
etal
s an
d M
iner
als.
199
2a.
See
Tab
le 4
for
sou
rces
of
data
in C
omm
odity
Pro
duce
d, T
ailin
gs G
ener
ated
, and
Oth
erW
aste
Gen
erat
ed c
olum
ns.
MINING INDUSTRY PROFILE
September1997 A - 4
2. LOCATION OF MINING ACTIVITIES
Tables 3 and 3a show the distribution of hardrock mining activities in the United States (1992 Bureau
of Mines data for number of mines and state-by-state production for each commodity). The following
discussion briefly summarizes location information for each sector. The information presented below
focuses on primary production. However, significant volumes of some minerals are produced as
byproducts (e.g., molybdenum as a byproduct of copper flotation). For the purposes of this discussion,
primary production refers to the major mineral extracted at the mine. Byproducts are the ancillary minerals
that are found in and recovered from the same ore as the primary mineral, although the presence of that
byproduct is not the primary target.
Copper. As shown in Tables 3 and 3a, southern and central Arizona copper mines produce nearly
two-thirds of U.S. copper. Among other primary copper producers, several large copper mines are located
in New Mexico near the Arizona border (close to smelter facilities) and one of the largest copper mines in
the country, Kennecott Utah Copper, is located near Salt Lake City. An additional medium-size
underground mine, Copper Range’s White Pine facility, is near Lake Superior on the Upper Peninsula of
Michigan. The copper mines in other states identified in Table 3 either are small operations or represent
limited byproduct production at gold, molybdenum, and other mines (Bureau of Mines, 1992a, 1992b, and
1995; EPA, 1994a).
Gold. With the widespread application of heap leaching technology, most of the U.S. gold production
now occurs in Nevada. Nevada mines account for more than 60 percent of the total production, with most
mines located along the Carlin Trend in northwestern Nevada. Most other gold mining operations are
located throughout the western United States, including Alaska, although four gold mines are located in
South Carolina (Bureau of Mines, 1992a; 1992b; EPA, 1994c).
Iron. Nearly all of the iron mined in the United States is produced from taconite ore found in
Northern Minnesota and Michigan. The largest mining operations (all open pits) are found along the
Mesabi Range in Minnesota, which extends from Hibbing to north of Duluth (Bureau of Mines, 1992a;
1992b; EPA, 1994f).
Lead/Zinc. The Viburnum area of southeastern Missouri is the center of U.S. lead production. The
lead mines in this area also produce significant quantities of zinc (as a byproduct from smelter operations).
Alaska is the largest zinc producer in the United States (with associated lead byproducts) at the Red Dog
and Greens Creek Mines (the Red Dog Mine is the primary producer). Central Tennessee and northern
New York State are also major sources of zinc ore (Bureau of Mines, 1992a; 1992b; EPA, 1994g).

MINING INDUSTRY PROFILE
September1997 A - 5
TA
BL
E 3
. L
ocat
ion
of M
inin
g A
ctiv
itie
s, 1
992
Stat
e
Cop
per
Gol
dIr
on O
reL
ead
Pho
spha
te R
ock
#m
ines
1%
U.S
.P
rodu
ctio
n#
min
es1
% U
.S.
Pro
duct
ion
#m
ines
1%
U.S
.P
rodu
ctio
n#
min
es1
% U
.S.
Pro
duct
ion
#m
ines
1%
U.S
.P
rodu
ctio
n
Uni
ted
Stat
es50
1,76
5,00
0m
etri
c to
ns21
2+3
329
met
ric
tons
2255
,593
,000
met
ric
tons
2330
8,00
0m
etri
c to
ns16
46,9
65,0
00m
etri
c to
ns
Ala
ska
131.
5%2
15.6
%
Ari
zona
1665
.3%
142.
1%1
W
Cal
ifor
nia
1910
%N
AW
Col
orad
o22
W7
1.2%
2W
Flor
ida
968
.6%
Idah
o32
W11
1%1
W7
11.1
%
Illin
ois
1W
Mic
higa
n3
W2
23.2
%
Min
neso
ta7
76.2
%
Mis
sour
i2
0.6%
NA
0.03
%7
75.6
%
Mon
tana
3W
94.
3%1
W2
W1
NA
Nev
ada
1W
6161
.7%
New
Mex
ico
712
%5
W2
W
New
Yor
k2
Nor
th C
arol
ina
1W
Ore
gon
10.
01%
2W
Sout
h C
arol
ina
42.
1%
Sout
h D
akot
a5
5.8%
1W
Ten
ness
ee2
W
Tex
as2
W
(con
tinue
d)

MINING INDUSTRY PROFILE
September1997 A - 6
TA
BL
E 3
. L
ocat
ion
of M
inin
g A
ctiv
itie
s, 1
992
(con
tinu
ed)
Stat
e
Cop
per
Gol
dIr
on O
reL
ead
Pho
spha
te R
ock
#m
ines
1%
U.S
.P
rodu
ctio
n#
min
es1
% U
.S.
Pro
duct
ion
min
es1
% U
.S.
Pro
duct
ion
#m
ines
1%
U.S
.P
rodu
ctio
n#
min
es1
% U
.S.
Pro
duct
ion
Uni
ted
Stat
es50
1,76
5,00
0m
etri
c to
ns21
2+3
329
met
ric
tons
2255
,593
,000
met
ric
tons
2330
8,00
0m
etri
c to
ns16
46,9
65,0
00m
etri
c to
ns
Uta
h1
W2
W1
NA
Ver
mon
tN
AW
Was
hing
ton
42.
7%1
W
NO
TE
S: NA
= I
nfor
mat
ion
not a
vaila
ble.
W =
Inf
orm
atio
n w
ithhe
ld b
y th
e B
urea
u of
Min
es f
or p
ropr
ieta
ry r
easo
ns.
1D
ue to
the
natu
re o
f th
e m
inin
g in
dust
ry, t
he e
xact
num
ber
of m
ines
is d
iffi
cult
to d
isce
rn.
For
inst
ance
, sev
eral
of
the
com
mod
ities
are
pro
duce
d as
co-
prod
ucts
or
by-
prod
ucts
fro
m o
ther
com
mod
ity m
inin
g op
erat
ions
(e.
g., g
old
as a
res
ult o
f co
pper
pro
duct
ion)
. T
here
fore
, the
num
ber
of m
ines
for
indi
vidu
al c
omm
oditi
es in
clud
es b
oth
actu
al c
omm
odity
min
es a
nd th
ose
min
es f
rom
whi
ch th
e co
mm
odity
is a
co-
prod
uct o
r by
-pro
duct
. T
hese
unc
erta
intie
s re
sult
in in
cons
iste
nt n
umbe
rs th
roug
hout
the
BO
M s
ourc
es.
2A
t all
of th
ese
min
es, c
oppe
r is
pro
duce
d as
a b
ypro
duct
of
othe
r co
mm
odity
ope
ratio
ns.
3T
his
incl
udes
abo
ut 2
00 lo
de m
ines
and
abo
ut 1
2 la
rge
plac
er m
ines
. It
doe
s no
t inc
lude
the
hund
reds
of
smal
l pla
cer
min
es th
roug
hout
the
wes
t.
SOU
RC
ES:
U.S
. Bur
eau
of M
ines
. Min
eral
Com
mod
ity S
umm
arie
s 19
94.
U.S
. Bur
eau
of M
ines
. Min
eral
s Ye
arbo
ok, V
olum
e I:
Met
als
and
Min
eral
s. 1
992.
U.S
. Bur
eau
of M
ines
. Min
eral
s Ye
arbo
ok, V
olum
e II
: A
rea
Rep
orts
: D
omes
tic.
1992
.

MINING INDUSTRY PROFILE
September1997 A - 7
TA
BL
E 3
a. L
ocat
ion
of M
inin
g A
ctiv
itie
s, 1
992
Stat
e
Mol
ybde
num
Pla
tinu
m2
Pot
ash
Silv
erU
rani
umZ
inc
#m
ines
1%
U.S
.P
rodu
ctio
n#
min
es1
% U
.S.
Pro
duct
ion
#m
ines
1%
U.S
.P
rodu
ctio
n#
min
es1
% U
.S.
Pro
duct
ion
#m
ines
1%
U.S
.P
rodu
ctio
n#
min
es1
% U
.S.
Pro
duct
ion
Uni
ted
Stat
es10
349
,000
met
ric
tons
18,
300
met
ric
tons
121,
705,
000
met
ric
tons
150
1,80
0 m
etri
cto
ns17
522
met
ric
tons
2552
4,00
0m
etri
c to
ns
Ala
ska
1515
.8%
347
.5%
Ari
zona
5W
159.
2%
Cal
ifor
nia
NA
W2
W14
1%
Col
orad
o2
W4
W1
NA
Flor
ida
24N
A
Idah
o1
W12
14.1
%2
NA
Illin
ois
NA
NA
NA
NA
Mic
higa
n1
W1
NA
Min
neso
taN
A1.
8%
Mis
sour
iN
AN
A4
8.4%
Mon
tana
1W
110
0%9
10.9
%1
3.9%
Neb
rask
a2
35%
Nev
ada
134
.1%
New
Mex
ico
1W
684
%1
10%
New
Yor
k1
NA
2W
Nor
th C
arol
ina
Ore
gon
1.0
6%
(con
tinue
d)

MINING INDUSTRY PROFILE
September1997 A - 8
TA
BL
E 3
a. L
ocat
ion
of M
inin
g A
ctiv
itie
s, 1
992 (
cont
inue
d)
Stat
e
Mol
ybde
num
Pla
tinu
m2
Pot
ash
Silv
erU
rani
umZ
inc
#m
ines
1%
U.S
.P
rodu
ctio
n#
min
es1
% U
.S.
Pro
duct
ion
#m
ines
1%
U.S
.P
rodu
ctio
n#
min
es1
% U
.S.
Pro
duct
ion
#m
ines
1%
U.S
.P
rodu
ctio
n#
min
es1
% U
.S.
Pro
duct
ion
Uni
ted
Stat
es10
349
,000
met
ric
tons
18,
300
met
ric
tons
121,
705,
000
met
ric
tons
150
1,80
0 m
etri
cto
ns17
522
met
ric
tons
2552
4,00
0m
etri
c to
ns
Sout
h C
arol
ina
3N
A
Sout
h D
akot
a4
0.3%
Ten
ness
eeN
AN
A10
W
Tex
as2
NA
Uta
h1
W3
W4
W1
NA
Ver
mon
t
Was
hing
ton
4W
1N
A
Wyo
min
g2
>12
%5
NO
TE
S: NA
= I
nfor
mat
ion
not a
vaila
ble.
W =
Inf
orm
atio
n w
ithhe
ld b
y th
e B
urea
u of
Min
es f
or p
ropr
ieta
ry r
easo
ns.
1D
ue to
the
natu
re o
f th
e m
inin
g in
dust
ry, t
he e
xact
num
ber
of m
ines
is d
iffi
cult
to d
isce
rn.
For
inst
ance
, sev
eral
of
the
com
mod
ities
are
pro
duce
d as
co-
prod
ucts
or
by-p
rodu
cts
from
othe
r co
mm
odity
min
ing
oper
atio
ns (
e.g.
, gol
d as
a r
esul
t of
copp
er p
rodu
ctio
n).
The
refo
re, t
he n
umbe
r of
min
es f
or in
divi
dual
com
mod
ities
incl
udes
bot
h ac
tual
com
mod
ity m
ines
and
thos
e m
ines
fro
m w
hich
the
com
mod
ity is
a c
o-pr
oduc
t or
by-p
rodu
ct.
The
se u
ncer
tain
ties
resu
lt in
inco
nsis
tent
num
bers
thro
ugho
ut th
e B
OM
sou
rces
. 2
The
num
bers
for
pla
tinum
incl
ude
all t
he p
latin
um-g
roup
met
als.
Tho
se m
etal
s in
clud
e pl
atin
um, p
alla
dium
, rho
dium
, rut
heni
um, i
ridi
um, a
nd o
smiu
m.
3O
f th
e 10
mol
ybde
num
min
es, o
nly
thre
e ar
e in
bus
ines
s to
min
e m
olyb
denu
m.
The
oth
er s
even
pro
duce
mol
ybde
num
as
a re
sult
of o
ther
com
mod
ity o
pera
tions
. O
f th
e th
ree
true
mol
ybde
num
min
es, t
wo
are
loca
ted
in C
olor
ado
and
one
in I
daho
.4
Ura
nium
was
pro
duce
d at
thes
e tw
o si
tes
as a
byp
rodu
ct o
f ph
osph
ate
proc
essi
ng.
5O
ne o
f th
e tw
o m
ines
in th
e st
ate
repo
rted
pro
duct
ion
of 6
1 m
etri
c to
ns o
f ur
aniu
m.
Prod
uctio
n da
ta f
or th
e ot
her
min
e w
as n
ot a
vaila
ble.
SOU
RC
ES:
U.S
. Bur
eau
of M
ines
. Min
eral
Com
mod
ity S
umm
arie
s 19
94.
U.S
. Bur
eau
of M
ines
. Min
eral
s Ye
arbo
ok, V
olum
e I:
Met
als
and
Min
eral
s. 1
992.
U.S
. Bur
eau
of M
ines
. Min
eral
s Ye
arbo
ok, V
olum
e II
: A
rea
Rep
orts
: D
omes
tic.
1992
.
MINING INDUSTRY PROFILE
September1997 A - 9
Phosphate Rock. The Tampa/Bartow area of central Florida is the major phosphate rock producing
area of the United States. The recent introduction of a heavy media separation process at IMC’s Four
Corners mine has led to possibly increased phosphate recovery from types of ore that previously could not
be beneficiated (i.e., the potential for additional production in the area). Beyond the Florida operations,
TexasGulf operates a large phosphate facility along the North Carolina coast near New Bern, and smaller
phosphate mines are located in Idaho, Montana, and Utah (Bureau of Mines, 1992a; 1992b; EPA, 1994h).
Molybdenum. Recent market conditions have limited molybdenum production in the United States,
especially primary production. In 1994, Cyprus’ Henderson Mine in central Colorado was the only active
primary molybdenum operation in the country (compared with three in 1992). Byproducts represent the
remainder of U.S. production, mostly as a byproduct of copper ore flotation at mines and mills in Arizona
and Utah (Kennecott) (Bureau of Mines, 1992a and 1992b).
Platinum. Only one platinum mine is active in the United States, the Stillwater Mine operated by the
Stillwater Mining Company near Nye, Montana (Bureau of Mines, 1992a and 1992b).
Potash. New Mexico produced almost all potash produced in the United States in 1992. In the state,
five producers operated six mines, all of which mined potash in underground bedded ore zones. The other
potash-producing states (California, Michigan, and Utah) produced potash by two-well solution mining,
solar evaporation, and selective crystallization (Bureau of Mines, 1992a and 1992b).
Silver. Silver is mined primarily in the Western United States both through primary and byproduct
production. Primary silver production generally occurs in Montana, Idaho, and Nevada. Silver is also
recovered as a byproduct from copper, lead/zinc, and gold production. In Alaska, silver is a significant
byproduct at the Green Creek and Red Dog Mines. In Nevada, much of the total silver production is
derived as a byproduct of the state’s extensive gold mining industry (Bureau of Mines, 1992a and 1992b;
EPA, 1994 and 1994c).
Uranium. The total amount of uranium produced in 1992 (522 metric tons) was more than 70
percent less than the quantity produced in 1991 and the lowest amount produced since 1951. The
decreased demand for uranium (and the resulting decrease in price) shut down several mines and put others
on standby. According to the Bureau of Mines, Nebraska produced nearly 35 percent of the uranium
produced in the United States. Texas was second producing more than 12 percent. Of the 17 mines in
operation in 1992, five were conventional mines (both underground and open pits), four were in situ, and
eight were reported as “other” (heap leach, mine water, mill tailings, or low-grade stockpiles). In Florida,
uranium has also been produced as a byproduct of phosphoric acid production (Bureau of Mines, 1992a
and 1992b; EPA, 1994 and 1994j; U.S. Department of Energy, 1993).

MINING INDUSTRY PROFILE
September1997 A - 10
3. MINING PRACTICES AND PRODUCTS
Overall, as shown in Table 4, hardrock mining operations handle large quantities of material, the vast
majority of which becomes waste in most industry sectors. Although it varies by commodity, the amount
of product per ton of ore is generally very small for most of these commodities. Overall, the quantities and
characteristics of the wastes are largely beyond the control of the industry, since they are the direct product
of the material being mined.
Conventional underground and surface mining techniques account for most of the hardrock mining in
the United States. Until recent decades, nearly all mining occurred underground, but with the advent of
large earthmoving equipment and cheaper energy sources, surface mining has become prevalent in most
industry sectors. The relatively lower cost of surface mining has allowed much lower-grade ores to be
exploited economically in some industry sectors (EPA, 1994). In addition, in situ leaching has been used
for about two decades in uranium and copper mining.
Primary iron and phosphate ores are mined almost exclusively by surface mining methods. Open pit
mining is also the predominant extraction method used in primary gold and copper production, although
there are several significant exceptions. For example, Homestake’s facility in Lead, South Dakota, and
Copper Range’s White Pine mine in Michigan are large underground gold and copper mines, respectively.
An additional mining practice used during the past 20 years in the copper and uranium sectors is in situleaching. Lead/zinc and the only platinum mine in the United States, on the other hand, are industry sectors
where nearly all primary production occurs at underground mines (Bureau of Mines, 1993; 1992a; 1992b).
The major wastes generated by mines include mine water, waste rock, tailings, and overburden. Mine
water is produced when the water table is higher than the underground mine workings or the depth of an
open pit surface mine. When this occurs, the water must be pumped or drained out of the mine.
Alternatively, water may be pumped from wells surrounding the mine to create a cone of depression in the
ground water table, thereby reducing infiltration. Mine water may be used in milling operations as makeup
water, used for dust suppression, or discharged. When mining ends and pumping stops, groundwater will
usually recover to its pre-mining level, although this can take decades or centuries.
Surface mines generate greater volumes of waste rock than underground operations. Waste rock is
typically managed in angle-of-repose piles, either within or near the pit/mine. Waste rock also can be used
on-site for road construction, in tailings dams, and to backfill mined-out areas. The differentiation between
waste rock and ore (i.e., the cutoff grade) is generally an economic distinction, and can vary significantly
over time depending on economic conditions; thus, what is disposed as waste rock (or sub-ore) at one time
during a mine’s life may be ore at another time. In addition, the development of new technologies can lead
to economically viable mineral recovery from historic waste rock piles. Sub-ore is often stored in
freestanding piles until economic conditions favor its beneficiation or until the mine reaches the end of its
active life (EPA, 1994).
MINING INDUSTRY PROFILE
September1997 A - 11
TA
BL
E 4
. So
lid W
aste
Gen
erat
ed b
y M
ines
, 199
2
Com
mod
ity
Mat
eria
lha
ndle
d1
(tho
usan
dm
etri
c to
ns)
Was
te r
ock2
Ore
Tot
al w
aste
(was
te r
ock
+ t
ailin
gs)
Tai
lings
3P
rodu
ct
Tho
usan
dm
etri
c to
ns%
of
mat
eria
l4T
hous
and
met
ric
tons
% o
fm
ater
ial4
Tho
usan
dm
etri
c to
ns%
of
mat
eria
l4T
hous
and
met
ric
tons
% o
fm
ater
ial4
Cop
per
732,
831
393,
332
53.7
%33
7,73
346
.1%
1,76
50.
2%73
1,06
599
.8%
Gol
d54
0,66
129
3,12
854
%24
7,53
346
%.3
29.0
0006
%54
0,66
199
.99%
Iron
Ore
242,
029
106,
233
43.9
%80
,204
33.1
55,5
9323
%18
6,43
777
%
Lea
d>
6,7
59W
NA
6,36
194
.1%
398
5.9%
6,36
194
.1%
Mol
ybde
num
,Pl
atin
um g
roup
<10
,677
5<
6,75
15<
63%
<3,
9265
<37
%49
0.5%
<10
,677
599
.5%
Phos
phat
e R
ock
151,
796
--
104,
831
69.1
%46
,965
30.9
%10
4,83
169
.1%
Pota
sh1,
902
--
197
10%
1,70
590
%19
710
%
Silv
er>
2,8
24W
NA
2,82
299
.9%
1.8
0.1%
2,82
299
.9%
Ura
nium
NA
NA
NA
NA
NA
.522
NA
NA
NA
Zin
c4,
751
WN
A4,
227
89%
524
11%
4,22
789
%
NO
TE
S: 1T
otal
Mat
eria
l Han
dled
= C
rude
Ore
Han
dled
+ W
aste
Han
dled
+ T
otal
Com
mod
ity P
rodu
ced.
2In
BO
M s
ourc
es, t
his
cate
gory
is s
impl
y cl
assi
fied
as
“Was
te.”
Her
e, it
is c
ateg
oriz
ed a
s “W
aste
Roc
k.”
3T
ailin
gs =
Tot
al C
rude
Ore
Han
dled
- T
otal
Com
mod
ity P
rodu
ced.
4C
alcu
late
d as
a p
erce
ntag
e of
the
Mat
eria
l Han
dled
col
umn.
5In
clud
es b
auxi
te, b
eryl
lium
, mol
ybde
num
, nic
kel,
plat
inum
gro
up m
etal
s, a
nd r
are-
eart
h co
ncen
trat
es.
WIn
form
atio
n w
ithhe
ld b
y th
e B
urea
u of
Min
es f
or p
ropr
ieta
ry r
easo
ns.
NA
Info
rmat
ion
not a
vaila
ble.
Sour
ce f
or M
ater
ials
han
dled
, Was
te r
ock,
and
Cru
de o
re to
nnag
es:
“Min
ing
and
Qua
rryi
ng T
rend
s in
the
Met
als
and
Indu
stri
al M
iner
al I
ndus
trie
s,”
Tab
le 2
(“M
ater
ial H
andl
ed a
t Sur
face
and
Und
ergr
ound
Min
es in
the
Uni
ted
Stat
es in
199
2, b
y C
omm
odity
and
Sta
te,”
p. 8
2).
In:
Bur
eau
of M
ines
, 199
2a.
Sour
ce o
f Pr
oduc
t ton
nage
: “
Surv
ey M
etho
ds a
nd S
tatis
tical
Sum
mar
y of
Non
fuel
Min
eral
”, T
able
1 (
“Non
fuel
Min
eral
Pro
duct
ion
in th
e U
nite
d St
ates
,” p
. 5)
In:
B
urea
u of
Min
es, 1
992a
.
MINING INDUSTRY PROFILE
September1997 A - 12
Waste rock piles are generally designed to drain freely to minimize the potential for unstable
conditions. Therefore, these piles are often located in natural drainages and now frequently have drainage
systems installed during construction (e.g., French drains). Due to the potential for contamination of water
flowing over or through waste rock piles, many mining facilities are now installing systems or taking steps
to prevent or reduce the infiltration of precipitation. Contamination from piles may include sediments and
solids, and also acid mine drainage or toxic pollutant loadings, depending upon the mineralogy of the waste
rock. Systems used to reduce or prevent drainage into, or over, waste rock piles include uphill diversions,
sloped and compacted surfaces, drains, and covers (EPA, 1994).
Except for the gold and copper sectors, in which leaching is increasingly prevalent, beneficiation of
most other metal and phosphate ores occurs by conventional milling technologies. These include crushing,
grinding, autoclaving, roasting, chlorination, calcining, and reagent flotation, by which a chemical reagent
causes the target mineral to stick to air bubbles. In these cases, the ore is crushed and ground and the
target mineral(s) are recovered, leaving very fine “tailings” as a waste to be disposed of. Tailings can be
dewatered and disposed of in piles or used as backfill in the mine; more commonly, they are pumped as a
slurry (typically 30 to 65 percent solids) to impoundments. In tailings impoundments, the solid component
of the tailings settles out behind embankments and the ponded water is either reused in the process or
discharged to surface water. The volumes of water discharged and reused are dependent on site-specific
conditions, including water availability and evaporation rates. Tailings embankments/dams can be
constructed of concrete, earthen materials, and/or waste rock or tailings (EPA, 1994 and 1994e; Bureau of
Mines, 1995).
Table 5 is a summary of mining methods and beneficiation waste management practices for the
various industry sectors.
While conventional flotation involves a wide range of flotation reagents (oils, xanthates, lime, etc.),
depending on the industry sector and site-specific geology residual reagents comprise a diminishing fraction
of the total amount of waste. One exception is in the phosphate industry where flotation occurs in
conjunction with “washing” stages that use both ammonia and sulfuric acid; even there, at least one
company now uses a substitute reagent that both increases recovery efficiency and reduces the toxicity of
discharges (EPA, 1994 and 1994h).
Cyanidation technologies, some of which have been available for more than 100 years, are widely
used for gold beneficiation. Higher-grade ores (“higher-grade” is relative; the highest grades are generally
in the tenths of an ounce of gold per ton of ore) are crushed and ground, then the ore slurry passes through
a series of tanks or vats that contain a sodium cyanide solution that dissolves the gold values; then the gold
is recovered from the solution via Merrill-Crowe zinc precipitation or carbon adsorption, electrowinning,
melting, and refining. The slurry of fine tailings is then disposed of, typically in impoundments (EPA,
1994, 1994c, and 1994i).

MINING INDUSTRY PROFILE
September1997 A - 13
TA
BL
E 5
. P
redo
min
ant
Min
ing
Met
hods
and
Was
te M
anag
emen
t P
ract
ices
Com
mod
ity
Num
ber
ofm
ines
1P
redo
min
ant
min
ing
met
hods
Pre
dom
inan
t B
enef
icia
tion
Met
hods
Maj
or b
enef
icia
tion
was
tem
anag
emen
t pr
acti
ces
Zin
c25
Und
ergr
ound
Flot
atio
nT
ailin
gs im
poun
dmen
ts
Cop
per
50U
nder
grou
nd, o
pen
pit,
in s
ituFl
otat
ion,
Lea
chin
g, S
X/E
WT
ailin
gs im
poun
dmen
ts, s
pent
ore
dum
ps
Iron
22U
nder
grou
ndG
ravi
ty, m
agne
tic s
epar
atio
n, f
lota
tion
Tai
lings
impo
undm
ents
Gol
d20
0 lo
deM
ost o
pen
pit
Seve
ral u
nder
grou
ndC
yani
datio
n: h
eap,
tank
, vat
leac
hing
Tai
lings
impo
undm
ents
(ta
nk, v
at),
dum
ps a
nd h
eaps
(he
aps)
, spe
nt o
redu
mps
100s
pla
cer
Ope
n pi
t, dr
edge
, etc
.G
ravi
ty, s
ome
cyan
idat
ion
Tai
lings
bac
k in
to m
ine
cut
Mol
ybde
num
10U
nder
grou
ndO
pen
pit
Flot
atio
nT
ailin
gs im
poun
dmen
ts
Lea
d23
Und
ergr
ound
Flot
atio
nT
ailin
gs im
poun
dmen
ts
Phos
phat
e16
Mos
t by
surf
ace
min
ing
Flot
atio
n, h
eavy
med
ia s
epar
atio
nB
ackf
illin
g an
d cl
ay p
onds
Plat
inum
1U
nder
grou
ndFl
otat
ion
Tai
lings
impo
undm
ent
Pota
sh6
Und
ergr
ound
, sol
utio
n m
inin
g,la
ke b
rine
Flot
atio
n, h
eavy
med
ia s
epar
atio
n,di
ssol
utio
n -
recr
ysta
lizat
ion
Silv
er15
0O
pen
pit,
unde
rgro
und,
pla
cer,
by-
prod
uct
Flot
atio
n (b
ase
met
al o
res)
, Sm
eltin
g(c
oppe
r or
es),
Cya
nida
tion
(gol
d/ s
ilver
ores
), p
reci
pita
tion
(silv
er o
res)
Tai
lings
impo
undm
ents
Tai
lings
use
d as
bac
kfill
Not
e: 1
Due
to th
e na
ture
of
the
min
ing
indu
stry
, the
exa
ct n
umbe
r of
min
es is
dif
ficu
lt to
dis
cern
. Fo
r in
stan
ce, s
ever
al o
f th
e co
mm
oditi
es a
re p
rodu
ced
asco
-pro
duct
s or
by-
prod
ucts
fro
m o
ther
com
mod
ity m
inin
g op
erat
ions
(e.
g., c
oppe
r as
a r
esul
t of
gold
pro
duct
ion)
. T
here
fore
, the
num
ber
of m
ines
for
indi
vidu
al c
omm
oditi
es in
clud
es b
oth
actu
al c
omm
odity
min
es a
nd th
ose
min
es f
rom
whi
ch th
e co
mm
odity
is a
co-
prod
uct o
r by
-pro
duct
. T
hese
unce
rtai
ntie
s re
sult
in in
cons
iste
nt n
umbe
rs th
roug
hout
the
BO
M s
ourc
es.
Sour
ce:
Var
ious

MINING INDUSTRY PROFILE
September1997 A - 14
Lower grade gold ore (down to two hundredths of an ounce of gold or less per ton of ore), which may
be crushed, is piled onto lined “pads,” and a “barren” cyanide solution is applied to the surface. The
cyanide solution percolates through the heap, dissolving gold values. This “pregnant” solution is recovered
from the base of the heap, gold is recovered from the solution, and the “barren” solution is refortified with
cyanide and reapplied. The pregnant and barren solutions are generally stored in lined ponds. Following
leaching, spent ore may either be left in place (with new ore added over it) or removed for disposal (after
detoxification/neutralization) in a spent ore pile/dump. Where spent ore is managed in place, neutralization
of the residual cyanide occurs after the heap has reached the maximum height (EPA, 1994, 1994c, and
1994i).
The process of using cyanide to extract gold works most effectively on oxide ores. (Oxide ores are
those exposed to weathering and the action of water, and that have little or no sulfur content.) As the sulfur
content of the ore increases, the efficiency of gold recovery decreases. As shallow oxide deposits are mined
out, gold mines are beginning to extract ores with ever higher concentrations of sulfur bearing minerals. In
response, operators are treating these sulfide ores with a variety of techniques to reduce their sulfur content.
Such techniques include roasting and biological treatment. The trend towards greater exploitation of
sulfide ores is of concern in that these ores contain potentially acid generating sulfide minerals, as does the
waste rock (EPA, 1994c and 1994i).
In addition, copper ores are increasingly being leached, primarily in very large dumps (e.g., Cyprus
Minerals Col, ASARCO, Inc., and Magma Copper Co.) but also in situ. Leaching of copper ores has
occurred since the 1950s and 1960s, but the use of dump leaching for copper recovery has only become
viable during the past decade, with the acceptance of solvent extraction/electrowinning (SX/EW)
technology. In this process, oxide ores and low grade sulfide ore (those that cannot be economically milled
and recovered by flotation) are placed in lined heaps or unlined dumps, typically with no crushing or
grinding. Leaching solution is applied to the surface and collected at the base. Ore can also be leached insitu, with leach solution injected into the ore body through wells and recovered in underground workings or
through recovery wells. The pregnant solution from these leach operations is collected and conveyed to the
SX plant, where the copper is extracted by a proprietary organic chemical dispersed in a kerosene diluent.
The copper is then extracted from the organic base with a strong sulfuric acid solution that then becomes
the electrolyte for electrowinning. In the electrowinning tankhouse, the copper is plated out of solution onto
a cathode suitable for sale. The entire SX/EW process is almost exclusively closed-looped. For low-grade
sulfide ores, water is the lixiviant; for oxide ores, sulfuric acid is used to make up leaching solution. To
facilitate collection of pregnant solution, dump leach units are typically located within a pit or a natural
drainage. Dump leach units (and in situ operations) are not always designed to ensure maximum collection
of pregnant solution; there are technological limits to containment, but the more important factor is the
balance struck between the economics of facility design/construction and the anticipated efficiency of
solution recovery. (Another factor, state regulation, is increasingly important: Arizona’s new regulations,
for example, have led to increased attention on improving solution containment there (EPA, 1994 and
1994a).)

MINING INDUSTRY PROFILE
September1997 A - 15
Mineral processing operations generally follow beneficiation and include techniques that often change
the chemical make-up of the ore or mineral by chemical attack or digestion, electrolytic refining, and
pyrometallurgical/thermal processes. In contrast to extraction and beneficiation wastes, processing
operations generate waste streams that generally bear little or no resemblance to the materials that entered
the operation.
When mineral processing operations are co-located with extraction and beneficiation operations,
commingling of extraction and/or beneficiation and mineral processing wastes (both Bevill and non-Bevill)
may occur. Most often, the volume of processing waste is very small compared with the total waste
quantity managed on-site (e.g., co-disposing a few thousand tons per year of wastewater treatment sludge
with millions of tons of mill tailings). In these cases, management of the mixed waste streams usually
occurs in a land disposal unit, such as a tailings pond or other surface impoundment, or, in some industry
sectors, a gypsum stack.
Environmental Performance
Mining operations can be and have been sources of widespread environmental impacts, with more
than 60 sites on the National Priorities List. During the past 20 years, however, there has been significant
improvement in environmental performance at many hardrock mining operations. This is due to many
factors:
! Increasing environmental awareness and commitment to environmental protection by many miningcompanies.
! Better techniques to predict and detect potential environmental effects before damage occurs.
! Continually developing technologies to prevent, mitigate, or remediate environmental impacts.
! Broader state and federal regulatory requirements, including post-mining liability.
Many of the largest mining companies have set up extensive environmental programs. They have
begun to incorporate environmental concerns into all phases of mining operations, from exploration to
mining planning, through development, operations, closure and reclamation. At some mines, management
performance standards now include environmental accomplishments. Other mining companies have set up
comprehensive environmental auditing programs. Therefore, environmental costs are now being
characterized during the earliest stages of mine planning as part of the economic evaluation of recovering
target minerals (EPA, 1994).
The most significant environmental threats posed by mine sites are often complex and highly
dependent on site-specific factors. Acid generation potential and water balances, for example, can be very

MINING INDUSTRY PROFILE
September1997 A - 16
difficult to predict, but also can be very difficult, and expensive, to deal with once problems occur. Poor
understanding of water balances, or site hydrology, can contribute to making uninformed decisions about
control technologies, and that in turn can result in environmental problems. During the past decade,
predictive tools have been greatly improved; this reduces uncertainty and provides more reliable
information to develop and carry out mitigation measures. Uncertainty does remain, though, and
unanticipated environmental impacts continue to occur at some sites, which emphasizes the need for
continued development and refinement of site characterization and mine planning tools (EPA, 1994 and
1994k).
Along with better predictive tools, technologies also continue to be developed to reduce potential
environmental threats and address impacts where they do occur. Mining companies have learned to build
better, more efficient, and more environmentally safe operations. Advances in liner and other containment
systems, piping and spill control, and reclamation techniques are all examples of such improvements. It is
important to recognize that the economic costs of environmental controls are a significant element, as is the
concentration of the target mineral in the ore body, in the planning and economic evaluation of a site for
mine development and operation. Environmental controls must be affordable, cost-effective, and meet
certain standards. Where there are potential or actual releases to the environment, treatment and remedial
technologies also continue to evolve. For example, nearly 20 years ago, the Homestake Mining Company
developed an innovative biotreatment technology for cyanide destruction at the company’s gold mine in
Lead, South Dakota. Other biotechnologies are being started and improved for cyanide heap leach
detoxification and acid drainage control, among other environmental applications. Information
management and process controls are also improving environmental performance at many mine and mill
sites. By better classifying ore grades and by improving mineral recovery from ore, mines and mills can
improve productivity and thus generate somewhat less waste rock or tailings for every pound of metal
recovered. (Better classification and recovery, however, have finite limits imposed by the absolute amount
of the valuable mineral in the ore and the technologies that are available for recovery.) Because of the high
waste-to-product ratios and the volume of wastes generated, however, any improvement in recovery can
reduce wastes by substantial amounts (but generally only by small proportions) (EPA, 1994 through
1994k).
Historic mining operations were often unregulated, resulting in extensive uncontrolled environmental
releases. In recent decades, particularly since the early 1970s, state and federal agencies have established
broad regulatory requirements that generally address all phases of mine operations. During mine planning,
operators may be required to complete baseline studies and assess the potential effects of and risks
associated with proposed operations. Mine units frequently have to meet specific design standards (liner
requirements, stability standards, overflow protection, etc.). Environmental statutes and regulations, such
as the Clean Water Act, Clean Air Act and corresponding state requirements, are intended to address
environmental releases. Bonding requirements are imposed to ensure that reclamation will be successfully
completed. In some states, bonding also serves to protect against environmental problems.
MINING INDUSTRY PROFILE
September1997 A - 17
4. MINING AND THE ECONOMY
All non-fuel mineral beneficiation and extraction activities accounted for approximately 0.23% of
GNP (Commerce, 1995a) and 0.85% of total employment (Commerce, 1995c) at the national level in 1993.
In contrast, the manufacturing industries accounted for 17.63% of GNP (Commerce, 1995a) and 19.2% of
total employment (Commerce, 1995c) during the same year. The apparently small portion of the national
economy attributed to mining can be traced to several factors: 1) the national economy of the United States
is the largest, and most diverse, in the world; 2) improvements in productivity, technology, and
mechanization have reduced the need for a large workforce; and 3) the mining sector of the economy has
not grown at the same rate as other major sectors of the economy (U.S. Department of Commerce, 1995a).
Although basic non-fuel metal mining occupies a statistically small position in the overall national
economy, the mining sector provides basic raw materials for major sectors of the U.S. economy, and thus is
more important then the mere numbers suggest. Copper is essential to the electronics and construction
industries. Iron ore provides the base material for the steel, automotive, and transportation industries.
Molybdenum is used in steel production, machinery, electrical and chemical manufacturing. Potash and
phosphate rock are used in fertilizers and chemical manufacturing. Gold, while primarily used in jewelry
and the decorative arts, is also used in the electronics industry and dentistry. These minerals are essential
to the operation of a modern, industrialized economy. Without a domestic iron ore industry for example,
the unit cost to produce automobiles in the United States would be significantly different. Copper,
molybdenum, phosphate rock, gold, silver, lead, and zinc play similar roles. The amount of raw materials
produced by the U.S. mining industry has provided and will continue to provide raw materials necessary to
drive the diverse U.S. economy.
Other important contributions of the minerals industry to the national economy are its value as a
producer of exports, and in reducing industrial dependence on certain minerals that would otherwise be
imported. For example, in 1994 the United States exported 8% of the lead and 75% of the molybdenum it
produced. Conversely, the United States imported 22% of the iron ore it consumed in 1994.
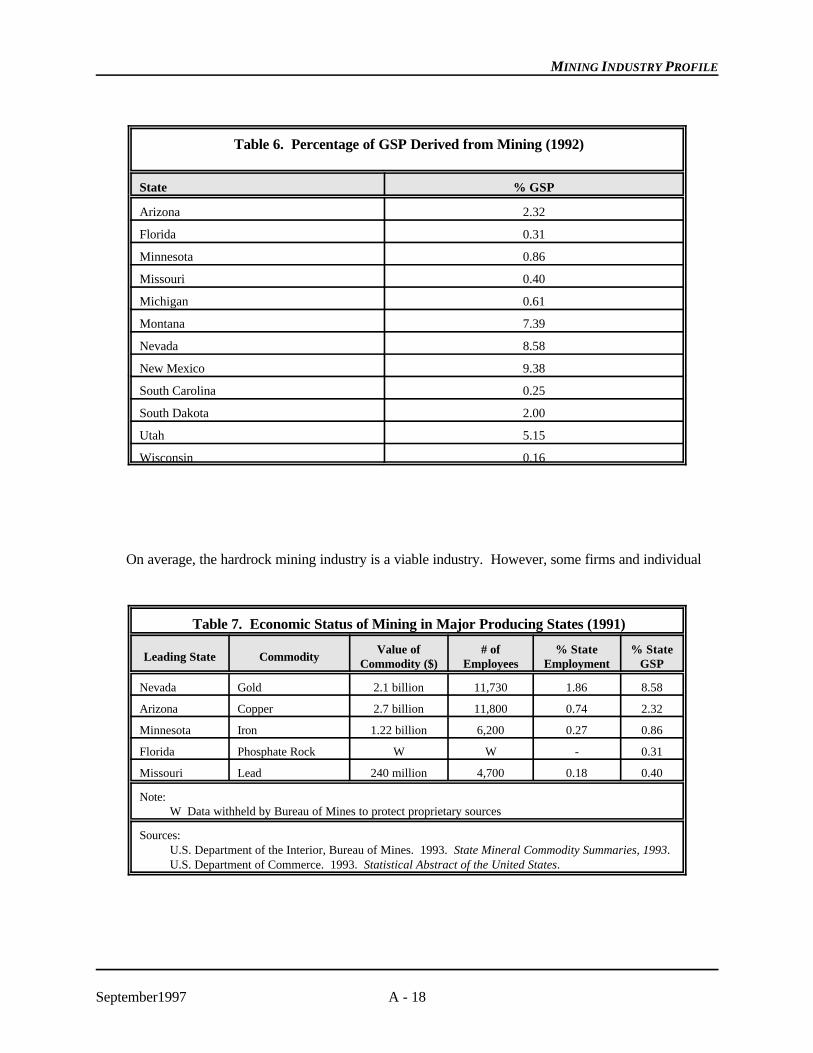
While mining is a small part of the national economy, the importance of mining to state economies
varies widely (See Table 6). Of the twelve states producing significant amounts of minerals, there exists a
large difference in the percentage of GSP (gross state product) contributed by mining. Generally, states
with large, diverse economies (Florida, Missouri) reflect the same trend as is evidenced at the national
level: mining is responsible for a very small percentage of GSP. This is even true in Arizona, which is
ranked first in terms of dollar value of copper produced, yet whose mining sector accounts for “only”
2.32% of GSP. However, in states with smaller, less diverse economies, mining has a much greater role in
the state economy. This is notable in Montana and New Mexico, where mining accounts for 7.39% and
9.38% of GSP, respectively (U.S. Department of Commerce, 1995b). Mining at the state level is similarly
important to overall employment. As shown in Table 7, the percentage of state employment in the mining
sector is small in the five states that are the major producers of their respective commodities.
MINING INDUSTRY PROFILE
September1997 A - 18
Table 6. Percentage of GSP Derived from Mining (1992)
State % GSP
Arizona 2.32
Florida 0.31
Minnesota 0.86
Missouri 0.40
Michigan 0.61
Montana 7.39
Nevada 8.58
New Mexico 9.38
South Carolina 0.25
South Dakota 2.00
Utah 5.15
Wisconsin 0.16
Table 7. Economic Status of Mining in Major Producing States (1991)
Leading State CommodityValue of
Commodity ($)# of
Employees% State
Employment% State
GSP
Nevada Gold 2.1 billion 11,730 1.86 8.58
Arizona Copper 2.7 billion 11,800 0.74 2.32
Minnesota Iron 1.22 billion 6,200 0.27 0.86
Florida Phosphate Rock W W - 0.31
Missouri Lead 240 million 4,700 0.18 0.40
Note: W Data withheld by Bureau of Mines to protect proprietary sources
Sources:U.S. Department of the Interior, Bureau of Mines. 1993. State Mineral Commodity Summaries, 1993.U.S. Department of Commerce. 1993. Statistical Abstract of the United States.
On average, the hardrock mining industry is a viable industry. However, some firms and individual

MINING INDUSTRY PROFILE
September1997 A - 19
mines, particularly small ones, have financial difficulties. Assessing the financial health of individual
commodities is difficult because many firms produce various commodities from various countries. Reports
by Standard and Poor’s, Moody’s and the Value Line assess the finances for the mining companies, which
includes non-American holdings. In addition, publicly available financial statements for companies are
consolidated, and include the assets, liabilities, and operating accounts of the parent company and its
subsidiaries. This creates a problem in trying to understand the financial health of the American hardrock
mining industry because the consolidated financial statements include financial information from operations
outside of the United States. Therefore, it becomes a problem in distinguishing the financial health of the
American mining industry from the world’s mining industry.
The discussion below covers the major industry sectors, as reported by Standard & Poor’s, Moody’s,
and the Value Line. Individual commodities not discussed indicates that Standard & Poor’s or Moody’s
did not compile information. Note that the latest financial information reported by Standard & Poor’s,
Moody’s, and the Value Line includes information ending before the economic recovery of the mid-1990s.
It should also be noted that the industry’s, and individual companies’, financial health can be quite volatile
over relatively short periods of time, so the discussion that follows is necessarily only a snapshot in time.
Copper. Three financially viable producers dominate the copper mining industry (ASARCO
Incorporated, Cyprus Amax Mining Company, and Phelps Dodge). However, other firms are not as
financially healthy. From 1989 to 1992, the copper mining industry was characterized by decreasing
operating revenues, net income (including some companies with negative net income), asset-use efficiency,
average share prices, and earnings per share. Short-term and long-term liabilities have increased for some
companies but are stable. Overall the industry is financially secure.
Lead and Zinc. For purposes of its analysis, Standard & Poor’s combined the lead and zinc
industries. Leading lead producers include The Doe Run Company, ASARCO, and Cominco, while
leading zinc producers include Cominco, Doe Run, Jersey Miniere Zinc, and the Green Creek mine
(Kennecott, Hecla, and others). From 1988 to 1991, decreasing operating revenues, net income (including
some companies with negative net income), asset-use efficiency, average share prices, and earnings per
share characterized the lead and zinc mining industry. The industry began a modest improvement in 1992.
Short-term and long-term liabilities have remained constant, but decreasing sales has reduced the industry’s
ability to meet short-term and long-term obligations. Companies focusing on the lead and zinc industry
may be problematic.
Gold. The gold mining industry is dominated by a few firms (Barrick Gold Corporation, Echo Bay
Mines Limited, Homestake Mining, Lac Minerals Limited, and Newmont Mining Corporation) that are
gaining an increasing portion of the market share. None of these firms have a problem meeting either
short- or long-term debt. Decreasing operating revenues, net income and increasing liability characterize
smaller firms. In the gold mining industry, the major producing companies are financially strong, although
other firms within the industry are not as healthy and some have a problem meeting short-term debt.

MINING INDUSTRY PROFILE
September1997 A - 20
Silver. Many companies that produce gold also produce silver. Therefore, much said about gold can
also be repeated for silver. However, Standard & Poor’s classifies a few firms as primarily silver
producers (Coeur d’Alene Mines Corporation, Hecla Mining Corporation, and Sunshine Mining
Company). Net income for silver producers has continued to decline with the three major silver producers
having negative net income during 1991 and 1992. However, the companies do not have liquidity
problems. Based on current ratios (current assets divided by current liabilities), the three companies have
had consistently large cash reserves.
Miscellaneous sectors. In the metals-miscellaneous category, Standard & Poor’s used financial data
from several selected companies that mine diverse commodities. On average, for the companies in the
miscellaneous category sales, operating income, profit margin, cash flow, and earnings have all decreased.
All of the indicators started to decrease in 1988 and continued until 1992. However, based on measures of
liquidity for selected companies there does not appear to be a problem meeting short- and long-term
liabilities.
Capital Expenditures for Pollution Abatement. The U.S. Bureau of the Census does not separate
capital expenditures for pollution from companies identified by SIC codes 10, 11, 12, or 14, but reports
them together (those SIC codes include metal mining, industrial minerals mining, and coal mining). In
1991, capital expenditures for pollution abatement equipment was a combined $273.6 million for these four
major groups. This included expenditures of $117.5 million for air pollution control, $119.6 million for
water pollution control, and $38.5 million for solid waste control (U.S. Department of Commerce, 1993).
5. INACTIVE AND ABANDONED MINES
The number of inactive and abandoned mines in the United States is simply not known. (Although
“inactive and abandoned mines,” or IAMs, has become a commonly used term, the mines so categorized
may be better described as abandoned mines; most mines that are temporarily inactive are still considered
“active” by state and federal regulators.) Many federal agencies and others have made estimates of the
number of mines, with little consistency and unknown accuracy. There are several areas of agreement
among most sources and commentators. First, nearly all agree that the total number of abandoned mines is
very large. In addition, there is some agreement that only a minority cause environmental damages--the
size of the minority is uncertain, however. Also, many have noted that some mines pose a threat to safety
but otherwise pose little or no risk to human health or the environment. Finally, there is also some
agreement that the costs of remediation dwarfs available resources, at whatever level.
Major areas of disagreement include the extent to which resources should be devoted to detailed
inventories instead of remediation (the ultimate issue is how sites should be ranked), what the cleanup goals
should be, and who should be the responsible party (e.g., federal or private land owners or prior
claimants/lessees). If additional resources were made available for remediation, the major issue would
likely become establishing priorities among sites (Frieders and Raney, 1994).

MINING INDUSTRY PROFILE
September1997 A - 21
6. TRENDS
Commodity prices are generally set or at least strongly influenced by the global economy. In addition,
there are alternative sources for every commodity mined in the United States, many at lower or marginally
higher costs. Thus, increases in production costs in the United States compared with other sources could
reduce U.S. production of any commodity.
Future trends in the United States mining industry are almost entirely dependent on various aspects of
the domestic and world economies. As such, they are extremely difficult to predict with any degree of
certainty. The following are observations (taken largely from Bureau of Mines, 1992a, 1992b, 1993, and
1995) on trends that are likely to occur or that have been predicted.
To some extent, changes in the environmental requirements can affect future trends in the domestic
mining industry that are applicable to mining operations. Industry reports (including annual reports and
other filings) and Bureau of Mines commentaries nearly always note the uncertainty of future
environmental requirements and the impacts those requirements may have on the cost of production. The
most commonly cited areas of uncertainty are possible requirements under a RCRA program and possible
liability under Superfund. The actual effects of existing regulations (including the many new state
requirements), not to mention possible future effects, have not been well assessed.
Gold. Contrary to prices of most metals and other commodities (e.g., copper), gold prices increase in
uncertain times. No major economic expansions or retractions are being predicted, so gold production
worldwide is likely to hold steady or increase slowly in coming years. Prices should do the same, although
increased production from the former Soviet Union could drive prices down somewhat. Unless gold prices
increase dramatically, however, U.S. production is likely to decline over time as higher grade deposits are
mined out in the contiguous states. Many gold mines that opened in the late 1970s and early 1980s have
reached or are nearing the end of their active lives. Thus, unprecedented numbers of mines are (or will be)
closing and being reclaimed under “modern” environmental requirements. In addition, future production
will come increasingly from lower-grade ores (which will increase waste generation, even as production
declines) and ores with higher sulfide content.
Copper. Copper prices and production are very sensitive to global and domestic economic health.
Expansions trigger increases in demand and prices, which drive production upward. Increasingly, U.S.
mines are leaching copper from lower-grade ores, which significantly increases the waste-per-product ratio.
This trend will likely continue, as several major U.S. copper operations have announced major expansions
of SX/EW production. State reclamation requirements have only recently been developed and imposed on
operations in Arizona and New Mexico, where most copper production occurs, and the impacts of those
requirements are not clear.

MINING INDUSTRY PROFILE
September1997 A - 22
Lead. Although domestic demand for lead grew an average of 4 percent per year from 1985 to 1989,
the Bureau of Mines predicts that the growth in domestic lead demand will range from 0.5 percent to 1.5
percent per year during the 1990s. The availability of scrap lead will influence production increases and
decreases in the U.S. secondary industry (Jordan, 1994). The most probable world growth in lead use until
the end of the century is forecast to average about 1.5 percent per year. In recent years, the United States
has increasingly relied on secondary sources (e.g., scrap batteries), and concern over lead exposure has
reduced lead consumption.
Phosphate Rock. World production and consumption have declined steadily since 1989. After 1993,
a modest increase was forecast. The long-term growth in phosphate rock production is forecast to average
about 1.3 percent annually beginning in 1997.
Iron Ore. The domestic iron ore industry is entirely dependent on the steel industry for sales
(molybdenum also is used primarily in the steel industry, and molybdenum trends should follow iron).
Dependence is not expected to change in the near future. For the long-term there is little expected growth
in the domestic steel industry or countries with highly developed economies. In contrast to the United
States, the demand for iron ore is expected to increase, especially in Asia. The increase in iron ore
consumption in Asia is expected to benefit Australia rather than the United States
Uranium. Uranium mines within the United States produced 522 metric tons (1.4 million pounds) of
U O equivalent in 1992. Production figures from 1992 showed a drop of more than 70 percent from 19913 8
levels and the lowest level of production since 1951. Uranium prices and production are down. In 1992,
the average price per pound of uranium oxide equivalent was $8.70, down from an average of $13.66 in
1991 (U.S. Department of Energy, 1993). Uranium requirements in the next two decades are forecast to
increase at less than 1 percent per year. Decreases are possible in the near term, as premature shutdowns
of existing reactors balance the few new additions. Development of new projects without most or all of the
production from the new projects being committed will not occur. In addition, future uranium supplies for
nuclear power will contain 15 percent converted weapons material by the year 2000 (Pool, 1994).
Platinum. Platinum sales are dependent largely upon the automobile industry, since platinum is used
in catalytic converters. The automobile market is expected to continue growing until 1997 and then to slow
(Federal Reserve, 1994).

MINING INDUSTRY PROFILE
September1997 A - 23
7. REFERENCES
Frieders, T. and R. Raney. April 1994. “Abandoned Mines - the Federal Response” in Minerals Today. U.S. Bureau of Mines, Washington, D.C.
Jordan, Jeffrey, G. “Lead: Modest Recovery for Immediate Future,” Engineering and Mining Journal: 125th Annual Survey & Outlook, vol. 195 (March 1994), pp. 24-25.
Mineral Policy Center. June 1993. Burden of Gilt: The Legacy of Environmental Damage fromAbandoned Mines, and What America Should Do About It. Washington, D.C.
Pool, Thomas C. “Uranium: Weapons Conversion Looms,” Engineering and Mining Journal: 125thAnnual Survey & Outlook, vol. 195 (March 1994), pp. 55-58.
Standard and Poors. December 9, 1993. Industry Surveys: Volume No. 2 M-2.
The Federal Reserve Bank of Chicago September 1994. Chicago Fed Letter. Number 85.
U.S. Department of Commerce, Economics and Statistics Administration, Bureau of Economic Analysis. August 1994. Survey of Current Business. Volume 74, Number 8. Washington, D.C.
U.S. Department of Commerce, Economics and Statistics Administration. January 1993. PollutionAbatement Cost and Expenditures, 1991. MA200(91)-1. Washington, D.C.
U.S. Department of Commerce. Bureau of the Census. 1993. Statistical Abstract of the United States. Washington, D.C.
U.S. Department of Commerce. Bureau of the Census. 1994. Statistical Abstract of the United States. Washington, D.C.
U.S. Department of Commerce, Bureau of Economic Analysis. 1995a. Survey of Current Business: April1995", Volume 75, Number 4. Washington, DC.
U.S. Department of Commerce, Bureau of Economic Analysis. 1995b. Survey of Current Business: May1995", Volume 75, Number 5. Washington, DC.
UU.S. Department of Commerce, Bureau of the Census. 1995c. County Business Patterns 1993: UnitedStates. Washington, DC.
U.S. Department of Energy, Energy Information Administration. 1993. Domestic Uranium Mining andMilling Industry 1992, Viability Assessment. DOE/EIA-0477(92), Distribution Category UC-98,Washington, D.C.
U.S. Department of the Interior, Bureau of Mines. 1968. A Dictionary of Mining and Related Terms. Edited by P.W. Phrush.

MINING INDUSTRY PROFILE
September1997 A - 24
U.S. Department of the Interior, Bureau of Mines. 1992a. Minerals Yearbook, Volume I: Metals andMinerals. Washington, D.C.
U.S. Department of the Interior, Bureau of Mines. 1992b. Minerals Yearbook, Volume II: Area Reports: Domestic. Washington, D.C.
U.S. Department of the Interior, Bureau of Mines. 1993. State Mineral Commodity Summaries, 1993.Washington, D.C.
U.S. Department of the Interior, Bureau of Mines. 1994. Mineral Commodity Summaries 1994. Washington, D.C.
U.S. Department of the Interior, Bureau of Mines. 1995. Mineral Commodity Summaries 1995. Washington, D.C.
U.S. Department of the Interior, Office of Inspector General. September 1991. Audit Report. NoncoalReclamation, Abandoned Mine Land Reclamation Program, Office of Surface Mining Reclamationand Enforcement. Report No. 91-I-1248. Washington, D.C.
U.S. Environmental Protection Agency, Office of Federal Activities. 1994. EIA Guidelines for Mining. Washington D.C.
U.S. Environmental Protection Agency, Office of Solid Waste. 1994a. Copper - Extraction andBeneficiation of Ores and Minerals, Volume 4, EPA/530-R-94-031, NTIS/PB94-200 979,Washington D.C.
U.S. Environmental Protection Agency, Office of Solid Waste. 1994b. Design and Technical Evaluationof Tailings Dams, EPA/530-R-94-038, NTIS/PB94-201 845, Washington D.C.
U.S. Environmental Protection Agency, Office of Solid Waste. 1994c. Gold - Extraction andBeneficiation of Ores and Minerals, Volume 2, EPA/530-R-94-013, NTIS/PB94-170 305,Washington D.C.
U.S. Environmental Protection Agency, Office of Solid Waste. 1994d. Gold Placer - Extraction andBeneficiation of Ores and Minerals, Volume 6, EPA/530-R-94-035, NTIS/PB94-201 811,Washington D.C.
U.S. Environmental Protection Agency, Office of Solid Waste. 1994e. Innovative Methods of ManagingEnvironmental Releases at Mine Sites, EPA/530-R-94-012, NTIS/PB94-170 255, Washington D.C.
U.S. Environmental Protection Agency, Office of Solid Waste. 1994f. Iron - Extraction andBeneficiation of Ores and Minerals, Volume 3, EPA/530-R-94-030, NTIS/PB94-195 203,Washington D.C.
U.S. Environmental Protection Agency, Office of Solid Waste. 1994g. Lead-Zinc - Extraction andBeneficiation of Ores and Minerals, Volume 1, EPA/530-R-94-011, NTIS/PB94-170 248,Washington D.C.

MINING INDUSTRY PROFILE
September1997 A - 25
U.S. Environmental Protection Agency, Office of Solid Waste. 1994h. Other Mining Sectors: Phosphateand Molybdenite - Extraction and Beneficiation of Ores and Minerals, Volume 7, EPA/530-R-94-034, NTIS/PB94-201 001, Washington D.C.
U.S. Environmental Protection Agency, Office of Solid Waste. 1994i. Treatment of Cyanide HeapLeaches and Tailings, EPA/530-R-94-037, NTIS/PB94-201 837, Washington D.C.
U.S. Environmental Protection Agency, Office of Solid Waste. 1994j. Uranium - Extraction andBeneficiation of Ores and Minerals, Volume 5, EPA/530-R-94-032, NTIS/PB94-200 987,Washington D.C.
U.S. Environmental Protection Agency, Office of Solid Waste. 1994k. Acid Mine Drainage Prediction,EPA/530-R-94-036, NTIS/PB94-201 829, Washington D.C.
U.S. Environmental Protection Agency. 1996. CERCLIS Report SCAP 11: Site Summary Report for NPLSites, Washington, D.C.
U.S. General Accounting Office. 1988. Federal Land Management: An Assessment of Hardrock MiningDamage. Briefing report to the Chairman, Subcommittee on Mining and Natural Resources,Committee on Interior and Insular Affairs, House of Representatives. GAO RCED-88-123BR. Washington, D.C.
U.S. National Park Service, Land Resources Division, Mining and Minerals Branch. March 1990. Abandoned Mineral Lands in the National Park System. Washington, D.C.
Western Governors’ Association. April 1991. Inactive and Abandoned Non-coal Mines: A ScopingStudy. Prepared for the Western Governors’ Association Mine Waste Task Force by the WesternInterstate Energy Board. Denver, CO.