appendix a - epa guidelines on water efficiency measures
TRANSCRIPT

1
Environmental Protection Agency Region 4 Guidelines on Water Efficiency Measures
For Water Supply Projects in the Southeast 6-21-2010
Purpose of Guidelines: These guidelines were developed to ensure the various Environmental Protection Agency (EPA) Region 4 programs and partners involved in reviewing water supply reservoir projects use consistent methods in evaluating the purpose and need and the analysis of alternatives for these projects, especially the need for additional capacity due to projected future demands and the determination of the least environmentally damaging practicable alternative (LEDPA). These guidelines were developed to inform local governments and water utilities of the actions EPA expects them to take in order to eliminate or minimize the need for additional capacity before consideration of a water supply reservoir project on a stream or river. These guidelines will also ensure water utilities use consistent and rigorous approaches to the implementation of water efficiency measures as they determine the projected demand based on future needs. EPA will also use these guidelines to evaluate water demand projections for non reservoir projects, such as new or significantly increased public surface water withdrawals or public ground water supply wells which are being reviewed through EPA grants, the National Environmental Policy Act (NEPA) or other EPA programs. EPA Region 4 will be using these guidelines for the review of environmental documents and permit proposals for reservoir projects under both NEPA and Section 404 of the Clean Water Act (CWA). The evaluation of the water efficiency/water conservation measures in these guidelines should be reflected in the water demand projections for project purpose and need and should also be an important consideration in the economic practicability of the alternatives and in the determination of the LEDPA per the Section 404(b)(1) Guidelines, 40 CFR §230.10(a). Regulatory Authorities: The construction of water supply reservoir projects requires the issuance of a CWA, Section 404 permit for the discharge of the dredged or fill material in waters of the U.S. to build the dam and control structures. The U.S. Army Corps of Engineers (Corps) has defined Loss of Waters in the Department of the Army March 12, 2007, Notice of Issuance of Nationwide Permits (72FR 11092-11198) as the following: “Waters of the U.S. that include the filled area and other waters that are permanently adversely affected by flooding, excavation, or drainage because of the regulated activity.” [emphasis added]. EPA and the Corps’ responsibility in the Section 404 permit process is to ensure that any proposed project is consistent with the Section 404(b)(1) regulations which provide that “…no discharge of dredged or fill material shall be permitted if there is a practicable alternative to the proposed discharge which would have less adverse impact on the aquatic ecosystem…” and that no permit shall be issued unless the potential impacts to waters of the U.S. be minimized to the degree practicable. With reservoir projects, this includes

2
impacts from both the fill and inundated areas. If required, under Section 404(q) EPA may elevate a proposed permit to higher levels of management review within EPA and in the Corps. In extreme situations, Section 404(c) authorizes EPA to prohibit, restrict, or deny the discharge of dredged or fill material at defined sites in waters of the United States (including wetlands) whenever it determines, after notice and opportunity for public hearing, that use of such sites for disposal would have an unacceptable adverse impact on one or more of various resources, including fisheries, wildlife, municipal water supplies, or recreational areas. EPA’s objective is to ensure that alternatives that support sustainable water resource management and minimize environmental impacts through effective water efficiency and water conservation practices are employed to the maximum extent practicable at the project design stage of the proposal. Background: Water is vital to the survival of everything on the planet and yet the earth’s supply of freshwater is limited. Only one percent of the earth’s water is available as freshwater for human use without the use of energy intensive and expensive methods of treatment. While the population and the demand on freshwater resources are increasing, the supply remains constant. Competing freshwater needs such as human consumption, aquatic habitat and water quality protection, energy production, agriculture and industrial uses, and recreational opportunities, are stretching our limited water supply in ways that will require new solutions for wise future use. a. Water Consumption Demands: Our nation’s growing population and challenging climatic
events continue to stress our available water supplies. Climatic extremes are affecting the availability of public water supplies in the Southeast. But there is good news for the Southeast. The U.S. Geologic Survey (USGS) Circulars 1268 and 1344 (Estimated Use of Water in the United States in 2005)1 suggest the national per capita water consumption rate for public water supplies may be stabilizing. After rising for 30 years between 1950 and 1990, the public water supply consumption rate was relatively steady between 1990 and 2000. The latest numbers released by USGS circular 1344 suggest, the public supply consumption rate dropped in 2005 to close to the 1980 rate.2 The USGS data do not provide the detail to explain the source of the decline in the public supply consumption rate. Although the overall lowering of water usage may be attributed to the use of more efficient irrigation systems and alternative technologies at power plants, these agriculture and power supply usages are not included in the gallon per capita per day (gpcd) public consumption rate. The decline in the public consumption rate is likely generated from many of the new programs which have been initiated in the last 10 years such as system-wide leak detection and correction, the use of high efficiency plumbing fixtures, and implementation of industrial Environmental Management Systems which lead to water use efficiencies. The public water supply consumption rate, or gallons per capita per day (gpcd), is calculated by taking the national withdrawals of ground and surface waters for public water supplies and dividing the total by the population. Public water supply withdrawals include

3
withdrawals for domestic, commercial, and industrial consumption of public water supplies. Public water supply withdrawals also include unaccounted for water consumption from such sources as system leaks and public uses such as fire protection. The commercial/industrial consumption is added in to the gpcd use because it is necessary for determining the water demand projections. Each of the eight Region 4 states are projected to have population increases through the year 2030 and most of our states had higher than average per capita water use rates in 2000.3 As was stated earlier, this increasing demand has put additional stress on our region’s water supply, contributing to human health and water quality problems along with increasing levels of greenhouse gas emissions related to the energy needed for pumping and treating drinking and waste water. However, many communities across the country, such as Seattle, Washington, have been able to meet the challenge of growing populations and limited water sources by instituting an aggressive water efficiency program. Since 1990, Seattle Public Utilities decreased water consumption in and around Seattle by 24 percent while the region’s population grew by 11 percent. 4
b. Environmental Costs and Consequences of Reservoirs: Providing a clean and reliable
water supply is a topic foremost on the agendas of many southeastern communities, as well as communities across the United States. Growing populations, climate change, and water resource disputes are causing communities to consider how they can best continue to provide adequate potable water to current customers while providing for future needs. Among the available solutions, reservoirs, large and small, created by damming streams to capture and store water, are often the first choice of water utilities due to the apparent quick fix provided by the ease of creating a large amount of storage. Unfortunately, water supply reservoirs have significant negative environmental impacts on water quality and stream health and do not address the root problem of the need to use our limited water supply wisely. Adverse water quality impacts are well documented in the literature and include adverse effects on both the impounded areas and downstream reaches. The elimination of flow makes the impounded area unsuitable habitat for native fluvial species and the physical, chemical and biological health of the downstream reaches may be greatly impacted due to numerous changes, including the alteration of sediment regime, water and food transport downstream, increased temperature and nutrients and low dissolved oxygen. The following two citations contain recent studies conducted by two southeastern states (Tennessee and North Carolina) addressing water quality impacts from impoundments:
envhttp://www.tn.gov/environment/wpc/publications/pdf/isp_report.pdf Selected Bibliography – Stream Impoundment Perspectives, North Carolina
Division of Water Quality, June 2008).

4
Not only do reservoirs cause disruption to the water cycle for the watershed and river basin, but they can also actually increase water loss due to evaporation and be very expensive to build in comparison to implementing water conservation/efficiency measures. Estimates are that dams and reservoirs can cost up to 8,500 times more than water efficiency measures. According to a Georgia Environmental Protection Division March 2008 paper, dams and reservoirs can cost $4,000 per 1,000 gallons of capacity while water efficiency costs between $0.46 to $250 per 1,000 gallons saved or new capacity.5 The State of California’s Water Plan concluded that the largest single new water supply available to meet growth needs over the next 25 years will be water efficiency.6 Inefficient water usage also impacts air resources by increasing the need for energy production. It takes energy to pump water from the water source to the treatment facility, to treat water from wasteful uses such as leaks, inefficient outdoor irrigation, or water wasted at the tap as well as the energy it takes to pump the wastewater generated from inefficient water use back to a wastewater treatment plant. For example, energy use is can be reduced by such measures as the use of low flow shower heads which not only reduce water usage but can significantly reduce the amount of energy used for heating water. The increasing energy use at water and wastewater utilities has become a concern for EPA in our efforts to reduce greenhouse gas emissions. The EPA National Water Program Climate Change Response Actions Report7 considers water conservation/efficiency to be an important factor in its climate change goals. One of the largest sources of greenhouse gases are from emissions associated with the generation of electricity from coal fired power plants which can be significantly reduced with water efficiency/conservation measures.8 Additionally, increasing energy use without first considering approaches that are more energy efficient is contrary to the goals of the Energy Independence and Security Act. Increased energy use also indirectly impacts water quality because the power plants, which provide the additional energy necessary to accommodate inefficient water use, rely on our nation’s water supply to meet their cooling needs. Nearly half of the 410 billion gallons of water used per day by Americans in 2005 was for producing electricity at thermoelectric power plants.9 These are important considerations in evaluating the positive impacts of water efficiency measures and the many indirect environmental impacts of reservoir projects. EPA believes these concerns can be partially addressed by implementing water efficiency measures which reduce water supply needs resulting in reduced energy needs.
Implementation of the Guidelines. The Section 404 permit process requires a clearly stated project purpose, which for water supply reservoirs includes a projected demand analysis to support additional water capacity needs, and an analysis of alternatives. Before EPA considers a water supply reservoir as an alternative to address the need for additional water capacity, the water utility must take actions to ensure that, to the maximum extent practicable, they are implementing sustainable water management practices, including (1) Effective management,

5
(2) Pricing for Efficiency, (3) Efficient Water Use, and (4) Watershed Approaches. These four measures are designed to help an applicant eliminate the need for, or reduce the impacts to aquatic resources from future water facility expansions including the construction of water supply reservoirs. More information regarding these measures and their implementation can be found at: www.epa.gov/waterinfrastructure. These guidelines provide a discussion of water efficiency measures which represent a sustainable approach when developing water supply alternatives. Any applicant for a reservoir project will be expected to conduct an extensive analysis using this approach in developing their water demand projections and alternative analysis and provide a thorough discussion of reservoir needs after analysis of these measures.
1. Effective Management: Widespread adoption of better management practices offers great promise to reduce costs and direct system investments to ensuring existing infrastructure is sustainable for now and into the future. A critical element of the water demand projections and alternatives analysis is a description of how water utilities either are or will implement the following measures to ensure they are optimizing existing operations before determining future needs and sizing reservoirs.
a. A description of how the utility has or will implement water consumption reduction
goals: Water utilities should have a written plan which includes definitive and measurable water consumption reduction goals. The written plan can be incorporated in an existing plan such as a Water Use Plan or Environmental Management System, or can be in a separate document such as a Water Conservation Plan. The plan should also include how the municipality has incorporated or will incorporate the water efficiency measures contained in these guidelines.
b. Increase public understanding: Communities should equip individuals with
information about the cost of their water and the rate structure, their own water use patterns, and educate the public about smart, simple water efficiency solutions. The public should be made aware of the full-cost of operating, maintaining and upgrading the system so when rates are restructured, there is a basic understanding of how the rates are derived. An example of how to read a meter and check for leaks should be readily available for customers to ensure the customer can track their water use and check for leaks. Free audits can be provided to customers (both residential and commercial) to assess where the most cost effective and water efficient savings can be secured. Charlotte-Mecklenburg Utilities (Charlotte, North Carolina) was able to reduce consumption by 15.6 percent between 2003 and 2007 as a result of an integrated approach of education, incentives and community outreach programs focused on encouraging water efficiency.10
c. Involve water users in decisions: Opportunities for significant water savings can be
overlooked without the stakeholders at the table. Involving the water users encourages

6
higher rates of efficiency. The plan developed in 1.a. above should include a section on how the water utility will involve users in the decision-making process.
d. Use an Integrated Resource Management Approach: Utilities should recognize the interrelationships between water, wastewater, stormwater, and energy when planning and evaluating infrastructure needs and solutions by close collaboration between all water related departments and organizations. A gallon of water conserved is a gallon of wastewater not collected, treated, and disposed of, with energy savings from both water and wastewater processes. The cost benefits of water conservation are even greater when the wastewater cost benefits are also considered. Wastewater reuse can reduce drinking water demands and costs. An Integrated Resource Management approach to infrastructure needs and solutions often provides greater benefits at lower costs.
2. Pricing for Efficiency: Water should be priced to cover the full costs of operating and maintaining a water utility and to encourage efficiency. Water utilities should estimate the demand reductions from pricing water for efficiency before sizing a reservoir.
a. Full Cost Pricing: The flat service fee should cover all utility fixed costs, including pipe maintenance and pump substation operations. Water rates which reflect the full cost of service can help utilities capture the actual costs of operating water systems, raise revenues, and also help to conserve water.
b. Conservation Pricing: The fees should also reward water conservation. This can be accomplished with a tiered fee system which includes a flat fee for fixed costs and a variable fee for volume of water consumed, with significantly higher rates as water consumption increases. It has been found that a relatively small increase in price does not significantly affect usage, but that higher prices do affect usage. For this reason, rates need to be designed so that the price is sufficient to encourage conservation. Pricing water for efficiency can yield a 15 percent reduction in consumption for a fraction of a penny per gallon.11 A tiered pricing system adopted by Greensboro, North Carolina in 2000 was able to reduce average household consumption by 22 percent in seven years.12
3. Efficient Water Use: This measure is critical, particularly where communities are undergoing water shortages. Utilities need to create market incentives to encourage more efficient use of water and to protect our sources of water. The Alliance for Water Efficiency states that the most effective water efficiency measures for water utilities to implement are installing meters on unmetered customers and billing based on the quantity of water used. Some WaterSense statistics for estimated water savings with water saving fixtures are13:

7
Water Saving Fixture WaterSense Estimated Water Savings Toilets 4,000 gallons/year/toilet Urinals Between 1.0 and 4.5 gallons/flush Bathroom Faucets 500 gallons/year for average household Showerheads Up to 1.0 gallon/minute
a. Stop leaks: Over six billion gallons of water are lost each day in the U.S. due to aging
water distribution systems14. All utilities should have both a leak detection and abatement program and a program to determine unmetered users. Water loss should be reduced to as close to zero as possible. All systems should, at a minimum, achieve the accepted industry standard of no higher than 10 percent.15 Raleigh, North Carolina has an effective leak detection program that has been able to reduce leaks to 4.5 percent of their total water consumption.16
b. Meter all water users: Most multifamily and commercial buildings have a fixed water
rate which does not encourage conservation. The water utility should ensure water meters are installed on all new homes, on each unit of multi-family residential buildings, and on individual commercial stores so water users can measure, monitor and directly pay for their consumption. The Alliance for Water Efficiency has found that installing meters on unmetered customers to be one of the single most effective water conservation measure water utilities can implement. Their website describes many case studies where municipalities realized savings of 20 percent and higher by metering all users.17
c. Build smart for the future: Recognizing that 50 percent of the homes that will exist in
2030 have not yet been built, building codes and ordinances should be updated to support or require the use of the most water efficient technologies in both new construction and existing buildings. The water utility should collaborate with the local jurisdiction responsible for building codes to help adopt water efficient building standards for all new buildings in the community. This should include water efficient fixtures, gray water use, and water efficient landscape requirements. The water utility should structure rates to encourage water efficient buildings. For example, a reduced water rate for the first year that a water efficient home is occupied could encourage the construction of water efficient buildings.
d. Harvest rainwater for non-potable needs: The water utility should work with
appropriate community stakeholders to ensure all new construction (homes, commercial, industrial and institutional development, neighborhood development, etc.) incorporate standards and/or codes that require the capture and reuse of stormwater for non-potable purposes.

8
e. Retrofit all buildings: If all U.S. households installed water-efficient fixtures and appliances, the country would save more than 8.2 billion gallons per day18. This savings could supply all Southeast states with their entire public water supply needs and equals approximately 20 percent of the total U.S. public water supply19. The retrofit requirement could be tied to the resale of property, the establishment of a new water account, or with issuance of a construction permit. The water utility should work with the local jurisdiction to ensure buildings are retrofitted with water efficient fixtures (WaterSense toilets, faucets and showerheads). Other measures for replacement of old water inefficient fixtures are voluntary incentive programs that provide rebates or direct installation. San Antonio, Texas implemented numerous water efficiency efforts including a free toilet retrofit program that provides up to two low flow toilets per water customer, funded by a surcharge on high volume use water customers. Water use per person has declined by 25 percent since the late 1980’s. They have since expanded the program to include apartments, all schools (including colleges), 1200 restaurants and several hotels20.
f. Landscape to minimize water waste: On average U.S. homes consume 30 percent of
their water outdoors watering lawns, plants and trees21. Water utilities should separately meter large users of irrigation water and implement a pricing structure which encourages efficiency. Other measures should be the requirement of rain and moisture sensors for irrigation systems. Because the use of native and drought-tolerant plants and more efficient irrigation can produce significant water savings, water utilities should develop incentives to encourage their use in the landscape. Water utilities should work with planning and zoning departments to encourage “grass-free” residential development to demonstrate how creative use of native plantings and mulching can provide attractive, low maintenance yards that require no irrigation. An example is the Longleaf Subdivision at Callaway Gardens, Pine Mountain Georgia.22 Another example is Cary, North Carolina that was able to reduce per capita water use by 15 percent between 1996 and 2008 due mainly to an aggressive “WaterWise” landscape water efficiency program.23
4. Watershed Approaches: This measure requires taking a broader look at water resources in a coordinated way to reduce utility costs, improve source water quality, and enhance water supplies by increasing groundwater recharge and wetlands/floodplains restoration.
a. Develop Water Budgets on a Watershed Scale: Water budgets should provide: an evaluation of both the assimilative capacity under critical conditions and the
ecologically healthy flow for a river or stream, a determination of how much water can be sustainably withdrawn and still maintain
both the assimilative capacity and an ecologically healthy flow, and

9
an assessment of community priorities as to how the water source should be shared to address all users’ needs.
This option provides for an instream flow study which includes an assessment of the current volume and location of water withdrawn for potable and other uses, as well as, the volume, timing, quality, and location of water returned to the water body from current discharges; an assessment of the health of the water body (lake, stream, river, ground water) based on existing withdrawals and discharges flows; actions needed to maintain or restore the chemical, physical and biological integrity of the water body; and determining, through stakeholder participation, how to best achieve the needs of all the communities served by the water body. This could include options such as consolidating water systems, combining water efficiency programs, and implementing watershed based opportunities for supplementing the flow, such as ground water recharge, floodplain wetlands restoration, use of reclaimed wastewater, etc.
Note: Water efficiency “savings” would result in lower withdrawals and help to sustain healthy instream flows for ecological and community use.
b. Seek opportunities for wetland restoration: Restoring and preserving floodplain and formerly floodplain wetland acres for water storage is an environmental alternative to reservoirs (rainwater banking). The release of this banked water during dry periods would increase flows for water supplies, minimum flows for point source dischargers and for aquatic habitat.
c. Seek opportunities for groundwater recharge and storage: Encourage increased recharge to groundwater for rainwater banking by implementing Green Infrastructure practices such as permeable pavement on all utility construction projects. Groundwater can then be directly pumped back out for water supply or it will discharge to streams to increase flows for water supply, assimilative capacity, and the ecologically sustainable flow for a healthy river.
d. Reuse of treated wastewater: Encourage the reuse of treated wastewater for nonpotable
uses, such as irrigation, as an alternative to using potable water for these activities. Reusing treated wastewater has been shown to reduce potable water demand significantly in many communities and, in some communities, has been demonstrated to be a reliable and safe means to augment source water for potable water supply during drought periods. Treated wastewater is routinely reused for irrigation of golf courses, ball fields, parks, and residential/commercial lawns and landscaping. It is also used for evaporative chillers for commercial cooling systems, boiler makeup water for steam heating systems, and other commercial uses.

10
e. Graywater reuse: Allow the reuse of Graywater for commercial applications such as hotels, dormitories, apartment buildings, and residential applications. Some states either have or are developing guidelines for graywater reuse, such as Georgia Environmental Protection Division, which is presently finalizing the Georgia Graywater Reuse Guidelines to permit graywater to be used for toilet and urinal flushing.
f. Ensure source water is protected: All utilities should develop a source water
protection program to ensure the water supply source is protected for quality as well as quantity purposes. Using water efficiency practices to augment water supply needs makes it even more critical to protect the quality and quantity of the community’s water supply. In addition to traditional source water protection programs based on use zones and limiting development types for water quality, such a program should include protection of the quantity of the source water through aquifer recharge protection and restoration as well as restoration of wetlands as rainwater banking. Stream buffers resulting from the restoration/enhancement or preservation of wetland and floodplain areas also provide water quality protection benefits. Even if already required by state regulations, a utility should review the existing source water protection program to ensure it provides for protection of the quality of the source water as well as protection of quantity of water coming from upstream, ground water recharge, wetlands, and other sources such as green infrastructure.
Additional information, including examples where implementation of water efficiency measures by water utilities in the Southeast and other parts of the country have achieved significant water use savings, can be obtained from EPA’s WaterSense program’s website at www.epa.gov/watersense/tips/index.htm and the reference section of these guidelines. As an example, the American Rivers paper (Hidden Reservoir, October 2008)24 applied these water efficiency principles to four water systems in the Southeast using calculations which illustrate the potential water savings from applying these water efficiency measures. EPA’s WaterSense program provides a water efficiency case study publication (http://www.epa.gov/watersense/docs/utilityconservation_508.pdf ) with examples of water efficiency practices enacted by different municipalities and the water savings realized by these communities. It is EPA Region 4’s intent to apply these guidelines in the following manner:
I) Review of Environmental Impact Statements, Environmental Assessments and in both the pre application discussions for 404 Permit applications and the 404 permit applications. These documents should show that the water efficiency measures in these Guidelines have been evaluated in the proposed project’s water demand projections for purpose and need and in the alternatives analysis for reservoir projects.

11
II) Encourage State 401 reviewers to ensure the recommendations under the Water Efficiency Guidelines have been evaluated in analyzing alternatives to reservoirs.
III) Encourage states to ensure stormwater permits incorporate the above recommendations to restore urban watershed stream hydrographs to (or near) the natural hydrograph that existed before urbanization. These could include:
1) Incorporating wetland restoration and groundwater recharge goals or performance
standards into stormwater permits to mitigate for impervious surfaces. 2) Incorporating rainwater capture and reuse goals or performance standards into
stormwater permits.
IV) Encourage siting of mitigation banks in water supply watersheds to store rainwater and supplement stream flows.
These guidelines were developed to address both the increasing water demand issues and the large environmental consequences to stream and wetlands associated with reservoir construction and other water supply projects. It is expected that any entity (public or private) pursuing a water supply project will comply with these guidelines and complete the attached Water Efficiency checklist during the planning process.

12
References
1. Kenny, J.F., Barber, N.L., Hutson, S.S., Linsey, K.S., Lovelace, J.K., and Maupin, M.A., 2009, Estimated Use of Water in the United States in 2005, U.S. Geological Survey Circular 1344, 52 p.
2. Ibid.
3. U.S. Environmental Protection Agency WaterSense website. www.epa.gov/watersense.
4. Ibid.
5. Georgia Water Use and Conservation Profiles, Georgia Department of Natural Resources Environmental Protection Division and CH2MHill, March 2008.
6. California State Water Plan website. www.waterplan.water.ca.gov.
7. U.S. Environmental Protection Agency. National Water Program Strategy: Response to Climate Change. September 2008. http://www.epa.gov/ow/climatechange/strategy.html
8. Ibid.
9. Kenny, J.F., Barber, N.L., Hutson, S.S., Linsey, K.S., Lovelace, J.K., and Maupin, M.A., 2009, Estimated Use of Water in the United States in 2005, U.S. Geological Survey Circular 1344, 52 p.
10. Simpson, Vic. Charlotte-Mecklenburg Utilities. Email Communication to American Rivers. September 15, 2008.
11. Southwest Florida Water Management District. Water Rates: Conserving Water and Protecting Revenues, 2005.
12. Williams, Kristine. Email communication to American Rivers. September 12, 2008.
13. U.S. Environmental Protection Agency WaterSense website. www.epa.gov/watersense.
14. Wayne B. Solley, Robert R. Pierce and Howard A. Perlman, Estimated Use of Water in the United States in 1995.
15. U.S. Environmental Protection Agency WaterSense website. www.epa.gov/watersense.

13
16. Buchan, Ed. Email communication with American Rivers, September 18, 2008.
17. Alliance for Water Efficiency website. www.allianceforwaterefficiency.org/metering.
18. U.S. Environmental Protection Agency WaterSense website. www.epa.gov/watersense.
19. U.S. Geological Survey. Estimated Use of Water in the United States in 2000.
20. U.S. Environmental Protection Agency WaterSense website. www.epa.gov/watersense.
21. Wayne B. Solley, Robert R. Pierce and Howard A. Perlman. Estimated Use of Water in the United States in 1995.
22. Freeman, Bob, U.S. Environmental Protection Agency, Region 4, Sustainable Infrastructure and Decentralized Wastewater Systems, Personal Communication, November 12, 2009.
23. Town of Cary, North Carolina. Water Conservation Incentive Programs. www.townofcary.org/depts/pwdept/water/waterconservation/incentiveprograms.htm.
24. American Rivers. Hidden Reservoir: Why Water Efficiency is the Best Solution for the Southeast. October 2008.

14
Water Efficiency Evaluation Checklist
Sustainable Water
Management Practice
Strategy
Strategy Minimums
(* indicates SRF loan funds are available for these purposes)
Strategy
Met (Yes/No)
Estimated Demand
Reductions
(1) Better Management
(a) Develop Water Consumption Reduction Goals
Must have: reduction goals, discussion of water efficiency measures that will be implemented to meet the goals, schedule for meeting the goals, and a method to track progress. (Complete before application.)
NA
(b) Increase public understanding
Must have a public awareness program that consists of more than just inserts in the monthly bill. (Complete before application.)
NA
(c) Involve water users in decisions
Must have a written policy of how water users will be involved in decision-making process. This policy should include how users’ comments/concerns will be addressed. (Complete before application.)
NA
(2) Pricing for Efficiency
(a) Full Price costing
(b) Conservation pricing
Must demonstrate that the full cost of operating, maintaining and improving the system is accounted for in the rate structure. (Complete before application.) Must have a rate structure that encourages water conservation. (Complete before

15
Sustainable Water
Management Practice
Strategy
Strategy Minimums
(* indicates SRF loan funds are available for these purposes)
Strategy
Met (Yes/No)
Estimated Demand
Reductions
application.)
(3) Efficient Water Use
(a) Stop leaks Must have an active leak detection and correction program which demonstrates progress in reducing water loss. (Complete before application.) *
(b) Meter all water users
Must have a program for metering individual users such as multi-family residential units and individual commercial operations. (Complete during process)*
(c) Build smart for the future
Must have requirements for new buildings and new landscapes to be water efficient (WaterSense fixtures and irrigation systems). (complete during process) If above is not feasible, must have a strong incentive program (such as rate reductions) to encourage new buildings and new landscapes are water efficient (WaterSense fixtures and irrigation systems). (Complete during process)*
(d) Harvest rainwater for nonpotable use
Must have strong incentives for rainwater harvesting for new and existing facilities. (Complete during process)*

16
Sustainable Water
Management Practice
Strategy
Strategy Minimums
(* indicates SRF loan funds are available for these purposes)
Strategy
Met (Yes/No)
Estimated Demand
Reductions
(e) Retrofit all buildings
Should have at least one program which provides ordinance or incentives for retrofits of existing buildings. (complete during process)*
(f) Landscape to minimize water waste
Should have at least one program which provides incentives for minimizing irrigation needs for existing landscapes. (Complete during process)*
(4) Watershed Approaches
(a) Develop Water Budget/Instream Flow Study
Should conduct an instream flow study for any water body proposed for reservoir impacts. (Complete before application.)
NA
(b) Seek opportunities for wetlands restoration
NA
(c) Seek opportunities for ground water recharge
NA
(d) Evaluate opportunities for use of treated
Should provide information on the availability of reclaimed wastewater, the cost-benefit of using treated wastewater in lieu of potable water for appropriate uses such as irrigation and

17
Sustainable Water
Management Practice
Strategy
Strategy Minimums
(* indicates SRF loan funds are available for these purposes)
Strategy
Met (Yes/No)
Estimated Demand
Reductions
wastewater recharge where it is available, and any area-wide studies on the potential for developing reclaimed wastewater. If the water utility also owns and operates the wastewater utility, an area-wide study on the potential use should be initiated.
(e) Evaluate opportunities for use of treated graywater
Should provide information on any state restrictions to reuse of graywater. If no statewide restrictions exist, local barriers to graywater reuse should be investigated and guidelines should be developed to allow reuse of treated graywater in appropriate situations.
(f) Ensure the source water is protected
Should have a source water protection plan in place. An additional plan should be developed for any sources under development
NA
Summary Total estimated demand reduction.
Should provide an accounting of the estimated demand reduction with and without the implementation of the WE measures.
.


SOUTHEAST MISSISSIPPI REGIONAL WATER SUPPLY PROJECT APPLICATION
IN RESPONSE TO ENVIRONMENTAL PROTECTION AGENCY REGION IV GUIDELINES ON WATER EFFICIENCY MEASURES FOR WATER SUPPLY
PROJECTS IN THE SOUTHEAST UNITED STATES
PREPARED FOR:
USEPA REGION IV 61 FORSYTH STREET
ATLANTA, GEORGIA 30303-8960
PREPARED BY:
PICKERING FIRM, INC. 2001 AIRPORT ROAD, SUITE 201 FLOWOOD, MISSISSIPPI 39232
NOVEMBER 21, 2012
PICKERING PROJECT NO. 23282.02

i
TABLE OF CONTENTS
Page 1.0 APPLICANTS .............................................................................................................. 1 2.0 MISSISSIPPI PROJECT AUTHORITY ........................................................................ 1 3.0 PROJECT LOCATION ................................................................................................ 2 4.0 PROJECT SUMMARY ................................................................................................ 4 5.0 WATER STORAGE AND SUPPLY OVERVIEW ......................................................... 6 6.0 REGIONAL WATER SUPPLIES – STATUS AND TRENDS ....................................... 8 6.1 Surface Water ..................................................................................................... 9 6.1.1 Instream Flow ........................................................................................ 11 6.1.2 Surface Water Status – Water Budget ................................................. 13 6.1.3 Trends – Climate Variability ................................................................. 18 6.2 Groundwater Overview..................................................................................... 21 7.0 Projected Water Demands ....................................................................................... 24 7.1 Jackson County Port Authority ....................................................................... 25 7.1.1 JCPA-Jackson County Industrial Water System ................................. 26 7.1.2 2002 Flow Augmentation Agreement – Okatibbee Reservoir ............ 28 7.2 Jackson County Utility Authority-Eastern Jackson County Regional Water
System ............................................................................................................... 29 7.2.1 Gulf Coast Region Water and Wastewater Plan .................................. 30 7.2.2 Proposed and Pending W23 Water Infrastructure .............................. 32 8.0 Summary-2065 Regional Water Needs ................................................................... 34 9.0 Alternatives .............................................................................................................. 35 9.1 No Action .......................................................................................................... 35 9.2 Water Efficiency and Conservation ................................................................. 36 9.2.1 Jackson County Port Authority-Jackson County Industrial Water System ........................................................................................ 36 9.2.2 Jackson County Utility Authority-Eastern Jackson County Regional Water (W23)System .............................................................................. 38 9.3 Modified Flow Augmentation Agreement – Okatibbee Reservoir ................. 38

ii
TABLE OF CONTENTS (Continued)
9.4 New Water Supply Reservoir ........................................................................... 39 9.5 Desalinization Plant .......................................................................................... 41 10.0 LEAST ENVIRONMENTALLY DAMAGING PRACTICABLE ALTERNATIVE .......... 42 11.0 REFERENCES .......................................................................................................... 44 12.0 APPENDIX ................................................................................................................ 47 TABLES Table 1 Pascagoula Basin Public Reservoirs Larger than 100 Acres .......................... 6 Table 2 USGS Stream Gauges and Established 7Q10 in the Project Study Area ...... 16 Table 3 Large Surface Water Withdrawal Permits within the Project Area ................ 16 Table 4 JCIWS Expansion/Improvement History ......................................................... 26 Table 5 Release Volumes and Costs for Agreement (PHWD and JCPA Agreement 2003) ............................................................................................... 29 Table 6 W23 Population Projections............................................................................. 31 Table 7 W23 Historical and Projected Total Water Demand ....................................... 31 Table 8 JCUA Water Rates (per gallon) ........................................................................ 40 Table 9 Price Estimates for Desalinization Plant ......................................................... 41 Table 10 Environmental Impact Matrix ........................................................................... 43 FIGURES Figure 1 Pascagoula River Basin ..................................................................................... 3 Figure 2 Jackson County Port Authority - Industrial Water System .............................. 4 Figure 3 Water Resources Map of the Pascagoula River Basin ................................... 10 Figure 4 Major Land Cover in the Pascagoula River Basin (MARIS) ........................... 14 Figure 5 Water Budget Representing the Project Area ................................................. 15 Figure 6 MDEQ Permitted Pascagoula River Basin Surface Water Withdrawals / Discharges ................................................................................ 17 Figure 7 Pascagoula River Flow for One Year with P-E and Predicated Climate ....... 19 Figure 8 Pascagoula River Flow for One Year with P-E and Without Climate Change ................................................................................................ 19 Figure 9 Monthly Mean Discharge at Merrill .................................................................. 20 Figure 10 Geological Units of Study Area ....................................................................... 22 Figure 11 Example of Delta Front Sand Deposition ........................................................ 23 Figure 12 Geologic Cross-Section of George County .................................................... 24 Figure 13 JCPO Industrial Water System Treatment Facility ......................................... 27 Figure 14 Minimum Discharges for Water Years 1930-2000 along the Pascagoula River ....................................................................................... 29 Figure 15 JCUA Current and Proposed Water Supply Infrastructure (W23) ................. 33

iii
TABLE OF CONTENTS (Continued)
PHOTOS Photo 1 View of Record Low Flow at Merrill Bridge on the Pascagoula River ........... 28

1
SOUTHEAST MISSISSIPPI REGIONAL WATER SUPPLY PROJECT APPLICATION IN RESPONSE TO
ENVIRONMENTAL PROTECTION AGENCY REGION 4’S
GUIDELINES ON WATER EFFICIENCY MEASURES FOR WATER SUPPLY PROJECTS IN
THE SOUTHEAST UNITED STATES
November 21, 2012
NOTE: This application was prepared based on a good faith interpretation of EPA Region 4’s Guidelines on Water Efficiency Measures for Water Supply Projects in the Southeastern United States (June 21, 2010). The applicant’s representative met with the assigned Region 4 Project Manager on September 26, 2011. The meeting dealt extensively with Region 4’s expectations of the range of alternatives and water efficiency and conservation measures to analyze and Region 4’s threshold to overcome BEFORE proceeding with any detailed analysis of a water supply reservoir (e.g. site specific instream flow study or water budget). Applicants were unable to obtain any substantive guidance on Region 4’s expectations for the application’s contents, review process or if Region 4 would take formal or informal agency action on this application. Accordingly, the applicants plan to proceed in a responsible manner on the project while awaiting Region 4’s comments on this application. 1.0 Applicants This application is submitted jointly by the project’s current two local sponsors: the George County, Mississippi Board of Supervisors and the Pat Harrison Waterway District. Neither applicant is a water utility or anticipates becoming a water utility. One or possibly more additional applicants may be added to the project as it proceeds to address project funding and operation and maintenance responsibilities. 2.0 Mississippi Project Authority The Pat Harrison Waterway District (PHWD) is a Mississippi State Agency authorized “[t]o impound overflow water and the surface water of any streams in the [Pascagoula Basin], at the place or places and in the amount as may be approved by the [Mississippi Department of Environmental Quality] Office of Land and Water Resources of the State of Mississippi, by the construction of a dam or dams, reservoir or reservoirs, work or works, plants and any other necessary or useful related facilities . . ., to control, store, and preserve these waters, and to use, distribute, and sell them, to construct or otherwise acquire within the project area all works, plants or other facilities necessary or useful to the project for processing the water and transporting it to cities and other facilities necessary or useful . . . for the purpose of processing the water and transporting it to cities and other facilities for domestic, municipal, commercial, industrial, agricultural and manufacturing purposes . . .” (Miss. Code Ann. § 51-15-119(1)(b)). In 2010 Mississippi’s Legislature authorized the PHWD “to construct a lake and related structures and facilities in George County, Mississippi” (House Bill No. 1351; codified at Miss. Code Ann. § 51-15-119(1)(bb)).

2
3.0 Project Location This project addresses long-term surface water supplies reliability on a watershed scale in the Pascagoula River Basin Hydrologic Unity Code (HUC) 031700 (Figure 1). The Pascagoula River and its tributaries which include eight (8) sub-basins combine to form Mississippi’s second largest river basin covering an area of roughly 9,700 square miles. The Pascagoula’s main stem is formed by the confluence of the Leaf and Chickasawhay Rivers just north of the Merrill Bridge at river mile (RM) 84. The River’s largest water withdrawal and this project’s focus is at the Cumbest Bluff intake structure at RM 25.4. Originally issued in 1962, in 1996 Mississippi’s Department of Environmental Quality (MDEQ) reissued the Jackson County Port Authority (JCPA) a permit to withdraw up to 100 million gallons a day (mgd) of surface water day from the Pascagoula River at Cumbest Bluff for transportation approximately twenty-five (25) miles downstream by a pipeline for treatment and distribution to various industries located on Bayou Casotte (Figure 2). The industries use this water for assorted industrial processes and depend on this water for fire fighting in the event of an industrial fire. The Jackson County Utility Authority (JCUA) is finalizing funding and permits to construct a 1 mgd surface water treatment plant and seeking a MDEQ permit to withdraw 1 mgd from Cumbest Bluff for public water supply for the Eastern Jackson County Regional Water System (see Figure 15). The project’s geographic scope is necessary for a comprehensive watershed approach to encompass surface water availability (minimum stream flows) and the location and design of existing and pending water treatment, supply and delivery infrastructure.

3
Figure 1- Pascagoula River Basin

4
Figure 2 – Jackson County Port Authority - Industrial Water System 4.0 Project Summary During periodic droughts, MDEQ has faced the need to temporarily suspend or revoke the JCPA’s water withdrawal permit at Cumbest Bluff. Droughts and extremely low flows as recent as the 2000 water year and 2011 raised serious concerns that MDEQ might have to suspend the JCPA’s withdrawal permit until the River exceeded its established minimum stream flow level of 917 cubic feet per second (cfs) at the USGS Merrill Stream Gauge. Without water, the JCPA’s industrial customers would have to shut down and would also lack emergency water supplies for fire fighting. Even a temporary closure of Chevron’s Pascagoula Refinery would have documentable catastrophic impacts on national security and the national economy. In addition, Chevron and the JCPA’s other industrial water customers are major regional employers and account for approximately 33% of jobs in the City of Pascagoula alone (City of Pascagoula 2010). These industries include Chevron’s Pascagoula Refinery which had the 9th largest refining capacity of any refinery in the United States (United States Energy Information Administration. 2012). In January 2011, Chevron announced a $1.4 Billion expansion of the Pascagoula Refinery to produce base oil which is the main ingredient of premium motor oils. At capacity, the Pascagoula refinery can handle 330,000 barrels of crude oil thus producing gasoline, jet fuel and diesel (Nelson 2011). As another example of the dynamic economic activities by the JCPA’s industrial customers, on November 5, 2012, Ingalls Shipbuilding announced plans to hire more than 5,000 new workers over the next two years (Mississippi Business Journal 2012). Similarly, future droughts would threaten the JCUA’s ability to withdraw surface water for public drinking water. As documented below, climate change and variability studies predict that the Southeastern United States, the Mississippi Gulf Coast and southeast Mississippi will likely

5
experience increases in drought frequency, duration and severity over the next fifty (50) plus years.
This proactive project will identify and implement a multi-decadal (50-year) solution to ensure an absolutely reliable regional water supply solution for the JCPA’s industrial customers to serve critical National energy needs and support southeast Mississippi’s economy and meet the JCUA’s public water supply needs in W-23. As such, this project is inextricably interconnected with regional climate change or variability predictions. The Environmental Protection Agency’s (EPA) 2008 National Water Program Strategy Response to Climate Change (USEPA 2008) and the 2012 National Water Program Strategy Draft for Public Comment (USEPA 2012) recognize that climate change may require water resource managers to adapt to more water (increased precipitation and storm intensity) or less water (increased frequency and duration of droughts) and temperature change. The 2008 Report explicitly recognized that these changes could cause increased demands on water infrastructure and capital expenditures. To meet these challenges the process used to predict future water demand and availability is critical.
This project and project approach are consistent with the EPA’s National Water Program Strategy Response to Climate Change (USEPA 2008) which found that regardless of the actual impact of climate change or variability, “[r]ecognition of the increased frequency of extreme water events is important to water program managers . . . . Perhaps most important, local water infrastructure managers need to adapt emergency plans to reflect the most extreme water events (at p. 36, emphasis added). Much like EPA Region 4’s Guidelines, the 2008 Report found that, “[f]rom this more holistic perspective, managing stormwater, protecting wetlands, building water infrastructure, and sustaining drinking water supply all support an overarching goal of making an aquatic system more sustainable and resilient to the stresses of a changing climate (id, emphasis added).
While EPA’s 2012 Report fails to explicitly discuss industrial water supply infrastructure this project fully incorporates its ten (10) principles for a climate ready water supply project:
1. Integrated Water Resources Management (includes collaboration between governments, agencies and water sectors to manage water quality and quantity on a watershed basis.
2. Adaptive Management (recognizes the uncertainty of predicting future drought frequency, duration and severity and future industrial water demand projections).
3. Collaborative Learning and Capacity Development (builds on existing collaborative inter-agency and federal-state efforts to provide supplemental water to maintain the Lower Pascagoula River’s established minimum stream flows to ensure continuation of permitted industrial water withdrawals during droughts).
4. Long Term Planning (i.e., multi-decadal time horizon) (project has a fifty (50) year water demand/supply planning horizon).
5. Water-Energy Nexus (incorporates water efficiency and conservation measures into the plan as practicable).
6. Systems & Portfolio Approach (explicitly recognize the multiple and diverse benefits of an integrated and resilient solution that accommodates the inter-relationships between environmental, public health, social and economic aspects of climate change and its impact on minimum stream flows and water supply).
7. Cost of Inaction (the project applicants assert that inaction is not an option for the Lower Pascagoula River).
8. Environmental Justice (the industries that depend on a reliable water supply largely drive the regional economy and directly provide numerous low and moderate income jobs which indirectly support many more low and moderate jobs).

6
9. Performance Evaluation (regardless of which alternative is identified as the “least environmentally damaging practicable alternative”, the project will have multiple performance criteria to maximize direct and indirect benefits and minimize unavoidable adverse impacts).
10. Mainstreaming Climate Change into Core Programs (stakeholders in Southeast Mississippi have actively pursued long-term regional solutions to maintain the Pascagoula’s minimum stream flow and ensure industrial water supplies during droughts since the 1960’s).
5.0 Water Storage and Supply Overview
Unlike all other states in the Southeast, Mississippi has very few reservoirs that were designed, permitted and are operated and maintained for water supply (See University of Georgia 2002). State-wide, Mississippi has only three (3) public water supply reservoirs: 1) Ross Barnet Reservoir (33,000 acres) for the Jackson metropolitan area; 2) Bonita #2 (3,000 acre-feet of storage) for the City of Meridian; and 3) Whites Creek #1 (1,800 acre-feet of storage) for the City of Eupora. Mississippi has seven (7) private industrial water supply reservoirs: 1) Lake Hico (cooling water for Entergy’s Jackson Plant); 2) SeverCorr Pond #1 (Lowndes County); 3) SeverCorr #2 (Lowndes County); 4) Black Creek Reservoir (cooling water for Mississippi Power Company’s Plant Daniel in Jackson County); 5) Delta Stream Electric Station Dam (cooling water for Entergy in Bolivar County); 6) Make Up Water Pond (supplies Entergy in Attala County); and 7) South Mississippi Electric Power Association Dam (Lamar County) (MDEQ 2012).
In Southeast Mississippi, the Pascagoula River is widely known as the largest free flowing rivers in the continental United States. While the mainstream Pascagoula River is free flowing MDEQ cites EPA’s First River Reach File as listing 1680 lakes and ponds on the basin’s tributaries (MDEQ 2001) (Table 1).
Waterbody Watershed Agency Surface Acres 1 Okatibbee Reservoir Chunky-Oktibbee Corps 3,800 2 Bogue Homa Lower Leaf DWFP 1,200 3 Flint Creek Black-Red PHWD 600 4 Little Black Creek Black-Red PHWD 600 5 Archusa Creek Upper Chickasawhay PHWD 450 6 Maynor Creek Lower Chickasawhay PHWD 450 7 Turkey Creek Chunky-Okatibbee PHWD 250 8 Big Creek Lower Leaf PHWD 150 9 Dry Creek Upper Leaf PHWD 150
10 Lake Perry Lower Leaf DWFP 125
Table 1 - Pascagoula Basin Public Reservoirs Larger than 100 Acres
In addition, MDEQ classifies only three (3) Pascagoula Basin reservoirs as public water supply or public water supply and recreation for Clean Water Act Water Quality Standards for designated uses (MDEQ 2012a). Long Creek Reservoir in Lauderdale County was omitted from the list above, but has a normal storage capacity of 2,800 acre feet of water. MDEQ classifies Flint Creek Reservoir and Okatibbee Reservoir as both public water supply and recreation.

7
Okatibbee Reservoir is the Basin’s largest reservoir by far with a surface area of 6,580 acres at its maximum flood control pool of 352 feet, and 1,280 acres at its minimum operating pool of 328 feet. However, Okatibbee Reservoir was authorized in 1962 to provide, “flood protection on the Chunky Creek, Chickasawhay and Pascagoula Rivers . . . substantially in accordance with the recommendations of the Chief of Engineers in House Document Numbered 549, Eighty-seventh Congress. . .”. (Pub.Law 87-874, October 23, 1962). Sometime after its construction the PHWD obtained rights to a portion of the Reservoir’s water storage capacity for water supply (See PHWD and JCPA 2003). Nonetheless, Okatibbee Reservoir was designed and is managed by the U.S. Army Corps of Engineers primarily as a flood control reservoir with water supply as a secondary consideration. So, the Pascagoula River Basin’s limited water storage capacity is a secondary consideration in how those reservoirs are managed. This is necessary to examine how permitted water withdrawals from the Pascagoula River are treated under unregulated, essentially natural flow regimes. Mississippi’s water law prohibits the withdrawal of surface water from a river or stream when its flow falls below an established minimum flow rate (Miss. Code Ann. § 51-3-7(2)). That minimum flow “is the average streamflow rate over seven (7) consecutive days that may be expected to be reached as an annual minimum no more frequently than one (1) year in ten (10) years (7Q10)” (Miss. Code Ann. § 51-3-3(i)). If a river or stream’s flow falls below its established minimum flow, MDEQ’s Permit Board is required to revoke a withdrawal permit if and when the relevant river or stream falls below its established minimum flow rate (Miss. Code Ann. § 51-3-15(2)(d)). The one exception to this requirement is if the water withdrawn is discharged in essentially the same quality and quantity in the same watershed (Miss. Code Ann. § 51.3-7(2)). In the Lower Pascagoula River, MDEQ issued the JCPA a permit to withdraw up to 100 million gallons a day (mgd) of surface water from the Pascagoula River at Cumbest Bluff (river mile 25.4) for industrial uses (MS-SW-00121, issued January 9, 1996). The JCPA pipes this approximately 25 miles downstream for use by multiple industries located primarily at Bayou Casotte. This water is then treated and discharge into the Mississippi Sound. In 2012, the JCUA applied to MDEQ for a 1 mgd withdrawal permit from Cumbest Bluff for potable water for Eastern Jackson County Regional Water System. No waste water from this regional water system would be discharged back into the Pascagoula River. In conjunction with the withdrawal permit, MDEQ set a 7Q10 of 1030 cubic feet per second (cfs) for the Pascagoula River at Cumbest Bluff and an upstream flow of 917 cfs at the USGS’s Merrill stream gage (MDEQ 1995; USGS 1992). Since neither the JCPA nor the JCUA would provide return flows into the Pascagoula River, both permits are subject to suspension or revocation when the flow at the USGS Merrill stream gage falls below 917 cfs. The Pascagoula has suffered severe and prolonged droughts in 1999, 2000 and most recently in 2011. To summarize the extent of the major in 2000 drought, “minimum daily discharges computed for 19 of 21 gages during the 2000 water year were less than the published 7Q10 discharges, and 16 of 21 gages in the Pascagoula River Basin had computed minimum daily discharges that were lowest for the period of record. Notably, 3 of the 5 gages in the basin that did not set new low flow records are affected by the flow regulation from the Okatibbee Reservoir” (Turnipseed and Baldwin 2001 at page 190).
As discussed in Section 7.1, the JCPA realized that droughts threaten their Cumbest Bluff withdrawal permit and adversely impact the Pascagoula River’s aquatic ecosystem. In 2000, the JCPA, PHWD and MDEQ negotiated emergency water releases from the Okatibbee Reservoir to maintain flows above 917 cfs at the USGS Merrill Stream Gauge in the summer and fall. Subsequently, the parties recognized that supplemental flows in the Pascagoula would

8
have environmental benefits and benefit Jackson County’s citizens, businesses and industries in 2003 the JCPA, with the support of MDEQ, contracted with the PHWD to purchase up to 4,000,000,000 gallons of water from Okatibbee Reservoir to augment the Pascagoula River’s natural flows to maintain or exceed 917 cfs at the USGS Merrill Stream Gauge during future droughts (PHWD and JCPA 2003).
Projections about specific regional impacts of climate change or variability vary and are speculative. Perhaps the best summary is, that climate change should not be counted on to solve the Southeast’s [United States] water woes and is, in fact, as likely to make matters worse as it is better.” (Seager et al. 2009 at page 5043). Thus, the Southeast Mississippi Regional Water Supply project is more critical now than at any time since a reliable water supply was first explored in the 1960’s. The JCPA’s Water Augmentation Contract narrowly allowed industrial water supplies to continue in 2000. Supplies were threatened again by the 2011 drought and climate change or variability studies predict more frequent, longer droughts with higher temperatures and evaporation rates in the future. The EPA (2008) stated that, “[r]ecognition of the increased frequency of extreme water events is important to water program managers . . . . Perhaps most important, local water infrastructure managers need to adapt emergency plans to reflect the most extreme water events (at page 36, emphasis added). Much like EPA Region 4’s Guidelines on Water Efficiency Measures for Water Supply Projects in the Southeast (June 21, 2010), EPA’s 2008 Report found that, “[f]rom this more holistic perspective, managing stormwater, protecting wetlands, building water infrastructure, and sustaining drinking water supply all support an overarching goal of making an aquatic system more sustainable and resilient to the stresses of a changing climate (id, emphasis added). Finally, the Report recognizes that climate change could result in increased demands on water infrastructure systems including capital expenditures to adapt to more water (increased precipitation and storm intensity) or less water (increased frequency and duration of droughts) as well as temperature change (id at page. 47). 6.0 Regional Water Supplies-Status and Trends Generally the Pascagoula River provides an abundance of surface water. On average, each year approximately 4 trillion gallons of water flows down the Pascagoula River into the Mississippi Sound at an average rate of roughly 16,000 cfs or 10,000,000 mgd (USGS 1965). In years with normal precipitation, the Pascagoula River’s flows are more than sufficient to meet permitted withdrawals now and into the foreseeable future even during normal periods of reduced flow during the late summer and early fall. However Pascagoula River’s surface water situation changes dramatically during droughts when flows at the USGS Merrill stream gage hover at or below the 7Q10 of 917 cfs. The Pascagoula River’s periodic droughts threaten existing water withdrawals and the industries and jobs that depend on a consistent, reliable daily water supply. Similarly, future surface water supply needs are evaluated on a worst case scenario of the potential impacts of global climate change or variability on the frequency, duration and severity of future droughts. For groundwater, MDEQ reported that there is ample groundwater at present pumping rates in the Lower Pascagoula’s aquifers for the foreseeable future. However, as especially relevant to this project, “[a]n individual sand [aquifer] may be more than one hundred feet thick in some places, but thin or nonexistent in other areas. These sands (aquifers) tend to disappear in the eastern part of Jackson County (MDEQ 2000). Below, Sections 6.1 and 6.2 discuss the Lower Pascagoula’s surface water resources and groundwater availability and uses in more detail.

9
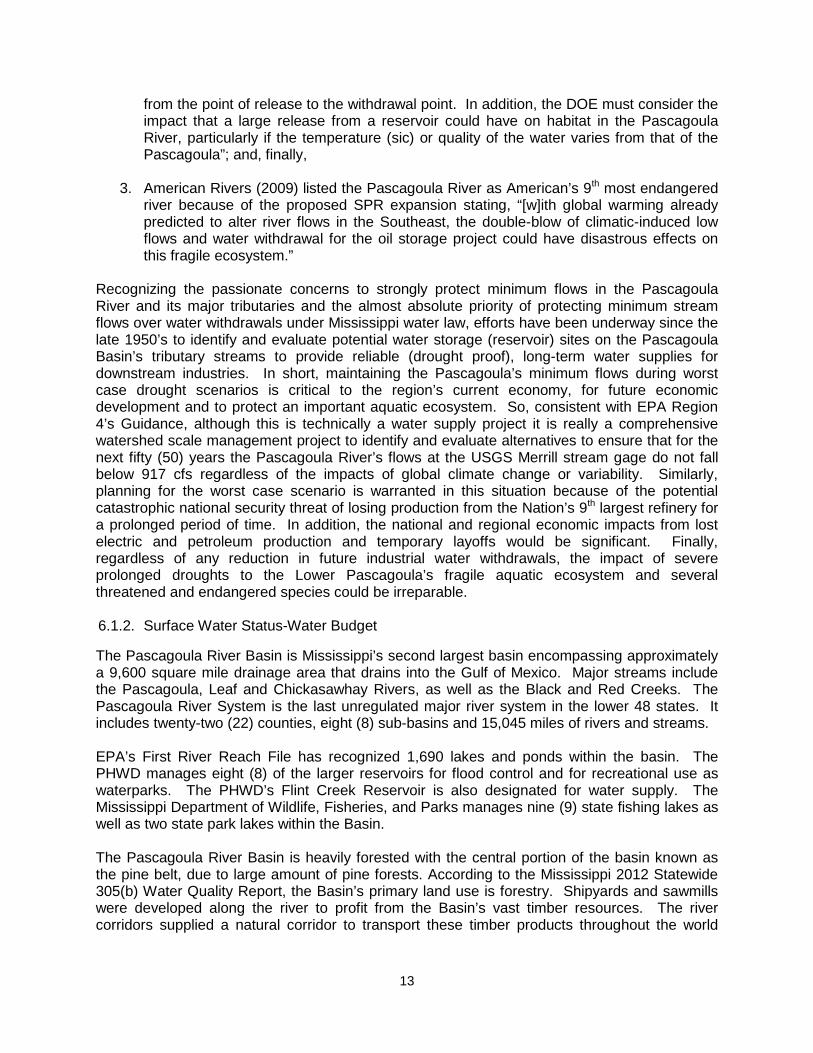
6.1. Surface Water In a normal year the Pascagoula River has ample water to easily meet environmental instream flow needs and its permitted water withdrawals now and into the future. As per EPA Region 4’s Guidelines, Section 6.1.1 discusses the Lower Pascagoula’s instream flow. This watershed scale discussion continues in Section 6.1.2’s assessment of the project area’s surface water budget. Finally, to project future surface water availability, Section 6.1.3 applies projected changes in precipitation and evapotranspiration rates from climate change or variability to fifty (50) years of measured, historic precipitation and stream flow data to project the frequency, severity and duration of droughts on the Lower Pascagoula River through 2065. These projections show an increase in the frequency, severity and duration of droughts on the Lower Pascagoula River that will threaten the River’s vaunted aquatic ecosystem, disrupt its unique estuarine environment and threaten permitted water withdrawals regardless of their volume or any voluntary reductions in demand from water efficiency or water conservation measures.

10
Figure 3 - Water Resources Map of the Pascagoula River Basin.

11
6.1.1. Instream Flow
The quality and quantity of stream flow on the Lower Pascagoula River has and will continue to vary greatly depending on time and place. Water resources management and development in Pascagoula Watershed has to account for these projected variations. Predicting the frequency, severity and duration of low flow events is especially critical to comply with Mississippi’s water law which prohibits surface water withdrawals from a river or stream when its flow falls below an established minimum flow rate (Miss. Code Ann. § 51-3-7(2)). That minimum stream flow “is the average streamflow rate over seven (7) consecutive days that may be expected to be reached as an annual minimum no more frequently than one (1) year in ten (10) years (7Q10)” (Miss. Code Ann. § 51-3-3(i)). The MDEQ has established a minimum flow on the Lower Pascagoula of 917 cfs at the USGS Merrill Stream Gauge which is upstream of the major industrial water withdrawals at Cumbest Bluff (USGS 1992). However, MDEQ recognized the need to reevaluate the JCPA’s 100 mgd withdrawal permit in 1996 and contracted with Harza Engineering to study and model the impact of 0, 25 and 100 mgd withdrawals from Cumbest Bluff on flow characteristics and upstream migration of a salt water wedge on the Lower Pascagoula River (MDEQ 1995). Based on the results of this study, MDEQ set a 7Q10 of 1,030 cfs at the JCUA’s Cumbest Bluff intake structure (MDEQ 1998). The EPA and Mississippi Department of Wildlife, Fisheries and Parks concurred with the 1,030 cfs 7Q10 at Cumbest Bluff and the withdrawal permit was reissued for up to 100 mgd on January 9, 2006 (MS-SW-00121). Interestingly, these two 7Q10’s conflict with each other, MDEQ calculates that if the Pascagoula River flows at 1030 cfs at Cumbest Bluff then the flow at the upstream USGS Merrill Stream Gauge should be 707 cfs (MDEQ 2012b). This flow is significantly lower than the 917 cfs 7Q10 MDEQ has established for the USGS Merrill Stream Gauge. Although MDEQ references the calculated minimum flow of 707 cfs at the USGS Merrill Stream Gauge for regulatory purposes, 917 cfs is the published 7Q10 for the USGS Merrill Stream Gauge. The value MDEQ uses for regulatory decision-making is a matter of degree (severity of the problem) and does not obviate the concern over minimum stream flows at the USGS Merrill Stream Gauge dictating the suspension or revocation of downstream withdrawals at Cumbest Bluff. There are various different instream flow methodologies besides the 7Q10 methodology used in Mississippi (Mulvaney and Park 2008, Instream Flow Council 2002). MDEQ may adopt an alternative minimum flow rate under a different generally accepted scientific methodology that considers biological, hydrological and hydraulic factors. Prior to adopting a new minimum flow methodology, MDEQ must consult with the Mississippi Department of Wildlife, Fisheries and Parks and consider consumptive and non-consumptive water uses, including, but not limited to, agricultural, industrial, municipal and domestic uses, assimilative waste capacity, recreation, navigation, fish and wildlife resources and other ecologic values, estuarine resources, aquifer recharge and aesthetics (Miss. Code Ann. § 51-3-3(i)). Since 2010, MDEQ has been devoting considerably more attention to regional water quantity concerns and minimum flow issues but has not indicated any willingness to replace the current 7Q10 methodology. Thus, water availability from Lower Pascagoula River must be evaluated in light of the potential frequency, severity and duration of droughts and is not based on normal or average flows. So surface water supply permitting decisions require the collection, analysis and interpretation of considerable objective, measured field data (e.g., precipitation, temperature, flow data, etc). This data must be supplemented with field data collection on un-gaged streams, spring inventories, etc. Finally, historical and field data must then be re-analyzed in light of potential impacts from climate change and variability. National level studies predict that over the next fifty (50) years climate change or variability will cause sea level rise, increased temperatures, less precipitation, and generally increase the frequency, severity and duration of droughts along the

12
Mississippi Gulf Coast and in the Lower Pascagoula Basin. To quantify these impacts on minimum stream flows will require scientific modeling methods that are unavoidably speculative to some degree and subject to alternative projections. Still, it is indisputable that water resources planning, management and development in the Lower Pascagoula River has been and will continue to be driven by the need to maintain established minimum stream flows from the worst case scenario of long-term future drought frequency, severity and duration. The need to plan for this type of “worst case scenario” became apparent during the U.S. Department of Energy’s (DOE) evaluation of a potential site on the Pascagoula River near Richton, Mississippi for an expansion of the Strategic Petroleum Reserve (SPR). In evaluating the Richton site, DOE proposed a raw water intake (rwi) (surface water withdrawal) on the Leaf River approximately 450 feet downstream of the confluence with the Bogue Homa which would be used as a water supply for approximately five (5) years during normal and high flows and alternative water source from the Gulf of Mexico would have been available during low flow conditions on the Leaf River which is a Pascagoula River tributary (DOE 2006). MDEQ used flow data from 1939-1991 from stream gages upstream of the proposed rwi site to establish a 7Q10 of 503 cfs for the Leaf River at New Augusta. There were only 160 days out of the entire 52 year period that MDEQ tracked when the Leaf River’s flow fell below the 503 cfs 7Q10. Overall, MDEQ’s results indicate that the Leaf River’s flow would exceed the minimum flow 99 percent of the time, although there could droughts when the flow would be below 503 cfs for as much as 15 percent of the time during the project period (DOE 2006).
Notwithstanding the DOE’s accommodation to protect minimum flows, various interests remained extraordinarily concerned about the project’s potential impacts on the Pascagoula River’s minimum flows for environmental, industrial water supply and economic concerns. Below are some key comments submitted on the SPR’s Environmental Impact Statement:
1. Gulf Conservation Coalition (2008): “1) Removal of a large amount of water from the Pascagoula River over five years will tax an already stressed natural resource. . . [.] Since the Pascagoula River is a free flowing river . . . it is much more dependant (sic) on weather conditions to keep its water levels sufficient for maintaining its ecology than would a river system that is managed with dams. In addition to the ecology dependence on the river water levels, the population of the southern counties of Mississippi also depends on the river system for much of its economy as well. The industries of Jackson County depend on the river for their fresh water needs. Ecotourism businesses are running tours of the river for tourists. Questions: 1) If a study has been conducted regarding use of the Pascagoula River for the Raw Water Intake, how did it incorporate the potential for increase of the current water removal for industrial expansions?; 2) If the Pascagoula River water level falls close to the point where pumping for the SPR stops, will raw water pumping for the SPR stop to allow the Jackson County industrial needs be met?”
2. Gulf Restoration Network (2008): Environmental Issues: “12) If a supplemental water source such as the Okatibee (sic) Reservoir is intended to be used during periods of low-flow, the DOE must consider how long such a release from the reservoir could be sustained given that there would likely be drought conditions throughout the basin at the same time. In addition, the Okatibee (sic) Reservoir has been at low water levels in recent years. 13) If a supplemental water source such as the Okatibee (sic) Reservoir is intended to be used during periods of low-flow, the DOE must consider how long it would take a release of water to reach lower parts of the Pascagoula River from where water is being withdrawn. The DOE must also consider how much water volume would be lost
13
from the point of release to the withdrawal point. In addition, the DOE must consider the impact that a large release from a reservoir could have on habitat in the Pascagoula River, particularly if the temperature (sic) or quality of the water varies from that of the Pascagoula”; and, finally,
3. American Rivers (2009) listed the Pascagoula River as American’s 9th most endangered river because of the proposed SPR expansion stating, “[w]ith global warming already predicted to alter river flows in the Southeast, the double-blow of climatic-induced low flows and water withdrawal for the oil storage project could have disastrous effects on this fragile ecosystem.”
Recognizing the passionate concerns to strongly protect minimum flows in the Pascagoula River and its major tributaries and the almost absolute priority of protecting minimum stream flows over water withdrawals under Mississippi water law, efforts have been underway since the late 1950’s to identify and evaluate potential water storage (reservoir) sites on the Pascagoula Basin’s tributary streams to provide reliable (drought proof), long-term water supplies for downstream industries. In short, maintaining the Pascagoula’s minimum flows during worst case drought scenarios is critical to the region’s current economy, for future economic development and to protect an important aquatic ecosystem. So, consistent with EPA Region 4’s Guidance, although this is technically a water supply project it is really a comprehensive watershed scale management project to identify and evaluate alternatives to ensure that for the next fifty (50) years the Pascagoula River’s flows at the USGS Merrill stream gage do not fall below 917 cfs regardless of the impacts of global climate change or variability. Similarly, planning for the worst case scenario is warranted in this situation because of the potential catastrophic national security threat of losing production from the Nation’s 9th largest refinery for a prolonged period of time. In addition, the national and regional economic impacts from lost electric and petroleum production and temporary layoffs would be significant. Finally, regardless of any reduction in future industrial water withdrawals, the impact of severe prolonged droughts to the Lower Pascagoula’s fragile aquatic ecosystem and several threatened and endangered species could be irreparable. 6.1.2. Surface Water Status-Water Budget
The Pascagoula River Basin is Mississippi’s second largest basin encompassing approximately a 9,600 square mile drainage area that drains into the Gulf of Mexico. Major streams include the Pascagoula, Leaf and Chickasawhay Rivers, as well as the Black and Red Creeks. The Pascagoula River System is the last unregulated major river system in the lower 48 states. It includes twenty-two (22) counties, eight (8) sub-basins and 15,045 miles of rivers and streams. EPA’s First River Reach File has recognized 1,690 lakes and ponds within the basin. The PHWD manages eight (8) of the larger reservoirs for flood control and for recreational use as waterparks. The PHWD’s Flint Creek Reservoir is also designated for water supply. The Mississippi Department of Wildlife, Fisheries, and Parks manages nine (9) state fishing lakes as well as two state park lakes within the Basin. The Pascagoula River Basin is heavily forested with the central portion of the basin known as the pine belt, due to large amount of pine forests. According to the Mississippi 2012 Statewide 305(b) Water Quality Report, the Basin’s primary land use is forestry. Shipyards and sawmills were developed along the river to profit from the Basin’s vast timber resources. The river corridors supplied a natural corridor to transport these timber products throughout the world

14
from the Port of Pascagoula. Figure 4 shows the distribution of land cover in the Pascagoula River Basin (MDEQ 2001).
Figure 4 - Major Land Cover in the Pascagoula River Basin (MARIS) Although urban uses only makes up 2% of the basin area, one of Mississippi’s largest concentrations of industry is located in the coastal portion of the Basin. The cities of Pascagoula, Moss Point, Escatawpa and Gautier were founded and prospered because of the Basin’s coastal industries. The Pascagoula River Basin also produces 75 percent of the oil, and 50 percent of the natural gas produced in Mississippi. The Basin has numerous small natural waterbodies (ponds, swamps and bayous) that are mostly shallow, open-water wetland systems. Approximately thirty-five (35) waterbodies larger than 100 acres are located within the basin, with only seven (7) being man-made reservoirs. However, as shown in Figure 5 below, without manmade water storage capacity, none of the area streams can provide a sufficient volume of water to the meet the project area’s future water needs during extended periods of severe drought. Figure 4 shows the surface water features in the study area. Consistent with project area identified in Section 2, the water budget’s geographic extent was limited to allow a more detailed discussion of permitted withdrawals and discharges. The USGS Stream Gauge near Leakesville was the northern limit along the Chickasawhay River and the USGS Stream Gauge near McLain was the northern limit along the Leaf River. However, Okatibbee Reservoir on Okatibbee Creek, a tributary of the Chickasawhay River, is included in the Water Budget because it has water supply as a secondary purpose to augment flows during droughts along the Pascagoula River, as mentioned in Section 5 above and discussed in detail in Section 7.1 below. Therefore, a USGS Gauge Station at Arundel, closest downstream Gauge of the reservoir, was included as a control point. The Leaf and the Chickasawhay Rivers converge to form the Pascagoula River just upstream of the USGS Merrill Stream Gauge. Numerous intermittent and perennial streams flow into these two tributaries before converging into the Pascagoula River. Similarly, the Pascagoula River has numerous tributaries of its own, two of the larger being the Big Cedar Creek and Black Creek. Black Creek is designated as Mississippi’s only Scenic Stream, flowing through portions of the Desoto National Forest before discharging into the Pascagoula River.
15
Figure 5 – Water Budget Representing the Project Area

16
USGS Stream Gauge Waterway Location 7Q10 (cfs) 2475000 Leaf River Mclain, MS 598
2476600 Okatibbee Creek Arundel, MS 12
2477000 Chickasawhay River Enterprise,MS 29
2478500 Chickasawhay River Leakesville,MS 246
2479000 Pascagoula River Merrill,MS 917
Table 2 - USGS Stream Gauges and Established 7Q10 in the Project Study Area
According to a database compiled by MDEQ’s, a total of 298 surface water withdrawal permits currently exist within the Pascagoula River Basin. Of the 298, several large withdrawals exist within the Pascagoula River Basin and are listed in the table below (MDEQ 2012 d). Permit Number Water Source Volume Diverted Permit Holder
MS-SW-02034 Leaf River 115.2 mgd MS Power Co. MS-SW-00121 Pascagoula River 99.9 mgd JCPA MS-SW-01898 Leaf River 26.0 mgd Leaf River Cellulose LLC MS-SW-00330 Escatawpa River 22.8 mgd JCPA
Table 3 - Large Surface Water Withdrawal Permits within the Project Area (MDEQ 2012 d)
Regarding the above listed withdrawals, both permitted withdrawals along the Leaf River are up stream of the USGS Mclain Stream Gauge with no large withdrawals downstream of the Gauge. Therefore, the gaged flow at the Mclain Station accurately tracks the volume of water flowing into the Pascagoula River from the Leaf River. The JCPA’s permitted withdrawal location along Escatawpa River is near the confluence with the Pascagoula River, which is downstream of the Cumbest Bluff intake structure. Flows from the Escatawpa River do not affect the Pascagoula River levels at Cumbest Bluff. Cumbest Bluff along the eastern banks of the Pascagoula River at river mile 25.4 is where significant permitted industrial water supplies are withdrawn. The JCUA has also applied to MDEQ for a permit to withdrawal water from the Cumbest Bluff intake structure for potable water uses in its Eastern Jackson County Regional Water System (identified as project W-23 in the Gulf Region Water and Wastewater Plan). The USGS Merrill Stream Gauge is the nearest upstream gage from Cumbest Bluff and because of its long historic data record it is heavily relied on to estimate Pascagoula River flows at Cumbest Bluff. Table 2 summarizes the established 7Q10s at corresponding USGS Stream Gauges within the project area.

17
Figure 6 - MDEQ Permitted Pascagoula River Basin Surface Water Withdrawals / Discharges in the (MDEQ 2012 d)

18
6.1.3. Trends-Climate Variability
As discussed throughout this application, a reliable, long-term water supply is critical to southeast Mississippi’s economy. Numerous heavy industries in southern Jackson County depend on surface water withdrawn from the Pascagoula River at Cumbest Bluff. Regardless of any water conservation or efficiency measures adopted, potential prolonged or severe droughts that reduce the Pascagoula River’s flow at the Cumbest Bluff gage below its minimum instream flow of 917 cfs threatens these industries’ access to any water from the Pascagoula River. Long-term climate change or variability projections vary and are inherently speculative. Still, Seager et al. (2009 at page 5043) observes “that climate change should not be counted on to solve the Southeast’s water woes and is, in fact, as likely to make matters worse as it is better.” Generally, the NRDC (2010 at page 2) asserts that two main reasons for projected regional water constraints from climate variability are; 1) shifts in precipitation and 2) potential evapotranspiration (PET). PET is the sum of evaporative water loss from the ground surface and transpiration losses from vegetation. Cumulatively, changes in precipitation and PET significantly affect available precipitation. Available precipitation is important for surface water supply because it is estimated as any precipitation in excess of PET. The NRDC estimates that Southern areas of the United States may experience annual PET increases of 5 to 6 inches. This PET increase loss would further diminish the availability of water released from the Okatibbee Reservoir to restore or maintain instream flows to allow continued water withdrawals from Cumbest Bluff. Finally, the NRDC (2010) report finds that, “[p]rojected decreases in available precipitation from historical records will also vary [regionally] . . . with some regions, such as . . . the Southeastern U.S., experiencing decreases of more than 5 inches per year by 2050 (NRDC 2010 at page 2).
More specific, to the Mississippi Gulf Coast, the NRDC (2012) found that precipitation models are unclear but models suggest that immediate Mississippi coastal areas may be drier in the winter and spring. Further, higher temperatures are likely to lead to greater evaporative losses from soil and vegetation which would result in lower summer soil moisture that would increase drought intensity along the Mississippi coast. Subsequently, more frequent and severe droughts could reduce groundwater recharge which would have severe impacts in Mississippi statewide and on the Gulf Coast because of its heavy reliance on groundwater. Briefly, “[a]s a result of higher evapotranspiration rates, historical summer low flows could be more extreme and negatively impact water quality through reduced dissolved oxygen, potentially increasing the occurrence of fish kills and harmful algal blooms. Increased water temperatures also would impact aquatic ecosystems by changing the distribution of species” (NRDC 2012 at pg 155). Finally, “[g]iven the state’s heavy reliance on groundwater resources and the likelihood that climate change and burgeoning water demands will strain the state’s water supplies, Mississippi should work to develop a statewide plan for managing water quantity” (NRDC 2012 at pg 156, emphasis in the original).
Figure 7 and 8 below show cumulative Precipitation-Evaporation (P-E) for the Pascagoula Basin’s wettest (1961), driest (2000), median (1993), and average year with or without climate change (Wax and Pote 2012). This shows the variable annual interplay between precipitation and evaporation in the Basin under recorded extreme wet and dry years as well as the climate’s delivery of “average” moisture and energy to the Basin. For purposes of future drought prediction it is necessary to plan for the worst case scenario shown by the driest year 2000.

19
Figure 7- Pascagoula River Flow for One Year with P-E and Predicted Climate Change
Figure 8- Pascagoula River Flow for One Year with P-E and without Climate Change
-30
-20
-10
0
10
20
30
40
50
60
70
1 18 35 52 69 86 103 120 137 154 171 188 205 222 239 256 273 290 307 324 341 358
CFS
(in
thou
sand
ths)
Days
George County Cumulative P-.8E, With Climate Change
CumAvg
61 Cum
00 Cum
93 Cum
-30
-20
-10
0
10
20
30
40
50
60
70
1 18 35 52 69 86 103 120 137 154 171 188 205 222 239 256 273 290 307 324 341 358
CFS
(in
thou
sand
ths)
Days
George County Cumulative P-.8E, With Climate Change
CumAvg
61 Cum
00 Cum
93 Cum

20
Wax and Pote (2012) collated this daily data for the wettest, driest and median years into monthly records and correlated the measured precipitation to the Pascagoula River’s measured flow at the USGS Merrill Gauge. As shown in Figure 9, the drought of 2000 and 2001 resulted in the Pascagoula falling below its established 7Q10 of 917 cfs at the USGS Merrill Stream Gauge from Mid-May until early November 2000.
Figure 9 – Monthly Mean Discharge at Merrill (MSU) Referring back to Figures 7 and 8 above, the precipitation less a 0.8 evaporation factor showed the Pascagoula River essentially falling below its established 7Q10 from day 137 of 2000 and continuing into January of 2001. Similarly, as Turnipseed and Baldwin (2001 at page 3) report based on an analysis of twenty-one (21) gages in the Pascagoula Basin during the 2000 drought:
Minimum daily flows for the 2000 water year at the Leaf River near Collins were 46 percent less than the published 7Q10 discharge for the station and 29 percent less than the previous period of record minimum daily flow at the gage []. The computed minimum daily discharge for the Pascagoula River at Merrill during the 2000 water year was 649 ft3/s, which was about 29 percent less than the published 7Q10 discharge and about 8 percent less than the previous period of record minimum daily flow of 704 ft3/s, which was set on October 21, 1936.
Flows at three of the selected gages in the Pascagoula River Basin (Okatibbee Creek at Arundel, Chickasawhay River at Enterprise, and Chickasawhay River at Leakesville) are
0
5,000
10,000
15,000
20,000
25,000
30,000
35,000
40,000
45,000
50,000
J F M A M J J A S O N D
cfs
months
Monthly Mean Discharge at Merrill
wet (1961) median (1984) dry (2000) 7Q10 (917cfs)

21
affected by regulation from the Okatibbee Reservoir north of Meridian during low-flows and, consequently, the effect of the 2000 drought was reduced from what it would have been. Of these three gages (sic), only the Chickasawhay River at Leakesville had minimum daily discharges less than the published 7Q10 discharge.
In summary, minimum daily discharges computed for 19 of 21 gages (sic) during the 2000 water year selected were less than the published 7Q10 discharges, and 16 of 21 gages (sic) in the Pascagoula River Basin had computed minimum daily discharges that were the lowest for the period of record. Notably, 3 of the 5 gages (sic) in the basin that did not set new low flow records are affected by flow regulation from Okatibbee Reservoir.
Finally, Turnipseed and Baldwin (2001) found that flow regulation on the Okatibbee Lake lessened the downstream effects of the drought on Pascagoula River. Water releases from Okatibbee Lake prevented three downstream gages (Okatibbee Creek at Arundel, Chickasawhay River and Enterprise and Leakesville) from reaching record low-flows in the 2000 water year. However, reflecting the loss of water from PET, the most downstream site (Chickasawhay River at Leakesville) did flow below its published 7Q10 value. In short, the Pascagoula Basin suffered its worst drought of record in the 2000 water year and the effects of the drought would have been significantly greater without outflows from Okatibbee Lake.
Having established the impact of droughts on the Pascagoula River in the early the 21st Century, it is necessary to predict the impact of climate change or variability on the frequency, severity and duration of droughts through 2065. More specific to the project area, the NRDC (2010) study developed a new water supply sustainability index to evaluate long-term water sustainability on an individual county-by-county basis based on the following five (5) criteria: 1) projected surface water demand as a share of available precipitation; 2) projected groundwater demand as a share of projected available precipitation; 3) drought susceptibility; 4) increases in freshwater withdrawals and 5) increased summer water deficits. The report then classified all the counties in the U.S. for risk to water sustainability. Counties meeting two of the criteria were “moderately at risk”, those meeting three were “highly at risk” and those meeting four or more were “extremely at risk” of having water sustainability issues by 2050. Without climate change George, Jackson and Stone Counties in southeast Mississippi have a moderate risk to water sustainability (NRDC 2010b). With climate change, those counties are at a high risk and neighboring Harrison County faces a moderate risk to water sustainability (NRDC 2010a).
Refining the NRDC methodology as documented in Tetra Tech (2010) to the project area and the correlation between precipitation and streamflow, Wax and Pote (2012) reduced the measured daily precipitation and river discharge measurement from 1960-2010 by 1.57%, while increasing PE by 9.73% each day to project the potential future impact of climate variability on drought severity and frequency in the Lower Pascagoula Basin
6.2. Groundwater Overview
Groundwater quantity and quality in the project area is more constant than surface water resources. Specifically, “[ground] water levels in Jackson County have generally been stable or slightly declining since the mid-1970’s. There are ample [ground]water resources (available drawdown) at present pumping rates in all aquifers for the foreseeable future” (MDEQ 2000 at page 10).
Multiple geologic units capable of producing groundwater underlie the project area, and in particular George County and northern Jackson County. The major aquifer containing formations

22
which underlie the area, in order from youngest to oldest, include the Citronelle formation of Pleistocene age and the Hattiesburg, Pascagoula, and Catahoula formations, which are all of Miocene age. Wells have been developed in each of these aquifers with uses ranging from agricultural and industrial to private and municipal water supply.
Figure 10 - Geological UNITS of Study Area (from Thompson, 2011)
The Citronelle formation is a series of lenticular beds of gravel, red sand, and white clay of a fluvial origin which outcrops in central and eastern George County and throughout Jackson County. There are no major withdrawal centers in this aquifer, and the majority of the wells developed in the Citronelle are agricultural or domestic. However, the porous and permeable nature of the Citronelle and its broad areal extend of surface outcrops across George County allows a large volume of rain water to percolate into the formation which enters the underlying Pascagoula formation and also sustains the base flow of streams draining the area.
The Pascagoula formation consists of primarily green to gray silty clays and also includes silt, sand, sandy clay, and some gravelly sand. This formation includes important aquifers that are used in both George and Jackson Counties. The Pascagoula outcrops in George and Jackson counties where the overlying Citronelle formation has been eroded away by surface flow such as creeks and streams. As previously mentioned, recharge is not only obtained from the areas the formation outcrops, but also from the overlying Citronelle formation.
The Hattiesburg formation is characterized by alternating gray to tan sands, silts, and clays. Important municipal wells are completed in this formation throughout George County. This formation does not outcrop in either George or Jackson County, and is not seen on the surface until Greene County and further north.
Both the Pascagoula and Hattiesburg formations were deposited over a period of time which saw a fluctuation in sea levels, resulting in a variety of continental and near-shore depositional environments including fluvial, estuary and deltaic deposits which left alternating layers of sands, silts, and clays. The formations are so similar; they are often referred to together as the Miocene aquifers, as they are difficult to differentiate. The aquifers of this formation consist of several beds of sand separated by beds of clay. These sand units tend to be lenticular in nature, meaning that the beds are not continuous throughout the region. With this discontinuity, some problems have been encountered while attempting to install water wells, as the water bearing units can be “hit or miss” due to this subsurface geology. Figure 11 shows how some of these discontinuous sand beds are deposited.

23
Figure 11 - Example of Delta Front Sand Deposition (from Frazier and Osanik, 1969)
In a Geological Survey-Water Supply Report regarding water supply issues in George and Jackson Counties, USGS (1965) explain that one of the principal issues in the area was actually locating an aquifer in the immediate vicinity of the need. The paper goes on to explain that some groundwater “zones can be traced for 10 miles or more where there is an abundance of sand into areas where there is little sand”. The report provides an example of the lack of groundwater present in the industrial area near Bayou Casotte, where the chief aquifer of the area is completely absent. Generally, these sands tend to thin or disappear in eastern Jackson County (MDEQ 2000). MDEQ (2000 at page 2) reports that, “[t]his type of variability is common in these types of sedimentary sequences, and caution should be used when comparing water-level and water-quality data from well to well or from aquifer to aquifer.” This explains why after drilling numerous wells, the JCUA was unable to locate sufficient groundwater supplies for the Eastern Jackson County Regional Water System and abandoned the search for groundwater to pursue surface water which is discussed below in Section 7.2.
These units outcrop throughout George County and as far north as southern Jones and Wayne County. The Hattiesburg formation is an important aquifer throughout George County, supplying many domestic and municipal wells. The Pascagoula formation is utilized further south, in Jackson County where it also supplies a number of domestic and municipal wells.

24
The geologic formations that supply the majority of potable water in George County outcrop and are recharged further to the north, in Green and Wayne Counties, Mississippi, and from the western parts of Mobile and Washington, Counties, Alabama. The main recharge zones for the aquifers in Jackson County are in George County or northern Jackson County. Surface water that does not escape by run-off, evaporation, and transpiration enters permeable outcropping units in the recharge areas and moves in the direction of dip to the southwest. The following Figure 12 shows a cross-section from northeast to southwest across George County, illustrating the outcrop areas and dip of the formations and the position of the fresh water aquifers within the formations.
Figure 12 - Geologic Cross-Section of George County (from Williams, et al, 1967) 7.0 Projected Water Demands For the reasons discussed in Section 6.1.1 related to instream flow projected future water demands are largely irrelevant to this project. If the Pascagoula River’s flow at the USGS Merrill Stream Gauge falls below the 7Q10 of 917 cfs then the MDEQ is required to suspend or revoke all permitted downstream water withdrawals. Currently there is no provision for any type of reduced withdrawal or “credit” for implementing water efficiency or conservation measures. As long as flows exceed 917 cfs permittees can fully utilize their permitted withdrawal amounts. Therefore, projected future water demands are based on current and pending withdrawal amounts permitted or pending with MDEQ. Section 7.1 discusses the Jackson County Port Authority’s longstanding 100 mgd permit. That is followed in Section 7.2’s discussion of the

25
Jackson County Utility Authority’s pending application to withdraw 1 mgd of surface water for its Eastern Jackson County Regional Water System 7.1. Jackson County Port Authority (JCPA) The JCPA was organized under the appropriate provisions of the Mississippi Code in 1957 (Miss. Code Ann. §§ 59-1-1 and 59-1-9) with the responsibility for building and operating public port facilities, serving as the non-federal sponsor for the federal navigation project, and fostering industrial development through the operation of industrial parks and the Jackson County Industrial Water System (JCIWS) (Jackson County Port Authority, 2008). As an industrial water supplier, JCPA has three (3) very unique obligations to its customers. First, the JCPA must meet its current and potential industries’ demand for a constant and reliable water supply. Secondly, recognizing the need for a reliable water supply, the JCPA must have backup systems, redundancy and plan for worst case scenarios to ensure the water supply for all industrial water clients. This may be viewed as overkill in some domestic or agricultural water supply situations but from an industrial perspective, industries such as Chevron’s Pascagoula Refinery have no alternative but to depend on the JCPA to ensure a water supply to refine oil and gas products that are critical to National Security and the National Economy. Finally, the JCPA provides its industrial clients with water for firefighting when needed. The JCPA must be prepared provide water needed to respond to a major fire at the Pascagoula Refinery twenty-four (24) hours a day, seven (7) days a week, 365 days a year, every year. Such an event may never occur but if it does, it could easily require the JCPA to significantly exceed normal or average seasonal water demands and maximize or exceed the water supply infrastructure’s designed capacity. Long-term industrial water supply demand projections are extraordinarily difficult and subjective. Existing industrial customers could significantly expand or contract their production capacity or operations in response to external economic conditions and markets. Similarly, over the next fifty years it is impossible to project which new industries may respond to economic conditions, incentives or market conditions to relocate to the Project Area or what their water demands would be. For instance, the Airbus Plant groundbreaking in Mobile, Alabama will attract myriad secondary and tertiary parts manufacturers and suppliers to the area. It is impossible to predict how many of those companies may locate in the Project Area or their water demands. In 1972, the Jackson County Board of Supervisors established a base industrial water demand and projected a 3.9 percent increase per year. Based on those projected industrial water demands the JCPA would require 224.2 mgd from Cumbest Bluff by 1990. That has clearly not occurred. In preparing this application, numerous meetings were held with MDEQ Office of Land and Water Resources, the JCPA Staff and JCPA industrial customers to discuss projected long-term water demands and water efficiency and conservation measures that are discussed below in Sections 9.2.1. However those efforts were largely unsuccessful. Subsequently, in consultation with MDEQ’s Office of Land and Water Resources it was determined that the JCPA’s permitted 100 mgd withdrawal was a viable water demand projection through 2065. The MDEQ has accepted the validity of the 100 mgd withdrawal amount at Cumbest Bluff since it was first proposed by the Jackson County Board of Supervisors on February 23, 1962 (Permit Number 01166). The permit was reviewed and reissued in the same volume on November 12, 1985 (MS-SW-00121). Most recently, the permit was reviewed and reissued to the JCPA on January 9, 1996 for the same volume (MS-SW-00121). More details on the JCPA’s JCIWS are presented in Section 7.1.1. The JCPA’s work to formalize a 2000 emergency flow augmentation agreement with MDEQ and the Pat Harrison Waterway District is introduced in Section 7.1.2 and discussed as a possible long-term water supply alternative in Section 9.3.

26
7.1.1. JCPA-Jackson County Industrial Water System The JCPA’s industrial water supply infrastructure dates back to 1961 and is collectively referred to as the Jackson County Industrial Water System (JCIWS). Over the next fifty (50) years the infrastructure was periodically expand and upgraded. During that time, the Jackson County Board of Supervisors ceded administrative control over the JCIWS to the JCPA. As shown in Figure 2, The JCIWS has three (3) interrelated components:
1. Cumbest Bluff Intake structure and pumps; 2. Transmission pipelines; and 3. A treatment Plant (historically known as the Kreole Water Treatment Plant).
In addition, the JCPA owns and operates the Black Creek Water Cooling Facility that provides cooling water for Mississippi Power Company’s Plant Daniel generating facility (JCPA 2012). Table 4 shows series of investments that expanded and improved the JCIWS’s raw and treated water capacity including the Black Creek plant capacity.
Year Capacity Cost 1961 Raw-15 mgd ~$2,000,000 1966 Raw-25 mgd
Treated-25 mgd ~$4,000,000
1976 Raw-45 mgd Treated-25 mgd
~$2,000,000
1980 Raw-50.4 mgd Treated-25 mgd
~$7,500,000
1983 Raw-50.4 mgd Treated-37.5 mgd
~$7,100,000
1997 Raw-78.4 mgd Treated-37.5 mgd
~$4,000,000
2009 Raw-78.4 mgd Treated- 40 mgd
~$24,000,000
Total ~$50,600,000
Table 4 - JCIWS Expansion/Improvement History
The System’s redundancy starts at the Cumbest Bluff intake which has dual power sources to for the multiple large capacity pumps that draw water from the Pascagoula River and propel it down the pipeline. The redundancy continues with the multiple pipelines that transport raw water from Cumbest Bluff outside the watershed to the treatment plant near the Gulf of Mexico. These pipelines vary from the 30’ steel pipe installed in 1961, to the 36’ concrete pressure pipes installed in 1976 and 1980. Most recently a 54’ ductile iron pipe was added in 1997. This redundancy allows any pipeline to be temporarily shut down for inspection or maintenance needed to locate and repair leaks for water conservation purposes.
These two components deliver raw water to the treatment plant for treatment and delivery of treated water to industrial customers in the Bayou Casotte Industrial Area. The treatment plant

27
and its treated water distribution infrastructure is a closed loop system. This closed loop system prohibits the JCPA from accepting graywater from any individual industrial customer back into the system because that would put the entire system at risk from any failure in the graywater treatment process. Individual industrial customers are supported in internal efforts for water or graywater reuse but that is outside the JCPA’s control. As per its water supply agreements with industrial customers, the JCPA treats the raw water to reach certain turbidity levels and maintain a neutral pH of seven (7). As shown in Figure 13 below, the treatment plant includes two (2) 15,000,000 gallon retention reservoirs for primary settling of raw water for a total capacity of 30,000,000 of storage. These storage/settling reservoirs essentially give the JCPA a one (1) day water supply reserve during periods of normal or average industrial water demand. In addition, the treatment plant has a very aggressive rainwater harvesting capacity that is integrated with the plant’s stormwater management system and designed to capture and deliver water into the plant either via gravity feed or recycle pumps. The treatment plant uses a dual system of clarifiers and mixed media sand filters to achieve the necessary treated water quality for delivery to industrial customers. Major upgrades were recently completed on the treatment system which resulted in significantly lower treatment costs individual industries. As of 2012, although the treatment plant’s total capacity has not been certified it is estimated to be able to easily treat and deliver in excess of 40 mgd to industrial customers.
Figure 13 – JCPO Industrial Water System Treatment Facility (JCPA)

28
A final note, outside of on-site water storage capacity, surface water from Cumbest Bluff is the only water source available in the event of an industrial fire emergency. In the case of a fire emergency, the JCPA is prepared to maximize or exceed design capacity to deliver raw water from Cumbest Bluff for fire suppression and fighting as long as necessary. Additional elements of the JCIWS and relevant operational and maintenance practices are highlighted or detailed below in Section 9.2.1. 7.1.2. 2002 Flow Augmentation Agreement- Okatibbee Reservoir
Regardless of any and all water efficiency or conservation measures the JCPA has or may implement; MDEQ must suspend or revoke any JCPA water withdrawal if the Pascagoula River’s flow falls below 917 cfs at the USGS Merrill Stream Gauge. The 2000 water year demonstrated that this was not a hypothetical or academic concern. As the USGS Merrill Stream Gauge documented a steady decline toward and eventually well below the 917 cfs minimum flow; MDEQ initiated emergency discussions with the JCPA, the Pat Harrison Waterway District (PHWD) and the U.S. Army Corps of Engineers (USACE) to identify a mechanism to augment the Pascagoula River’s flows to keep the USGS Merrill Stream Gauge above 917 cfs. Finally, on October 2, 2000, with the USGS Merrill Stream Gauge recording a flow below 707 cfs, the MDEQ requested that the PHWD, in conjunction with the USACE, increase the outflow from Okatibbee Reservoir from 30 to 50 cfs to begin the 251 river mile trip from north of Meridian in Lauderdale County, Mississippi to the JCPA’s Cumbest Bluff intake structure (Pat Harrison Waterway District 2001). Shortly thereafter rains came and by October 10, the outflow from Okatibbee was reduced back to 30 cfs. However the rains only provided a temporary solution and by October 23, the drought had worsened and the outflow from Okatibbee was increased to 122 cfs. By October 31 outflow was decreased again to 76 cfs. Finally on November 7, 2000, the Oktatibbee’s outflow was returned to the normal 10 cfs rate.
Photo 1 – View of Record Low Flow At Merrill Bridge on the Pascagoula River in October 2000

29
Figure 14 - Minimum Discharges for Water Years 1930-2000 along the Pascagoula River
The emergency measure provided supplemental water to continue industrial water withdrawals from Combest Bluff and also provided ecosystem benefits through the basin during an extended drought. The release lasted 31 days (with variable volumes released dependent on precipitation) until a large rainfall event occurred and provided sustained flows above minimum levels. Still, following the 2000 drought, the JCPA and MDEQ realized the severe threat of a potential disruption of industrial water usage and entered into a Water Purchase Contract with the PHWD in 2003 to provide a mechanism and schedule to release of water from the Okatibbee Reservoir (PWHD and JCPA 2003). Future releases are coordinated with the MDEQ, USACE and the PHWD/JCPA. The agreement allows the release of up to 4,000,000,000 (4 billion) gallons of water from the Okatibbee Reservoir during any given fiscal year as requested to the JCPA (PHWD and JCPA 2003). Table 5 below illustrates the release schedule and associated costs.
Sequence Release Amount (gallons) Costs Initial Release 200,000,000 $15,0000 *annual retainer 2nd Release if necessary 1,000,000,000 Additional $30,000 3rd Release if necessary 1,000,000,000 Additional $40,000 4th Release if necessary 1,000,000,000 Additional $50,000 Final release if necessary 800,000,000 Additional $48,000
Table 5 - Release volumes and costs for agreement (PHWD and JCPA Agreement 2003)
This emergency flow augmentation protected the JCPA’s permit from the suspension or revocation but did not provide sufficient flows to maintain the Pascagoula River’s flows above 917 cfs at Cumbest Bluff. Now that the agreement is formalized it is appropriate to consider if a proactive response and earlier release could maintain flows above 917 cfs. The potential of this agreement or a modification of this agreement to provide long-term, drought proof flows into the Lower Pascagoula is analyzed in more detail in Section 9.3 below.
7.2. Jackson County Utility Authority-Eastern Jackson County Regional Water System Having spent considerable effort presenting the longstanding surface water industrial demands in the Lower Pascagoula River it is necessary to introduce a pending potable water demand. A major portion of Mississippi’s post Hurricane Katrina recovery was devoted to long-term Gulf

30
Coast Region water and wastewater needs and infrastructure. Section 7.2.1 discusses the resulting Gulf Coast Region Water and Wastewater Plan (hereinafter “Gulf Region Plan”). The Gulf Region Plan did not recognize any significant surface water supply demands and laid out a comprehensive groundwater supply infrastructure backbone which to be implemented largely by newly created county-wide water and wastewater utility authorities. The JCUA was one such agency. As presented in Section 7.2.2 as the JCUA began implementing its specific identified projects it was unable to obtain sufficient quality or quantities of ground water in on specific project – the Eastern Jackson County Regional Water Supply System. Accordingly, the JCUA had to modify the proposed project (identified as W-23 in the Gulf Region Plan) to use surface water from the Pascagoula River instead of ground as originally intended. The result is a proposed new 1 mgd surface water withdrawal for public water supply. 7.2.1. Gulf Coast Region Water and Wastewater Plan Much of the Jackson County Utility Authority’s (JCUA) activities and projects have been driven by the Gulf Region Plan developed to guide and prioritize water and wastewater infrastructure repairs, expansions and improvements in response to Hurricane Katrina. While the effects of Katrina were felt statewide the devastation was especially keen in Mississippi’s Gulf Region which includes Pearl River, Stone, George, Jackson, Harrison and Hancock Counties. The Gulf Region Plan was prepared to identify and prioritize the Gulf Region’s most critical water, wastewater and stormwater infrastructure needs. To accomplish this goal, the Gulf Regional Plan encouraged centralization and consolidation of infrastructure wherever practicable; provided for new infrastructure in areas of current or projected development and supported siting facilities in areas that are less vulnerable to future hurricane impacts. Essentially, the Gulf Region Plan developed a regional infrastructure “backbone” for future local expansions or improvements by the individual county-wide utility authorities (MDEQ 2006). The Gulf Region Plan included documentation and analysis to project the long-term water demand and the necessary water treatment and delivery infrastructure to meet that demand for included projects including the Eastern Jackson County Regional Water System. As introduced in Section 5 above, the Eastern Jackson County Regional Water System was included in the Gulf Region Plan to serve the unincorporated area in eastern Jackson County generally bounded by the Pascagoula River on the west, the Escatawpa River on the east, Davis Sawmill Road on the north, and the east-west rail spur near the intersection of MS 63 and MS 613 on the south. The service area will also provide water for the Hurley, Wade, Polketown and Big Point Communities. The project service area encompasses approximately 72,956 acres or about 114 square miles in eastern Jackson County (MDEQ 2006 at p. 6-22). The area’s population is projected to increase consistently over the next twenty (20) years as Jackson County’s population migrates northward. Population projections for Jackson County were developed as part of the Gulf Region Plan (MDEQ 2006). These population projections were used to develop population projections specific to the proposed service area boundary. The project service area lies within census tracts 040101, 040102, and 041300. Table 6 shows the 2005 populations as well as the short term (2010) and long term (2025) projected populations for the entire census tract and the project service area boundary. The projections represent a short term annual growth rate of approximately 2.5% and an annual growth rate of approximately 1.4% over the long term.

31
Census Tract
2005 2010 2025 Entire
Census Tract
Within Service
Area
Entire Census
Tract
Within Service
Area
Entire Census
Tract
Within Service
Area 040101 6,654 5,763 7,525 6,518 8,853 7,668 040102 7,095 4,402 8,017 4,975 9,432 5,853 041300 6,493 239 7,309 269 8,469 311
Total 20,242 10,404 22,851 11,762 26,754 13,832
Table 6 - W23 Population Projections
In estimating the project service area’s potable water needs, it is important to understand that many existing residential, commercial, and industrial entities rely on individual wells for their water needs. It is probable that some portion of the project service area’s population will continue to utilize individual wells throughout the design life of the water system. As development occurs within an area, and centralized water supply and distribution systems are installed, the need for individual well use for potable water demands decreases. The JCUA’s extension and expansion of the potable water supply and transmission system will occur at a reasonably uniform rate within the planning period. Such expansion will permit the reduction of individual well usage in the service area at a similar rate. As individual well use decreases, the per-capita water demand must be satisfied by the centralized supply and distribution infrastructure. Projected land use within the proposed service area is primarily residential, with isolated areas of commercial use near the population centers and along main transportation corridors. Thus, it is reasonable to estimate water usage within the project area based on residential water consumption rates. Using the population estimates above, as well as composite per-capita daily water demand rates, an estimate of total water demand within the proposed service area may be developed. Table 7 provides estimated historical water demand as well as projected short term and long term water demand for the service area.
Average Water Demand (gpd) Census
Tract 2005 2010 2025
Within Service Area Within Service Area Within Service Area 040101 57,630 195,540 690,120 040102 8,804 199,000 526,770 041300 19,120 21,520 29,545
Total 85,554 416,060 1,246,435
Table 7 - W23 Historical and Projected Total Water Demand
To meet this increased potable water demand and mitigate potential public health concerns associated with individual domestic water wells, the Gulf Region Plan proposed a centralized supply and transmission facility for these communities, construction of water supply wells

32
totaling 2,000 gallons per minute capacity and storage tanks totaling 1.5 million gallons of capacity located throughout the area. The System would be connected by water transmission mains along existing roads (MDEQ 2006 at p. 6-22). 7.2.2. Proposed and Pending W23 Water Infrastructure To address the increase in demand for potable water in the communities of eastern Jackson County, while at the same time mitigating the potential public health concern associated with the use of individual wells for domestic water supply, an initial phase of the centralized supply and transmission facility needed to serve eastern Jackson County has been constructed. The initial phase of this system includes the construction of:
• Two water supply wells, with an aggregate production capacity of 1,500 gpm • Three elevated storage tanks, with an aggregate capacity of 500,000 gallons • Approximately 27 miles of primary water transmission main along MS 613, MS 614, MS
63, Polktown Road, Saracenia Road, Nutbank Road, Lily Orchard Road, and Cumberland Trail.
After drilling approximately twelve (12) water wells that yielded either insufficient amounts or poor quality groundwater; JCUA elected to pursue surface water to meet W23’s remaining potable water needs. To augment current potable water supply in the southern portion of the project service area, as well as address projected potable water demand beyond the capacity of supply infrastructure constructed as a part of the Gulf Region Water and Wastewater Plan implementation, the JCUA is in the final design stage for a 1.0 mgd conventional-process surface water treatment facility. The surface water treatment facility will receive raw water via the existing raw water transmission main supplying water to the industrial water treatment facility in the Bayou Casotte Industrial Park. The JCUA has completed planning to expand the initial water storage and transmission infrastructure constructed through the Gulf Region Water and Wastewater Plan implementation. This additional infrastructure includes elevated storage at the surface water treatment facility and approximately 15 miles of transmission main along MS 613, MS 63, and Davis Sawmill Road. The additional transmission main will provide a “looped” primary distribution system, improving redundancy and availability of potable water within the project area. See Figure 15 below for the JCUA (W23) infrastructure exhibit.

33
Figure 15- JCUA Current and Proposed Water Supply Infrastructure (W23)

34
8.0 Summary-2065 Regional Water Needs
The data and analysis above are intended to meet EPA Region 4’s Guidelines (June 21, 2010) wherein we interpret that Region 4 expects:
1. A projected long-term numerical water supply demand volume. Projected as the currently permitted 100 MGD withdrawal at Cumbest Bluff.
2. Then the assumed water utility applicant must take actions to ensure that to the maximum extent practicable, they are implementing sustainable water management practices to eliminate the need for, or reduce the impacts to aquatic resources from future water facility expansions including the construction of water supply reservoirs. These practices must include:
a. Effective management b. Pricing for Efficiency c. Efficient Water Use, and d. Watershed Approaches
3. Finally, alternatives are identified and evaluated to identify the preliminary least environmentally damaging practicable alternative to meet the new projected water supply volume (established by subtracting the “projected water savings” in #2 from the projected water demand established in #1).
This project does not cleanly fit the paradigm envisioned by EPA Region 4’s Guidelines. First, the applicants are not a water utility and have no direct control to implement sustainable water management practices. Secondly, and most importantly, this is a watershed scale approach to address projected increases in the frequency and severity of droughts. Such droughts would threaten any current or future permitted surface water withdrawals from the Lower Pascagoula River and adversely impact the Basin’s unique aquatic ecosystem regardless. In brief, this project’s goal is to ensure that the Pascagoula River’s flow at the USGS Merrill Bridge gage will remain above its established minimum stream flow of 917 cfs through 2065 regardless of the frequency, duration or severity of droughts as projected by the “best” scientific data and analysis available. Following Region 4’s Guidelines, this project’s long-term water supple needs can be summarize as follows:
1. MDEQ set a minimum stream flow for the Pascagoula River’s USGS Merrill stream gage (the nearest upstream gage to existing and proposed downstream water withdrawals) of 917 cfs. (e.g., Mississippi Code Annotated § 51-3-3(1); USGS 1992).
2. MDEQ has permitted the JCPA to withdraw 100 million gallon per day (mgd) of industrial water from the Pascagoula River at Cumbest Bluff. This permit was first issued in February 23, 1962 and has been reissued at the same volume as recently as January 9, 1996.
3. Because of groundwater quantity and quality issues, the JCUA is pursuing an MDEQ permit to withdraw 1 MGD from Cumbest Bluff for public water supply.

35
4. If the Pascagoula River’s flow falls below 917 cfs at the USGS Merrill Stream Gauge; MDEQ must suspend or revoke downstream water withdrawals unless the user discharges a substantially equivalent quantity and quality of water at a site downstream that will not impact the public interest (Mississippi Code Annotated § 51-3-7(2). Here, the industrial wastewater is discharged into the Gulf of Mexico and not the Pascagoula River.
5. Both the JCPA and the JCUA have recently installed new water supply infrastructure and adopted significant water efficiency and water conservation measures. Many of the the JCPA’s industrial water customers have implemented water efficiency and conservation measures to minimize costs; however, it is impossible to quantify the impact of those individual industrial water conservation measures because they often involve confidential, industry specific industrial processes.
6. Faced with an emanate suspension or revocation of their withdrawal permit because of a major drought in 2000; MDEQ worked with the JCPA to find an emergency, alternative water supply to supplement flows in the Pascagoula River allow continued withdrawals. With MDEQ’s support in 2002 the JCPA formalized this agreement in a Water Purchase Contract with the Pat Harrison Waterway District for the release of up to 4,000,000,000 gallons of water from the Okatibbee Reservoir into the Pascagoula River system to maintain flows above 917 cfs at the USGS Merrill stream gage. This arrangement is limited because: a) Okatibbee was designed and is operated and maintained by the U.S. Army Corps of Engineers primarily for flood control so it may not always be able to provide the necessary water; and b) currently 50% of the water released from Okatibbee is lost to evapotranspiration before reaching the Merrill gage.
7. Climate Change and Variability studies project that over the next fifty (50) years, the project area will experience higher temperatures, less precipitation and a higher evapotranspiration rate which will likely cause more frequent, longer and severe droughts on the Pascagoula River.
8. So it is appropriate and necessary to use this worst case drought scenario to make long-term water development and management decisions on the Lower Pascagoula River.
In addition, long-term water management planning to maintain minimum stream flows is appropriate for comprehensive watershed scale management. Maintaining instream flow provides numerous environmental benefits to the Lower Pascagoula River’s wetlands and estuary which provides habitat for numerous Threatened and Endangered Species. The Lower River’s unique ecosystem also attracts tourists that support many local ecotourism businesses. 9.0 Alternatives The data and analysis presented above document that, generally in years with normal precipitation the Pascagoula River’s flows are more than sufficient to meet permitted withdrawals now and into the foreseeable future even during normal periods of reduced flow during the late summer and early fall. As show in the discussion of the Jackson County Port Authority, they already plan for and invest funds for redundant, backup systems and backups to backups in anticipation of the worst case scenario. In this instance, the worst case scenario is a projected climactic cycle with increased drought frequency, severity and duration that will require MDEQ to at least temporarily suspend or revoke water withdrawal permits on the Pascagoula River at Cumbest Bluff which will have resounding and dire impacts on National Security and National economic productivity. The potential alternatives below are evaluated in light of that situation.
36
9.1. No Action Despite the difficulties to fully and accurately quantify future water demand or the potential impacts of climate change or variability, some type of Southeastern Mississippi Regional Water Supply Solution is vital to prevent potential devastating national, regional and local consequences of any suspension of surface water withdrawals from Cumbest Bluff. Briefly, in this context, the cost of inaction (No Action) (i.e., the risk) compared to the benefits of a proactive solution mandates that some action must be taken recognizing that any alternative must be supported by “express tradeoffs in terms of costs and benefits (quantified and non-quantified short- and long-term risks)” (USEPA 2012 at p. 24). The matrix in Section 10 attempts to generally classify the environmental consequences of failing to identify a viable water supply option to maintain minimum flows during periods of prolonged, severe and frequent droughts. Based on the likely impacts of climate change or variability, no action would have unacceptable environmental consequences in the Lower Pascagoula River Basin. 9.2. Water Efficiency and Conservation Under Mississippi’s Water Law MDEQ is required to suspend or revoke all water withdrawals regardless of the amount withdrawn or of the magnitude of any new water conservation and water efficiency measures adopted to reduce or limit increases in water demand. In short, MDEQ is required to suspend or revoke any withdrawal permits at Cumbest Bluff when the Pascagoula River falls below 917 cfs at the USGS Merrill Stream Gauge. Still Sections 9.2.1 and 9.2.2 show that below the JCPA and the JCUA respectively have been remarkably more proactive than many other states in the Southeastern United States in implementing many progressive water conservation and management measures (See Manuel 2008). A somewhat arbitrary decision was made to discuss specific water conservation and efficiency aspects of the JCPA and the JCUA’s infrastructure below rather than in Sections 7.1.2 and 7.2.2 above to highlight these efforts. To the maximum extent possible, these water efficiency and conservation measures are also summarized in Region 4’s Water Efficiency Evaluation Checklist which is appended to this application. Water and water supply is a very public issue in the Lower Pascagoula River. The Gulf Region Plan, the proposed Strategic Petroleum Reserve Expansion to Richton, Mississippi, droughts and the recent Deep Water Horizon oil spill have all placed water supplies in the public eye. The JCPA and the JCUA have actively participated in innumerable public meetings, working groups and other public outreach activities to inform the public about their water supply concerns and solicit public comments and suggestions. In short, while laudable and certainly valuable to minimize future water demand increases above the permitted 100 mgd increases, water conservation and efficiency alone are not viable water supply solutions for the Lower Pascagoula River. 9.2.1. Jackson County Port Authority-Jackson County Industrial Water System The JCPA is an industrial water provider with minimal authority over whether or not individual industrial clients adopt water conservation measures. Furthermore a careful review of the water conservation references in EPA Region 4’s Guidance failed to provide information on any industrial water conservation measures. For instance, few if any of the specific water conservation measures referenced in EPA’s WaterSense documents apply to industrial water users. Finally given the confidentiality of manufacturing processes and proposed expansions or adoption of new processes by specific industrial water customers at Bayou Casotte makes it

37
impossible to describe or quantify what water efficiency or conservation practices have been implemented or are anticipated by the JCPA’s industrial water customers. Still, most of the JCPA’s industrial water customers have made tremendous efforts to be outstanding corporate citizens. In particular the Mississippi Power Company and Chevron’s Pascagoula Refinery both actively participate as members of the Pascagoula River Basin Alliance’s (PRBA) Steering Committee. The PRBA is a partnership to promote the ecological, economic and cultural health and viability of the Pascagoula, Leaf, Chickasawhay, and Escatawpa Rivers and their watersheds. Notwithstanding the limitations above, the JCPA’s Jackson County Industrial Water System (JCIWS) is a closed loop system to withdraw, transport and treat raw water from the Pascagoula River. Regrettably, this design limitation has forced the JCPA to reject some of its industrial customers’ proposals to feed graywater back into the system. The JCPA cannot risk a failure in any one industrial customer’s graywater system contaminating the water supply for all the other customers. However, the JCPA owns and operates the Black Creek Water Cooling Facility that provides Mississippi Power Company’s Plant Daniel generating facility with cooling water. This facility helps conserve water use by allowing heated cooling water to be removed from the facility and “recooled” for continuous reuse. In the Fall of 2012, JCPA expects to complete a $900,000 project to increase the Facility’s effectiveness by dredging its intake and return channels into the power plant (Jackson County Port Authority 2012). In addition as mentioned above in Section 7.1.1, the JCIWS treatment plant was designed to harvest and use rainwater to supplement or replace raw river water whenever possible. The JCIWS’s policy is to conduct monthly leak detection inspections on its pipelines and now has the redundancy to shut down individual pipelines for repair or maintenance without disrupting the industrial customers’ water supply. The JCIWS also continuously monitors water usage and will quickly respond to any indication of a significant leak. In 2009, the JCPA which owns and operates the Jackson County Industrial Water System initiated a $24 million program to repair and rehabilitate the entire system (Jackson County Port Authority 2012). The project was Mississippi Development Bank helped fund the overall project with a loan which will be repaid by user fees. As relevant, the overall project has three (3) major components:
1. Increased the water treatment plant’s capacity and water quality output; 2. Constructed a new chemical feed system and building; and, 3. Construction of a new 42” industrial water transmission line to service Chevron and other
industries on Bayou Casotte (Jackson County Port Authority 2012).
The JCPA is designing a smaller 18-inch industrial water line to provide an additional, redundant, water source for two other industrial water customers; Mississippi Phosphates and First Chemical Corporation. In summary, as an industrial water provider, the JCPA has been very proactive in implementing water conservation and efficiency policies. The JCPA has also invested in water conservation and efficiency infrastructure and aggressively maintains that infrastructure for water conservation and efficiency. However, as the JCPA’s Flow Augmentation Agreement with the PHWD demonstrates the JCPA and its industrial customers cannot survive an interruption of its surface water withdrawal permit.

38
9.2.2. Jackson County Utility Authority- Eastern Jackson County Regional Water System (W23)
As recommended by EPA Region 4’s Guidelines, the JCUA has adopted a $100 capacity consumption fee for new residential structures requiring a new water and/or sewer connection to justify the additional capacity to pump stations and treatment plants. The individual fee may be waived if a developer pays the capacity consumption fee for an entire project/development. Likewise the JCUA has tiered water rates for residential and commercial customers. Residential Rates (monthly) Commercial – Small (Up to
2”) Commercial – Large (Over 2”)
$15.00 (0 to 4,999 g) $20.00 (5,000 to 7,499 g) $25.00 (7,500 to 9,999 g) $2.00/1000 g (10,000 and up)
$25.00 (0 to 9,999 g) $25.00 + $2.00/1000 g (10,000 and up)
$200.00 (0 to 9,999 g) $200.00 + $2.00/1000 g (10,000 & up)
Table 8 - JCUA Water Rates (per gallon)
The JCUA recently began a fifty (50) year strategic planning initiative. As part of that initiative the JCUA is undertaking a very preliminary evaluation of the feasibility of planning, permitting and constructing a single new Publicly Owned Treatment Work (POTW) to discharge “greywater” into the Pascagoula River slightly upstream of the Cumbest Bluff intake structure. This would eliminate the need for both the 10 MGD Pascagoula/Moss Point and the 3 MDG Escatawpa PTOWs which discharge into the Lower Pascagoula and Escatawpa Rivers respectively. The JCUA lacks the legal authority to implement many of the other regulatory water conservation and efficiency measures. 9.3. Modified Flow Augmentation Agreement - Okatibbee Reservoir
To date this agreement has provided sufficient supplemental water into the Pascagoula River to allow the JCPA to continue water withdrawals from Cumbest Bluff. Still, from an industrial water supply view, several concerns exist with the current plan for flow augmentation along the Pascagoula River. Although the 2000 release aided in augmenting flow along the Pascagoula River during a month long drought, it did not and most likely would not provide sufficient volumes of water to allow full utilization of the JCPA’s permitted 100 mgd at the Cumbest Bluff intake.
Several factors must be considered in evaluating flow augmentation in a drought period; distance, bed / bank conditions, evapotranspiration and transpiration. It is estimated that only 50% of the water released from the Okatibbee Reservoir reaches Cumbest Bluff. This estimation is due to the extensive 251 river mile distance between the two points and the evaporative water loss during the period of flow between points. In reviewing Wax and Pote (2012) it is estimated that in the next fifty (50) years an increase in evaporation and decrease in precipitation will likely occur requiring ever larger releases from the Okatibbee Reservoir to keep the Pascagoula River flowing above 917 cfs at the USGS Merrill Stream Gauge. There are also serious concerns about the Okatibbee Reservoir’s ability to provide sufficient water storage to meet its flood control mission and augment downstream flows for a prolonged period of time. The predicted increase in evaporation rates will impact both the Reservoir’s ability to hold water and decrease the ability of released water to remain in the Pascagoula River to Cumbest Bluff.

39
There have been recent discussions regarding the use of other PHWD managed lakes and reservoirs to serve as a water supply reserve for industrial usage. Water from several of the PHWD’s smaller reservoirs could be used to supplement releases from Okatibbee during prolonged or frequent droughts. However, no other PHWD managed waterbody compares to the size and volume of Okatibbee Creek Reservoir. The nearest PHWD managed reservoir to Cumbest Bluff is located along Flint Creek near Wiggins, MS. The Flint Creek Water Park includes a 600 acre lake and is approximately 50 river miles upstream of Cumbest Bluff.
During the Lower Pascagoula River’s 2011 drought, MDEQ initiated regular meetings with the PHWD, JCPA, Chevron, Mississippi Power Company and the USACE to report on river flows, trends and projections and at the USGS Merrill Stream Gauge. Thus, flow augmentation continues to be a critical issue in the Lower Pascagoula River. Notwithstanding the potential limitations above, a modification or thorough analysis of the existing agreement between the PHWD and the JCPA merits additional analysis. There is longstanding the data on pool levels at Okatibbee Reservoir which would be available for detailed analysis of projected climate change or variability. Additional field work would be necessary to assess the impact of sedimentation on the Reservoir’s designed storage capacity. Similarly, the effectiveness of increased water releases from the Reservoir could be modeled with climate change and variability assumptions. Less data is available for the PHWD’s smaller reservoirs but they could be integrated into a projected water budget/instream flow analysis. As discussed in Section 9.4 below, given the cost and complexity to permit, construct and operate and maintain a new water supply reservoir this alternative certainly merits additional analysis.
9.4. New Water Supply Reservoir In following the verbal guidance provided by Region 4 on September 26, 2011, no detailed analysis of a specific site was done in conjunction with this application. Specifically no water budget or instream flow analysis was done for any specific site as referenced in the Appended Water Efficiency Evaluation Checklist. The discussion below is only intended to document the following: 1) that several watersheds in the Lower Pascagoula River Basin that could support a “large” to “very large” multi-use/multi-purpose reservoir designed and operated and maintained primarily for water supply; and 2) that the applicant’s are aware of the opportunities and obstacles for environmental management and financial implications of including development around a publicly owned and operated reservoir. Various agencies and local governments in Southeast Mississippi have long recognized that the lack of water surface water supply/storage capacity makes the region’s industrial and economic development extremely vulnerable to severe or prolonged droughts. Over the past forty years many studies have evaluated and identified potential sites for a large multi-use/multi-purpose reservoir in the Lower Pascagoula River Basin. Specifically, three watersheds were identified that could support a “large” to “very large” multi-use/multi-purpose reservoir for regional water supply needs:
1. The 15,900 acre Harelston Reservoir on the Escatawpa River in Jackson and George Counties was proposed to provide flood control, water quality, water supply, recreational and area redevelopment benefits. The Reservoir would provide 228,500 acre feet of storage capacity supplemental flows on the Escatawpa River during droughts and an additional 30,300 acre foot of water storage for municipal and industrial water supply. When proposed in 1967, the project had a benefit-to-cost ratio of 3.1. The ratio increased to 3.4 if economic redevelopment benefits were included in the calculation.

40
(USACE 1967). A preliminary estimate of the total cost of this project was $412,000,000 in July 2006 dollars (MDEQ 2006).
2. In 1970, the Jackson County Board of Supervisors and the Jackson County Port Authority (1970) identified two alternative Reservoir sites in the Big Cedar Creek watershed in northern Jackson and southern George County: a) a 3,200 acre Reservoir site on Big Cedar Creek and b) an alternative 5,145 acre site. Either Reservoir would have provided reliable municipal and industrial water supply, insured continued regional economic growth, provided major fresh water recreational amenities, augment depleting groundwater supplies and supplement and add reliability to existing water supply systems. The larger site was intended to provide additional water-based recreational amenities and support residential and commercial development closely associated with the Reservoir. A preliminary estimate of the total cost of the smaller Reservoir as proposed (including a water treatment plant and water transmission system) was $78,126,000 in July 2006 dollars. A preliminary estimate of the total cost of the larger Reservoir as proposed (including a water treatment plant and water transmission system) was $52,600,000 in July 2006 dollars. The lower cost reflects a significantly shorter dam length (MDEQ 2006).
3. Finally, in 1974, the Pat Harrison Waterway District (1974) evaluated a 732 acre reservoir on Big Creek in George County. The Big Creek Reservoir would have been patterned after the Flint Creek Reservoir to serve both recreational and water supply needs. The Reservoir would have provided 5 mdg volume of water supply with a maximum draw down of five (5) feet. The original project costs were estimated at $13,685,000 in July 2006 dollars (MDEQ 2006).
These four (4) proposed reservoirs were each included in the Mississippi Gulf Region Water and Wastewater Plan and recommended for further study (MDEQ 2006). In addition to the project purposes stated above, the Gulf Region Plan recognized that “large” Reservoirs would also provide more “hurricane proof” residential options and economic development opportunities in that region (MDEQ 2006).
For the most part these earlier studies emphasized surface water storage and supplies for industrial, municipal and agricultural water uses. This was appropriate because, Mississippi’s primary state regulatory agencies the Mississippi State Department of Health and MDEQ both strongly prefer groundwater to meet potable water supplies because it has significantly lower treatment costs. So to the extent possible, groundwater resources should be preserved for drinking water while non-potable industrial, commercial and agricultural uses should be encouraged to use surface water. However, preliminary analysis shows that the Lower Pascagoula River’s surface water supplies as a whole are already periodically stressed by drought and are likely to be more stressed by increased industrial water demands and global climate change which may increase the frequency and duration of regional droughts.
The Applicants recognize that any reservoir solution will have to be financially self-supporting. Fortunately, Mississippi’s largest water supply reservoir, the 33,000 acre Ross Barnett Reservoir provides an ideal example of how a multi-use/multi-purpose reservoir can be managed and operated and maintained to be self-supporting. Much like the PHWD in the Pascagoula Basin, the Pearl River Valley Water Supply District (PRVWSD) was created to develop and manage water and related resources in the Pearl River Basin (Miss. Code Ann. §§ 51-9-101 et. seq.). Like the PHWD, the PRVWSD is self-supporting, manages diverse recreational facilities and maintains a large dam. However, the PRVWSD is unique in developing residential communities on District property adjacent to the Reservoir. Specifically, the PRVWSD’s publicly owned property includes 66 subdivisions with more than 5,800 homes

41
that are which are maintained by the District’s comprehensive subdivision regulations, architectural review guidelines, active homeowners associations and protective covenants under a long-term lease (http://www.therez.ms/about.html). State agencies and member Counties are represented on the PRVWSD’s Board of Directors to ensure that the District is a responsible steward of State resources. Essentially, the PRVWSD can implement and enforce de facto zoning regulations to ensure that development on public property around Reservoir protects water quality. Further, potential homeowners are aware that the lake level is managed primarily for flood control and water supply. For these and related reasons, the Applicants will evaluate the Reservoir option as being developed and managed with the PHWD very similarly to how the PRVWSD has developed and is managing the Ross Barnet Reservoir. Including residential development on public property like the Ross Barnet will ensure that appropriate regulations are implemented and enforced and allow the overall project to incorporate additional wetlands protection and mitigation measures. Still, any large reservoir would have significant, unavoidable wetlands and stream bank impacts. Similarly any project in the Lower Pascagoula Basin may encounter aquatic and terrestrial threatened and endangered species. 9.5. Desalinization Plant
The Region 4 Project Manager explicitly requested that desalinization be included as an alternative water supply solution at the September 26, 2012 meeting. A desalinization plant would withdraw salt water from the Mississippi Sound and Gulf of Mexico and process the solution to separate the salt and other minerals from fresh water for human and industrial usage. Several methods of desalinization exist, with thermal and membrane being just two of the more common methods. In terms of costs, a desalinization plant requires very expensive infrastructure and technology and is energy intensive. From a cost perspective, transporting fresh water over long distances is more economical. It is estimated that a plant which could produce 100 mgd would costs approximately $581 million.
Unit Design
Capacity (Mgal/d)
Initial Ultimate
Qty. Req’d
Cost
Qty. Req’d
Cost
Raw Water Intake 100 1 $65,000,000 1 $65,000,000 Pumps 50 1 $25,000,000 2 $50,000,000 Pre-Treatment 50 1 $25,000,000 2 $50,000,000 Main Treatment 50 1 $60,000,000 2 $120,000,000 Piping 50/100 1 $45,000,000 15 $65,000,000 Site Work 50/100 1 $55,000,000 15 $80,000,000 Subtotal – Construction $275,000,000 $430,000,000 Contingency 20% $55,000,000 $86,000,000 Engineering $35,000,000 $55,000,000 Legal $5,000,000 $5,000,000 Acquisition $5,000,000 $5,000,000 Total: $375,000,000 $581,000,000
Table 9 – Price Estimates for Desalinization Plant

42
In terms of emissions, nearly all of the energy used for desalinization comes from fossil fuels, therefore increasing greenhouse gases and global warming. In addition to emissions, the desalinization process has a by-product of brine, a high concentration of salt and minerals, which creates buildup of salt deposits near the outflow. The outflow is typically located on the ocean floor which also alters the temperature and other aspects of the chemical composition of the surrounding ocean floor. Such changes are invariability detrimental to marine life. Regardless of the environmental impacts, water from a desalinization plant would only be used as a backup during period of drought when MDEQ might terminate or revoke surface water withdrawals from Cumbest Bluff. As a backup, the plant would be intended to sit idle for years yet be ready to start up and deliver large volumes of water after a month or so of advance notice. This production cycle would cause exorbitant operation and maintenance costs. The plant would not have a regular customer unless the JCPA or an individual industrial customer was willing to totally abandon its much less expensive surface water source. The JCIWS infrastructure is all designed around pulling surface water from Cumbest Bluff and would be unable to accept or deliver water from a desalinization plant without extensive and expensive modification. Finally, regardless of meeting industrial water demands, a desalinization plant would not be able to provide water upstream to provide any environmental benefits during prolonged droughts. For these reasons, a desalinization plant does not warrant further consideration as a potentially viable, cost effective alternative. 10.0 Least Environmentally Damaging Practicable Alternative It is somewhat contradictory or at least ironic that the only verbal guidance provided by Region 4 pertained to certain alternatives that should be evaluated and stressing that for purposes of the Region 4 Guidance water storage/supply reservoirs should be evaluated as one of several alternatives. To restate the material presented in Section 8 essentially Region 4’s written Guidance was intended to:
1. Establish a projected water demand (quantity of water needed) 2. Force then the assumed water utility applicant to take actions to ensure that to the
maximum extent practicable, they are implementing sustainable water management practices to eliminate the need for, or reduce the impacts to aquatic resources from future water facility expansions including the construction of water supply reservoirs.
3. Finally, for any remaining water deficit, alternatives are identified and evaluated to select one or more preliminary “least environmentally damaging practicable alternative” for further analysis in the subsequent permitting process.
This application follows this approach and finds that water was initially proposed as a water storage/supply project is in reality a project to maintain instream flow over the next fifty (50) years when climate change/variability projections are for more severe, prolonged and frequent droughts in the project area (watershed). This application’s analysis identifies a wide range of significant water conservation and efficiency measures that have already been implemented in the project area; however, as shown in Table 10 based on a careful analysis of the project purpose and need, only two potential alternatives remain as potential “least environmentally damaging practicable alternatives.” Accordingly, the applicants intend to proceed with the permitting process which will evaluate three (3) alternatives in details. Those alternatives are:

43
1) No Action, 2) various modifications to the existing flow augmentation agreement, and 3) a multi-use/multi-purpose water storage/supply reservoir.
PRELIMINARY ALTERNATIVES COMPARISON
Topic No Action1
Water Efficiency
Water Conservation
Okatibbee Reservoir Flow Augmentation Agreeement
New Water Suppply Reservoir
Desalinization Plant
Land Use None None None None
Significant- reservoir footprint
Significant-coastal zone
Structures Impacted None None None None Moderate Minimal Roads Impacted None None None None Moderate None
Water Quality Moderate None None Moderate Minimal Significant - Brine
discharge Wetlands Moderate None None Moderate Significant Moderate-Marsh Floodplain/ Floodway Moderate None None Minimal Moderate None
Streams Moderate None None Minimal Moderate Minimal
Coastal Zone Significant None None Significant Minimal
Significant-marine ecology and environment
T & E Species
Moderate None None Minimal Moderate
Significant-brine discharge,
temperature change, intake
structure Cultural Resources None None None None Minimal Minimal
Construction Cost
0.00 0.00 0.00 $183,000 annually
$50,000,000 (excluding wetlands/stream bank mitigation costs) 581,000,000.00
1 Based on projected impacts from climate change/variability
Table 10 - Environmental Impact Matrix

44
11.0 References American Rivers. 2009. America’s Most Endangered Rivers of 2009. Available at:
http://www.americanrivers.org/newsroom/press-releases/2009/nationalmer-press.html. Accessed on Nov. 2, 2012.
City of Pascagoula. 2010. 2010 Comprehensive Plan. 229 pages. Available at: http://cityofpascagoula.com/wp-content/uploads/2011/06/Pascagoula_Comprehensive_Plan_ADOPTED_December_2010_with_cover.pdf. Accessed Nov. 2, 2012.
Harvey, Edward J., Golden, Harold G., and Jeffery, H. G., 1965, Water Resources of the Pascagoula Area Mississippi, Geological Survey Water-Supply Paper 1763.
Interagency Climate Change Adaption Task Force. 2011. National Action Plan Priorities for Managing Freshwater Resources in a Changing Climate. (October 2011). 76 p.
Jackson County Board of Supervisors and The Jackson County Port Authority. 1970. The Jackson County Water Supply System, A proposed 100 Million Gallon Per Day Water Supply System with Multipurpose 3800 Acre Reservoir, An Overview of a Regional Public Works Improvement Project and Multi-Agency Participating Development. Pascagoula MS. 1970_____. 1972. Synopsis of Preliminary Engineering Report for Proposed Big Cedar Creek Reservoir.
Federal Interagency Panel on Climate Change and Water Data Information. 2011. Report to Congress. Strengthening the scientific understanding of climate impacts to freshwater resources of the United States. 56 p. Available at: http://www.doi.gov/news/pressreleases/loader.cfm?csModule=security/getfile&pageid=260567. Accessed Nov. 2, 2012.
Frazier, D. E., and Osanik, A., 1969, Recent peat deposits - Louisiana coastal plain: in Dapples, E. C., and Hopkins, M. E., eds., Environments of Coal Deposition, Geological Society of America Special paper 114, p. 63-86.
Gulf Conservation Coalition. 2008. Statement of Eric Richards, Spokesman to Mr. Donald Silawsky. (on file with Pickering Firm).
Gulf Restoration Network. 2008. Statement of Jeff Grimes, Assistant Director, Water Resources.
ICF International Company. 2009. Effects of the Withdrawal of Water on Protected Species in the Pascagoula River: An Application of the Instream Flow Incremental Methodology. Strategic Petroleum Reserve Richton. Prepared for the U.S. Dept. of Energy, Office of Fossil Energy. By. Earle, C.J., W. McConnaha, and J. Schwartz. Available at: http://www.fossil.energy.gov/programs/reserves/spr/Pascagoula_IFIM.pdf Accessed Nov. 2, 2012.
Ilushchenko. Simon. 2012. Continental US Climate Changes 1985-2012. Available on line at: http://www.simonf.com/srex/noaa/map/#index=PCP&p=0&units=I&start=1895&vis%5Bd%5D=1&vis%5Bs%5D=0&vis%5Bc%5D=1&seq=164&station= Accessed on October 30, 2010.
Instream Flow Council. 2002. Instream Flows for Riverine Resource Stewardship. Jackson County Port Authority of Pascagoula. 2012. Port RePort July 2012. Rehabilitation of
the Jackson County Industrial Water System. Pg. 10. Available at: http://portofpascagoula.com/pdfs/RePort0712.pdf Accessed Nov. 2, 2012.
Manuel, J. 2008. Drought in the Southeast Lessons for Water Management. Environmental Health Perspectives 116(4)A168-A171.
Mississippi Business Journal. 2012. Shipbuilder to add 5000+ jobs over the next two years. November 5, 2012. Available at: http://msbusiness.com/blog/2012/11/05/shipbuilder-to-add-5000-jobs-over-next-two-years/ Accessed on November 6, 2012.

45
Mississippi Commission on Environmental Quality Regulation LW-2. Surface Water and Groundwater Use and Protection. Amended December 10, 2009.
Mississippi Department of Environmental Quality. 2012. Personal Communication. James MacLellan, P.E. Director, Drillers Licensing and Dam Safety Division.
_____. 2012a. Pascagoula River Basin Designated Uses. Available at: http://www.deq.state.ms.us/MDEQ.nsf/page/WMB_pascagouladesignate?OpenDocument Accessed November 6, 2012.
_____. 2012b. Personal Communication. Charlotte Bryant Byrd, Office of Land and Water Resources. (On file with Pickering Firm).
_____. 2012c. State of Mississippi Water Quality Assessment 2012 Section 305B Report. 64 pages. Available at: http://www.deq.state.ms.us/MDEQ.nsf/pdf/FS_MS_12_Section_305b_WQA_report/$File/2012_305b_report.pdf?OpenElement. Accessed on November 11, 2012. _____. 2012d. Data request. Brad Segrest, Data Integration Division. (On file with Pickering Firm). _____. 2006. Gulf Region Water and Wastewater Plan. Available at
http://www.msgulfregionplan.org/ (Accessed on Nov. 2, 2012) _____. 2001. Pascagoula River Basin Status Report 2001. 29 p. Available at:
http://www.deq.state.ms.us/MDEQ.nsf/pdf/WMB_pastatusreport2001/$File/pastatusreport2001.pdf?OpenElement Accessed on November 11, 2012.
_____. 2000. Ground-Water Study of Historical Water-Level and Water-Quality Data in Jackson County, Mississippi. Open-file Report 99-102; May 1999; Revised February 2000.
_____. 1998. Presentation to Commission on Environmental Quality for Adoption of a Low-Flow Standard in the Pascagoula River At Cumbest Bluff in Jackson County, Mississippi. (August 27, 1998). On file with Pickering Firm.
_____. 1995. Pascagoula River Low Flow Management Study Phase 4 Report Final. Prepared by Harza Engineering. July 1995.
Mississippi Research and Development Center. 1978. Availability of Additional Ground-Water Supplies in the Pascagoula Area, Mississippi. By Wasson, B.E. Cooperative Study by U.S. Geological Survey and Mississippi Research and Development Center.
Mulvaney, T.M. and A.J. Park. 2008. Opportunities for Protecting Instream Flows in Mississippi. Mississippi-Alabama Sea Grant Legal Program. MASGLP 08-007-14. 18 pages. Available at: http://masglp.olemiss.edu/Opportunities.pdf (Accessed on Nov. 2, 2012).
Natural Resources Defense Council. 2012. Ready or Not: An Evaluation of State Climate and Water Preparedness Planning. NRDC Document April 2012 D:12-03-D. (321 pages). Available at: http://www.nrdc.org/water/readiness/files/Water-Readiness-issue-brief.pdf Accessed on Nov. 2, 2012.
_____. 2010. Climate Change, Water, and Risk: Current Water Demands Are Not Sustainable (4 pages). July 2010. Available at: http://www.nrdc.org/globalWarming/watersustainability/files/WaterRisk.pdf Accessed October 30, 2012.
_____. 2010a. Mississippi With Climate Change Impacts. Available at: http://www.nrdc.org/globalWarming/watersustainability/Mississippi_With_Climate_Change.pdf Accessed October 30, 2012.
_____. 2010b. Mississippi Without Climate Change Impacts. Available at: http://www.nrdc.org/globalWarming/watersustainability/Mississippi_Without_Climate_Change.pdf Accessed October 30, 2012.
Nelson, Karen. 2011. Chevron announces $1.4 billion expansion. The Sun Herald. On File with Pickering Firm.
_____. 2003. Industrial Drawdown. The Sun Herald. On File with Pickering Firm.

46
Pat Harrison Waterway District. 2001. Drought Report. Internal PowerPoint Presentation. On file with Pickering Firm.
Pat Harrison Waterway District. 1974. Engineering Study of Proposed Big Creek Water Park. Pat Harrison Waterway District and the Jackson County Port Authority. 2003. Water Supply
Contract. (On file with Pickering Firm). Seager, R., Tzanova, A., Nakamura, J., Drought in the Southestern United States: Causes,
Variability over the Last Millennium and the Potential for Future Hydroclimate Change. Journal of Climate. Vol. 22:5021-5045.
Tetra Tech, Inc. 2010. Evaluating Sustainability of Projected Water Demands Under Climate Change Scenarios. Prepared for Natural Resources Defense Council (30 pages).
Thompson, David E. (after Alvin R. Bicker, Jr. , 1969), September 2011, Geologic Map of Mississippi.
Turnipseed, P. and W.T. Baldwin. 2001. Impact of Drought Conditions on Mississippi Streams and Rivers in 2000. Proceedings of the Mississippi Water Resources Conference.
U.S. Army Corps of Engineers, Mobile District. 1967. Pascagoula River Comprehensive Basin Study, Vol. III. Appendix D-Engineering Studies for Major Reservoirs.
U.S. Department of Energy. Office of Petroleum Reserves. 2006. Site Selection for the Expansion of the Strategic Petroleum Reserve Final Environmental Impact Statement. DOE/EIS-0385.
United States Energy Information Administration. 2012. Oil: Crude and Petroleum Products Explained. U.S. Refineries Operable Capacity (2011 data). http://www.eia.gov/energyexplained/index.cfm?page=oil_refining#tab4 Accessed on October 30, 2012.
United States Environmental Protection Agency. 2012. National Water Program 2012 Strategy: Response to Climate Change (Public Comment Draft). March 2012.
_____. 2008. National Water Program Strategy Response to Climate Change. Office of Water. EPA 800-R-08-001. Replace with March 2012
United States Geologic Survey. 1992. Techniques for Estimating 7-Day, 10-Year Low-Flow Characteristics for Ungaged Sites on Streams in Mississippi. Water-Resources Investigations Report 91-4130. By Telis, Pamela. A.
_____. 1965. Water Resources of the Pascagoula Area Mississippi. Geological Survey Water-Supply Paper 1763. By. Harvey, E.J., H.G. Golden and H.G. Jeffery.
_____. 1967. Ground-Water Resources of the Pascagoula River Basin Mississippi and Alabama. Geological Survey Water-Supply Paper 1839-K. By. Necome, R. Jr.,
University of Georgia Athens, River Basin Science and Policy Center. 2002. Reservoirs in Georgia: Meeting Water Supply Needs While Minimizing Impacts. 42 pages.
Wax, Charles and J.W. Pote. 2012. Draft. George County Climate Variability Analysis. Technical Report. Mississippi State University.
Williams, Charles H., Dinkins, Theo H., and McCutcheon, Thomas E., 1967, George County Geology and Mineral Resources, Mississippi Geological Survey Bulletin 108, plate 4.

47
12.0 Appendix – EPA Region 4-Water Efficiency Evaluation Check list Note: The Appended EPA Region 4 Water Efficiency Evaluation Check list essentially summarizes and is documented by the narrative and references above. This project’s applicants are not water utilities and neither they nor the two (2) primary water withdraw permittees (JCPA and JCUA) are not authorized under the Mississippi Code to directly implement or enforce some of the actions required, recommended or suggested by Region 4’s Checklist. Still, we believe that although not widely publicized, the JCPA and the JCUA have both been remarkably proactive in adopting water conservation and efficiency measures to minimize their water requirements and maximize their on-site water storage capacity and the use of every drop of water withdrawn or proposed to be withdrawn from the Lower Pascagoula River.

48
WATER EFFICIENCY EVALUATION CHECKLIST
Sustainable Water Management
Practice
Strategy Strategy Minimums (*Indicates that SRF
Loan Funds are available for these
purposes)
Strategy Met
Estimated Demand
(b) Meter all water users
Must have a program for metering individual users such as multi-family residential units and individual commercial operations*.
JCPA-Yes JCUA-Yes
(c) Build smart for the future
Must have requirements for new buildings and new landscapes to be water efficient (Water Sense fixtures and irrigation systems). If not feasible, must have a strong incentive program (such as rate reductions) to encourage new buildings and new landscapes are water efficient (Water Sense fixtures and irrigation systems)*.
JCPA-NA JCUA-NA
The Water Sense program does not include measures for industrial water customers. The potable water recommendations exceed the JCUA’s authority under State law.
(d) Harvest rainwater for non-potable use
Must have strong incentives for rainwater harvesting for new and existing facilities.*
JCPA-Yes JCUA-NA
The JCPA has a very robust rainwater harvesting system integrated with its treatment plant’s stormwater management system
(e) Retrofit all buildings
Should have at least one program which provide ordinance or incentives for retrofits of existing buildings.*
JCPA-NA JCUA-NA
Exceeds the State Legal authority of applicants and water providers.
(f) Landscape to minimize water waste
Should have at least one program which provides incentives for minimizing irrigation needs for existing landscapes.*
JCPA-NA JCUA-NA
Exceeds the State Legal authority of applicants and water providers.
(4) Watershed Approaches (a) Develop Water Budget/ Instream Flow Study
Should conduct an instream flow study for any water body proposed for reservoir impacts.
See Sections 6.1.1 & 6.1.2
NA-As per a discussion with Region 4, this application identifies and evaluates numerous alternatives and did not prioritize a reservoir.
(b) Seek opportunities for wetlands restoration
JCPA-NA JCUA-NA
NA-Application attempts a gross assessment of wetlands impacts from various alternatives

49
Sustainable Water Management
Practice
Strategy Strategy Minimums (*Indicates that SRF
Loan Funds are available for these
purposes)
Strategy Met
Estimated Demand
(c) Seek opportunities for ground water recharge
JCPA-NA JCUA-NA
NA-As per discussion above, groundwater is not a viable solution to the identified water needs.
(d) Evaluate opportunities for use of treated wastewater
Should provide information on the availability of reclaimed wastewater, the cost-benefit of using treated wastewater in lieu of potable water for appropriate uses such as irrigation and recharge where it is available, and any area-wide studies on the potential for developing reclaimed wastewater. If the water utility also owns and operates the wastewater utility, an area-wide study on the potential use should be initiated
JCPA-NA JCUA-Yes
The JCUA is undergoing a long-term strategic planning process to explore the feasibility of consolidating and relocating its two wastewater plants for wastewater reuse. The new strategic plan is still being developed.
(e) Evaluate opportunities for use of treated graywater
Should provide information on any state restrictions to reuse of graywater. If no statewide restrictions exist, local barriers to graywater reuse should be investigated and guidelines should be developed to allow reuse of treated graywater in appropriate situations.
JCPA- NA JCUA-investigating
JCUA-potential 1 mgd graywater return in long-term
(f) Ensure the source water is protected
Should have a source water protection plan in place. An additional plan should be developed for any sources under development.
JCPA-NA JCUA-yes GW, no for SW
NA- Depending on the preferred alternative, a source water protection plan may need to be developed and implemented.
Summary Total estimated demand reduction
Should provide an accounting of the estimated demand reduction with and without the implementation of the WE measures.
In the long-term there would be a 1 mgd reduction if JCUA relocates its waste water treatment plants and obtains a graywater discharge permit.


