appendix a. deming's 14 points for management978-3-662-22419-9/1.pdf · appendix a....
TRANSCRIPT

Appendix A. Deming's 14 points for management
1. Create constancy of purpose toward improvement of product and service with the aim to become competitive, stay in business and provide jobs.
2. Adopt the new philosophy. We are in a new economic age, created by Japan. A transformation of Western style of management is necessary to halt the continued decline of industry.
3. Cease dependence on inspection to achieve quality. Eliminate the need for mass inspection by building quality into the product in the first place.
4. End the practice of awarding business on the basis of price. Purchasing, design, manufacturing and sales departments must work with the chosen suppliers so as to minimise total cost, not initial cost.
5. Improve constantly, and for ever, every activity in the company so as to improve quality and productivity and thus constantly decrease costs.
6. Institute education and training on the job, including management.
7. Institute improved supervision. The aim of supervision should be to help people and machines do a better job.
8. Drive out fear so that everyone may work effectively for the company.
9. Break down the barriers between departments. People in research, design, sales and production must work as a team to tackle production and usage problems that may be encountered with the product or service.
10. Eliminate slogans, exhortations and targets for the workforce asking for new levels of productivity and zero defects. The bulk ofthe causes of low quality and low productivity belong to the system and will not be in the direct control of the workforce.
11. Eliminate work standards that prescribe numerical quotas. Instead, use resources and supportive supervision, using the methods to be described for the job.
12. Remove the barriers that rob the hourly worker of the right to pride of workmanship. The responsibility of supervision must be changed from sheer numbers to quality. Equally, remove barriers that rob people in management and engineering oftheir right to pride of workmanship.
13. Institute a vigorous programme of education and retraining. New skills are required for changes in techniques, materials and services.
14. Put everybody in the organisation to work in teams to accomplish the transformation.
343
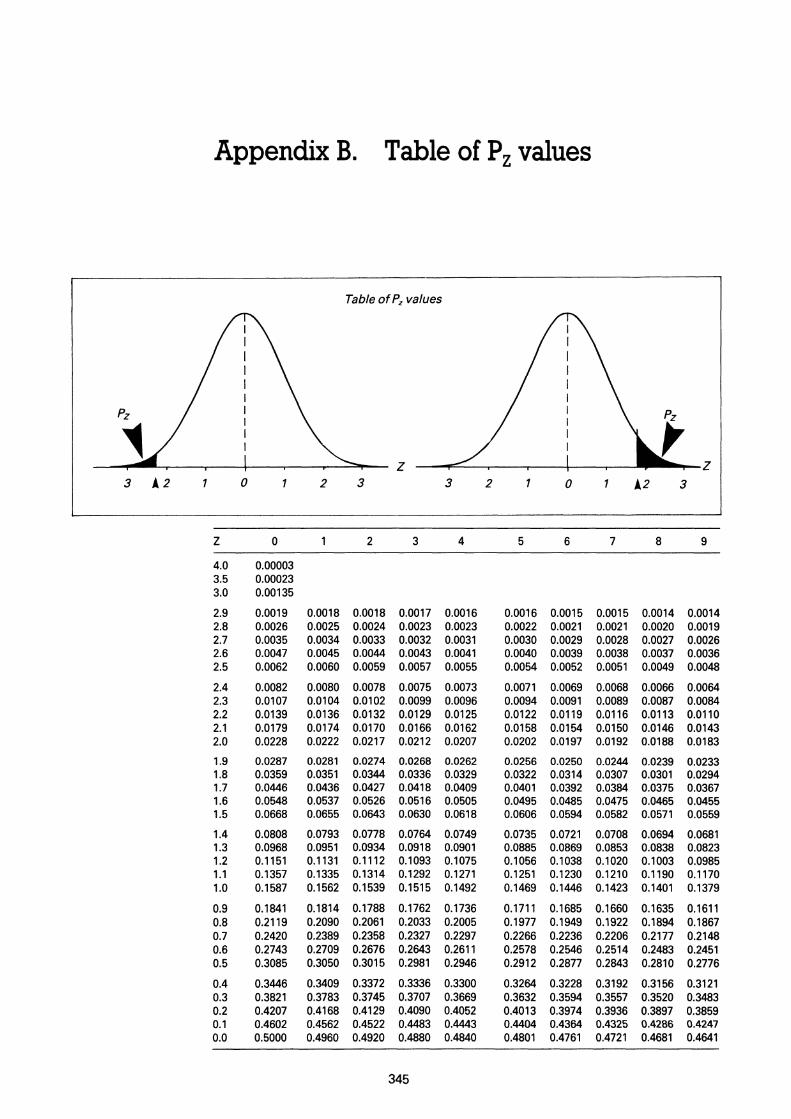
Appendix B. Table of P z values
Table of Pz values
3 .. 2 1 0 2 3 3 2 0 i2 3
z 0 2 3 4 5 6 7 8 9
4.0 0.00003 3.5 0.00023 3.0 0.00135
2.9 0.0019 0.0018 0.0018 0.0017 0.0016 0.0016 0.0015 0.0015 0.0014 0.0014 2.8 0.0026 0.0025 0.0024 0.0023 0.0023 0.0022 0.0021 0.0021 0.0020 0.0019 2.7 0.0035 0.0034 0.0033 0.0032 0.0031 0.0030 0.0029 0.0028 0.0027 0.0026 2.6 0.0047 0.0045 0.0044 0.0043 0.0041 0.0040 0.0039 0.0038 0.0037 0.0036 2.5 0.0062 0.0060 0.0059 0.0057 0.0055 0.0054 0.0052 0.0051 0.0049 0.0048
2.4 0.0082 0.0080 0.0078 0.0075 0.0073 0.0071 0.0069 0.0068 0.0066 0.0064 2.3 0.0107 0.0104 0.0102 0.0099 0.0096 0.0094 0.0091 0.0089 0.0087 0.0084 2.2 0.0139 0.0136 0.0132 0.0129 0.0125 0.0122 0.0119 O.Q116 0.0113 0.0110 2.1 0.0179 0.0174 0.0170 0.0166 0.0162 O.Q158 0.0154 O.Q150 0.0146 0.0143 2.0 0.0228 0.0222 0.0217 0.0212 0.0207 0.0202 0.0197 0.0192 0.0188 0.0183
1.9 0.0287 0.0281 0.0274 0.0268 0.0262 0.0256 0.0250 0.0244 0.0239 0.0233 1.8 0.0359 0.0351 0.0344 0.0336 0.0329 0.0322 0.0314 0.0307 0.0301 0.0294 1.7 0.0446 0.0436 0.0427 0.0418 0.0409 0.0401 0.0392 0.0384 0.0375 0.0367 1.6 0.0548 0.0537 0.0526 0.0516 0.0505 0.0495 0.0485 0.0475 0.0465 0.0455 1.5 0.0668 0.0655 0.0643 0.0630 0.0618 0.0606 0.0594 0.0582 0.0571 0.0559
1.4 0.0808 0.0793 0.0778 0.0764 0.0749 0.0735 0.0721 0.0708 0.0694 0.0681 1.3 0.0968 0.0951 0.0934 0.0918 0.0901 0.0885 0.0869 0.0853 0.0838 0.0823 1.2 0.1151 0.1131 0.1112 0.1093 0.1075 0.1056 0.1038 0.1020 0.1003 0.0985 1.1 0.1357 0.1335 0.1314 0.1292 0.1271 0.1251 0.1230 0.1210 0.1190 0.1170 1.0 0.1587 0.1562 0.1539 0.1515 0.1492 0.1469 0.1446 0.1423 0.1401 0.1379
0.9 0.1841 0.1814 0.1788 0.1762 0.1736 0.1711 0.1685 0.1660 0.1635 0.1611 0.8 0.2119 0.2090 0.2061 0.2033 0.2005 0.1977 0.1949 0.1922 0.1894 0.1867 0.7 0.2420 0.2389 0.2358 0.2327 0.2297 0.2266 0.2236 0.2206 0.2177 0.2148 0.6 0.2743 0.2709 0.2676 0.2643 0.2611 0.2578 0.2546 0.2514 0.2483 0.2451 0.5 0.3085 0.3050 0.3015 0.2981 0.2946 0.2912 0.2877 0.2843 0.2810 0.2776
0.4 0.3446 0.3409 0.3372 0.3336 0.3300 0.3264 0.3228 0.3192 0.3156 0.3121 0.3 0.3821 0.3783 0.3745 0.3707 0.3669 0.3632 0.3594 0.3557 0.3520 0.3483 0.2 0.4207 0.4168 0.4129 0.4090 0.4052 0.4013 0.3974 0.3936 0.3897 0.3859 0.1 0.4602 0.4562 0.4522 0.4483 0.4443 0.4404 0.4364 0.4325 0.4286 0.4247 0.0 0.5000 0.4960 0.4920 0.4880 0.4840 0.4801 0.4761 0.4721 0.4681 0.4641
345

Appendix C. Control chart constants and formulae
X and R charts and X and s charts*
X and R charts X and s charts
Chart for Chart for ave@ges ave@ges Chart for
(X) Chart for ranges (R) (X) standard deviations (s)
Divisors for Divisors for Factors for estimate of Factors for Factors for estimate of Factors for
Subgroup control standard control control standard control size limits deviation limits limits deviation limits
n A2 d2 D3 D4 A3 C4 83 84
2 1.880 1.128 3.267 2.659 0.7979 3.267 3 1.023 1.693 2.574 1.954 0.8862 2.568 4 0.729 2.059 2.282 1.628 0.9213 2.266 5 0.577 2.326 2.114 1.427 0.9400 2.089
6 0.483 2.534 2.004 1.287 0.9515 0.030 1.970 7 0.419 2.704 0.076 1.924 1.182 0.9594 0.118 1.882 8 0.373 2.847 0.136 1.864 1.099 0.9650 0.185 1.815 9 0.337 2.970 0.184 1.816 1.032 0.9693 0.239 1.761
10 0.308 3.078 0.223 1.777 0.975 0.9727 0.284 1.716
11 0.285 3.173 0.256 1.744 0.927 0.9754 0.321 1.679 12 0.266 3.258 0.283 1.717 0.886 0.9776 0.354 1.646 13 0.249 3.336 0.307 1.693 0.850 0.9794 0.382 1.618 14 0.235 3.407 0.328 1.672 0.817 0.9810 0.406 1.594 15 0.223 3.472 0.347 1.653 0.789 0.9823 0.428 1.572
16 0.212 3.532 0.363 1.637 0.763 0.9835 0.448 1.552 17 0.203 3.588 0.378 1.622 0.739 0.9845 0.466 1.534 18 0.194 3.640 0.391 1.608 0.718 0.9854 0.482 1.518 19 0.187 3.689 0.403 1.597 0.698 0.9862 0.497 1.503 20 0.180 3.735 0.415 1.585 0.680 0.9869 0.510 1.490
21 0.173 3.778 0.425 1.575 0.663 0.9876 0.523 1.477 22 0.167 3.819 0.434 1.566 0.647 0.9882 0.534 1.466 23 0.162 3.858 0.443 1.557 0.633 0.9887 0.545 1.455 24 0.157 3.895 0.451 1.548 0.619 0.9892 0.555 1.445 25 0.153 3.931 0.459 1.541 0.606 0.9896 0.565 1.435
UCLx =X + A2R UCLx = X + A3s
LCLx =X - A}i R LCLx = X - A3s a= s o= d2 UCLA = D4R UCLs = 84s C4
LCLR = D3R LCL5 = s3s
*Reprinted, with permission, from STP 150-Manual on the Presentation of Data and Control Chart Analysis. Copyright American Society for Testing and Materials.
347
348 SPC AND CONTINUOUS IMPROVEMENT
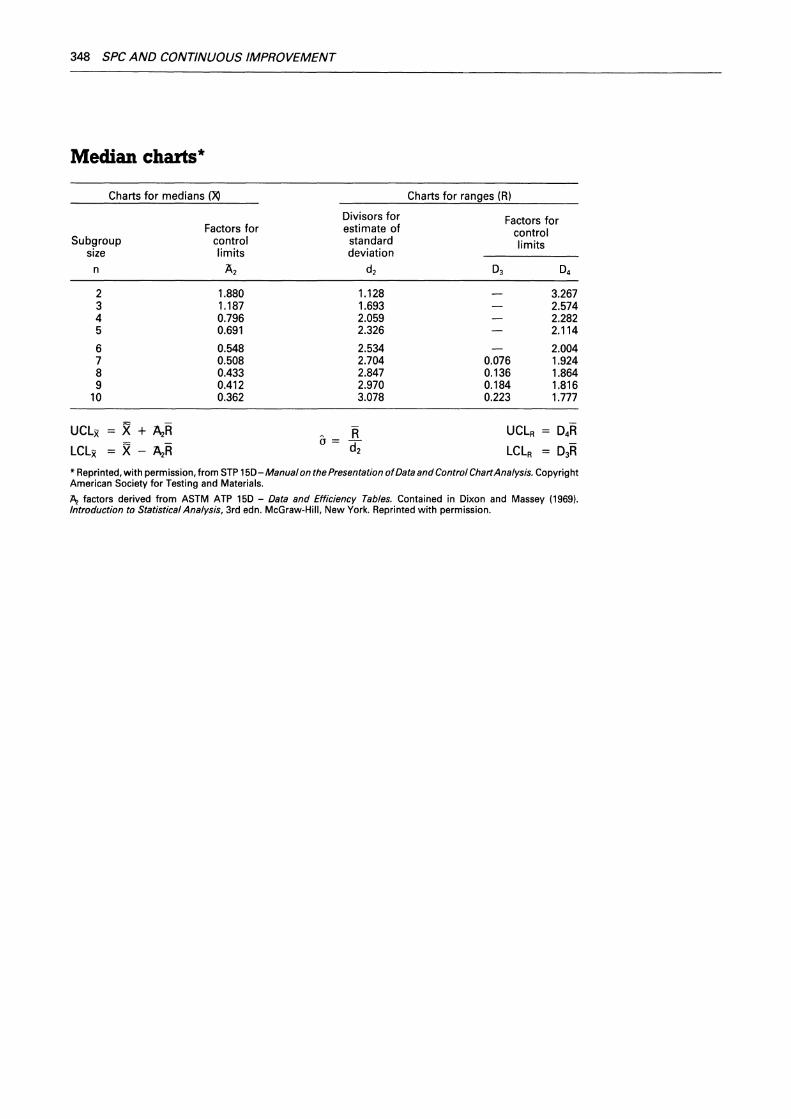
Median charts*
Charts for medians (}()
Factors for Subgroup control
size limits
n A2
2 1.880 3 1.187 4 0.796 5 0.691
6 0.548 7 0.508 8 0.433 9 0.412
10 0.362
UCLx x + ~R LCLx x ~R
Divisors for estimate of standard deviation
d2
1.128 1.693 2.059 2.326
2.534 2.704 2.847 2.970 3.078
R a= d2
Charts for ranges (R)
Factors for control limits
0.076 0.136 0.184 0.223
3.267 2.574 2.282 2.114
2.004 1.924 1.864 1.816 1.777
*Reprinted, with permission, from STP 150-Manual on the Presentation of Data and Control Chart Analysis. Copyright American Society for Testing and Materials.
~ factors derived from ASTM ATP 150 - Data and Efficiency Tables. Contained in Dixon and Massey (1969). Introduction to Statistical Analysis, 3rd edn. McGraw-Hill, New York. Reprinted with permission.

Appendix D. Control chart constants (British standards)
Control chart limits for sample mean (X). To obtain limit~ multiply w by the appropriate value of A' 0.025 and A' 0_00, then add to, and subtract from, X
For For Sample size inner limits outer limits
n A' o.o2s A' o.oo1
2 1.23 1.94 3 0.67 1.05 4 0.48 0.75 5 0.38 0.59 6 0.32 0.50
The above extract from BS 2564:1955 is reproduced by permission ofBSI. Copies ofthecompletestandard can be obtained from them at Linford Wood, Milton Keynes, Bucks MK14 6LE.
349

Appendix E. Derivation of US and British control chart constants
Derivation of control chart constants based on US standards (ANSI) For a distribution of individual readings, lines corresponding to 3 standard deviations (i.e. a probability level of 0.0013) away from the ground mean X are given by
X ± 3a
When considering samples of size n rather than individual readings, the standqrd deviation a is replaced by the standard error a I yn. But a can be replaced by the estimate R /d2, where d2 depends on sample size. Therefore
Control limits are at = 3 R X± ,r;:.. -d
vn 2
= 3 -=X ± yn d2. R
The expression yn3 d2 is denoted as A2 and hence
UCLx =X+ A)~
LCLx = X - A;R
If n = 5, for example, then
\15 X 2.326
0.577
Tables of A2 for different n values are tabulated in Appendix C.
Derivation of British control chart constants based on British Standards (BS2564) For a distribution of individual readings, lines corresponding to 3.09 standard deviations (i.e. a probability level of 0.001, or exactly 1 in 1000) away from the grand mean are given by
X ± 3.09a
351

352 SPC AND CONTINUOUS IMPROVEMENT
When considering samples of size n rather than individual readings, the standard deviation a is replaced by the standard error a I yn. Therefore control limits, which are called action limits, are at
= (J X± 3.09 Vn
But a can be replaced by the estimate R I d2, where d2 depends on sample size. Therefore
Action limits are at X=+ 3.09. B - Vn d2
= x ± }no~2. R
The expression }n°~2 is denoted by A' o.oo1 and hence
Upper action limit (UAL) = X + A'0.001 R
Lower action limit (LAL) = X - A'o.oo1 R
If n = 5, for example, then
A' o.oo1 = 3·09 ~
3.09 y'5 X 2.326
= 0.594
Tables of A'0.001 for different n values are tabulated in Appendix D. In addition to the action limits, the British system uses warning limits set at a 1 in 40
probability level, i.e. at
= (J
X± 1.96Vn
With a replaced by R I d2 this becomes
X= + 1.96 . B. - Vn d2
= x ± }n9~2 . "R.
The expression }n9~2 is denoted by A' o.o25 and hence
Upper warning limit (UWL) = X + A' 0.025 R
Lower warning limit (LWL) = X - A'o.o25 R
If n = 5, for example, then
A' o.o25 = 1·96 ys d2
1.96 = y'5 X 2.326
0.377
Tables of A' 0.025 for different n values are also tabulated in Appendix D.

Appendix F. Derivation of constants for individual/moving R chart
Individual chart UCLx = X + 3s
LCLx = X - 3s
where s is obtained using the relationship R I d2•
With a moving range of 2, as in the PPG chart, d2 is 1.128. Thus
3R 3s --1.128
= 2.66R
Therefore
- -UCLx = X + 2.66R
LCLx = X - 2.66R
Moving R chart UCLR = 04R
04, for n = 2, is 3.267R.
Therefore
UCLR = 3.267R
353

Appendix G. Symbols and definitions (in order of appearance)
f
X x,, X2, ... X n L X
x R (orw) s !! a 1\
z Pz k UCL LCL A2
Frequency: the number of observed values in a class interval of a frequency distribution Observed value of variable or attribute Specific values of X X bar: arithmetic mean of a sample Number of observed values in a sample Sigma: sum of X double bar: mean of a series of X values. Sometimes called the grand mean Curly X: median Range of a number of readings Standard deviation of a sample Arithmetic mean of a population Standard deviation of a population Best estimate; e.g. ~ = s = Rfd2
Mean of a series of R values Process capability index. A measure of the variability of the process in relation to the specification Units of standard deviation away from the mean of a normal distribution Area in the tail of a normal curve Number of samples Upper control limit Lower control limit Const<
356 SPC AND CONTINUOUS IMPROVEMENT
u Number of nonconformities in a sample of size n p Mean proportion of non-conforming units in a series of samples of varying size np Mean number of non-conforming units in a series of samples of constant size n u Mean number of nonconformities in a series of samples of varying size c Mean number of nonconformities in a series of samples of constant size n T Target value, used in Cusum analysis ARL Average run length: the number of points required, on average, to detect a signal
that the process has changed K1/K2 Reference values used in numerically based Cusum procedures Cm Machine capability index. A measure of the variability of the machine in relation
to the specification Cmk Machine capability index. A measure of the variability of the machine, and its
setting, in relation to the specification

Appendix H. Various charts
(X, R) chart
(X moving R) chart
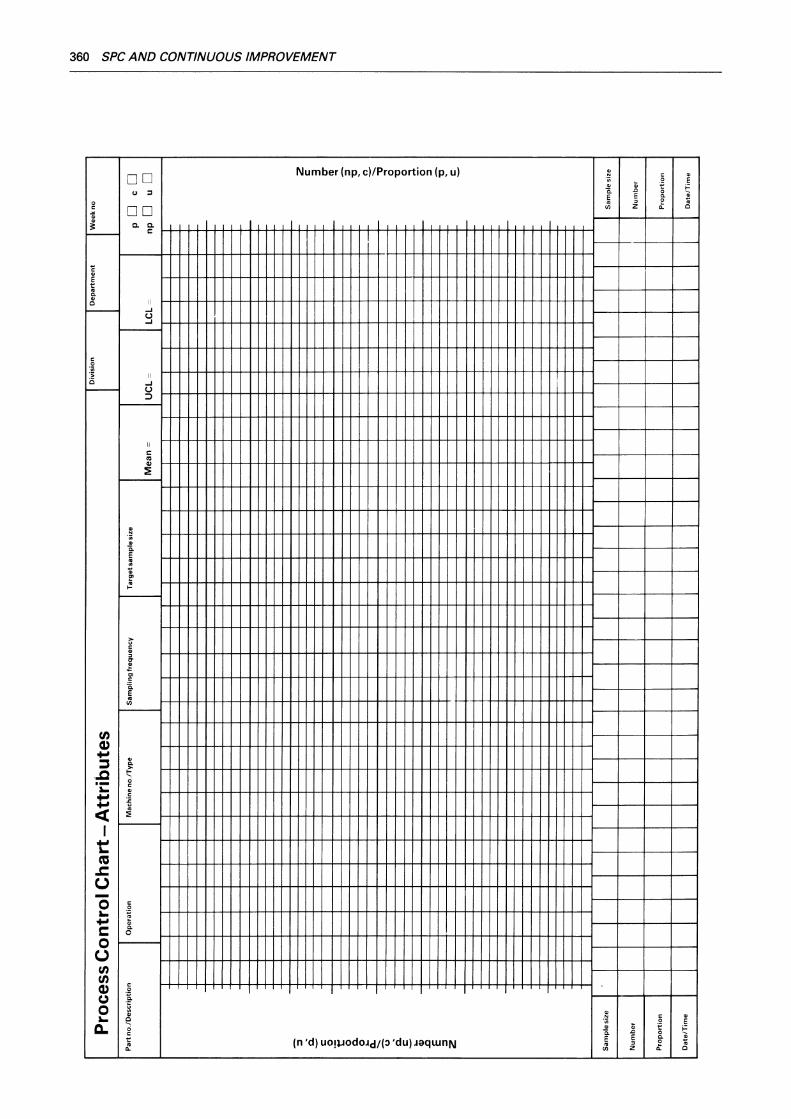
Attribute chart
Multiple characteristics chart
Cusum chart
Machine capability studies chart
Process log sheet
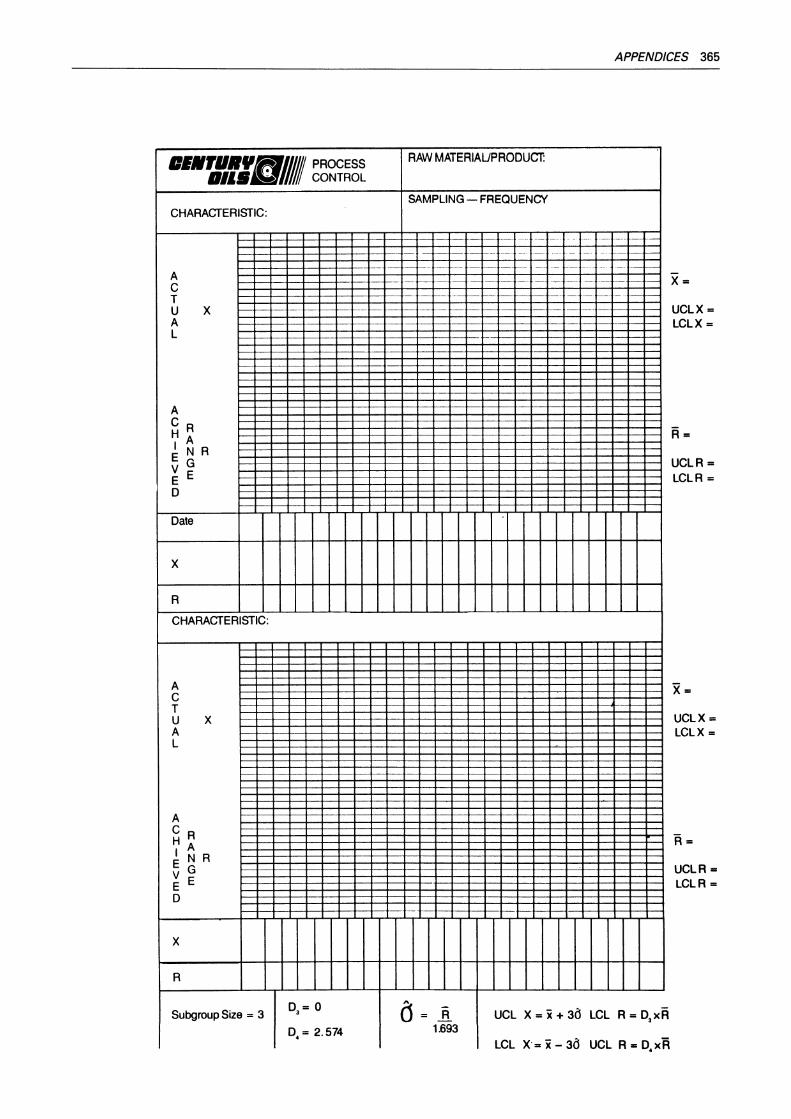
Century Oils chart
PPG chart
357
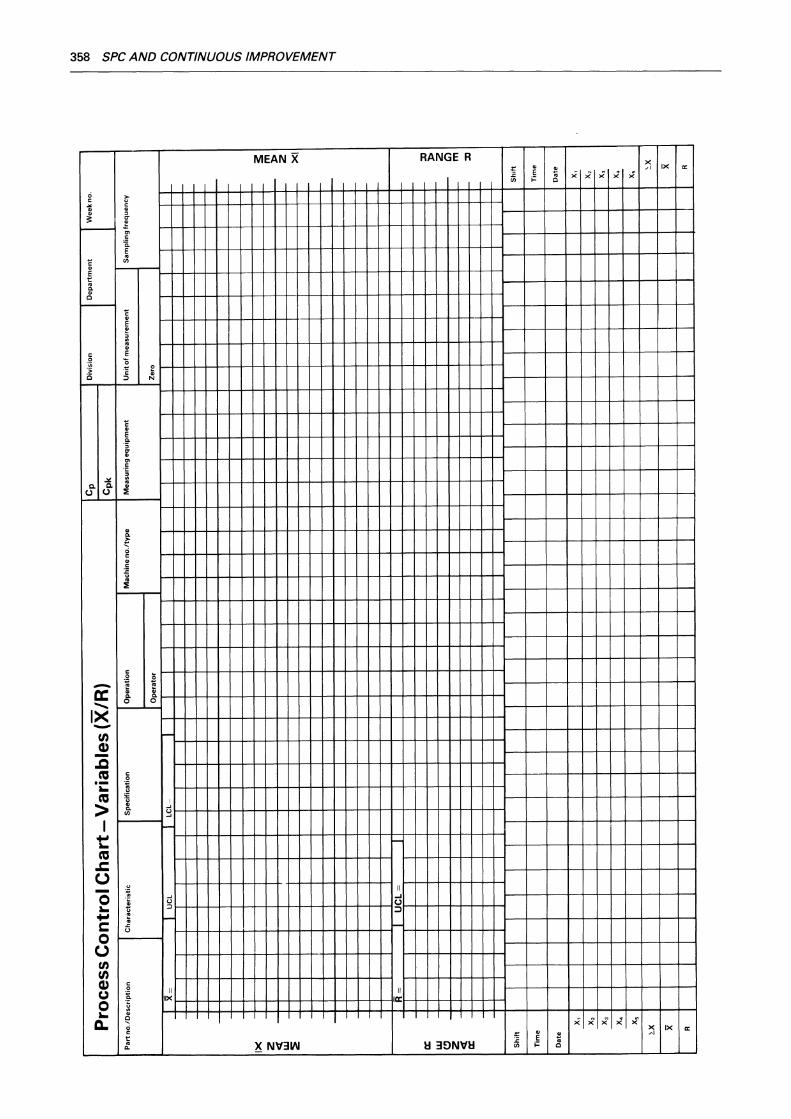
Pro
cess
Co
ntr
ol C
ha
rt-V
ari
ab
les
(X/R
) P
art
no
./D
esc
rip
tio
n
Ch
arac
teri
stic
S
peci
fica
tion
O
pe
rati
on
Op
erat
or
X-
I U
CL
I
LC
L-
I
IX
z <( w
:E
R-
I U
CL
-I
a:
w
<.:l z <( a:
Sh
ift
Tim
e
Dat
e
x,
x,
x,
x,
x,
l.X x R
Cp
Div
isio
n
Dep
artm
ent
We
ek
no
.
Cpk
Mac
hin
e n
o./
typ
e M
ea
suri
ng
eq
uip
me
nt
Un
it o
f me
asu
rem
en
t S
am
plin
g fr
eq
ue
ncy
Zer
o
s: m
)> z XI
:::tl
)> z C
) m
:::tl
Sh
ift
Tim
e
Dat
e
x,
x,
x,
x,
x, ~X
X
R
'
w
g) ~ )::
,. ~ ~ :::::! <: § 55 ~ a ~ ~ ~ ..,

Pro
cess
Co
ntr
ol C
ha
rt- V
ari
ab
les
(X o
r X
/Mo
vin
g R
) P
rod
uct
co
de
Pro
per
ty
Spe
cifi
cati
on
Ope
rati
on
Ma
chin
e n
o./
typ
e
Op
erat
or
ME
AN
-I
UC
L-
I LC
L~
I
IX ... 0 8 ..
.I
<( ::>
0 > Q ~
R-
UC
L-
a:
(!) z > 0 ~
n Sa
mp
le n
o.
1 2
3 4
5 6
7 8
9 10
11
12
13
14
Bat
ch n
o.
X x
Mo
vin
g A
Da
te/T
ime
--
-·--
L.
-
Cp
D
ivis
ion
Cp
k
Me
asu
rin
g e
qu
ipm
en
t U
nit
of m
ea
sure
me
nt
Ze
ro
15
16
17
18
19
20
De
pa
rtm
en
t I We
ekn
o.
Sa
mp
ing
fre
qu
en
cy
z c < 6 c l>
r- ~
0 XII ! I I
s: 0 < z Cl
::J:I
21
22
23
Sa
mp
le n
o.
Ba
tch
no
.
X x
Mo
vin
gR
--
Da
te/T
ime
):,.
'"1J ~ ~ ~ (/
) w
(11
C
D
Div
isio
n D
epar
tmen
t
Pro
cess
Con
trol
Ch
art-
Att
ribu
tes
Par
t no
./D
escr
ipti
on
O
per
atio
n
Mac
hine
no.
/Typ
e S
amp
lin
g fr
equ
ency
T
arg
et s
amp
le s
ize
Mea
n=
U
CL
=
LC
L-
:I
~
c: 0 "f
0 c.
0 Q:
......
<3" c: E. Gi .Q E
:I
2 Sam
ple
siz
e
Nu
mb
er
Pro
po
rtio
n
Dat
e/T
ime
'
I Week
no
pO
cO
np
D
u
D 2 c: 3 C
T ~ s- p --
... -:::::: , 0 "C
0 :::1- c;·
:I
p E.
Sam
ple
siz
e
Nu
mb
er
Pro
po
rtio
n
Dat
e/T
ime
I
w
en
0 (/) ~ ):,. ~ 8 :c: ::::! :c: § 55 ~ ~ a ~ s: ~ -1

Pro
cess
Co
ntr
ol C
ha
rt-M
ult
iple
Ch
arac
teri
stic
s P
art
no
/D
es
cri
pti
on
O
pe
rati
on
M
a:::
hin
e n
o./
Ty
pe
S
am
pli
ng
fre
qu
en
cy
T
arg
et s
am
ple
siz
e
No.
C
har
acte
rist
ic
Def
ecti
ve/D
efec
t fre
qu
ency
Tot
al D
efec
tive
/Def
ect
Sam
ple
siz
e
Pro
po
rtio
n
I
.... ~ ....
' /
Dat
e/T
ime
---I .
~ I
I I
I I
I I
I I
I I
I J
I I
~Div
isio
n
Mea
n=
U
CL
=
I I
I I
I I
I l ~
De
pa
rtm
en
t I Wee
kn
o.
pO
LC
L=
n
p 0
f
I I
T
cO
u 0 %
):::. :g ~ ~
(/)
w
CJ)
-'

Pro
cess
Co
ntr
ol C
ha
rt-
Cu
sum
C
har
acte
rist
ic
Tar
get
T=
1--
---
Sa
mp
le
1 2
3 4
5 6
7 8
9 10
11
12
13
14
15
1
6
no
.
Re
f.n
o.
Re
ad
ing
X
X-T
:E(X
-T)
-
Div
isio
n
De
pa
rtm
en
t
I --
17
18
19
20
21
22
23
24
25
26
27
(") c C
J)
c s:
28
Sa
mp
le
no
.
Re
f.n
o.
Re
ad
ing
X
X-T
:E(X
-T)
-L
__
__
w
0)
N ~ h ~ ~ ::j <: § ~ ~ ;g a ~ ~ """i

Mac
hin
e C
apab
ilit
y C
har
t P
art n
o./
Des
crip
tio
n
Ch
ara
cte
rjsti
c
Sp
eci
fica
tio
n
Op
erat
ion
VA
LU
E
TA
LL
Y M
AR
KS
f
H
H%
_
_r
__s--
__
r __
_r--+-
___r-
-+-
___r-
-+-__
_r--+-
r __
r
..r-
___r-
-+-
___r-
-+-
___r-
-+-
r r R
EA
DIN
GS
1 6
11
16
21
26
31
36
41
46
2 7
12
17
22
27
32
37
42
47
3 8
13
18
23
28
33
38
43
48
4 9
14
19
24
29
34
39
44
49
5 10
15
20
25
3
0
35
40
45
50
Div
isio
n
Ma
ch
ine
no
./ty
pe
M
ea
su
rin
g e
qu
ipm
en
t U
nit
of m
ea
su
rem
en
t
Ze
ro
99
997
99
.87
99.5
99
98
9
5
90
80
70
6
0
50
4
0
30
2
0
10
4s
3s
2s
i
0.00
3 0.
13
0.5
1 2
5 10
2
0
30
4
0
50
6
0
70
80
90
SP
EC
IFIE
D T
OLE
RA
NC
E
SP
EC
IFIE
D T
AR
GE
T
ES
TIM
AT
ED
CA
PA
BIL
ITY
(8s)
E
ST
IMA
TE
D M
EA
N
ES
TIM
AT
ED
ST
AN
DA
RD
DE
VIA
TIO
N (s
)
em~----
Na
me
S
ign
atu
re
I Depa
rtm
en
t I Ref
.no
.
5 2
1 0
5
0 13
0.
003
'2s
t 3s
'4
s
95
9
8
99
99
.5
99.8
7 99
.997
ES
TIM
AT
ED
OU
T
OF
TO
LE
RA
NC
E
TO
P
%
BO
TT
OM
__
__
%
cm
k-----
Dat
e
)::.
"lJ ~ § w
0)
w

364 SPC AND CONTINUOUS IMPROVEMENT
(/) ' 1- I z UJ ~ ~ 0 u
1- I I I w I I I 1 i w UJ
::1: ~
I I I i= I U) I i
I
I
I
!
I 1 I CJ UJ
I I 1-
0 <! I
I I !
Cl I I I I
...1 i !
I
I
I
U) i I
i
U) I I i
I w !
(J I
0 a: a.
(/) 1-z UJ ~ ~ 0 u
I I
I I
I I
UJ I i
~ i= I
UJ 1-<! Cl
t:••riJRI'f'B//1/11 PROCESS 8/l.Aii///J/J CONTROL
CHARACTERISTIC:
A c T u A L
A
X
C A H A I N A E G V E E D
Date
X
A
CHARACTERISTIC:
A c T u X A L
A C A H A I N A E G V E E D
X
A
Subgroup Size = 3 03= 0
D, = 2.574
APPENDICES 365
RAW MATERIAUPRODUCT:
SAMPLING- FREQUENCY
--~-
1-1-- ~-
-f-1-1-
f-- f--
- r-- 1--- - -
1-1-1- f-
--1--
r--f-r--
~----~-
--- - 1-- r--
-- -1-r--
-- 1--r--
f--- -
a= A UCL X= x + 30 LCL A= 03 xA 1.693
LCL X'= x- 30 UCL R ... D,xR
X=
UCLX = LCLX=
UCLA= LCLR =
X=
UCLX= LCLX=
UCLA= LCLR =

DE
PA
RTM
EN
T:
fl1
ST
AT
IST
ICA
L P
RO
CE
SS
-P
RO
DU
CT
CO
DE
: Q
UA
LIT
Y C
ON
TR
OL
CH
AR
T
PR
OP
ER
TY:
~
La
dyw
oo
d (
UK
)
SP
EC
IFIC
ATI
ON
: R
EC
ALC
ULA
TIO
N O
F C
ON
TRO
L LI
MIT
S:
g ...J
<( ::::>
Cl > iS ~ NO
TE
1 2
3 4
5 6
7 8
9 1
0
a: ~
w
(!) z <( a:
(!) z ~ ~ DA
lE/ll
ME
BATC
H No
.
X 1 2 M
R
FO
R
UC
Lx
VA
RIA
BL
ES
=
IND
IVID
UA
L/M
OV
ING
RA
NG
E
x +
(2
·66
x M
R)
MR
= ~
T:~s
~~ =
--~ =
11
12
13
14
15
16
LC
L x
U
CL
MR
=
=
x -(2
·66
x M
R)
3·2
68
X M
R
X = ,
.:o;;~0~~s =
--~ =
17
18
19
20
SP
CC
/1/1
0/8
7
w
Ol
Ol ~ )l. ~ 8 :<:
::::!
:<: § ~ ~ ;g a ~
~ ~ -t

Appendix I. Further information
Books Anon. (1976). QC Circles: Applications, Tools and Theory. American Society for Quality Control. An non. (1980). Code of practical guidance for packers and importers. Weights and Measures Act 1979. HMSO, London. Annon. (1980). Manual of practical guidance for Inspectors. Weights and Measures Act 1979. HMSO, London. Anon. (1982). Japan Quality Control Circles. Asian Productivity Association. Anon. (1984). The Pursuit of Product Excellence: A Guide to SPC. GKN Automotive. Anon (1985). Statistical Process Control: Course Notes. Ford Motor Company, Brentwood, Essex. Anon. (1985). Statistical Process Control Experiments. Ford Motor Company, Brentwood, Essex. Anon. (1985). Statistical Process Control Methods. Chrysler Corporation, USA. Anon. (1985). Continuing Process Control and Process Capability Improvement. Statistical Methods Office, Ford Motor Company, USA. Anon. (1986). Statistical Process Control: Instruction Guide. Ford Motor Company, Brentwood, Essex. Anon. (1986). Guidelines to Statistical Process Control. The Society of Motor Manufacturers and Traders, London. Amsden, R.T., Butler, H.E. and Amsden, D.M. (1986). SPC Simplified: Practical Steps to Quality. Unipub/Kraus International Publications, White Plains, New York. Crosby, P.B. (1979). Quality is Free: The Art of Making Quality Certain. McGraw-Hill. Crosby, P.B. (1985). Quality Without Tears: The Art of Hassle-Free Management. McGrawHill. Cullen, J. and Hollingum, J. (1988)./mp/ementing Total Quality. IFS Publications, Kempston, Bedford. Deming, W. Edwards (1989). Out of the crisis, MIT, Centre for Advanced Engineering Study, Cambridge, Mass. Grant, E.L. and Leavenworth, R.S. (1980). Statistical Quality Control. McGraw-Hill. Feigenbaum, A.V. (1983). Total Quality Control. McGraw-Hill. Guaspari, J. (1985)./ Know It When I See ft. American Management Association. Harrington, H.H. (1987). The Improvement Process: How America's Leading Companies Improve Quality. McGraw-Hill. Ishikawa, K. (1982). Guide to Quality Control. Asian Productivity Association. Juran, J.M. and Gryna, F. (1980). Quality Planning and Analysis. McGraw-Hill. Juran, J.M., Gryna, F. and Bingham, F. (1979). Quality Control Handbook, 3rd edn. McGrawHill. Kilian, Cecilia S. (1988). The World of W. Edwards Deming, Ceepress Books, The George Washington University, Washington DC 20152. Mann, N.R. (1985). The Keys to Excellence: The Story of the Deming Philosophy. Prestwick Books, Santa Monica, California. · Nixon, F. (1971 ). Managing to Achieve Quality and Reliability. McGraw-Hill. Oakland, J.S. (1986). Statistical Process Control. Heinemann. Ott, E.R. (1975). Process Quality Control: Troubleshooting and Interpretation of Data. McGraw-Hill. Ouchi, W.G. ( 1981 ). Theory Z. Addison Wesley. Peters, T.J. and Austin, N.K. (1985). A Passion for Excellence: The Leadership Difference. Random House, New York. Price, F. (1984). Right First Time. Gower Press, Aldershot, Hants.

368 SPC AND CONTINUOUS IMPROVEMENT
Scherkenbach, W.W. (1986). The Deming Route to Quality and Productivity: Roadmaps and Roadblocks. Cee Press Books, Washington, DC. Shewhart, W.A. (1931 ). Economic Control of Quality of Manufactured Product. Van Nostrand. Walton, Mary (1989). The Deming Management Method, Mercury Books, London.
Articles and others Anon. (1988). SPCApplications to Short Production Runs. Ford Motor Company, Brentwood, Essex. Clark, I. (1988).1mplementing Statistical Process Control: Guidelines and Pitfalls. Training for Quality Unit, Bristol Polytechnic. Dale, B.G. and Shaw, P. (1988). A study of the use of Statistical Process Control in the automotive-related supplier community. Department of Management Sciences, University of Manchester Institute of Science and Technology. Occasional Paper No. 8801. Grubbs, F.E. (1983). An optimum procedure for setting machines or adjusting processes. Journal of Quality Technology, Vol. 15(4), October. Lascelles, D. and Dale, B. (1985). Quality training and education in the UK: a state of the art survey. Quality Assurance, vol. 11/12, pp. 39--42. Lockyer, K.G., Oakland, J.S., Duprey, C. H. and Followell, R.F. (1984). Research into the use of statistical methods of Quality Control in selected sectors of UK manufacturing industry. University of Bradford Management Centre.
Various editions of Quality Progress, Journal of the American Society for Quality Control and Annual Transactions of the American Society for Quality Control.
British Standards relating to SPC BS 2564
BS 2846
BS 5532
BS 5700
BS 5701
BS 5702
BS 5703
Control chart technique when manufacturing to a specification, with special reference to articles machined to dimensional tolerances
Guide to statistical interpretation of data Part 4/Part 7
Statistical terminology
Guide to process control using quality control chart methods and Cusum techniques
Guide to number-defective charts for quality control
Guide to quality control charts for measured variables (In preparation)
Guide to data analysis and quality control using Cusum techniques
Part 1: Introduction to Cusum charting
Part 2: Decision rules and statistical tests for Cusum charts and tabulations
Part 3: Cusum methods for process/quality control by measurement
Part 4: Cusum for counted/attribute data
BS 6143 Guide to the determination and use of quality-related costs
Ww\ '(ill/