appendix a - air quality and climate change assessment
TRANSCRIPT
Prologis Building 13 Air Quality &
Climate Change Assessment
April 2013 (3237)
Prepared for:
Prologis 2817 East Cedar Street # 200
Ontario, California 91761
Prepared by:
MIG|Hogle-Ireland 1500 Iowa Avenue, Suite 110
Riverside, California 92507

This document is formatted for double-sided printing to conserve natural resources.
Prologis Building 13 Air Quality & Climate Change Assessment
April 2013
San Bernardino County

Prologis Building 13 (3237) i
Table of Contents Table of Contents.................................................................................................. i
List of Tables ........................................................................................................ ii List of Figures ...................................................................................................... ii List of Exhibits ..................................................................................................... iii Appendices ......................................................................................................... iii
1 Executive Summary ....................................................................................... 1 1.1 Project Description ....................................................................................... 1 1.2 Air Quality ................................................................................................... 1 1.3 Climate Change ............................................................................................ 1 1.4 Mitigation Measures ...................................................................................... 2
2 Introduction ................................................................................................... 3 3 Environmental Setting ................................................................................... 5
3.1 Climate ....................................................................................................... 5 3.2 Regional Air Quality ...................................................................................... 5 3.3 Non-Attainment Status ................................................................................ 10 3.4 Local Air Quality ......................................................................................... 11 3.5 Sensitive Receptors .................................................................................... 15 3.6 Toxic Emission Sources ............................................................................... 15 3.7 Local Transportation ................................................................................... 15 3.8 Odors........................................................................................................ 15 3.9 Climate Change .......................................................................................... 16
3.9.1 Defining Climate Change ........................................................................ 16 3.9.2 Climate Change and California ................................................................ 19
4 Regulatory Framework ................................................................................. 27 4.1 Clean Air Act .............................................................................................. 27 4.2 California Clean Air Act ................................................................................ 27 4.3 Toxic Hotspots ........................................................................................... 27 4.4 California Code of Regulations ...................................................................... 28 4.5 2012 Air Quality Management Plan ............................................................... 29 4.6 SCAQMD Rule Book .................................................................................... 30 4.7 Executive Order S-3-05 ............................................................................... 30 4.8 California Global Warming Solutions Act ........................................................ 30 4.9 Sustainable Communities and Climate Protection Act ...................................... 31 4.10 Air Resources Board Scoping Plan .............................................................. 32 4.11 California Green Building Standards ........................................................... 32 4.12 San Bernardino County GHG Reduction Plan................................................ 34 4.13 Water Conservation in Landscaping Act ...................................................... 35
5 Project Description ...................................................................................... 37 6 Air Quality Impact Analysis .......................................................................... 41
6.1 Thresholds of Significance ........................................................................... 41 6.2 AQMP Consistency ...................................................................................... 42 6.3 Pollutant Emissions ..................................................................................... 42
6.3.1 Building Construction ............................................................................ 42 6.3.2 Operational Sources .............................................................................. 44
6.4 Localized Emissions .................................................................................... 45 6.4.1 Toxic Air Contaminants .......................................................................... 45
Table of Contents
ii Air Quality and Climate Change Assessment
6.4.2 Carbon Monoxide Hotspots ..................................................................... 47 6.5 Odors........................................................................................................ 48 6.6 Cumulative Impacts .................................................................................... 48
6.6.1 Cumulative Construction Impacts ............................................................ 48 6.6.2 Cumulative Operational Impacts ............................................................. 48
7 Climate Change Impact Analysis .................................................................. 51 7.1 Thresholds of Significance ........................................................................... 51 7.2 Direct and Indirect Emissions ....................................................................... 51
7.2.1 Short-Term Emissions ........................................................................... 51 7.2.2 Long-Term Emissions ............................................................................ 52 7.2.3 Greenhouse Gas Emissions Inventory ...................................................... 53
7.3 Greenhouse Gas Emissions Reductions .......................................................... 53 7.4 Greenhouse Gas Emissions Reduction Planning .............................................. 55
7.4.1 San Bernardino County Greenhouse Gas Emissions Reduction Plan ............. 55 7.4.2 Green County San Bernardino ................................................................ 56
8 Mitigation Measures ..................................................................................... 59 8.1 Required Mitigation ..................................................................................... 59 8.2 Regulatory Requirements and Standards ....................................................... 59
9 References ................................................................................................... 61
List of Tables Table 1 Ambient Air Quality Standards ....................................................................... 9 Table 2 South Coast Air Basin Attainment Status ....................................................... 11 Table 3 2008-2010 Local Air Quality ........................................................................ 13 Table 4 2008-2010 Air Quality Standards Exceedance ................................................ 13 Table 5 Global Warming Potential (GWP) of Greenhouse Gases (GHG) .......................... 18 Table 6 Scoping Plan Measures ................................................................................ 33 Table 7 CALGREEN Requirements ............................................................................ 34 Table 8 SCAQMD Maximum Daily Emissions Thresholds (lbs/days) ............................... 41 Table 9 Unmitigated Maximum Daily Construction Emissions (lbs/day) ......................... 43 Table 10 Mitigated Maximum Daily Construction Emissions for ROG (lbs/day) ............... 43 Table 11 Unmitigated Operational Daily Emissions (lbs/day) ....................................... 44 Table 12 Maximum Diesel Particulate Concentrations (µg/m3) ..................................... 46 Table 13 Cancer and Non-Cancer Risk ...................................................................... 47 Table 14 Long-Term Cumulative Emissions Reductions (tons/yr) ................................. 49 Table 15 Construction Greenhouse Gas Emissions ...................................................... 52 Table 16 Long-Term Greenhouse Gas Emissions ........................................................ 53 Table 17 Greenhouse Gas Emissions Inventory .......................................................... 53 Table 18 Reduced Greenhouse Gas Emissions Inventory ............................................. 54
List of Figures Figure 1 Redlands Wind Rose .................................................................................... 6 Figure 2 Automated Distance vs. Concentration ......................................................... 46
Table of Contents
Prologis Building 13 (3237) iii
List of Exhibits Exhibit 1 Regional Context and Vicinity Map .............................................................. 23 Exhibit 2 Radius Map .............................................................................................. 25 Exhibit 3 Site Plan ................................................................................................. 39
Appendices Appendix A Air Quality Modeling Assumptions Appendix B CalEEMod Output Appendix C SCREEN3 and EMFAC2011 Outputs Appendix D CO Hotspot Screening Appendix E Hand Calculations
Table of Contents
iv Air Quality and Climate Change Assessment
This Page Intentionally Left Blank
Prologis Building 13 (3237) 1
1 Executive Summary Construction-related and operational emissions of criteria pollutants and toxic air contaminants were modeled and analyzed for the proposed Prologis Building 13 located on the southeast corner of River Bluff Avenue and Alabama Street in unincorporated San Bernardino County. This report also analyzes the project’s consistency with the South Coast Air Quality Management District (SCAQMD) 2012 Air Quality Management Plan (AQMP) for the South Coast Air Basin. Cumulative impacts were analyzed using the methodology provided by the 1993 SCAQMD California Environmental Quality Act (CEQA) Air Quality Handbook. The results of this report find that the thresholds established by SCAQMD for volume and receptor-specific criteria pollutant emissions and toxic air contaminants will not be exceeded. Additionally, this report models and analyzes construction- and operation-related emissions of greenhouse gases from the proposed project. This analysis utilizes guidance provided in the California Air Pollution Control Officers Association (CAPCOA) CEQA and Climate Change white paper and the Quantifying Greenhouse Gas Mitigation Measures handbook. Modeling of emissions utilizes the California Emissions Estimator Model (CalEEMod) v 2011.1.1. The results of this report find that the threshold established by the San Bernardino County for greenhouse gas emissions will not be exceeded, therefore, no mitigation is required.
1.1 Project Description The project is a 289,327 square foot (SF) industrial distribution warehouse on 13.29 acres (AC) located on the northeast corner of River Bluff Avenue at Alabama Street in unincorporated San Bernardino County, California (near Redlands). The project also includes office space (estimated at approximately 10,000 SF), 86,977 SF of landscaping, and a vegetated detention basin located along the west side of the project site on Alabama Street. The project site is currently vacant and sparsely vegetated with grasses.
1.2 Air Quality The project will not result in substantial emissions of oxides of nitrogen, volatile organic compounds (with mitigation incorporated), or particulate matter and would not exceed the regional growth assumptions used in the Air Quality Management Plan (AQMP). The project will not individually cause or cumulatively contribute to an air quality standard violation. Emissions of diesel particulate matter and carbon monoxide will not substantially impact sensitive receptors in vicinity of the project. The project will not expose a substantial number of people to odors.
1.3 Climate Change Greenhouse gas emissions will exceed the 3,000 metric tons carbon dioxide equivalent Tier 1 threshold identified in the San Bernardino County Greenhouse Gas Reduction Plan; however, the climate change analysis identifies a 33.49 percent reduction in greenhouse gas emissions from business-as-usual conditions, and thus will not result in a considerable contribute to climate change impacts. The project will not conflict with local or state greenhouse gas emissions strategies.
Executive Summary
2 Air Quality and Climate Change Assessment
1.4 Mitigation Measures The following mitigation measures are required to ensure that project-related emissions do not exceed established thresholds. AQ1 Coating Restrictions. Prior to issuance of building permits, the project
proponent shall submit, to the satisfaction of County Planning, a Coating Restriction Plan (CRP), consistent with South Coast Air Quality Management District (SCAQMD) guidelines and a letter agreeing to include in any construction contracts and/or subcontracts a requirement that the contractors adhere to the requirements of the CRP. The CRP measures shall be implemented to the satisfaction of County Building and Safety. These shall include the following:
• The volatile organic compounds (VOC) of proposed architectural coatings
shall not exceed 25 g/l for interior applications. • The volatile organic compounds (VOC) of proposed architectural coatings
shall not exceed 25 g/l for exterior applications.
This measure shall conform to the performance standard that emissions of volatile organic compounds from application of interior or exterior coatings shall not exceed the daily emissions thresholds established by the South Coast Air Quality Management District. The CRP shall specify use of High-Volume, Low Pressure (HVLP) spray guns for application of coatings.
GHG1 CALGREEN Requirements. Prior to issuance of building permits, the County
Building and Safety Division shall verify that construction drawings reflect all applicable CALGREEN requirements of the California Building Code in the design of each proposed building, including use of low-flow fixtures.
GHG2 Idling Restrictions. Tenants of the proposed project shall comply with State
idling requirements.
Prologis Building 13 (3237) 3
2 Introduction This report models and analyzes construction- and operation-related emissions of criteria air pollutants, toxic air contaminants, and greenhouse gas emissions from the proposed Prologis Building 13 warehouse/distribution facility. The project includes construction of one warehouse/distribution center totaling 289,327 square feet on 13.29 acres located in unincorporated San Bernardino, California (within the City of Redlands Sphere of Influence). The air quality analysis provided herein utilizes guidance provided in the South Coast Air Quality Management District (SCAQMD) the 1993 California Environmental Quality Act (CEQA) Air Quality handbook as amended and supplemented (http://www.aqmd.gov/ceqa/hdbk.html). Modeling of emissions utilizes the following software:
• California Emissions Estimator Model (CalEEMod) v 2011.1.1 • California Emissions Factors (EMFAC2011) • United States Environmental Protection Agency SCREEN3 v 96043 • California Department of Transportation (Caltrans) Carbon Monoxide Protocol • Caltrans CALINE4 (CL4) v 1.32
The climate change analysis provided herein utilizes guidance provided in the California Air Pollution Control Officers Association (CAPCOA) CEQA and Climate Change white paper and the Quantifying Greenhouse Gas Mitigation Measures handbook. Modeling of greenhouse gas emissions utilizes the California Emissions Estimator Model (CalEEMod) v 2011.1.1. This report has been designed to demonstrate project consistency with the San Bernardino County Greenhouse Gas Emissions Reduction Plan. This report has been prepared utilizing project-specific characteristics where available. In those instances where project-specific data is not available, the analysis has been supplemented by model defaults or other standardized sources of comparable data. In any case where non-project defaults or other data have been used, a “worst-case” scenario was developed to ensure a conservative estimate of emissions. This report has been prepared for use by the Lead Agency to assess potential project-related air quality impacts in compliance with the State CEQA Statutes and Guidelines, particularly in respect to the air quality issues identified in Appendix G of the State CEQA Guidelines. This report does not make determinations of significance pursuant to CEQA because such determinations are required to be made solely in the purview of the Lead Agency. This document has been reviewed in accordance with the Table 7-2, Checklist for an Air Quality Analysis Section of the SCAQMD Air Quality Handbook for quality control purposes.
Introduction
4 Air Quality and Climate Change Assessment
This report was prepared by Nelson Miller (Principal) and Christopher Brown (Director of Environmental Services) of MIG|Hogle-Ireland, Inc. under contract by Prologis. Nelson Miller Christopher Brown Principal Director of Environmental Services
Prologis Building 13 (3237) 5
3 Environmental Setting
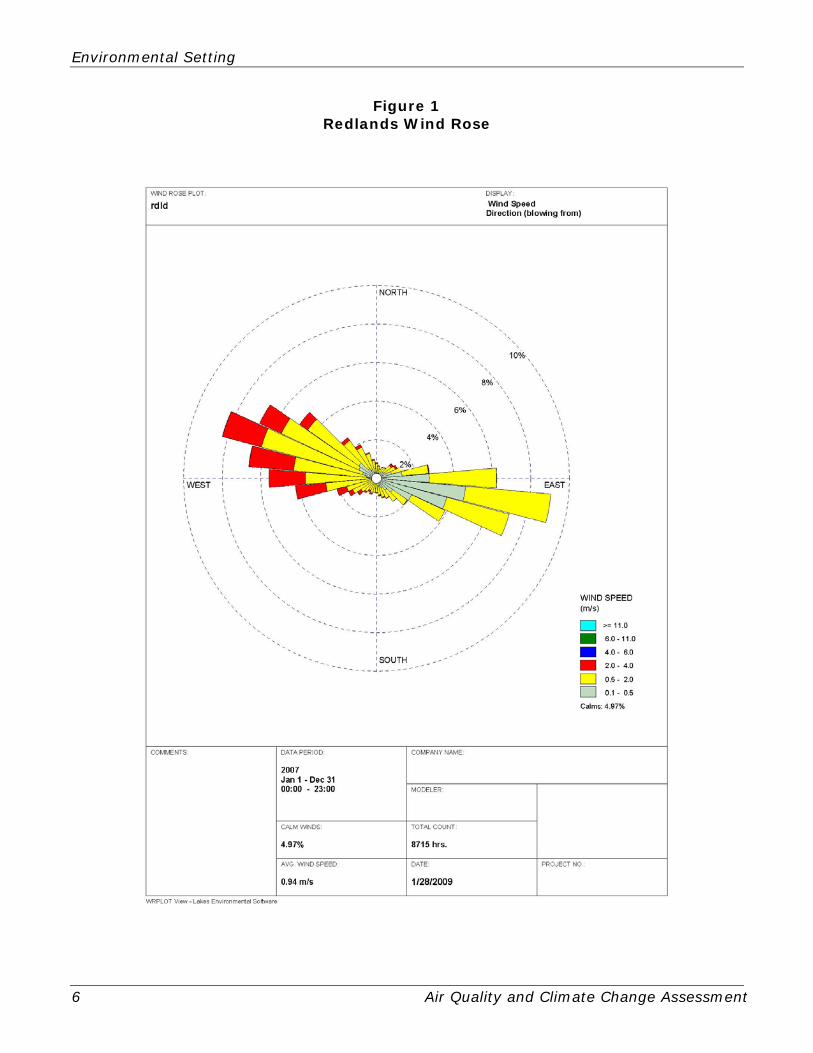
3.1 Climate The project is located in unincorporated San Bernardino County, surrounded by the city of Redlands. The city of Redlands and the broader Inland Empire are defined by a semi-arid, Mediterranean climate with mild winters and warm summers. Annual rainfall averages 13.56 inches with the rainy season occurring during the winter.1 The coolest month of the year is January with an average monthly low of 39.4° Fahrenheit (F). The warmest month is July with an average monthly high of 94.5° F. Redlands is located at an elevation of approximately 1,302 feet above mean sea level (AMSL). The project site increases in elevation from north to south by approximately 15 feet, ranging from 1,225 feet to 1,249 feet.2 Figure 1 (Redlands Wind Rose) summarizes wind direction and speed patterns for the Redlands area.3
3.2 Regional Air Quality
Wind has a generally equal chance of blowing from the east or west, although wind from the west tends to reach higher speeds.
The proposed warehouse is located within the South Coast Air Basin (Basin).4
The Basin includes Orange County and the non-desert portions of Los Angeles, San Bernardino, and Riverside Counties. The Basin is bounded by the San Gabriel, San Bernardino, and San Jacinto Mountains to the north and east that trap ambient air and pollutants within the Los Angeles and Inland Empire valleys below. The Basin is managed by the South Coast Air Quality Management District (SCAQMD). Pursuant to the California Clean Air Act (CCAA), SCAQMD is responsible for bringing air quality within the Basin into conformity with federal and state air quality standards by reducing existing emission levels and ensuring that future emission levels meet applicable air quality standards. SCAQMD works with federal, state, and local agencies to reduce pollutant emissions from stationary, mobile, and indirect pollutant sources through the development of rules and regulations.
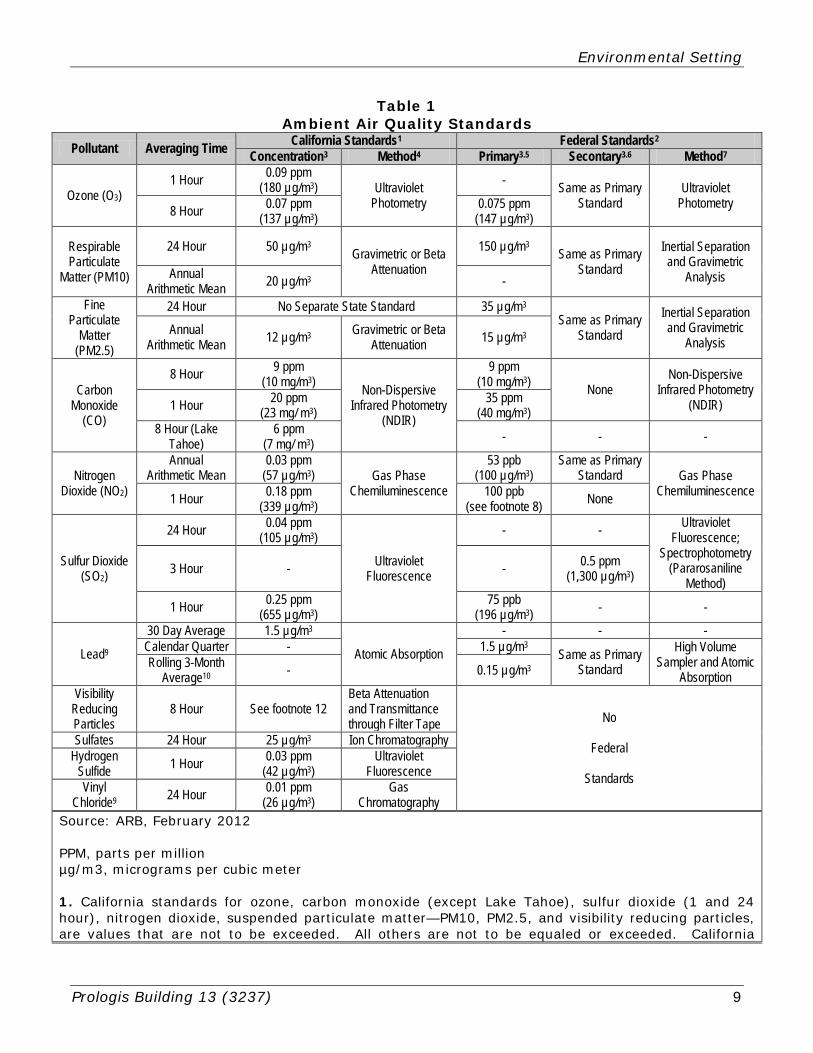
Both California and the federal government have established health-based ambient air quality standards (AAQS) for seven air pollutants (known as criteria pollutants). These pollutants include ozone (O3), carbon monoxide (CO), nitrogen dioxide (NO2), sulfur dioxide (SO2), inhalable particulate matter with a diameter of 10 microns or less (PM10), fine particulate matter with a diameter of 2.5 microns or less (PM2.5), and lead (Pb). The State has also established AAQS for the additional pollutants of visibility reducing particles, sulfates, hydrogen sulfide, and vinyl chloride. The AAQS are designed to protect the health and welfare of the populace within a reasonable margin of safety. Where the State and Federal standards differ, State AAQS are more stringent than Federal AAQS. Federal and State standards are shown in Table 1 (Ambient Air Quality Standards). A brief description of each criteria pollutant is provided herein.
Environmental Setting
6 Air Quality and Climate Change Assessment
Figure 1 Redlands Wind Rose
Environmental Setting
Prologis Building 13 (3237) 7
Ozone. Ozone is a pungent, colorless, and highly reactive gas that forms from the atmospheric reaction of organic gases with nitrogen oxides in the presence of sunlight. Ozone is most commonly associated with smog. Ozone precursors such as reactive organic gases (ROG) and oxides of nitrogen (NOX) are released from mobile and stationary sources. Ozone is a respiratory irritant and can cause cardiovascular diseases, eye irritation, and impaired cardiopulmonary function. Ozone can also damage building materials and plant leafs. Carbon Monoxide. Carbon monoxide is primarily emitted from vehicles due to the incomplete combustion of fuels. Carbon monoxide has wide ranging impacts on human health because it combines with hemoglobin in the body and reduces the amount of oxygen transported in the bloodstream. Carbon monoxide can result in reduced tolerance for exercise, impairment of mental function, impairment of fetal development, headaches, nausea, and death at high levels of exposure. Nitrogen Dioxide. Nitrogen dioxide and other oxides of nitrogen (NOX) contribute to the formation of smog and results in the brownish haze associated with it. They are primarily emitted from motor vehicle exhaust but can be omitted from other high-temperature stationary sources. Nitrogen oxides can aggravate respiratory illnesses, reduce visibility, impair plant growth, and form acid rain. Particulate Matter. Particulate matter is a complex mixture of small-suspended particles and liquid droplets in the air. Particulate matter between ten microns and 2.5 microns is known as PM10, also known as coarse or inhalable particulate matter. PM10 is emitted from diverse sources including road dust, diesel soot, combustion products, abrasion of tires and brakes, construction operations, and windstorms. PM10 can also be formed secondarily in the atmosphere when NO2 and SO2 react with ammonia. Particulate matter less than 2.5 microns in size are called PM2.5 or fine particulate matter. PM2.5 is primarily emitted from point sources such as power plants, industrial facilities, automobiles, wood-burning fireplaces, and construction sites. Particulate matter is deposited in the lungs and cause permanent lung damage, potentially resulting in lung disease and respiratory symptoms like asthma and bronchitis. Particulate matter has also been linked to cardiovascular problems such as arrhythmia and heart attacks. Particulate matter can also interfere with the body’s ability to clear the respiratory tract and can act as a carrier of absorbed toxic substances. Particulate matter causes welfare issues because it scatters light and reduces visibility, causes environmental damage such as increasing the acidity of lakes and streams, and can stain and damage stone, such as that applied in statues and monuments. Sulfur Dioxide. Sulfur dioxide and other oxides of sulfur (SOX) are reactive gases emitted from the burning of fossil fuels, primarily from power plants and other industrial facilities.5
Other less impacting sources include metal extraction activities, locomotives, large ships, and off-road equipment. Human health impacts associated with SOX emissions include bronchoconstriction and increased asthma symptoms.
Lead. Lead is primarily emitted from metal processing facilities (i.e. secondary lead smelters) and other sources such as manufacturers of batteries, paints, ink, ceramics, and ammunition. Historically, automobiles were the primary sources before lead was phased
Environmental Setting
8 Air Quality and Climate Change Assessment
out of gasoline. The health effects of exposure to lead include gastrointestinal disturbances, anemia, kidney diseases, and potential neuromuscular and neurologic dysfunction. Lead is also classified as a probable human carcinogen.
Environmental Setting
Prologis Building 13 (3237) 9
Table 1 Ambient Air Quality Standards
Pollutant Averaging Time California Standards1 Federal Standards2 Concentration3 Method4 Primary3.5 Secontary3.6 Method7
Ozone (O3) 1 Hour 0.09 ppm
(180 µg/m3) Ultraviolet Photometry
- Same as Primary Standard
Ultraviolet Photometry 8 Hour 0.07 ppm
(137 µg/m3) 0.075 ppm
(147 µg/m3)
Respirable Particulate
Matter (PM10)
24 Hour 50 µg/m3 Gravimetric or Beta Attenuation
150 µg/m3 Same as Primary Standard
Inertial Separation and Gravimetric
Analysis Annual Arithmetic Mean 20 µg/m3 -
Fine Particulate
Matter (PM2.5)
24 Hour No Separate State Standard 35 µg/m3 Same as Primary
Standard Inertial Separation and Gravimetric
Analysis Annual
Arithmetic Mean 12 µg/m3 Gravimetric or Beta Attenuation 15 µg/m3
Carbon Monoxide
(CO)
8 Hour 9 ppm (10 mg/m3) Non-Dispersive
Infrared Photometry (NDIR)
9 ppm (10 mg/m3) None
Non-Dispersive Infrared Photometry
(NDIR) 1 Hour 20 ppm (23 mg/ m3)
35 ppm (40 mg/m3)
8 Hour (Lake Tahoe)
6 ppm (7 mg/ m3) - - -
Nitrogen Dioxide (NO2)
Annual Arithmetic Mean
0.03 ppm (57 µg/m3) Gas Phase
Chemiluminescence
53 ppb (100 µg/m3)
Same as Primary Standard Gas Phase
Chemiluminescence 1 Hour 0.18 ppm (339 µg/m3)
100 ppb (see footnote 8) None
Sulfur Dioxide (SO2)
24 Hour 0.04 ppm (105 µg/m3)
Ultraviolet Fluorescence
- - Ultraviolet Fluorescence;
Spectrophotometry (Pararosaniline
Method) 3 Hour - - 0.5 ppm
(1,300 µg/m3)
1 Hour 0.25 ppm (655 µg/m3)
75 ppb (196 µg/m3) - -
Lead9
30 Day Average 1.5 µg/m3
Atomic Absorption
- - - Calendar Quarter - 1.5 µg/m3 Same as Primary
Standard High Volume
Sampler and Atomic Absorption
Rolling 3-Month Average10 - 0.15 µg/m3
Visibility Reducing Particles
8 Hour See footnote 12 Beta Attenuation and Transmittance through Filter Tape No
Federal
Standards
Sulfates 24 Hour 25 µg/m3 Ion Chromatography Hydrogen
Sulfide 1 Hour 0.03 ppm (42 µg/m3)
Ultraviolet Fluorescence
Vinyl Chloride9 24 Hour 0.01 ppm
(26 µg/m3) Gas
Chromatography Source: ARB, February 2012 PPM, parts per million µg/m3, micrograms per cubic meter 1. California standards for ozone, carbon monoxide (except Lake Tahoe), sulfur dioxide (1 and 24 hour), nitrogen dioxide, suspended particulate matter—PM10, PM2.5, and visibility reducing particles, are values that are not to be exceeded. All others are not to be equaled or exceeded. California
Environmental Setting
10 Air Quality and Climate Change Assessment
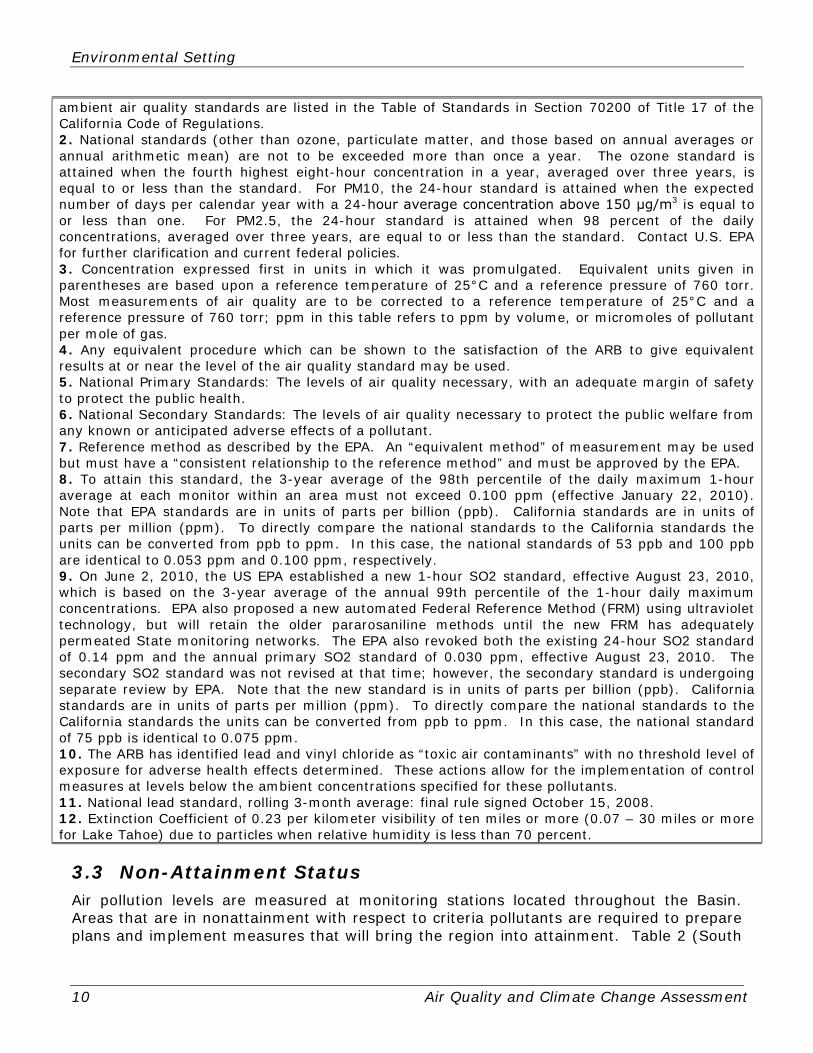
ambient air quality standards are listed in the Table of Standards in Section 70200 of Title 17 of the California Code of Regulations. 2. National standards (other than ozone, particulate matter, and those based on annual averages or annual arithmetic mean) are not to be exceeded more than once a year. The ozone standard is attained when the fourth highest eight-hour concentration in a year, averaged over three years, is equal to or less than the standard. For PM10, the 24-hour standard is attained when the expected number of days per calendar year with a 24-hour average concentration above 150 μg/m3 is equal to or less than one. For PM2.5, the 24-hour standard is attained when 98 percent of the daily concentrations, averaged over three years, are equal to or less than the standard. Contact U.S. EPA for further clarification and current federal policies. 3. Concentration expressed first in units in which it was promulgated. Equivalent units given in parentheses are based upon a reference temperature of 25°C and a reference pressure of 760 torr. Most measurements of air quality are to be corrected to a reference temperature of 25°C and a reference pressure of 760 torr; ppm in this table refers to ppm by volume, or micromoles of pollutant per mole of gas. 4. Any equivalent procedure which can be shown to the satisfaction of the ARB to give equivalent results at or near the level of the air quality standard may be used. 5. National Primary Standards: The levels of air quality necessary, with an adequate margin of safety to protect the public health. 6. National Secondary Standards: The levels of air quality necessary to protect the public welfare from any known or anticipated adverse effects of a pollutant. 7. Reference method as described by the EPA. An “equivalent method” of measurement may be used but must have a “consistent relationship to the reference method” and must be approved by the EPA. 8. To attain this standard, the 3-year average of the 98th percentile of the daily maximum 1-hour average at each monitor within an area must not exceed 0.100 ppm (effective January 22, 2010). Note that EPA standards are in units of parts per billion (ppb). California standards are in units of parts per million (ppm). To directly compare the national standards to the California standards the units can be converted from ppb to ppm. In this case, the national standards of 53 ppb and 100 ppb are identical to 0.053 ppm and 0.100 ppm, respectively. 9. On June 2, 2010, the US EPA established a new 1-hour SO2 standard, effective August 23, 2010, which is based on the 3-year average of the annual 99th percentile of the 1-hour daily maximum concentrations. EPA also proposed a new automated Federal Reference Method (FRM) using ultraviolet technology, but will retain the older pararosaniline methods until the new FRM has adequately permeated State monitoring networks. The EPA also revoked both the existing 24-hour SO2 standard of 0.14 ppm and the annual primary SO2 standard of 0.030 ppm, effective August 23, 2010. The secondary SO2 standard was not revised at that time; however, the secondary standard is undergoing separate review by EPA. Note that the new standard is in units of parts per billion (ppb). California standards are in units of parts per million (ppm). To directly compare the national standards to the California standards the units can be converted from ppb to ppm. In this case, the national standard of 75 ppb is identical to 0.075 ppm. 10. The ARB has identified lead and vinyl chloride as “toxic air contaminants” with no threshold level of exposure for adverse health effects determined. These actions allow for the implementation of control measures at levels below the ambient concentrations specified for these pollutants. 11. National lead standard, rolling 3-month average: final rule signed October 15, 2008. 12. Extinction Coefficient of 0.23 per kilometer visibility of ten miles or more (0.07 – 30 miles or more for Lake Tahoe) due to particles when relative humidity is less than 70 percent.
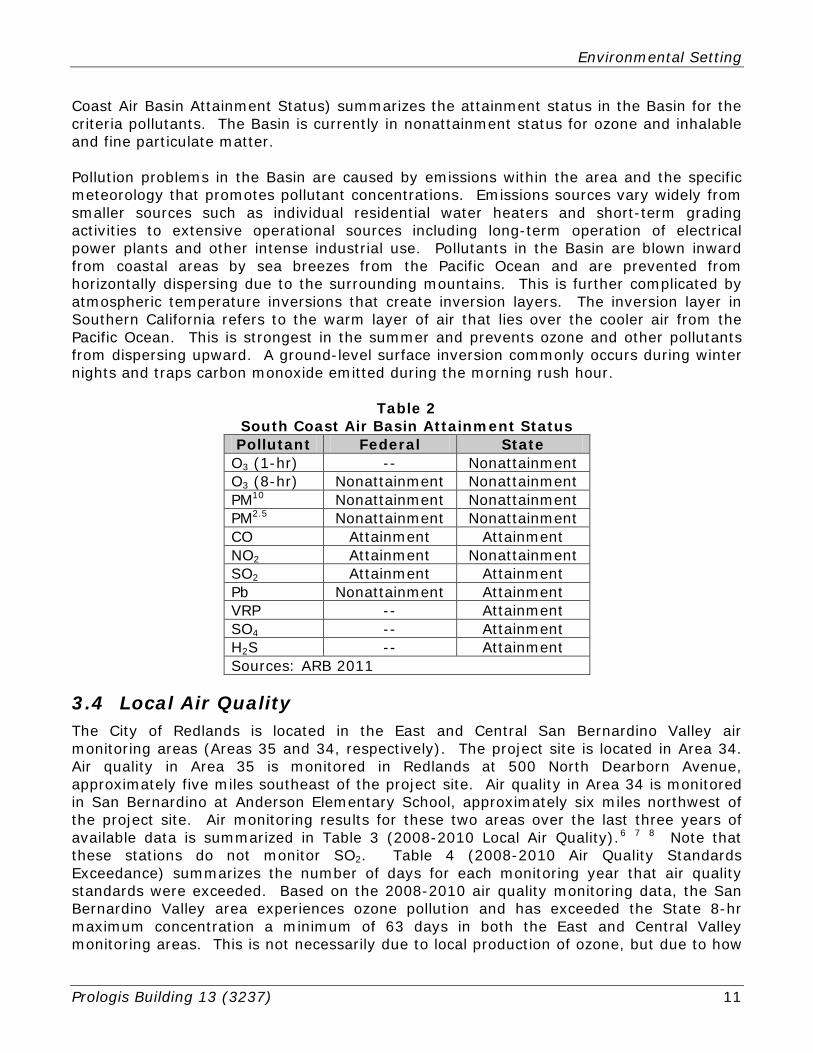
3.3 Non-Attainment Status Air pollution levels are measured at monitoring stations located throughout the Basin. Areas that are in nonattainment with respect to criteria pollutants are required to prepare plans and implement measures that will bring the region into attainment. Table 2 (South
Environmental Setting
Prologis Building 13 (3237) 11
Coast Air Basin Attainment Status) summarizes the attainment status in the Basin for the criteria pollutants. The Basin is currently in nonattainment status for ozone and inhalable and fine particulate matter. Pollution problems in the Basin are caused by emissions within the area and the specific meteorology that promotes pollutant concentrations. Emissions sources vary widely from smaller sources such as individual residential water heaters and short-term grading activities to extensive operational sources including long-term operation of electrical power plants and other intense industrial use. Pollutants in the Basin are blown inward from coastal areas by sea breezes from the Pacific Ocean and are prevented from horizontally dispersing due to the surrounding mountains. This is further complicated by atmospheric temperature inversions that create inversion layers. The inversion layer in Southern California refers to the warm layer of air that lies over the cooler air from the Pacific Ocean. This is strongest in the summer and prevents ozone and other pollutants from dispersing upward. A ground-level surface inversion commonly occurs during winter nights and traps carbon monoxide emitted during the morning rush hour.
Table 2 South Coast Air Basin Attainment Status Pollutant Federal State O3 (1-hr) -- Nonattainment O3 (8-hr) Nonattainment Nonattainment PM10 Nonattainment Nonattainment PM2.5 Nonattainment Nonattainment CO Attainment Attainment NO2 Attainment Nonattainment SO2 Attainment Attainment Pb Nonattainment Attainment VRP -- Attainment SO4 -- Attainment H2S -- Attainment Sources: ARB 2011
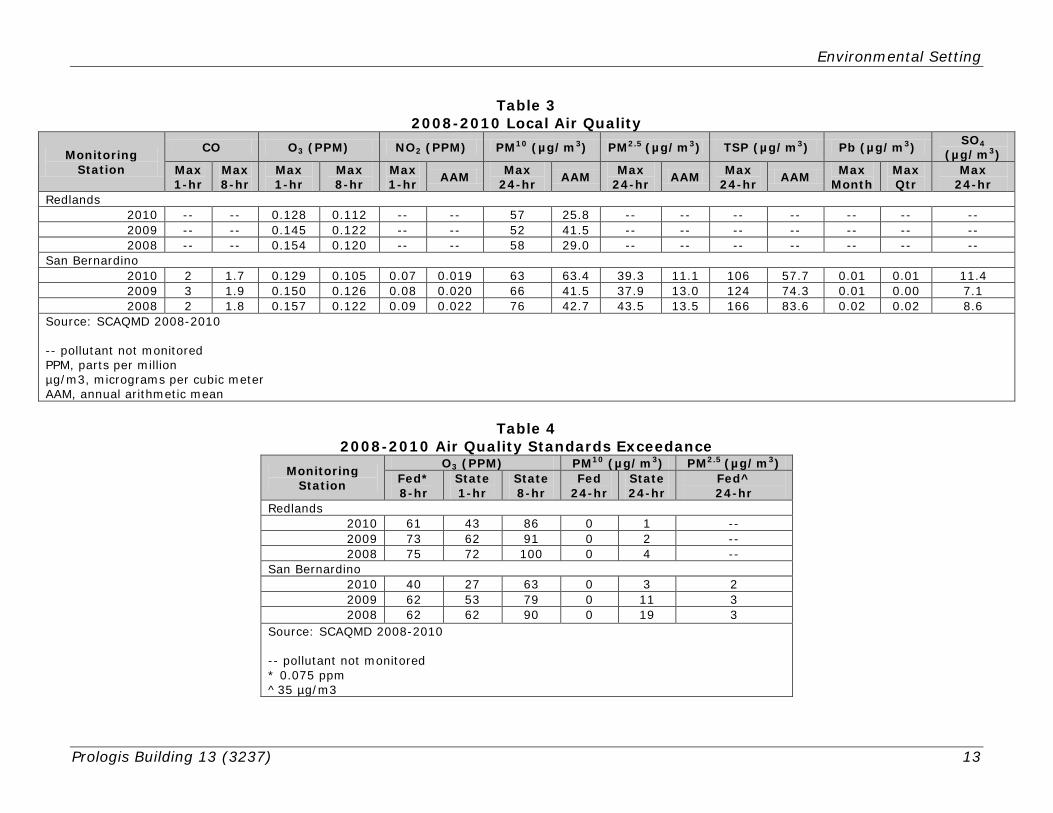
3.4 Local Air Quality The City of Redlands is located in the East and Central San Bernardino Valley air monitoring areas (Areas 35 and 34, respectively). The project site is located in Area 34. Air quality in Area 35 is monitored in Redlands at 500 North Dearborn Avenue, approximately five miles southeast of the project site. Air quality in Area 34 is monitored in San Bernardino at Anderson Elementary School, approximately six miles northwest of the project site. Air monitoring results for these two areas over the last three years of available data is summarized in Table 3 (2008-2010 Local Air Quality).6 7 8 Note that these stations do not monitor SO2. Table 4 (2008-2010 Air Quality Standards Exceedance) summarizes the number of days for each monitoring year that air quality standards were exceeded. Based on the 2008-2010 air quality monitoring data, the San Bernardino Valley area experiences ozone pollution and has exceeded the State 8-hr maximum concentration a minimum of 63 days in both the East and Central Valley monitoring areas. This is not necessarily due to local production of ozone, but due to how
Environmental Setting
12 Air Quality and Climate Change Assessment
ozone forms and travels over the Basin. Ozone precursors are emitted primarily in the urban centers of the Basin such as Los Angeles. Ozone does not form immediately but rather forms over the day. This combined with prevailing winds blowing ozone precursors inland cause the highest concentrations of ozone in the Basin to occur in the San Bernardino valley and mountain regions. Both the East and Central areas also experience particulate matter pollution, with approximately five percent of PM10 samples in year 2010 exceeding the State standard.
Environmental Setting
Prologis Building 13 (3237) 13
Table 3 2008-2010 Local Air Quality
Monitoring Station
CO O3 (PPM) NO2 (PPM) PM10 (µg/m3) PM2.5 (µg/m3) TSP (µg/m3) Pb (µg/m3) SO4 (µg/m3)
Max 1-hr
Max 8-hr
Max 1-hr
Max 8-hr
Max 1-hr AAM Max
24-hr AAM Max 24-hr AAM Max
24-hr AAM Max Month
Max Qtr
Max 24-hr
Redlands 2010 -- -- 0.128 0.112 -- -- 57 25.8 -- -- -- -- -- -- -- 2009 -- -- 0.145 0.122 -- -- 52 41.5 -- -- -- -- -- -- -- 2008 -- -- 0.154 0.120 -- -- 58 29.0 -- -- -- -- -- -- --
San Bernardino 2010 2 1.7 0.129 0.105 0.07 0.019 63 63.4 39.3 11.1 106 57.7 0.01 0.01 11.4 2009 3 1.9 0.150 0.126 0.08 0.020 66 41.5 37.9 13.0 124 74.3 0.01 0.00 7.1 2008 2 1.8 0.157 0.122 0.09 0.022 76 42.7 43.5 13.5 166 83.6 0.02 0.02 8.6
Source: SCAQMD 2008-2010 -- pollutant not monitored PPM, parts per million µg/m3, micrograms per cubic meter AAM, annual arithmetic mean
Table 4
2008-2010 Air Quality Standards Exceedance Monitoring
Station
O3 (PPM) PM10 (µg/m3) PM2.5 (µg/m3) Fed* 8-hr
State 1-hr
State 8-hr
Fed 24-hr
State 24-hr
Fed^ 24-hr
Redlands 2010 61 43 86 0 1 -- 2009 73 62 91 0 2 -- 2008 75 72 100 0 4 --
San Bernardino 2010 40 27 63 0 3 2 2009 62 53 79 0 11 3 2008 62 62 90 0 19 3
Source: SCAQMD 2008-2010 -- pollutant not monitored * 0.075 ppm ^35 µg/m3
Environmental Setting
14 Air Quality and Climate Change Assessment
This Page Intentionally Left Blank
Environmental Setting
Prologis Building 13 (3237) 15
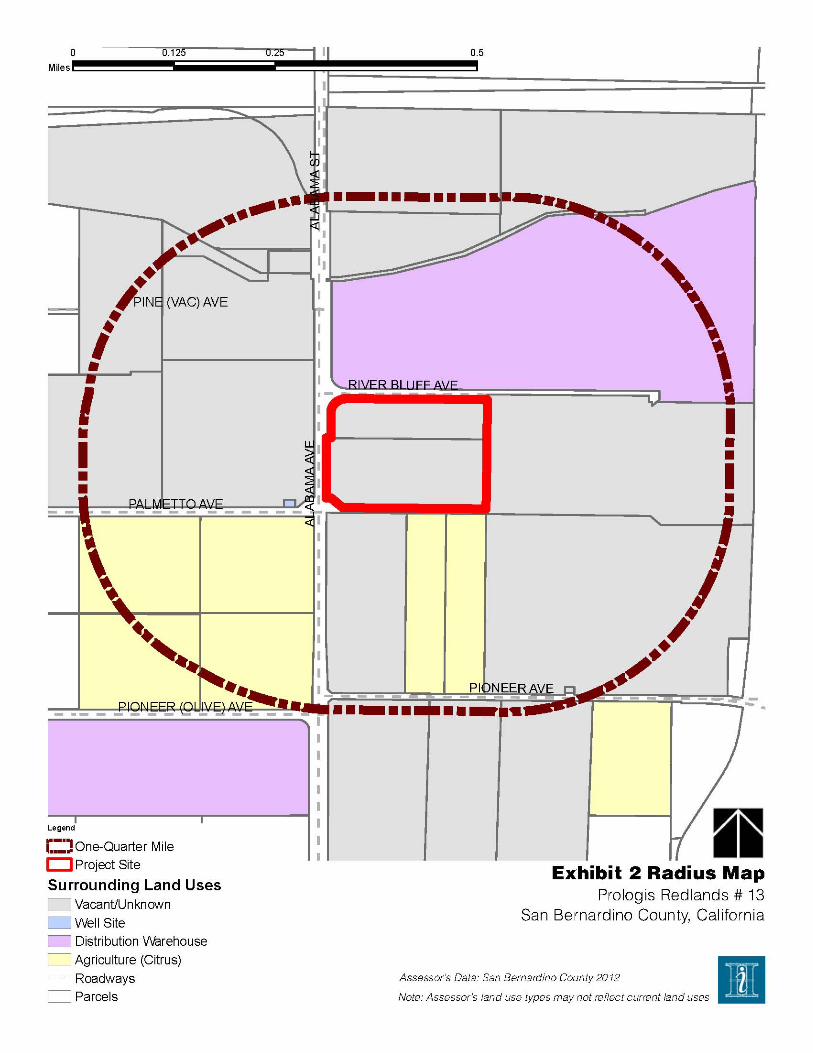
3.5 Sensitive Receptors Some populations are more susceptible to the effects of air pollution than the population at large; these populations are defined as sensitive receptors. Sensitive receptors include children, the elderly, the sick, and the athletic. Land uses associated with sensitive receptors include residences, schools, playgrounds, childcare centers, athletic facilities, long-term health care facilities, rehabilitation centers, convalescent centers, and retirement homes. Sensitive land uses located within one-quarter mile of the proposed warehouse includes a single-family residence on Pioneer Avenue 0.22 miles south of the project site. Pollutants of particular concern when relating to sensitive receptors include carbon monoxide, toxic air contaminants, and odors. Exhibit 2 (Radius Map) identifies existing development in the project vicinity based on assessors parcel data.
3.6 Toxic Emission Sources According to the EPA, there are no existing sources of industrial- or utility-related toxic emissions uses within one-quarter mile of the project site.9
3.7 Local Transportation
There are citrus groves to the east, south, and southwest of the project site that likely use pesticides. There are existing warehouses and distribution centers in the project vicinity that emit diesel-particulate matter associated with heavy-duty truck traffic, an identified toxic air contaminant.
The proposed distribution facility will be located at the southeast corner of River Bluff and Alabama Street, north of Palmetto Avenue. Regional access to the project site is provided by the Interstate 10 and Interstate 210 Freeway.10
3.8 Odors
River Bluff Avenue is a two-lane, undivided street. Alabama Street is a two-lane, undivided arterial north of Pioneer Avenue and a four-lane, divided arterial south of Pioneer Avenue. Palmetto Avenue is a two-lane, undivided arterial. The project traffic report indicates that existing level of service (LOS) at the intersection of Alabama Street at River Bluff Avenue is LOS B during the morning peak hour and LOS A during afternoon peak hour. Performance at the intersection of Alabama Street at Palmetto Avenue is LOS C during the morning peak hour and LOS D during the afternoon peak hour.
According to the CEQA Air Quality Handbook, land uses associated with odor complaints include agricultural operations, wastewater treatment plants, landfills, and certain industrial operations (such as manufacturing uses that produce chemicals, paper, etc.). The proposed warehouse is sited near agricultural (citrus) uses to the east, north, and west of the project site. The proposed distribution facility is not considered sensitive receptor and will not be substantially affected by potential odors from citrus operations. The proposed distribution facility, in turn, does not produce odors that could affect a substantial number of people.
Environmental Setting
16 Air Quality and Climate Change Assessment
3.9 Climate Change
3.9.1 Defining Climate Change Climate change is the distinct change in measures of climate for a long period of time. Climate change can result from natural processes and from human activities. Natural changes in the climate can be caused by indirect processes such as changes in the Earth’s orbit around the Sun or direct changes within the climate system itself (i.e. changes in ocean circulation). Human activities can affect the atmosphere through emissions of gases and changes to the planet’s surface. Emissions affect the atmosphere directly by changing its chemical composition, while changes to the land surface indirectly affects the atmosphere by changing the way the Earth absorbs gases from the atmosphere. The term climate change is preferred over the term global warming because climate change conveys the fact that other changes can occur beyond just average increase in temperatures near the Earth’s surface. Elements that indicate that climate change is occurring on Earth include:
• Rising of global surface temperatures by 1.3° Fahrenheit (F) over the last 100 years
• Changes in precipitation patterns • Melting ice in the Arctic • Melting glaciers throughout the world • Rising ocean temperatures • Acidification of oceans • Range shifts in plant and animal species
Climate change is intimately tied to the Earth’s greenhouse effect. The greenhouse effect is a natural occurrence that helps regulate the temperature of the planet. The majority of radiation from the Sun hits the Earth’s surface and warms it. The surface in turn radiates heat back towards the atmosphere, known as infrared radiation. Gases and clouds in the atmosphere trap and prevent some of this heat from escaping back into space and re-radiate it in all directions. This process is essential to supporting life on Earth because it keeps the planet approximately 60° F warmer than without it. Emissions from human activities since the beginning of the industrial revolution (approximately 150 years) are adding to the natural greenhouse effect by increasing the gases in the atmosphere that trap heat, thereby contributing to an average increase in the Earth’s temperature. Human activities that enhance the greenhouse effect are detailed below.
Greenhouse Gases
The greenhouse effect is caused by a variety of greenhouse gases. Greenhouse gases (GHGs) occur naturally and from human activities. Greenhouse gases produced by human activities include carbon dioxide (CO2), methane (CH4), nitrous oxide (N2O), hydrofluorocarbons (HFCs), perfluorocarbons (PFCs), and sulfur hexafluoride (SF6). Since the year 1750, it is estimated that the concentrations of carbon dioxide, methane, and nitrous oxide in the atmosphere have increased over 36 percent, 148 percent, and 18 percent, respectively, primarily due to human activity. The primary GHGs are discussed below.11
Environmental Setting
Prologis Building 13 (3237) 17
Carbon Dioxide. CO2 is emitted and removed from the atmosphere naturally. Animal and plant respiration involves the release of carbon dioxide from animals and its absorption by plants in a continuous cycle. The ocean-atmosphere exchange results in the absorption and release of CO2 at the sea surface. Carbon dioxide is also released from plants during wildfires. Volcanic eruptions release a small amount of CO2 from the Earth’s crust. Human activities that affect carbon dioxide in the atmosphere include burning of fossil fuels, industrial processes, and product uses. Combustion of fossil fuels is the largest source of carbon dioxide emissions in the United States, accounting for approximately 85 percent of all equivalent emissions. Because of the fossil fuels used, the largest of these sources is electricity generation and transportation. When fossil fuels are burned, the carbon stored in them is released into the atmosphere entirely as CO2. Emissions from onsite industrial activities also emit carbon dioxide such as cement, metal, and chemical production and use of petroleum produced in plastics, solvents, and lubricants. Methane. Methane (CH4) is emitted from human activities and natural sources. Natural sources of methane include wetlands, gas hydrates, permafrost, termites, oceans, freshwater bodies, soils, and wildfires. Human activities that cause methane releases include fossil fuel production, animal digestive processes from farms, manure management, and waste management. It is estimated that 50 percent of global methane emissions are generated from human activities. Wetlands are the primary producers of methane in the world because the habitat is conducive to bacteria that produce methane during decomposition of organic material. Methane is produced from landfills as solid waste decomposes. Methane is a primary component of natural gas and is emitted during its production, processing, storage, transmission, distribution, and use. Decomposition of organic material in manure stocks or in liquid manure management systems also releases methane. Releases from animal digestive processes at agricultural operations are the primary source of human-related methane emissions. Nitrous Oxide. Anthropogenic (human) sources of nitrous oxide include agricultural soil management, animal manure management, sewage treatment, combustion of fossil fuels, and production of certain acids. N2O is produced naturally in soil and water, especially in wet, tropical forests. The primary human-related source of N2O is agricultural soil management due to use of synthetic nitrogen fertilizers and other techniques to boost nitrogen in soils. Combustion of fossil fuels (mobile and stationary) is the second leading source of nitrous oxide, although parts of the world where catalytic converters are used (such as California) have significantly lower levels than those areas that do not. High Global Warming Potential Gases. High global warming potential (GWP) gases (or fluorinated gases) are entirely manmade and are mainly used in industrial processes. HFCs, PFCs, and SF6 are high GWP gases. These types of gases are used in aluminum production, semiconductor manufacturing, electric power transmission, magnesium production and processing, and in the production of hydrochlorofuorocarbon-22 (HCFC-22). High GWP gases are also used as substitutes for ozone-depleting gases like chlorofluorocarbons (CFCs) and halons. Use of high GWP gases as substitutes for ozone-depleting substances is the primary use of these gases in the United States.
Environmental Setting
18 Air Quality and Climate Change Assessment
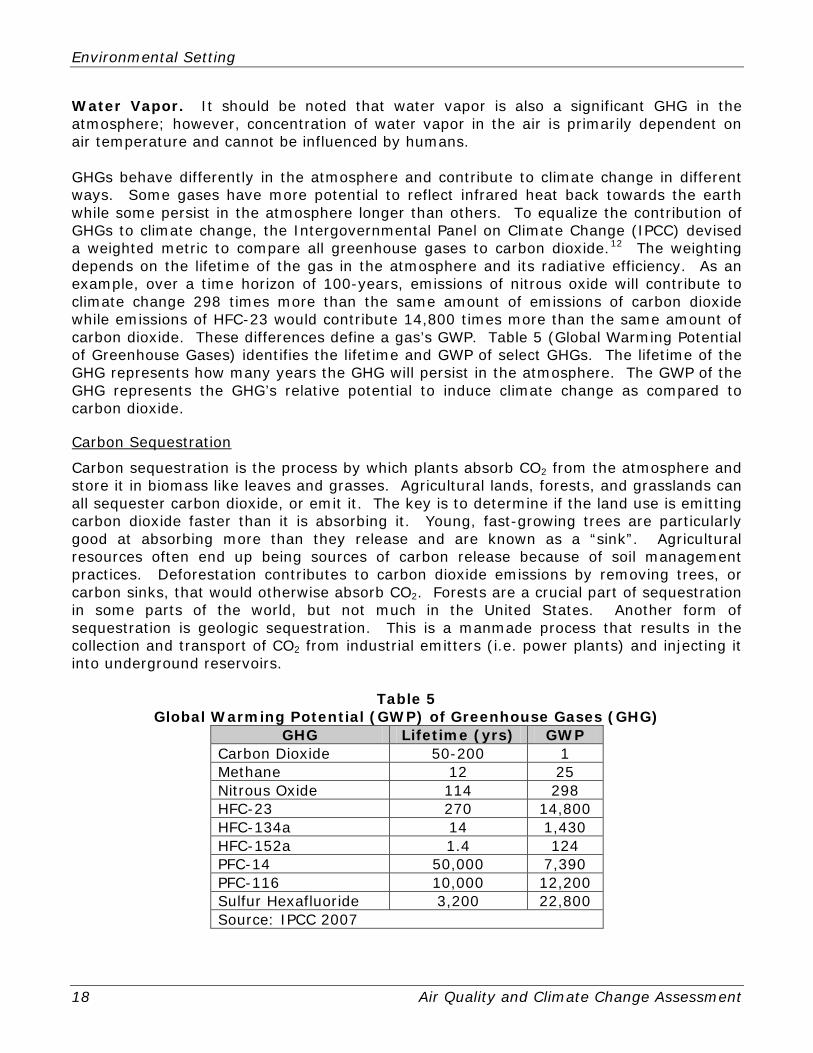
Water Vapor. It should be noted that water vapor is also a significant GHG in the atmosphere; however, concentration of water vapor in the air is primarily dependent on air temperature and cannot be influenced by humans. GHGs behave differently in the atmosphere and contribute to climate change in different ways. Some gases have more potential to reflect infrared heat back towards the earth while some persist in the atmosphere longer than others. To equalize the contribution of GHGs to climate change, the Intergovernmental Panel on Climate Change (IPCC) devised a weighted metric to compare all greenhouse gases to carbon dioxide.12
Carbon Sequestration
The weighting depends on the lifetime of the gas in the atmosphere and its radiative efficiency. As an example, over a time horizon of 100-years, emissions of nitrous oxide will contribute to climate change 298 times more than the same amount of emissions of carbon dioxide while emissions of HFC-23 would contribute 14,800 times more than the same amount of carbon dioxide. These differences define a gas’s GWP. Table 5 (Global Warming Potential of Greenhouse Gases) identifies the lifetime and GWP of select GHGs. The lifetime of the GHG represents how many years the GHG will persist in the atmosphere. The GWP of the GHG represents the GHG’s relative potential to induce climate change as compared to carbon dioxide.
Carbon sequestration is the process by which plants absorb CO2 from the atmosphere and store it in biomass like leaves and grasses. Agricultural lands, forests, and grasslands can all sequester carbon dioxide, or emit it. The key is to determine if the land use is emitting carbon dioxide faster than it is absorbing it. Young, fast-growing trees are particularly good at absorbing more than they release and are known as a “sink”. Agricultural resources often end up being sources of carbon release because of soil management practices. Deforestation contributes to carbon dioxide emissions by removing trees, or carbon sinks, that would otherwise absorb CO2. Forests are a crucial part of sequestration in some parts of the world, but not much in the United States. Another form of sequestration is geologic sequestration. This is a manmade process that results in the collection and transport of CO2 from industrial emitters (i.e. power plants) and injecting it into underground reservoirs.
Table 5 Global Warming Potential (GWP) of Greenhouse Gases (GHG)
GHG Lifetime (yrs) GWP Carbon Dioxide 50-200 1 Methane 12 25 Nitrous Oxide 114 298 HFC-23 270 14,800 HFC-134a 14 1,430 HFC-152a 1.4 124 PFC-14 50,000 7,390 PFC-116 10,000 12,200 Sulfur Hexafluoride 3,200 22,800 Source: IPCC 2007
Environmental Setting
Prologis Building 13 (3237) 19
3.9.2 Climate Change and California Specific, anticipated impacts to California have been identified in the 2009 California Climate Adaptation Strategy prepared by the California Natural Resources Agency (CNRA) through extensive modeling efforts.13
General climate changes in California indicate that:
• California is likely to get hotter and drier as climate change occurs with a reduction in winter snow, particularly in the Sierra Nevadas
• Some reduction in precipitation is likely by the middle of the century • Sea-levels will rise up to an estimated 55 inches • Extreme events such as heat waves, wildfires, droughts, and floods will
increase • Ecological shifts of habitat and animals are already occurring and will
continue to occur It should be noted that changes are based on the results of several models prepared under different climatic scenarios; therefore, discrepancies occur between the projections. The potential impacts of global climate change in California are detailed below.
Public Health and Welfare
Concerns related to public health and climate change includes higher rates of mortality and morbidity, change in prevalence and spread of disease vectors, decreases in food quality and security, reduced water availability, and increased exposure to pesticides. These concerns are all generally related to increase in ambient outdoor air temperature, particularly in summer. Higher rates of mortality and morbidity could arise from more frequent heat waves at greater intensities. Health impacts associated with extreme heat events include heat stroke, heat exhaustion, and exacerbation of medical conditions such as cardiovascular and respiratory diseases, diabetes, nervous system disorders, emphysema, and epilepsy. Climate change would result in degradation of air quality promoting the formation of ground-level pollutants, particularly ozone. Degradation of air quality would increase the severity of health impacts from criteria and other air pollutants discussed in Section 4.3 (Air Quality). Temperature increases and increases in carbon dioxide are also expected to increase plant production of pollens, spores, and fungus. Pollens and spores could induce or aggravate allergic rhinitis, asthma, and obstructive pulmonary diseases. Precipitation projections suggest that California will become drier over the next century due to reduced precipitation and increased evaporation from higher temperatures. These conditions could result in increased occurrences of drought. Surface water reductions will increase the need to pump groundwater, reducing supplies and increasing the potential for land subsidence. Precipitation changes are also suspected to impact the Sierra snowpack (see Water Management herein). Earlier snow melts could coincide with the rainy season and could result in failure of the flood control devices in that region. Flooding can cause property damage and loss of life for those affected. Increased wildfires are also of concern as the
Environmental Setting
20 Air Quality and Climate Change Assessment
State dries over time. Wildfires can also cause property damage, loss of life, and injuries to citizens and emergency response services. Sea-level rises would also threaten human health and welfare. Flood risks will be increased in coastal areas due to strengthened storm surges and greater tidal damage that could result in injury and loss of property and life. Gradual rising of the sea will permanently inundate many coastal areas in the state. Other concerns related to public health are changes in the range, incidence, and spread of infectious, water-borne, and food-borne diseases. Changes in humidity levels, distribution of surface water, and precipitation changes are all likely to shift or increase the preferred range of disease vectors (i.e. mosquitoes). This could expose more people and animals to potential for vector-borne disease.
Biodiversity and Habitat
Changes in temperature will change the livable ranges of plants and animals throughout the state and cause considerable stress on these species. Species will shift their range if appropriate habitat is available and accessible if they cannot adapt to their new climate. If they do not adapt or shift, they face local extirpation or extinction. As the climate changes, community compositions and interactions will be interrupted and changed. These have substantial implications on the ecosystems in the state. Extreme events will lead to tremendous stress and displacement on affected species. This could make it easier for invasive species to enter new areas, due to their ability to more easily adapt. Precipitation changes would alter stream flow patterns and affect fish populations during their life cycle. Sea level rises could impact fragile wetland and other coastal habitat.
Water Management
Although disagreement among scientists on long-term precipitation patterns in the State has occurred, it is generally accepted by scientists that rising temperatures will impact California’s water supply due to changes in the Sierra Nevada snowpack. Currently, the State’s water infrastructure is designed to both gather and convey water from melting snow and to serve as a flood control device. Snowpack melts gradually through spring warming into early summer, releasing an average of approximately 15 million acre-feet of water. The State’s concern related to climate change is that due to rising temperatures, snowpack melt will begin earlier in the spring and will coincide with the rainy season. The combination of precipitation and snowmelt would overwhelm the current system, requiring tradeoffs between water storage and flood protection to be made. Reduction in reserves from the Sierra Nevada snowpack is troublesome for California and particularly for Southern California. Approximately 75-percent of California’s available water supply originates in the northern third of the state while 80 percent of demand occurs in the southern two-thirds. There is also concern that rising temperatures will result in decreasing volumes from the Colorado River basin. Colorado River water is important to Southern California because it supplies water directly to Metropolitan Water District of Southern California. Water from the Colorado River is also used to recharge groundwater basins in the Coachella Valley.
Environmental Setting
Prologis Building 13 (3237) 21
Agriculture
California is the most agriculturally productive state in the US resulting in more than 37 billion dollars in revenue in 2008. California is the nation’s leading producer of nearly 80 crops and livestock commodities, supplying more than half of the nation’s fruit and vegetables and over 90 percent of the nation’s production of almonds, apricots, raisin grapes, olives, pistachios, and walnuts. Production of crops is not limited to the Central Valley but also occurs in Southern California. Strawberries and grapes are grown in San Bernardino and Riverside Counties. Orange County and San Diego County also contribute to strawberry production. Cherries are also grown in Los Angeles and Riverside County. Anticipated impacts to agricultural resources are mixed when compared to the potentially increased temperatures, reduced chill hours, and changes in precipitation associated with climate change. For example, wheat, cotton, maize, sunflower, and rice are anticipated to show declining yields as temperatures rise. Conversely, grapes and almonds would benefit from warming temperatures. Anticipated increases in the number and severity in heat waves would have a negative impact on livestock where heat stress would make livestock more vulnerable to disease, infection and mortality. The projected drying trend and changes in precipitation are a threat to agricultural production in California. Reduced water reliability and changes in weather patterns would impact irrigated farmlands and reduce food security. Furthermore, a drying trend would increase wildfire risk. Overall, agriculture in California is anticipated to suffer due to climate change impacts.
Forestry
Increases in wildfires will substantially impact California’s forest resources that are prime targets for wildfires. This can increase public safety risks, property damage, emergency response costs, watershed quality, and habitat fragmentation. Climate change is also predicted to affect the behavior or plant species including seed production, seedling establishment, growth, and vigor due to rising temperatures. Precipitation changes will affect forests due to longer dry periods and moisture deficits and drought conditions that limit seedling and sapling growth. Prolonged drought also weakens trees, making them more susceptible to disease and pest invasion. Furthermore, as trees die due to disease and pest invasion (i.e. the Bark Beetle invasion of the San Bernardino Forest), wildfires can spread more rapidly.
Transportation and Energy Infrastructure
Higher temperatures will require increased cooling, raising energy production demand. Higher temperatures also decrease the efficiency of distributing electricity and could lead to more power outages during peak demand. Climate changes would impact the effectiveness of California’s transportation infrastructure as extreme weather events damage, destroy, and impair roadways and railways throughout the state causing governmental costs to increase as well as impacts to human life as accidents increase. Other infrastructure costs and potential impacts to life would increase due to the need to upgrade levees and other flood control devices throughout the state. Infrastructure improvement costs related to climate change adaptation are estimated in the tens of billions of dollars.

Environmental Setting
22 Air Quality and Climate Change Assessment
This Page Intentionally Left Blank
Environmental Setting
Prologis Building 13 (3237) 23
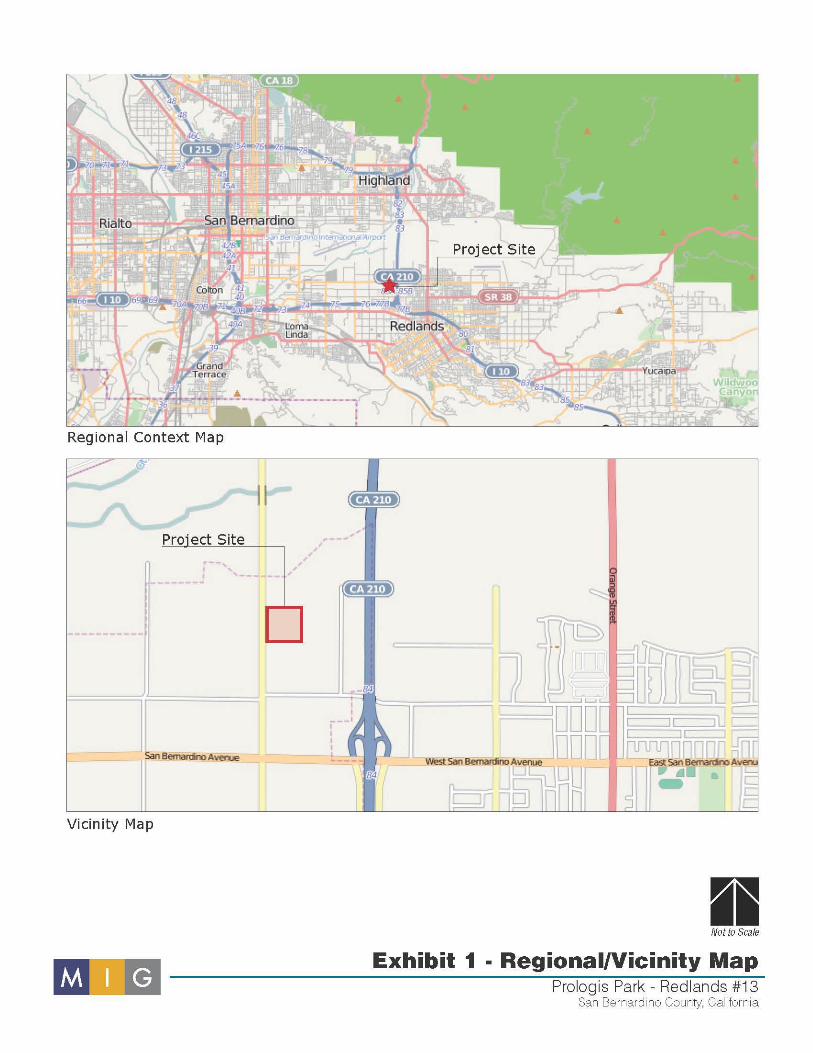
Exhibit 1 Regional Context and Vicinity Map
Environmental Setting
24 Air Quality and Climate Change Assessment
This Page Intentionally Left Blank
Environmental Setting
Prologis Building 13 (3237) 25
Exhibit 2 Radius Map

Environmental Setting
26 Air Quality and Climate Change Assessment
This Page Intentionally Left Blank
Prologis Building 13 (3237) 27
4 Regulatory Framework The following summarizes Federal, State, and local regulations related to air quality, pollution control, and greenhouse gas emissions.
4.1 Clean Air Act The Federal Clean Air Act (CAA) defines the Environmental Protection Agency’s (EPA) responsibilities for protecting and improving the United States air quality and ozone layer.14
Key components of the CAA include reducing ambient concentrations of air pollutants that cause health and aesthetic problems, reducing emission of toxic air pollutants, and stopping production and use of chemicals that destroy the ozone.
Federal clean air laws require areas with unhealthy levels of ozone, inhalable particulate matter, Carbon monoxide, nitrogen dioxide, and sulfur dioxide to develop State Implementation Plans (SIPs); comprehensive documents that identify how an area will attain NAAQS. Deadlines for attainment were established in the 1990 amendments to the CAA based on the severity of an area's air pollution problem. Failure to meet air quality deadlines can result in sanctions against the State or the EPA taking over enforcement of the CAA in the affected area. SIPs are a compilation of new and previously submitted plans, programs, district rules, and State and Federal regulations. The SCAQMD implements the required provisions of an applicable SIP through its AQMPs and updates. Currently, SCAQMD implements the 8-hr Ozone and PM2.5
SIP in the 2012 AQMP and the PM10
SIP in the 2003 AQMP. The PM2.5 SIP is currently being revised by SCAQMD in response to partial disapproval by the EPA.
4.2 California Clean Air Act The California Clean Air Act (CCAA) of 1988 was enacted to develop plans and strategies for attaining California Ambient Air Quality Standards (CAAQS). The California Air Resources Board (ARB), which is part of the California Environmental Protection Agency (Cal-EPA), develops statewide air quality regulations, including industry-specific limits on criteria, toxic, and nuisance pollutants. The CCAA is more stringent than Federal law in a number of ways including revised standards for PM10 and ozone and State for visibility reducing particles, sulfates, hydrogen sulfide, and vinyl chloride.
4.3 Toxic Hotspots State requirements specifically address air toxics issues through Assembly Bill (AB) 1807 (known as the Tanner Bill) that established the State air toxics program and the Air Toxics Hot Spots Information and Assessment Act (AB 2588). The air quality regulations developed from these bills have been modified recently to incorporate the Federal regulations associated with the Federal Clean Air Act Amendments of 1990. The Air Toxics Hot Spots Information and Assessment Act (Hot Spots Act) was enacted in September 1987. Under this bill, stationary sources of emissions are required to report the types and quantities of certain substances that their facilities routinely release into the air.
Regulatory Framework
28 Air Quality and Climate Change Assessment
The SCAQMD is required to prepare an annual report on the status and forecast of air toxic hotspots pursuant to Section 44363 of the California Health and Safety Code. SCAQMD monitors facilities that are not exempt from the fee and reporting requirements of AB2588. Some facilities are covered under umbrella permits that address industry-wide categories. SCAQMD has issued general permits for the following seven activities:
• Retail gasoline dispensing • Perchloroethylene dry cleaning • Auto body shops • Fiberglass molding • Printing • Metal plating • Wood striping and finishing
Emissions inventories and risk assessment guidelines have been prepared for the seven industry-wide categories. Approximately 1,400 auto body shops, 3,200 gasoline stations, and 1,400 perchloroethylene dry cleaners within the District are covered under these umbrella permits. Depending on the severity of the facilities’ TAC releases, SCAQMD requires either public notification of toxic hot spots or preparation of a risk reduction plan, as follows:
Cancer Risk (per million) Acute Risk Chronic Risk Action Risk Level >= 25 >= 3.0 >= 3.0 Public Notification Level >= 10 >= 1.0 >= 1.0 Exempt <1 <0.1 <0.1
4.4 California Code of Regulations In December 2008, the California Air Resources Board (ARB) approved the Truck and Bus Regulations as part of their rulemaking authority and adopted in Title 13 (Motor Vehicles) of the California Code of Regulations (CCR).15 These regulations are applicable to all diesel-fueled trucks and buses with a gross vehicle weight rating (GVWR) of 14,000 pounds or more (Class 4 or greater) that are privately or federally owned and for privately and publically owned school buses.16
These regulations are designed to reduce emissions of particulate matter and oxides of nitrogen from existing diesel vehicles operating in California. Compliance scheduling is phased for light and heavy vehicles depending on the age of the vehicle engine. Full compliance across vehicle ratings is set in 2023. Regulations affect the following areas:
• Auxiliary Power Units • Port and Rail Yard Trucks • Emissions Control Label Inspection • Greenhouse Gas Emissions Reductions • Heavy-Duty Diesel Vehicle Inspection • Idling Reduction
Regulatory Framework
Prologis Building 13 (3237) 29
• Periodic Smoke Inspection • Public and Utility Agencies • Public Transit Agencies • School Bus Fleets • Solid Waste Collection Vehicles • Transport Refrigeration Units
Regarding the proposed distribution facility, vehicle turnover, idling restrictions, and requirements for installation of diesel particulate filters will reduce particulate matter and oxides of nitrogen from future operations. Starting in 2015, lighter trucks (between 14,000 and 26,000 GVWR) will be required to replace the vehicle and/or engine if the engine manufacture date is from 1995 or earlier. Newer engines will be required to be replaced on a graduated scale until 2023 when all engines will be required to meet model year 2010 emissions or equivalent. Heavier trucks (greater than 26,000 GVWR) have options for meeting the regulation requirements through 2023. Vehicles with engine years earlier than 1994 and 1995 will be required to be replaced in 2015 and 2016, respectively. Engines between 1996 and 2006 have the option to install a particulate filter before being required to replace the engine towards the compliance deadline. Later engines are considered compliant 2023 when they demonstrate 2010 emissions levels or equivalent. Idling restrictions were established in 2008 and apply to vehicles greater than 10,000 GVWR (Class 3 or greater). These restrictions limit idling to five minutes or less before manual or automatic shutdown must be initiated. Engine models manufactured in 2008 and beyond are required to be equipped with a non-programmable engine shutdown mechanism that automatically shuts off the engine after five minutes of idling.
4.5 2012 Air Quality Management Plan The purpose of an Air Quality Management Plan (AQMP) is to bring an air basin into compliance with federal and state air quality standards and is a multi-tiered document that builds on previously adopted AQMPs.17
The 2003 AQMP was adopted in August 2003 and demonstrated O3 and PM10 for the Basin. It also provides the maintenance plans for CO and NO2, which the Basin has been in attainment for since 1997 and 1992, respectively. The 2007 AQMP for the Basin was approved by the SCAQMD Board of Directors in June 2007. The 2007 AQMP builds on the 2003 AQMP and is designed to address the federal 8-hour ozone and PM2.5 air quality standards. The AQMP identifies short- and long-term control measures designed to reduce stationary, area, and mobile source emissions, organized into four primary components:
1. District Stationary and Mobile Source Control Measures 2. Air Resources Board (ARB) State Strategy 3. Supplement to ARB Control Strategy 4. SCAG Regional Transportation Strategy and Control Measures
The 2012 AQMP was adopted by the SCAQMD board on December 7, 2012. The 2012 AQMP incorporated the latest scientific and technological information and planning assumptions, including the 2012 Regional Transportation Plan/Sustainable Communities
Regulatory Framework
30 Air Quality and Climate Change Assessment
Strategy and updated emission inventory methodologies for various source categories. The 2012 AQMP includes the new and changing federal requirements, implementation of new technology measures, and the continued development of economically sound, flexible compliance approaches. The SCAQMD is currently in the process of preparing the 2015 AQMP update.
4.6 SCAQMD Rule Book In order to control air pollution in the Basin, SCAQMD adopts rules that establish permissible air pollutant emissions and governs a variety of businesses, processes, operations, and products to implement the AQMP and the various federal and state air quality requirements. SCAQMD does not adopt rules for mobile sources; those are established by ARB or the United States Environmental Protection Agency (EPA). Rules that will be applicable during construction of the proposed distribution facility include Rule 403 (Fugitive Dust) and Rule 1113 (Architectural Coatings). Rule 403 prohibits emissions of fugitive dust from any grading activity, storage pile, or other disturbed surface area if it crosses the project property line or if emissions caused by vehicle movement cause substantial impairment of visibility (defined as exceeding 20 percent opacity in the air). Rule 403 requires the implementation of Best Available Control Measures (BACM) and includes additional provisions for projects disturbing more than five acres and those disturbing more than fifty acres. Rule 1113 establishes maximum concentrations of VOCs in paints and other applications and establishes the thresholds for low-VOC coatings.
4.7 Executive Order S-3-05 Executive Order S-3-05 was issued by California Governor Arnold Schwarzenegger and established targets for the reduction of greenhouse gas emission at the milestone years of 2010, 2020, and 2050. Statewide GHG emissions must be reduced to 1990 levels by year 2020 and by 80 percent beyond that by year 2050. The Order requires the Secretary of the California Environmental Protection Agency (CalEPA) to coordinate with other State departments to identify strategies and reduction programs to meet the identified targets. A Climate Action Team (CAT) was created and is headed by the Secretary of CalEPA who reports on the progress of the reduction strategies. The latest CAT Biennial Report to the Governor and Legislature was completed in April 2010.18
4.8 California Global Warming Solutions Act
CAT also works in 11 subgroups to support development and implementation of the Scoping Plan (see California Global Warming Solutions Act herein).
The California State Legislature adopted the California Global Warming Solutions Act in 2006 (AB32). AB32 establishes the caps on statewide greenhouse gas emissions proclaimed in Executive Order S-3-05 and establishes a regulatory timeline to meet the reduction targets. The timeline is as follows: January 1, 2009 Adopt Scoping Plan January 1, 2010 Early action measures take effect January 1, 2011 Adopt GHG reduction measures
Regulatory Framework
Prologis Building 13 (3237) 31
January 1, 2012 Reduction measures take effect December 31, 2020 Deadline for 2020 reduction target As part of AB32, CARB had to determine what 1990 GHG emissions levels were and projected a business-as-usual (BAU) estimate for 2020 to determine the amount of GHG emissions that will need to be reduced. BAU is a term used to define emissions levels without considering reductions from future or existing programs or technologies. 1990 emissions are estimated at 427 million metric tons of carbon dioxide equivalent (MMTCO2E) while 2020 emissions (without implementation of reduction measures) is estimated at 596 MMTCO2E; therefore, California GHG emissions must be reduced 169 MMTCO2E by 2020, a reduction of approximately 29 percent. The California Air Resources Board (ARB) is responsible for implementation of AB32. Nine discrete early action measures and 35 additional measures were adopted in October 2007 and are now enforceable. The discrete early actions include a low carbon fuel standard, landfill methane capture regulations, reductions in HFCs from mobile air conditioning systems, fluorinated gas emissions from semiconductor manufacturing, sulfur hexafluoride from some industrial processes, high GWP gases in consumer products, and emissions from diesel auxiliary engines on ships at California Ports, improved fuel efficiency in heavy-duty diesel vehicles, and new tire pressure regulations. The early action programs form part of California’s comprehensive strategy for achieving the GHG reduction targets.
4.9 Sustainable Communities and Climate Protection Act In January 2009, California Senate Bill (SB) 375 went into effect known as the Sustainable Communities and Climate Protection Act.19
The objective of SB375 is to better integrate regional planning of transportation, land use, and housing to reduce sprawl and ultimately reduce greenhouse gas emissions and other air pollutants. SB375 tasks ARB to set greenhouse gas reduction targets for each of California’s 18 regional Metropolitan Planning Organizations (MPOs). Each MPO is required to prepare a Sustainable Communities Strategy (SCS) as part of their Regional Transportation Plan (RTP). The SCS is a growth strategy in combination with transportation policies that will show how the MPO will meet its GHG reduction target. If the SCS cannot meet the reduction goal, an Alternative Planning Strategy (APS) may be adopted that meets the goal through alternative development, infrastructure, and transportation measures or policies.
In the Southern California Association of Governments (SCAG) region (in which the project is located), sub-regions can also elect to prepare their own SCS or APS. In August 2010, ARB released the proposed GHG reduction targets for the MPOs to be adopted in September 2010. The proposed reduction targets for the SCAG region were 8-percent by year 2020 and 13-percent by year 2035. The 8-percent year 2020 target was adopted in September 2010 and tentatively adopted the year 2035 until February 2011 to provide additional time for SCAG, ARB, and other stakeholders to account for additional resources (such as state transportation funds) needed to achieve the proposed targets. In February 2011, the SCAG President affirmed the year 2035 reduction target and SCAG Staff
Regulatory Framework
32 Air Quality and Climate Change Assessment
updated ARB on additional funding opportunities. The status of funding was requested to be revisited again in year 2014.
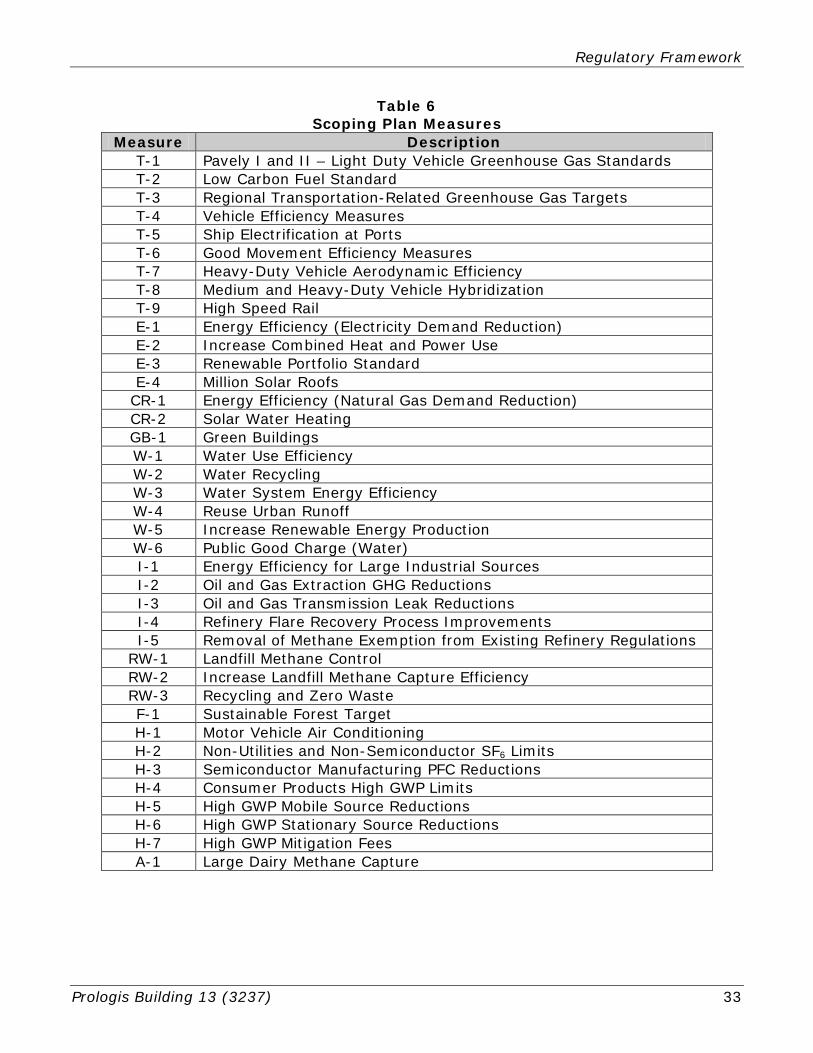
4.10 Air Resources Board Scoping Plan The ARB Scoping Plan is the comprehensive plan to reach the GHG reduction targets stipulated in AB32. The key elements of the plan are to expand and strengthen energy efficiency programs, achieve a statewide renewable energy mix of 33 percent, develop a cap-and-trade program with other partners in the Western Climate Initiative (includes seven states in the United States and four territories in Canada), establish transportation-related targets, and establish fees.20 The Scoping Plan measures are identified in Table 6 (Scoping Plan Measures). Note that the current early discrete actions are incorporated into these measures. ARB estimates that implementation of these measures will reduce GHG emissions in the state by 174 MMTCO2E by 2020; therefore, implementation of the Scoping Plan will meet the 2020 reduction target. In a report prepared on September 23, 2010, ARB indicates that 40 percent of the reduction measures identified in the Scoping Plan have been secured.21 ARB recently held the hearing for the cap-and-trade program rulemaking on December 16, 2010. The cap-and-trade program will begin January 1, 2012 after ARB completes a series of activities that deal with the registration process, compliance cycle, and tracking system; however, covered entities will not have an emissions obligation until 2013.22
4.11 California Green Building Standards
ARB is currently working on the low carbon fuel standard where public hearings and workshops are currently being conducted. In August 2011, the Scoping plan was reapproved by the ARB Board with the program’s environmental documentation.
New California Green Building Standards Code (CALGREEN) went into effect on January 1, 2011.23 The purpose of the new addition to the California Building Code (CBC) is to improve public health, safety, and general welfare by enhancing the design and construction of buildings using concepts to reduce negative impacts or produce positive impacts on the environment. The CALGREEN regulations cover planning and design, energy efficiency, water efficiency and conservation, material conservation and resources efficiency, and environmental quality. Many of the new regulations have the effect of reducing greenhouse gas emissions from the operation of new buildings. Table 7 (CALGREEN Requirements) summarizes the previous requirements of the CBC and the new requirements of CALGREEN that went into effect in January 2011. Minor technical revisions and additional requirements will go into effect in July 2012
Regulatory Framework
Prologis Building 13 (3237) 33
Table 6 Scoping Plan Measures
Measure Description T-1 Pavely I and II – Light Duty Vehicle Greenhouse Gas Standards T-2 Low Carbon Fuel Standard T-3 Regional Transportation-Related Greenhouse Gas Targets T-4 Vehicle Efficiency Measures T-5 Ship Electrification at Ports T-6 Good Movement Efficiency Measures T-7 Heavy-Duty Vehicle Aerodynamic Efficiency T-8 Medium and Heavy-Duty Vehicle Hybridization T-9 High Speed Rail E-1 Energy Efficiency (Electricity Demand Reduction) E-2 Increase Combined Heat and Power Use E-3 Renewable Portfolio Standard E-4 Million Solar Roofs
CR-1 Energy Efficiency (Natural Gas Demand Reduction) CR-2 Solar Water Heating GB-1 Green Buildings W-1 Water Use Efficiency W-2 Water Recycling W-3 Water System Energy Efficiency W-4 Reuse Urban Runoff W-5 Increase Renewable Energy Production W-6 Public Good Charge (Water) I-1 Energy Efficiency for Large Industrial Sources I-2 Oil and Gas Extraction GHG Reductions I-3 Oil and Gas Transmission Leak Reductions I-4 Refinery Flare Recovery Process Improvements I-5 Removal of Methane Exemption from Existing Refinery Regulations
RW-1 Landfill Methane Control RW-2 Increase Landfill Methane Capture Efficiency RW-3 Recycling and Zero Waste F-1 Sustainable Forest Target H-1 Motor Vehicle Air Conditioning H-2 Non-Utilities and Non-Semiconductor SF6 Limits H-3 Semiconductor Manufacturing PFC Reductions H-4 Consumer Products High GWP Limits H-5 High GWP Mobile Source Reductions H-6 High GWP Stationary Source Reductions H-7 High GWP Mitigation Fees A-1 Large Dairy Methane Capture
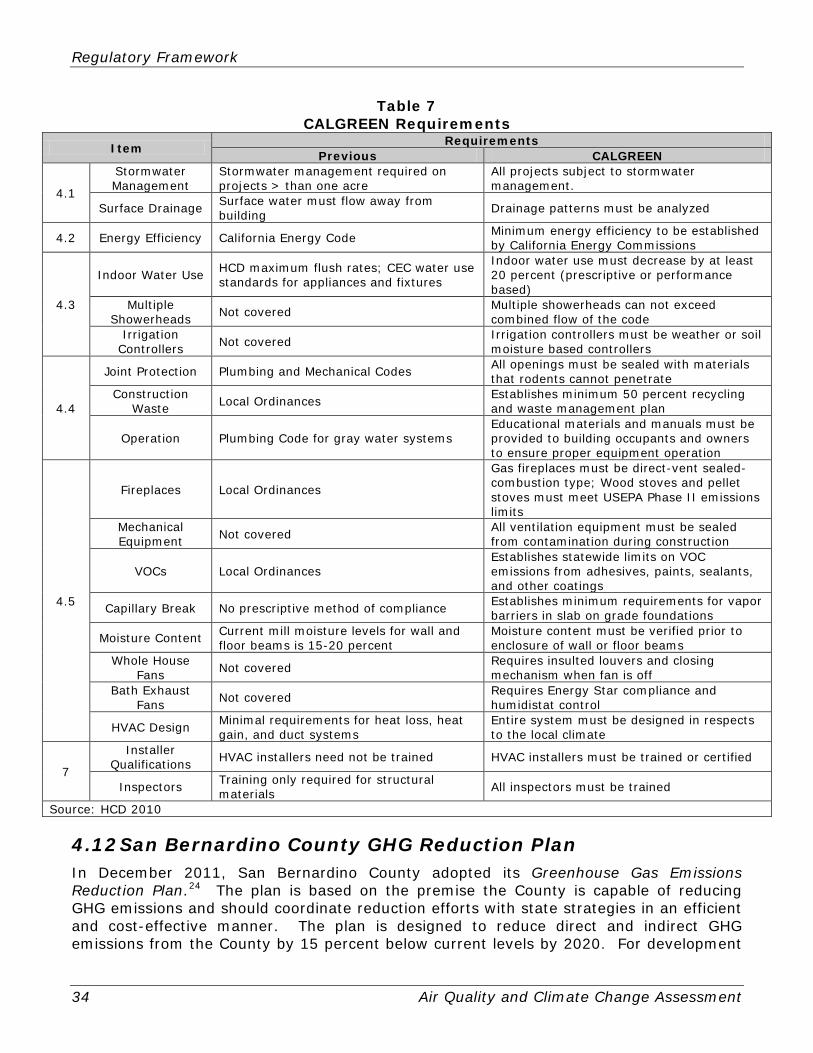
Regulatory Framework
34 Air Quality and Climate Change Assessment
Table 7 CALGREEN Requirements
Item Requirements Previous CALGREEN
4.1
Stormwater Management
Stormwater management required on projects > than one acre
All projects subject to stormwater management.
Surface Drainage Surface water must flow away from building Drainage patterns must be analyzed
4.2 Energy Efficiency California Energy Code Minimum energy efficiency to be established by California Energy Commissions
4.3
Indoor Water Use HCD maximum flush rates; CEC water use standards for appliances and fixtures
Indoor water use must decrease by at least 20 percent (prescriptive or performance based)
Multiple Showerheads Not covered Multiple showerheads can not exceed
combined flow of the code Irrigation
Controllers Not covered Irrigation controllers must be weather or soil moisture based controllers
4.4
Joint Protection Plumbing and Mechanical Codes All openings must be sealed with materials that rodents cannot penetrate
Construction Waste Local Ordinances Establishes minimum 50 percent recycling
and waste management plan
Operation Plumbing Code for gray water systems Educational materials and manuals must be provided to building occupants and owners to ensure proper equipment operation
4.5
Fireplaces Local Ordinances
Gas fireplaces must be direct-vent sealed-combustion type; Wood stoves and pellet stoves must meet USEPA Phase II emissions limits
Mechanical Equipment Not covered All ventilation equipment must be sealed
from contamination during construction
VOCs Local Ordinances Establishes statewide limits on VOC emissions from adhesives, paints, sealants, and other coatings
Capillary Break No prescriptive method of compliance Establishes minimum requirements for vapor barriers in slab on grade foundations
Moisture Content Current mill moisture levels for wall and floor beams is 15-20 percent
Moisture content must be verified prior to enclosure of wall or floor beams
Whole House Fans Not covered Requires insulted louvers and closing
mechanism when fan is off Bath Exhaust
Fans Not covered Requires Energy Star compliance and humidistat control
HVAC Design Minimal requirements for heat loss, heat gain, and duct systems
Entire system must be designed in respects to the local climate
7
Installer Qualifications HVAC installers need not be trained HVAC installers must be trained or certified
Inspectors Training only required for structural materials All inspectors must be trained
Source: HCD 2010
4.12 San Bernardino County GHG Reduction Plan In December 2011, San Bernardino County adopted its Greenhouse Gas Emissions Reduction Plan.24 The plan is based on the premise the County is capable of reducing GHG emissions and should coordinate reduction efforts with state strategies in an efficient and cost-effective manner. The plan is designed to reduce direct and indirect GHG emissions from the County by 15 percent below current levels by 2020. For development
Regulatory Framework
Prologis Building 13 (3237) 35
review, the plan establishes a preliminary screening threshold of 3,000 metric tons of carbon dioxide equivalent per year (MTCO2E) to determine if a project is subject to further climate change review.
4.13 Water Conservation in Landscaping Act Section 65591 of the Government Code requires all local jurisdictions to adopt a water efficient landscape ordinance. The ordinance is to address water conservation through appropriate use and grouping of plants based on environmental conditions, water budgeting to maximize irrigation efficiency, storm water retention, and automatic irrigation systems. Failure to adopt a water efficiency ordinance requires a local jurisdiction to enforce the provisions of the State’s model water efficiency ordinance. In 2009, the Department of Water Resources (DWR) updated the Model Water Efficient Landscape Ordinance pursuant to amendments to the 1991 Act. These amendments and the new model ordinance went into effect on January 1, 2010. The amended Act is applicable to any new commercial, multi-family, industrial or tract home project containing 2,500 square feet (SF) or more of landscaping. Individual landscape projects of 5,000 SF or more on single-family properties will also be subject to the Act. All landscape plans are required to include calculations verifying conformance with the maximum applied water allowance and must be prepared and stamped by a licensed landscape architect.
Regulatory Framework
36 Air Quality and Climate Change Assessment
This Page Intentionally Left Blank
Prologis Building 13 (3237) 37
5 Project Description The project is a 289,327 square foot (SF) distribution facility on 13.29 acres (AC) located on the southeast corner of River Bluff Avenue at Alabama Street in unincorporated San Bernardino County, California (near Redlands). The project also includes office space (estimated at approximately 10,000 SF), 86,977 SF of landscaping, and a vegetated detention basin on Alabama Street along the western boundary of the project site. The project site is currently vacant and sparsely vegetated with grasses.
Project Description
38 Air Quality and Climate Change Assessment
This Page Intentionally Left Blank
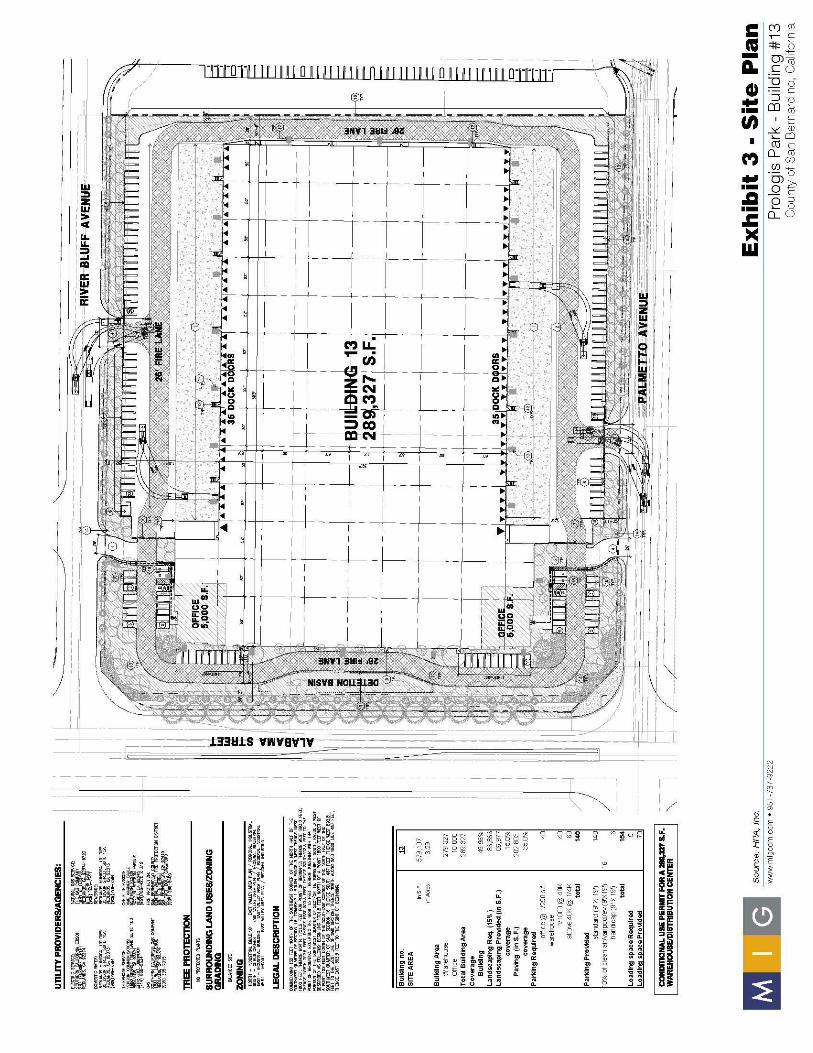
Project Description
Prologis Building 13 (3237) 39
Exhibit 3 Site Plan

Project Description
40 Air Quality and Climate Change Assessment
This Page Intentionally Left Blank
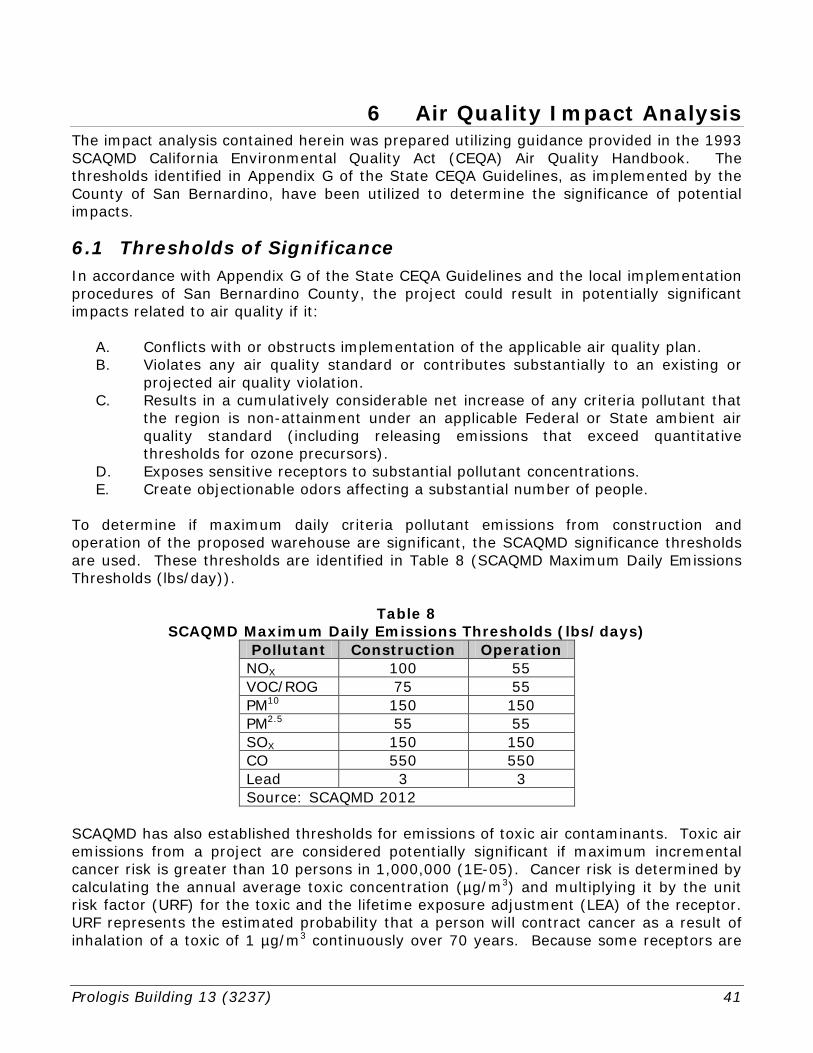
Prologis Building 13 (3237) 41
6 Air Quality Impact Analysis The impact analysis contained herein was prepared utilizing guidance provided in the 1993 SCAQMD California Environmental Quality Act (CEQA) Air Quality Handbook. The thresholds identified in Appendix G of the State CEQA Guidelines, as implemented by the County of San Bernardino, have been utilized to determine the significance of potential impacts.
6.1 Thresholds of Significance In accordance with Appendix G of the State CEQA Guidelines and the local implementation procedures of San Bernardino County, the project could result in potentially significant impacts related to air quality if it:
A. Conflicts with or obstructs implementation of the applicable air quality plan. B. Violates any air quality standard or contributes substantially to an existing or
projected air quality violation. C. Results in a cumulatively considerable net increase of any criteria pollutant that
the region is non-attainment under an applicable Federal or State ambient air quality standard (including releasing emissions that exceed quantitative thresholds for ozone precursors).
D. Exposes sensitive receptors to substantial pollutant concentrations. E. Create objectionable odors affecting a substantial number of people.
To determine if maximum daily criteria pollutant emissions from construction and operation of the proposed warehouse are significant, the SCAQMD significance thresholds are used. These thresholds are identified in Table 8 (SCAQMD Maximum Daily Emissions Thresholds (lbs/day)).
Table 8 SCAQMD Maximum Daily Emissions Thresholds (lbs/days)
Pollutant Construction Operation NOX 100 55 VOC/ROG 75 55 PM10 150 150 PM2.5 55 55 SOX 150 150 CO 550 550 Lead 3 3 Source: SCAQMD 2012
SCAQMD has also established thresholds for emissions of toxic air contaminants. Toxic air emissions from a project are considered potentially significant if maximum incremental cancer risk is greater than 10 persons in 1,000,000 (1E-05). Cancer risk is determined by calculating the annual average toxic concentration (µg/m3) and multiplying it by the unit risk factor (URF) for the toxic and the lifetime exposure adjustment (LEA) of the receptor. URF represents the estimated probability that a person will contract cancer as a result of inhalation of a toxic of 1 µg/m3 continuously over 70 years. Because some receptors are
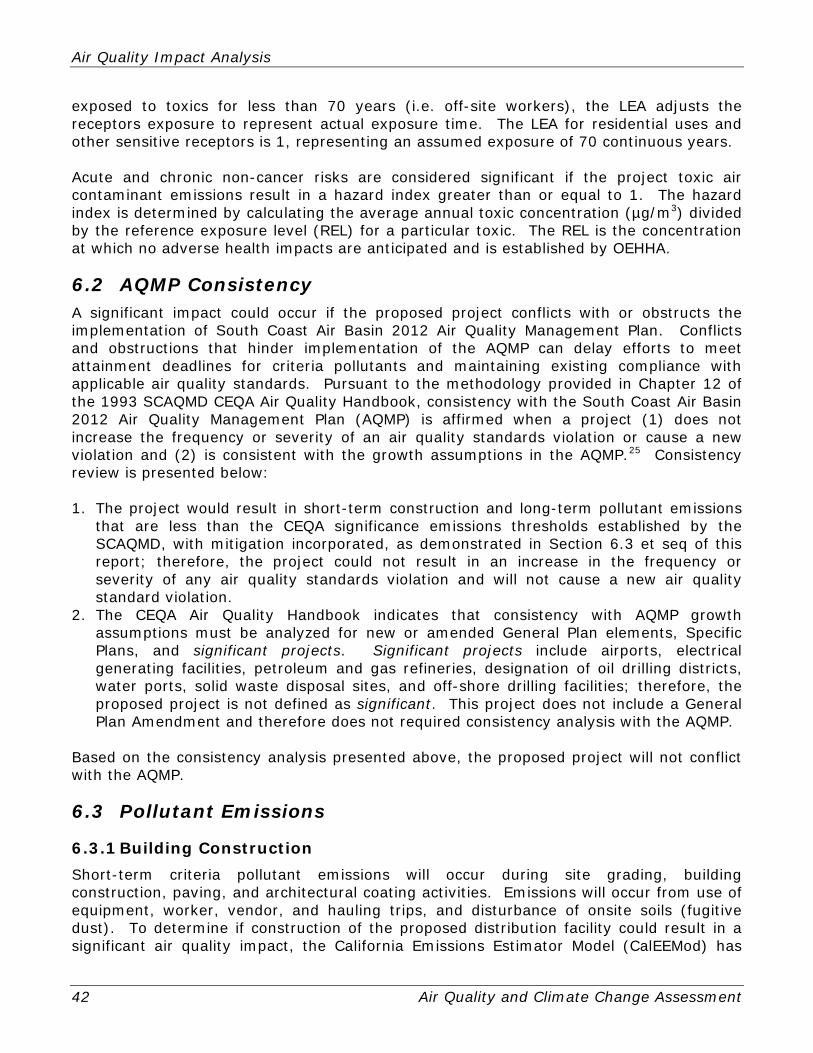
Air Quality Impact Analysis
42 Air Quality and Climate Change Assessment
exposed to toxics for less than 70 years (i.e. off-site workers), the LEA adjusts the receptors exposure to represent actual exposure time. The LEA for residential uses and other sensitive receptors is 1, representing an assumed exposure of 70 continuous years. Acute and chronic non-cancer risks are considered significant if the project toxic air contaminant emissions result in a hazard index greater than or equal to 1. The hazard index is determined by calculating the average annual toxic concentration (µg/m3) divided by the reference exposure level (REL) for a particular toxic. The REL is the concentration at which no adverse health impacts are anticipated and is established by OEHHA.
6.2 AQMP Consistency A significant impact could occur if the proposed project conflicts with or obstructs the implementation of South Coast Air Basin 2012 Air Quality Management Plan. Conflicts and obstructions that hinder implementation of the AQMP can delay efforts to meet attainment deadlines for criteria pollutants and maintaining existing compliance with applicable air quality standards. Pursuant to the methodology provided in Chapter 12 of the 1993 SCAQMD CEQA Air Quality Handbook, consistency with the South Coast Air Basin 2012 Air Quality Management Plan (AQMP) is affirmed when a project (1) does not increase the frequency or severity of an air quality standards violation or cause a new violation and (2) is consistent with the growth assumptions in the AQMP.25
Consistency review is presented below:
1. The project would result in short-term construction and long-term pollutant emissions that are less than the CEQA significance emissions thresholds established by the SCAQMD, with mitigation incorporated, as demonstrated in Section 6.3 et seq of this report; therefore, the project could not result in an increase in the frequency or severity of any air quality standards violation and will not cause a new air quality standard violation.
2. The CEQA Air Quality Handbook indicates that consistency with AQMP growth assumptions must be analyzed for new or amended General Plan elements, Specific Plans, and significant projects. Significant projects include airports, electrical generating facilities, petroleum and gas refineries, designation of oil drilling districts, water ports, solid waste disposal sites, and off-shore drilling facilities; therefore, the proposed project is not defined as significant. This project does not include a General Plan Amendment and therefore does not required consistency analysis with the AQMP.
Based on the consistency analysis presented above, the proposed project will not conflict with the AQMP.
6.3 Pollutant Emissions
6.3.1 Building Construction Short-term criteria pollutant emissions will occur during site grading, building construction, paving, and architectural coating activities. Emissions will occur from use of equipment, worker, vendor, and hauling trips, and disturbance of onsite soils (fugitive dust). To determine if construction of the proposed distribution facility could result in a significant air quality impact, the California Emissions Estimator Model (CalEEMod) has
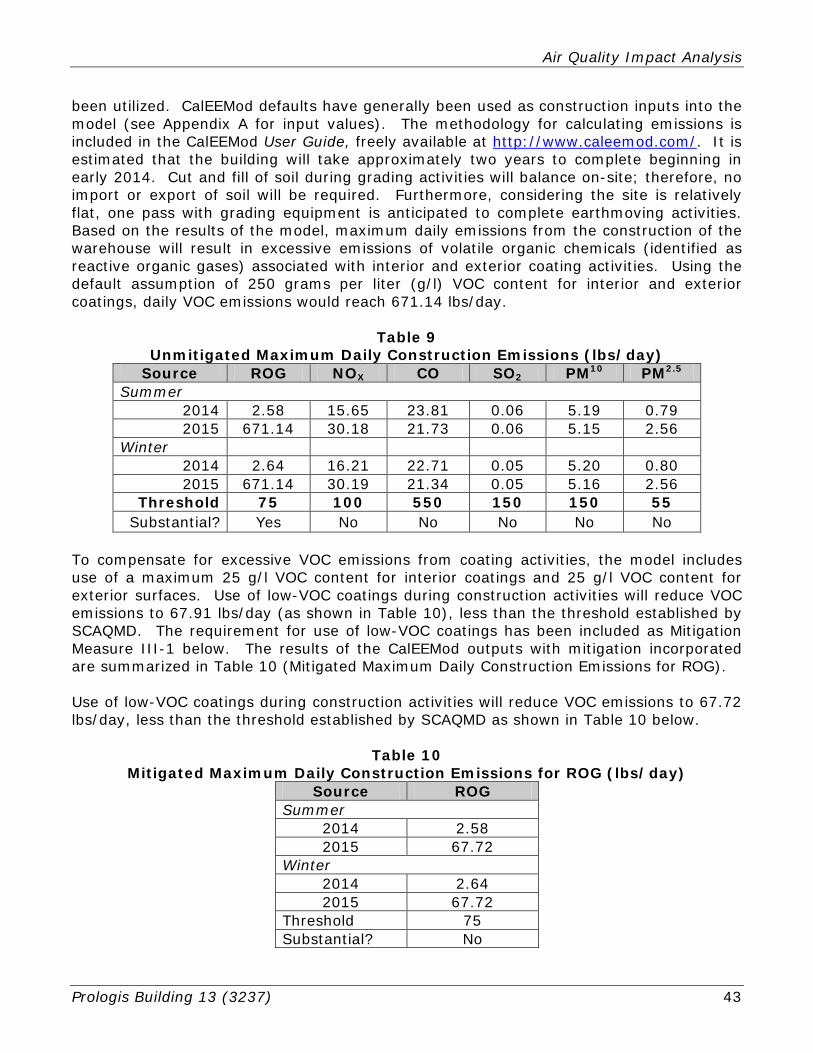
Air Quality Impact Analysis
Prologis Building 13 (3237) 43
been utilized. CalEEMod defaults have generally been used as construction inputs into the model (see Appendix A for input values). The methodology for calculating emissions is included in the CalEEMod User Guide, freely available at http://www.caleemod.com/. It is estimated that the building will take approximately two years to complete beginning in early 2014. Cut and fill of soil during grading activities will balance on-site; therefore, no import or export of soil will be required. Furthermore, considering the site is relatively flat, one pass with grading equipment is anticipated to complete earthmoving activities. Based on the results of the model, maximum daily emissions from the construction of the warehouse will result in excessive emissions of volatile organic chemicals (identified as reactive organic gases) associated with interior and exterior coating activities. Using the default assumption of 250 grams per liter (g/l) VOC content for interior and exterior coatings, daily VOC emissions would reach 671.14 lbs/day.
Table 9 Unmitigated Maximum Daily Construction Emissions (lbs/day)
Source ROG NOX CO SO2 PM10 PM2.5 Summer
2014 2.58 15.65 23.81 0.06 5.19 0.79 2015 671.14 30.18 21.73 0.06 5.15 2.56
Winter 2014 2.64 16.21 22.71 0.05 5.20 0.80 2015 671.14 30.19 21.34 0.05 5.16 2.56
Threshold 75 100 550 150 150 55 Substantial? Yes No No No No No
To compensate for excessive VOC emissions from coating activities, the model includes use of a maximum 25 g/l VOC content for interior coatings and 25 g/l VOC content for exterior surfaces. Use of low-VOC coatings during construction activities will reduce VOC emissions to 67.91 lbs/day (as shown in Table 10), less than the threshold established by SCAQMD. The requirement for use of low-VOC coatings has been included as Mitigation Measure III-1 below. The results of the CalEEMod outputs with mitigation incorporated are summarized in Table 10 (Mitigated Maximum Daily Construction Emissions for ROG). Use of low-VOC coatings during construction activities will reduce VOC emissions to 67.72 lbs/day, less than the threshold established by SCAQMD as shown in Table 10 below.
Table 10 Mitigated Maximum Daily Construction Emissions for ROG (lbs/day)
Source ROG Summer
2014 2.58 2015 67.72
Winter 2014 2.64 2015 67.72
Threshold 75 Substantial? No
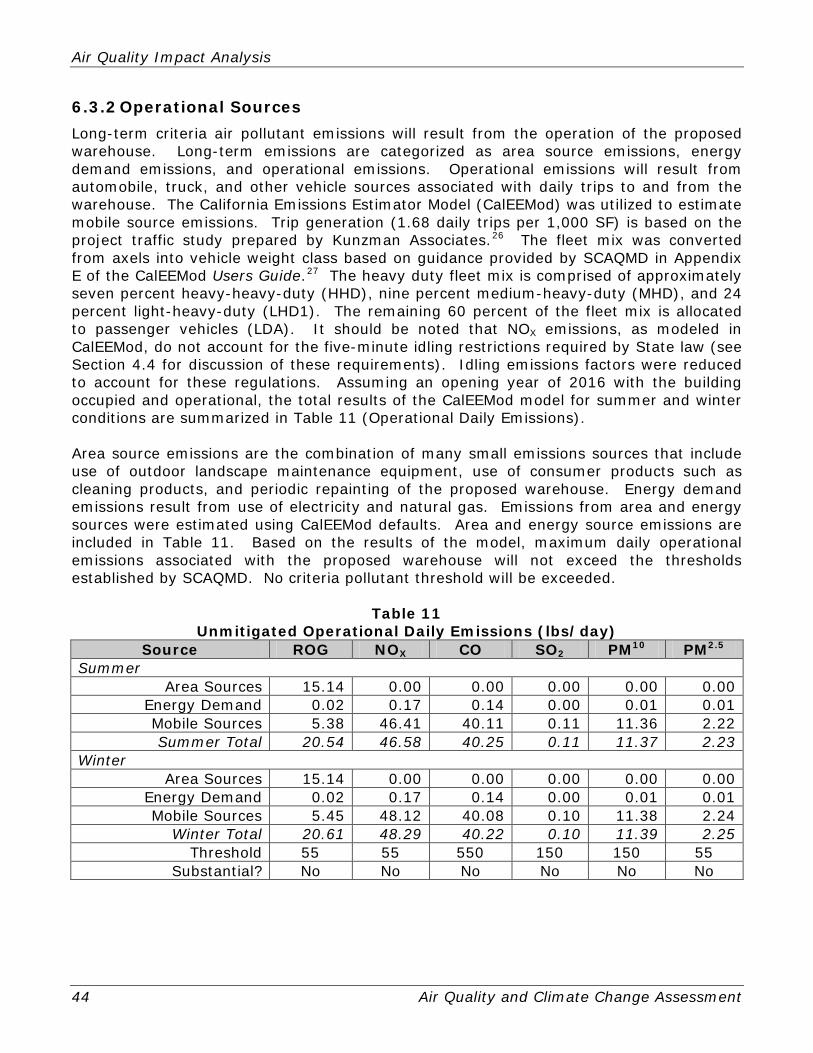
Air Quality Impact Analysis
44 Air Quality and Climate Change Assessment
6.3.2 Operational Sources Long-term criteria air pollutant emissions will result from the operation of the proposed warehouse. Long-term emissions are categorized as area source emissions, energy demand emissions, and operational emissions. Operational emissions will result from automobile, truck, and other vehicle sources associated with daily trips to and from the warehouse. The California Emissions Estimator Model (CalEEMod) was utilized to estimate mobile source emissions. Trip generation (1.68 daily trips per 1,000 SF) is based on the project traffic study prepared by Kunzman Associates.26 The fleet mix was converted from axels into vehicle weight class based on guidance provided by SCAQMD in Appendix E of the CalEEMod Users Guide.27
The heavy duty fleet mix is comprised of approximately seven percent heavy-heavy-duty (HHD), nine percent medium-heavy-duty (MHD), and 24 percent light-heavy-duty (LHD1). The remaining 60 percent of the fleet mix is allocated to passenger vehicles (LDA). It should be noted that NOX emissions, as modeled in CalEEMod, do not account for the five-minute idling restrictions required by State law (see Section 4.4 for discussion of these requirements). Idling emissions factors were reduced to account for these regulations. Assuming an opening year of 2016 with the building occupied and operational, the total results of the CalEEMod model for summer and winter conditions are summarized in Table 11 (Operational Daily Emissions).
Area source emissions are the combination of many small emissions sources that include use of outdoor landscape maintenance equipment, use of consumer products such as cleaning products, and periodic repainting of the proposed warehouse. Energy demand emissions result from use of electricity and natural gas. Emissions from area and energy sources were estimated using CalEEMod defaults. Area and energy source emissions are included in Table 11. Based on the results of the model, maximum daily operational emissions associated with the proposed warehouse will not exceed the thresholds established by SCAQMD. No criteria pollutant threshold will be exceeded.
Table 11 Unmitigated Operational Daily Emissions (lbs/day)
Source ROG NOX CO SO2 PM10 PM2.5 Summer
Area Sources 15.14 0.00 0.00 0.00 0.00 0.00 Energy Demand 0.02 0.17 0.14 0.00 0.01 0.01 Mobile Sources 5.38 46.41 40.11 0.11 11.36 2.22 Summer Total 20.54 46.58 40.25 0.11 11.37 2.23
Winter Area Sources 15.14 0.00 0.00 0.00 0.00 0.00
Energy Demand 0.02 0.17 0.14 0.00 0.01 0.01 Mobile Sources 5.45 48.12 40.08 0.10 11.38 2.24
Winter Total 20.61 48.29 40.22 0.10 11.39 2.25 Threshold 55 55 550 150 150 55
Substantial? No No No No No No
Air Quality Impact Analysis
Prologis Building 13 (3237) 45
6.4 Localized Emissions
6.4.1 Toxic Air Contaminants Distribution warehouses result in the generation of heavy diesel truck traffic and have been linked with high emissions of diesel particulate matter (DPM), established as an air toxic contaminant by ARB in 1998.28
DPM was identified as a toxic because of its potential to cause cancer, premature deaths, and other health problems. Health hazards associated with DPM are especially hazardous for children because their lungs are still developing, and the elderly who may have other serious health problems. As identified in Exhibit 2, there is one sensitive land uses located within one-quarter mile of the proposed warehouse, a single-family home approximately 0.22 miles south of the project.
Cancer risk and non-cancer health risks from construction activities were analyzed using the EPA SCREEN3 model and guidance provided by SCAQMD.29
SCREEN3 is a single source Gaussian plume model that provides maximum ground-level concentrations for point, area, flare, and volume sources. SCREEN3 outputs are attached as Appendix C. The emissions factors for idling trucks and on-site truck movement were modeled using EMFAC2011. EMFAC2011 was developed by ARB to calculate emissions inventories for mobile vehicles operating in California based on raw vehicle data. EMFAC2011 outputs are included in Appendix C.
Idling and running emissions (10 miles per hour) were for afternoon peak hour truck traffic consisting of seven light-heavy duty trucks (LHD1), six medium-heavy duty trucks (T6), and four heavy-heavy duty trucks (T7). With a building size of 289,327 square meters (m2), the maximum idling and running emissions factor from the proposed building is 1.32908E-09 grams per second per square meter (g/sec/m2). Truck movement was estimated at 0.25 miles per truck reflecting the length of the longest proposed drive aisle. These emissions factors were input into SCREEN3 to estimate DPM concentrations in a 1,000-meter grid around the project site at 100-meter transects. SCREEN3 indicates that the worst-case maximum concentration will occur 251 meters (824 feet) from the southwest of the project site at 0.3518E-01 µg/m3. The discrete and maximum grid receptor concentrations around the proposed warehouse are summarized in Table 12 (Maximum Diesel Particulate Concentrations).
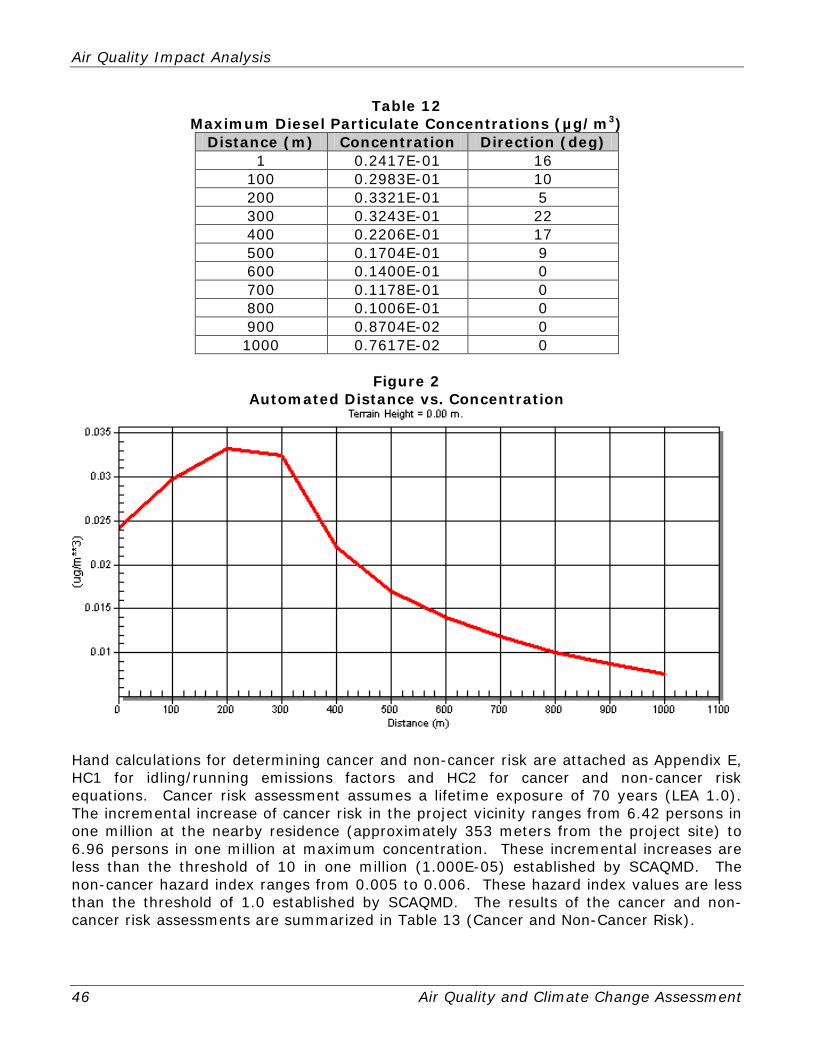
Air Quality Impact Analysis
46 Air Quality and Climate Change Assessment
Table 12 Maximum Diesel Particulate Concentrations (µg/m3)
Distance (m) Concentration Direction (deg) 1 0.2417E-01 16
100 0.2983E-01 10 200 0.3321E-01 5 300 0.3243E-01 22 400 0.2206E-01 17 500 0.1704E-01 9 600 0.1400E-01 0 700 0.1178E-01 0 800 0.1006E-01 0 900 0.8704E-02 0 1000 0.7617E-02 0
Figure 2
Automated Distance vs. Concentration
Hand calculations for determining cancer and non-cancer risk are attached as Appendix E, HC1 for idling/running emissions factors and HC2 for cancer and non-cancer risk equations. Cancer risk assessment assumes a lifetime exposure of 70 years (LEA 1.0). The incremental increase of cancer risk in the project vicinity ranges from 6.42 persons in one million at the nearby residence (approximately 353 meters from the project site) to 6.96 persons in one million at maximum concentration. These incremental increases are less than the threshold of 10 in one million (1.000E-05) established by SCAQMD. The non-cancer hazard index ranges from 0.005 to 0.006. These hazard index values are less than the threshold of 1.0 established by SCAQMD. The results of the cancer and non-cancer risk assessments are summarized in Table 13 (Cancer and Non-Cancer Risk).
Air Quality Impact Analysis
Prologis Building 13 (3237) 47
Table 13 Cancer and Non-Cancer Risk
Distance Cancer Risk Non-Cancer Risk 251 6.966E-06 0.007
Threshold 10.000E-06 1.000 Substantial? No No
6.4.2 Carbon Monoxide Hotspots A carbon monoxide (CO) hotspot is an area of localized CO pollution that is caused by severe vehicle congestion on major roadways, typically near intersections. CO hotspots have the potential to violate state and federal CO standards at intersections, even if the broader Basin is in attainment for federal and state levels. In general, SCAQMD and the California Department of Transportation Project-Level Carbon Monoxide Protocol (CO Protocol) recommend analysis of CO hotspots when a project increases traffic volumes at an intersection by more than two percent that is operating at LOS D or worse.30 31
According to Section 3.1.3 of the Protocol, the project is not regionally significant and therefore is only required to examine local impacts (see Appendix D). Regionally significant projects are defined in 40 CFR Section 93.101 and through extension in 40 CFR Section 93.105(c)(1)(ii), as follows:
Regionally significant project means a transportation project (other than an exempt project) that is on a facility which serves regional transportation needs (such as access to and from the area outside of the region, major activity centers in the region, major planned developments such as new retail malls, sports complexes, etc., or transportation terminals as well as most terminals themselves) and would normally be included in the modeling of a metropolitan area's transportation network, including at a minimum all principal arterial highways and all fixed guideway transit facilities that offer an alternative to regional highway travel.
Localized impacts are analyzed in Protocol Section 4. The local analysis procedures in Section 4.7.1 indicate that the project has the potential to worsen air quality (as defined for Protocol purposes only) because it will result in an increase in the number of vehicles operating in cold start mode by more than two percent. Cold Start mode refers to a vehicle started after an hour or more being turned off. The project will also increase average daily trip (ADT) by more than two percent on local roadways and will likely result in some decrease in average speeds due to the increased traffic at the project site ingresses and egresses. The local analysis procedures then direct to Protocol Sections 4.7.3 and 4.7.4. These sections indicate that if the project involves signalized intersections performing at Level of Service (LOS) E or worse then the project will be subject to a screening analysis. The proposed project will not involve signalized intersections operating at LOS E or worse as identified in the project traffic study (with improvements). The final section (4.7.5) looks at special conditions that could result in potential hotspot formations even if poorly performing intersections are not involved. Because the project includes a high percentage of vehicles operating in cold start mode coupled with high traffic volumes, a screening analysis is performed to determine if a detailed analysis will be required. Section 4.4 references Appendix A of the Protocol for
Air Quality Impact Analysis
48 Air Quality and Climate Change Assessment
screening purposes; however, because of the age of the assumptions used in the screening procedures, they are no longer acceptable. The Sacramento Metropolitan Air Quality Management District (SAQMD) developed a screening threshold that states that any project involving an intersection experiencing 31,600 vehicles per hour or more will require detailed analysis.32
6.5 Odors
The project will not involve an intersection experiencing this level of traffic; therefore, the project passes the screening analysis and impacts are deemed acceptable. Based on the local analysis procedures, the project is satisfactory pursuant to the Protocol and will not result in a CO hotspot.
According to the CEQA Air Quality Handbook, land uses associated with odor complaints include agricultural operations, wastewater treatment plants, landfills, and certain industrial operations (such as manufacturing uses that produce chemicals, paper, etc.). The proposed warehouse is sited within an existing industrial area. The proposed warehouse is not considered a sensitive receptor and therefore would not be substantially affected by potential odors from existing industrial uses operations. The proposed warehouse, in turn, does not produce odors that would affect a substantial number of people considering that the proposed warehouse will not result in the manufacturing of any products and that there are no sensitive receptors in the project vicinity.
6.6 Cumulative Impacts
6.6.1 Cumulative Construction Impacts Cumulative short-term, construction-related emissions from the project will not contribute considerably to any potential cumulative air quality impact because short-term project emissions will be less than significant and other concurrent construction projects in the region will be required to implement standard air quality regulations and mitigation pursuant to State CEQA requirements, just as this project has.
6.6.2 Cumulative Operational Impacts The SCAQMD CEQA Air Quality Handbook identifies methodologies for analyzing long-term cumulative air quality impacts. These methodologies identify three performance standards that can be used to determine if long-term emissions will result in cumulative impacts. Essentially, these methodologies assess growth associated with a land use project and are evaluated for consistency with regional projections. Consistency would demonstrate that the project’s cumulative impacts are not significant. Exceedance of regional projections could result in potentially significant impacts. To determine if the project could result in cumulative impacts, the methodology identified in Table A9-15 of the Air Quality Handbook has been utilized. This method establishes a minimum one percent per year reduction in project emissions over the life of the project. If this minimum reduction were met, the project would not result in a significant cumulative impact because emissions would demonstrate consistency with the AQMP. Opening-year emissions (2016) and year 2040 emissions are summarized in Table 14 (Long-Term Cumulative Emissions Reductions (tons/yr)), based on an assumed 24-year
Air Quality Impact Analysis
Prologis Building 13 (3237) 49
(2016 to 2040) lifespan for the proposed warehouse. Generally, a 30-year lifespan is utilized for the life of a project; however, CalEEMod only provides emissions estimated up to year 2040. As emissions technology improves past year 2040, emissions will be reduced beyond those modeled in Table 14, further reducing emission from the proposed warehouses beyond a 24-year lifespan.
Table 14 Long-Term Cumulative Emissions Reductions (tons/yr) Year ROG NOX CO SO2 PM10 PM2.5
2016 3.72 8.48 7.30 0.02 1.89 0.40 2040 3.19 3.93 3.31 0.02 1.71 0.16 Maximum Allowable Emissions 2.92 6.66 5.74 0.02 1.48 0.31
Variance 0.27 -2.73 -2.43 0.00 0.23 -0.15 Year 2040 > Max Allowable? Yes No No No Yes No
Maximum allowable emissions equivalent to a minimum one percent reduction over the project lifespan for each criteria pollutant are identified in Table 14. Long-term emissions reflect long-term emissions technology improvements as modeled by CalEEMod utilizing State EMFAC2007 emissions factors. The variance between year 2040 emissions and the maximum allowable one percent per year emissions threshold indicates that Year 2040 cumulative emissions from operation of the warehouse will be less than maximum allowable emissions for all criteria pollutants except ROG and PM10. Emissions of ROG will be reduced by approximately 16 percent over the 24 year project life, 0.59 percent per year. This is 0.27 total tons over the total allowable 2.92 tons, or 0.01 tons per year (20 lbs per year) over the life of the project. An excess of 20 pounds per year is not substantial considering it would not contribute substantially to any daily air quality violation and in light of the long-term emissions reductions that will be achieved over the life of the project. Emissions of PM10 will be reduced by approximately ten percent over the 24 year project life, 0.32 percent per year. This is 0.23 total tons over the total allowable 1.48 tons, or 0.0096 tons per year (19 lbs per year) over the life of the project. An excess of 19 pounds per year is not substantial considering it would not contribute substantially to any daily air quality violation and in light of the long-term emissions reductions that will be achieved over the life of the project.
Air Quality Impact Analysis
50 Air Quality and Climate Change Assessment
This Page Intentionally Left Blank

Prologis Building 13 (3237) 51
7 Climate Change Impact Analysis
7.1 Thresholds of Significance The proposed project could result in potentially significant impacts related to greenhouse gas emissions and global climate change if it would: A. Generate greenhouse gas emissions, either directly or indirectly, that may have a
significant impact on the environment. B. Conflict with an applicable plan, policy, or regulation adopted for the purposes of
reducing the emissions of greenhouse gases. The County of San Bernardino adopted its Greenhouse Gas Emissions Plan in December 2011.33
7.2 Direct and Indirect Emissions
The purpose of the GHG Plan is to reduce the County's internal and external GHG emissions by 15 percent below current (2011) levels by year 2020. The GHG Plan includes a two-tiered development review procedure to determine if a project could result in a significant impact related to greenhouse gas emissions or otherwise comply with the Plan pursuant to Section 15183.5 of the state CEQA Guidelines. The initial screening procedure is to determine if a project will emit 3,000 metric tons of carbon dioxide equivalent (MTCO2E) per year or more. Projects that do not exceed this threshold require no further climate change analysis. Projects exceeding this threshold must meet a minimum 31 percent emissions reduction in order to garner a less than significant determination. This can be met by either (1) achieving 100 points from a menu of mitigation options provided in the GHG Plan or (2) quantifying proposed reduction measures. Projects failing to meet the 31 percent reduction threshold would have a potentially significant impact related to climate change and greenhouse gas emissions.
The proposed warehouse will include activities that emit greenhouse gas emissions over the short- and long-term. While one project could not be said to cause global climate change, individual projects contribute cumulatively to greenhouse gas emissions that result in climate change. To determine if the proposed warehouse will exceed the 3,000 MTC2OE screening threshold, a greenhouse gas emissions inventory was prepared for the project and is analyzed below.
7.2.1 Short-Term Emissions The project will result in short-term greenhouse gas emissions from construction and installation activities associated with construction of the proposed warehouse. Greenhouse gas emissions will be released by equipment used for grading, paving, and building construction activities. GHG emissions will also result from worker and vendor trips to and from the project site. Table 15 (Construction Greenhouse Gas Emissions) summarizes the estimated yearly emissions from construction activities. Carbon dioxide emissions from construction equipment and worker/vendor trips were estimated utilizing the California Emissions Estimator Model (CalEEMod) version 2011.1.1 (see Appendix B). Construction activities are short-term and cease to emit greenhouse gases upon
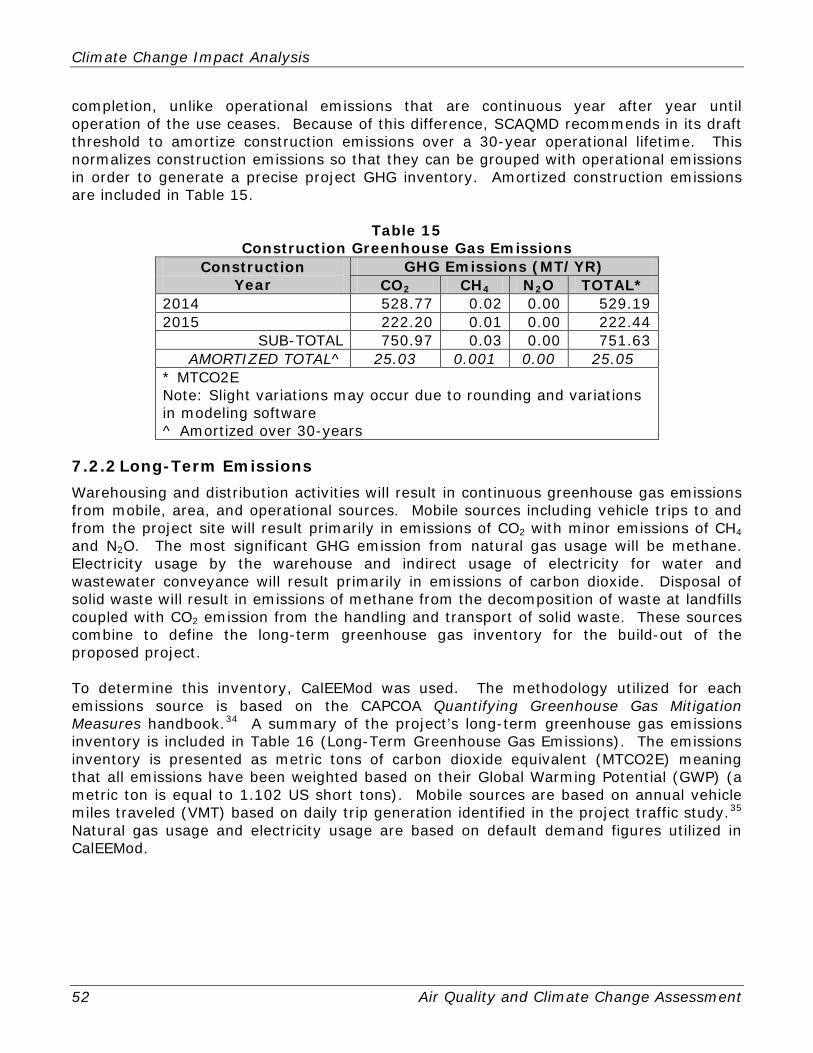
Climate Change Impact Analysis
52 Air Quality and Climate Change Assessment
completion, unlike operational emissions that are continuous year after year until operation of the use ceases. Because of this difference, SCAQMD recommends in its draft threshold to amortize construction emissions over a 30-year operational lifetime. This normalizes construction emissions so that they can be grouped with operational emissions in order to generate a precise project GHG inventory. Amortized construction emissions are included in Table 15.
Table 15 Construction Greenhouse Gas Emissions
Construction Year
GHG Emissions (MT/YR) CO2 CH4 N2O TOTAL*
2014 528.77 0.02 0.00 529.19 2015 222.20 0.01 0.00 222.44
SUB-TOTAL 750.97 0.03 0.00 751.63 AMORTIZED TOTAL^ 25.03 0.001 0.00 25.05
* MTCO2E Note: Slight variations may occur due to rounding and variations in modeling software ^ Amortized over 30-years
7.2.2 Long-Term Emissions Warehousing and distribution activities will result in continuous greenhouse gas emissions from mobile, area, and operational sources. Mobile sources including vehicle trips to and from the project site will result primarily in emissions of CO2 with minor emissions of CH4 and N2O. The most significant GHG emission from natural gas usage will be methane. Electricity usage by the warehouse and indirect usage of electricity for water and wastewater conveyance will result primarily in emissions of carbon dioxide. Disposal of solid waste will result in emissions of methane from the decomposition of waste at landfills coupled with CO2 emission from the handling and transport of solid waste. These sources combine to define the long-term greenhouse gas inventory for the build-out of the proposed project. To determine this inventory, CalEEMod was used. The methodology utilized for each emissions source is based on the CAPCOA Quantifying Greenhouse Gas Mitigation Measures handbook.34 A summary of the project’s long-term greenhouse gas emissions inventory is included in Table 16 (Long-Term Greenhouse Gas Emissions). The emissions inventory is presented as metric tons of carbon dioxide equivalent (MTCO2E) meaning that all emissions have been weighted based on their Global Warming Potential (GWP) (a metric ton is equal to 1.102 US short tons). Mobile sources are based on annual vehicle miles traveled (VMT) based on daily trip generation identified in the project traffic study.35
Natural gas usage and electricity usage are based on default demand figures utilized in CalEEMod.
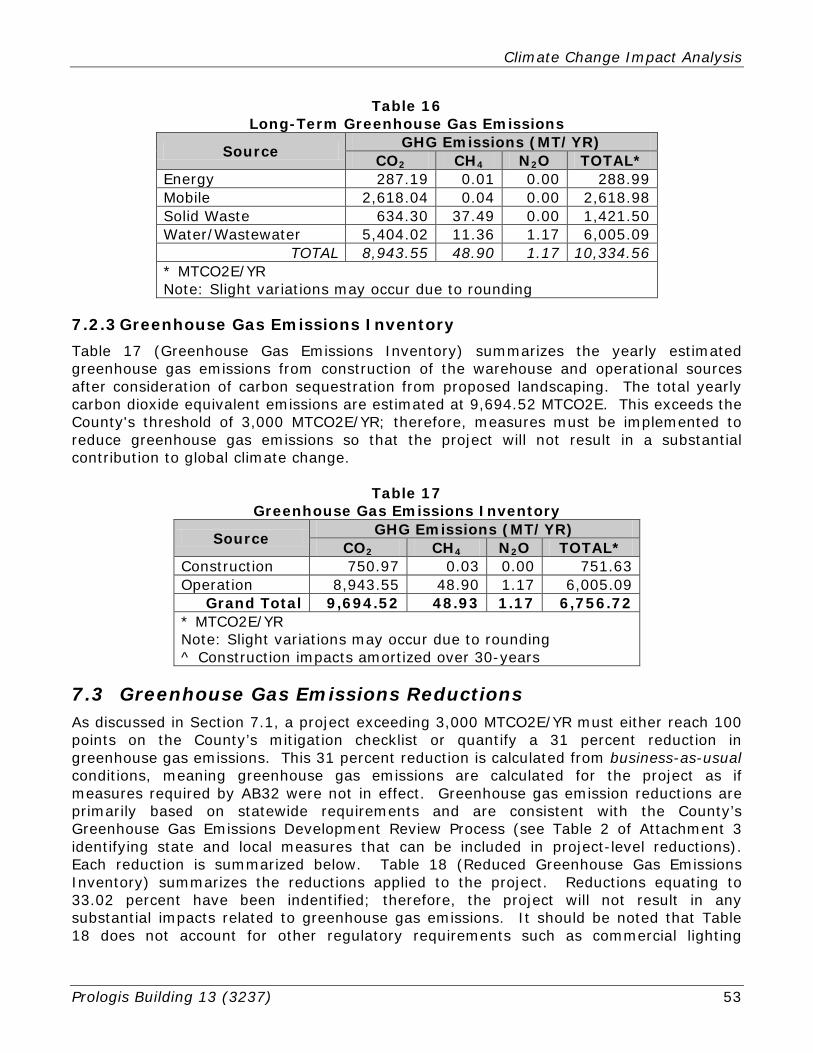
Climate Change Impact Analysis
Prologis Building 13 (3237) 53
Table 16 Long-Term Greenhouse Gas Emissions
Source GHG Emissions (MT/YR) CO2 CH4 N2O TOTAL*
Energy 287.19 0.01 0.00 288.99 Mobile 2,618.04 0.04 0.00 2,618.98 Solid Waste 634.30 37.49 0.00 1,421.50 Water/Wastewater 5,404.02 11.36 1.17 6,005.09
TOTAL 8,943.55 48.90 1.17 10,334.56 * MTCO2E/YR Note: Slight variations may occur due to rounding
7.2.3 Greenhouse Gas Emissions Inventory Table 17 (Greenhouse Gas Emissions Inventory) summarizes the yearly estimated greenhouse gas emissions from construction of the warehouse and operational sources after consideration of carbon sequestration from proposed landscaping. The total yearly carbon dioxide equivalent emissions are estimated at 9,694.52 MTCO2E. This exceeds the County's threshold of 3,000 MTCO2E/YR; therefore, measures must be implemented to reduce greenhouse gas emissions so that the project will not result in a substantial contribution to global climate change.
Table 17 Greenhouse Gas Emissions Inventory
Source GHG Emissions (MT/YR) CO2 CH4 N2O TOTAL*
Construction 750.97 0.03 0.00 751.63 Operation 8,943.55 48.90 1.17 6,005.09
Grand Total 9,694.52 48.93 1.17 6,756.72 * MTCO2E/YR Note: Slight variations may occur due to rounding ^ Construction impacts amortized over 30-years
7.3 Greenhouse Gas Emissions Reductions As discussed in Section 7.1, a project exceeding 3,000 MTCO2E/YR must either reach 100 points on the County’s mitigation checklist or quantify a 31 percent reduction in greenhouse gas emissions. This 31 percent reduction is calculated from business-as-usual conditions, meaning greenhouse gas emissions are calculated for the project as if measures required by AB32 were not in effect. Greenhouse gas emission reductions are primarily based on statewide requirements and are consistent with the County’s Greenhouse Gas Emissions Development Review Process (see Table 2 of Attachment 3 identifying state and local measures that can be included in project-level reductions). Each reduction is summarized below. Table 18 (Reduced Greenhouse Gas Emissions Inventory) summarizes the reductions applied to the project. Reductions equating to 33.02 percent have been indentified; therefore, the project will not result in any substantial impacts related to greenhouse gas emissions. It should be noted that Table 18 does not account for other regulatory requirements such as commercial lighting
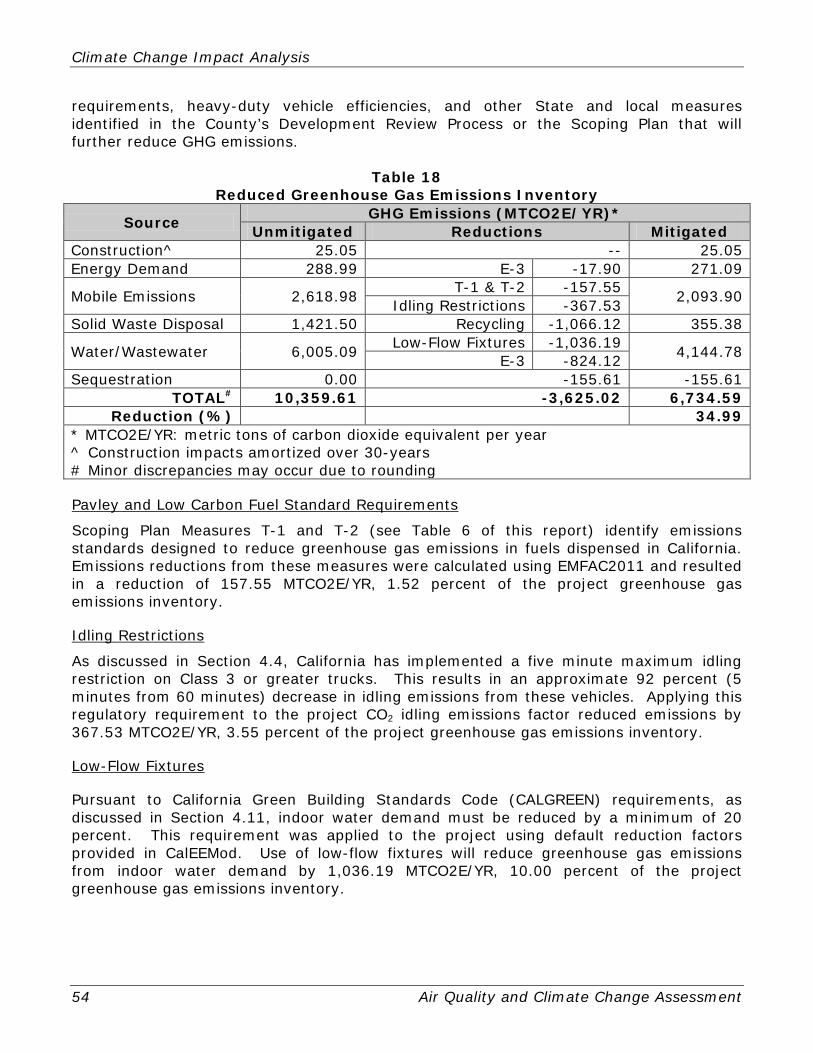
Climate Change Impact Analysis
54 Air Quality and Climate Change Assessment
requirements, heavy-duty vehicle efficiencies, and other State and local measures identified in the County’s Development Review Process or the Scoping Plan that will further reduce GHG emissions.
Table 18 Reduced Greenhouse Gas Emissions Inventory
Source GHG Emissions (MTCO2E/YR)* Unmitigated Reductions Mitigated
Construction^ 25.05 -- 25.05 Energy Demand 288.99 E-3 -17.90 271.09
Mobile Emissions 2,618.98 T-1 & T-2 -157.55 2,093.90 Idling Restrictions -367.53 Solid Waste Disposal 1,421.50 Recycling -1,066.12 355.38
Water/Wastewater 6,005.09 Low-Flow Fixtures -1,036.19 4,144.78 E-3 -824.12 Sequestration 0.00 -155.61 -155.61
TOTAL# 10,359.61 -3,625.02 6,734.59 Reduction (%) 34.99
* MTCO2E/YR: metric tons of carbon dioxide equivalent per year ^ Construction impacts amortized over 30-years # Minor discrepancies may occur due to rounding
Pavley and Low Carbon Fuel Standard Requirements
Scoping Plan Measures T-1 and T-2 (see Table 6 of this report) identify emissions standards designed to reduce greenhouse gas emissions in fuels dispensed in California. Emissions reductions from these measures were calculated using EMFAC2011 and resulted in a reduction of 157.55 MTCO2E/YR, 1.52 percent of the project greenhouse gas emissions inventory.
Idling Restrictions
As discussed in Section 4.4, California has implemented a five minute maximum idling restriction on Class 3 or greater trucks. This results in an approximate 92 percent (5 minutes from 60 minutes) decrease in idling emissions from these vehicles. Applying this regulatory requirement to the project CO2 idling emissions factor reduced emissions by 367.53 MTCO2E/YR, 3.55 percent of the project greenhouse gas emissions inventory.
Low-Flow Fixtures
Pursuant to California Green Building Standards Code (CALGREEN) requirements, as discussed in Section 4.11, indoor water demand must be reduced by a minimum of 20 percent. This requirement was applied to the project using default reduction factors provided in CalEEMod. Use of low-flow fixtures will reduce greenhouse gas emissions from indoor water demand by 1,036.19 MTCO2E/YR, 10.00 percent of the project greenhouse gas emissions inventory.
Climate Change Impact Analysis
Prologis Building 13 (3237) 55
Renewable Portfolio Standard
Scoping Plan Measure E-3 (see Table 6 of this report) will increase electricity production from eligible renewable power sources to 33 percent by 2020. By 2020, this requirement will reduce emissions from electricity used for water supply and conveyance in California by approximately 15.2 percent of emissions from electricity generation (in-State and imports) and operational electricity requirements by seven percent. This will reduce greenhouse gas emissions from water conveyance by 824.12 MTCO2E/YR and non-renewable electricity demand by 17.9 MTCO2E/YR, 8.13 percent of the project greenhouse gas emissions inventory.
Recycling Program
A 75 percent diversion rate was applied to the project solid waste disposal rate consistent with the County diversion goals as identified as Reduction Measure R2W6 in the Greenhouse Gas Emissions Reduction Plan and Development Review Process manual. This will reduce greenhouse gas emissions from solid waste disposal by 1,066.12 MTCO2E/YR, 10.29 of the project greenhouse gas emissions inventory.
Carbon Sequestration
Carbon sequestration is the process of storing or removing CO2 from the atmosphere. Forests, vegetation, wetlands, and other ecosystems act as CO2 scrubbers by absorbing CO2 as they grow.36
7.4 Greenhouse Gas Emissions Reduction Planning
CalEEMod calculates sequestration in project landscaping utilizing the methodology in the CAPCOA mitigation handbook. Currently, there are no hardwood trees on the project site with the remainder of the site covered in grasses (ruderal). The project includes planting of 212 new trees including Italian Cypress, Lombardy Poplar, Crape Myrtle, Camphor Tree, California Pepper, Chinese Flame Tree, Afghan Pine, London Plane Tree, California Sycamore, African Sumac, Brisbane Box, and Mexican Fan Palm. A net increase in 212 trees will accumulate approximately 155.61 MTCO2E/YR, 1.5 of the project greenhouse gas emissions inventory.
7.4.1 San Bernardino County Greenhouse Gas Emissions Reduction Plan In December 2011, the County of San Bernardino adopted the "Greenhouse Gas Emissions Reduction Plan". The purpose of the GHG Plan is to reduce the County's internal and external GHG emissions by 15 percent below current (2011) levels by year 2020 in consistency with State climate change goals pursuant to AB32. The specific objectives of the GHG Plan are as follows:
• Reduce emissions from activities over which the County has jurisdictional and operational control consistent with the target reductions of Assembly Bill (AB) 32 Scoping Plan;
• Provide estimated GHG reductions associated with the County’s existing sustainability efforts and integrate the County’s sustainability efforts into the discrete actions of this Plan;
• Provide a list of discrete actions that will reduce GHG emissions; and Approve a GHG Plan that satisfies the requirements of Section 15183.5 of the California
Climate Change Impact Analysis
56 Air Quality and Climate Change Assessment
Environmental Quality Act (CEQA) Guidelines, so that compliance with the GHG Plan can be used in appropriate situations to determine the significance of a project’s effects relating to GHG emissions, thus providing streamlined CEQA analysis of future projects that are consistent with the approved GHG Plan.
The GHG Plan identifies goals and strategies to obtain the 2020 reduction target. Reduction measures are classified into broad classes based on the source of the reduction measure. Class 1 (R1) reduction measures are those adopted at the state or regional level and require no additional action on behalf of the County other than required implementation. Class 2 (R2) reflect quantified measures that have or will be implemented by the County as a result of the GHG Plan. Class 3 (R3) measures are qualified measures that have or will be implemented by the County as a result of the GHG Plan. Section 5.6 of the GHG Plan identifies the procedures for reviewing development projects for consistency with the GHG Plan. The GHG Plan has been designed in accordance with Section 15183.5 of the State CEQA Guidelines which provides for streamline review of climate change issues related to development projects when found consistent with an applicable greenhouse gas emissions reduction plan. The GHG Plan includes a two-tiered development review procedure to determine if a project could result in a significant impact related greenhouse gas emissions or otherwise comply with the Plan pursuant to Section 15183.5 of the state CEQA Guidelines. The initial screening procedure is to determine if a project will emit 3,000 metric tons of carbon dioxide equivalent (MTCO2E) per year or more. Projects that do not exceed this threshold require no further climate change analysis. Projects exceeding this threshold must meet a minimum 31 percent emissions reduction in order to garner a less than significant determination. This can be met by either (1) achieving 100 points from a menu of mitigation options provided in the GHG Plan or (2) quantifying proposed reduction measures. Projects failing to meet the 31 percent reduction threshold would have a potentially significant impact related to climate change and greenhouse gas emissions. As analyzed and discussed in Section 7.2, the project will exceed the 3,000 MTC2OE/YR screening threshold identified in the GHG Plan but a 31 percent reduction in business-as-usual GHG emissions has been demonstrated; therefore, the project is consistent with the GHG Plan pursuant to Section 15183.5 of the State CEQA Guidelines.
7.4.2 Green County San Bernardino In August 2007, the San Bernardino County Board of Supervisors launched four environmental initiatives known as Green County San Bernardino.37
These initiatives included:
1. Adoption of a County policy that would require that new county buildings and major renovations of existing county facilities comply with U.S. Green Building Council Leadership in Energy and Environmental Design (LEED) Silver standards. LEED promotes a whole-building approach to sustainability by recognizing performance in five key areas of human and environmental health – sustainable site development,
Climate Change Impact Analysis
Prologis Building 13 (3237) 57
water savings, energy efficiency, materials selection, and indoor environmental quality.
2. Establishment of the San Bernardino County Green Builder Program (SBCGB) as a voluntary green building incentive program for residential construction. Under the SBCGB program, builders who agree to satisfy the requirements of the California Green Builder program would receive priority processing for plan review from the County Land Use Services Department, including guaranteed timelines and priority field inspection service. The California Green Builder program has set goals for significant improvements in energy efficiency, indoor air quality and comfort, onsite waste recycling, and water and wood conservation.
3. Waiver of County building permit fees for the installation of solar energy systems, wind-generated electrical systems, tankless water heaters, and highly energy-efficient heating, ventilation and air-conditioning systems for existing buildings. The waiver of fees would promote energy conservation, facilitate a reduction in greenhouse gas emission, and reduce the public’s reliance on commercial energy sources.
4. Establishment of a County website, www.greencountysb.com, to serve as a resource for the public to obtain information on creating and maintaining environmentally friendly buildings, landscapes, and lifestyles. Through this website, the public would have access to the various “green” programs such as the Green Builder Program, the Municipal LEED program, and the New Commercial Construction and Renovation LEED Program. The website would also contain information pertaining to energy efficient building permits, useful “green” tips, and information on affordable ways to protect the environment.
These initiatives are critically tied with the County’s current efforts to reduce greenhouse gas emissions through a GHG reduction plan and General Plan amendment. The County’s Green County website provides information related to transportation, construction, recycling, and landscaping for the community to learn how to reduce individual and development-related carbon footprints. The proposed warehouse will not result in substantial emissions of greenhouse gases and will not conflict with the Green County initiatives.
Climate Change Impact Analysis
58 Air Quality and Climate Change Assessment
This Page Intentionally Left Blank
Prologis Building 13 (3237) 59
8 Mitigation Measures
8.1 Required Mitigation The following mitigation measures are required to ensure that project-related emissions do not exceed established thresholds.
AQ1 Coating Restrictions. Prior to issuance of building permits, the project proponent
shall submit, to the satisfaction of County Planning, a Coating Restriction Plan (CRP), consistent with South Coast Air Quality Management District (SCAQMD) guidelines and a letter agreeing to include in any construction contracts and/or subcontracts a requirement that the contractors adhere to the requirements of the CRP. The CRP measures shall be implemented to the satisfaction of County Building and Safety. These shall include the following:
• The volatile organic compounds (VOC) of proposed architectural coatings
shall not exceed 25 g/l for interior applications. • The volatile organic compounds (VOC) of proposed architectural coatings
shall not exceed 25 g/l for exterior applications.
This measure shall conform to the performance standard that emissions of volatile organic compounds from application of interior or exterior coatings shall not exceed the daily emissions thresholds established by the South Coast Air Quality Management District. The CRP shall specify use of High-Volume, Low Pressure (HVLP) spray guns for application of coatings.
GHG1 CALGREEN Requirements. Prior to issuance of building permits, the County Building and Safety Division shall verify that construction drawings reflect all applicable CALGREEN requirements of the California Building Code in the design of each proposed building, including use of low-flow fixtures.
GHG2 Idling Restrictions. Tenants of the proposed project shall comply with State
idling requirements.
8.2 Regulatory Requirements and Standards The following lists existing regulatory requirements and standards that are required to be implemented as part of the project. While the following measures are not considered mitigation pursuant to the CEQA, the Lead Agency may choose to include the following as conditions of approval to ensure that they are appropriately implemented. S1 Dust Control Plan. The developer shall submit to the satisfaction of County
Planning a Dust Control Plan (DCP) consistent with SCAQMD guidelines and a letter agreeing to include in any construction contracts and/or subcontracts a requirement that the contractors adhere to the requirements of the approved DCP. The DCP shall include activities to reduce on-site and off-site fugitive dust production, including:
Mitigation Measures
60 Air Quality and Climate Change Assessment
• Exposed soil shall be kept moist through a minimum of twice daily watering to reduce fugitive dust, throughout grading and construction activities. During high wind conditions (i.e., wind speeds exceeding 25 mph), areas with disturbed soil will be watered hourly and activities on unpaved surfaces shall be terminated until wind speeds no longer exceed 25 mph. Use reclaimed water if available.
• Vehicle tires will be washed before leaving the project site to enter a paved road.
• Paved site access driveways and adjacent streets will be washed and swept by street sweepers daily, if there are visible signs of any dirt track-out.
• All trucks hauling soil or other loose materials off-site shall be covered. • On-site hauling shall either be covered or maintain at least 2 feet of
“freeboard”. • Storage piles that are to be left in place for more than 3 working days shall
either be: 1) re-vegetated, or 2) covered with plastic or 3) sprayed with a non-toxic soil binder until placed in use.
Prologis Building 13 (3237) 61
9 References 1 Western Regional Climate Center. Period of Record Monthly Climate Summary: Redlands, California (047306). http://www.wrcc.dri.edu/cgi-bin/cliMAIN.pl?ca7306 [August 7, 2012] 2 United States Geological Survey. Redlands Quadrangle 7.5 Minute Series. 1988 3 South Coast Air Quality Management District. Wind Rose Plot rdld. January 2009 4 South Coast Air Quality Management District. CEQA Air Quality Handbook. 1993 5 United States Environmental Protection Agency. Particulate Matter. http://www.epa.gov/air/particlepollution/index.html [September 20, 2010] 6 South Coast Air Quality Management District. Air Quality. 2008 7 South Coast Air Quality Management District. Air Quality. 2009 8 South Coast Air Quality Management District. Air Quality. 2010 9 United States Environmental Protection Agency. EnviroMapper for Envirofacts. [April 10, 2013] 10 Kunzman Associates. Redlands Distribution Center Building 13 Traffic Impact Analysis. February 5, 2013 11 United States Environmental Protection Agency. Greenhouse Gas Emissions. www.epa.gov/climatechange/emissions/index.html [September 28, 2010] 12 Intergovernmental Panel on Climate Change. Changes in Atmospheric Constituents and in Radiative Forcing (Working Group I). Forth Assessment Report. 2007 13 California Natural Resources Agency. 2009 California Climate Adaptation Strategy. 14 United States Environmental Protection Agency. Clean Air Act. www.epa.gov/air/caa/ [July 31, 2012] 15 California Air Resources Board. Statewide Truck and Bus Regulations. www.arb.ca.gov/regact/2008/truckbus08/truckbus08.htm [July 31, 2012] 16 California Air Resources Board. Facts About Truck and Bus Regulation Compliance Requirements Summary. January 2011 17 South Coast Air Quality Management District. Air Quality Management Plan. June 2007 18 California Climate Action Team. Biennial Report. April 2010 19 Southern California Association of Governments. Senate Bill 3.75 Fact Sheet. www.scag.ca.gov/sb375/factsheets.htm [July 31, 2012] 20 California Air Resources Board. Climate Change Scoping Plan. December 2008 21 California Air Resources Board. AB 32 Climate Change, Scoping Plan Progress Report. September 2010 22 California Air Resources Board. Cap-and-Trade. http://www.arb.ca.gov/cc/capandtrade/capandtrade.htm [July 31, 2012] 23 California Building Standards Commission. California Code of Regulations Title 24. California Green Building Standards Code. 2010
References
62 Air Quality and Climate Change Assessment
24 San Bernardino County. Greenhouse Gas Emissions Reduction Plan. September 2011 25 South Coast Air Quality Management District. CEQA Air Quality Handbook. 1993 26 Kunzman Associates. Redlands Distribution Center Building 13 Traffic Impact Analysis. February 5, 2013 27 South Coast Air Quality Management District. California Emissions Estimator Model User’s Guide. February 2011 28 California Air Resources Board. Facts about California’s Accomplishments in Reducing Diesel Particulate Matter Emissions. http://www.arb.ca.gov/diesel/factsheets/dieselpmfs.pdf [February 28, 2011] 29 South Coast Air Quality Management District. Health Risk Assessment Guidance for Analyzing Cancer Risks from Mobile Source Diesel Idling Emissions for CEQA Air Quality Analysis. August 2003 30 California Department of Transportation. Transportation Project-Level Carbon Monoxide Protocol. 1997 31 South Coast Air Quality Management District. Initial Study (IS) and Draft Mitigated Negative Declaration (Draft MND) for the Proposed Project No. P200500723 The Alabama Business Center – Industrial Warehouse Facility. September 2006 32 Sacramento Metropolitan Air Quality Management District. CEQA Guide. May 2011 33 San Bernardino County. Greenhouse Gas Emissions Reduction Plan. September 2011 34 California Air Pollution Control Officers Association. Quantifying Greenhouse Gas Emissions. August 2010 35 Kunzman Associates. Redlands Distribution Center Building 13 Traffic Impact Analysis. February 5, 2013 36 California Energy Commission. Public Interest Energy Research Program. Research Development and Demonstration Plan. Attachment IV. April 2003 37 San Bernardino County. News from the County of San Bernardino. Biane Unveils “Green County San Bernardino” Programs. August 2007

Appendix A Air Quality Modeling Assumptions

This Page Intentionally Left Blank

Attach CD-ROM with Assumptions


Appendix B CalEEMod Output

This Page Intentionally Left Blank
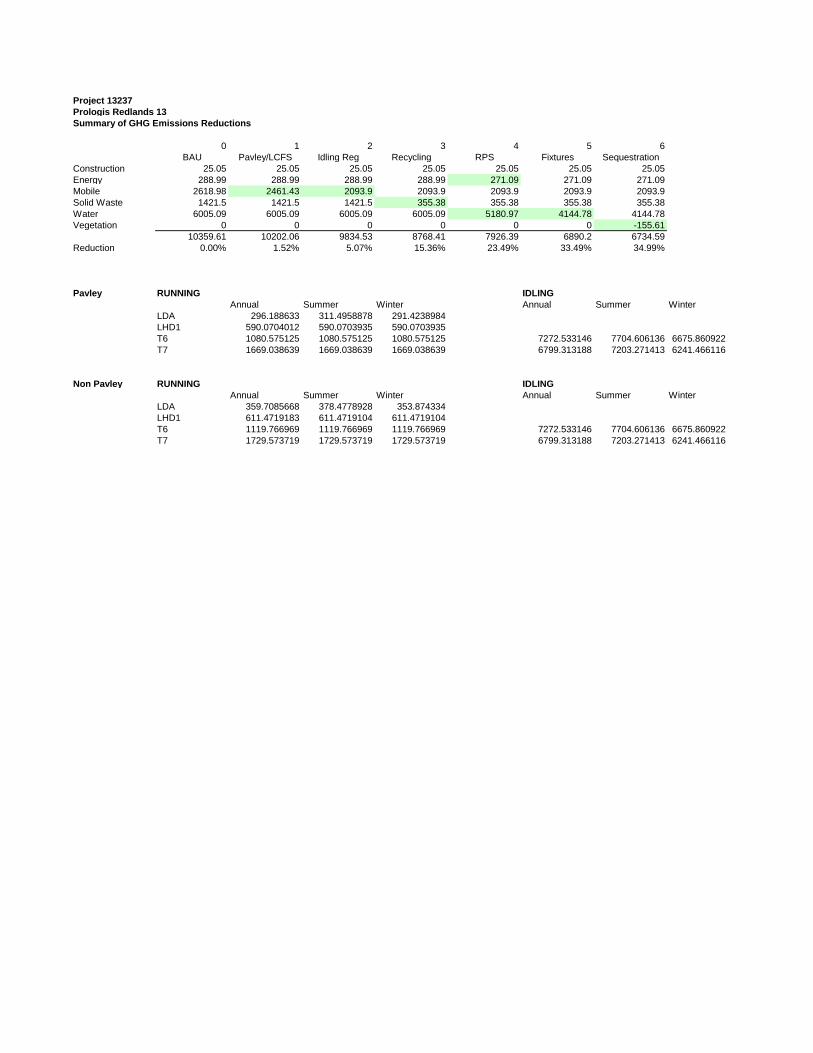
Project 13237Prologis Redlands 13Summary of GHG Emissions Reductions
0 1 2 3 4 5 6BAU Pavley/LCFS Idling Reg Recycling RPS Fixtures Sequestration
Construction 25.05 25.05 25.05 25.05 25.05 25.05 25.05Energy 288.99 288.99 288.99 288.99 271.09 271.09 271.09Mobile 2618.98 2461.43 2093.9 2093.9 2093.9 2093.9 2093.9Solid Waste 1421.5 1421.5 1421.5 355.38 355.38 355.38 355.38Water 6005.09 6005.09 6005.09 6005.09 5180.97 4144.78 4144.78Vegetation 0 0 0 0 0 0 -155.61
10359.61 10202.06 9834.53 8768.41 7926.39 6890.2 6734.59Reduction 0.00% 1.52% 5.07% 15.36% 23.49% 33.49% 34.99%
Pavley RUNNING IDLINGAnnual Summer Winter Annual Summer Winter
LDA 296.188633 311.4958878 291.4238984LHD1 590.0704012 590.0703935 590.0703935T6 1080.575125 1080.575125 1080.575125 7272.533146 7704.606136 6675.860922T7 1669.038639 1669.038639 1669.038639 6799.313188 7203.271413 6241.466116
Non Pavley RUNNING IDLINGAnnual Summer Winter Annual Summer Winter
LDA 359.7085668 378.4778928 353.874334LHD1 611.4719183 611.4719104 611.4719104T6 1119.766969 1119.766969 1119.766969 7272.533146 7704.606136 6675.860922T7 1729.573719 1729.573719 1729.573719 6799.313188 7203.271413 6241.466116

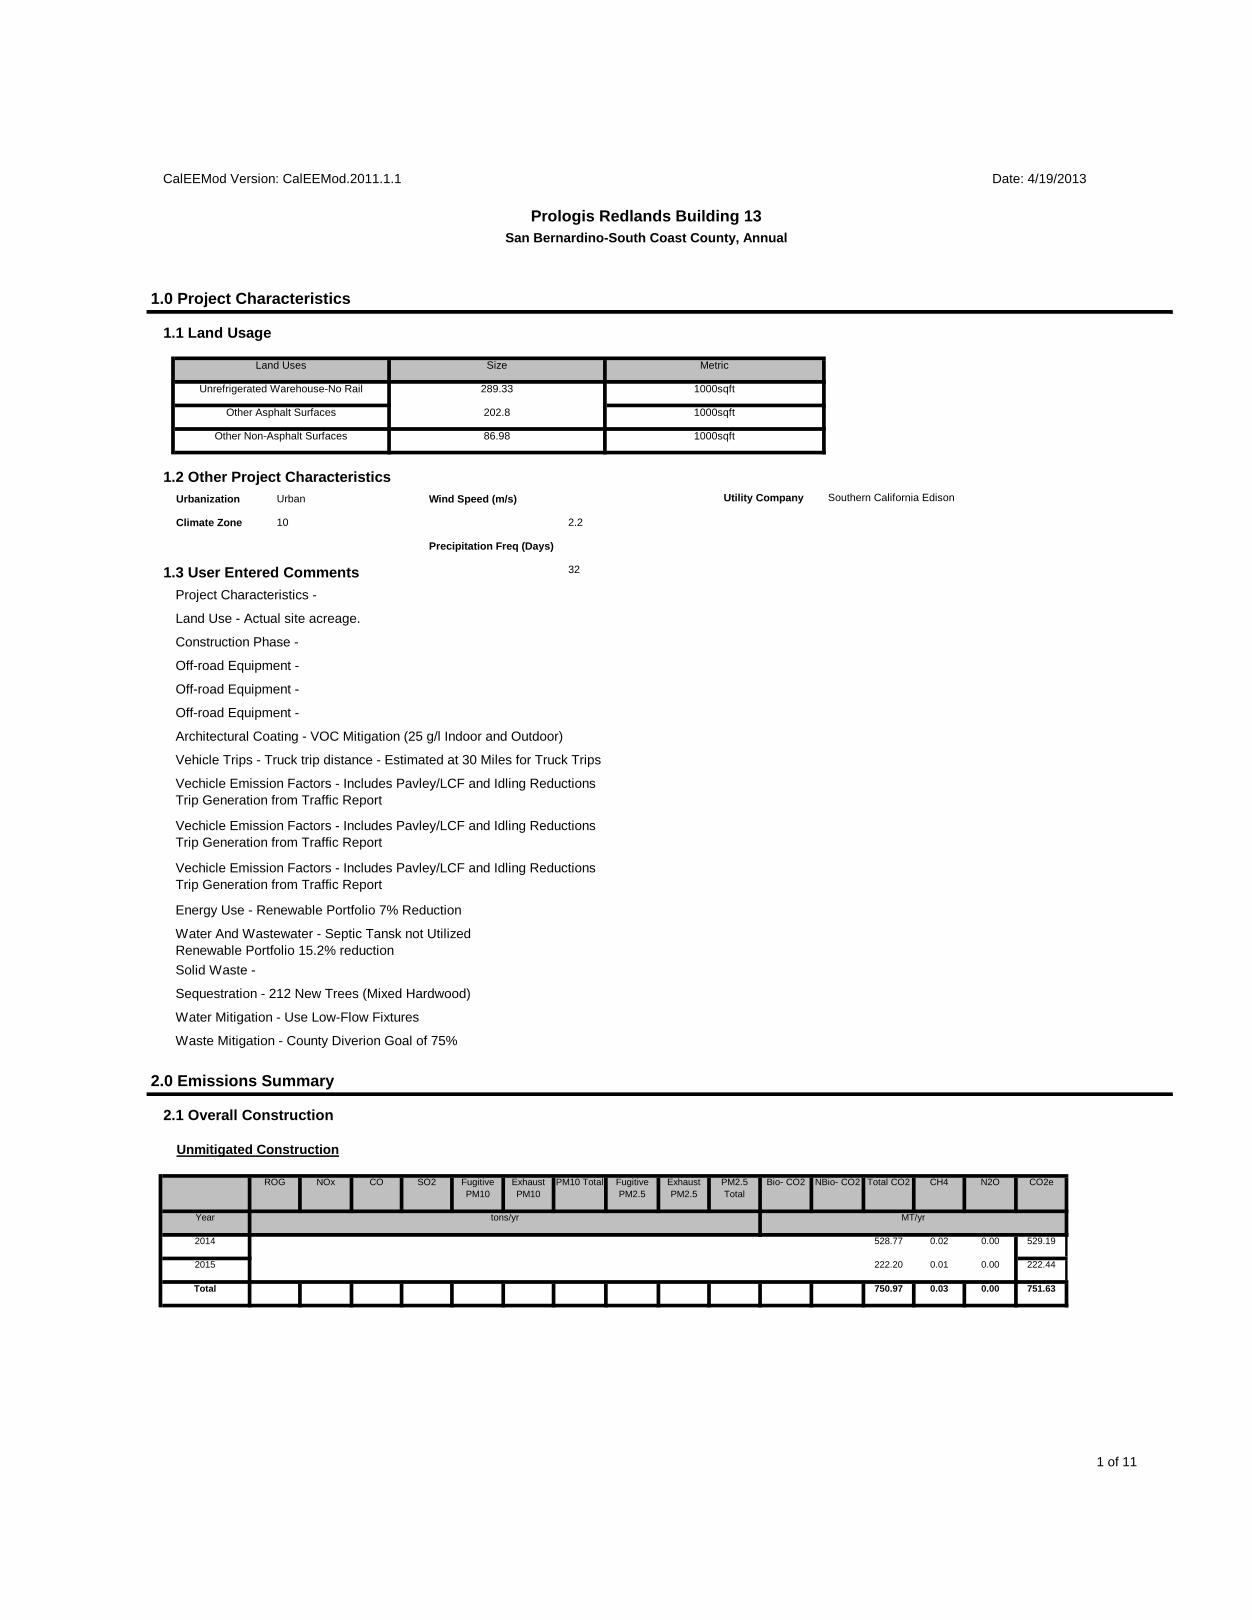
1 of 11
750.97 0.03 0.00 751.63Total
222.20 0.01 0.00 222.44
528.77 0.02 0.00 529.19
2015
2014
CH4 N2O CO2e
Year tons/yr MT/yr
PM10 Total Fugitive PM2.5
Exhaust PM2.5
Bio- CO2 NBio- CO2
2.1 Overall Construction
Unmitigated Construction
ROG NOx CO Total CO2SO2 Fugitive PM10
Exhaust PM10
Water And Wastewater - Septic Tansk not UtilizedRenewable Portfolio 15.2% reductionSolid Waste -
Sequestration - 212 New Trees (Mixed Hardwood)
Water Mitigation - Use Low-Flow Fixtures
Waste Mitigation - County Diverion Goal of 75%
2.0 Emissions Summary
PM2.5 Total
Architectural Coating - VOC Mitigation (25 g/l Indoor and Outdoor)
Vehicle Trips - Truck trip distance - Estimated at 30 Miles for Truck Trips
Vechicle Emission Factors - Includes Pavley/LCF and Idling ReductionsTrip Generation from Traffic Report
Vechicle Emission Factors - Includes Pavley/LCF and Idling ReductionsTrip Generation from Traffic Report
Vechicle Emission Factors - Includes Pavley/LCF and Idling ReductionsTrip Generation from Traffic Report
Energy Use - Renewable Portfolio 7% Reduction
Project Characteristics -
Land Use - Actual site acreage.
Construction Phase -
Off-road Equipment -
Off-road Equipment -
Off-road Equipment -
Climate Zone 10 2.2
Precipitation Freq (Days)
1.3 User Entered Comments 32
1.2 Other Project CharacteristicsUtility Company Southern California EdisonUrbanization Urban Wind Speed (m/s)
Other Asphalt Surfaces 202.8 1000sqft
Other Non-Asphalt Surfaces 86.98 1000sqft
1.1 Land Usage
Land Uses Size Metric
Unrefrigerated Warehouse-No Rail 289.33 1000sqft
CalEEMod Version: CalEEMod.2011.1.1 Date: 4/19/2013
Prologis Redlands Building 13San Bernardino-South Coast County, Annual
1.0 Project Characteristics
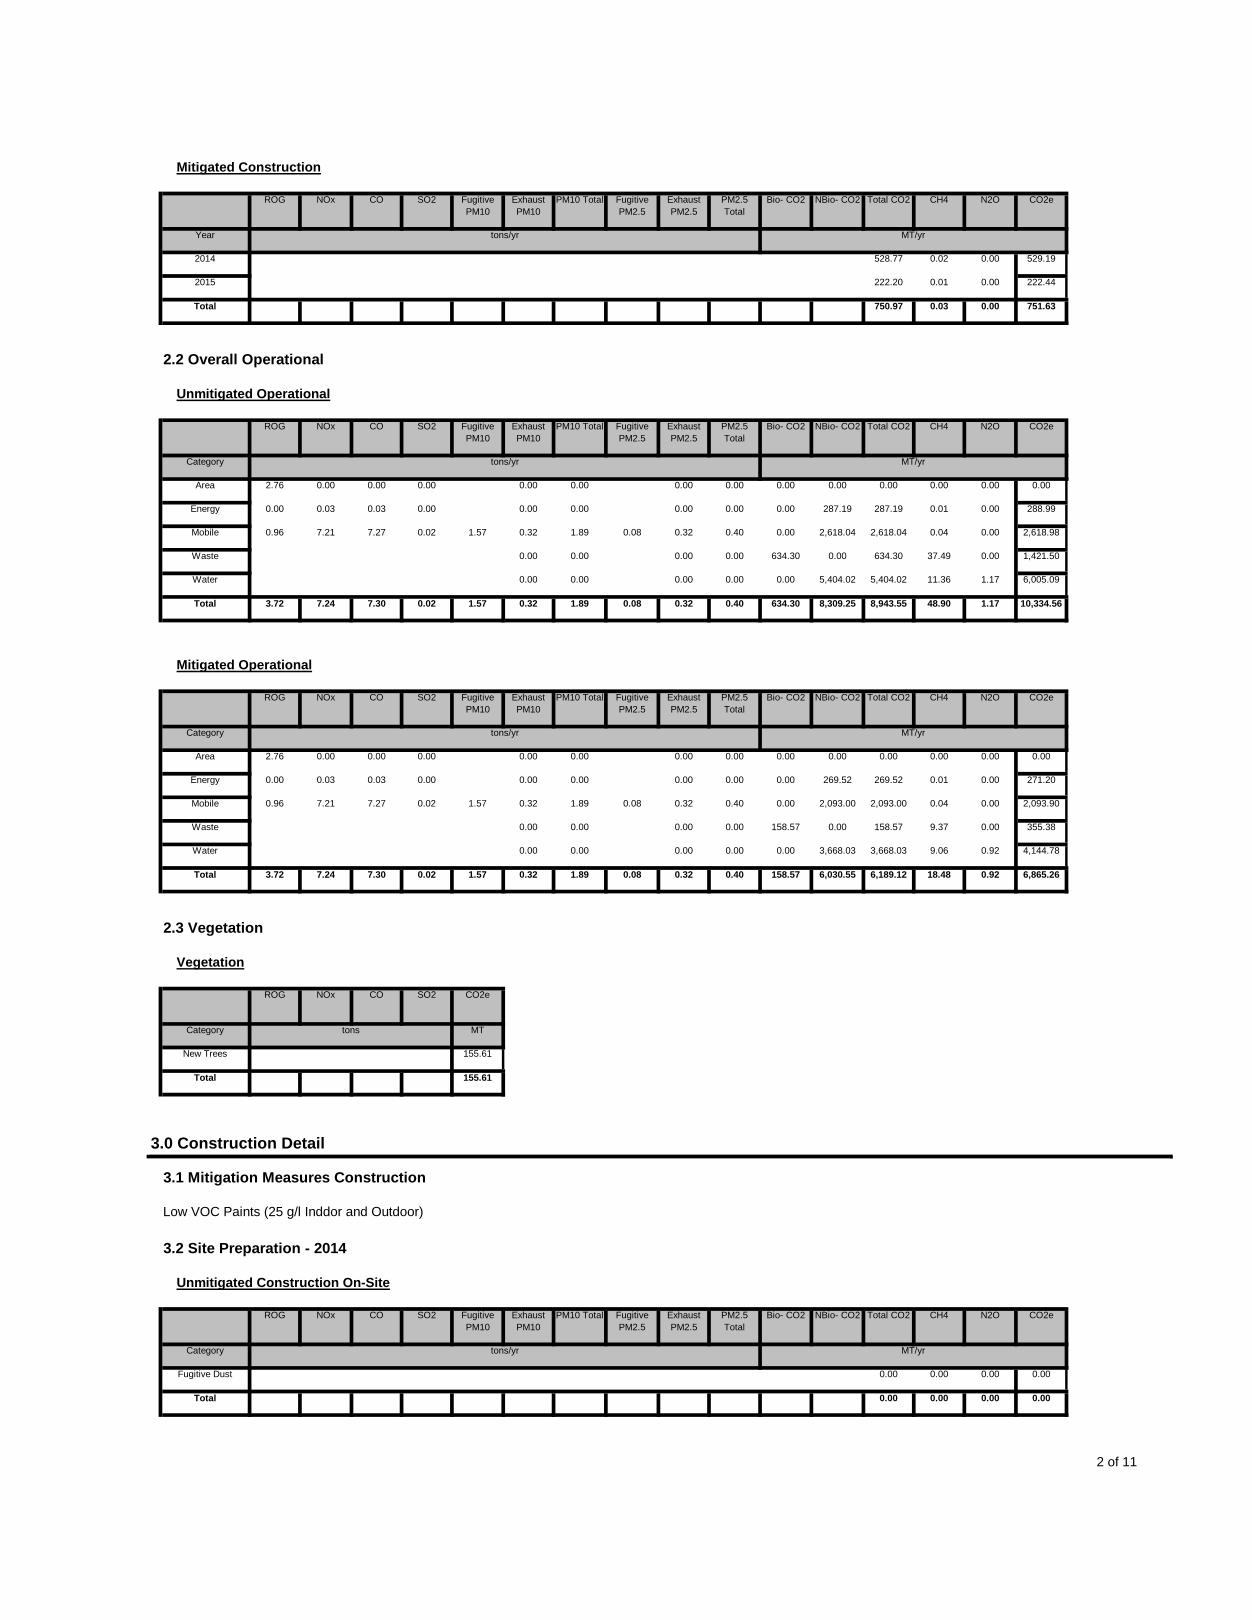
2 of 11
0.00 0.00 0.00 0.00
0.00 0.00 0.00 0.00
Total
Fugitive Dust
NBio- CO2 Total CO2 CH4 N2O CO2e
Category tons/yr MT/yr
Exhaust PM10
PM10 Total Fugitive PM2.5
Exhaust PM2.5
PM2.5 Total
Bio- CO2ROG NOx CO SO2 Fugitive PM10
3.0 Construction Detail
3.1 Mitigation Measures Construction
Low VOC Paints (25 g/l Inddor and Outdoor)
3.2 Site Preparation - 2014
Unmitigated Construction On-Site
Total 155.61
Category tons MT
New Trees 155.61
2.3 Vegetation
Vegetation
ROG NOx CO SO2 CO2e
158.57 6,030.55 6,189.12 18.48 0.92 6,865.261.57 0.32 1.89 0.08 0.32 0.40
3,668.03 3,668.03 9.06 0.92 4,144.78
Total 3.72 7.24 7.30 0.02
0.00 0.00 0.00 0.00 0.00Water
158.57 0.00 158.57 9.37 0.00 355.380.00 0.00 0.00 0.00
2,093.00 2,093.00 0.04 0.00 2,093.90
Waste
0.32 1.89 0.08 0.32 0.40 0.00Mobile 0.96 7.21 7.27 0.02 1.57
0.00 269.52 269.52 0.01 0.00 271.200.00 0.00 0.00 0.00
0.00 0.00 0.00 0.00 0.00
Energy 0.00 0.03 0.03 0.00
0.00 0.00 0.00 0.00 0.00Area 2.76 0.00 0.00 0.00
CH4 N2O CO2e
Category tons/yr MT/yr
Fugitive PM2.5
Exhaust PM2.5
PM2.5 Total
Bio- CO2ROG NOx CO SO2 Fugitive PM10
Exhaust PM10
PM10 Total
634.30 8,309.25 8,943.55 48.90
NBio- CO2 Total CO2
Mitigated Operational
1.17 10,334.561.57 0.32 1.89 0.08 0.32 0.40
5,404.02 5,404.02 11.36 1.17 6,005.09
Total 3.72 7.24 7.30 0.02
0.00 0.00 0.00 0.00 0.00Water
634.30 0.00 634.30 37.49 0.00 1,421.500.00 0.00 0.00 0.00
2,618.04 2,618.04 0.04 0.00 2,618.98
Waste
0.32 1.89 0.08 0.32 0.40 0.00Mobile 0.96 7.21 7.27 0.02 1.57
0.00 287.19 287.19 0.01 0.00 288.990.00 0.00 0.00 0.00
0.00 0.00 0.00 0.00 0.00
Energy 0.00 0.03 0.03 0.00
0.00 0.00 0.00 0.00 0.00Area 2.76 0.00 0.00 0.00
CH4 N2O CO2e
Category tons/yr MT/yr
Fugitive PM2.5
Exhaust PM2.5
PM2.5 Total
Bio- CO2ROG NOx CO SO2 Fugitive PM10
Exhaust PM10
PM10 Total
750.97 0.03
NBio- CO2 Total CO2
2.2 Overall Operational
Unmitigated Operational
0.00 751.63
222.20 0.01 0.00 222.44
Total
2015
528.77 0.02 0.00 529.19
N2O CO2e
Year tons/yr MT/yr
2014
Exhaust PM2.5
PM2.5 Total
Bio- CO2 NBio- CO2 Total CO2 CH4
Mitigated Construction
ROG NOx CO SO2 Fugitive PM10
Exhaust PM10
PM10 Total Fugitive PM2.5
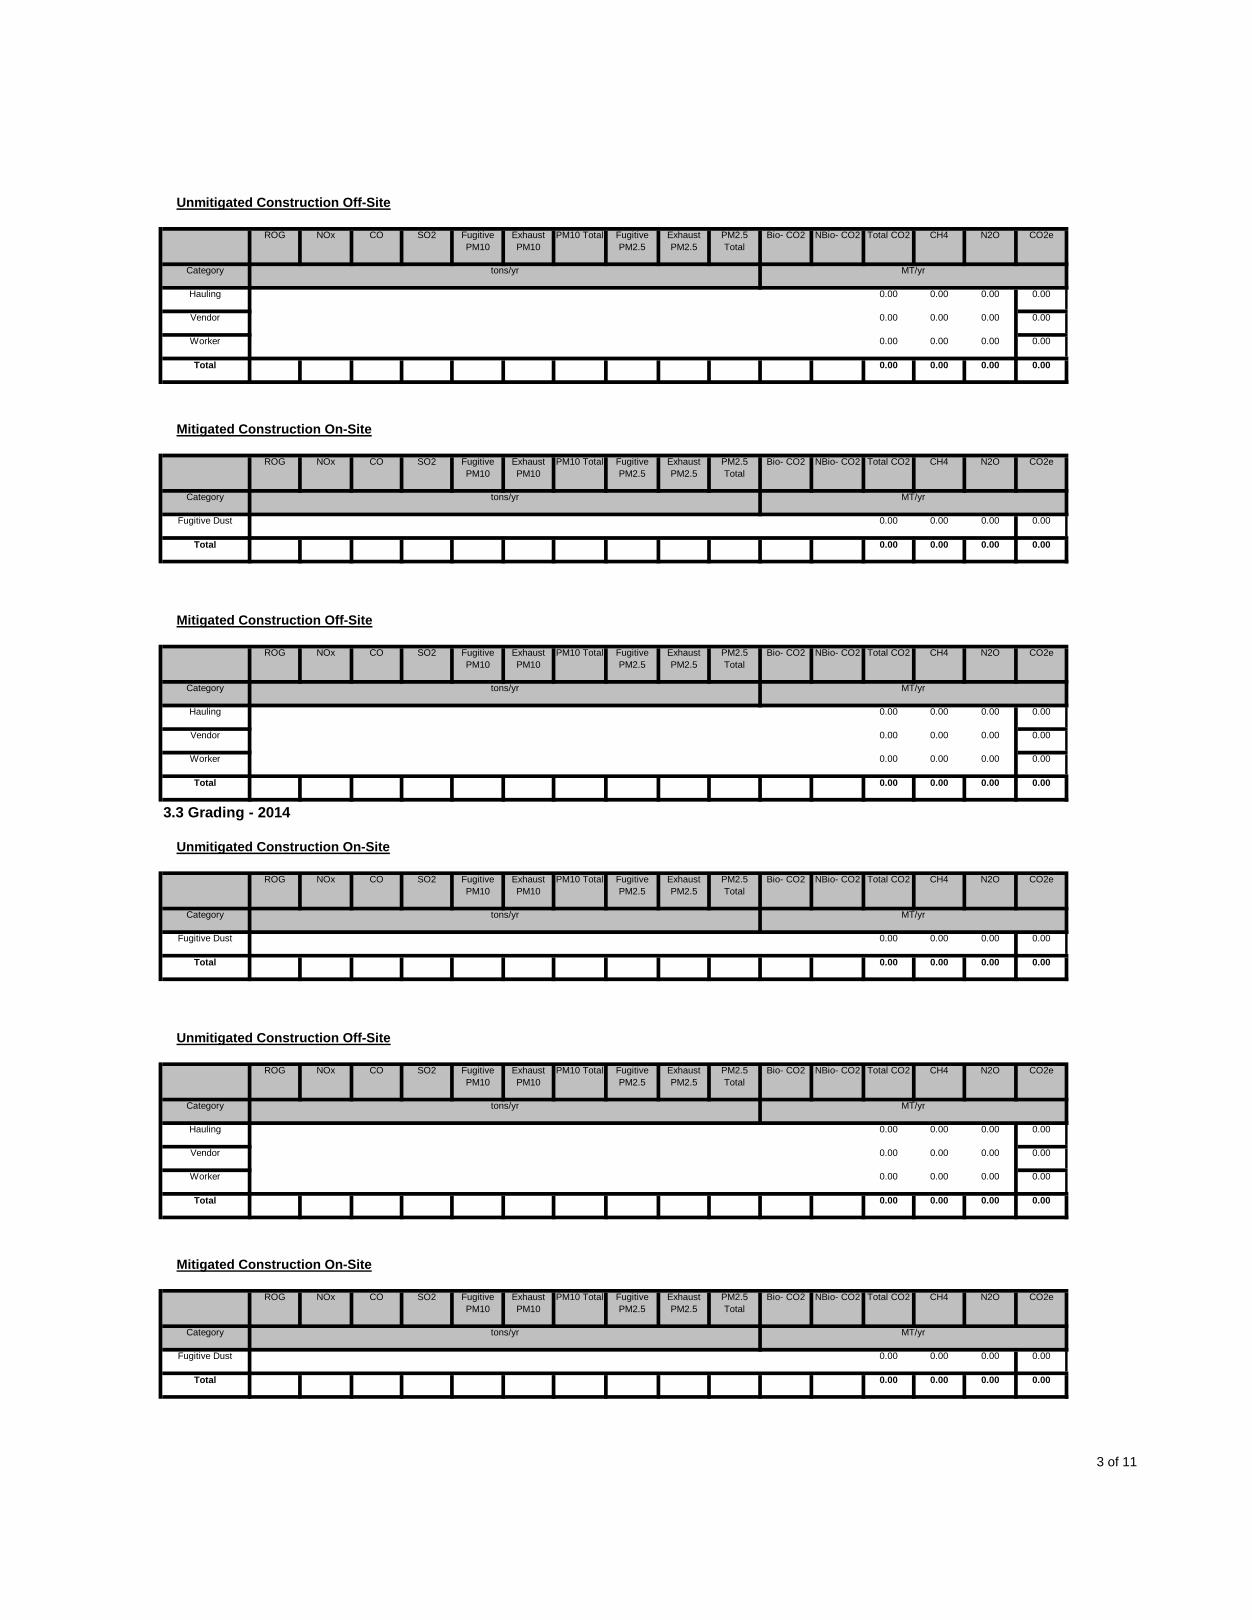
3 of 11
0.00 0.00 0.00 0.00
0.00 0.00 0.00 0.00
Total
Fugitive Dust
CH4 N2O CO2e
Category tons/yr MT/yr
Fugitive PM2.5
Exhaust PM2.5
PM2.5 Total
Bio- CO2ROG NOx CO SO2 Fugitive PM10
Exhaust PM10
PM10 Total
0.00 0.00
NBio- CO2 Total CO2
Mitigated Construction On-Site
0.00 0.00
0.00 0.00 0.00 0.00
Total
Worker
0.00 0.00 0.00 0.00
0.00 0.00 0.00 0.00
Vendor
Hauling
CH4 N2O CO2e
Category tons/yr MT/yr
Fugitive PM2.5
Exhaust PM2.5
PM2.5 Total
Bio- CO2ROG NOx CO SO2 Fugitive PM10
Exhaust PM10
PM10 Total
0.00 0.00
NBio- CO2 Total CO2
Unmitigated Construction Off-Site
0.00 0.00
0.00 0.00 0.00 0.00
Total
Fugitive Dust
CH4 N2O CO2e
Category tons/yr MT/yr
Fugitive PM2.5
Exhaust PM2.5
PM2.5 Total
Bio- CO2ROG NOx CO SO2 Fugitive PM10
Exhaust PM10
PM10 Total
0.00 0.00
NBio- CO2 Total CO2
3.3 Grading - 2014
Unmitigated Construction On-Site
0.00 0.00
0.00 0.00 0.00 0.00
Total
Worker
0.00 0.00 0.00 0.00
0.00 0.00 0.00 0.00
Vendor
Hauling
CH4 N2O CO2e
Category tons/yr MT/yr
Fugitive PM2.5
Exhaust PM2.5
PM2.5 Total
Bio- CO2ROG NOx CO SO2 Fugitive PM10
Exhaust PM10
PM10 Total
0.00 0.00
NBio- CO2 Total CO2
Mitigated Construction Off-Site
0.00 0.00
0.00 0.00 0.00 0.00
Total
Fugitive Dust
CH4 N2O CO2e
Category tons/yr MT/yr
Fugitive PM2.5
Exhaust PM2.5
PM2.5 Total
Bio- CO2ROG NOx CO SO2 Fugitive PM10
Exhaust PM10
PM10 Total
0.00 0.00
NBio- CO2 Total CO2
Mitigated Construction On-Site
0.00 0.00
0.00 0.00 0.00 0.00
Total
Worker
0.00 0.00 0.00 0.00
0.00 0.00 0.00 0.00
Vendor
Hauling
CH4 N2O CO2e
Category tons/yr MT/yr
Fugitive PM2.5
Exhaust PM2.5
PM2.5 Total
Bio- CO2ROG NOx CO SO2 Fugitive PM10
Exhaust PM10
PM10 Total NBio- CO2 Total CO2
Unmitigated Construction Off-Site
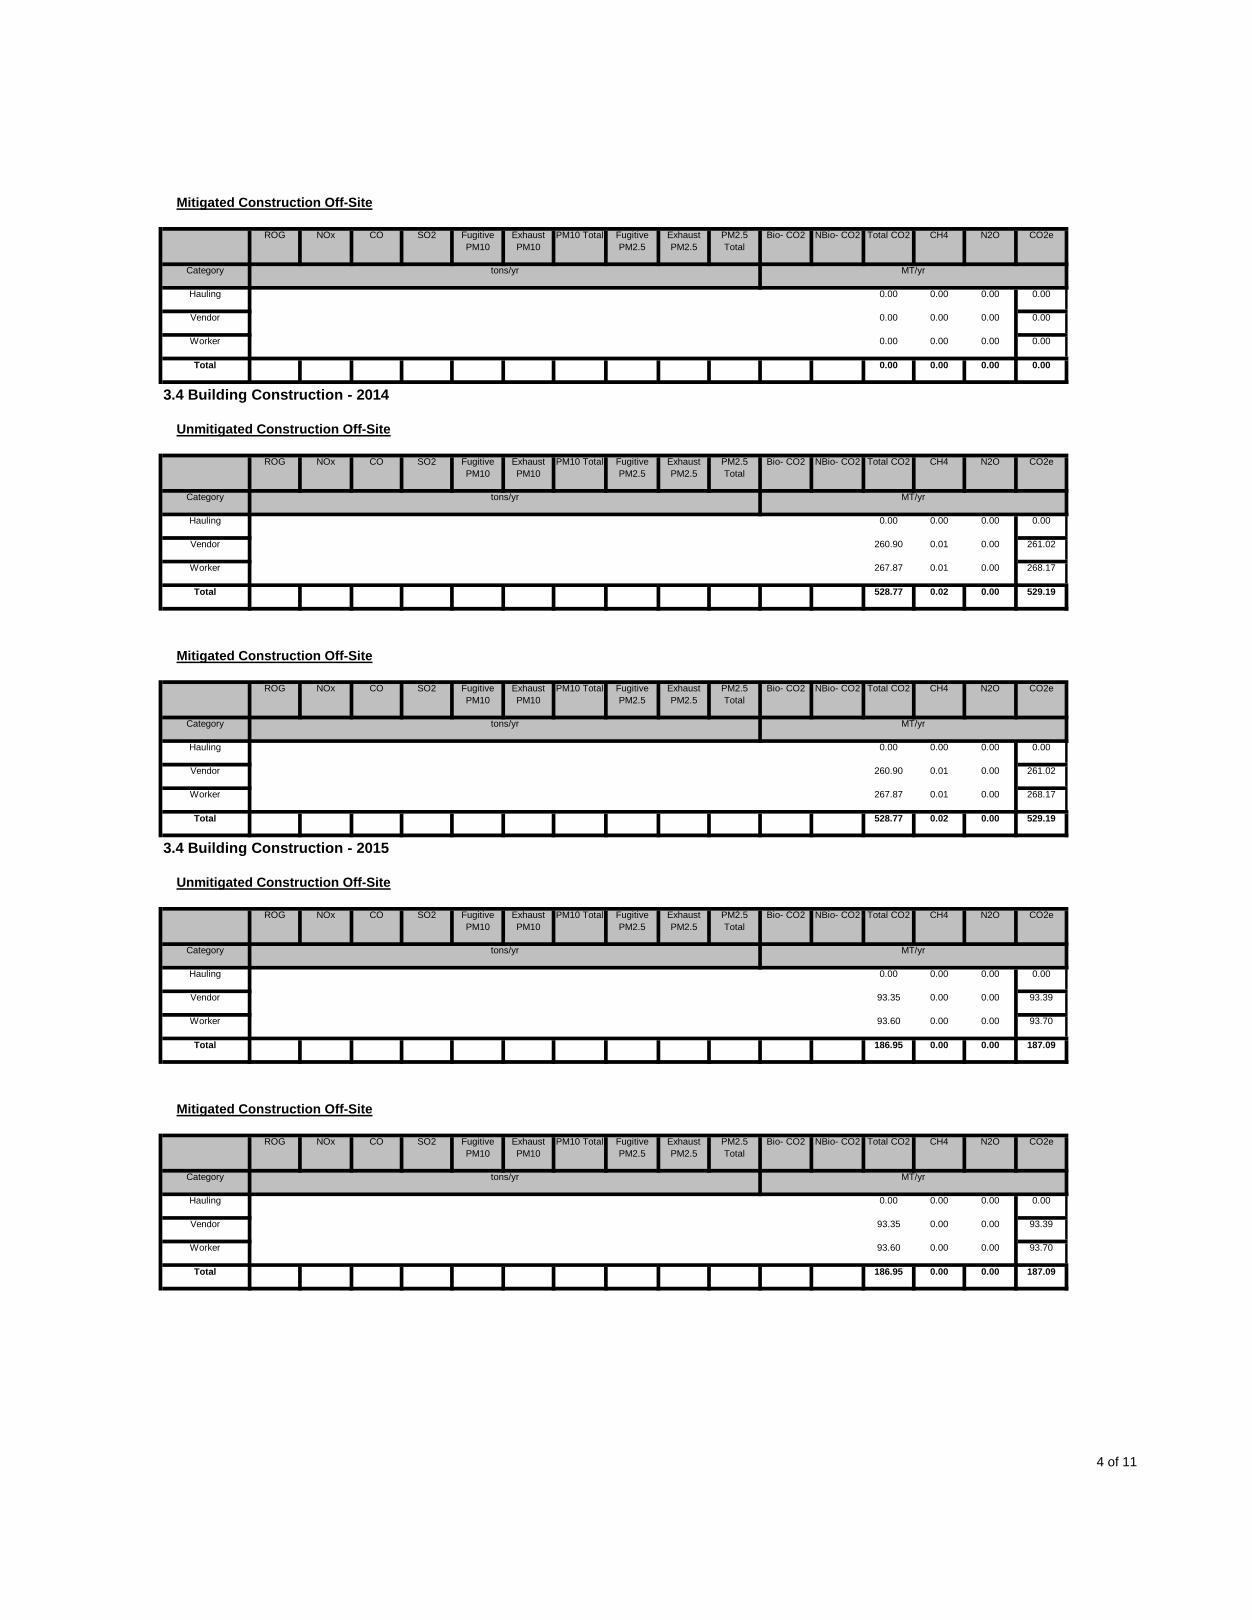
4 of 11
186.95 0.00 0.00 187.09
93.60 0.00 0.00 93.70
Total
Worker
93.35 0.00 0.00 93.39
0.00 0.00 0.00 0.00
Vendor
Hauling
CH4 N2O CO2e
Category tons/yr MT/yr
Fugitive PM2.5
Exhaust PM2.5
PM2.5 Total
Bio- CO2ROG NOx CO SO2 Fugitive PM10
Exhaust PM10
PM10 Total
186.95 0.00
NBio- CO2 Total CO2
Mitigated Construction Off-Site
0.00 187.09
93.60 0.00 0.00 93.70
Total
Worker
93.35 0.00 0.00 93.39
0.00 0.00 0.00 0.00
Vendor
Hauling
CH4 N2O CO2e
Category tons/yr MT/yr
Fugitive PM2.5
Exhaust PM2.5
PM2.5 Total
Bio- CO2ROG NOx CO SO2 Fugitive PM10
Exhaust PM10
PM10 Total
528.77 0.02
NBio- CO2 Total CO2
3.4 Building Construction - 2015
Unmitigated Construction Off-Site
0.00 529.19
267.87 0.01 0.00 268.17
Total
Worker
260.90 0.01 0.00 261.02
0.00 0.00 0.00 0.00
Vendor
Hauling
CH4 N2O CO2e
Category tons/yr MT/yr
Fugitive PM2.5
Exhaust PM2.5
PM2.5 Total
Bio- CO2ROG NOx CO SO2 Fugitive PM10
Exhaust PM10
PM10 Total
528.77 0.02
NBio- CO2 Total CO2
Mitigated Construction Off-Site
0.00 529.19
267.87 0.01 0.00 268.17
Total
Worker
260.90 0.01 0.00 261.02
0.00 0.00 0.00 0.00
Vendor
Hauling
CH4 N2O CO2e
Category tons/yr MT/yr
Fugitive PM2.5
Exhaust PM2.5
PM2.5 Total
Bio- CO2ROG NOx CO SO2 Fugitive PM10
Exhaust PM10
PM10 Total
0.00 0.00
NBio- CO2 Total CO2
3.4 Building Construction - 2014
Unmitigated Construction Off-Site
0.00 0.00
0.00 0.00 0.00 0.00
Total
Worker
0.00 0.00 0.00 0.00
0.00 0.00 0.00 0.00
Vendor
Hauling
CH4 N2O CO2e
Category tons/yr MT/yr
Fugitive PM2.5
Exhaust PM2.5
PM2.5 Total
Bio- CO2ROG NOx CO SO2 Fugitive PM10
Exhaust PM10
PM10 Total NBio- CO2 Total CO2
Mitigated Construction Off-Site
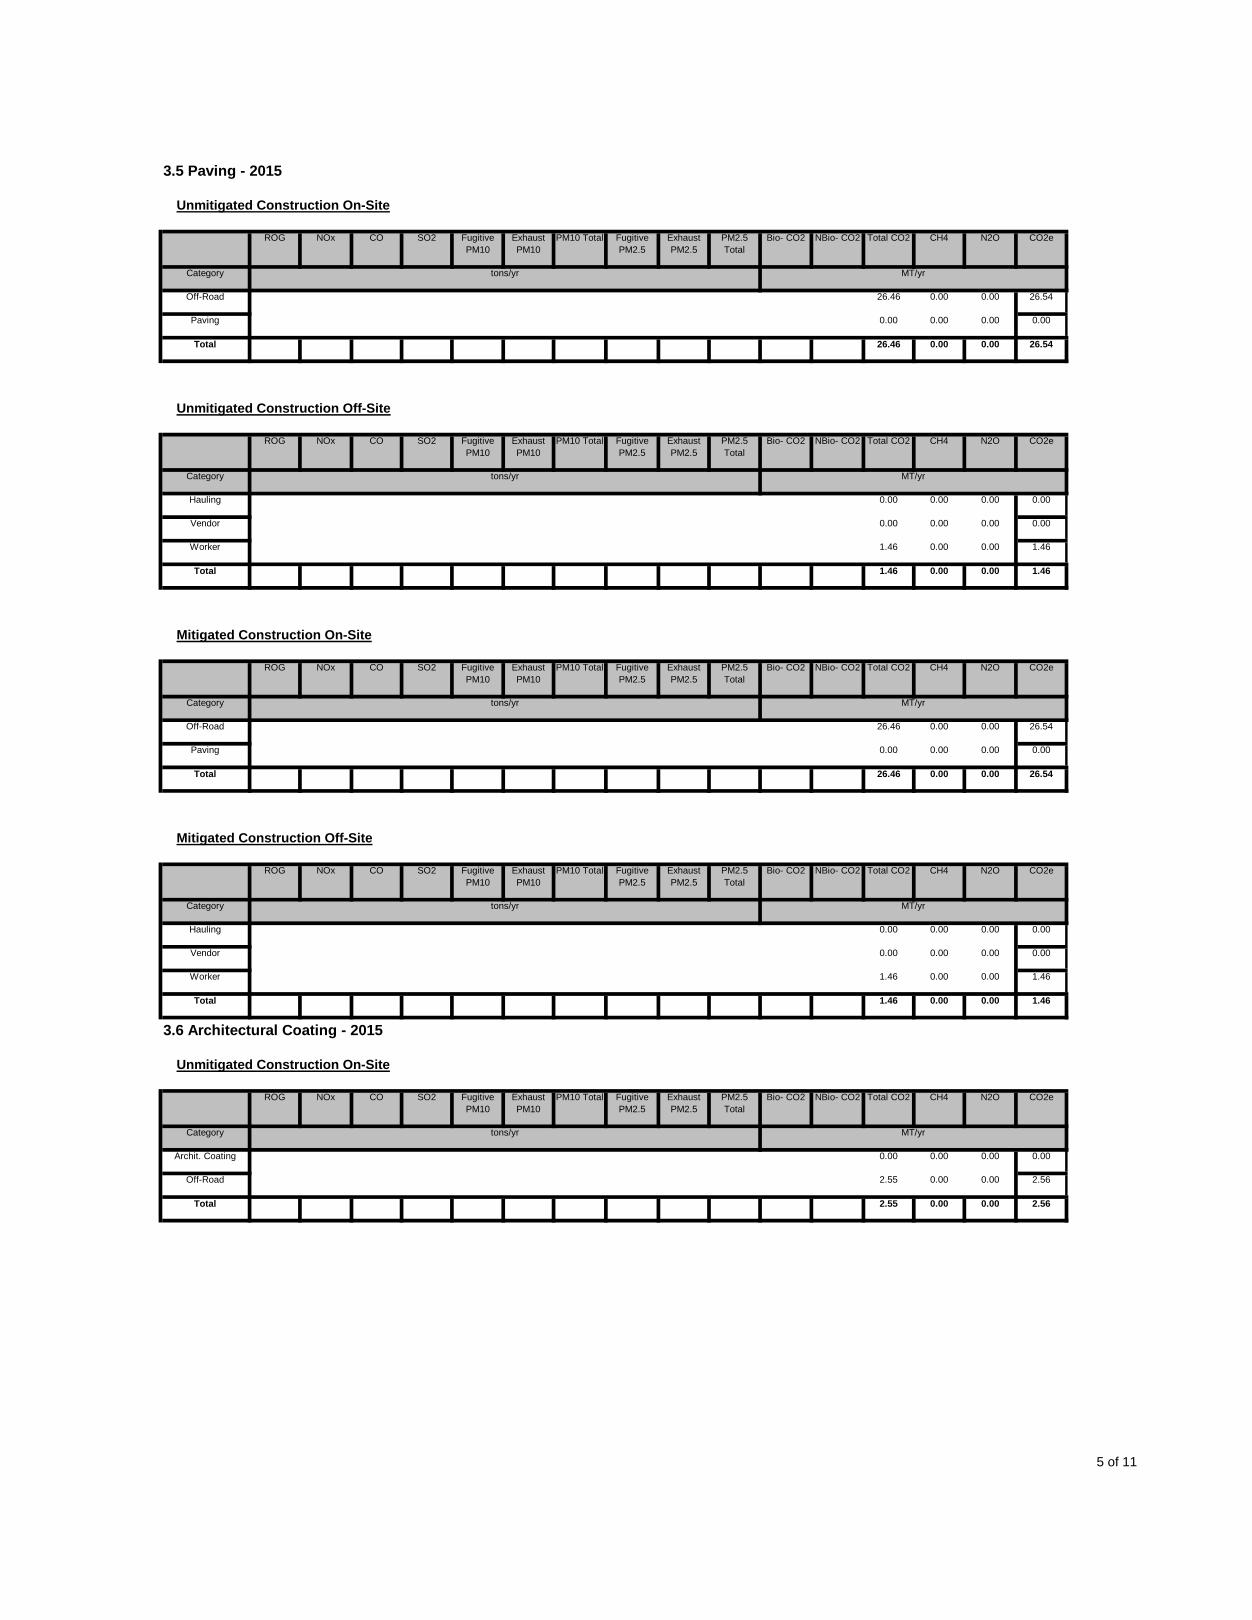
5 of 11
2.55 0.00 0.00 2.56Total
2.55 0.00 0.00 2.56
0.00 0.00 0.00 0.00
Off-Road
Archit. Coating
CH4 N2O CO2e
Category tons/yr MT/yr
Fugitive PM2.5
Exhaust PM2.5
PM2.5 Total
Bio- CO2ROG NOx CO SO2 Fugitive PM10
Exhaust PM10
PM10 Total
1.46 0.00
NBio- CO2 Total CO2
3.6 Architectural Coating - 2015
Unmitigated Construction On-Site
0.00 1.46
1.46 0.00 0.00 1.46
Total
Worker
0.00 0.00 0.00 0.00
0.00 0.00 0.00 0.00
Vendor
Hauling
CH4 N2O CO2e
Category tons/yr MT/yr
Fugitive PM2.5
Exhaust PM2.5
PM2.5 Total
Bio- CO2ROG NOx CO SO2 Fugitive PM10
Exhaust PM10
PM10 Total
26.46 0.00
NBio- CO2 Total CO2
Mitigated Construction Off-Site
0.00 26.54
0.00 0.00 0.00 0.00
Total
Paving
26.46 0.00 0.00 26.54
N2O CO2e
Category tons/yr MT/yr
Off-Road
Exhaust PM2.5
PM2.5 Total
Bio- CO2 NBio- CO2 Total CO2 CH4
Mitigated Construction On-Site
ROG NOx CO SO2 Fugitive PM10
Exhaust PM10
PM10 Total Fugitive PM2.5
1.46 0.00 0.00 1.46Total
1.46 0.00 0.00 1.46
0.00 0.00 0.00 0.00
Worker
Vendor
0.00 0.00 0.00 0.00
N2O CO2e
Category tons/yr MT/yr
Hauling
Exhaust PM2.5
PM2.5 Total
Bio- CO2 NBio- CO2 Total CO2 CH4
Unmitigated Construction Off-Site
ROG NOx CO SO2 Fugitive PM10
Exhaust PM10
PM10 Total Fugitive PM2.5
26.46 0.00 0.00 26.54Total
0.00 0.00 0.00 0.00
26.46 0.00 0.00 26.54
Paving
Off-Road
CH4 N2O CO2e
Category tons/yr MT/yr
Fugitive PM2.5
Exhaust PM2.5
PM2.5 Total
Bio- CO2ROG NOx CO SO2 Fugitive PM10
Exhaust PM10
PM10 Total NBio- CO2 Total CO2
3.5 Paving - 2015
Unmitigated Construction On-Site
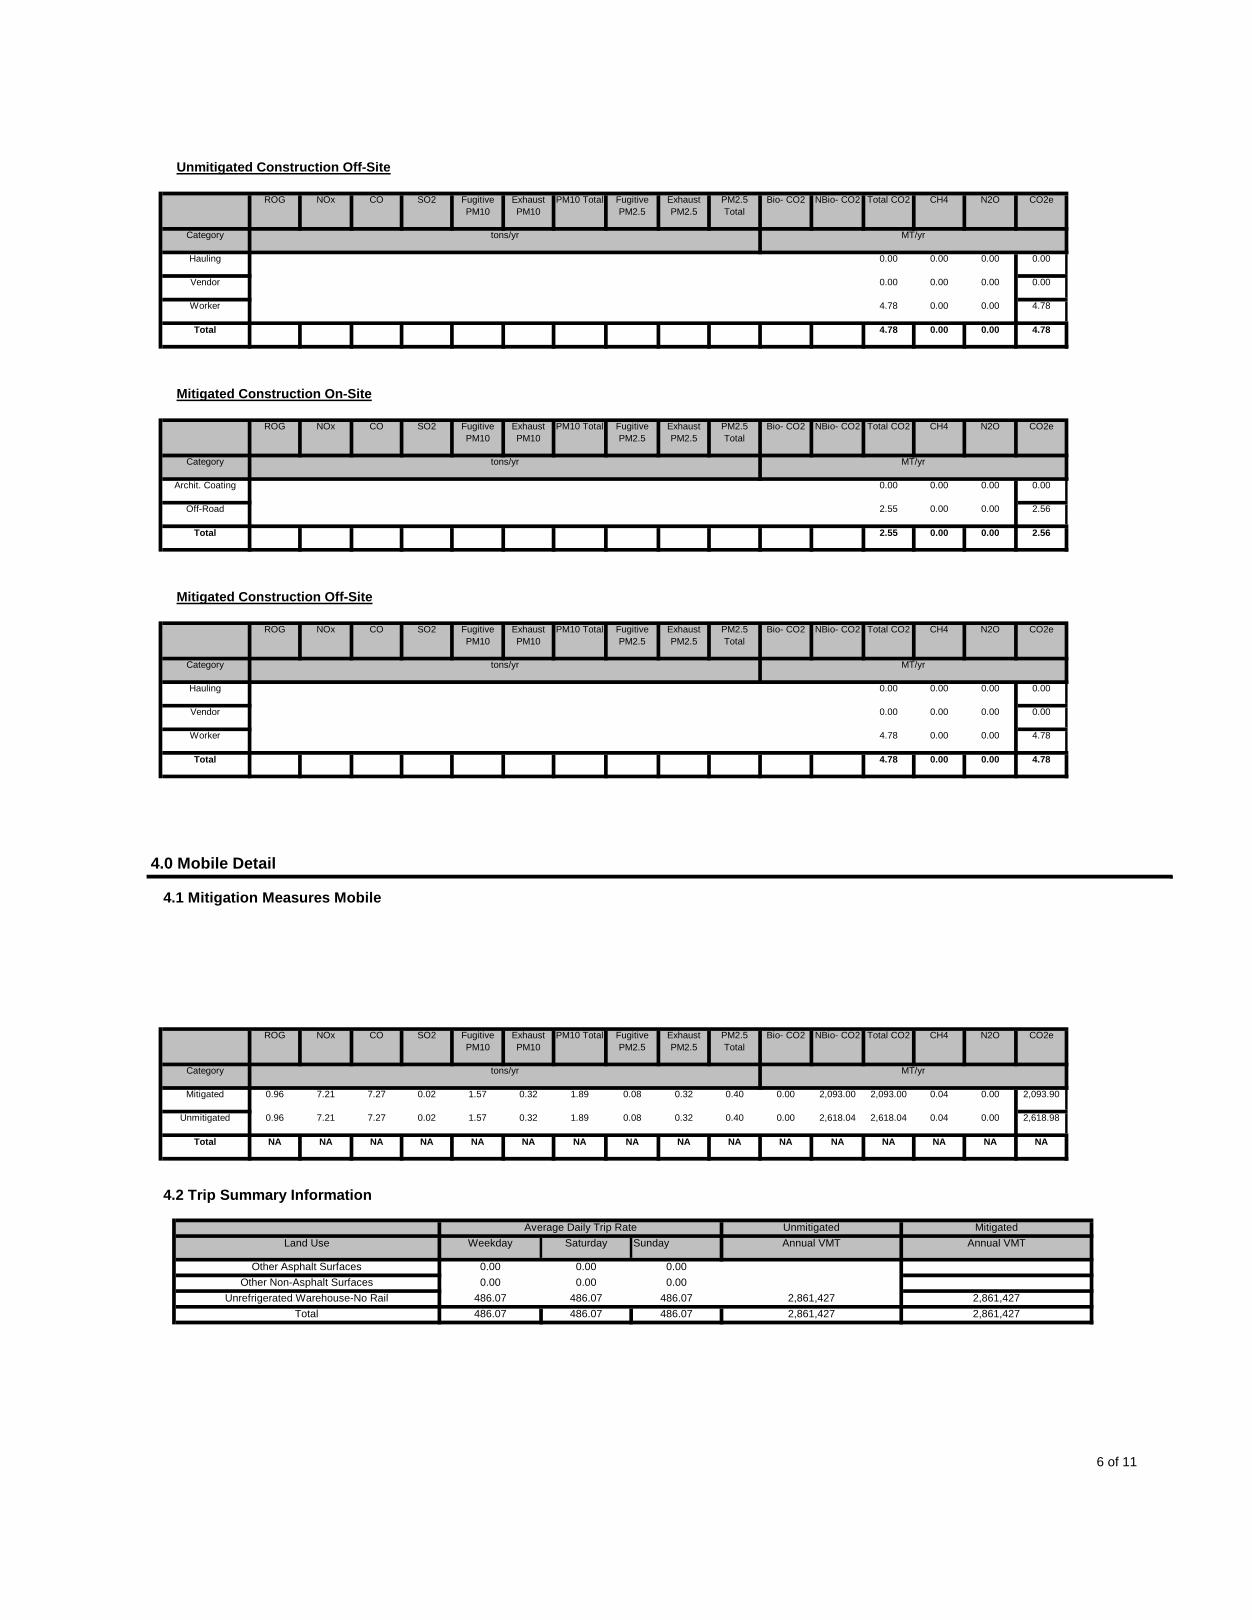
6 of 11
Total 486.07 486.07 486.07 2,861,427 2,861,427Unrefrigerated Warehouse-No Rail 486.07 486.07 486.07 2,861,427 2,861,427
Other Non-Asphalt Surfaces 0.00 0.00 0.00
Annual VMT
Other Asphalt Surfaces 0.00 0.00 0.00
4.2 Trip Summary Information
Average Daily Trip Rate Unmitigated MitigatedLand Use Weekday Saturday Sunday Annual VMT
NA NA NA NA NA NANA NA NA NA NA NA
2,618.04 2,618.04 0.04 0.00 2,618.98
Total NA NA NA NA
0.32 1.89 0.08 0.32 0.40 0.00Unmitigated 0.96 7.21 7.27 0.02 1.57
0.00 2,093.00 2,093.00 0.04 0.00 2,093.901.57 0.32 1.89 0.08 0.32 0.40
N2O CO2e
Category tons/yr MT/yr
Mitigated 0.96 7.21 7.27 0.02
Exhaust PM2.5
PM2.5 Total
Bio- CO2 NBio- CO2 Total CO2 CH4ROG NOx CO SO2 Fugitive PM10
Exhaust PM10
PM10 Total Fugitive PM2.5
4.0 Mobile Detail
4.1 Mitigation Measures Mobile
4.78 0.00 0.00 4.78
4.78 0.00 0.00 4.78
Total
Worker
0.00 0.00 0.00 0.00
0.00 0.00 0.00 0.00
Vendor
Hauling
CH4 N2O CO2e
Category tons/yr MT/yr
Fugitive PM2.5
Exhaust PM2.5
PM2.5 Total
Bio- CO2ROG NOx CO SO2 Fugitive PM10
Exhaust PM10
PM10 Total
2.55 0.00
NBio- CO2 Total CO2
Mitigated Construction Off-Site
0.00 2.56
2.55 0.00 0.00 2.56
Total
Off-Road
0.00 0.00 0.00 0.00
N2O CO2e
Category tons/yr MT/yr
Archit. Coating
Exhaust PM2.5
PM2.5 Total
Bio- CO2 NBio- CO2 Total CO2 CH4
Mitigated Construction On-Site
ROG NOx CO SO2 Fugitive PM10
Exhaust PM10
PM10 Total Fugitive PM2.5
4.78 0.00 0.00 4.78Total
4.78 0.00 0.00 4.78
0.00 0.00 0.00 0.00
Worker
Vendor
0.00 0.00 0.00 0.00
N2O CO2e
Category tons/yr MT/yr
Hauling
Exhaust PM2.5
PM2.5 Total
Bio- CO2 NBio- CO2 Total CO2 CH4
Unmitigated Construction Off-Site
ROG NOx CO SO2 Fugitive PM10
Exhaust PM10
PM10 Total Fugitive PM2.5
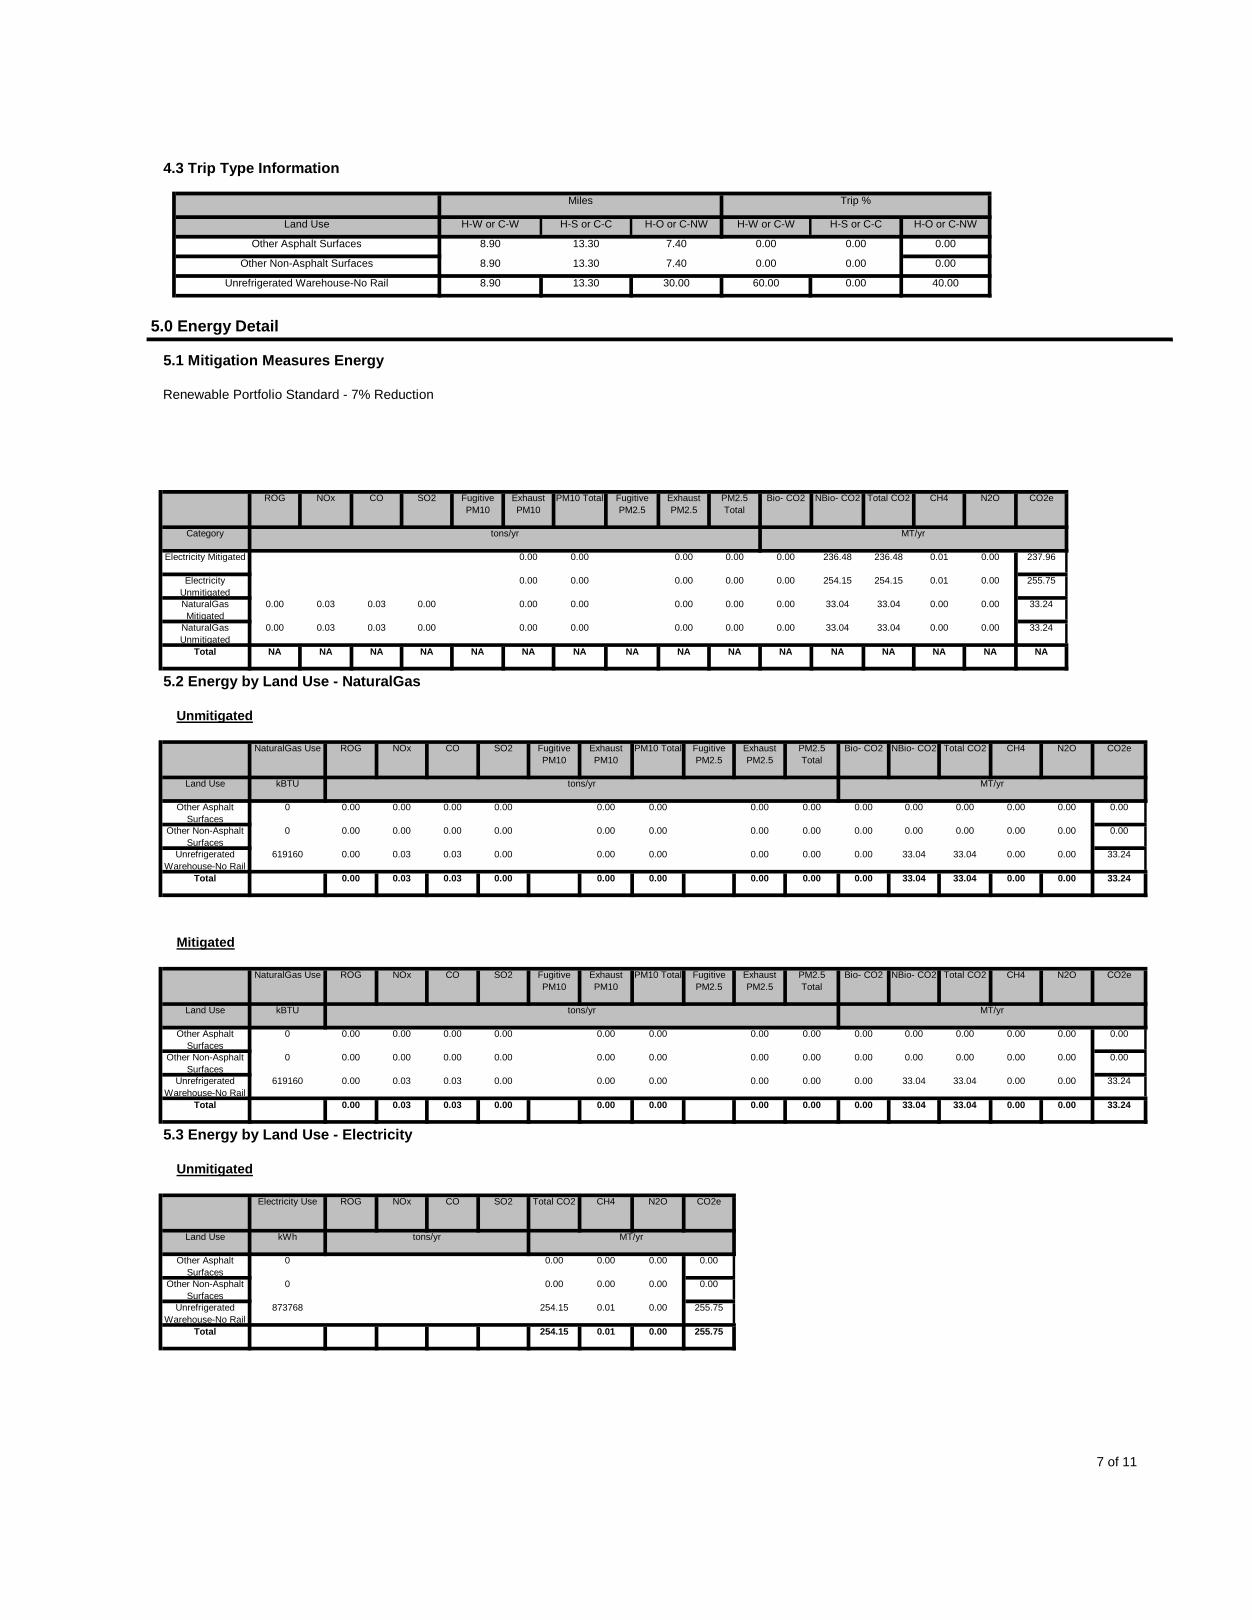
7 of 11
254.15 0.01 0.00 255.75
254.15 0.01 0.00 255.75
Total
0.00 0.00 0.00 0.00
Unrefrigerated Warehouse-No Rail
873768
0.00 0.00 0.00 0.00
Other Non-Asphalt Surfaces
0
Other Asphalt Surfaces
0
N2O CO2e
Land Use kWh tons/yr MT/yr
5.3 Energy by Land Use - Electricity
Unmitigated
Electricity Use ROG NOx CO SO2 Total CO2 CH4
0.00 33.04 33.04 0.00 0.00 33.240.00 0.00 0.00 0.00Total 0.00 0.03 0.03 0.00
0.00 33.04 33.04 0.00 0.00 33.240.00 0.00 0.00 0.00Unrefrigerated Warehouse-No Rail
619160 0.00 0.03 0.03 0.00
0.00 0.00 0.00 0.00 0.00 0.000.00 0.00 0.00 0.00Other Non-Asphalt Surfaces
0 0.00 0.00 0.00 0.00
0.00 0.00 0.00 0.00 0.00 0.000.00 0.00 0.00 0.00Other Asphalt Surfaces
0 0.00 0.00 0.00 0.00
Total CO2 CH4 N2O CO2e
Land Use kBTU tons/yr MT/yr
PM10 Total Fugitive PM2.5
Mitigated
NaturalGas Use ROG NOx CO SO2 Fugitive PM10
Exhaust PM10
0.00 33.04
Exhaust PM2.5
PM2.5 Total
Bio- CO2 NBio- CO2
33.04 0.00 0.00 33.240.00 0.00 0.00 0.00Total 0.00 0.03 0.03 0.00
0.00 33.04 33.04 0.00 0.00 33.240.00 0.00 0.00 0.00Unrefrigerated Warehouse-No Rail
619160 0.00 0.03 0.03 0.00
0.00 0.00 0.00 0.00 0.00 0.000.00 0.00 0.00 0.00Other Non-Asphalt Surfaces
0 0.00 0.00 0.00 0.00
0.00 0.00 0.00 0.00 0.00 0.000.00 0.00 0.00 0.00Other Asphalt Surfaces
0 0.00 0.00 0.00 0.00
CH4 N2O CO2e
Land Use kBTU tons/yr MT/yr
Fugitive PM2.5
Exhaust PM2.5
PM2.5 Total
NaturalGas Use ROG NOx CO SO2 Fugitive PM10
Exhaust PM10
PM10 Total
NA NA NA
Bio- CO2 NBio- CO2 Total CO2
Unmitigated
NA NA
5.2 Energy by Land Use - NaturalGas
NA NA NA NA NA NATotal NA NA NA NA NA
0.000.00 33.04 33.04 0.00 0.00 33.240.00 0.00 0.00
33.04 33.04 0.00 0.00 33.24
NaturalGas Unmitigated
0.00 0.03 0.03 0.00
0.00 0.00 0.00 0.00 0.00NaturalGas Mitigated
0.00 0.03 0.03 0.00
0.00 254.15 254.15 0.01 0.00 255.750.00 0.00 0.00 0.00
236.48 236.48 0.01 0.00 237.96
Electricity Unmitigated
0.00 0.00 0.00 0.00 0.00Electricity Mitigated
NBio- CO2 Total CO2 CH4 N2O CO2e
Category tons/yr MT/yr
Exhaust PM10
PM10 Total Fugitive PM2.5
Exhaust PM2.5
PM2.5 Total
Bio- CO2ROG NOx CO SO2 Fugitive PM10
5.0 Energy Detail
5.1 Mitigation Measures Energy
Renewable Portfolio Standard - 7% Reduction
0.00
Unrefrigerated Warehouse-No Rail 8.90 13.30 30.00 60.00 0.00 40.00
Other Non-Asphalt Surfaces 8.90 13.30 7.40 0.00 0.00
H-O or C-NW
Other Asphalt Surfaces 8.90 13.30 7.40 0.00 0.00 0.00
4.3 Trip Type Information
Miles Trip %
Land Use H-W or C-W H-S or C-C H-O or C-NW H-W or C-W H-S or C-C
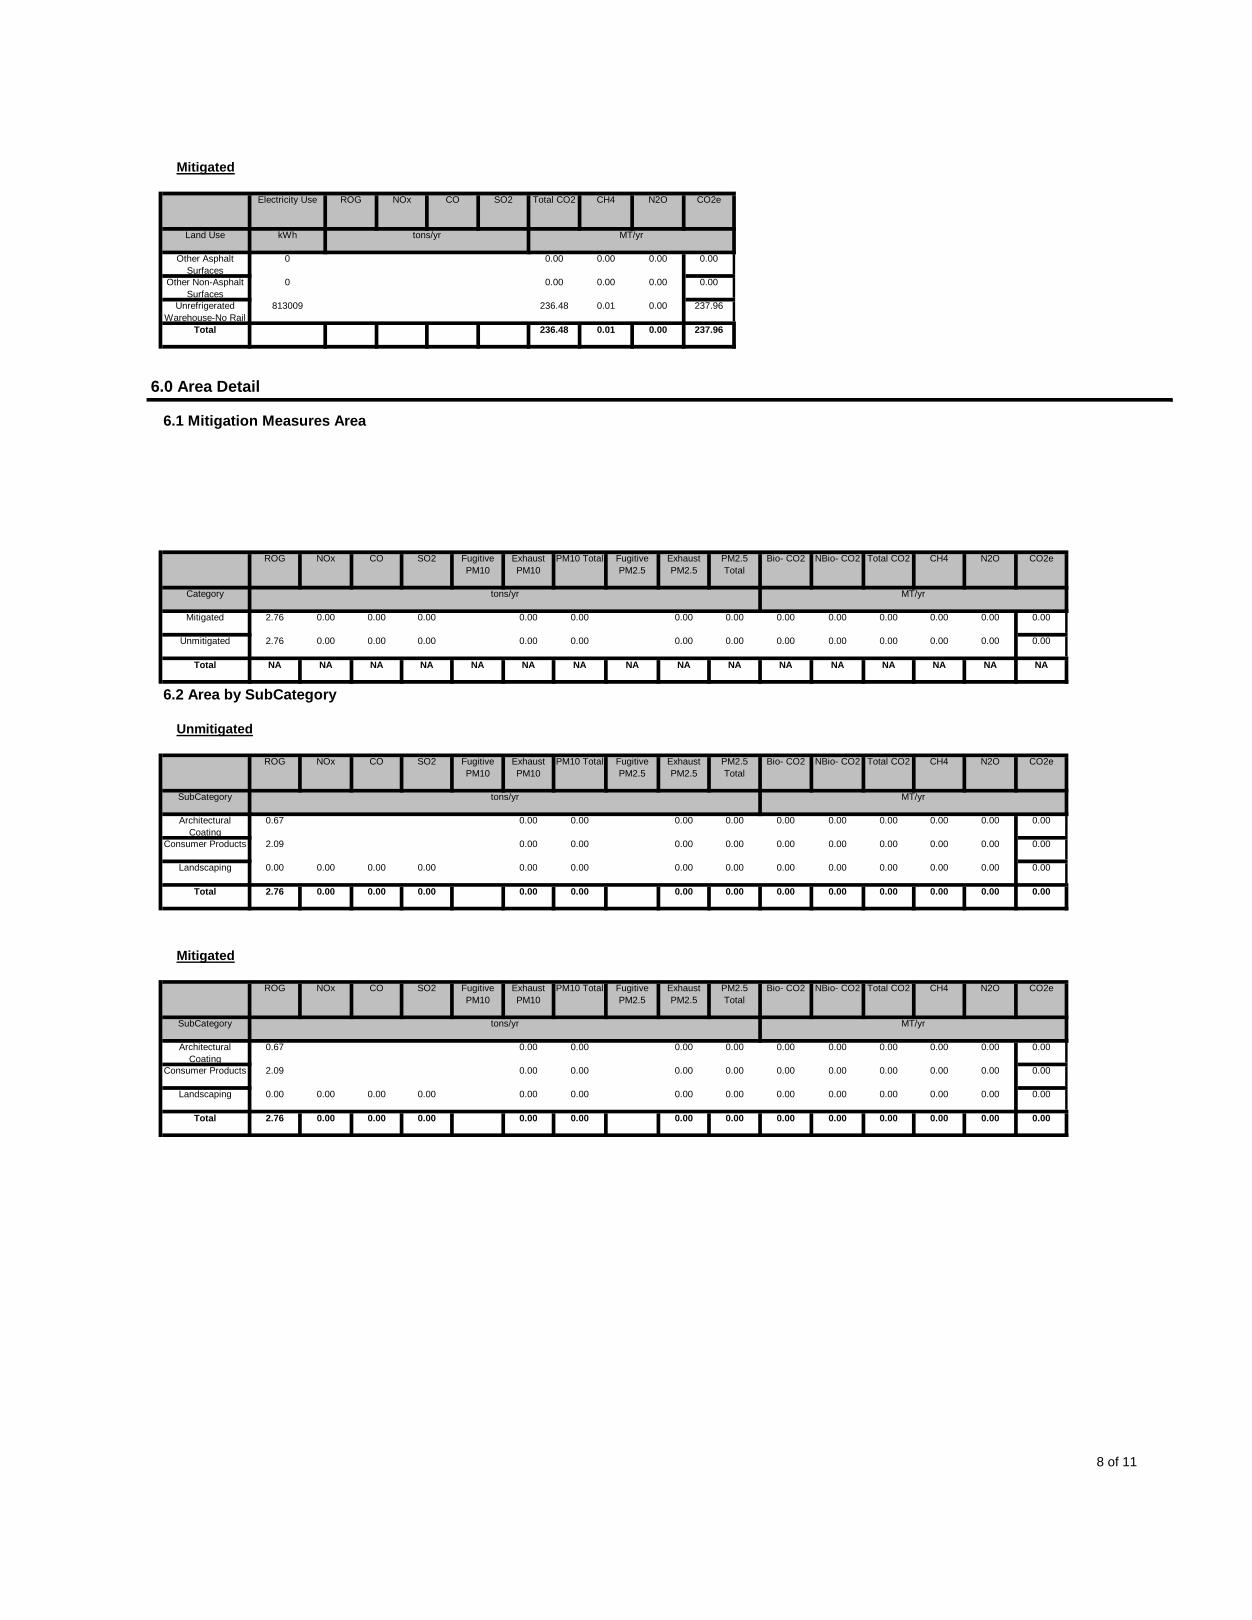
8 of 11
0.00 0.00 0.00 0.00 0.000.00 0.00 0.00 0.00 0.00Total 2.76 0.00 0.00 0.00
0.00 0.00 0.00 0.00 0.00 0.000.00 0.00 0.00 0.00
0.00 0.00 0.00 0.00 0.00
Landscaping 0.00 0.00 0.00 0.00
0.00 0.00 0.00 0.00 0.00Consumer Products 2.09
0.00 0.00 0.00 0.00 0.00 0.000.00 0.00 0.00 0.00
N2O CO2e
SubCategory tons/yr MT/yr
Architectural Coating
0.67
Exhaust PM2.5
PM2.5 Total
Bio- CO2 NBio- CO2 Total CO2 CH4
Mitigated
ROG NOx CO SO2 Fugitive PM10
Exhaust PM10
PM10 Total Fugitive PM2.5
0.00 0.00 0.00 0.00 0.000.00 0.00 0.00 0.00 0.00Total 2.76 0.00 0.00 0.00
0.00 0.00 0.00 0.00 0.00 0.000.00 0.00 0.00 0.00
0.00 0.00 0.00 0.00 0.00
Landscaping 0.00 0.00 0.00 0.00
0.00 0.00 0.00 0.00 0.00Consumer Products 2.09
0.00 0.00 0.00 0.00 0.00 0.000.00 0.00 0.00 0.00
N2O CO2e
SubCategory tons/yr MT/yr
Architectural Coating
0.67
Exhaust PM2.5
PM2.5 Total
Bio- CO2 NBio- CO2 Total CO2 CH4
Unmitigated
ROG NOx CO SO2 Fugitive PM10
Exhaust PM10
PM10 Total Fugitive PM2.5
NA NA NA NA NA
6.2 Area by SubCategory
NA NA NA NA NA NATotal NA NA NA NA NA
0.00 0.00 0.00 0.00 0.00 0.000.00 0.00 0.00 0.00
0.00 0.00 0.00 0.00 0.00
Unmitigated 2.76 0.00 0.00 0.00
0.00 0.00 0.00 0.00 0.00Mitigated 2.76 0.00 0.00 0.00
NBio- CO2 Total CO2 CH4 N2O CO2e
Category tons/yr MT/yr
Exhaust PM10
PM10 Total Fugitive PM2.5
Exhaust PM2.5
PM2.5 Total
Bio- CO2
6.1 Mitigation Measures Area
ROG NOx CO SO2 Fugitive PM10
236.48 0.01 0.00 237.96
6.0 Area Detail
236.48 0.01 0.00 237.96
Total
0.00 0.00 0.00 0.00
Unrefrigerated Warehouse-No Rail
813009
0.00 0.00 0.00 0.00
Other Non-Asphalt Surfaces
0
Other Asphalt Surfaces
0
Total CO2 CH4 N2O CO2e
Land Use kWh tons/yr MT/yr
Electricity Use ROG NOx CO SO2
Mitigated
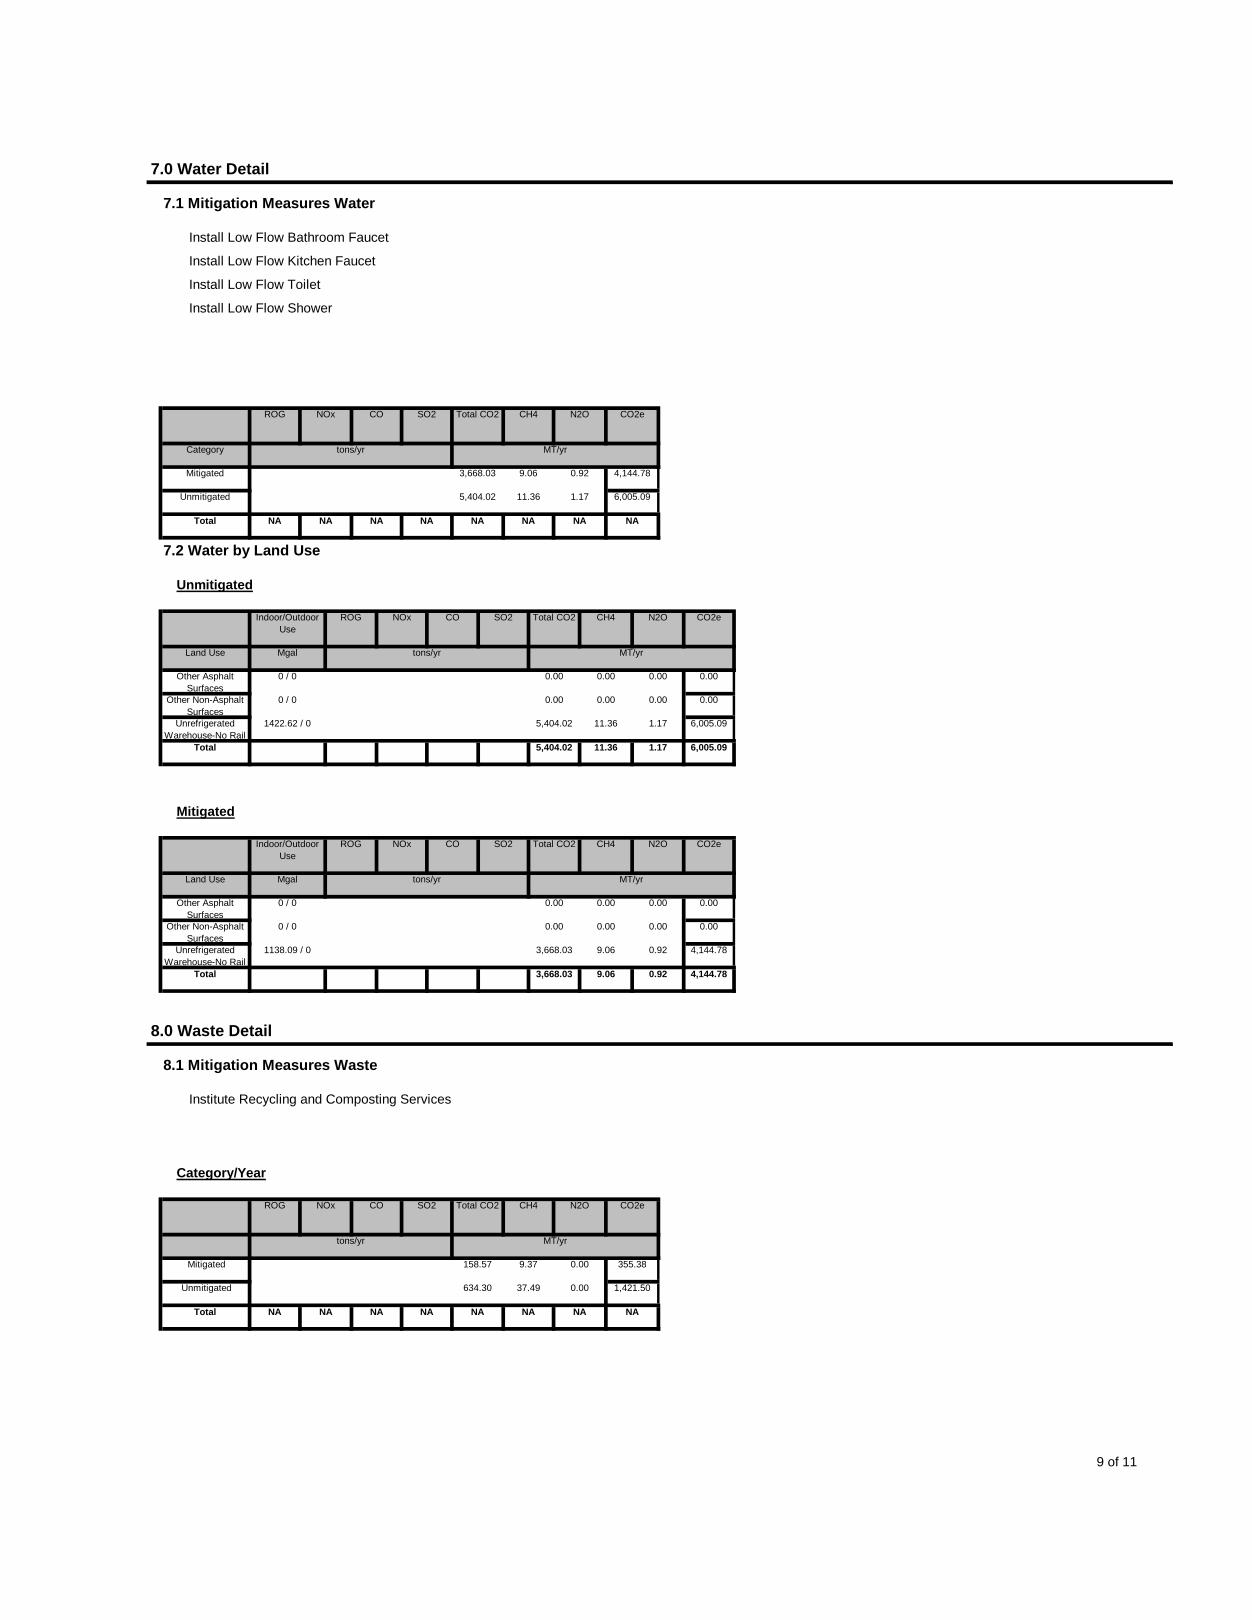
9 of 11
NA
0.00 1,421.50
Total NA NA NA NA NA NA NA
9.37 0.00 355.38
Unmitigated 634.30 37.49
Mitigated 158.57
CH4 N2O CO2e
tons/yr MT/yr
8.1 Mitigation Measures Waste
Institute Recycling and Composting Services
Category/Year
ROG NOx CO SO2 Total CO2
3,668.03 9.06 0.92 4,144.78
8.0 Waste Detail
3,668.03 9.06 0.92 4,144.78
Total
0.00 0.00 0.00 0.00
Unrefrigerated Warehouse-No Rail
1138.09 / 0
0.00 0.00 0.00 0.00
Other Non-Asphalt Surfaces
0 / 0
Other Asphalt Surfaces
0 / 0
Total CO2 CH4 N2O CO2e
Land Use Mgal tons/yr MT/yr
Indoor/Outdoor Use
ROG NOx CO SO2
5,404.02 11.36 1.17 6,005.09
Mitigated
5,404.02 11.36 1.17 6,005.09
Total
0.00 0.00 0.00 0.00
Unrefrigerated Warehouse-No Rail
1422.62 / 0
0.00 0.00 0.00 0.00
Other Non-Asphalt Surfaces
0 / 0
Other Asphalt Surfaces
0 / 0
CH4 N2O CO2e
Land Use Mgal tons/yr MT/yr
NA
7.2 Water by Land Use
Unmitigated
Indoor/Outdoor Use
ROG NOx CO SO2 Total CO2
1.17 6,005.09
Total NA NA NA NA NA NA NA
9.06 0.92 4,144.78
Unmitigated 5,404.02 11.36
CO2e
Category tons/yr MT/yr
Mitigated 3,668.03
ROG NOx CO SO2 Total CO2 CH4 N2O
7.1 Mitigation Measures Water
Install Low Flow Bathroom Faucet
Install Low Flow Kitchen Faucet
Install Low Flow Toilet
Install Low Flow Shower
7.0 Water Detail
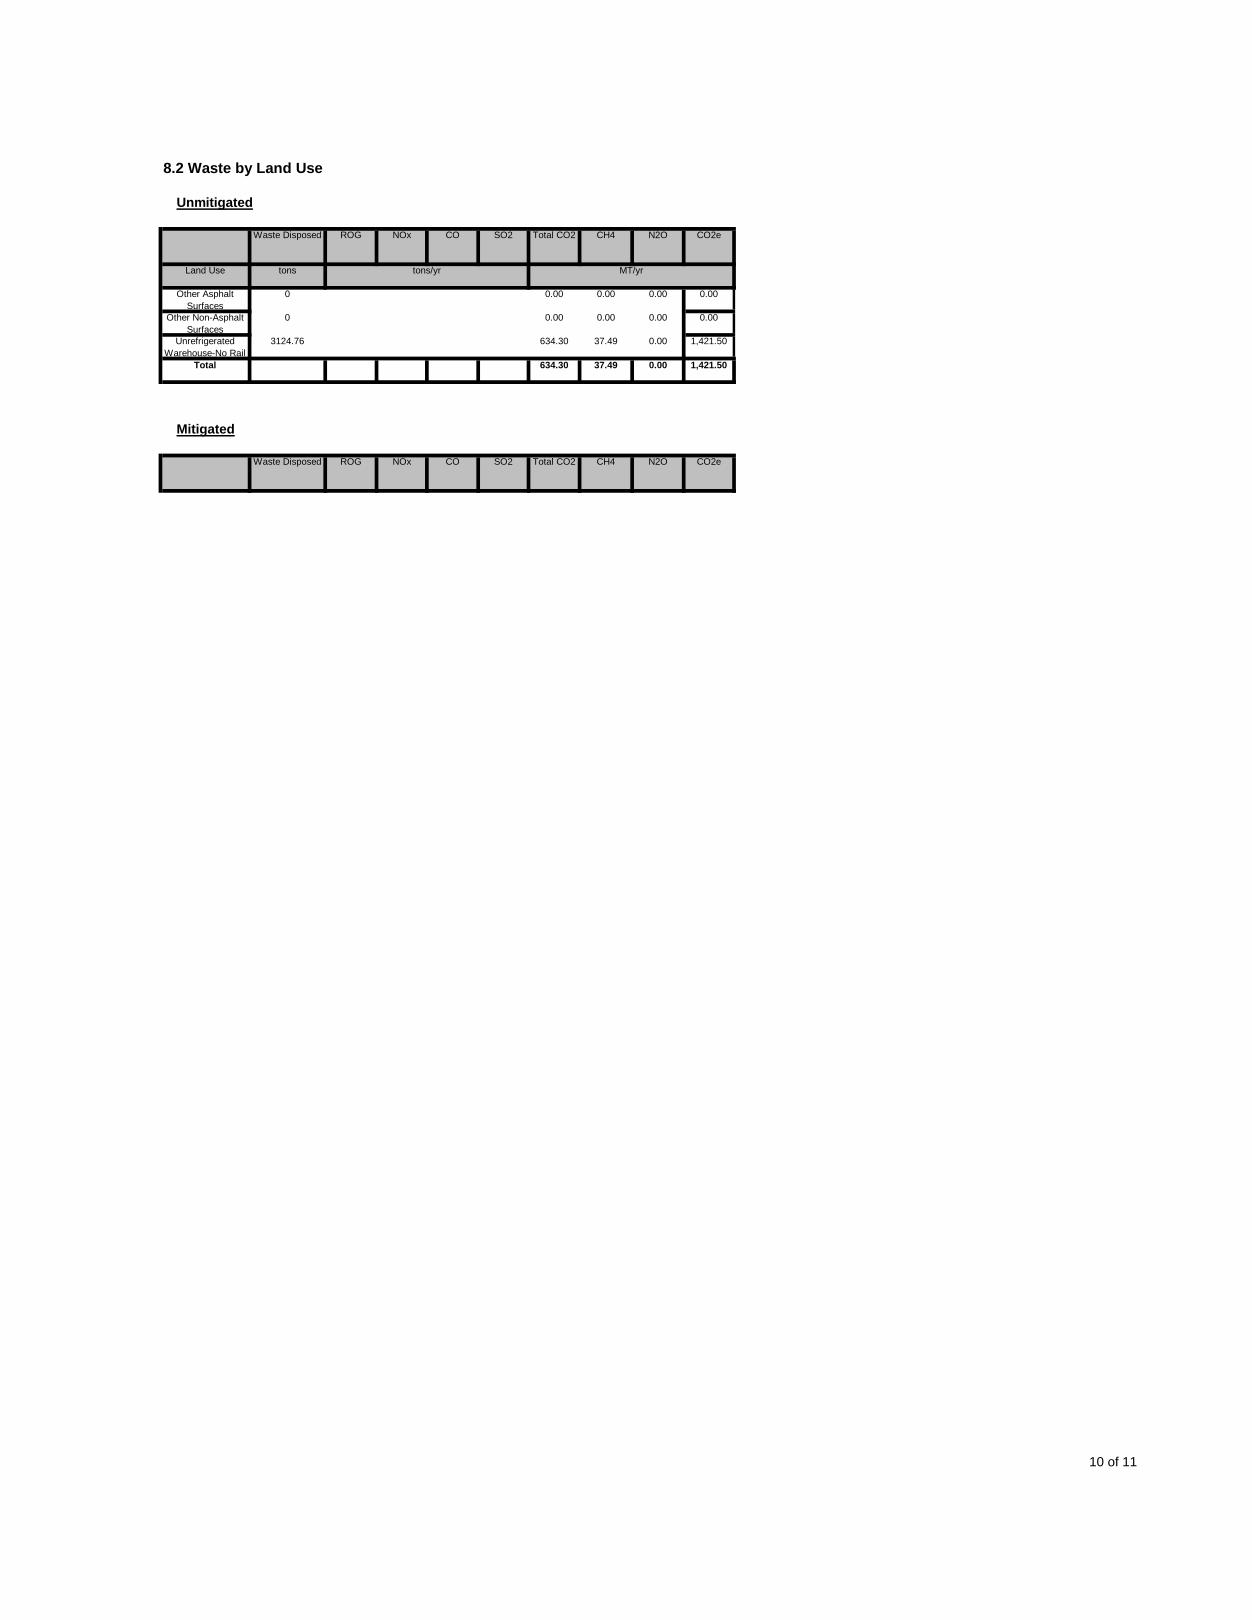
10 of 11
Total CO2 CH4 N2O CO2eWaste Disposed ROG NOx CO SO2
634.30 37.49 0.00 1,421.50
Mitigated
634.30 37.49 0.00 1,421.50
Total
0.00 0.00 0.00 0.00
Unrefrigerated Warehouse-No Rail
3124.76
0.00 0.00 0.00 0.00
Other Non-Asphalt Surfaces
0
Other Asphalt Surfaces
0
CH4 N2O CO2e
Land Use tons tons/yr MT/yr
8.2 Waste by Land Use
Unmitigated
Waste Disposed ROG NOx CO SO2 Total CO2
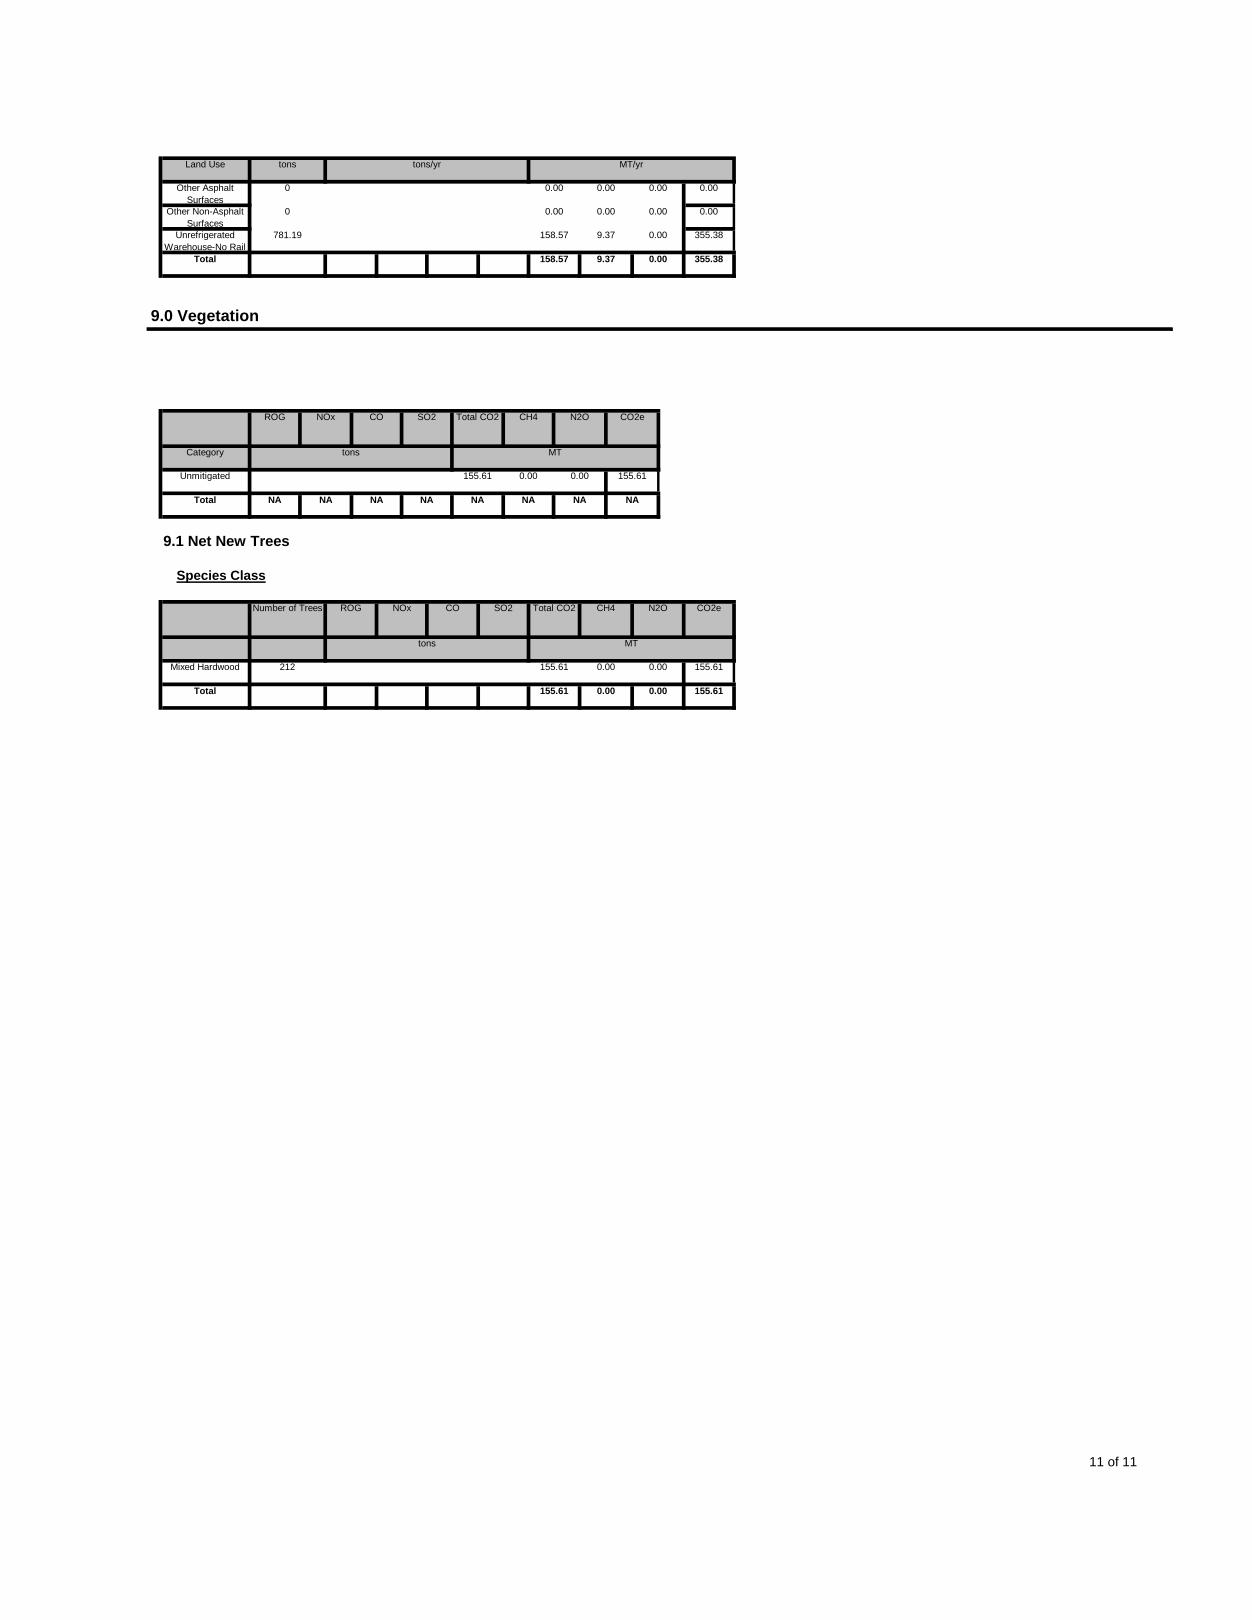
11 of 11
155.61 0.00 0.00 155.61
155.61 0.00 0.00 155.61
Total
Mixed Hardwood 212
Total CO2 CH4 N2O CO2e
tons MT
NA NA
9.1 Net New Trees
Species Class
Number of Trees ROG NOx CO SO2
0.00 0.00 155.61
Total NA NA NA NA NA NA
CO2e
Category tons MT
Unmitigated 155.61
ROG NOx CO SO2 Total CO2 CH4 N2O
158.57 9.37 0.00 355.38
9.0 Vegetation
158.57 9.37 0.00 355.38
Total
0.00 0.00 0.00 0.00
Unrefrigerated Warehouse-No Rail
781.19
0.00 0.00 0.00 0.00
Other Non-Asphalt Surfaces
0
Other Asphalt Surfaces
0
Land Use tons tons/yr MT/yr

1 of 8
NA NA NA NA NATotal NA NA NA NA NA
0.21 2.55 2.56 0.21 2.55 2.562015 67.72 30.18 21.73 0.06
0.58 0.79 0.21 0.58 0.792014 2.58 15.65 23.81 0.06 0.21
CH4 N2O CO2e
Year lb/day lb/day
Fugitive PM2.5
Exhaust PM2.5
PM2.5 Total
Bio- CO2 NBio- CO2 Total CO2
Mitigated Construction
ROG NOx CO SO2 Fugitive PM10
Exhaust PM10
PM10 Total
NA NA NA NA NA NATotal NA NA NA NA
2.55 5.15 0.21 2.55 2.562015 671.14 30.18 21.73 0.06 4.62
5.19 0.21 0.58 0.79
Year lb/day lb/day
2014 2.58 15.65 23.81 0.06 4.62 0.58
Bio- CO2 NBio- CO2 Total CO2 CH4 N2O CO2eFugitive PM10
Exhaust PM10
PM10 Total Fugitive PM2.5
Exhaust PM2.5
PM2.5 Total
Water Mitigation -
2.0 Emissions Summary
2.1 Overall Construction (Maximum Daily Emission)
Unmitigated Construction
ROG NOx CO SO2
Vehicle Trips - Truck Trip Distance at 30 Miles
Vechicle Emission Factors -
Vechicle Emission Factors -
Vechicle Emission Factors -
Water And Wastewater - Not Served by Septic Tanks
Solid Waste -
Project Characteristics -
Land Use - Actual site acreage.
Construction Phase -
Off-road Equipment -
Off-road Equipment -
Off-road Equipment -
Climate Zone 10 2.2
Precipitation Freq (Days)
1.3 User Entered Comments 32
1.2 Other Project CharacteristicsUtility Company Southern California EdisonUrbanization Urban Wind Speed (m/s)
Other Asphalt Surfaces 202.8 1000sqft
Other Non-Asphalt Surfaces 86.98 1000sqft
1.1 Land Usage
Land Uses Size Metric
Unrefrigerated Warehouse-No Rail 289.33 1000sqft
CalEEMod Version: CalEEMod.2011.1.1 Date: 4/12/2013
Prologis Redlands Building 13San Bernardino-South Coast County, Summer
1.0 Project Characteristics

2 of 8
0.00 0.00 0.00 0.00 0.00 0.00Total
0.00 0.00 0.00 0.00 0.00Fugitive Dust 0.00
CH4 N2O CO2e
Category lb/day lb/day
Fugitive PM2.5
Exhaust PM2.5
PM2.5 Total
Bio- CO2 NBio- CO2 Total CO2
Mitigated Construction On-Site
ROG NOx CO SO2 Fugitive PM10
Exhaust PM10
PM10 Total
0.00 0.00 0.00 0.00 0.00 0.00Total 0.00 0.00 0.00 0.00
0.00 0.00 0.00 0.00 0.00Worker 0.00 0.00 0.00 0.00 0.00
0.00 0.00 0.00 0.00 0.00 0.00Vendor 0.00 0.00 0.00 0.00
0.00 0.00 0.00 0.00 0.00Hauling 0.00 0.00 0.00 0.00 0.00
CH4 N2O CO2e
Category lb/day lb/day
Fugitive PM2.5
Exhaust PM2.5
PM2.5 Total
Bio- CO2 NBio- CO2 Total CO2
Unmitigated Construction Off-Site
ROG NOx CO SO2 Fugitive PM10
Exhaust PM10
PM10 Total
0.00 0.00 0.00 0.00 0.00 0.00Total
0.00 0.00 0.00 0.00 0.00Fugitive Dust 0.00
NBio- CO2 Total CO2 CH4 N2O CO2e
Category lb/day lb/day
Exhaust PM10
PM10 Total Fugitive PM2.5
Exhaust PM2.5
PM2.5 Total
Bio- CO2ROG NOx CO SO2 Fugitive PM10
3.0 Construction Detail
3.1 Mitigation Measures Construction
3.2 Site Preparation - 2014
Unmitigated Construction On-Site
1.77 11.37 0.45 1.77 2.23Total 20.54 46.58 40.25 0.11 9.60
9.60 1.77 11.36 0.45 1.77 2.22Mobile 5.38 46.41 40.11 0.11
0.00 0.01 0.00 0.01Energy 0.02 0.17 0.14 0.00
0.00 0.00 0.00 0.00
N2O CO2e
Category lb/day lb/day
Area 15.14 0.00 0.00 0.00
Exhaust PM2.5
PM2.5 Total
Bio- CO2 NBio- CO2 Total CO2 CH4
Mitigated Operational
ROG NOx CO SO2 Fugitive PM10
Exhaust PM10
PM10 Total Fugitive PM2.5
1.77 11.37 0.45 1.77 2.23Total 20.54 46.58 40.25 0.11 9.60
9.60 1.77 11.36 0.45 1.77 2.22Mobile 5.38 46.41 40.11 0.11
0.00 0.01 0.00 0.01Energy 0.02 0.17 0.14 0.00
0.00 0.00 0.00 0.00
N2O CO2e
Category lb/day lb/day
Area 15.14 0.00 0.00 0.00
Exhaust PM2.5
PM2.5 Total
Bio- CO2 NBio- CO2 Total CO2 CH4
Unmitigated Operational
ROG NOx CO SO2 Fugitive PM10
Exhaust PM10
PM10 Total Fugitive PM2.5
2.2 Overall Operational
3 of 8
4.62 0.58 5.20 0.21 0.58 0.79Total 2.58 15.65 23.81 0.05
0.11 3.84 0.14 0.11 0.25Worker 1.44 1.41 16.48 0.03 3.73
0.89 0.47 1.36 0.07 0.47 0.54Vendor 1.14 14.24 7.33 0.02
0.00 0.00 0.00 0.00 0.00Hauling 0.00 0.00 0.00 0.00 0.00
CH4 N2O CO2e
Category lb/day lb/day
Fugitive PM2.5
Exhaust PM2.5
PM2.5 Total
Bio- CO2 NBio- CO2 Total CO2
3.4 Building Construction - 2014
Unmitigated Construction Off-Site
ROG NOx CO SO2 Fugitive PM10
Exhaust PM10
PM10 Total
0.00 0.00 0.00 0.00 0.00 0.00Total 0.00 0.00 0.00 0.00
0.00 0.00 0.00 0.00 0.00Worker 0.00 0.00 0.00 0.00 0.00
0.00 0.00 0.00 0.00 0.00 0.00Vendor 0.00 0.00 0.00 0.00
0.00 0.00 0.00 0.00 0.00Hauling 0.00 0.00 0.00 0.00 0.00
CH4 N2O CO2e
Category lb/day lb/day
Fugitive PM2.5
Exhaust PM2.5
PM2.5 Total
Bio- CO2 NBio- CO2 Total CO2
Mitigated Construction Off-Site
ROG NOx CO SO2 Fugitive PM10
Exhaust PM10
PM10 Total
0.00 0.00 0.00 0.00 0.00 0.00Total
0.00 0.00 0.00 0.00 0.00Fugitive Dust 0.00
CH4 N2O CO2e
Category lb/day lb/day
Fugitive PM2.5
Exhaust PM2.5
PM2.5 Total
Bio- CO2 NBio- CO2 Total CO2
Mitigated Construction On-Site
ROG NOx CO SO2 Fugitive PM10
Exhaust PM10
PM10 Total
0.00 0.00 0.00 0.00 0.00 0.00Total 0.00 0.00 0.00 0.00
0.00 0.00 0.00 0.00 0.00Worker 0.00 0.00 0.00 0.00 0.00
0.00 0.00 0.00 0.00 0.00 0.00Vendor 0.00 0.00 0.00 0.00
0.00 0.00 0.00 0.00 0.00Hauling 0.00 0.00 0.00 0.00 0.00
CH4 N2O CO2e
Category lb/day lb/day
Fugitive PM2.5
Exhaust PM2.5
PM2.5 Total
Bio- CO2 NBio- CO2 Total CO2
Unmitigated Construction Off-Site
ROG NOx CO SO2 Fugitive PM10
Exhaust PM10
PM10 Total
0.00 0.00 0.00 0.00 0.00 0.00Total
0.00 0.00 0.00 0.00 0.00Fugitive Dust 0.00
CH4 N2O CO2e
Category lb/day lb/day
Fugitive PM2.5
Exhaust PM2.5
PM2.5 Total
Bio- CO2 NBio- CO2 Total CO2
3.3 Grading - 2014
Unmitigated Construction On-Site
ROG NOx CO SO2 Fugitive PM10
Exhaust PM10
PM10 Total
0.00 0.00 0.00 0.00 0.00 0.00Total 0.00 0.00 0.00 0.00
0.00 0.00 0.00 0.00 0.00Worker 0.00 0.00 0.00 0.00 0.00
0.00 0.00 0.00 0.00 0.00 0.00Vendor 0.00 0.00 0.00 0.00
0.00 0.00 0.00 0.00 0.00Hauling 0.00 0.00 0.00 0.00 0.00
CH4 N2O CO2e
Category lb/day lb/day
Fugitive PM2.5
Exhaust PM2.5
PM2.5 Total
Bio- CO2 NBio- CO2 Total CO2
Mitigated Construction Off-Site
ROG NOx CO SO2 Fugitive PM10
Exhaust PM10
PM10 Total
4 of 8
0.01 0.24 0.01 0.01 0.02Total 0.08 0.08 0.93 0.00 0.23
0.23 0.01 0.24 0.01 0.01 0.02Worker 0.08 0.08 0.93 0.00
0.00 0.00 0.00 0.00 0.00Vendor 0.00 0.00 0.00 0.00 0.00
0.00 0.00 0.00 0.00 0.00 0.00
N2O CO2e
Category lb/day lb/day
Hauling 0.00 0.00 0.00 0.00
Exhaust PM2.5
PM2.5 Total
Bio- CO2 NBio- CO2 Total CO2 CH4
Unmitigated Construction Off-Site
ROG NOx CO SO2 Fugitive PM10
Exhaust PM10
PM10 Total Fugitive PM2.5
2.54 2.54 2.54 2.54Total 5.50 30.10 20.54 0.03
0.00 0.00 0.00 0.00Paving 0.61
2.54 2.54 2.54 2.54Off-Road 4.89 30.10 20.54 0.03
CH4 N2O CO2e
Category lb/day lb/day
Fugitive PM2.5
Exhaust PM2.5
PM2.5 Total
Bio- CO2 NBio- CO2 Total CO2
3.5 Paving - 2015
Unmitigated Construction On-Site
ROG NOx CO SO2 Fugitive PM10
Exhaust PM10
PM10 Total
0.21 0.53 0.74 0.21 0.53 0.74Total 2.36 14.28 21.73 0.05
0.11 0.25 0.14 0.11 0.25Worker 1.33 1.28 15.06 0.03 0.14
0.07 0.42 0.49 0.07 0.42 0.49Vendor 1.03 13.00 6.67 0.02
0.00 0.00 0.00 0.00 0.00Hauling 0.00 0.00 0.00 0.00 0.00
CH4 N2O CO2e
Category lb/day lb/day
Fugitive PM2.5
Exhaust PM2.5
PM2.5 Total
Bio- CO2 NBio- CO2 Total CO2
Mitigated Construction Off-Site
ROG NOx CO SO2 Fugitive PM10
Exhaust PM10
PM10 Total
4.62 0.53 5.15 0.21 0.53 0.74Total 2.36 14.28 21.73 0.05
0.11 3.84 0.14 0.11 0.25Worker 1.33 1.28 15.06 0.03 3.73
0.89 0.42 1.31 0.07 0.42 0.49Vendor 1.03 13.00 6.67 0.02
0.00 0.00 0.00 0.00 0.00Hauling 0.00 0.00 0.00 0.00 0.00
CH4 N2O CO2e
Category lb/day lb/day
Fugitive PM2.5
Exhaust PM2.5
PM2.5 Total
Bio- CO2 NBio- CO2 Total CO2
3.4 Building Construction - 2015
Unmitigated Construction Off-Site
ROG NOx CO SO2 Fugitive PM10
Exhaust PM10
PM10 Total
0.21 0.58 0.79 0.21 0.58 0.79Total 2.58 15.65 23.81 0.05
0.11 0.25 0.14 0.11 0.25Worker 1.44 1.41 16.48 0.03 0.14
0.07 0.47 0.54 0.07 0.47 0.54Vendor 1.14 14.24 7.33 0.02
0.00 0.00 0.00 0.00 0.00Hauling 0.00 0.00 0.00 0.00 0.00
CH4 N2O CO2e
Category lb/day lb/day
Fugitive PM2.5
Exhaust PM2.5
PM2.5 Total
Bio- CO2 NBio- CO2 Total CO2
Mitigated Construction Off-Site
ROG NOx CO SO2 Fugitive PM10
Exhaust PM10
PM10 Total
5 of 8
0.03 0.02 0.05 0.03 0.02 0.05Total 0.27 0.26 3.04 0.01
0.02 0.05 0.03 0.02 0.05Worker 0.27 0.26 3.04 0.01 0.03
0.00 0.00 0.00 0.00 0.00 0.00Vendor 0.00 0.00 0.00 0.00
0.00 0.00 0.00 0.00 0.00Hauling 0.00 0.00 0.00 0.00 0.00
CH4 N2O CO2e
Category lb/day lb/day
Fugitive PM2.5
Exhaust PM2.5
PM2.5 Total
Bio- CO2 NBio- CO2 Total CO2
Mitigated Construction Off-Site
ROG NOx CO SO2 Fugitive PM10
Exhaust PM10
PM10 Total
0.22 0.22 0.22 0.22Total 67.46 2.57 1.90 0.00
0.22 0.22 0.22 0.22Off-Road 0.41 2.57 1.90 0.00
0.00 0.00 0.00 0.00
N2O CO2e
Category lb/day lb/day
Archit. Coating 67.05
Exhaust PM2.5
PM2.5 Total
Bio- CO2 NBio- CO2 Total CO2 CH4
Mitigated Construction On-Site
ROG NOx CO SO2 Fugitive PM10
Exhaust PM10
PM10 Total Fugitive PM2.5
0.02 0.77 0.03 0.02 0.05Total 0.27 0.26 3.04 0.01 0.75
0.75 0.02 0.77 0.03 0.02 0.05Worker 0.27 0.26 3.04 0.01
0.00 0.00 0.00 0.00 0.00Vendor 0.00 0.00 0.00 0.00 0.00
0.00 0.00 0.00 0.00 0.00 0.00
N2O CO2e
Category lb/day lb/day
Hauling 0.00 0.00 0.00 0.00
Exhaust PM2.5
PM2.5 Total
Bio- CO2 NBio- CO2 Total CO2 CH4
Unmitigated Construction Off-Site
ROG NOx CO SO2 Fugitive PM10
Exhaust PM10
PM10 Total Fugitive PM2.5
0.22 0.22 0.22 0.22Total 670.87 2.57 1.90 0.00
0.22 0.22 0.22 0.22Off-Road 0.41 2.57 1.90 0.00
0.00 0.00 0.00 0.00Archit. Coating 670.46
CH4 N2O CO2e
Category lb/day lb/day
Fugitive PM2.5
Exhaust PM2.5
PM2.5 Total
Bio- CO2 NBio- CO2 Total CO2
3.6 Architectural Coating - 2015
Unmitigated Construction On-Site
ROG NOx CO SO2 Fugitive PM10
Exhaust PM10
PM10 Total
0.01 0.01 0.02 0.01 0.01 0.02Total 0.08 0.08 0.93 0.00
0.01 0.02 0.01 0.01 0.02Worker 0.08 0.08 0.93 0.00 0.01
0.00 0.00 0.00 0.00 0.00 0.00Vendor 0.00 0.00 0.00 0.00
0.00 0.00 0.00 0.00 0.00Hauling 0.00 0.00 0.00 0.00 0.00
CH4 N2O CO2e
Category lb/day lb/day
Fugitive PM2.5
Exhaust PM2.5
PM2.5 Total
Bio- CO2 NBio- CO2 Total CO2
Mitigated Construction Off-Site
ROG NOx CO SO2 Fugitive PM10
Exhaust PM10
PM10 Total
2.54 2.54 2.54 2.54Total 5.50 30.10 20.54 0.03
0.00 0.00 0.00 0.00Paving 0.61
2.54 2.54 2.54 2.54
N2O CO2e
Category lb/day lb/day
Off-Road 4.89 30.10 20.54 0.03
Exhaust PM2.5
PM2.5 Total
Bio- CO2 NBio- CO2 Total CO2 CH4
Mitigated Construction On-Site
ROG NOx CO SO2 Fugitive PM10
Exhaust PM10
PM10 Total Fugitive PM2.5

6 of 8
0.00 0.01 0.00 0.01Total 0.02 0.17 0.14 0.00
0.00 0.01 0.00 0.01Unrefrigerated Warehouse-No Rail
1696.33 0.02 0.17 0.14 0.00
0.00 0.00 0.00 0.00Other Non-Asphalt Surfaces
0 0.00 0.00 0.00 0.00
0.00 0.00 0.00 0.00Other Asphalt Surfaces
0 0.00 0.00 0.00 0.00
CH4 N2O CO2e
Land Use kBTU lb/day lb/day
Fugitive PM2.5
Exhaust PM2.5
PM2.5 Total Bio- CO2 NBio- CO2 Total CO2
Unmitigated
NaturalGas Use ROG NOx CO SO2 Fugitive PM10
Exhaust PM10
PM10 Total
5.2 Energy by Land Use - NaturalGas
NA NA NA NA NATotal NA NA NA NA NA
0.00 0.01 0.00 0.01NaturalGas Unmitigated
0.02 0.17 0.14 0.00
0.00 0.01 0.00 0.01NaturalGas Mitigated
0.02 0.17 0.14 0.00
NBio- CO2 Total CO2 CH4 N2O CO2e
Category lb/day lb/day
Exhaust PM10
PM10 Total Fugitive PM2.5
Exhaust PM2.5
PM2.5 Total
Bio- CO2ROG NOx CO SO2 Fugitive PM10
5.0 Energy Detail
5.1 Mitigation Measures Energy
0.00
Unrefrigerated Warehouse-No Rail 8.90 13.30 30.00 60.00 0.00 40.00
Other Non-Asphalt Surfaces 8.90 13.30 7.40 0.00 0.00
H-O or C-NW
Other Asphalt Surfaces 8.90 13.30 7.40 0.00 0.00 0.00
4.3 Trip Type Information
Miles Trip %
Land Use H-W or C-W H-S or C-C H-O or C-NW H-W or C-W H-S or C-C
Total 486.07 486.07 486.07 2,861,427 2,861,427Unrefrigerated Warehouse-No Rail 486.07 486.07 486.07 2,861,427 2,861,427
Other Non-Asphalt Surfaces 0.00 0.00 0.00
Annual VMT
Other Asphalt Surfaces 0.00 0.00 0.00
4.2 Trip Summary Information
Average Daily Trip Rate Unmitigated MitigatedLand Use Weekday Saturday Sunday Annual VMT
NA NA NA NA NA NATotal NA NA NA NA
1.77 11.36 0.45 1.77 2.22Unmitigated 5.38 46.41 40.11 0.11 9.60
9.60 1.77 11.36 0.45 1.77 2.22
N2O CO2e
Category lb/day lb/day
Mitigated 5.38 46.41 40.11 0.11
Exhaust PM2.5
PM2.5 Total
Bio- CO2 NBio- CO2 Total CO2 CH4ROG NOx CO SO2 Fugitive PM10
Exhaust PM10
PM10 Total Fugitive PM2.5
4.0 Mobile Detail
4.1 Mitigation Measures Mobile
7 of 8
7.1 Mitigation Measures Water
7.0 Water Detail
0.00 0.00 0.00 0.00Total 15.14 0.00 0.00 0.00
0.00 0.00 0.00 0.00Landscaping 0.00 0.00 0.00 0.00
0.00 0.00 0.00 0.00Consumer Products 11.47
0.00 0.00 0.00 0.00
N2O CO2e
SubCategory lb/day lb/day
Architectural Coating
3.67
Exhaust PM2.5
PM2.5 Total
Bio- CO2 NBio- CO2 Total CO2 CH4
Mitigated
ROG NOx CO SO2 Fugitive PM10
Exhaust PM10
PM10 Total Fugitive PM2.5
0.00 0.00 0.00 0.00Total 15.14 0.00 0.00 0.00
0.00 0.00 0.00 0.00Landscaping 0.00 0.00 0.00 0.00
0.00 0.00 0.00 0.00Consumer Products 11.47
0.00 0.00 0.00 0.00
N2O CO2e
SubCategory lb/day lb/day
Architectural Coating
3.67
Exhaust PM2.5
PM2.5 Total
Bio- CO2 NBio- CO2 Total CO2 CH4
Unmitigated
ROG NOx CO SO2 Fugitive PM10
Exhaust PM10
PM10 Total Fugitive PM2.5
6.2 Area by SubCategory
NA NA NA NA NATotal NA NA NA NA NA
0.00 0.00 0.00 0.00Unmitigated 15.14 0.00 0.00 0.00
0.00 0.00 0.00 0.00Mitigated 15.14 0.00 0.00 0.00
NBio- CO2 Total CO2 CH4 N2O CO2e
Category lb/day lb/day
Exhaust PM10
PM10 Total Fugitive PM2.5
Exhaust PM2.5
PM2.5 Total
Bio- CO2ROG NOx CO SO2 Fugitive PM10
6.0 Area Detail
6.1 Mitigation Measures Area
0.00 0.01 0.00 0.01Total 0.02 0.17 0.14 0.00
0.00 0.01 0.00 0.01Unrefrigerated Warehouse-No Rail
1.69633 0.02 0.17 0.14 0.00
0.00 0.00 0.00 0.00Other Non-Asphalt Surfaces
0 0.00 0.00 0.00 0.00
0.00 0.00 0.00 0.00Other Asphalt Surfaces
0 0.00 0.00 0.00 0.00
Total CO2 CH4 N2O CO2e
Land Use kBTU lb/day lb/day
PM10 Total Fugitive PM2.5
Exhaust PM2.5
PM2.5 Total Bio- CO2 NBio- CO2
Mitigated
NaturalGas Use ROG NOx CO SO2 Fugitive PM10
Exhaust PM10

8 of 8
8.1 Mitigation Measures Waste
9.0 Vegetation
8.0 Waste Detail
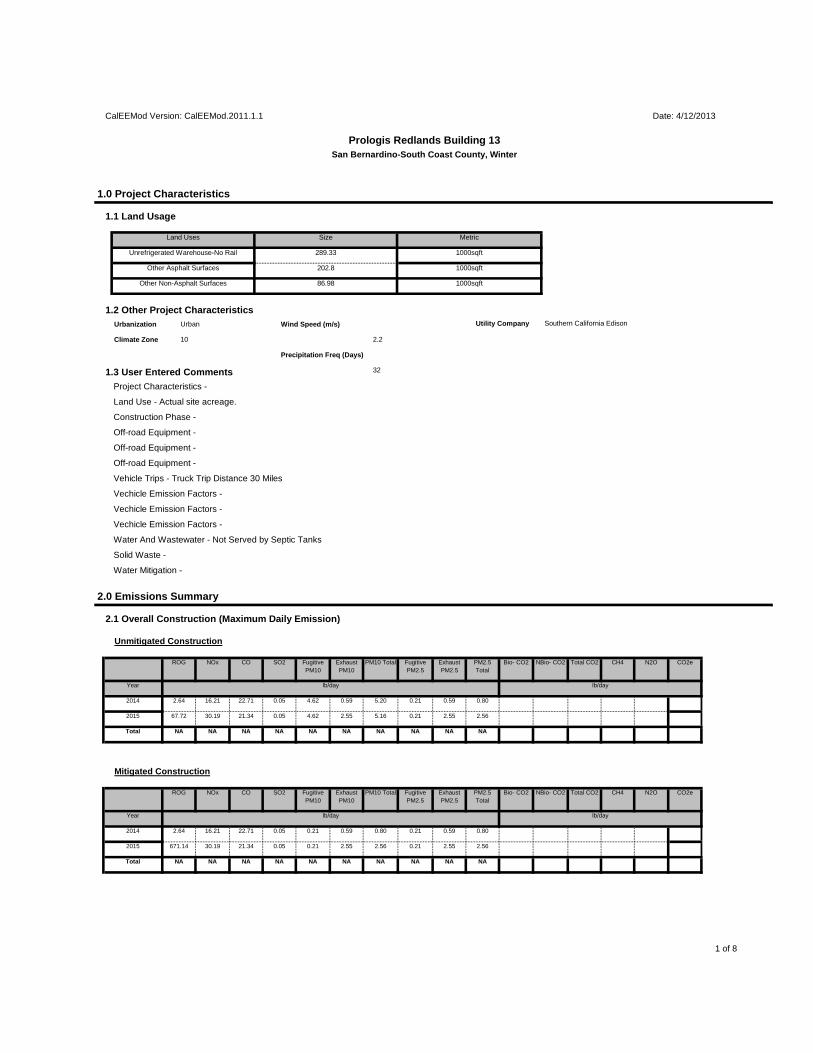
1 of 8
CalEEMod Version: CalEEMod.2011.1.1 Date: 4/12/2013
Prologis Redlands Building 13San Bernardino-South Coast County, Winter
1.0 Project Characteristics
1.1 Land Usage
Land Uses Size Metric
Unrefrigerated Warehouse-No Rail 289.33 1000sqft
Other Asphalt Surfaces 202.8 1000sqft
Southern California EdisonUrbanization Urban Wind Speed (m/s)
Other Non-Asphalt Surfaces 86.98 1000sqft
1.2 Other Project CharacteristicsUtility Company
1.3 User Entered Comments 32
Project Characteristics -
Land Use - Actual site acreage.
Climate Zone 10 2.2
Precipitation Freq (Days)
Vehicle Trips - Truck Trip Distance 30 Miles
Vechicle Emission Factors -
Vechicle Emission Factors -
Vechicle Emission Factors -
Construction Phase -
Off-road Equipment -
Off-road Equipment -
Off-road Equipment -
SO2 Fugitive PM10
Exhaust PM10
Water And Wastewater - Not Served by Septic Tanks
Solid Waste -
Water Mitigation -
2.0 Emissions Summary
Fugitive PM2.5
Exhaust PM2.5
PM2.5 Total
2.1 Overall Construction (Maximum Daily Emission)
Unmitigated Construction
ROG NOx CO N2O CO2e
Year lb/day lb/day
Bio- CO2 NBio- CO2 Total CO2 CH4PM10 Total
0.05 4.62 0.59 5.202014 2.64 16.21 22.71 0.21 0.59 0.80
2015 67.72 30.19 21.34 0.05 4.62 2.55 5.16 0.21 2.55 2.56
Total NA NA NA NA NA NANA NA NA NA
SO2 Fugitive PM10
Exhaust PM10
Fugitive PM2.5
Exhaust PM2.5
PM2.5 Total
Mitigated Construction
ROG NOx CO N2O CO2e
Year lb/day lb/day
Bio- CO2 NBio- CO2 Total CO2 CH4PM10 Total
0.05 0.21 0.59 0.802014 2.64 16.21 22.71 0.21 0.59 0.80
2015 671.14 30.19 21.34 0.05 0.21 2.55 2.56 0.21 2.55 2.56
Total NA NA NA NA NA NANA NA NA NA
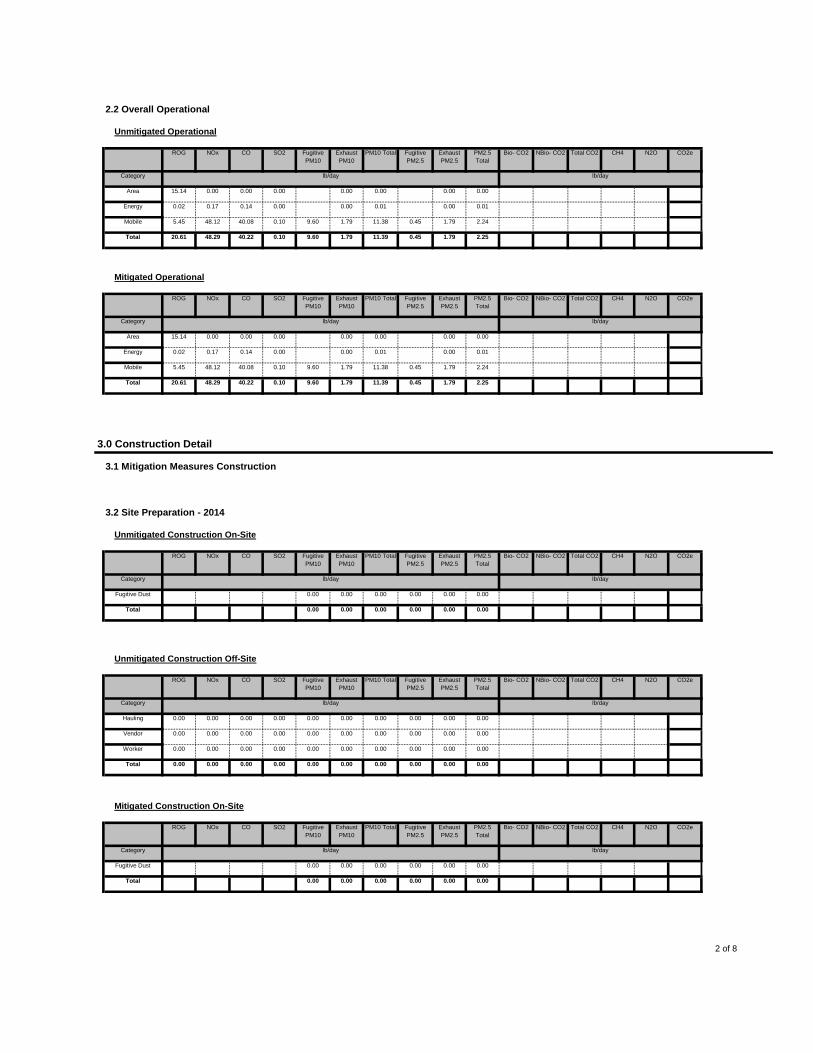
2 of 8
SO2 Fugitive PM10
Exhaust PM10
Fugitive PM2.5
Exhaust PM2.5
PM2.5 Total
2.2 Overall Operational
Unmitigated Operational
ROG NOx CO N2O CO2e
Category lb/day lb/day
Bio- CO2 NBio- CO2 Total CO2 CH4PM10 Total
0.00 0.00 0.00Area 15.14 0.00 0.00 0.00 0.00
Energy 0.02 0.17 0.14 0.00 0.00 0.01 0.00 0.01
0.10 9.60 1.79 11.38Mobile 5.45 48.12 40.08 0.45 1.79 2.24
Total 20.61 48.29 40.22 0.10 9.60 1.79 11.39 0.45
Exhaust PM10
PM10 Total
1.79 2.25
PM2.5 Total
Bio- CO2
Mitigated Operational
ROG NOx CO SO2 Fugitive PM10
CO2e
Category lb/day lb/day
NBio- CO2 Total CO2 CH4 N2OFugitive PM2.5
Exhaust PM2.5
0.00 0.00 0.00Area 15.14 0.00 0.00 0.00 0.00
Energy 0.02 0.17 0.14 0.00 0.00 0.01 0.00 0.01
0.10 9.60 1.79 11.38Mobile 5.45 48.12 40.08 0.45 1.79 2.24
Total 20.61 48.29 40.22 0.10 9.60 1.79 11.39 0.45 1.79 2.25
SO2 Fugitive PM10
Exhaust PM10
3.0 Construction Detail
3.1 Mitigation Measures Construction
Fugitive PM2.5
Exhaust PM2.5
PM2.5 Total
3.2 Site Preparation - 2014
Unmitigated Construction On-Site
ROG NOx CO N2O CO2e
Category lb/day lb/day
Bio- CO2 NBio- CO2 Total CO2 CH4PM10 Total
0.00 0.00 0.00Fugitive Dust 0.00 0.00 0.00
Total 0.00 0.00 0.00 0.00
Exhaust PM10
PM10 Total
0.00 0.00
PM2.5 Total
Bio- CO2
Unmitigated Construction Off-Site
ROG NOx CO SO2 Fugitive PM10
CO2e
Category lb/day lb/day
NBio- CO2 Total CO2 CH4 N2OFugitive PM2.5
Exhaust PM2.5
0.00 0.00 0.00 0.00Hauling 0.00 0.00 0.00 0.00 0.00 0.00
Vendor 0.00 0.00 0.00 0.00 0.00 0.00 0.00 0.00 0.00 0.00
0.00 0.00 0.00 0.00Worker 0.00 0.00 0.00 0.00 0.00 0.00
Total 0.00 0.00 0.00 0.00 0.00 0.00 0.00 0.00
Exhaust PM10
PM10 Total
0.00 0.00
PM2.5 Total
Bio- CO2
Mitigated Construction On-Site
ROG NOx CO SO2 Fugitive PM10
CO2e
Category lb/day lb/day
NBio- CO2 Total CO2 CH4 N2OFugitive PM2.5
Exhaust PM2.5
0.00 0.00 0.00Fugitive Dust 0.00 0.00 0.00
Total 0.00 0.00 0.00 0.00 0.00 0.00
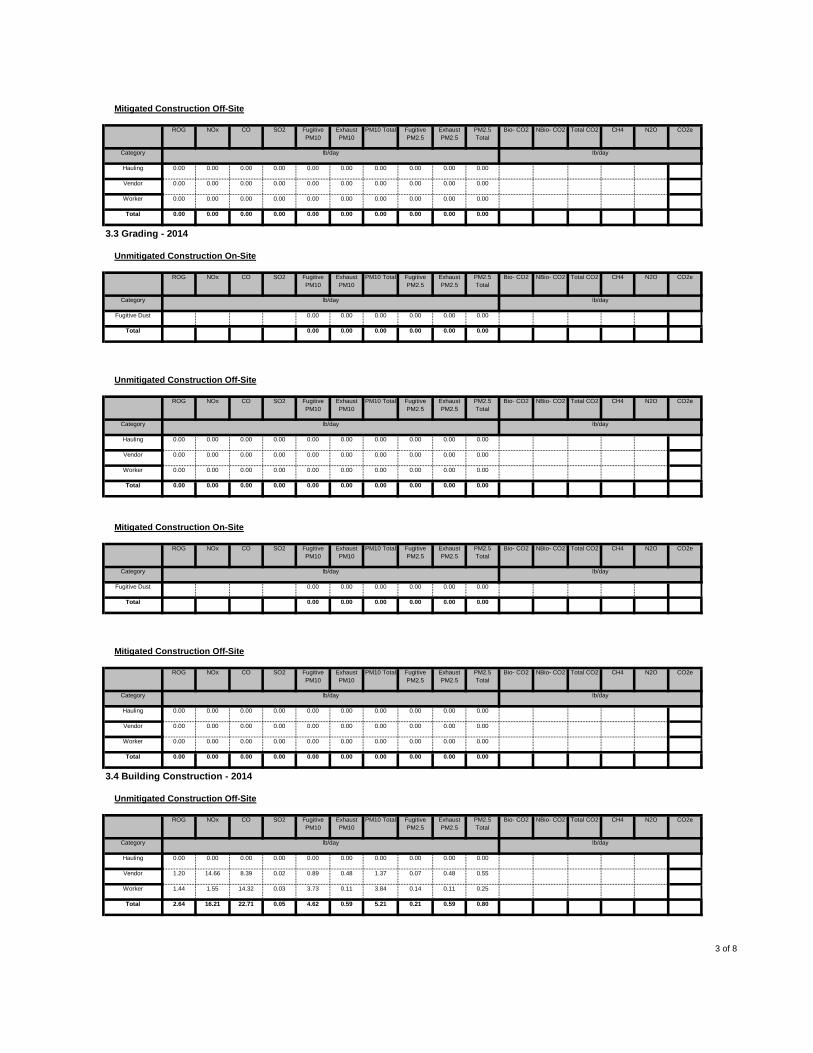
3 of 8
Exhaust PM10
PM10 Total PM2.5 Total
Bio- CO2
Mitigated Construction Off-Site
ROG NOx CO SO2 Fugitive PM10
CO2e
Category lb/day lb/day
NBio- CO2 Total CO2 CH4 N2OFugitive PM2.5
Exhaust PM2.5
0.00 0.00 0.00 0.00Hauling 0.00 0.00 0.00 0.00 0.00 0.00
Vendor 0.00 0.00 0.00 0.00 0.00 0.00 0.00 0.00 0.00 0.00
0.00 0.00 0.00 0.00Worker 0.00 0.00 0.00 0.00 0.00 0.00
Total 0.00 0.00 0.00 0.00 0.00 0.00 0.00 0.00
Exhaust PM10
PM10 Total
0.00 0.00
PM2.5 Total
Bio- CO2
3.3 Grading - 2014
Unmitigated Construction On-Site
ROG NOx CO SO2 Fugitive PM10
CO2e
Category lb/day lb/day
NBio- CO2 Total CO2 CH4 N2OFugitive PM2.5
Exhaust PM2.5
0.00 0.00 0.00Fugitive Dust 0.00 0.00 0.00
Total 0.00 0.00 0.00 0.00
Exhaust PM10
PM10 Total
0.00 0.00
PM2.5 Total
Bio- CO2
Unmitigated Construction Off-Site
ROG NOx CO SO2 Fugitive PM10
CO2e
Category lb/day lb/day
NBio- CO2 Total CO2 CH4 N2OFugitive PM2.5
Exhaust PM2.5
0.00 0.00 0.00 0.00Hauling 0.00 0.00 0.00 0.00 0.00 0.00
Vendor 0.00 0.00 0.00 0.00 0.00 0.00 0.00 0.00 0.00 0.00
0.00 0.00 0.00 0.00Worker 0.00 0.00 0.00 0.00 0.00 0.00
Total 0.00 0.00 0.00 0.00 0.00 0.00 0.00 0.00
Exhaust PM10
PM10 Total
0.00 0.00
PM2.5 Total
Bio- CO2
Mitigated Construction On-Site
ROG NOx CO SO2 Fugitive PM10
CO2e
Category lb/day lb/day
NBio- CO2 Total CO2 CH4 N2OFugitive PM2.5
Exhaust PM2.5
0.00 0.00 0.00Fugitive Dust 0.00 0.00 0.00
Total 0.00 0.00 0.00 0.00
Exhaust PM10
PM10 Total
0.00 0.00
PM2.5 Total
Bio- CO2
Mitigated Construction Off-Site
ROG NOx CO SO2 Fugitive PM10
CO2e
Category lb/day lb/day
NBio- CO2 Total CO2 CH4 N2OFugitive PM2.5
Exhaust PM2.5
0.00 0.00 0.00 0.00Hauling 0.00 0.00 0.00 0.00 0.00 0.00
Vendor 0.00 0.00 0.00 0.00 0.00 0.00 0.00 0.00 0.00 0.00
0.00 0.00 0.00 0.00Worker 0.00 0.00 0.00 0.00 0.00 0.00
Total 0.00 0.00 0.00 0.00 0.00 0.00 0.00 0.00
Exhaust PM10
PM10 Total
0.00 0.00
PM2.5 Total
Bio- CO2
3.4 Building Construction - 2014
Unmitigated Construction Off-Site
ROG NOx CO SO2 Fugitive PM10
CO2e
Category lb/day lb/day
NBio- CO2 Total CO2 CH4 N2OFugitive PM2.5
Exhaust PM2.5
0.00 0.00 0.00 0.00Hauling 0.00 0.00 0.00 0.00 0.00 0.00
Vendor 1.20 14.66 8.39 0.02 0.89 0.48 1.37 0.07 0.48 0.55
0.03 3.73 0.11 3.84Worker 1.44 1.55 14.32 0.14 0.11 0.25
Total 2.64 16.21 22.71 0.05 4.62 0.59 5.21 0.21 0.59 0.80

4 of 8
Exhaust PM10
PM10 Total PM2.5 Total
Bio- CO2
Mitigated Construction Off-Site
ROG NOx CO SO2 Fugitive PM10
CO2e
Category lb/day lb/day
NBio- CO2 Total CO2 CH4 N2OFugitive PM2.5
Exhaust PM2.5
0.00 0.00 0.00 0.00Hauling 0.00 0.00 0.00 0.00 0.00 0.00
Vendor 1.20 14.66 8.39 0.02 0.07 0.48 0.55 0.07 0.48 0.55
0.03 0.14 0.11 0.25Worker 1.44 1.55 14.32 0.14 0.11 0.25
Total 2.64 16.21 22.71 0.05 0.21 0.59 0.80 0.21
Exhaust PM10
PM10 Total
0.59 0.80
PM2.5 Total
Bio- CO2
3.4 Building Construction - 2015
Unmitigated Construction Off-Site
ROG NOx CO SO2 Fugitive PM10
CO2e
Category lb/day lb/day
NBio- CO2 Total CO2 CH4 N2OFugitive PM2.5
Exhaust PM2.5
0.00 0.00 0.00 0.00Hauling 0.00 0.00 0.00 0.00 0.00 0.00
Vendor 1.09 13.33 7.74 0.02 0.89 0.43 1.32 0.07 0.43 0.50
0.03 3.73 0.11 3.84Worker 1.34 1.40 13.06 0.14 0.11 0.25
Total 2.43 14.73 20.80 0.05 4.62 0.54 5.16 0.21
Exhaust PM10
PM10 Total
0.54 0.75
PM2.5 Total
Bio- CO2
Mitigated Construction Off-Site
ROG NOx CO SO2 Fugitive PM10
CO2e
Category lb/day lb/day
NBio- CO2 Total CO2 CH4 N2OFugitive PM2.5
Exhaust PM2.5
0.00 0.00 0.00 0.00Hauling 0.00 0.00 0.00 0.00 0.00 0.00
Vendor 1.09 13.33 7.74 0.02 0.07 0.43 0.50 0.07 0.43 0.50
0.03 0.14 0.11 0.25Worker 1.34 1.40 13.06 0.14 0.11 0.25
Total 2.43 14.73 20.80 0.05 0.21 0.54 0.75 0.21
Exhaust PM10
PM10 Total
0.54 0.75
PM2.5 Total
Bio- CO2
3.5 Paving - 2015
Unmitigated Construction On-Site
ROG NOx CO SO2 Fugitive PM10
CO2e
Category lb/day lb/day
NBio- CO2 Total CO2 CH4 N2OFugitive PM2.5
Exhaust PM2.5
0.03 2.54 2.54Off-Road 4.89 30.10 20.54 2.54 2.54
Paving 0.61 0.00 0.00 0.00 0.00
Total 5.50 30.10 20.54 2.54 2.540.03 2.54 2.54
SO2 Fugitive PM10
Exhaust PM10
Fugitive PM2.5
Exhaust PM2.5
PM2.5 Total
Unmitigated Construction Off-Site
ROG NOx CO N2O CO2e
Category lb/day lb/day
Bio- CO2 NBio- CO2 Total CO2 CH4PM10 Total
0.00 0.00 0.00 0.00Hauling 0.00 0.00 0.00 0.00 0.00 0.00
Vendor 0.00 0.00 0.00 0.00 0.00 0.00 0.00 0.00 0.00 0.00
0.00 0.23 0.01 0.24Worker 0.08 0.09 0.81 0.01 0.01 0.02
Total 0.08 0.09 0.81 0.00 0.23 0.01 0.24 0.01 0.01 0.02
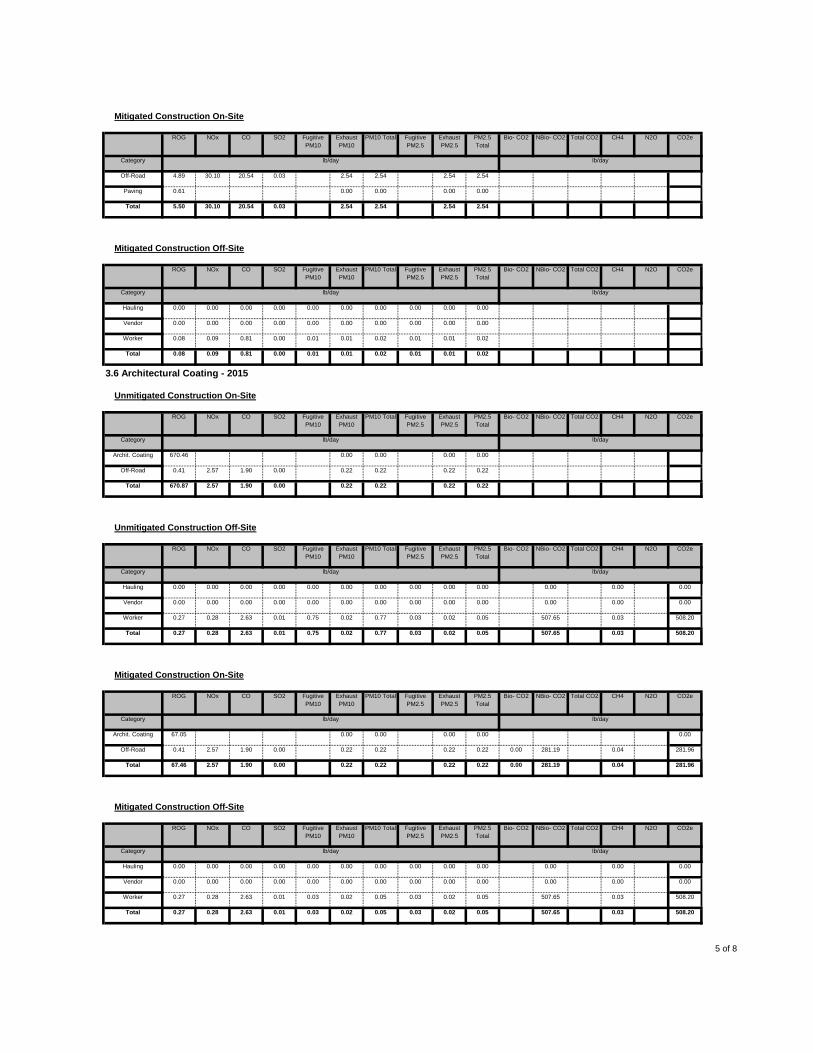
5 of 8
Exhaust PM10
PM10 Total PM2.5 Total
Bio- CO2
Mitigated Construction On-Site
ROG NOx CO SO2 Fugitive PM10
CO2e
Category lb/day lb/day
NBio- CO2 Total CO2 CH4 N2OFugitive PM2.5
Exhaust PM2.5
0.03 2.54 2.54Off-Road 4.89 30.10 20.54 2.54 2.54
Paving 0.61 0.00 0.00 0.00 0.00
Total 5.50 30.10 20.54 2.54 2.540.03 2.54 2.54
SO2 Fugitive PM10
Exhaust PM10
Fugitive PM2.5
Exhaust PM2.5
PM2.5 Total
Mitigated Construction Off-Site
ROG NOx CO N2O CO2e
Category lb/day lb/day
Bio- CO2 NBio- CO2 Total CO2 CH4PM10 Total
0.00 0.00 0.00 0.00Hauling 0.00 0.00 0.00 0.00 0.00 0.00
Vendor 0.00 0.00 0.00 0.00 0.00 0.00 0.00 0.00 0.00 0.00
0.00 0.01 0.01 0.02Worker 0.08 0.09 0.81 0.01 0.01 0.02
Total 0.08 0.09 0.81 0.00 0.01 0.01 0.02 0.01
Exhaust PM10
PM10 Total
0.01 0.02
PM2.5 Total
Bio- CO2
3.6 Architectural Coating - 2015
Unmitigated Construction On-Site
ROG NOx CO SO2 Fugitive PM10
CO2e
Category lb/day lb/day
NBio- CO2 Total CO2 CH4 N2OFugitive PM2.5
Exhaust PM2.5
0.00 0.00Archit. Coating 670.46 0.00 0.00
Off-Road 0.41 2.57 1.90 0.00 0.22 0.22 0.22 0.22
Total 670.87 2.57 1.90 0.22 0.220.00 0.22 0.22
SO2 Fugitive PM10
Exhaust PM10
Fugitive PM2.5
Exhaust PM2.5
PM2.5 Total
Unmitigated Construction Off-Site
ROG NOx CO N2O CO2e
Category lb/day lb/day
Bio- CO2 NBio- CO2 Total CO2 CH4PM10 Total
0.00 0.00 0.00 0.00Hauling 0.00 0.00 0.00 0.00 0.000.00 0.00 0.00 0.00
Vendor 0.00 0.00 0.00 0.00 0.00 0.00 0.00 0.00 0.00 0.000.00 0.00 0.00
0.01 0.75 0.02 0.77Worker 0.27 0.28 2.63 507.65 0.030.03 0.02 0.05 508.20
Total 0.27 0.28 2.63 0.01 0.75 0.02 0.77 0.03
Exhaust PM10
PM10 Total
0.03 508.200.02 0.05 507.65
PM2.5 Total
Bio- CO2
Mitigated Construction On-Site
ROG NOx CO SO2 Fugitive PM10
CO2e
Category lb/day lb/day
NBio- CO2 Total CO2 CH4 N2OFugitive PM2.5
Exhaust PM2.5
0.00 0.00Archit. Coating 67.05 0.00 0.00 0.00
Off-Road 0.41 2.57 1.90 0.00 0.22 0.22 281.960.22 0.22 0.00 281.19
Total 67.46 2.57 1.90
0.04
0.22 0.22 0.000.00 0.22 0.22
SO2 Fugitive PM10
Exhaust PM10
281.19 0.04
Fugitive PM2.5
Exhaust PM2.5
PM2.5 Total
281.96
Mitigated Construction Off-Site
ROG NOx CO N2O CO2e
Category lb/day lb/day
Bio- CO2 NBio- CO2 Total CO2 CH4PM10 Total
0.00 0.00 0.00 0.00Hauling 0.00 0.00 0.00 0.00 0.000.00 0.00 0.00 0.00
Vendor 0.00 0.00 0.00 0.00 0.00 0.00 0.00 0.00 0.00 0.000.00 0.00 0.00
0.01 0.03 0.02 0.05Worker 0.27 0.28 2.63 507.65 0.030.03 0.02 0.05 508.20
Total 0.27 0.28 2.63 0.01 0.03 0.02 0.05 0.03 0.03 508.200.02 0.05 507.65
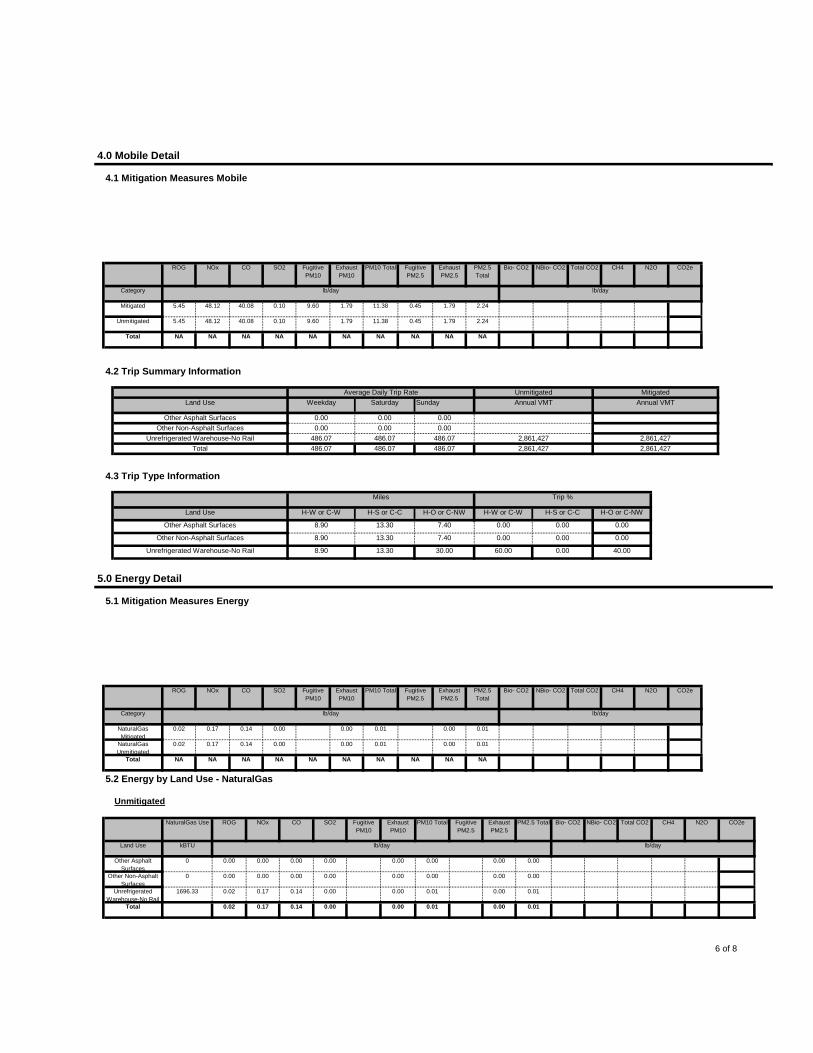
6 of 8
SO2 Fugitive PM10
Exhaust PM10
4.0 Mobile Detail
4.1 Mitigation Measures Mobile
Fugitive PM2.5
Exhaust PM2.5
PM2.5 Total
ROG NOx CO N2O CO2e
Category lb/day lb/day
Bio- CO2 NBio- CO2 Total CO2 CH4PM10 Total
0.10 9.60 1.79 11.38Mitigated 5.45 48.12 40.08 0.45 1.79 2.24
Unmitigated 5.45 48.12 40.08 0.10 9.60 1.79 11.38 0.45 1.79 2.24
NA NA NA NATotal NA NA NA NA NA NA
Land Use Weekday Saturday Sunday
4.2 Trip Summary Information
Average Daily Trip Rate Unmitigated Mitigated
0.00 0.00
Annual VMT Annual VMT
Other Asphalt Surfaces 0.00 0.00 0.00
Unrefrigerated Warehouse-No Rail 486.07 486.07 486.07 2,861,427 2,861,427Other Non-Asphalt Surfaces 0.00
2,861,427 2,861,427
4.3 Trip Type Information
Miles Trip %
Total 486.07 486.07 486.07
H-O or C-NW
Other Asphalt Surfaces 8.90 13.30 7.40 0.00 0.00 0.00
Land Use H-W or C-W
Other Non-Asphalt Surfaces 8.90 13.30 7.40
H-W or C-W H-S or C-CH-S or C-C H-O or C-NW
0.00 0.00 0.00
Unrefrigerated Warehouse-No Rail 8.90 13.30 30.00 60.00 0.00 40.00
Exhaust PM10
PM10 Total
5.0 Energy Detail
5.1 Mitigation Measures Energy
PM2.5 Total
Bio- CO2ROG NOx CO SO2 Fugitive PM10
CO2e
Category lb/day lb/day
NBio- CO2 Total CO2 CH4 N2OFugitive PM2.5
Exhaust PM2.5
0.00 0.00 0.01NaturalGas Mitigated
0.02 0.17 0.14 0.00 0.01
NaturalGas Unmitigated
0.02 0.17 0.14 0.00 0.00 0.01 0.00 0.01
Total NA NA NA NA NA NA
ROG NOx CO SO2 Fugitive PM10
NA NA NA NA
Total CO2Exhaust PM10
PM10 Total Fugitive PM2.5
Exhaust PM2.5
5.2 Energy by Land Use - NaturalGas
Unmitigated
NaturalGas Use CH4 N2O CO2e
Land Use kBTU lb/day lb/day
PM2.5 Total Bio- CO2 NBio- CO2
0.00 0.00 0.00Other Asphalt Surfaces
0 0.00 0.00 0.00 0.00 0.00
Other Non-Asphalt Surfaces
0 0.00 0.00 0.00 0.00 0.00 0.00 0.00 0.00
Unrefrigerated Warehouse-No Rail
1696.33 0.02 0.17 0.14 0.00 0.00 0.01 0.00 0.01
Total 0.02 0.17 0.14 0.00 0.00 0.01 0.00 0.01

7 of 8
NaturalGas Use ROG NOx
Mitigated
PM10 Total Fugitive PM2.5
Exhaust PM2.5
PM2.5 TotalCO SO2 Fugitive PM10
Exhaust PM10
N2O CO2e
Land Use kBTU lb/day lb/day
Bio- CO2 NBio- CO2 Total CO2 CH4
0.00 0.00 0.00Other Asphalt Surfaces
0 0.00 0.00 0.00 0.00 0.00
Other Non-Asphalt Surfaces
0 0.00 0.00 0.00 0.00 0.00 0.00 0.00 0.00
Unrefrigerated Warehouse-No Rail
1.69633 0.02 0.17 0.14 0.00 0.00
0.00
0.01 0.00 0.01
0.00 0.01Total 0.02 0.17 0.14 0.00
6.0 Area Detail
0.01
ROG NOx CO
6.1 Mitigation Measures Area
PM2.5 Total
Bio- CO2SO2 Fugitive PM10
Exhaust PM10
PM10 Total CO2e
Category lb/day lb/day
NBio- CO2 Total CO2 CH4 N2OFugitive PM2.5
Exhaust PM2.5
0.00 0.00 0.00Mitigated 15.14 0.00 0.00 0.00 0.00
Unmitigated 15.14 0.00 0.00 0.00 0.00 0.00 0.00 0.00
Total NA NA NA NA NA NANA NA NA NA
SO2 Fugitive PM10
Exhaust PM10
Fugitive PM2.5
Exhaust PM2.5
PM2.5 Total
6.2 Area by SubCategory
Unmitigated
ROG NOx CO N2O CO2e
SubCategory lb/day lb/day
Bio- CO2 NBio- CO2 Total CO2 CH4PM10 Total
0.00 0.00Architectural Coating
3.67 0.00 0.00
Consumer Products 11.47 0.00 0.00 0.00 0.00
0.00 0.00 0.00Landscaping 0.00 0.00 0.00 0.00 0.00
Total 15.14 0.00 0.00 0.00 0.00 0.00
Exhaust PM10
PM10 Total
0.00 0.00
PM2.5 Total
Bio- CO2
Mitigated
ROG NOx CO SO2 Fugitive PM10
CO2e
SubCategory lb/day lb/day
NBio- CO2 Total CO2 CH4 N2OFugitive PM2.5
Exhaust PM2.5
0.00 0.00Architectural Coating
3.67 0.00 0.00
Consumer Products 11.47 0.00 0.00 0.00 0.00
0.00 0.00 0.00Landscaping 0.00 0.00 0.00
0.00
0.00 0.00
Total 15.14 0.00 0.00 0.00 0.00
7.0 Water Detail
7.1 Mitigation Measures Water
0.00 0.00

8 of 8
9.0 Vegetation
8.0 Waste Detail
8.1 Mitigation Measures Waste
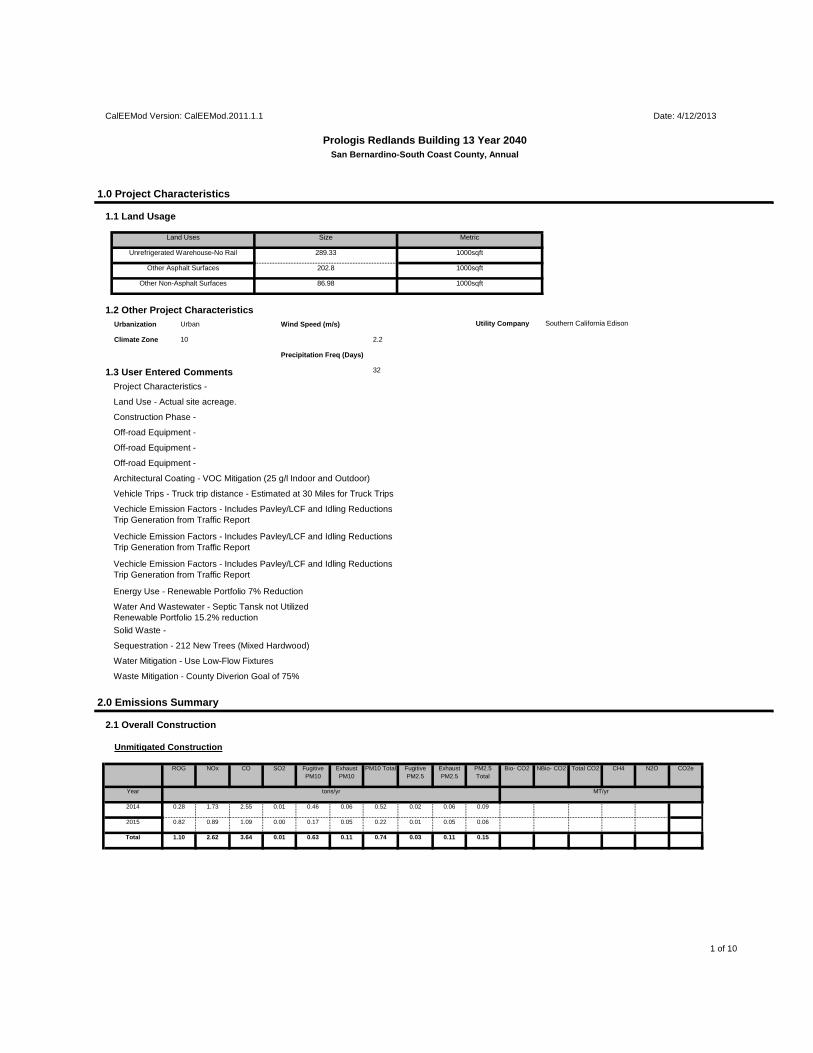
1 of 10
0.11 0.74 0.03 0.11 0.15Total 1.10 2.62 3.64 0.01 0.63
0.17 0.05 0.22 0.01 0.05 0.062015 0.82 0.89 1.09 0.00
0.06 0.52 0.02 0.06 0.092014 0.28 1.73 2.55 0.01 0.46
Total CO2 CH4 N2O CO2e
Year tons/yr MT/yr
PM10 Total Fugitive PM2.5
Exhaust PM2.5
PM2.5 Total
Bio- CO2 NBio- CO2
2.1 Overall Construction
Unmitigated Construction
ROG NOx CO SO2 Fugitive PM10
Exhaust PM10
Water And Wastewater - Septic Tansk not UtilizedRenewable Portfolio 15.2% reductionSolid Waste -
Sequestration - 212 New Trees (Mixed Hardwood)
Water Mitigation - Use Low-Flow Fixtures
Waste Mitigation - County Diverion Goal of 75%
2.0 Emissions Summary
Architectural Coating - VOC Mitigation (25 g/l Indoor and Outdoor)
Vehicle Trips - Truck trip distance - Estimated at 30 Miles for Truck Trips
Vechicle Emission Factors - Includes Pavley/LCF and Idling ReductionsTrip Generation from Traffic Report
Vechicle Emission Factors - Includes Pavley/LCF and Idling ReductionsTrip Generation from Traffic Report
Vechicle Emission Factors - Includes Pavley/LCF and Idling ReductionsTrip Generation from Traffic Report
Energy Use - Renewable Portfolio 7% Reduction
Project Characteristics -
Land Use - Actual site acreage.
Construction Phase -
Off-road Equipment -
Off-road Equipment -
Off-road Equipment -
Climate Zone 10 2.2
Precipitation Freq (Days)
1.3 User Entered Comments 32
1.2 Other Project CharacteristicsUtility Company Southern California EdisonUrbanization Urban Wind Speed (m/s)
Other Asphalt Surfaces 202.8 1000sqft
Other Non-Asphalt Surfaces 86.98 1000sqft
1.1 Land Usage
Land Uses Size Metric
Unrefrigerated Warehouse-No Rail 289.33 1000sqft
CalEEMod Version: CalEEMod.2011.1.1 Date: 4/12/2013
Prologis Redlands Building 13 Year 2040San Bernardino-South Coast County, Annual
1.0 Project Characteristics
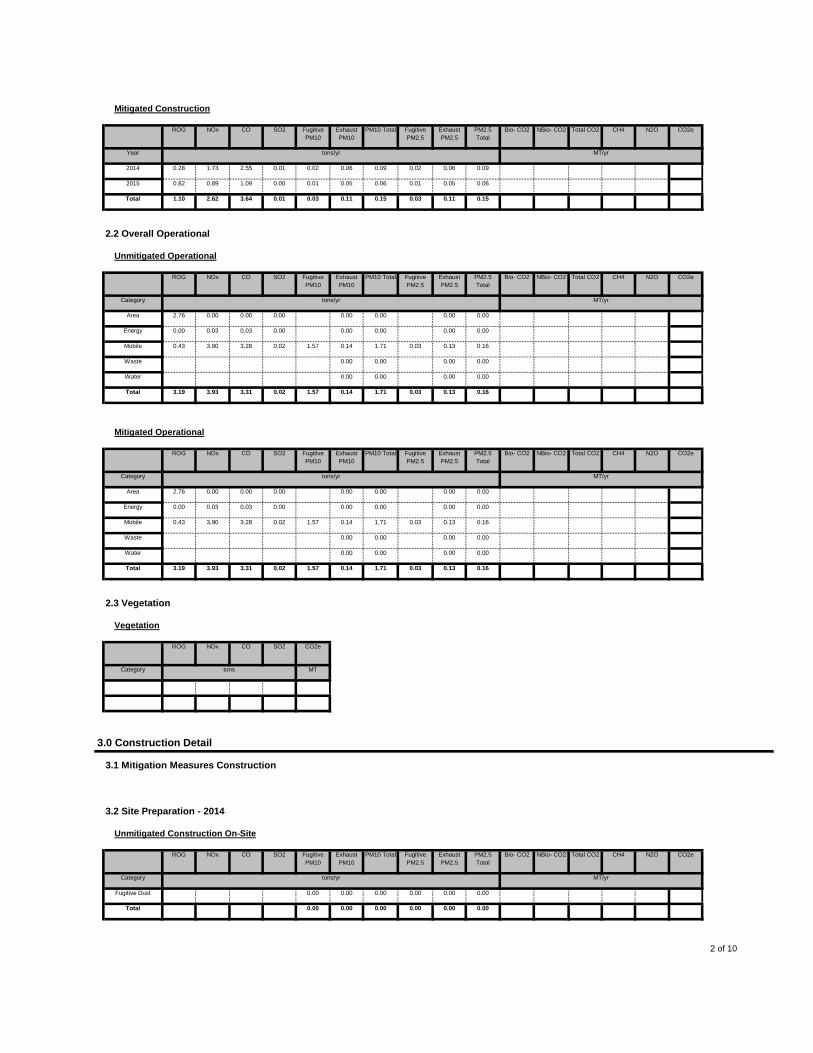
2 of 10
0.00 0.00 0.00 0.00 0.00 0.00Total
0.00 0.00 0.00 0.00 0.00Fugitive Dust 0.00
NBio- CO2 Total CO2 CH4 N2O CO2e
Category tons/yr MT/yr
Exhaust PM10
PM10 Total Fugitive PM2.5
Exhaust PM2.5
PM2.5 Total
Bio- CO2ROG NOx CO SO2 Fugitive PM10
3.0 Construction Detail
3.1 Mitigation Measures Construction
3.2 Site Preparation - 2014
Unmitigated Construction On-Site
Category tons MT
2.3 Vegetation
Vegetation
ROG NOx CO SO2 CO2e
1.57 0.14 1.71 0.03 0.13 0.16Total 3.19 3.93 3.31 0.02
0.00 0.00 0.00 0.00Water
0.00 0.00 0.00 0.00Waste
0.14 1.71 0.03 0.13 0.16Mobile 0.43 3.90 3.28 0.02 1.57
0.00 0.00 0.00 0.00Energy 0.00 0.03 0.03 0.00
0.00 0.00 0.00 0.00Area 2.76 0.00 0.00 0.00
CH4 N2O CO2e
Category tons/yr MT/yr
Fugitive PM2.5
Exhaust PM2.5
PM2.5 Total
Bio- CO2 NBio- CO2 Total CO2
Mitigated Operational
ROG NOx CO SO2 Fugitive PM10
Exhaust PM10
PM10 Total
1.57 0.14 1.71 0.03 0.13 0.16Total 3.19 3.93 3.31 0.02
0.00 0.00 0.00 0.00Water
0.00 0.00 0.00 0.00Waste
0.14 1.71 0.03 0.13 0.16Mobile 0.43 3.90 3.28 0.02 1.57
0.00 0.00 0.00 0.00Energy 0.00 0.03 0.03 0.00
0.00 0.00 0.00 0.00Area 2.76 0.00 0.00 0.00
CH4 N2O CO2e
Category tons/yr MT/yr
Fugitive PM2.5
Exhaust PM2.5
PM2.5 Total
Bio- CO2 NBio- CO2 Total CO2
2.2 Overall Operational
Unmitigated Operational
ROG NOx CO SO2 Fugitive PM10
Exhaust PM10
PM10 Total
0.03 0.11 0.15 0.03 0.11 0.15Total 1.10 2.62 3.64 0.01
0.05 0.06 0.01 0.05 0.062015 0.82 0.89 1.09 0.00 0.01
0.02 0.06 0.09 0.02 0.06 0.09
N2O CO2e
Year tons/yr MT/yr
2014 0.28 1.73 2.55 0.01
Exhaust PM2.5
PM2.5 Total
Bio- CO2 NBio- CO2 Total CO2 CH4
Mitigated Construction
ROG NOx CO SO2 Fugitive PM10
Exhaust PM10
PM10 Total Fugitive PM2.5
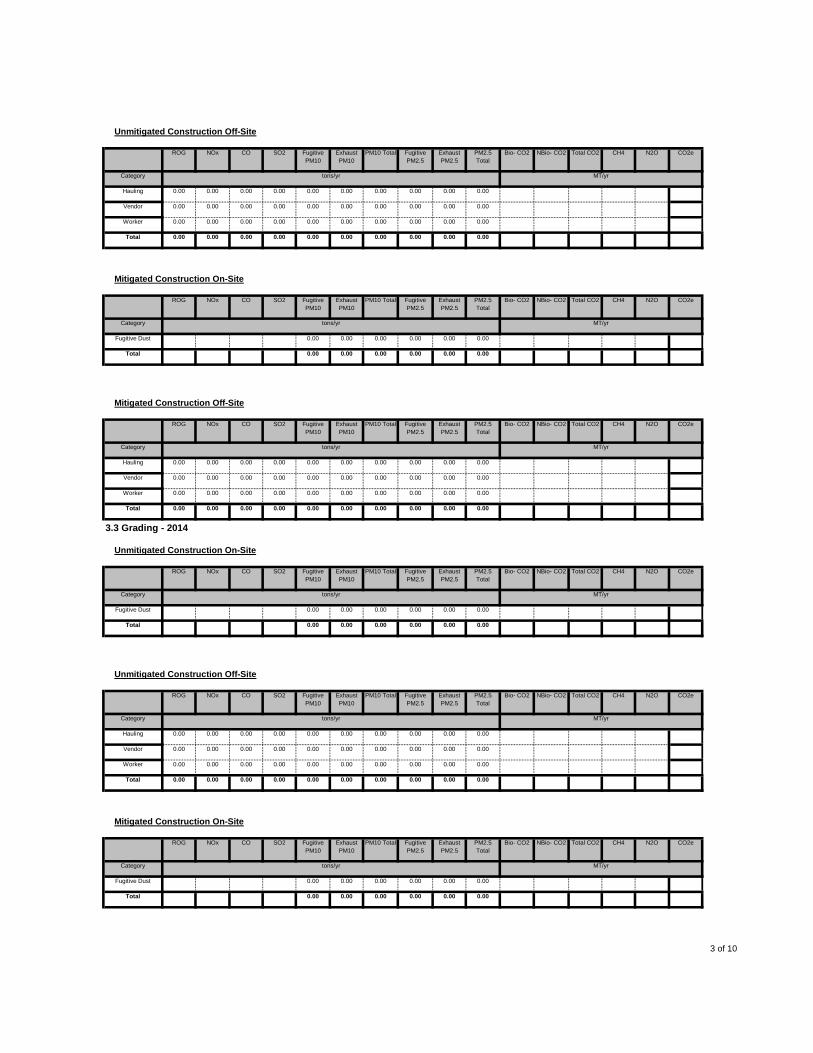
3 of 10
0.00 0.00 0.00 0.00 0.00 0.00Total
0.00 0.00 0.00 0.00 0.00Fugitive Dust 0.00
CH4 N2O CO2e
Category tons/yr MT/yr
Fugitive PM2.5
Exhaust PM2.5
PM2.5 Total
Bio- CO2 NBio- CO2 Total CO2
Mitigated Construction On-Site
ROG NOx CO SO2 Fugitive PM10
Exhaust PM10
PM10 Total
0.00 0.00 0.00 0.00 0.00 0.00Total 0.00 0.00 0.00 0.00
0.00 0.00 0.00 0.00 0.00Worker 0.00 0.00 0.00 0.00 0.00
0.00 0.00 0.00 0.00 0.00 0.00Vendor 0.00 0.00 0.00 0.00
0.00 0.00 0.00 0.00 0.00Hauling 0.00 0.00 0.00 0.00 0.00
CH4 N2O CO2e
Category tons/yr MT/yr
Fugitive PM2.5
Exhaust PM2.5
PM2.5 Total
Bio- CO2 NBio- CO2 Total CO2
Unmitigated Construction Off-Site
ROG NOx CO SO2 Fugitive PM10
Exhaust PM10
PM10 Total
0.00 0.00 0.00 0.00 0.00 0.00Total
0.00 0.00 0.00 0.00 0.00Fugitive Dust 0.00
CH4 N2O CO2e
Category tons/yr MT/yr
Fugitive PM2.5
Exhaust PM2.5
PM2.5 Total
Bio- CO2 NBio- CO2 Total CO2
3.3 Grading - 2014
Unmitigated Construction On-Site
ROG NOx CO SO2 Fugitive PM10
Exhaust PM10
PM10 Total
0.00 0.00 0.00 0.00 0.00 0.00Total 0.00 0.00 0.00 0.00
0.00 0.00 0.00 0.00 0.00Worker 0.00 0.00 0.00 0.00 0.00
0.00 0.00 0.00 0.00 0.00 0.00Vendor 0.00 0.00 0.00 0.00
0.00 0.00 0.00 0.00 0.00Hauling 0.00 0.00 0.00 0.00 0.00
CH4 N2O CO2e
Category tons/yr MT/yr
Fugitive PM2.5
Exhaust PM2.5
PM2.5 Total
Bio- CO2 NBio- CO2 Total CO2
Mitigated Construction Off-Site
ROG NOx CO SO2 Fugitive PM10
Exhaust PM10
PM10 Total
0.00 0.00 0.00 0.00 0.00 0.00Total
0.00 0.00 0.00 0.00 0.00Fugitive Dust 0.00
CH4 N2O CO2e
Category tons/yr MT/yr
Fugitive PM2.5
Exhaust PM2.5
PM2.5 Total
Bio- CO2 NBio- CO2 Total CO2
Mitigated Construction On-Site
ROG NOx CO SO2 Fugitive PM10
Exhaust PM10
PM10 Total
0.00 0.00 0.00 0.00 0.00 0.00Total 0.00 0.00 0.00 0.00
0.00 0.00 0.00 0.00 0.00Worker 0.00 0.00 0.00 0.00 0.00
0.00 0.00 0.00 0.00 0.00 0.00Vendor 0.00 0.00 0.00 0.00
0.00 0.00 0.00 0.00 0.00Hauling 0.00 0.00 0.00 0.00 0.00
CH4 N2O CO2e
Category tons/yr MT/yr
Fugitive PM2.5
Exhaust PM2.5
PM2.5 Total
Bio- CO2 NBio- CO2 Total CO2
Unmitigated Construction Off-Site
ROG NOx CO SO2 Fugitive PM10
Exhaust PM10
PM10 Total
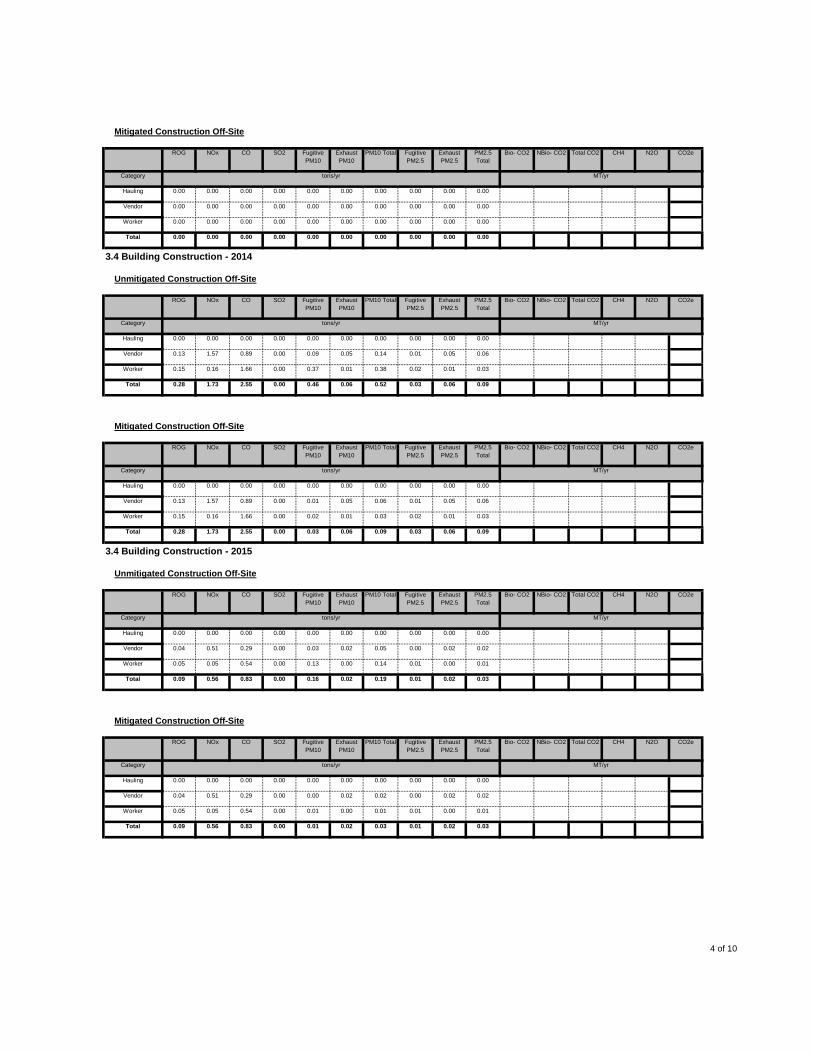
4 of 10
0.01 0.02 0.03 0.01 0.02 0.03Total 0.09 0.56 0.83 0.00
0.00 0.01 0.01 0.00 0.01Worker 0.05 0.05 0.54 0.00 0.01
0.00 0.02 0.02 0.00 0.02 0.02Vendor 0.04 0.51 0.29 0.00
0.00 0.00 0.00 0.00 0.00Hauling 0.00 0.00 0.00 0.00 0.00
CH4 N2O CO2e
Category tons/yr MT/yr
Fugitive PM2.5
Exhaust PM2.5
PM2.5 Total
Bio- CO2 NBio- CO2 Total CO2
Mitigated Construction Off-Site
ROG NOx CO SO2 Fugitive PM10
Exhaust PM10
PM10 Total
0.16 0.02 0.19 0.01 0.02 0.03Total 0.09 0.56 0.83 0.00
0.00 0.14 0.01 0.00 0.01Worker 0.05 0.05 0.54 0.00 0.13
0.03 0.02 0.05 0.00 0.02 0.02Vendor 0.04 0.51 0.29 0.00
0.00 0.00 0.00 0.00 0.00Hauling 0.00 0.00 0.00 0.00 0.00
CH4 N2O CO2e
Category tons/yr MT/yr
Fugitive PM2.5
Exhaust PM2.5
PM2.5 Total
Bio- CO2 NBio- CO2 Total CO2
3.4 Building Construction - 2015
Unmitigated Construction Off-Site
ROG NOx CO SO2 Fugitive PM10
Exhaust PM10
PM10 Total
0.03 0.06 0.09 0.03 0.06 0.09Total 0.28 1.73 2.55 0.00
0.01 0.03 0.02 0.01 0.03Worker 0.15 0.16 1.66 0.00 0.02
0.01 0.05 0.06 0.01 0.05 0.06Vendor 0.13 1.57 0.89 0.00
0.00 0.00 0.00 0.00 0.00Hauling 0.00 0.00 0.00 0.00 0.00
CH4 N2O CO2e
Category tons/yr MT/yr
Fugitive PM2.5
Exhaust PM2.5
PM2.5 Total
Bio- CO2 NBio- CO2 Total CO2
Mitigated Construction Off-Site
ROG NOx CO SO2 Fugitive PM10
Exhaust PM10
PM10 Total
0.46 0.06 0.52 0.03 0.06 0.09Total 0.28 1.73 2.55 0.00
0.01 0.38 0.02 0.01 0.03Worker 0.15 0.16 1.66 0.00 0.37
0.09 0.05 0.14 0.01 0.05 0.06Vendor 0.13 1.57 0.89 0.00
0.00 0.00 0.00 0.00 0.00Hauling 0.00 0.00 0.00 0.00 0.00
CH4 N2O CO2e
Category tons/yr MT/yr
Fugitive PM2.5
Exhaust PM2.5
PM2.5 Total
Bio- CO2 NBio- CO2 Total CO2
3.4 Building Construction - 2014
Unmitigated Construction Off-Site
ROG NOx CO SO2 Fugitive PM10
Exhaust PM10
PM10 Total
0.00 0.00 0.00 0.00 0.00 0.00Total 0.00 0.00 0.00 0.00
0.00 0.00 0.00 0.00 0.00Worker 0.00 0.00 0.00 0.00 0.00
0.00 0.00 0.00 0.00 0.00 0.00Vendor 0.00 0.00 0.00 0.00
0.00 0.00 0.00 0.00 0.00Hauling 0.00 0.00 0.00 0.00 0.00
CH4 N2O CO2e
Category tons/yr MT/yr
Fugitive PM2.5
Exhaust PM2.5
PM2.5 Total
Bio- CO2 NBio- CO2 Total CO2
Mitigated Construction Off-Site
ROG NOx CO SO2 Fugitive PM10
Exhaust PM10
PM10 Total
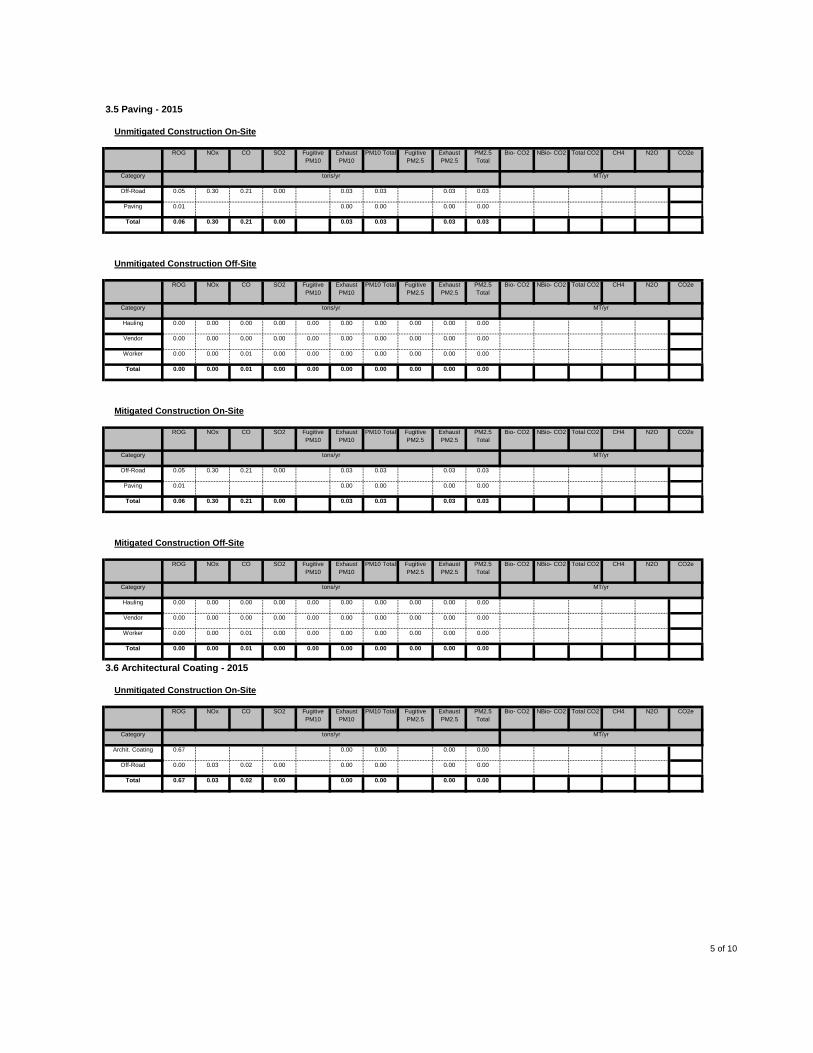
5 of 10
0.00 0.00 0.00 0.00Total 0.67 0.03 0.02 0.00
0.00 0.00 0.00 0.00Off-Road 0.00 0.03 0.02 0.00
0.00 0.00 0.00 0.00Archit. Coating 0.67
CH4 N2O CO2e
Category tons/yr MT/yr
Fugitive PM2.5
Exhaust PM2.5
PM2.5 Total
Bio- CO2 NBio- CO2 Total CO2
3.6 Architectural Coating - 2015
Unmitigated Construction On-Site
ROG NOx CO SO2 Fugitive PM10
Exhaust PM10
PM10 Total
0.00 0.00 0.00 0.00 0.00 0.00Total 0.00 0.00 0.01 0.00
0.00 0.00 0.00 0.00 0.00Worker 0.00 0.00 0.01 0.00 0.00
0.00 0.00 0.00 0.00 0.00 0.00Vendor 0.00 0.00 0.00 0.00
0.00 0.00 0.00 0.00 0.00Hauling 0.00 0.00 0.00 0.00 0.00
CH4 N2O CO2e
Category tons/yr MT/yr
Fugitive PM2.5
Exhaust PM2.5
PM2.5 Total
Bio- CO2 NBio- CO2 Total CO2
Mitigated Construction Off-Site
ROG NOx CO SO2 Fugitive PM10
Exhaust PM10
PM10 Total
0.03 0.03 0.03 0.03Total 0.06 0.30 0.21 0.00
0.00 0.00 0.00 0.00Paving 0.01
0.03 0.03 0.03 0.03
N2O CO2e
Category tons/yr MT/yr
Off-Road 0.05 0.30 0.21 0.00
Exhaust PM2.5
PM2.5 Total
Bio- CO2 NBio- CO2 Total CO2 CH4
Mitigated Construction On-Site
ROG NOx CO SO2 Fugitive PM10
Exhaust PM10
PM10 Total Fugitive PM2.5
0.00 0.00 0.00 0.00 0.00Total 0.00 0.00 0.01 0.00 0.00
0.00 0.00 0.00 0.00 0.00 0.00Worker 0.00 0.00 0.01 0.00
0.00 0.00 0.00 0.00 0.00Vendor 0.00 0.00 0.00 0.00 0.00
0.00 0.00 0.00 0.00 0.00 0.00
N2O CO2e
Category tons/yr MT/yr
Hauling 0.00 0.00 0.00 0.00
Exhaust PM2.5
PM2.5 Total
Bio- CO2 NBio- CO2 Total CO2 CH4
Unmitigated Construction Off-Site
ROG NOx CO SO2 Fugitive PM10
Exhaust PM10
PM10 Total Fugitive PM2.5
0.03 0.03 0.03 0.03Total 0.06 0.30 0.21 0.00
0.00 0.00 0.00 0.00Paving 0.01
0.03 0.03 0.03 0.03Off-Road 0.05 0.30 0.21 0.00
CH4 N2O CO2e
Category tons/yr MT/yr
Fugitive PM2.5
Exhaust PM2.5
PM2.5 Total
Bio- CO2 NBio- CO2 Total CO2
3.5 Paving - 2015
Unmitigated Construction On-Site
ROG NOx CO SO2 Fugitive PM10
Exhaust PM10
PM10 Total
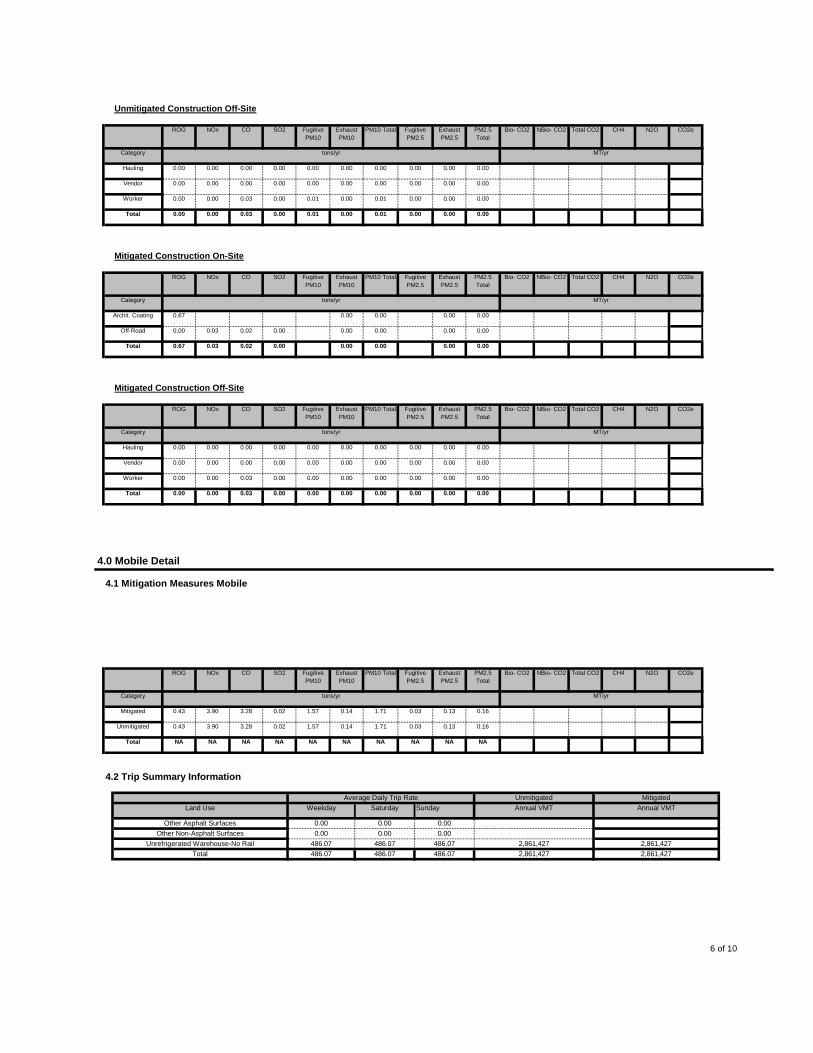
6 of 10
Total 486.07 486.07 486.07 2,861,427 2,861,427Unrefrigerated Warehouse-No Rail 486.07 486.07 486.07 2,861,427 2,861,427
Other Non-Asphalt Surfaces 0.00 0.00 0.00
Annual VMT
Other Asphalt Surfaces 0.00 0.00 0.00
4.2 Trip Summary Information
Average Daily Trip Rate Unmitigated MitigatedLand Use Weekday Saturday Sunday Annual VMT
NA NA NA NA NA NATotal NA NA NA NA
0.14 1.71 0.03 0.13 0.16Unmitigated 0.43 3.90 3.28 0.02 1.57
1.57 0.14 1.71 0.03 0.13 0.16
N2O CO2e
Category tons/yr MT/yr
Mitigated 0.43 3.90 3.28 0.02
Exhaust PM2.5
PM2.5 Total
Bio- CO2 NBio- CO2 Total CO2 CH4ROG NOx CO SO2 Fugitive PM10
Exhaust PM10
PM10 Total Fugitive PM2.5
4.0 Mobile Detail
4.1 Mitigation Measures Mobile
0.00 0.00 0.00 0.00 0.00 0.00Total 0.00 0.00 0.03 0.00
0.00 0.00 0.00 0.00 0.00Worker 0.00 0.00 0.03 0.00 0.00
0.00 0.00 0.00 0.00 0.00 0.00Vendor 0.00 0.00 0.00 0.00
0.00 0.00 0.00 0.00 0.00Hauling 0.00 0.00 0.00 0.00 0.00
CH4 N2O CO2e
Category tons/yr MT/yr
Fugitive PM2.5
Exhaust PM2.5
PM2.5 Total
Bio- CO2 NBio- CO2 Total CO2
Mitigated Construction Off-Site
ROG NOx CO SO2 Fugitive PM10
Exhaust PM10
PM10 Total
0.00 0.00 0.00 0.00Total 0.67 0.03 0.02 0.00
0.00 0.00 0.00 0.00Off-Road 0.00 0.03 0.02 0.00
0.00 0.00 0.00 0.00
N2O CO2e
Category tons/yr MT/yr
Archit. Coating 0.67
Exhaust PM2.5
PM2.5 Total
Bio- CO2 NBio- CO2 Total CO2 CH4
Mitigated Construction On-Site
ROG NOx CO SO2 Fugitive PM10
Exhaust PM10
PM10 Total Fugitive PM2.5
0.00 0.01 0.00 0.00 0.00Total 0.00 0.00 0.03 0.00 0.01
0.01 0.00 0.01 0.00 0.00 0.00Worker 0.00 0.00 0.03 0.00
0.00 0.00 0.00 0.00 0.00Vendor 0.00 0.00 0.00 0.00 0.00
0.00 0.00 0.00 0.00 0.00 0.00
N2O CO2e
Category tons/yr MT/yr
Hauling 0.00 0.00 0.00 0.00
Exhaust PM2.5
PM2.5 Total
Bio- CO2 NBio- CO2 Total CO2 CH4
Unmitigated Construction Off-Site
ROG NOx CO SO2 Fugitive PM10
Exhaust PM10
PM10 Total Fugitive PM2.5
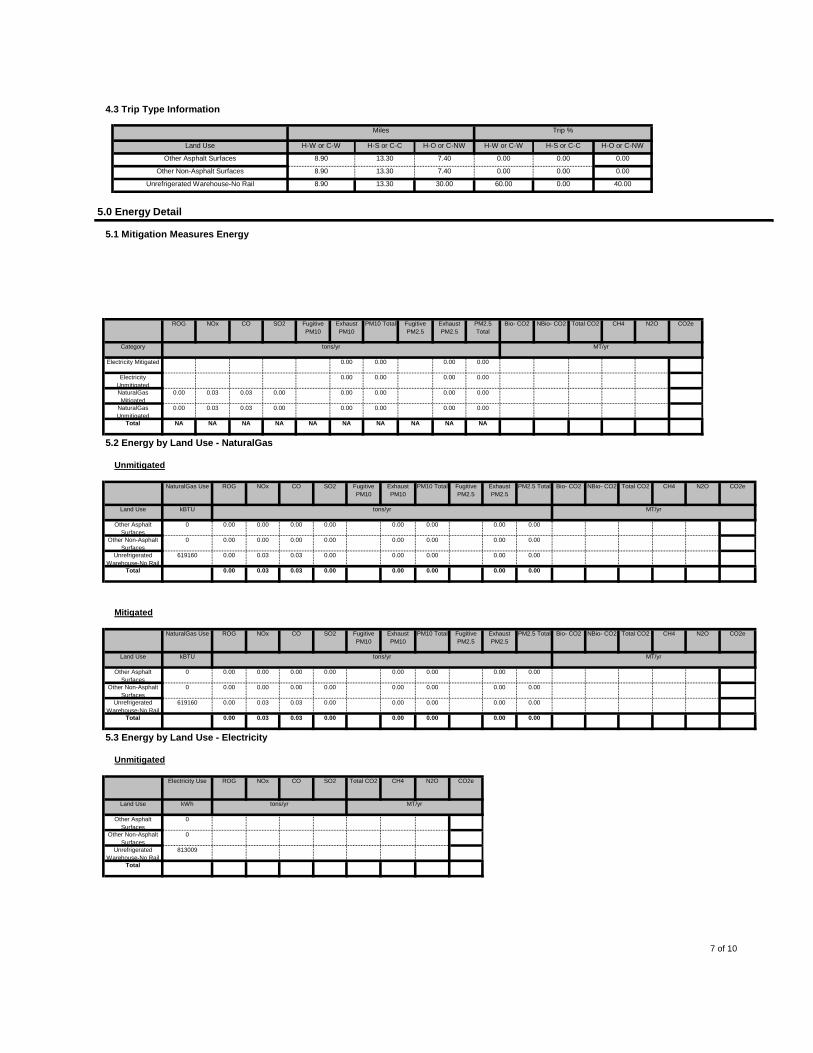
7 of 10
Total
Unrefrigerated Warehouse-No Rail
813009
Other Non-Asphalt Surfaces
0
Other Asphalt Surfaces
0
N2O CO2e
Land Use kWh tons/yr MT/yr
5.3 Energy by Land Use - Electricity
Unmitigated
Electricity Use ROG NOx CO SO2 Total CO2 CH4
0.00 0.00 0.00 0.00Total 0.00 0.03 0.03 0.00
0.00 0.00 0.00 0.00Unrefrigerated Warehouse-No Rail
619160 0.00 0.03 0.03 0.00
0.00 0.00 0.00 0.00Other Non-Asphalt Surfaces
0 0.00 0.00 0.00 0.00
0.00 0.00 0.00 0.00Other Asphalt Surfaces
0 0.00 0.00 0.00 0.00
Total CO2 CH4 N2O CO2e
Land Use kBTU tons/yr MT/yr
PM10 Total Fugitive PM2.5
Exhaust PM2.5
PM2.5 Total Bio- CO2 NBio- CO2
Mitigated
NaturalGas Use ROG NOx CO SO2 Fugitive PM10
Exhaust PM10
0.00 0.00 0.00 0.00Total 0.00 0.03 0.03 0.00
0.00 0.00 0.00 0.00Unrefrigerated Warehouse-No Rail
619160 0.00 0.03 0.03 0.00
0.00 0.00 0.00 0.00Other Non-Asphalt Surfaces
0 0.00 0.00 0.00 0.00
0.00 0.00 0.00 0.00Other Asphalt Surfaces
0 0.00 0.00 0.00 0.00
CH4 N2O CO2e
Land Use kBTU tons/yr MT/yr
Fugitive PM2.5
Exhaust PM2.5
PM2.5 Total Bio- CO2 NBio- CO2 Total CO2
Unmitigated
NaturalGas Use ROG NOx CO SO2 Fugitive PM10
Exhaust PM10
PM10 Total
5.2 Energy by Land Use - NaturalGas
NA NA NA NA NATotal NA NA NA NA NA
0.00 0.00 0.00 0.00NaturalGas Unmitigated
0.00 0.03 0.03 0.00
0.00 0.00 0.00 0.00NaturalGas Mitigated
0.00 0.03 0.03 0.00
0.00 0.00 0.00 0.00Electricity Unmitigated
0.00 0.00 0.00 0.00Electricity Mitigated
NBio- CO2 Total CO2 CH4 N2O CO2e
Category tons/yr MT/yr
Exhaust PM10
PM10 Total Fugitive PM2.5
Exhaust PM2.5
PM2.5 Total
Bio- CO2ROG NOx CO SO2 Fugitive PM10
5.0 Energy Detail
5.1 Mitigation Measures Energy
0.00
Unrefrigerated Warehouse-No Rail 8.90 13.30 30.00 60.00 0.00 40.00
Other Non-Asphalt Surfaces 8.90 13.30 7.40 0.00 0.00
H-O or C-NW
Other Asphalt Surfaces 8.90 13.30 7.40 0.00 0.00 0.00
4.3 Trip Type Information
Miles Trip %
Land Use H-W or C-W H-S or C-C H-O or C-NW H-W or C-W H-S or C-C
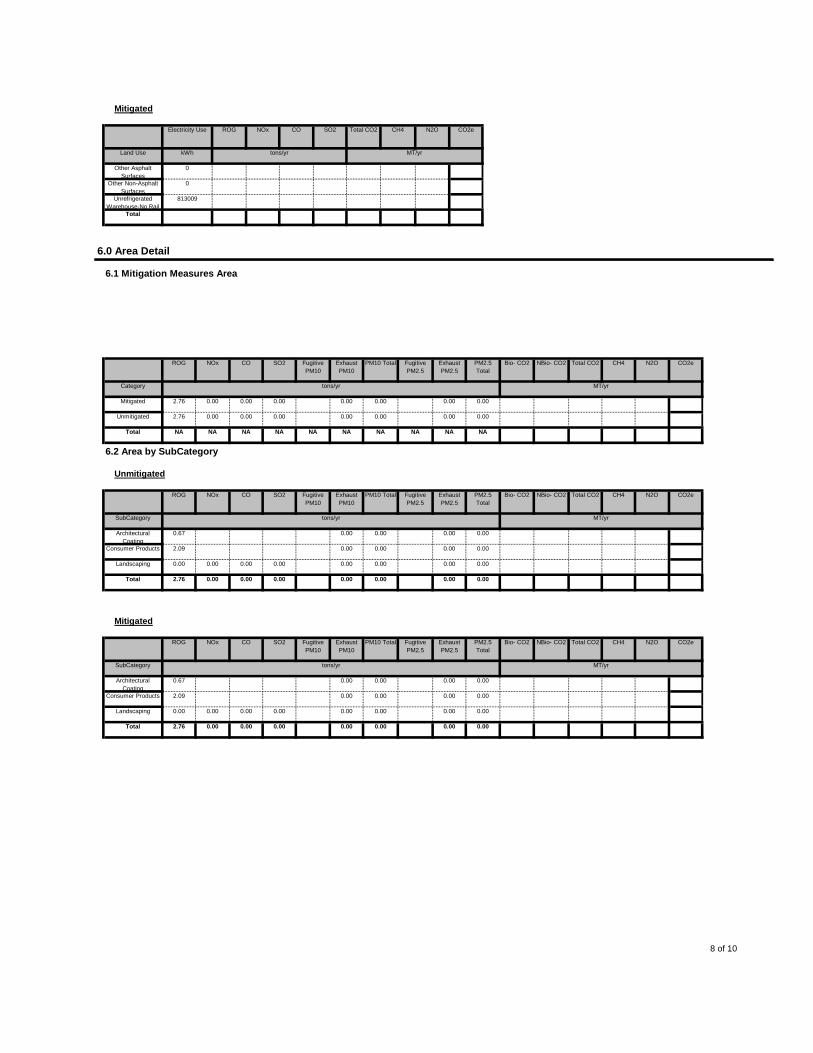
8 of 10
0.00 0.00 0.00 0.00Total 2.76 0.00 0.00 0.00
0.00 0.00 0.00 0.00Landscaping 0.00 0.00 0.00 0.00
0.00 0.00 0.00 0.00Consumer Products 2.09
0.00 0.00 0.00 0.00
N2O CO2e
SubCategory tons/yr MT/yr
Architectural Coating
0.67
Exhaust PM2.5
PM2.5 Total
Bio- CO2 NBio- CO2 Total CO2 CH4
Mitigated
ROG NOx CO SO2 Fugitive PM10
Exhaust PM10
PM10 Total Fugitive PM2.5
0.00 0.00 0.00 0.00Total 2.76 0.00 0.00 0.00
0.00 0.00 0.00 0.00Landscaping 0.00 0.00 0.00 0.00
0.00 0.00 0.00 0.00Consumer Products 2.09
0.00 0.00 0.00 0.00
N2O CO2e
SubCategory tons/yr MT/yr
Architectural Coating
0.67
Exhaust PM2.5
PM2.5 Total
Bio- CO2 NBio- CO2 Total CO2 CH4
Unmitigated
ROG NOx CO SO2 Fugitive PM10
Exhaust PM10
PM10 Total Fugitive PM2.5
6.2 Area by SubCategory
NA NA NA NA NATotal NA NA NA NA NA
0.00 0.00 0.00 0.00Unmitigated 2.76 0.00 0.00 0.00
0.00 0.00 0.00 0.00Mitigated 2.76 0.00 0.00 0.00
NBio- CO2 Total CO2 CH4 N2O CO2e
Category tons/yr MT/yr
Exhaust PM10
PM10 Total Fugitive PM2.5
Exhaust PM2.5
PM2.5 Total
Bio- CO2
6.1 Mitigation Measures Area
ROG NOx CO SO2 Fugitive PM10
6.0 Area Detail
Total
Unrefrigerated Warehouse-No Rail
813009
Other Non-Asphalt Surfaces
0
Other Asphalt Surfaces
0
Total CO2 CH4 N2O CO2e
Land Use kWh tons/yr MT/yr
Electricity Use ROG NOx CO SO2
Mitigated

9 of 10
Total NA NA NA NA
Unmitigated
Mitigated
CH4 N2O CO2e
tons/yr MT/yr
8.1 Mitigation Measures Waste
Institute Recycling and Composting Services
Category/Year
ROG NOx CO SO2 Total CO2
8.0 Waste Detail
Total
Unrefrigerated Warehouse-No Rail
1138.09 / 0
Other Non-Asphalt Surfaces
0 / 0
Other Asphalt Surfaces
0 / 0
Total CO2 CH4 N2O CO2e
Land Use Mgal tons/yr MT/yr
Indoor/Outdoor Use
ROG NOx CO SO2
Mitigated
Total
Unrefrigerated Warehouse-No Rail
1422.62 / 0
Other Non-Asphalt Surfaces
0 / 0
Other Asphalt Surfaces
0 / 0
CH4 N2O CO2e
Land Use Mgal tons/yr MT/yr
7.2 Water by Land Use
Unmitigated
Indoor/Outdoor Use
ROG NOx CO SO2 Total CO2
Total NA NA NA NA
Unmitigated
CO2e
Category tons/yr MT/yr
Mitigated
ROG NOx CO SO2 Total CO2 CH4 N2O
7.1 Mitigation Measures Water
Install Low Flow Bathroom Faucet
Install Low Flow Kitchen Faucet
Install Low Flow Toilet
Install Low Flow Shower
7.0 Water Detail
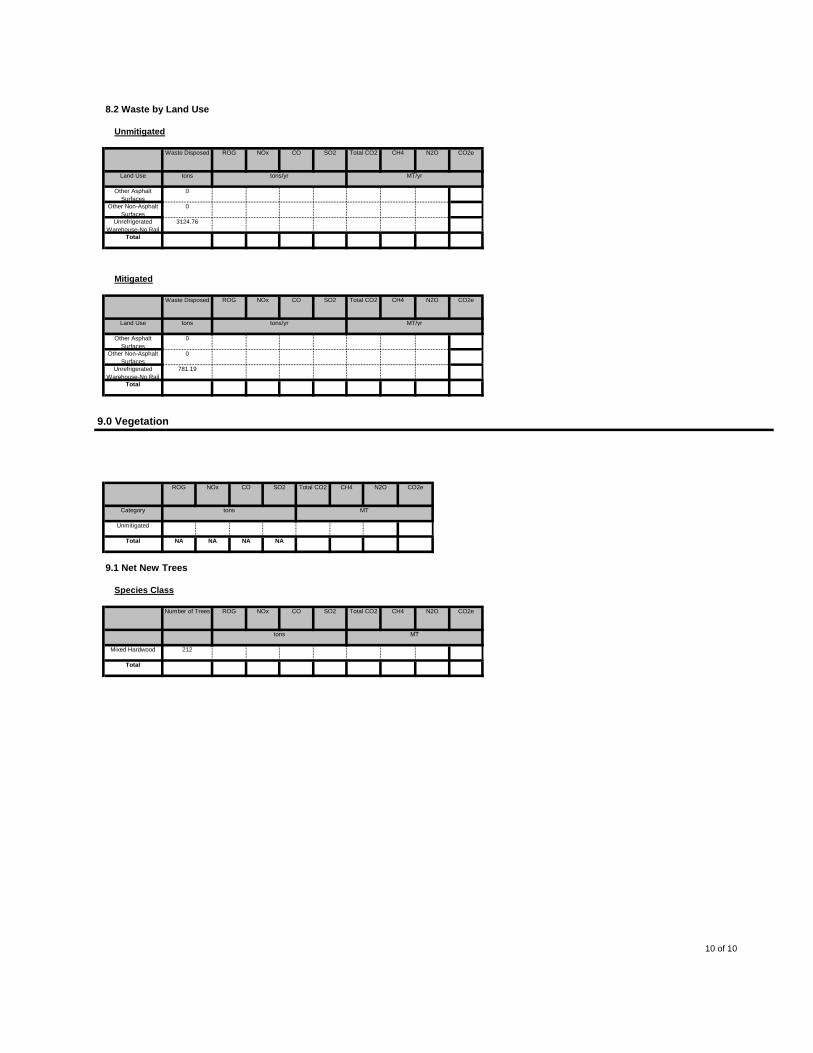
10 of 10
Total
Mixed Hardwood 212
Total CO2 CH4 N2O CO2e
tons MT
9.1 Net New Trees
Species Class
Number of Trees ROG NOx CO SO2
Total NA NA NA NA
CO2e
Category tons MT
Unmitigated
ROG NOx CO SO2 Total CO2 CH4 N2O
9.0 Vegetation
Total
Unrefrigerated Warehouse-No Rail
781.19
Other Non-Asphalt Surfaces
0
Other Asphalt Surfaces
0
Total CO2 CH4 N2O CO2e
Land Use tons tons/yr MT/yr
Waste Disposed ROG NOx CO SO2
Mitigated
Total
Unrefrigerated Warehouse-No Rail
3124.76
Other Non-Asphalt Surfaces
0
Other Asphalt Surfaces
0
CH4 N2O CO2e
Land Use tons tons/yr MT/yr
8.2 Waste by Land Use
Unmitigated
Waste Disposed ROG NOx CO SO2 Total CO2


Appendix C SCREEN3 and EMFAC2011 Outputs

This Page Intentionally Left Blank
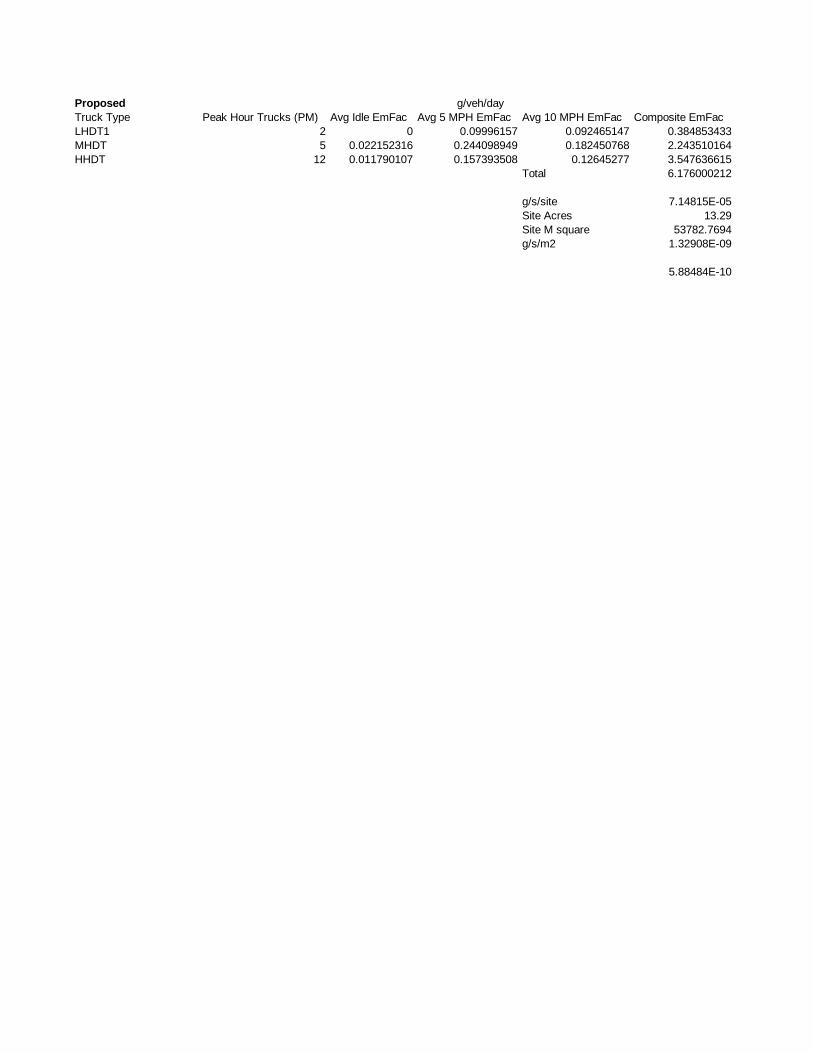
ProposedTruck Type Peak Hour Trucks (PM) Avg Idle EmFac Avg 5 MPH EmFac Avg 10 MPH EmFac Composite EmFacLHDT1 2 0 0.09996157 0.092465147 0.384853433MHDT 5 0.022152316 0.244098949 0.182450768 2.243510164HHDT 12 0.011790107 0.157393508 0.12645277 3.547636615
Total 6.176000212
g/s/site 7.14815E-05Site Acres 13.29Site M square 53782.7694g/s/m2 1.32908E-09
5.88484E-10
g/veh/day
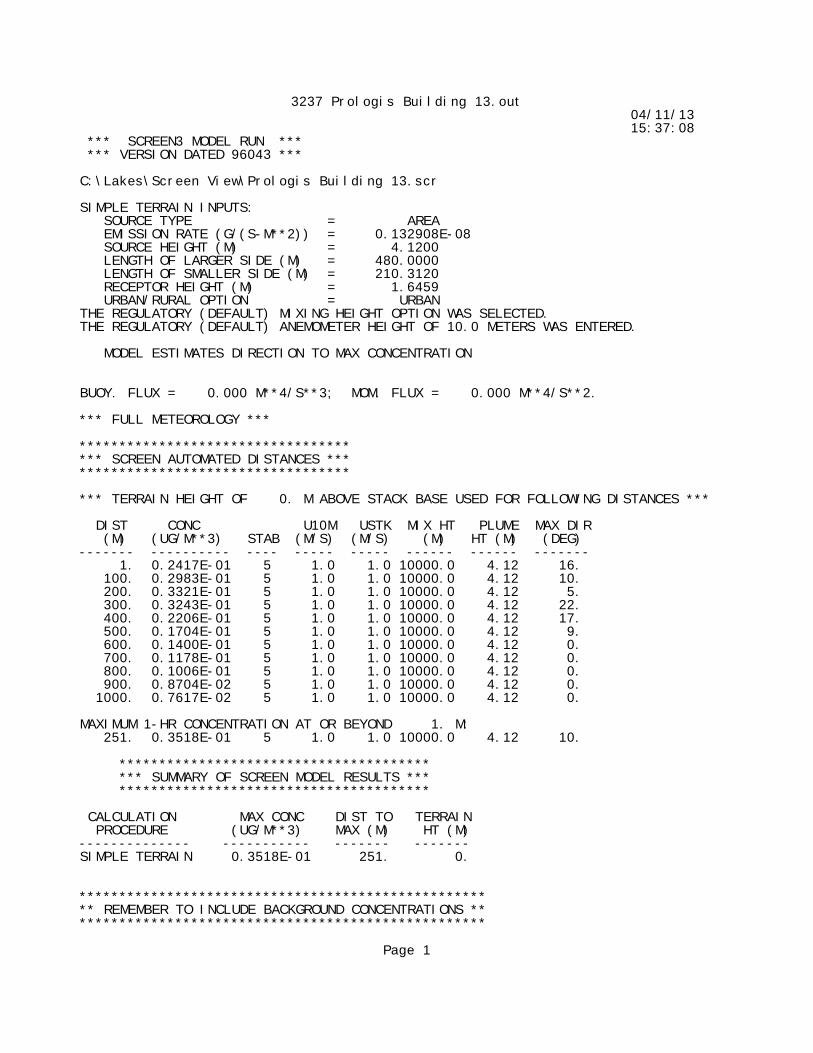
3237 Prologis Building 13.out 04/11/13 15:37:08 *** SCREEN3 MODEL RUN *** *** VERSION DATED 96043 ***
C:\Lakes\Screen View\Prologis Building 13.scr
SIMPLE TERRAIN INPUTS: SOURCE TYPE = AREA EMISSION RATE (G/(S-M**2)) = 0.132908E-08 SOURCE HEIGHT (M) = 4.1200 LENGTH OF LARGER SIDE (M) = 480.0000 LENGTH OF SMALLER SIDE (M) = 210.3120 RECEPTOR HEIGHT (M) = 1.6459 URBAN/RURAL OPTION = URBAN THE REGULATORY (DEFAULT) MIXING HEIGHT OPTION WAS SELECTED. THE REGULATORY (DEFAULT) ANEMOMETER HEIGHT OF 10.0 METERS WAS ENTERED.
MODEL ESTIMATES DIRECTION TO MAX CONCENTRATION
BUOY. FLUX = 0.000 M**4/S**3; MOM. FLUX = 0.000 M**4/S**2.
*** FULL METEOROLOGY ***
********************************** *** SCREEN AUTOMATED DISTANCES *** **********************************
*** TERRAIN HEIGHT OF 0. M ABOVE STACK BASE USED FOR FOLLOWING DISTANCES ***
DIST CONC U10M USTK MIX HT PLUME MAX DIR (M) (UG/M**3) STAB (M/S) (M/S) (M) HT (M) (DEG) ------- ---------- ---- ----- ----- ------ ------ ------- 1. 0.2417E-01 5 1.0 1.0 10000.0 4.12 16. 100. 0.2983E-01 5 1.0 1.0 10000.0 4.12 10. 200. 0.3321E-01 5 1.0 1.0 10000.0 4.12 5. 300. 0.3243E-01 5 1.0 1.0 10000.0 4.12 22. 400. 0.2206E-01 5 1.0 1.0 10000.0 4.12 17. 500. 0.1704E-01 5 1.0 1.0 10000.0 4.12 9. 600. 0.1400E-01 5 1.0 1.0 10000.0 4.12 0. 700. 0.1178E-01 5 1.0 1.0 10000.0 4.12 0. 800. 0.1006E-01 5 1.0 1.0 10000.0 4.12 0. 900. 0.8704E-02 5 1.0 1.0 10000.0 4.12 0. 1000. 0.7617E-02 5 1.0 1.0 10000.0 4.12 0.
MAXIMUM 1-HR CONCENTRATION AT OR BEYOND 1. M: 251. 0.3518E-01 5 1.0 1.0 10000.0 4.12 10.
*************************************** *** SUMMARY OF SCREEN MODEL RESULTS *** ***************************************
CALCULATION MAX CONC DIST TO TERRAIN PROCEDURE (UG/M**3) MAX (M) HT (M) -------------- ----------- ------- ------- SIMPLE TERRAIN 0.3518E-01 251. 0.
*************************************************** ** REMEMBER TO INCLUDE BACKGROUND CONCENTRATIONS ** ***************************************************
Page 1

Appendix D CO Hotspots Screening

This Page Intentionally Left Blank
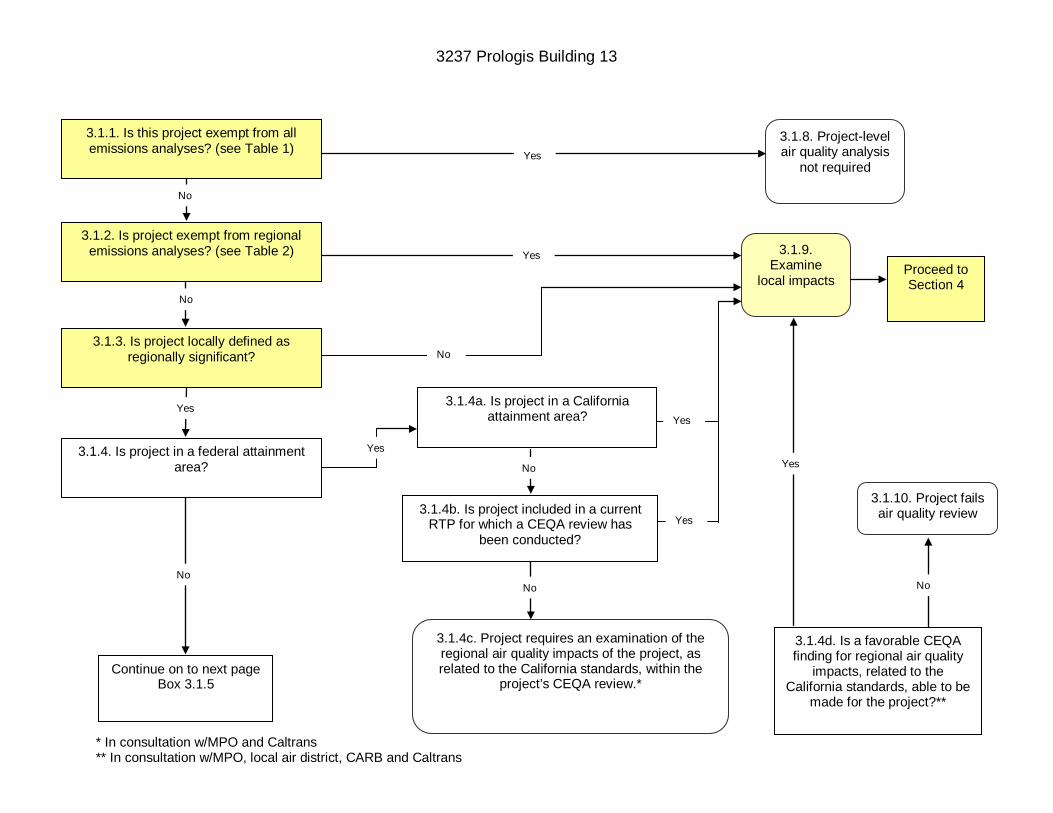
3237 Prologis Building 13
* In consultation w/MPO and Caltrans ** In consultation w/MPO, local air district, CARB and Caltrans
3.1.1. Is this project exempt from all emissions analyses? (see Table 1)
3.1.8. Project-level air quality analysis
not required
3.1.2. Is project exempt from regional emissions analyses? (see Table 2)
3.1.3. Is project locally defined as regionally significant?
3.1.4. Is project in a federal attainment area?
Continue on to next page Box 3.1.5
3.1.4c. Project requires an examination of the regional air quality impacts of the project, as related to the California standards, within the
project’s CEQA review.*
3.1.4d. Is a favorable CEQA finding for regional air quality
impacts, related to the California standards, able to be
made for the project?**
3.1.10. Project fails air quality review
3.1.9. Examine
local impacts Proceed to Section 4
3.1.4a. Is project in a California attainment area?
3.1.4b. Is project included in a current RTP for which a CEQA review has
been conducted?
Yes
Yes
Yes
Yes
Yes
Yes
No No
No
No
Yes
No
No
No
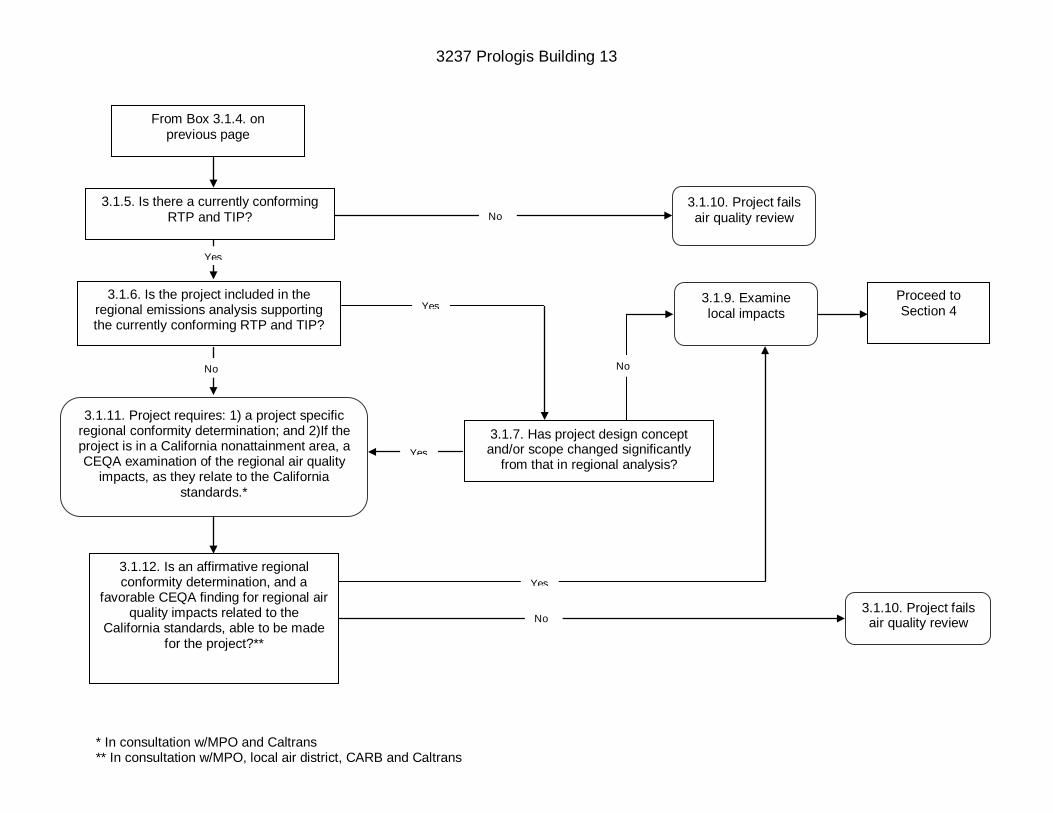
3237 Prologis Building 13
* In consultation w/MPO and Caltrans ** In consultation w/MPO, local air district, CARB and Caltrans
From Box 3.1.4. on previous page
3.1.5. Is there a currently conforming RTP and TIP?
3.1.6. Is the project included in the regional emissions analysis supporting the currently conforming RTP and TIP?
3.1.11. Project requires: 1) a project specific regional conformity determination; and 2)If the project is in a California nonattainment area, a CEQA examination of the regional air quality
impacts, as they relate to the California standards.*
3.1.12. Is an affirmative regional conformity determination, and a
favorable CEQA finding for regional air quality impacts related to the
California standards, able to be made for the project?**
3.1.7. Has project design concept and/or scope changed significantly
from that in regional analysis?
3.1.9. Examine local impacts
3.1.10. Project fails air quality review
Proceed to Section 4
3.1.10. Project fails air quality review
No
No
No
No
Yes
Yes
Yes
Yes
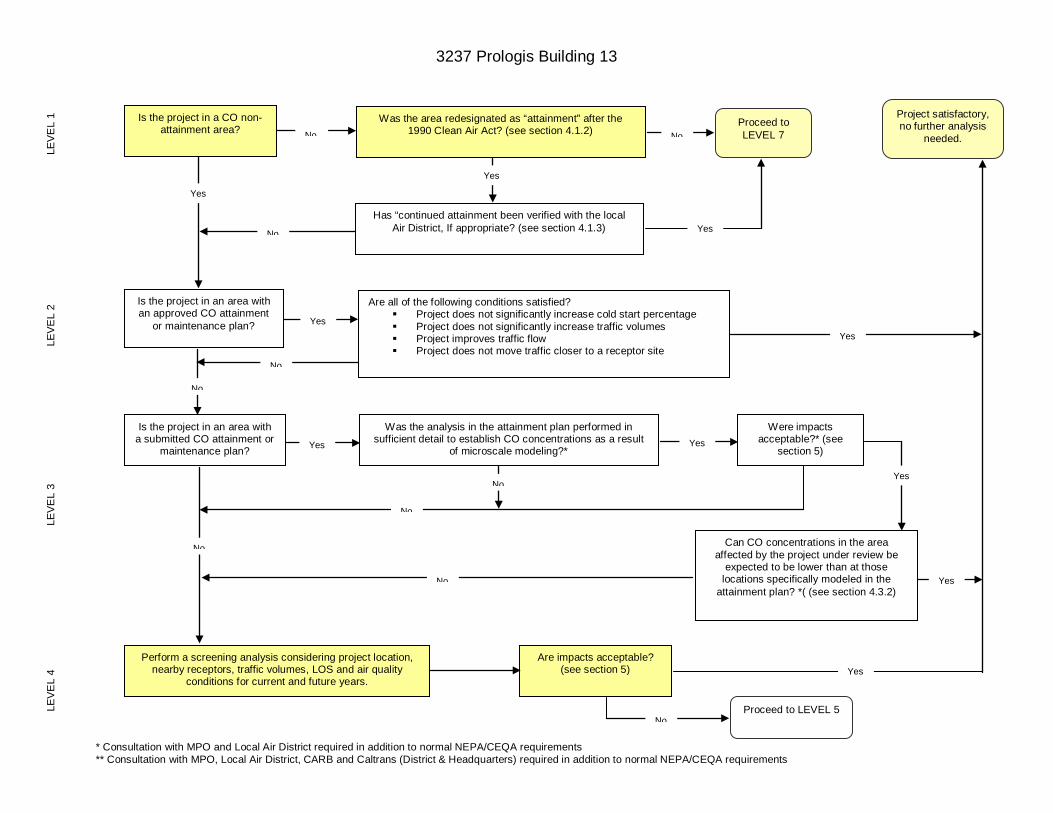
3237 Prologis Building 13
* Consultation with MPO and Local Air District required in addition to normal NEPA/CEQA requirements ** Consultation with MPO, Local Air District, CARB and Caltrans (District & Headquarters) required in addition to normal NEPA/CEQA requirements
Is the project in a CO non-
attainment area? Was the area redesignated as “attainment” after the
1990 Clean Air Act? (see section 4.1.2) Proceed to LEVEL 7
Project satisfactory, no further analysis
needed.
Has “continued attainment been verified with the local Air District, If appropriate? (see section 4.1.3)
Are all of the following conditions satisfied? Project does not significantly increase cold start percentage Project does not significantly increase traffic volumes Project improves traffic flow Project does not move traffic closer to a receptor site
Is the project in an area with an approved CO attainment
or maintenance plan?
Is the project in an area with a submitted CO attainment or
maintenance plan?
Perform a screening analysis considering project location, nearby receptors, traffic volumes, LOS and air quality
conditions for current and future years.
Are impacts acceptable? (see section 5)
Proceed to LEVEL 5
Was the analysis in the attainment plan performed in sufficient detail to establish CO concentrations as a result
of microscale modeling?*
Were impacts acceptable?* (see
section 5)
Can CO concentrations in the area affected by the project under review be
expected to be lower than at those locations specifically modeled in the
attainment plan? *( (see section 4.3.2)
LEV
EL
1 LE
VE
L 2
LEV
EL
3 LE
VE
L 4
Yes
No
No
No No
Yes
Yes
Yes
Yes
Yes Yes
No
No
No
No
No
Yes
No
Yes
Yes
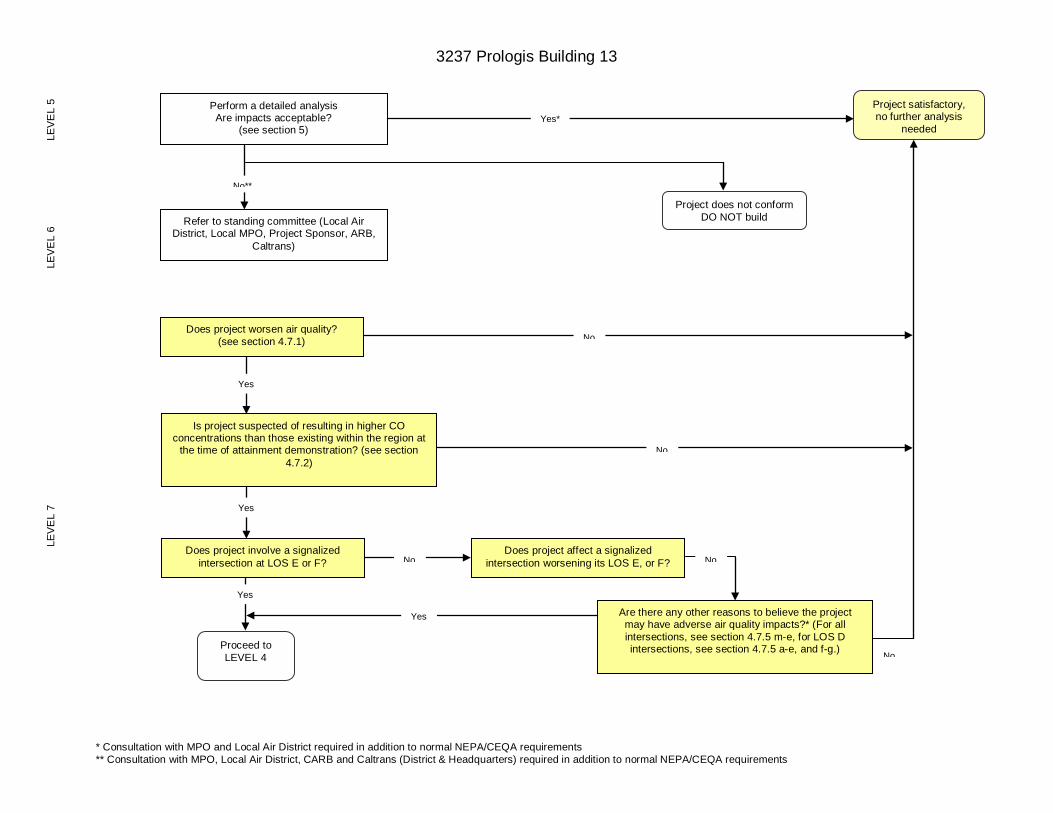
3237 Prologis Building 13
* Consultation with MPO and Local Air District required in addition to normal NEPA/CEQA requirements ** Consultation with MPO, Local Air District, CARB and Caltrans (District & Headquarters) required in addition to normal NEPA/CEQA requirements
Perform a detailed analysis Are impacts acceptable?
(see section 5)
Project satisfactory, no further analysis
needed
Refer to standing committee (Local Air District, Local MPO, Project Sponsor, ARB,
Caltrans)
Does project worsen air quality? (see section 4.7.1)
Is project suspected of resulting in higher CO concentrations than those existing within the region at
the time of attainment demonstration? (see section 4.7.2)
Does project involve a signalized intersection at LOS E or F?
Proceed to LEVEL 4
Does project affect a signalized intersection worsening its LOS E, or F?
Are there any other reasons to believe the project may have adverse air quality impacts?* (For all intersections, see section 4.7.5 m-e, for LOS D intersections, see section 4.7.5 a-e, and f-g.)
Project does not conform DO NOT build
LEV
EL
5 LE
VE
L 6
LEV
EL
7
Yes*
Yes
Yes
Yes
Yes
No**
No
No
No No
No

Appendix F Hand Calculations

This Page Intentionally Left Blank
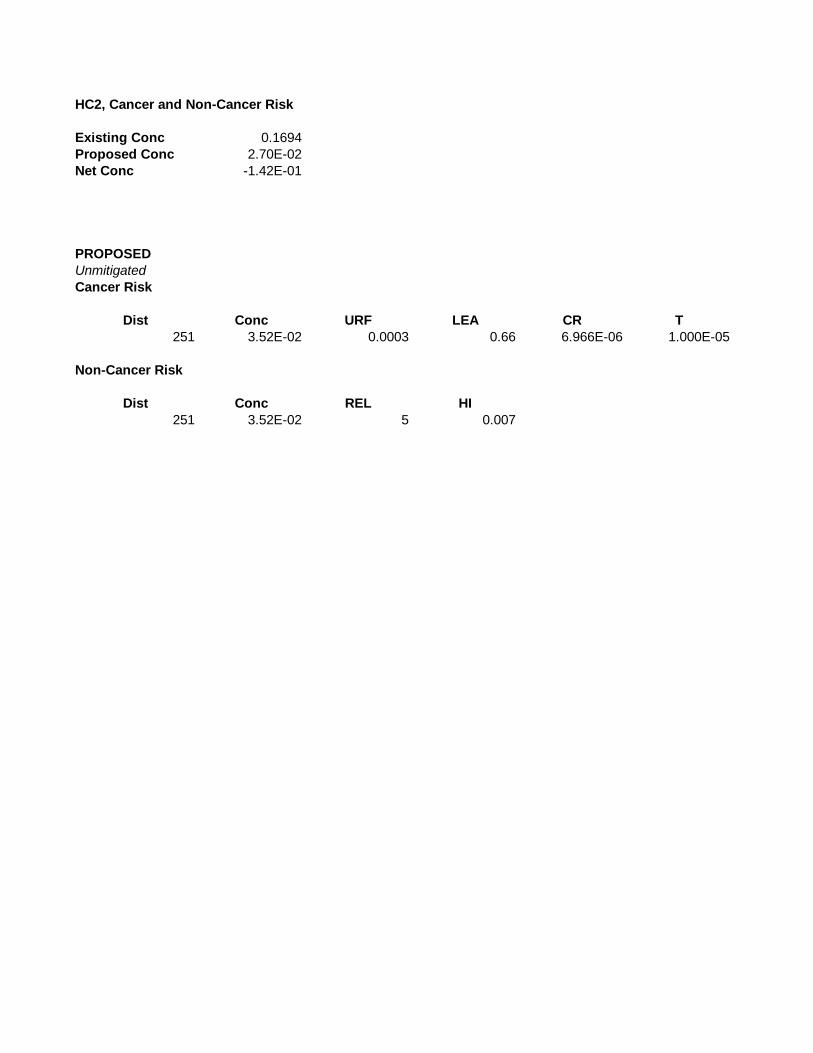
HC2, Cancer and Non-Cancer Risk
Existing Conc 0.1694Proposed Conc 2.70E-02Net Conc -1.42E-01
PROPOSEDUnmitigated
Cancer Risk
Dist Conc URF LEA CR T251 3.52E-02 0.0003 0.66 6.966E-06 1.000E-05
Non-Cancer Risk
Dist Conc REL HI251 3.52E-02 5 0.007
