appendix 5.18 faro mine pumped storage conceptual ... · to the east of the faro mine, and...
TRANSCRIPT

Appendix 5.18 Faro Mine Pumped Storage
Conceptual Assessment (EMC2 and Picacho and
Associates 2015)
Appendix 5.1 Gree

____________________________________________________________________________________ S:\Proj\1355\Faro Mine Pumped Storage Tech Memo_031015 R1.Docx
TECHNICAL MEMORANDUM To: Marc-Andre Lavigne Project 1355-1 Yukon Energy Corporation Box 5920, 2 Miles Canyon Road Whitehorse, YT Y1A6S7 From: Stephen Taylor, P.E., EMC2-Picacho
Date: March 10, 2016 Subject: Faro Mine Pumped Storage
Conceptual Assessment of Seasonal Pumped Storage Power Facilities at the Faro Mine Complex
Introduction In response to a series of discussions with Yukon Energy Corporation (YEC) in June 2015, EMC2-Picacho proposed a scope of work to YEC to perform a high-level assessment of the economics, social acceptability, regulatory requirements; environmental impacts; geotechnical issues; and geographic/geological attractiveness of a pumped storage facility at the Faro Mine. The purpose was to provide YEC with information to support and inform their decision-making process for further research into, or elimination of, the Faro Mine Complex area for consideration for potential pumped storage project development. This high-level study relied on:
The judgment of experienced individuals;
Existing industry cost databases developed for hydro power projects; and EMC2-Picacho’s own cost databases.
In September 2015, EMC2-Picacho’s Stephen Taylor and Joe Flynn met with YEC representatives in Whitehorse and travelled to the Faro Mine for a site visit and for an initial pumped storage options review and technical discussion. Completion of this visit provided the basis for refining the evaluation. This technical memorandum presents results of our assessment based upon the above considerations. Background The purpose of this evaluation was to complete conceptual site assessments and conceptual designs, including economic viability, for several seasonal pumped storage projects. The studied sites are within the vicinity of the Faro Mine Complex, including the Faro Mine area, Rose Creek Tailings area and the Vangorda Plateau area (see Figure 1 attached in Appendix A). The Faro Mine Complex is located in south-central Yukon, approximately 14 kilometers (km) north of the town of Faro. The Faro Mine Complex began mining in 1969 and lasted approximately 30 years.
745 E. Maryland Avenue, Suite 114 Phoenix, AZ 85014 (602) 331-3859 office (801) 979-4056 mobile

Marc-Andre Lavigne, Yukon Energy Corporation Page 2 of 11 Technical Memorandum: Faro Mine Pumped Storage March 10, 2016 Conceptual Assessment of Seasonal Pumped Storage Power Facilities at the Faro Mine Complex
____________________________________________________________________________________ S:\Proj\1355\Faro Mine Pumped Storage Tech Memo_031015 R1.Docx
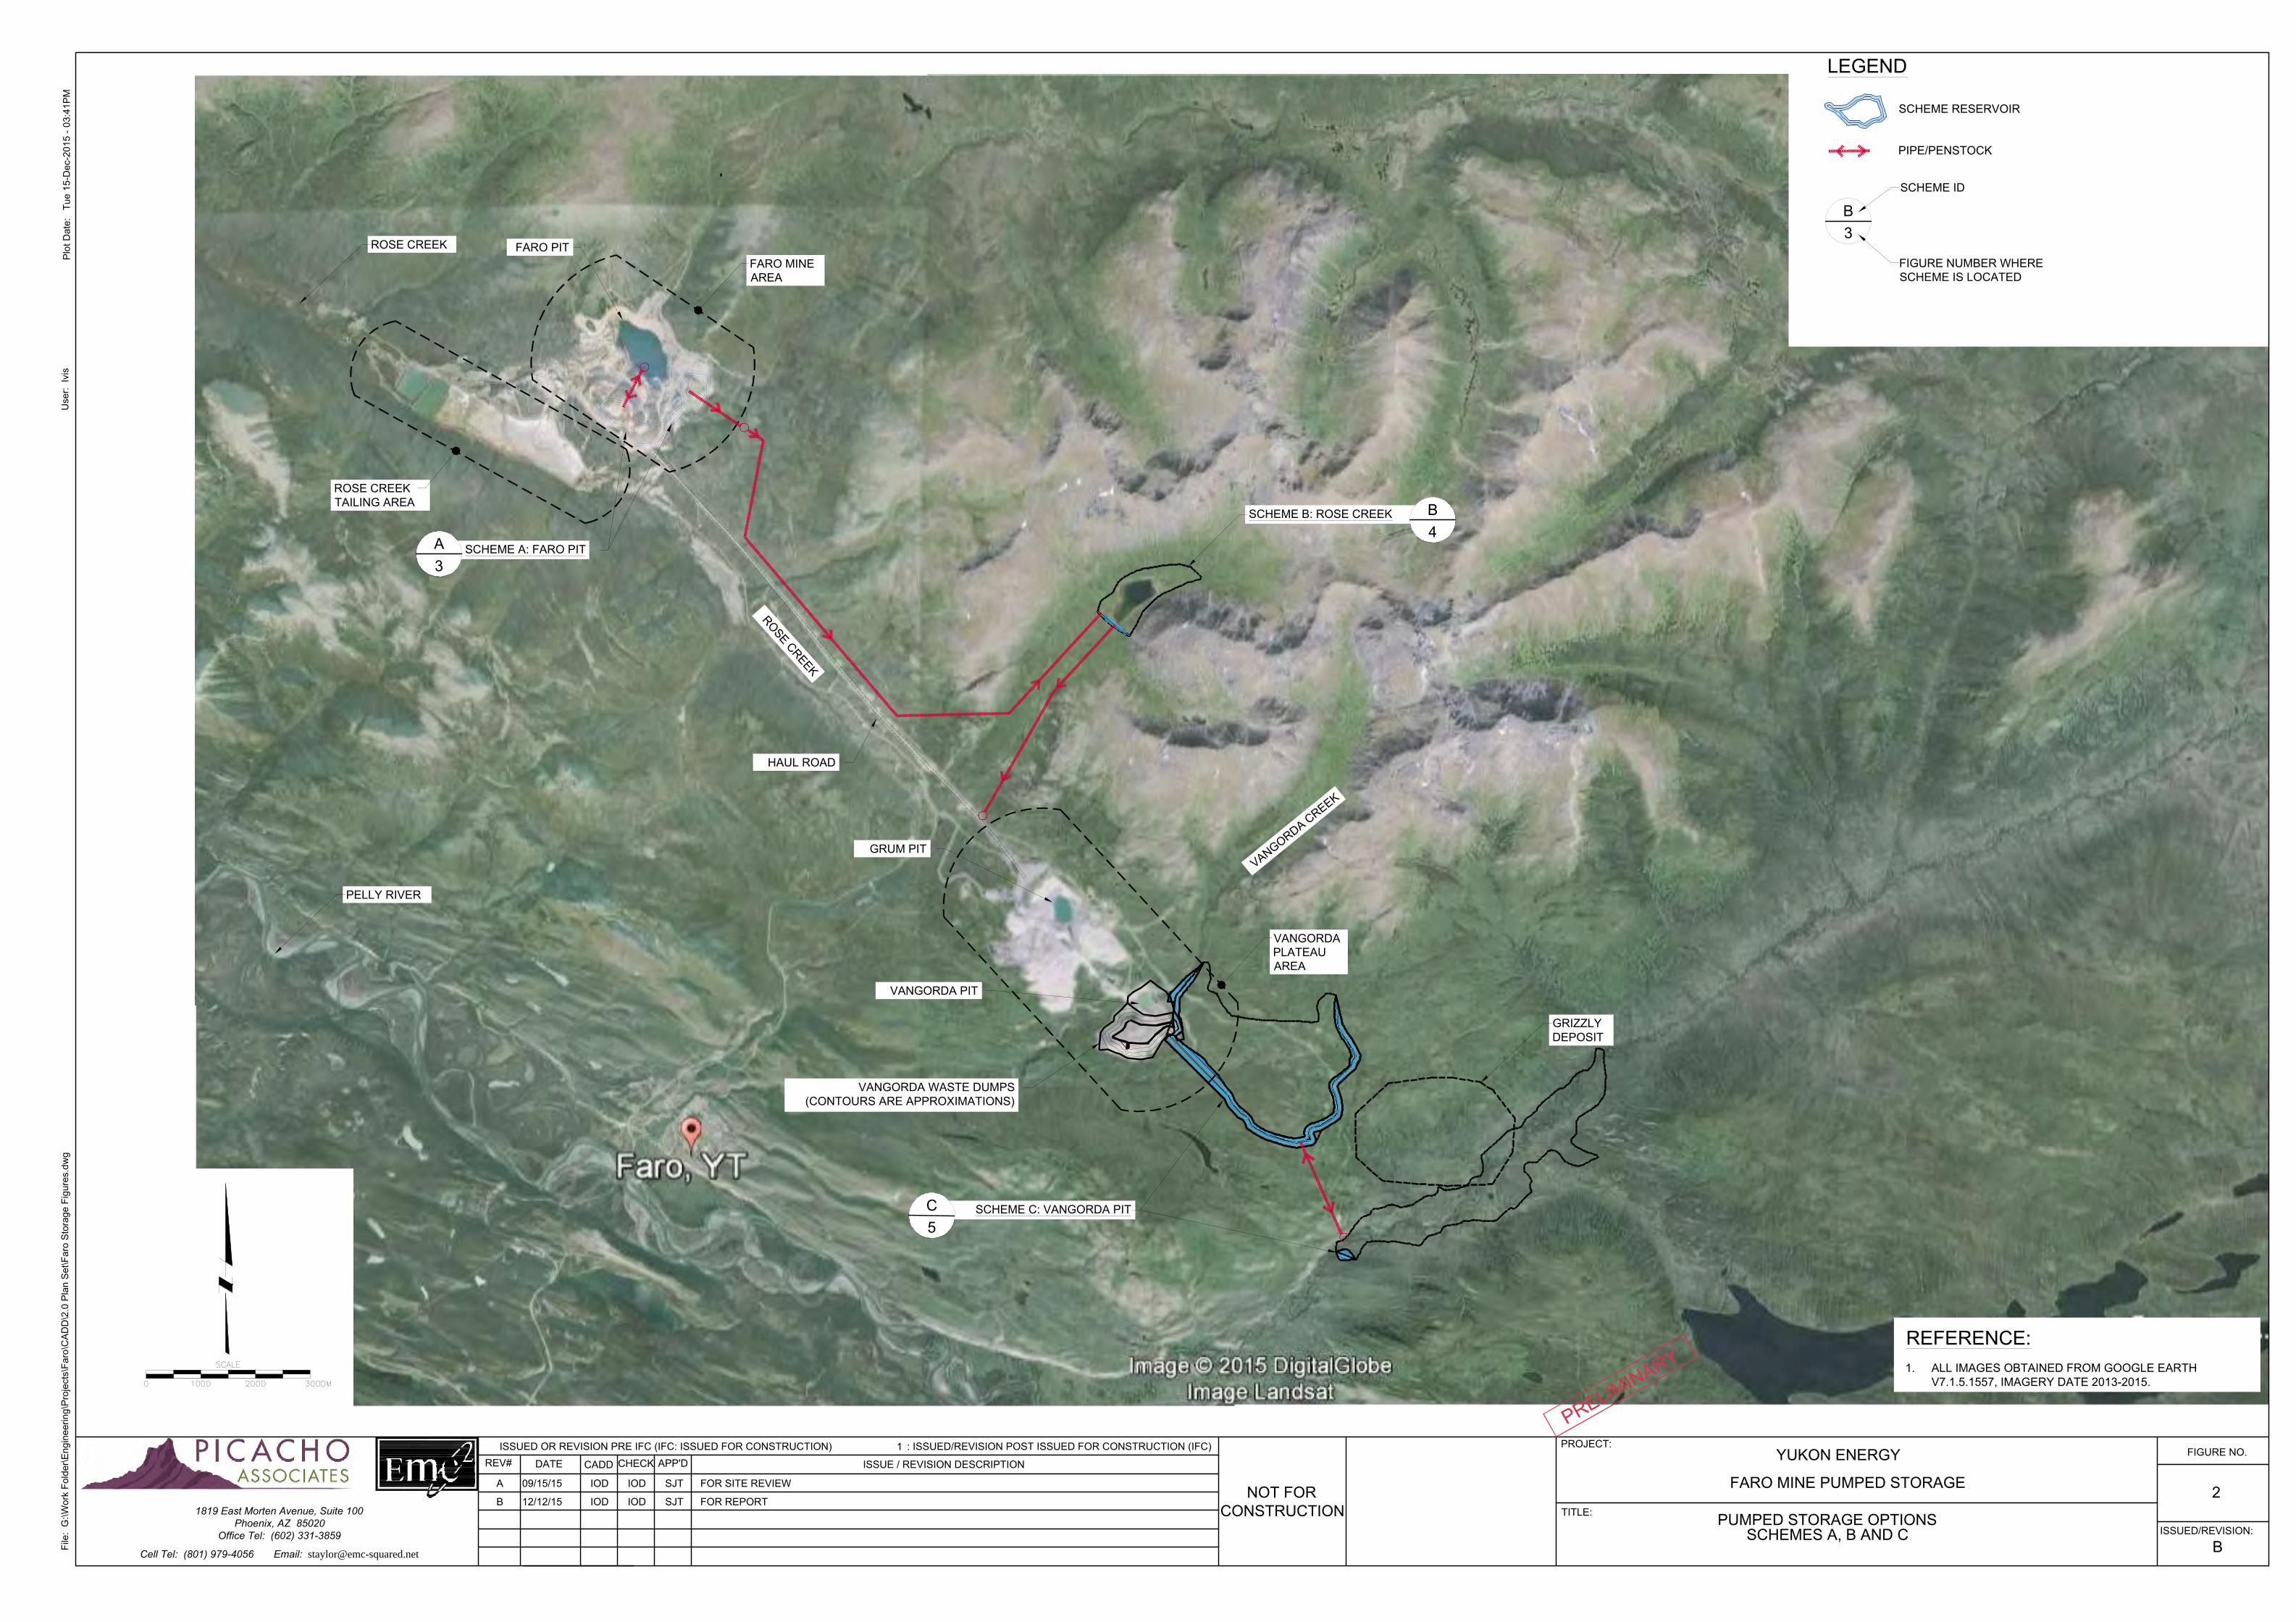
The mine is currently being reclaimed and remediated to a stable condition. The current layout of the mine consists of large open pit, the Faro pit, which is approximately 1,675 meters by 975 meters in surface area. The pit is surrounded by approximately 250 million tonnes of waste rock. To the southwest of the Faro Mine pit lies the Rose Creek Tailings, containing approximately 55 million tonnes of tailings. The tailings facility consists of a series of three dams to hold the tailings, and a fourth dam to store water. To the East of the Faro Mine, and connected by a haul road, lies the Vangorda Plateau consisting of two open pits: the Vangorda Pit, with approximately 20 million tons of waste rock; and the Grum Pit, with approximately 100 million tonnes of waste rock. The study range for this conceptual assessment was confined to the Faro Mine Complex and nearby surrounding areas. Potential site locations of the pumped storage schemes were kept to within a reasonable distance of waste rock (pit areas) to try to exploit previously-disturbed areas and to minimize the cost of new transmission lines and access roads. A total of 11 different locations and schemes were analyzed in this study (Schemes A through K). Due to factors affecting scheme viability, we selected three potentially promising schemes (Schemes, A, B and C) for further more detailed study. A brief summary describing each scheme layout and its potential is provided, as well as the reasons why each scheme was discarded or carried forward for further study. For Schemes A, B and C, detailed cost estimates (accurate to approximately -20% to +50%) are provided, assuming 1) costs with no support from mining operations and 2) costs if some support is received from a current mining operation (i.e., closure) or a potential future mining operation, e.g., the further development of ore bodies in the Vangorda Pit or from the Grizzly Deposit. Design Criteria and Assumptions Potential Seasonal Pumped Storage Schemes Numerous potential locations were assessed at a high level for siting pumped storage facilities. From these, a total of 11 schemes were analyzed having a wide range of design concepts, capacities and costs. Many schemes were eliminated as viable economics seemed unlikely. This report presents in detail three potential pumped storage locations: the Faro Pit Scheme (Scheme A), the Rose Creek Scheme (Scheme B) and the Vangorda Scheme (Scheme C). See Figure 1 for a plan view of the three schemes. Some of the rejected schemes are briefly summarized and shown in Figure 5. Power and Energy Potential Storage capacities for each scheme were chosen based on the suitability of the topography. In all cases we tried to find the maximum possible storage without making the reservoir embankments excessively large. Based on the storage volume, the head between upper and lower reservoirs and the requirement to deliver power during the four or five winter months, capacities for each scheme were chosen. For the three schemes A, B and C studied in detail, the capacities were 4, 8 and 40 megawatts (MW), and the stored energy 9.4, 9.6 and 134 gigawatt hours (GWh), respectively. For all schemes a system efficiency of 82% was assumed.
Marc-Andre Lavigne, Yukon Energy Corporation Page 3 of 11 Technical Memorandum: Faro Mine Pumped Storage March 10, 2016 Conceptual Assessment of Seasonal Pumped Storage Power Facilities at the Faro Mine Complex
____________________________________________________________________________________ S:\Proj\1355\Faro Mine Pumped Storage Tech Memo_031015 R1.Docx
Hydrology Weather in the area consists of long cold winters and warm summers. The annual precipitation for the study area ranges from 300-400 millimeters (mm), with a little over two-thirds falling as rain and one-third as snow. Climate normal and rainfall averages for the Yukon were obtainable from the Canadian Environmental department. The Yukon area contains approximately 19 weather stations. The data range used for this study is from 1981 to 2010. The total yearly average precipitation is 319.7 mm. May to October yields the highest precipitation depths during the year. Catchment areas were delineated using topographic information obtained from the United States Geological Survey. The available topographic contour interval for the area is 10 meters (m). Yearly catchment volumes were determined using the rational method with a runoff coefficient of 0.80. Geology Most of the superficial geological materials within the Faro Complex area were deposited during the McConnell Glaciation period, and include thin till veneers and rock blankets which cover much of the mid to upper slopes. Glacial river sand, gravel, lake silts, sand and clays are common on low valley slopes contiguous to existing drainage pathways. Recent alluvium and organic deposits are found throughout the mid to lower valleys. The central Yukon shows signs of moderate seismic activity. The rocks in the Faro Mine site are sulphide-rich and are currently undergoing treatment for Acid Rock Drainage (ARD) so ARD should be expected from waste dumps until closure plans are implemented. A preliminary desk-top geologic study was done for the area and is presented in Appendix B. This conceptual site assessment assumes that low-permeability material is potentially available for the earthen embankments, and the in-situ impoundment materials are fairly impermeable. However, allowances are made for impoundment and embankment lining using an 80-mil high-density polyethylene (HDPE) geomembrane placed on a bedding. The proportion of the area chosen for lining was based on high-level judgment considering embankment size, impoundment depth, soils underlying the impoundment, and amount of storm water run-on into the impoundment that could offset seepage losses. The cost of the geomembrane is a significant part (~10%) of the overall capital cost. Reservoirs Embankments All reservoir embankments dams were designed as earth fill with side slopes of 2.5:1, and a 5m crest width as shown on the figures. It is possible that if suitable rock is available, these sideslopes could be steepened. It is also possible that steeper embankments built out of roller-compacted concrete could more economical in some locations; however, this option was not explored. The stability and constructability of the dams would need further geotechnical evaluation including seismic assessment. The earthwork volume quantities are based on neat-line values and do not include soil swell or shrinkage.

Marc-Andre Lavigne, Yukon Energy Corporation Page 4 of 11 Technical Memorandum: Faro Mine Pumped Storage March 10, 2016 Conceptual Assessment of Seasonal Pumped Storage Power Facilities at the Faro Mine Complex
____________________________________________________________________________________ S:\Proj\1355\Faro Mine Pumped Storage Tech Memo_031015 R1.Docx
Pits Only for Scheme A was a pit, the Faro Pit, used as a lower reservoir, and we could not exploit the entire Pit volume due to limitations on the size of the upper reservoir. The Grum and Vangorda Pits were found to be too small and do not have suitable surrounding topography to be useful. Pumped Storage Layout and Equipment For the three most promising schemes pumped storage capacities ranged from 4 to 40 MW, flows from 1.5 to 11.6 m3/s, heads from 92 to 390m, and seasonal storage from 11.7 to 123 million m3. In all cases, above-ground penstocks and power houses were chosen. This seemed like the most economical alternative; however, if any one of the options were to advance to the next level of design, then the full range of penstock design alternatives should be investigated. For Scheme A, a floating barge was chosen as a means to support the turbine-pump and generators. The full ramifications of such a solution would need to be investigated in further studies, but it does seem to be a viable solution based on the success of floating barges used for pump stations by the mining industry. With the above flows, a preliminary screening showed that a Francis turbine is likely the most cost-efficient turbine choice, and hence was used for each of the schemes. Types of electrical generation, control and other equipment were not studied in detail beyond estimating costs of typical equipment. Existing power lines to Faro Mine were assumed to be adequate and would require only relatively short extensions (up to 6,000m) for the schemes considered. Costs and Economic Analysis Preliminary cost estimates were performed for all 11 schemes, but only the three most promising schemes results are presented. The major cost and financial analysis assumptions are listed below.
TABLE 1 Major Cost Analysis Assumptions
Life of the Project 50 years Term 40 years Debt Interest Rate 6% Inflation Rate (over past 5 years)1 2% Operations and Maintenance (O&M) EPI Formula (HDR 2014) Contingency 25% Summer power rate2 US$0.03 Winter power rate3 US$0.20
1. Future inflation of power rates and O&M was assumed to match chosen interest rates. 2. A nominal amount to cover O&M. 3. Based off YEC personal communication; assuming CDN$0.2 for natural gas generated
power, CDN$0.29 for diesel generated power, an assumed 50/50 mix and a 0.8 US$ to CDN$ conversion.
Marc-Andre Lavigne, Yukon Energy Corporation Page 5 of 11 Technical Memorandum: Faro Mine Pumped Storage March 10, 2016 Conceptual Assessment of Seasonal Pumped Storage Power Facilities at the Faro Mine Complex
____________________________________________________________________________________ S:\Proj\1355\Faro Mine Pumped Storage Tech Memo_031015 R1.Docx
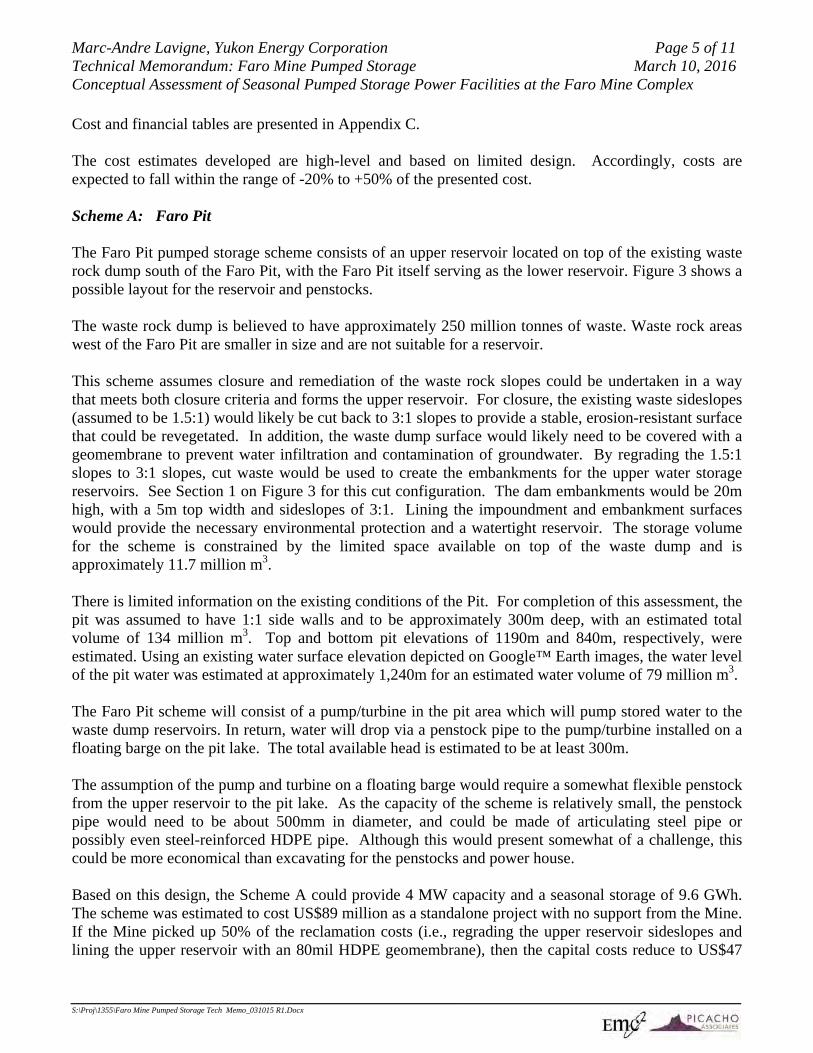
Cost and financial tables are presented in Appendix C. The cost estimates developed are high-level and based on limited design. Accordingly, costs are expected to fall within the range of -20% to +50% of the presented cost. Scheme A: Faro Pit The Faro Pit pumped storage scheme consists of an upper reservoir located on top of the existing waste rock dump south of the Faro Pit, with the Faro Pit itself serving as the lower reservoir. Figure 3 shows a possible layout for the reservoir and penstocks. The waste rock dump is believed to have approximately 250 million tonnes of waste. Waste rock areas west of the Faro Pit are smaller in size and are not suitable for a reservoir. This scheme assumes closure and remediation of the waste rock slopes could be undertaken in a way that meets both closure criteria and forms the upper reservoir. For closure, the existing waste sideslopes (assumed to be 1.5:1) would likely be cut back to 3:1 slopes to provide a stable, erosion-resistant surface that could be revegetated. In addition, the waste dump surface would likely need to be covered with a geomembrane to prevent water infiltration and contamination of groundwater. By regrading the 1.5:1 slopes to 3:1 slopes, cut waste would be used to create the embankments for the upper water storage reservoirs. See Section 1 on Figure 3 for this cut configuration. The dam embankments would be 20m high, with a 5m top width and sideslopes of 3:1. Lining the impoundment and embankment surfaces would provide the necessary environmental protection and a watertight reservoir. The storage volume for the scheme is constrained by the limited space available on top of the waste dump and is approximately 11.7 million m3. There is limited information on the existing conditions of the Pit. For completion of this assessment, the pit was assumed to have 1:1 side walls and to be approximately 300m deep, with an estimated total volume of 134 million m3. Top and bottom pit elevations of 1190m and 840m, respectively, were estimated. Using an existing water surface elevation depicted on Google™ Earth images, the water level of the pit water was estimated at approximately 1,240m for an estimated water volume of 79 million m3. The Faro Pit scheme will consist of a pump/turbine in the pit area which will pump stored water to the waste dump reservoirs. In return, water will drop via a penstock pipe to the pump/turbine installed on a floating barge on the pit lake. The total available head is estimated to be at least 300m. The assumption of the pump and turbine on a floating barge would require a somewhat flexible penstock from the upper reservoir to the pit lake. As the capacity of the scheme is relatively small, the penstock pipe would need to be about 500mm in diameter, and could be made of articulating steel pipe or possibly even steel-reinforced HDPE pipe. Although this would present somewhat of a challenge, this could be more economical than excavating for the penstocks and power house. Based on this design, the Scheme A could provide 4 MW capacity and a seasonal storage of 9.6 GWh. The scheme was estimated to cost US$89 million as a standalone project with no support from the Mine. If the Mine picked up 50% of the reclamation costs (i.e., regrading the upper reservoir sideslopes and lining the upper reservoir with an 80mil HDPE geomembrane), then the capital costs reduce to US$47
Marc-Andre Lavigne, Yukon Energy Corporation Page 6 of 11 Technical Memorandum: Faro Mine Pumped Storage March 10, 2016 Conceptual Assessment of Seasonal Pumped Storage Power Facilities at the Faro Mine Complex
____________________________________________________________________________________ S:\Proj\1355\Faro Mine Pumped Storage Tech Memo_031015 R1.Docx
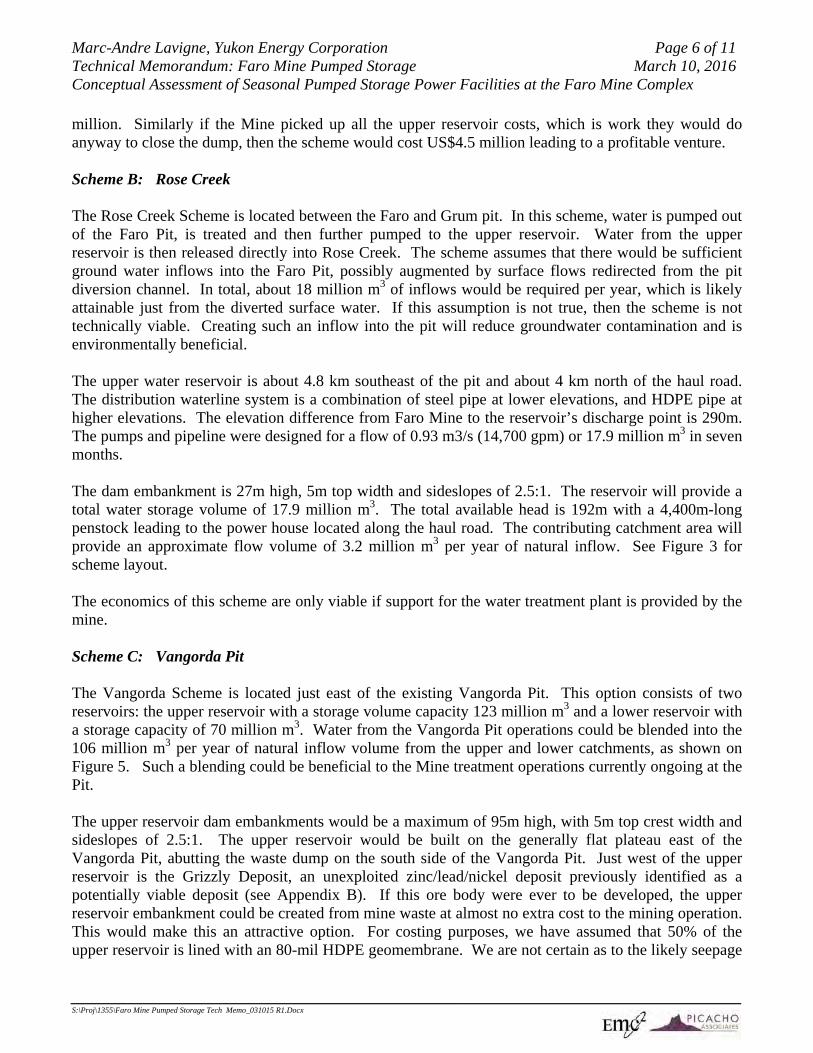
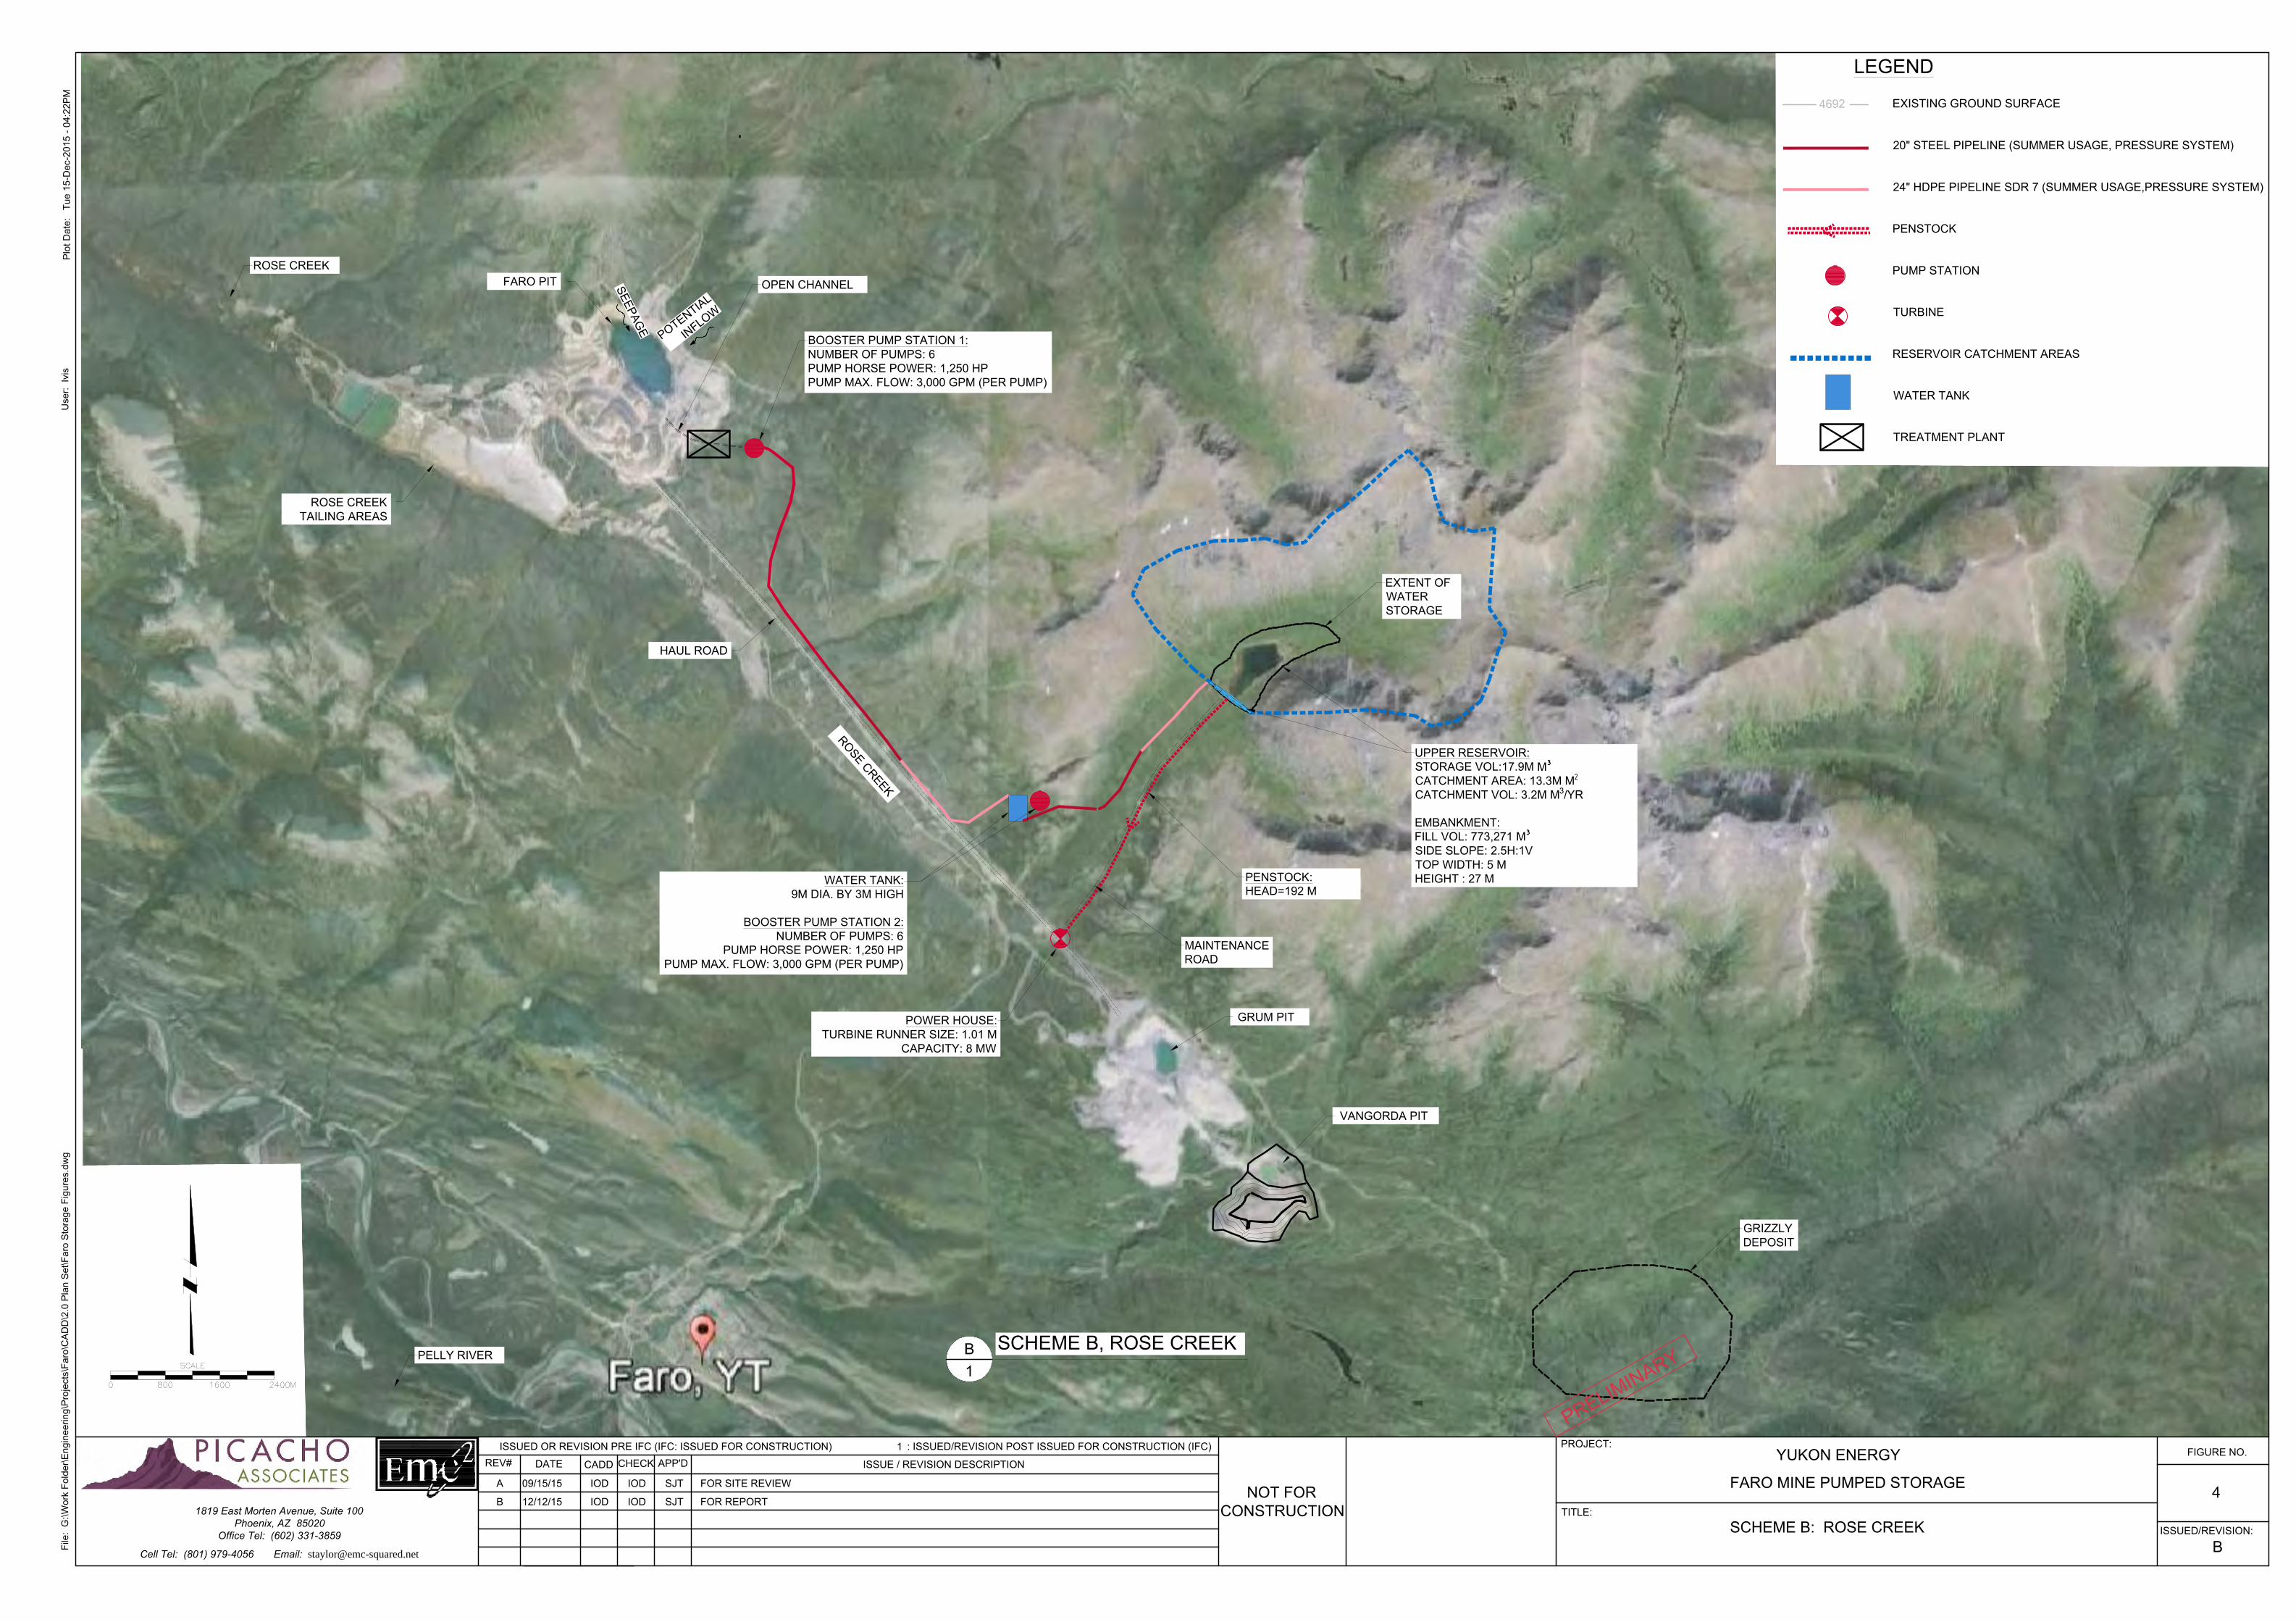
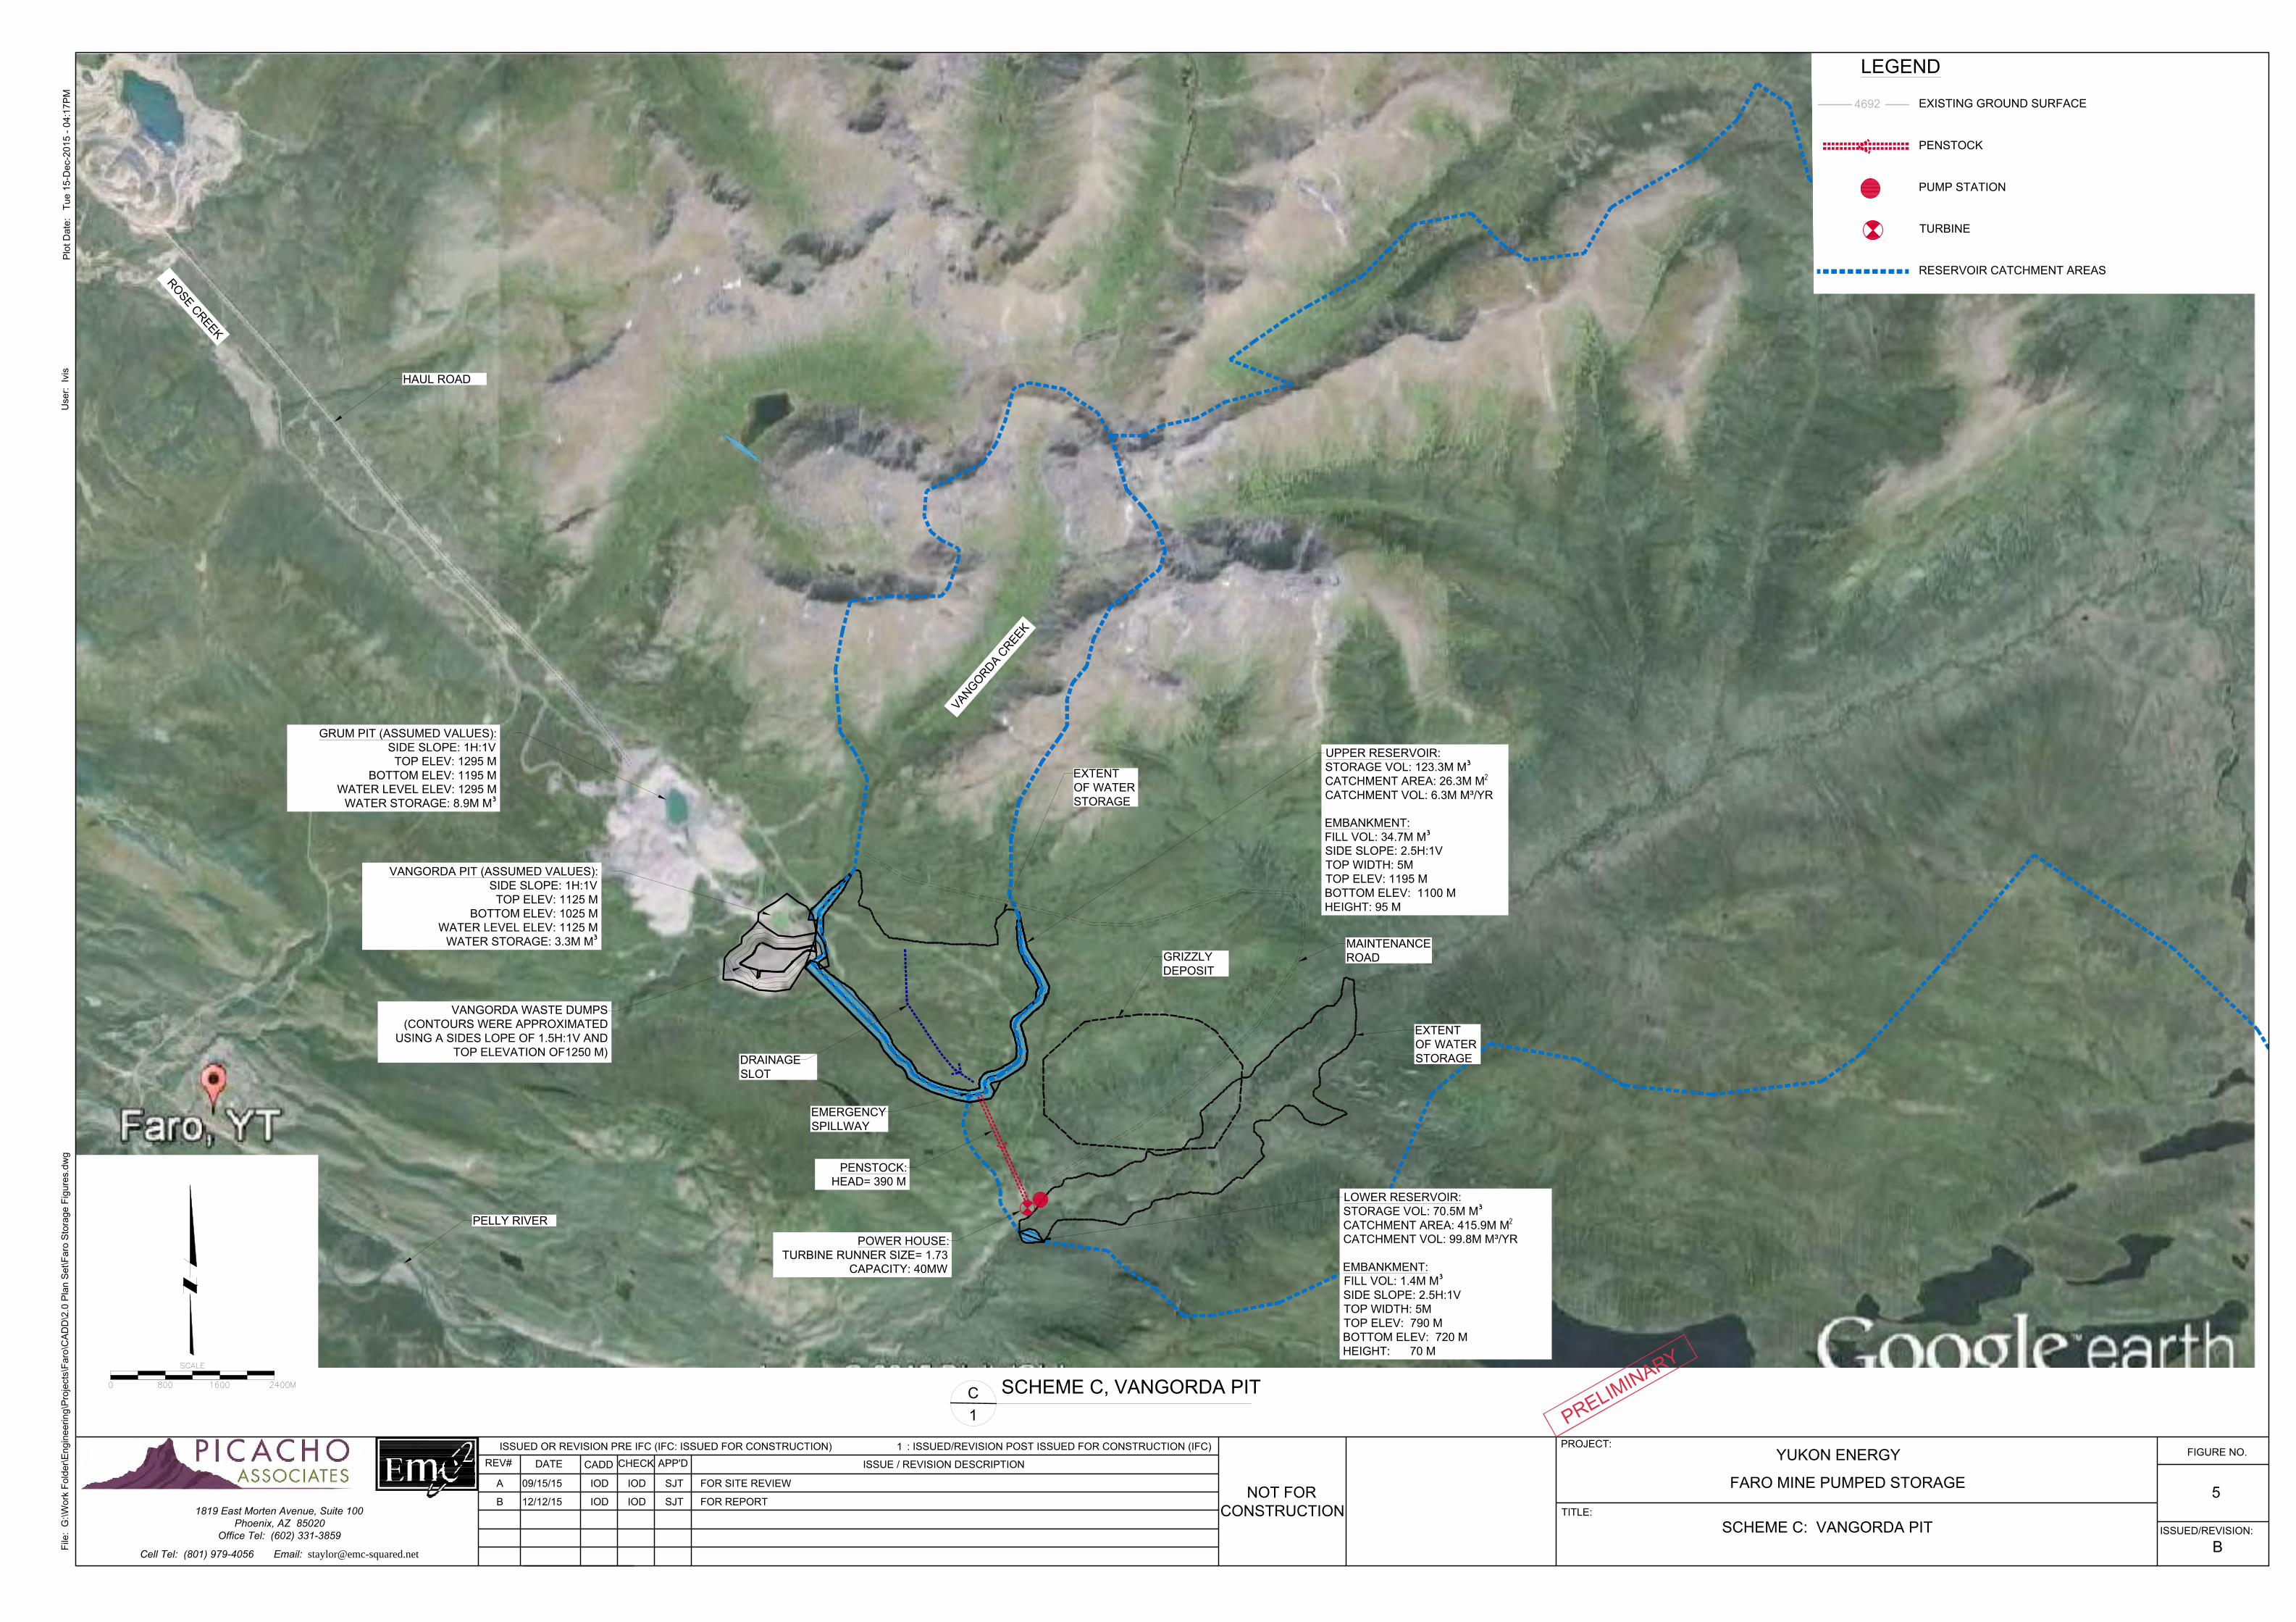
million. Similarly if the Mine picked up all the upper reservoir costs, which is work they would do anyway to close the dump, then the scheme would cost US$4.5 million leading to a profitable venture. Scheme B: Rose Creek The Rose Creek Scheme is located between the Faro and Grum pit. In this scheme, water is pumped out of the Faro Pit, is treated and then further pumped to the upper reservoir. Water from the upper reservoir is then released directly into Rose Creek. The scheme assumes that there would be sufficient ground water inflows into the Faro Pit, possibly augmented by surface flows redirected from the pit diversion channel. In total, about 18 million m3 of inflows would be required per year, which is likely attainable just from the diverted surface water. If this assumption is not true, then the scheme is not technically viable. Creating such an inflow into the pit will reduce groundwater contamination and is environmentally beneficial. The upper water reservoir is about 4.8 km southeast of the pit and about 4 km north of the haul road. The distribution waterline system is a combination of steel pipe at lower elevations, and HDPE pipe at higher elevations. The elevation difference from Faro Mine to the reservoir’s discharge point is 290m. The pumps and pipeline were designed for a flow of 0.93 m3/s (14,700 gpm) or 17.9 million m3 in seven months. The dam embankment is 27m high, 5m top width and sideslopes of 2.5:1. The reservoir will provide a total water storage volume of 17.9 million m3. The total available head is 192m with a 4,400m-long penstock leading to the power house located along the haul road. The contributing catchment area will provide an approximate flow volume of 3.2 million m3 per year of natural inflow. See Figure 3 for scheme layout. The economics of this scheme are only viable if support for the water treatment plant is provided by the mine. Scheme C: Vangorda Pit The Vangorda Scheme is located just east of the existing Vangorda Pit. This option consists of two reservoirs: the upper reservoir with a storage volume capacity 123 million m3 and a lower reservoir with a storage capacity of 70 million m3. Water from the Vangorda Pit operations could be blended into the 106 million m3 per year of natural inflow volume from the upper and lower catchments, as shown on Figure 5. Such a blending could be beneficial to the Mine treatment operations currently ongoing at the Pit. The upper reservoir dam embankments would be a maximum of 95m high, with 5m top crest width and sideslopes of 2.5:1. The upper reservoir would be built on the generally flat plateau east of the Vangorda Pit, abutting the waste dump on the south side of the Vangorda Pit. Just west of the upper reservoir is the Grizzly Deposit, an unexploited zinc/lead/nickel deposit previously identified as a potentially viable deposit (see Appendix B). If this ore body were ever to be developed, the upper reservoir embankment could be created from mine waste at almost no extra cost to the mining operation. This would make this an attractive option. For costing purposes, we have assumed that 50% of the upper reservoir is lined with an 80-mil HDPE geomembrane. We are not certain as to the likely seepage

Marc-Andre Lavigne, Yukon Energy Corporation Page 7 of 11 Technical Memorandum: Faro Mine Pumped Storage March 10, 2016 Conceptual Assessment of Seasonal Pumped Storage Power Facilities at the Faro Mine Complex
____________________________________________________________________________________ S:\Proj\1355\Faro Mine Pumped Storage Tech Memo_031015 R1.Docx
in this area, but the inflow of 6.3M m3 of stormwater would offset some leakage, hence the 50% estimate, which is likely conservative. The lower reservoir embankment would be a maximum of 80m high, with a 5m top width and sideslopes of 2.5:1, and would be located in a very narrow region of the stream below the upper reservoir. The lower reservoir has a large natural inflow of water and hence can be smaller than the upper reservoir. The total available head is 390m with a 1,780m-long penstock leading to the power house located next to the lower embankment. This gives a length to height ratio (l/h) of 4.6, which is attractive. See Figure 5 for a schematic layout. Several other options in this area that may provide greater head and a larger upstream catchment. Thus there is a good chance that a better scheme in the area could be identified in a more in-depth and comprehensive study. This option shows viable economics if the embankment costs are offset by at least 50% by using mine waste. Other Schemes As part of the site assessment process, several other schemes were considered. Some had more potential than others; however, due to a lack of head elevation, distance, or storage capacity the economic viability of these schemes was assessed to be low, and hence they were rejected for further study. Each of these schemes is briefly described below. Scheme D Scheme D is located just south of the Vangorda Pit. Similar to Scheme C, this option consists of two reservoirs: the upper reservoir with a storage volume capacity of 205 million m3 and the lower reservoir (same as Scheme C) with a storage capacity of 70 million m3. Water from the Vangorda Pit operations can be used, as well as a combined 107.2 million m3 per year of natural inflow volume from catchment areas north of the reservoir. The upper reservoir consists of two embankments with 2.5:1 sideslopes and 5m top width. The total available head is 310m with a penstock leading to the power house located on the lower reservoir (see Figure 5). This scheme would have similar economics as Scheme C and hence was not studied further. Scheme E Scheme E is located south of the Faro Mine Pit. Similar to Scheme A, this option consists of using the Faro Pit as an upper reservoir and the Rose Creek tailing area as a lower reservoir (see Figure 5). The limited head differential and relatively small storage volumes made this option unattractive.

Marc-Andre Lavigne, Yukon Energy Corporation Page 8 of 11 Technical Memorandum: Faro Mine Pumped Storage March 10, 2016 Conceptual Assessment of Seasonal Pumped Storage Power Facilities at the Faro Mine Complex
____________________________________________________________________________________ S:\Proj\1355\Faro Mine Pumped Storage Tech Memo_031015 R1.Docx
Scheme F Scheme F is located between Faro Mine pit and the Grum Pit. Similar to Scheme B, water from the Faro Mine complex will be pumped in an easterly direction to the water reservoir 3 kilometers (km) northeast of the Haul road. The dam embankments are 40m height, 5m top width a sideslope of 2.5:1. The reservoir will provide a total water storage volume of 17 million m3. The total available head is 430m with a 3,500m-long penstock leading to the power house located along the Haul road (see Figure 5). This scheme would have similar economics as Scheme B and hence was not studied further. Scheme G Scheme G is located north of the Grum Pit. Similar to Schemes B and F, water from Grum Pit will be pumped in a northerly direction to the water reservoir 4.1 km northeast of the Haul road. The dam embankments are 90m high, 5m top width and a sideslope of 2.5:1. The reservoir will provide a total water storage volume of 25 million m3. The available head is 375m with a 4,175m-long penstock along the Vangorda Creek and leading to the power house located north of the Vangorda Pit (see Figure 5). Scheme H Scheme H is located north of the Vangorda Pit and Grizzly Deposit. Similar to the Vangorda schemes (C and D), Scheme H consists of an upper and lower reservoir. The upper reservoir dam embankments are 338m high, 5m top width and a sideslope of 2.5:1. Storage capacity for the upper reservoirs is approximately 470 million m3. The lower reservoir dam embankments are 40m in height, 5m top width and a sideslope of 2.5:1. Storage capacity for the lower reservoirs is approximately 180 million m3. The available head is 660m with a 6,457m-long penstock leading to the power house located along the lower embankment (see Figure 5). The upper reservoir embankment is very large and would likely make the scheme less economical. Scheme I Scheme I is located 17.6 km east of the Faro Pit. Scheme I does not contain dam embankments but instead uses the natural topography for water storage. The reservoir has a storage capacity of 4.2 million m3. The total available head is 300m with a 17,603m-long penstock leading to the power house located along the Rose Creek/Haul road (see Figure 5). The extremely long penstock makes this scheme unattractive.
Marc-Andre Lavigne, Yukon Energy Corporation Page 9 of 11 Technical Memorandum: Faro Mine Pumped Storage March 10, 2016 Conceptual Assessment of Seasonal Pumped Storage Power Facilities at the Faro Mine Complex
____________________________________________________________________________________ S:\Proj\1355\Faro Mine Pumped Storage Tech Memo_031015 R1.Docx
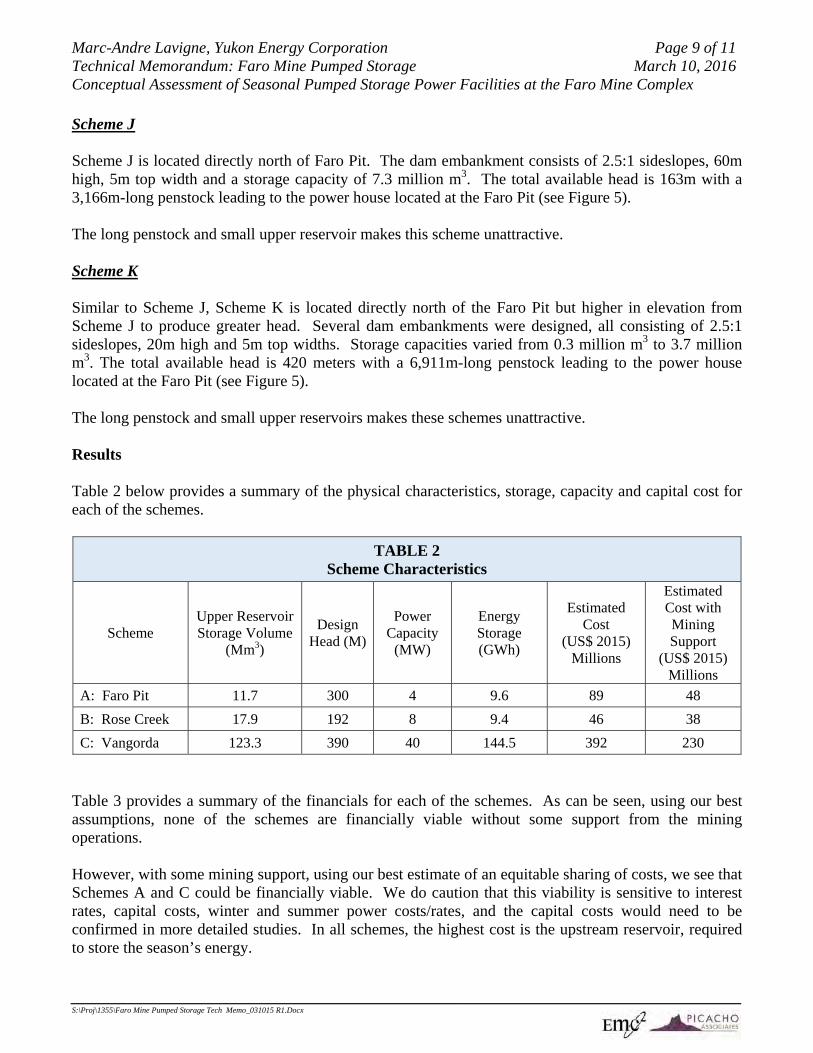
Scheme J Scheme J is located directly north of Faro Pit. The dam embankment consists of 2.5:1 sideslopes, 60m high, 5m top width and a storage capacity of 7.3 million m3. The total available head is 163m with a 3,166m-long penstock leading to the power house located at the Faro Pit (see Figure 5). The long penstock and small upper reservoir makes this scheme unattractive. Scheme K Similar to Scheme J, Scheme K is located directly north of the Faro Pit but higher in elevation from Scheme J to produce greater head. Several dam embankments were designed, all consisting of 2.5:1 sideslopes, 20m high and 5m top widths. Storage capacities varied from 0.3 million m3 to 3.7 million m3. The total available head is 420 meters with a 6,911m-long penstock leading to the power house located at the Faro Pit (see Figure 5). The long penstock and small upper reservoirs makes these schemes unattractive. Results Table 2 below provides a summary of the physical characteristics, storage, capacity and capital cost for each of the schemes.
TABLE 2 Scheme Characteristics
Scheme Upper Reservoir Storage Volume
(Mm3)
Design Head (M)
Power Capacity
(MW)
Energy Storage (GWh)
Estimated Cost
(US$ 2015) Millions
Estimated Cost with Mining Support
(US$ 2015) Millions
A: Faro Pit 11.7 300 4 9.6 89 48
B: Rose Creek 17.9 192 8 9.4 46 38
C: Vangorda 123.3 390 40 144.5 392 230
Table 3 provides a summary of the financials for each of the schemes. As can be seen, using our best assumptions, none of the schemes are financially viable without some support from the mining operations. However, with some mining support, using our best estimate of an equitable sharing of costs, we see that Schemes A and C could be financially viable. We do caution that this viability is sensitive to interest rates, capital costs, winter and summer power costs/rates, and the capital costs would need to be confirmed in more detailed studies. In all schemes, the highest cost is the upstream reservoir, required to store the season’s energy.

Marc-Andre Lavigne, Yukon Energy Corporation Page 10 of 11 Technical Memorandum: Faro Mine Pumped Storage March 10, 2016 Conceptual Assessment of Seasonal Pumped Storage Power Facilities at the Faro Mine Complex
____________________________________________________________________________________ S:\Proj\1355\Faro Mine Pumped Storage Tech Memo_031015 R1.Docx
TABLE 3
Conclusions A range of seasonal pumped storage schemes were found within the relatively small Faro Mine Complex area, showing how rich the area is in potential opportunities for pumped storage.
Cost Item UnitScheme A:
Faro Pit
Scheme A: Faro Pit with Mining (3)
Scheme B: Rose Creek
Scheme B: Rose Creek
with Mining (3)
Scheme C: Vangorda
Scheme C: Vangorda with
Mining (3)
Project Capital Cost 2015 $/kW 22,379$ 3,545$ 5,767$ 4,834$ 9,821$ 5,759$ Capacity MW 4.00 4.00 8.00 8.00 40.00 40.00 Seasonal Storage GWh 9.60 9.60 9.40 9.40 134.00 134.00 Total Capital Cost 89,514,500$ 14,178,580$ 46,139,521$ 38,673,706$ 392,824,500$ 230,374,500$ Debt/Equity 80/20 80/20 80/20 80/20 80/20 80/20Interest Rate (2015) 6% 6% 6% 6% 6% 6%Term Years 40 40 40 40 40 40Principal & Interest ($4,759,417) ($753,864) ($2,453,203) ($2,056,251) ($20,886,176) ($12,248,834)Equity Rate (2015) 9% 9% 9% 9% 9% 9%Equity Return ($1,611,261) ($255,214) ($830,511) ($696,127) ($7,070,841) ($4,146,741)
Annual Amortized Capital Costs /year ($6,370,678) ($1,009,079) ($3,283,714) ($2,752,378) ($27,957,017) ($16,395,575)
Winter Rate $/kWh 0.20$ 0.20$ 0.20$ 0.20$ 0.20$ 0.20$ Summer Rate $/kWh 0.03$ 0.03$ 0.03$ 0.03$ 0.03$ 0.03$ Winter/ Summer Rate 6.67$ 6.67$ 6.67$ 6.67$ 6.67$ 6.67$ Capacity rate $/ kW-yr -$ -$ -$ -$ -$ -$ Transfer Efficiency 82% 82% 82% 82% 82% 82%Winter Energy (generating) GWh 9.60 9.60 9.40 9.40 134.00 134.00Summer Energy (pumping) GWh 11.71 11.71 11.46 11.46 163.41 163.41
Winter Revenue 1,920,000$ 1,920,000$ 1,880,000$ 1,880,000$ 26,800,000$ 26,800,000$ Capacity Revenue -$ -$ -$ -$ -$ -$
Annual Revenue 1,920,000$ 1,920,000$ 1,880,000$ 1,880,000$ 26,800,000$ 26,800,000$
Summer Pumping Cost (351,220)$ (351,220)$ (343,902)$ (343,902)$ (4,902,439)$ (4,902,439)$ Depreciation NA NA NA NA NA NAO&M (2) (232,732) (232,732) (288,515) (288,515) (1,160,514) (1,160,514) Annual Capital Cost (6,370,678)$ (1,009,079)$ (3,283,714)$ (2,752,378)$ (27,957,017)$ (16,395,575)$
Annual Costs (6,954,629)$ (1,593,030)$ (3,916,131)$ (3,384,795)$ (34,019,970)$ (22,458,529)$
Annual Earnings (Pre-Tax) (5,034,629)$ 326,970$ (2,036,131)$ (1,504,795)$ (7,219,970)$ 4,341,471$
Present Value (40 years) (3) (201,385,164)$ 13,078,809$ (81,445,244)$ (60,191,793)$ (288,798,805)$ 173,658,844$
Present Value (50 years) (3, 4) (188,024,675)$ 26,439,298$ (68,969,415)$ (47,715,963)$ (81,428,339)$ 381,029,309$
Notes
1. Shaded cells have variables that can be changed.
2. Based on EPRI Formula. See HDR 2014.
3. Power rates and O&M assumed to increase at rate of inflation for calculation of Present Values.
4. The Present Value based on 50 years assumes that there are no debt payments for the last 10 years.
Conceptual Assessment of Seasonal Pumped Storage Facilities at the Faro Mine ComplexPreliminary Financial Analysis of Options US$2015

Marc-Andre Lavigne, Yukon Energy Corporation Page 11 of 11 Technical Memorandum: Faro Mine Pumped Storage March 10, 2016 Conceptual Assessment of Seasonal Pumped Storage Power Facilities at the Faro Mine Complex
____________________________________________________________________________________ S:\Proj\1355\Faro Mine Pumped Storage Tech Memo_031015 R1.Docx
From the range of schemes studied, the most significant cost in all the schemes is the large upper reservoir and embankment required for the seasonal storage volume. This has a correspondingly large influence on the seasonal pumped storage economics. When comparing seasonal pumped storage schemes to daily or weekly pumped storage schemes, we see that the more frequent use of the upper reservoir by the daily/weekly schemes results in a smaller upper reservoir and better economics. Only when the costs of the upper reservoir are shared by a mining operation do any of the schemes studied become potentially economically viable. When the Vangorda Scheme (Scheme C) is developed in conjunction with the Grizzly resource, we see a yearly income of about US$4 million on an investment of US$230 million. This is largely due to being able to locate the upper reservoir adjacent to the ore deposit, which would allow the mine’s waste rock to be judiciously dumped to form the upper reservoir’s embankment. We are of the opinion that this dumping would cost the mine little, if any more, than if dumped in a conventional heap. As an upper bound, we estimated that the additional dumping cost (due to building a dam rather than a waste dump) could potentially be $4.38/m3 of dumped rock. If this US$4.38/m3 were reduced to a still-credible US$2.38/m3, then the yearly return rises to US$8 million and the investment drops to US$176 million. Another factor influencing project economics is the catchment area to the upper reservoir. Obviously a large catchment provides free energy to the upper reservoir and improves the project economics. Several of the schemes were able to exploit large catchments. Based on this study, we see good potential for seasonal pumped storage facilities co-developed with mining projects, as the plentiful mine waste can be used to inexpensively build the large upper reservoir required by seasonal storage. Of course, the cost of power transmission is also absorbed by the mine development. We see the Yukon Territory itself proving good opportunity for seasonal pumped storage due to the rugged terrain and strong flowing water often providing near-ideal locations. Admittedly, a thorough and intensive search would be needed to find suitable locations. References Report to PacifiCorp, “Energy Storage Screening Study” Final July, 2014, HDR.
Technical Analysis of Pumped Storage and Integration with Wind Power in the Pacific Northwest. U.S. Army Corps of Engineers Northwest Division Hydroelectric Design Center. Final Report August 2009, MWH.
Natural Resources Canada, RETScreen International ‘Clean Energy Project Analysis RETScreen Engineering & Cases Textbook, Small Hydro Project Analysis’, 2004.
Natural Resources Canada, RETScreen Clean Energy Analysis Software, v2013.
Appendices Appendix A: Figures Appendix B: Faro Mine Complex Structural Geology Appendix C: Scheme Costs and Financials

________________________________EMC2 – Picacho_______________________________
APPENDIX A
FIGURES
TECHNICAL MEMORANDUM
FARO MINE PUMPED STORAGE CONCEPTUAL ASSESSMENT OF SEASONAL PUMPED STORAGE POWER
FACILITIES AT THE FARO MINE COMPLEX YUKON ENERGY CORPORATION YUKON TERRITORY, CANADA

File
: G
:\Wor
k Fo
lder
\Eng
inee
ring\
Pro
ject
s\Fa
ro\C
AD
D\2
.0 P
lan
Set
\Far
o S
tora
ge F
igur
es.d
wg
Use
r: Iv
isP
lot D
ate:
Tu
e 15
-Dec
-201
5 - 0
4:24
PM
REV#1 : ISSUED/REVISION POST ISSUED FOR CONSTRUCTION (IFC)ISSUED OR REVISION PRE IFC (IFC: ISSUED FOR CONSTRUCTION)
NOT FORCONSTRUCTION
ISSUED/REVISION:
PROJECT:
TITLE:
DATE ISSUE / REVISION DESCRIPTIONCADD CHECK APP'D YUKON ENERGY
FARO MINE PUMPED STORAGE
FIGURE NO.
A 09/15/15 IOD IOD SJT FOR SITE REVIEW
1819 East Morten Avenue, Suite 100Phoenix, AZ 85020
Office Tel: (602) 331-3859
Cell Tel: (801) 979-4056 Email: [email protected]
PRELIMINARY
B 12/12/15 IOD IOD SJT FOR REPORT
SCHEME E
PUMPED STORAGE OPTIONSALL SCHEMES EXPLORED
1
B
SCHEME A,FARO PIT
SCHEME C(UPPER RESERVOIR)
SCHEME C(LOWER RESERVOIR)
SCHEME D
SCHEME F
SCHEME B,ROSE CREEK
SCHEME G
SCHEME H(UPPER RESERVOIR)
SCHEME H(LOWER RESERVOIR)
SCHEME I
SCHEME J
SCHEME K
GRIZZLYDEPOSIT
FARO PIT
GRUM PIT
VANGORDA PIT
HAULROAD
VANGORDA CREEK
ROSE CREEK
PELLY RIVER
ROSE CREEK
IDSTORAGEVOL. (M3) HEAD (M) ENERGY
GWHCAPACITY
MWPENSTOCK
LENGTH (L) (M)EMBANKMENT
FILL VOL. (2) (M3)
SCHEME A 11.7 M 300 9.6 4 990 1.4 MSCHEME B 17.9 M 192 9.4 8 4,220 0.49 MSCHEME C 123.3 M 390 144.5 40 1,700 27.9 MSCHEME D 205.6 M 310 173.7 40 2,417 23.2 MSCHEME E 22.9 M 300 18.7 8 957 5.6 MSCHEME F 17.1 M 349 16.2 6 2,693 16.1 MSCHEME G 25 M 385 26.2 8 4,200 19.7 MSCHEME H 457 M 660 882 60 6,397 117 MSCHEME I 4.2 M 289 3.3 - 16,615 0.0SCHEME J 7.3 M 163 3.2 - 3,118 2.6 MSCHEME K 3.7 M 420 4.3 - 6,700 0.3 M
NOTES:1. SEASONAL ENERGY STORAGE.2. ASSUMING 2.5H:1V EMBANKMENT SLOPES.
LEGEND
SCHEME RESERVOIR
PIPE/PENSTOCK
TURBINE
PUMP STATION
TREATMENT PLANT
1. EXISTING SURFACE OBTAINED FROM: UNITED STATEGEOLOGICAL SURVEY (USGS) NATIONAL ELEVATIONDATA SET, ELEVATION LAYER OF THE USGS NATIONALMAP.
REFERENCE:
PUMPED STORAGE OPTIONSSCHEMES A, B AND C
2
B
SCHEME B: ROSE CREEK
FARO PIT
SCHEME A: FARO PIT
GRUM PIT
SCHEME C: VANGORDA PIT
VANGORDA PIT
1. ALL IMAGES OBTAINED FROM GOOGLE EARTHV7.1.5.1557, IMAGERY DATE 2013-2015.
REFERENCE:
ROSE CREEKTAILING AREA
HAUL ROAD
VANGORDA CREEK
ROSE CREEK
5C
4B
VANGORDA WASTE DUMPS(CONTOURS ARE APPROXIMATIONS)
ROSE CREEKFARO MINEAREA
VANGORDAPLATEAUAREA
PELLY RIVER
3A
LEGEND
SCHEME RESERVOIR
PIPE/PENSTOCK
3B
SCHEME ID
FIGURE NUMBER WHERESCHEME IS LOCATED
GRIZZLYDEPOSIT
File
: G
:\Wor
k Fo
lder
\Eng
inee
ring\
Pro
ject
s\Fa
ro\C
AD
D\2
.0 P
lan
Set
\Far
o S
tora
ge F
igur
es.d
wg
Use
r: Iv
isP
lot D
ate:
Tu
e 15
-Dec
-201
5 - 0
3:41
PM
REV#1 : ISSUED/REVISION POST ISSUED FOR CONSTRUCTION (IFC)ISSUED OR REVISION PRE IFC (IFC: ISSUED FOR CONSTRUCTION)
NOT FORCONSTRUCTION
ISSUED/REVISION:
PROJECT:
TITLE:
DATE ISSUE / REVISION DESCRIPTIONCADD CHECK APP'D YUKON ENERGY
FARO MINE PUMPED STORAGE
FIGURE NO.
A 09/15/15 IOD IOD SJT FOR SITE REVIEW
1819 East Morten Avenue, Suite 100Phoenix, AZ 85020
Office Tel: (602) 331-3859
Cell Tel: (801) 979-4056 Email: [email protected]
PRELIMINARY
B 12/12/15 IOD IOD SJT FOR REPORT

~1.5:1 (ASSUMED)
UPPER RESERVOIR :STORAGE VOL: 11.7M M3
CATCHMENT VOL: 0.0 M3
EMBANKMENT:FILL VOL: 7.9 M M3
SIDE SLOPE: 3:1TOP ELEV: 1260 MBOTTOM ELEV: 1240 MTOP WIDTH: 5 MHEIGHT=20 M
3
BSCHEME A: FARO PIT
SECTION 1: CUT OF EXISTING WASTE ROCK31
SCALE: NTS
31
BARGE POWER HOUSE:CAPACITY: 4 MW
EXISTING WASTEDUMP
CUT OFWASTE DUMP
EMBANKMENT FORSTORAGE OVER
THE WASTE ROCKMATERIAL
3:1
31
31
3:1
LOWER RESERVOIR ( FARO PITASSUMED VALUES):SIDE SLOPE: 1H:1V
BOTTOM ELEV: 840 MWATER LEVEL ELEV: 1140 M
ESTIMATED TOTAL VOLUME: 134 M³WATER VOLUME: 79M M³
EXISTINGWASTE ROCK
EXISTINGWASTE ROCK
EXISTINGWASTE ROCK
EXISTINGWASTE ROCK
EXISTINGWASTE ROCK
5.00 m
SCHEME A, FARO PIT1A
ROSE CREEKTAILING AREA
HAUL ROAD
PENSTOCK:HEAD= 300 M
MAINTENANCEROAD
File
: G
:\Wor
k Fo
lder
\Eng
inee
ring\
Pro
ject
s\Fa
ro\C
AD
D\2
.0 P
lan
Set
\Far
o S
tora
ge F
igur
es.d
wg
Use
r: Iv
isP
lot D
ate:
Tu
e 15
-Dec
-201
5 - 0
3:57
PM
REV#1 : ISSUED/REVISION POST ISSUED FOR CONSTRUCTION (IFC)ISSUED OR REVISION PRE IFC (IFC: ISSUED FOR CONSTRUCTION)
NOT FORCONSTRUCTION
ISSUED/REVISION:
PROJECT:
TITLE:
DATE ISSUE / REVISION DESCRIPTIONCADD CHECK APP'D YUKON ENERGY
FARO MINE PUMPED STORAGE
FIGURE NO.
A 09/15/15 IOD IOD SJT FOR SITE REVIEW
1819 East Morten Avenue, Suite 100Phoenix, AZ 85020
Office Tel: (602) 331-3859
Cell Tel: (801) 979-4056 Email: [email protected]
PRELIMINARY
B 12/12/15 IOD IOD SJT FOR REPORT
20 m
LEGEND
EXISTING GROUND SURFACE
20" STEEL PIPELINE (SUMMER USAGE, PRESSURE SYSTEM)
24" HDPE PIPELINE SDR 7 (SUMMER USAGE,PRESSURE SYSTEM)
PENSTOCK
PUMP STATION
TURBINE
RESERVOIR CATCHMENT AREAS
WATER TANK
TREATMENT PLANT
SEEPAGE
WATER TANK: 9M DIA. BY 3M HIGH
BOOSTER PUMP STATION 2:NUMBER OF PUMPS: 6
PUMP HORSE POWER: 1,250 HPPUMP MAX. FLOW: 3,000 GPM (PER PUMP)
UPPER RESERVOIR:STORAGE VOL:17.9M M³CATCHMENT AREA: 13.3M M2
CATCHMENT VOL: 3.2M M3/YR
EMBANKMENT:FILL VOL: 773,271 M³SIDE SLOPE: 2.5H:1VTOP WIDTH: 5 MHEIGHT : 27 M
4
B
PENSTOCK:HEAD=192 M
BOOSTER PUMP STATION 1:NUMBER OF PUMPS: 6PUMP HORSE POWER: 1,250 HPPUMP MAX. FLOW: 3,000 GPM (PER PUMP)
SCHEME B, ROSE CREEK1B
FARO PIT
GRUM PIT
VANGORDA PIT
ROSE CREEK TAILING AREAS
ROSE CREEK
SCHEME B: ROSE CREEK
ROSE CREEK
PELLY RIVER
OPEN CHANNEL
HAUL ROAD
POWER HOUSE:TURBINE RUNNER SIZE: 1.01 M
CAPACITY: 8 MW
MAINTENANCEROAD
EXTENT OFWATERSTORAGE
GRIZZLYDEPOSIT
File
: G
:\Wor
k Fo
lder
\Eng
inee
ring\
Pro
ject
s\Fa
ro\C
AD
D\2
.0 P
lan
Set
\Far
o S
tora
ge F
igur
es.d
wg
Use
r: Iv
isP
lot D
ate:
Tu
e 15
-Dec
-201
5 - 0
4:22
PM
REV#1 : ISSUED/REVISION POST ISSUED FOR CONSTRUCTION (IFC)ISSUED OR REVISION PRE IFC (IFC: ISSUED FOR CONSTRUCTION)
NOT FORCONSTRUCTION
ISSUED/REVISION:
PROJECT:
TITLE:
DATE ISSUE / REVISION DESCRIPTIONCADD CHECK APP'D YUKON ENERGY
FARO MINE PUMPED STORAGE
FIGURE NO.
A 09/15/15 IOD IOD SJT FOR SITE REVIEW
1819 East Morten Avenue, Suite 100Phoenix, AZ 85020
Office Tel: (602) 331-3859
Cell Tel: (801) 979-4056 Email: [email protected]
PRELIMINARY
B 12/12/15 IOD IOD SJT FOR REPORT
POTENTIAL
INFLOW
LEGEND
EXISTING GROUND SURFACE
PENSTOCK
PUMP STATION
TURBINE
RESERVOIR CATCHMENT AREAS
5
B
SCHEME C, VANGORDA PIT1C
ROSE CREEK
SCHEME C: VANGORDA PIT
VANGORDA CREEK
GRIZZLYDEPOSIT
UPPER RESERVOIR:STORAGE VOL: 123.3M M³CATCHMENT AREA: 26.3M M2
CATCHMENT VOL: 6.3M M³/YR
EMBANKMENT:FILL VOL: 34.7M M³SIDE SLOPE: 2.5H:1VTOP WIDTH: 5MTOP ELEV: 1195 MBOTTOM ELEV: 1100 MHEIGHT: 95 M
LOWER RESERVOIR:STORAGE VOL: 70.5M M³CATCHMENT AREA: 415.9M M2
CATCHMENT VOL: 99.8M M³/YR
EMBANKMENT:FILL VOL: 1.4M M³SIDE SLOPE: 2.5H:1VTOP WIDTH: 5MTOP ELEV: 790 MBOTTOM ELEV: 720 MHEIGHT: 70 M
DRAINAGESLOT
GRUM PIT (ASSUMED VALUES):SIDE SLOPE: 1H:1V
TOP ELEV: 1295 MBOTTOM ELEV: 1195 M
WATER LEVEL ELEV: 1295 MWATER STORAGE: 8.9M M³
VANGORDA PIT (ASSUMED VALUES):SIDE SLOPE: 1H:1V
TOP ELEV: 1125 MBOTTOM ELEV: 1025 M
WATER LEVEL ELEV: 1125 MWATER STORAGE: 3.3M M³
VANGORDA WASTE DUMPS(CONTOURS WERE APPROXIMATED
USING A SIDES LOPE OF 1.5H:1V ANDTOP ELEVATION OF1250 M)
PENSTOCK:HEAD= 390 M
MAINTENANCEROAD
EXTENTOF WATERSTORAGE
EXTENTOF WATERSTORAGE
PELLY RIVER
HAUL ROAD
EMERGENCYSPILLWAY
POWER HOUSE:TURBINE RUNNER SIZE= 1.73
CAPACITY: 40MW
File
: G
:\Wor
k Fo
lder
\Eng
inee
ring\
Pro
ject
s\Fa
ro\C
AD
D\2
.0 P
lan
Set
\Far
o S
tora
ge F
igur
es.d
wg
Use
r: Iv
isP
lot D
ate:
Tu
e 15
-Dec
-201
5 - 0
4:17
PM
REV#1 : ISSUED/REVISION POST ISSUED FOR CONSTRUCTION (IFC)ISSUED OR REVISION PRE IFC (IFC: ISSUED FOR CONSTRUCTION)
NOT FORCONSTRUCTION
ISSUED/REVISION:
PROJECT:
TITLE:
DATE ISSUE / REVISION DESCRIPTIONCADD CHECK APP'D YUKON ENERGY
FARO MINE PUMPED STORAGE
FIGURE NO.
A 09/15/15 IOD IOD SJT FOR SITE REVIEW
1819 East Morten Avenue, Suite 100Phoenix, AZ 85020
Office Tel: (602) 331-3859
Cell Tel: (801) 979-4056 Email: [email protected]
PRELIMINARY
B 12/12/15 IOD IOD SJT FOR REPORT
________________________________EMC2 – Picacho_______________________________
APPENDIX B
FARO MINES COMPLEX STRUCTURAL GEOLOGY
TECHNICAL MEMORANDUM
FARO MINE PUMPED STORAGE CONCEPTUAL ASSESSMENT OF SEASONAL PUMPED STORAGE POWER
FACILITIES AT THE FARO MINE COMPLEX YUKON ENERGY CORPORATION YUKON TERRITORY, CANADA

Page 1 of 10
Vangorda Pumped Storage Feasibility Study
Author: H. Blyth, P. Geo. of Blyth Consulting
Location
The Faro area, which in this report includes the Vangorda and Grum pits as well as the Grizzly deposit, is
located within central Yukon, approximately 10 kilometres east of Faro, at 62°14'20.67"N, 133° 9'2.87"W
(Figure 1).
Figure 1: Study area, including approximate catchments in green and magenta
Climate
Typical of much of the Yukon, climate in the Faro area consists of long cold winters and warm summers
ranging from ‐60° to +35° Celsius (C) but average about ‐23° in the winter and 19° C in the summer.
Total annual precipitation is ranges from 300‐400 mm, with a little over two‐thirds falling as rain one‐
third as snow. Winter snow pack rarely exceeds 1 metre in depth (McFaull, 1996).

Page 2 of 10
Physiography
Faro, Yukon lies in the north of the western most physiographic region of Canada known as the
Canadian Cordilleran physiographic region (Fulton, 1989). The complex nature of the Cordilleran Region
encompasses steep mountains with narrow valleys, plains and plateaus. The Faro, Grum, Vangorda and
Grizzly sites are located within the Anvil District of the Yukon Plateau physiographic subdivision. At the
core of this district is the Anvil Range, which rises to 1800 metres above sea level (m asl) and is flanked
by the midland, Vangorda Plateau.
The Canadian Cordillera is composed of five northwest‐trending morphogeological belts (Hart, 2002),
which are parallel to the continental margin (Figure 2). The Faro area lies within the glaciated portion of
the Omineca Belt, the most varied complex of the five morphogeological belts, composed of a variety of
metamorphosed sedimentary and granitic rock (Hart, 2002). The Omineca Belt presents itself as large
mountain ranges with localized centres of high mountains called massifs. The Massifs tend to centre on
granitic intrusions whose heat has metamorphosed the surrounding sedimentary bedrock (Hart, 2002).
Figure 2: The five northwest‐trending morphogeological belts of the Canadian Cordillera (After: Hart, 2002)
The study area lies at the edge of the Tintina Trench/Valley and the McMillan Plateau (Bostock, 1948)
and ranges in elevations from 1120 m asl to as high as 2050 m asl in the upslope catchment areas
(Figure 1).
Page 3 of 10
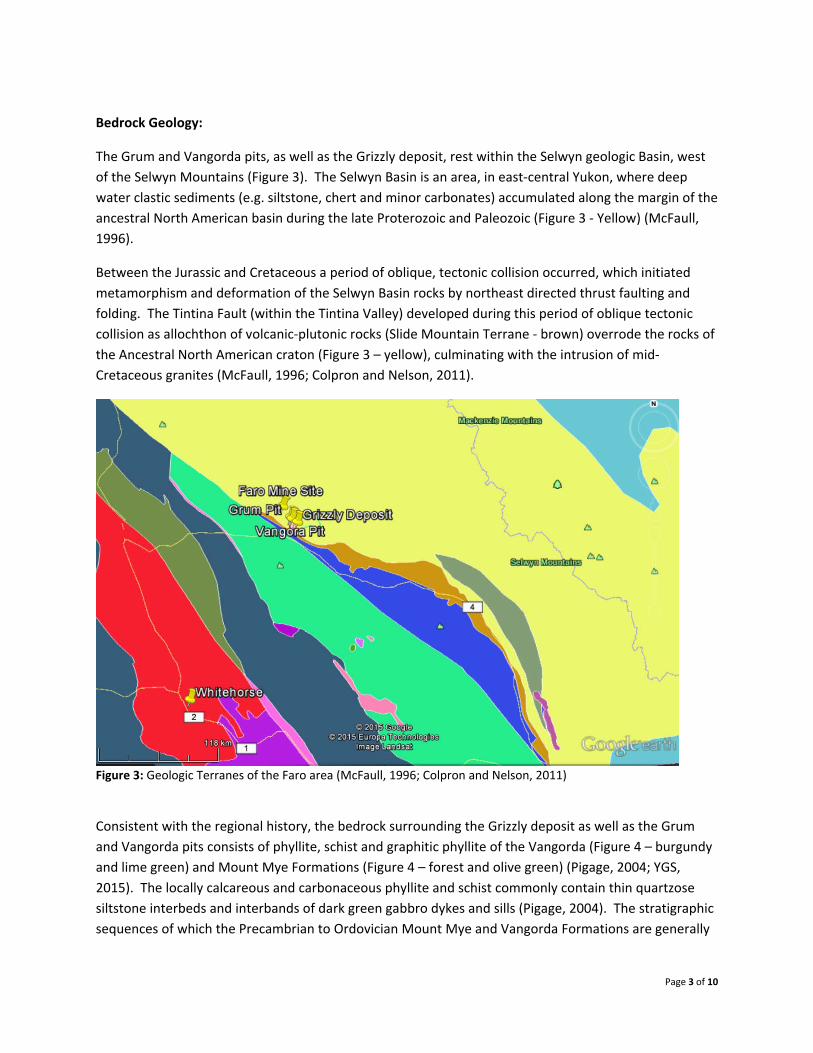
Bedrock Geology:
The Grum and Vangorda pits, as well as the Grizzly deposit, rest within the Selwyn geologic Basin, west
of the Selwyn Mountains (Figure 3). The Selwyn Basin is an area, in east‐central Yukon, where deep
water clastic sediments (e.g. siltstone, chert and minor carbonates) accumulated along the margin of the
ancestral North American basin during the late Proterozoic and Paleozoic (Figure 3 ‐ Yellow) (McFaull,
1996).
Between the Jurassic and Cretaceous a period of oblique, tectonic collision occurred, which initiated
metamorphism and deformation of the Selwyn Basin rocks by northeast directed thrust faulting and
folding. The Tintina Fault (within the Tintina Valley) developed during this period of oblique tectonic
collision as allochthon of volcanic‐plutonic rocks (Slide Mountain Terrane ‐ brown) overrode the rocks of
the Ancestral North American craton (Figure 3 – yellow), culminating with the intrusion of mid‐
Cretaceous granites (McFaull, 1996; Colpron and Nelson, 2011).
Figure 3: Geologic Terranes of the Faro area (McFaull, 1996; Colpron and Nelson, 2011)
Consistent with the regional history, the bedrock surrounding the Grizzly deposit as well as the Grum
and Vangorda pits consists of phyllite, schist and graphitic phyllite of the Vangorda (Figure 4 – burgundy
and lime green) and Mount Mye Formations (Figure 4 – forest and olive green) (Pigage, 2004; YGS,
2015). The locally calcareous and carbonaceous phyllite and schist commonly contain thin quartzose
siltstone interbeds and interbands of dark green gabbro dykes and sills (Pigage, 2004). The stratigraphic
sequences of which the Precambrian to Ordovician Mount Mye and Vangorda Formations are generally

Page 4 of 10
composed consist of: deep marine schists and phyllite sequences intruded by granite, granodiorite and
quartz monzonite of the Anvil Range Plutonic suite (Robertson and Kirsten, 2002).
Figure 4: Detailed geology of the Faro area (After: Pigage, 2004)
Mineral Reserves
Yukon metallurgical deposits are typically located along the margins of Selwyn Basin in fault‐controlled
basins and troughs (MacIntyre, 2005). The Grum and Vangorda deposits appear to rest on or near a
north‐south trending normal fault. The Grizzly deposit may also be associated with a northeast‐
southwest trending strike‐slip fault (Pigage, 2004). The following table (Table 1) shows proven or
inferred reserves for the Faro, Dy (Grizzly), Grum and Vangorda deposits.

Page 5 of 10
Acid Rock Drainage:
Acid Rock Drainage (ARD) refers to the outflow of acidic water as a common side effect to with mining
projects associated with metal sulphides (Spitz and Trudinger, 2009). Though the generation of
sulphuric acid is a natural occurrence over thousands of years of weathering of sulphide bearing rocks,
mining accelerates the process by fragmenting and exposing sulphide bearing materials to the
atmosphere and removing the filtering topsoil layers (Spitz and Trudinger, 2009).
As the rock types in the Vangorda, Grum and Grizzly deposits are similar to those of the sulphide rich
Faro Mine site (YGS, 2014, IPRP, 2007), which is presently undergoing treatment for ARD, ARD should be
expected throughout the study area.

Page 6 of 10
Seismic Activity:
The northern Cordillera and southwestern Yukon Territories are some of the most seismically active
areas of Canada. The largest earthquake recorded in this area, to date, is the magnitude 6.9 earthquake
of December 23, 1985 in the Mackenzie Mountains of the Northwest Territories and numerous
magnitude 6‐plus earthquakes have occurred in the Richardson Mountains of the Yukon Territory (NRC,
2015). The central Yukon (e.g. around Faro, Yukon) shows signs of moderate to low seismic activity
(Figure 5) (NRC, 2015).
Figure 5: Earthquakes in the Yukon from 1627‐2012 (X is the approximate location of Faro Yukon)
Surficial Geology:
The Faro region has undergone several glaciations, the last of which occurred between 25,000 and
10,000 years ago in the Late Wisconsinan and is known as the McConnell Glaciation (Bond, 2001).
Significant surficial materials were deposited during this period including thin till veneers (<1m thick)
and blankets (>lm thick), which cover much of the mid to upper slopes. Glaciofluvial (glacial river) sand
and gravel and glaciolacustrine (lake) silts, sands and clays are common on low valley slopes flanking
active drainage channels. Recent alluvium and organic deposits are found throughout the mid to lower
valleys while veneers of colluviated till and rock blanket the upland slopes. Figure 6 below, shows the
surficial geology of the Faro area followed by a written description of their common characteristics.

Page 7 of 10
Figure 6: The surficial geology of the Faro area (After: Bond, 2001, 1999)
Green = Till (may contain oversized material, otherwise it consists of clay to boulder sized clasts, is abundant in the area and should compact well for embankments).
Orange = Glaciofluvial sand and gravel (tends to consists of interbedded sand to boulder gravel; is generally a good source of aggregate/construction material; and tends to be very porous unless interbedded with fine, glaciolacustrine sediments). There appears to be a reasonable sized source up stream of the Grum pit and downslope of the Grizzly Deposit.
Purple = Glaciolacustrine sediments (interbedded sand, silt and clay with rare drop‐stones; commonly contains low porosity layers of silt and clay but is potentially unstable, particularly if undercut). If needed, there appears to be a source up valley of the Grum pit. The source up slope of the Grum pit indicates post‐glacial lake impoundment; expect sub‐surface glacial lacustrine deposits and seepage below the colluvium in this area.
Grey = Organic (poorly decomposed organic material; tends to be prone to seepage and permafrost). Small occurrences may be found throughout the area, the largest notable ones are due east of Vangorda pit, northwest of the Grum pit and below the Grizzly deposit in the valley.
White = Anthropogenic. These are areas altered by human activity and would need to be seen to determine porosity/seepage and other characteristics.
Beige = Fluvial material (interbedded silt, sand and gravel; usually porous, a good source of aggregate if away from active riparian zones). There may be available deposits down slope of the Grizzly deposit.
Magenta = Bedrock and colluviated till (bedrock colluvium in these area may be useful as construction material but the characteristics of each deposit will be variable depending on the source).
Dark reddish brown = Colluvium over bedrock (irregular porosity due to stratification and variable source material).
Notes: Seepage commonly occurs between materials of varied texture and compaction. This includes
any surficial material contacting bedrock, stratified surficial materials and textural variations derived
along weathering fronts.

Page 8 of 10
Permafrost is soil or rock that remains frozen from one year to the next and may or may not contain
significant quantities of ice. Permafrost covers approximately 25% southern Yukon and is continuous
north of Dawson but the Faro area is within what is known as The Extensive Discontinuous Permafrost
Zone where anywhere from 50‐90% of the ground may be frozen (YGS, 2015b).
Warming and thawing of permafrost occurs in response to fires, climate change and to environmental
disturbances associated with human activity and can cause ground instability and alter drainage
patterns. Warming, thawing and refreezing of permafrost has implications for natural systems and
infrastructure integrity, including but not limited to, landslides and ground subsidence (thermokarst).
The extent of permafrost in the project area should be established during the planning stage of any
construction project in this area to avoid structural problems, cost overruns and slope instability.
Summary
Upon completion of this preliminary desktop review there appears to be extensive till and some
glaciolacustrine sediment, which should prove an acceptable aquatard for a pumped storage facility in
the Vangorda area.
The geology at the Vangorda, DY (Grizzly) and Grum sites is similar to that of the very productive Faro
mine site. The reserves, though requiring further confirmation at the DY (Grizzly) site, appear richer in
silver, lead, zinc and gold than at the confirmed Faro mine site and even at the Grum site appear similar
or better than those at the mined‐out Faro site. This similarity, with the Faro mine site also extends to
the bedrock being conducive to acid rock drainage.
Recommendations
A detailed gap analysis should be conducted to identify data weaknesses in the bedrock and surficial
geologic knowledge of the area. This could include but not be limited to: bedrock distribution, specific
ARD susceptibilities, stratigraphy and structural characteristics, material depths, distributions, textural
and drainage characteristics; as well as detailed permafrost characteristics, avalanche, slope stability
issues and the geochemical characteristics of potential aquitard materials. Accurately locating contacts
between various materials (e.g. interbeds of porous and non‐porous material) and structures (e.g. faults
or sharp contacts) as well as textural and geochemical characteristics of till, glaciolacustrine and mineral
deposits will be paramount to the success of this project.

Page 9 of 10
References
Abbott, J.G., Gordey, S.P. and Tempelman‐Kluit, D.J., 1987. Setting of stratiform, sediment‐hosted lead‐zinc deposits in Yukon and northeastern British Columbia. In: Mineral Deposits of Northern Cordillera Symposium, Canadian Institute of Mining and Metallurgy, J.A. Morin, (ed.), Canadian Institute of Mining and Metallurgy, Special Volume 37, p. 1‐18.
Bond, 1999, Mount Mye and Faro (105K/3&6 E), YGS Open File 1999‐7
Colpron, M. and Nelson, J.L., 2011. A Digital Atlas of Terranes for the Northern Cordillera. Accessed online from Yukon Geological Survey (www.geology.gov.yk.ca), September 27, 2015.
NTS 105K/3 NE; 105K/6 SE ‐ Bond, J.D., 1999. Surficial geology map and till geochemistry of Mount Mye and Faro (105K/3&6 E), Central Yukon. YGS Open File 1999‐7, 1:25 000 scale.
Bostock, H.S., 2014. Geology, Physiographic Regions of Canada; Geological Survey of Canada, Map 1254A (2nd edition), scale 1:5 000 000. doi:10.4095/293408.
Robertson, S and Kirsten (Canada) Inc. (2002) Anvil Range Mining Corporation Interim Receivership Phase 1 Borrow Source Survey, pp.34.
Fulton, R.J. (ed.), (1989)Quaternary Geology of Canada and Greenland, Geological Survey of Canada Geology of Canada, no. 1 (also Geological Society of America, The Geology of North America, K‐1), I‐II.
Hart, C. (2002) The Geological Framework of the Yukon Territory, Yukon Geological Survey p.p. 11.
Horvath, J. (2011) Development and Implementation of a Closure and Remediation Plan: A Case Study of the Faro Mine Closure Project, YT. Queens University Thesis, Kingston, Ontario, pp. 34.
IPRP (2007) Review of Remediation Alternatives for the Anvil Range Mine Complex Final Report.
Lipovsky, P.S. & Bond, J.D. (compilers), 2014. Yukon digital surficial geology compilation, digital release 1, 08‐Apr‐2014, <insert layer name if applicable>. Yukon Geological Survey.
MacIntyre, D (2005) Sedimentary Exhalative (SEDEX) Zn‐Pb‐Ag, British Columbia Geological Survey, Victoria, B.C., Canada, p. 1‐7.
Natural Resources Canada website into Seismic Zones of Western Canada: http://www.earthquakescanada.nrcan.gc.ca/zones/westcan‐eng.php#Ncordillera.
Pigage, L.C., (2001) Geological map of Faro (NTS 105K/3 NW) & Mount Mye (NTS 105K/6 SW), central Yukon (1:25,000 scale). Exploration and Geological Services Division, Yukon Region, Indian and Northern Affairs Canada, Open File 2001‐26.
Spitz, K. and Trudinger, J. (2009) Mining and the Environment. London, UK: Taylor and Francis Group.
Yukon Geological Survey (2014) Selwyn Basin Metallogeny pp. 55. http://www.geology.gov.yk.ca/metallogeny_projects.html

Page 10 of 10
Yukon Geological Survey (2015a) Bedrock Geological Compilation http://data.geology.gov.yk.ca/Compilation/3
Yukon Geological Survey (2015b) Permafrost in the Yukon http://www.geology.gov.yk.ca/yukon_permafrost.html

________________________________EMC2 – Picacho_______________________________
APPENDIX C
SCHEME COSTS AND FINANCIALS
TECHNICAL MEMORANDUM
FARO MINE PUMPED STORAGE CONCEPTUAL ASSESSMENT OF SEASONAL PUMPED STORAGE POWER
FACILITIES AT THE FARO MINE COMPLEX YUKON ENERGY CORPORATION YUKON TERRITORY, CANADA

Conceptual Assessment of Seasonal Pumped Storage Facilities at the Faro Mine ComplexScheme A: Faro Pit
Preliminary Cost Estimate US$2015
Work Item UnitUnit Cost
(2015 US$)Estimated Quantity
Estimated Cost
Direct Costs (supply and install without profit and overhead)ReservoirsUpper Reservoir Embankment (cut to fill) m3 6 7,900,000 $ 47,400,000 Upper Reservoir Liner (80 mil HDPE on bedding) m2 12 775,000 $ 9,300,000 Lower Reservoir (Upgrade) sum 200,000 1 $ 200,000 Penstocks & Power Station ComplexPenstocks Excavation/Anchoring/Intake sum 200,000 1 $ 200,000
Penstock pipe (d=500mm, tav=7mm). 4 m 730 600 $ 438,000
Barge Pump Platform and Ancillaries. sum 350,000 1 $ 350,000 Maintenance/ Access Roads m 100 500 $ 50,000 Equipment (supply and install without profit and overhead)Substation sum $ 85,000 1 $ 85,000
Mechanical/ Electrical Equipment. 5. sum $ 1,150,000 1 $ 1,150,000
Sub-Total Direct Costs $ 59,173,000
General RequirementsLand acquisition/ rights sum $ 500,000 1 $ 500,000 Water Fill m3 $ - - $ - Additional Power Line m $ 250 500 $ 125,000 Feasibility Studies, including geotech, water quality investigations, etc. sum $ 130,000 1 $ 130,000
Engineering Procurement, Permitting/Licensing 1, 2 % $ 2 - $ 1,183,460
Construction Management, Surveying, QA/QC % $ 2 - $ 1,183,460 Sub-Total General Requirements Costs $ 3,121,920
Indirect Costs (as a percentage of direct costs)Contractor Mobilization/ Demobilization % $ 3 - $ 1,775,190 Contractor Site Personnel and Other Indirect Costs % $ 8 - $ 4,733,840 Contractor Profit/ Overhead % $ 10 - $ 5,917,300 Contingency/Unpriced Items/Market Conditions % $ 25 - $ 14,793,250 Sub-Total Indirect Costs $ 27,219,580
Total Project Cost (-20% to +50%) $ 89,514,500 Notes:
1. Percentages are percent of direct costs.
3. None.
2. Assume most environmental compliances are in place.
P=4MW, E=9.6GWh, h=300m, L=600m, V=11.7M m3
4. Above-ground penstocks with special provision for pipe articulation joints.
5. Supply and install electromechanical equipment including the turbine-generator(s), governor and controls, electrical protection and control (including remote monitoring system and powerhouse electrical equipment), pumps, gates, powerhouse crane.
Faro Pumped Storage Scheme Costs Financials.xlsx Page 1 of 1
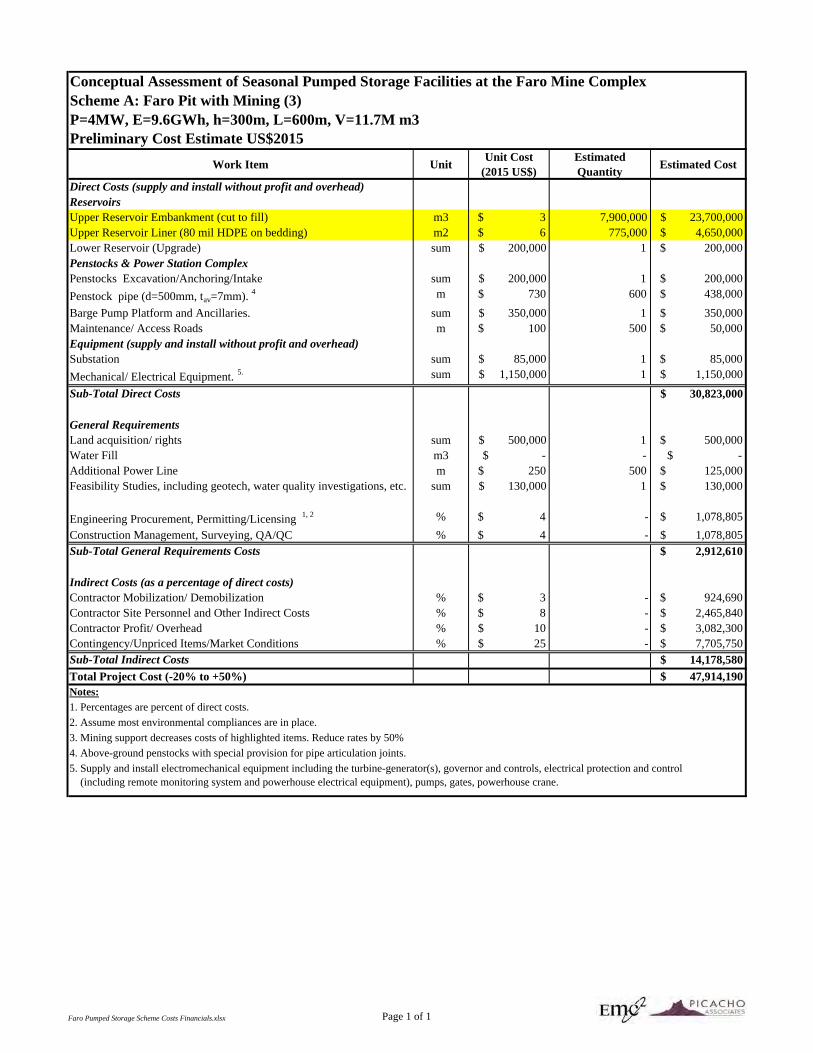
Conceptual Assessment of Seasonal Pumped Storage Facilities at the Faro Mine ComplexScheme A: Faro Pit with Mining (3)
Preliminary Cost Estimate US$2015
Work Item UnitUnit Cost
(2015 US$)Estimated Quantity
Estimated Cost
Direct Costs (supply and install without profit and overhead)ReservoirsUpper Reservoir Embankment (cut to fill) m3 $ 3 7,900,000 $ 23,700,000 Upper Reservoir Liner (80 mil HDPE on bedding) m2 $ 6 775,000 $ 4,650,000 Lower Reservoir (Upgrade) sum $ 200,000 1 $ 200,000 Penstocks & Power Station ComplexPenstocks Excavation/Anchoring/Intake sum $ 200,000 1 $ 200,000
Penstock pipe (d=500mm, tav=7mm). 4 m $ 730 600 $ 438,000
Barge Pump Platform and Ancillaries. sum $ 350,000 1 $ 350,000 Maintenance/ Access Roads m $ 100 500 $ 50,000 Equipment (supply and install without profit and overhead)Substation sum $ 85,000 1 $ 85,000
Mechanical/ Electrical Equipment. 5. sum $ 1,150,000 1 $ 1,150,000
Sub-Total Direct Costs $ 30,823,000
General RequirementsLand acquisition/ rights sum $ 500,000 1 $ 500,000 Water Fill m3 $ - - $ - Additional Power Line m $ 250 500 $ 125,000 Feasibility Studies, including geotech, water quality investigations, etc. sum $ 130,000 1 $ 130,000
Engineering Procurement, Permitting/Licensing 1, 2 % $ 4 - $ 1,078,805
Construction Management, Surveying, QA/QC % $ 4 - $ 1,078,805 Sub-Total General Requirements Costs $ 2,912,610
Indirect Costs (as a percentage of direct costs)Contractor Mobilization/ Demobilization % $ 3 - $ 924,690 Contractor Site Personnel and Other Indirect Costs % $ 8 - $ 2,465,840 Contractor Profit/ Overhead % $ 10 - $ 3,082,300 Contingency/Unpriced Items/Market Conditions % $ 25 - $ 7,705,750 Sub-Total Indirect Costs $ 14,178,580
Total Project Cost (-20% to +50%) $ 47,914,190 Notes:
1. Percentages are percent of direct costs.
4. Above-ground penstocks with special provision for pipe articulation joints.
5. Supply and install electromechanical equipment including the turbine-generator(s), governor and controls, electrical protection and control (including remote monitoring system and powerhouse electrical equipment), pumps, gates, powerhouse crane.
3. Mining support decreases costs of highlighted items. Reduce rates by 50%
2. Assume most environmental compliances are in place.
P=4MW, E=9.6GWh, h=300m, L=600m, V=11.7M m3
Faro Pumped Storage Scheme Costs Financials.xlsx Page 1 of 1

Conceptual Assessment of Seasonal Pumped Storage Facilities at the Faro Mine ComplexScheme B: Rose CreekP=8MW, E=9.4GWh, L=4220m, V=17.9M m3Preliminary Cost Estimate US$2015
Work Item UnitUnit Cost
(2015 US$)Estimated Quantity
Estimated Cost
Direct Costs (supply and install without profit and overhead)
TreatmentLime Treatment Plant Sum $ 5,000,000 1 $ 5,000,000 Water SupplyOpen Channel m $ 500 1,253 $ 626,500 Vertical Pump + Motor Each $ 350,000 12 $ 4,200,000 Steel Pipeline (600 mm diameter) m $ 630 3,845 $ 2,422,350 HDPE Pipeline (400mm diameter) m $ 412 7,512 $ 3,094,944 Water Tank (Steel) Each $ 45,000 1 $ 45,000 Maintenance Road m $ 100 4,041 $ 404,100 ReservoirsUpper Reservoir Embankment m3 $ 6 773,271 $ 4,639,626 Upper Reservoir Liner (assume run-on equals seepage) m2 $ 12 - $ - Lower Reservoir Embankment m3 5$ - $ - Lower Reservoir Liner m2 $ 12 - $ - Penstocks & Power Station ComplexPenstocks Excavation/Anchoring/Intake sum $ 1,500,000 1 $ 1,500,000
Penstock pipe (d=1m, tav=7mm). 4 m $ 800 4,220 $ 3,376,000
Power Station Complex (above ground) sum $ 500,000 1 $ 500,000 Maintenance/ Access Roads m $ 100 550 $ 55,000 Equipment (supply and install without profit and overhead)Substation sum $ 155,000 1 $ 155,000
Mechanical/ Electrical Equipment. 5. sum $ 2,400,000 1 $ 2,400,000
Sub-Total Direct Costs $ 28,418,520
General RequirementsLand acquisition/ rights sum $ 1,000,000 1 $ 1,000,000 Water Fill m3 $ - - $ - Additional Power Line m $ 250 3,500 $ 875,000 Feasibility Studies, including geotech investigations. sum $ 500,000 1 $ 500,000
Engineering Procurement, Permitting/Licensing 1, 2 % $ 4.00 - $ 1,136,741
Construction Management, Surveying, QA/QC % $ 4.00 - $ 1,136,741 Sub-Total General Costs $ 4,648,482
Indirect Costs (as a percentage of direct costs)Contractor Mobilization/ Demobilization % $ 3 - $ 852,556 Contractor Site Personnel and Other Indirect Costs % $ 8 - $ 2,273,482 Contractor Profit/ Overhead % $ 10 - $ 2,841,852 Contingency/Unpriced Items/Market Conditions % $ 25 - $ 7,104,630 Sub-Total Indirect Costs $ 13,072,519
Total Project Cost (-20% to +50%) $ 46,139,521 Notes:
1. Percentages are percent of direct costs.
2. Assume most environmental compliances are in place.
3. None.
4. Above-ground penstocks.
5. Supply and install electromechanical equipment including the turbine-generator(s), governor and controls, electrical protection and control (including remote monitoring system and powerhouse electrical equipment), pumps, gates, powerhouse crane.
Faro Pumped Storage Scheme Costs Financials.xlsx Page 1 of 1

Conceptual Assessment of Seasonal Pumped Storage Facilities at the Faro Mine ComplexScheme B: Rose Creek with Mining (3)P=8MW, E=9.4GWh, L=4220m, V=17.9M m3Preliminary Cost Estimate US$2015
Work Item UnitUnit Cost
(2015 US$)Estimated Quantity
Estimated Cost
Direct Costs (supply and install without profit and overhead)
TreatmentLime Treatment Plant Sum $ 5,000,000 0 $ - Water SupplyOpen Channel m $ 500 1,253 $ 626,500 Vertical Pump + Motor Each $ 350,000 12 $ 4,200,000 Steel Pipeline (600 mm diameter) m $ 630 3,845 $ 2,422,350 HDPE Pipeline (400mm diameter) m $ 412 7,512 $ 3,094,944 Water Tank (Steel) Each $ 45,000 1 $ 45,000 Maintenance Road m $ 100 4,041 $ 404,100 ReservoirsUpper Reservoir Embankment m3 $ 6 773,271 $ 4,639,626 Upper Reservoir Liner (assume run-on equals seepage) m2 $ 12 - $ - Lower Reservoir Embankment m3 5$ - $ - Lower Reservoir Liner m2 $ 12 - $ - Penstocks & Power Station ComplexPenstocks Excavation/Anchoring/Intake sum $ 1,500,000 1 $ 1,500,000
Penstock pipe (d=1m, tav=7mm). 4 m $ 800 4,220 $ 3,376,000
Power Station Complex (above ground) sum $ 500,000 1 $ 500,000 Maintenance/ Access Roads m $ 100 550 $ 55,000 Equipment (supply and install without profit and overhead)Substation sum $ 155,000 1 $ 155,000
Mechanical/ Electrical Equipment. 5. sum $ 2,400,000 1 $ 2,400,000
Sub-Total Direct Costs $ 23,418,520
General RequirementsLand acquisition/ rights sum $ 1,000,000 1 $ 1,000,000 Water Fill m3 $ - - $ - Additional Power Line m $ 250 3,500 $ 875,000 Feasibility Studies, including geotech investigations. sum $ 500,000 1 $ 500,000
Engineering Procurement, Permitting/Licensing 1, 2 % $ 4.50 - $ 1,053,833
Construction Management, Surveying, QA/QC % $ 4.50 - $ 1,053,833 Sub-Total General Costs $ 4,482,667
Indirect Costs (as a percentage of direct costs)Contractor Mobilization/ Demobilization % $ 3 - $ 702,556 Contractor Site Personnel and Other Indirect Costs % $ 8 - $ 1,873,482 Contractor Profit/ Overhead % $ 10 - $ 2,341,852 Contingency/Unpriced Items/Market Conditions % $ 25 - $ 5,854,630 Sub-Total Indirect Costs $ 10,772,519
Total Project Cost (-20% to +50%) $ 38,673,706 Notes:
1. Percentages are percent of direct costs.
5. Supply and install electromechanical equipment including the turbine-generator(s), governor and controls, electrical protection and control (including remote monitoring system and powerhouse electrical equipment), pumps, gates, powerhouse crane.
2. Assume most environmental compliances are in place.
3. Assume mining support takes away treatment plant.
4. Above-ground penstocks.
Faro Pumped Storage Scheme Costs Financials.xlsx Page 1 of 1
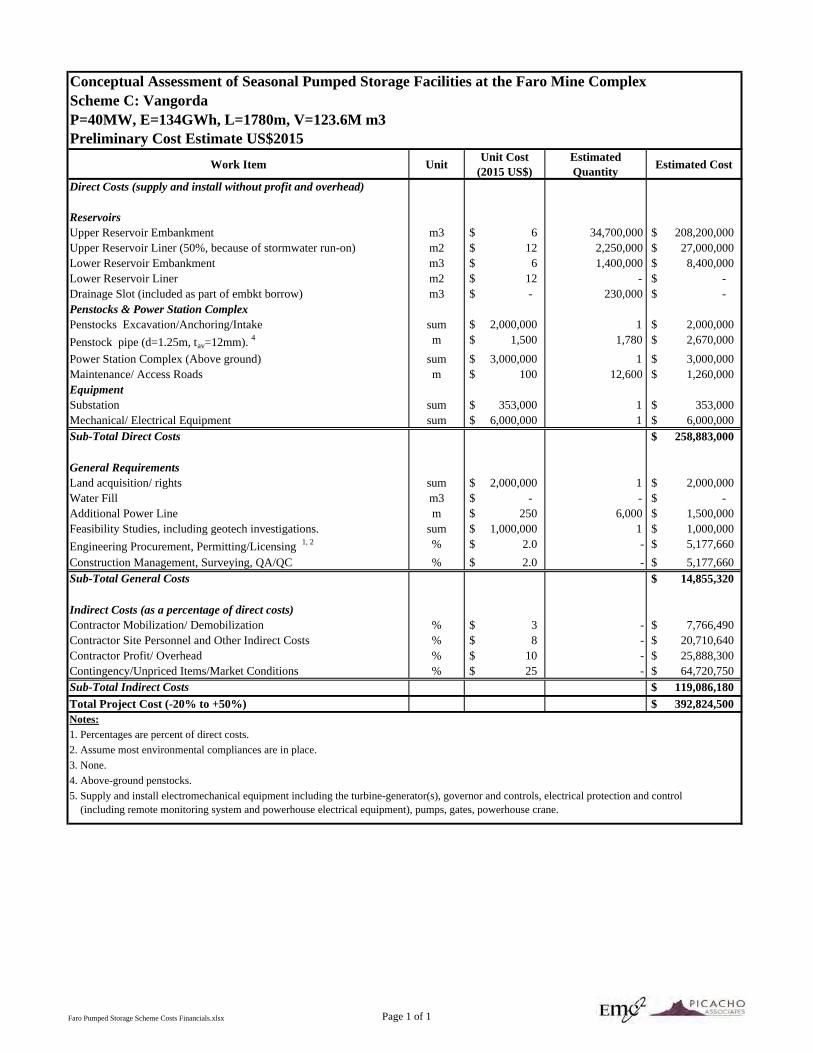
Conceptual Assessment of Seasonal Pumped Storage Facilities at the Faro Mine ComplexScheme C: VangordaP=40MW, E=134GWh, L=1780m, V=123.6M m3Preliminary Cost Estimate US$2015
Work Item UnitUnit Cost
(2015 US$)Estimated Quantity
Estimated Cost
Direct Costs (supply and install without profit and overhead)
ReservoirsUpper Reservoir Embankment m3 $ 6 34,700,000 $ 208,200,000 Upper Reservoir Liner (50%, because of stormwater run-on) m2 $ 12 2,250,000 $ 27,000,000 Lower Reservoir Embankment m3 $ 6 1,400,000 $ 8,400,000 Lower Reservoir Liner m2 $ 12 - $ - Drainage Slot (included as part of embkt borrow) m3 $ - 230,000 $ - Penstocks & Power Station ComplexPenstocks Excavation/Anchoring/Intake sum $ 2,000,000 1 $ 2,000,000
Penstock pipe (d=1.25m, tav=12mm). 4 m $ 1,500 1,780 $ 2,670,000
Power Station Complex (Above ground) sum $ 3,000,000 1 $ 3,000,000 Maintenance/ Access Roads m $ 100 12,600 $ 1,260,000 EquipmentSubstation sum $ 353,000 1 $ 353,000 Mechanical/ Electrical Equipment sum $ 6,000,000 1 $ 6,000,000 Sub-Total Direct Costs $ 258,883,000
General RequirementsLand acquisition/ rights sum $ 2,000,000 1 $ 2,000,000 Water Fill m3 $ - - $ - Additional Power Line m $ 250 6,000 $ 1,500,000 Feasibility Studies, including geotech investigations. sum $ 1,000,000 1 $ 1,000,000
Engineering Procurement, Permitting/Licensing 1, 2 % $ 2.0 - $ 5,177,660
Construction Management, Surveying, QA/QC % $ 2.0 - $ 5,177,660 Sub-Total General Costs $ 14,855,320
Indirect Costs (as a percentage of direct costs)Contractor Mobilization/ Demobilization % $ 3 - $ 7,766,490 Contractor Site Personnel and Other Indirect Costs % $ 8 - $ 20,710,640 Contractor Profit/ Overhead % $ 10 - $ 25,888,300 Contingency/Unpriced Items/Market Conditions % $ 25 - $ 64,720,750 Sub-Total Indirect Costs $ 119,086,180
Total Project Cost (-20% to +50%) $ 392,824,500 Notes:
1. Percentages are percent of direct costs.
2. Assume most environmental compliances are in place.
3. None.
4. Above-ground penstocks.
5. Supply and install electromechanical equipment including the turbine-generator(s), governor and controls, electrical protection and control (including remote monitoring system and powerhouse electrical equipment), pumps, gates, powerhouse crane.
Faro Pumped Storage Scheme Costs Financials.xlsx Page 1 of 1

Conceptual Assessment of Seasonal Pumped Storage Facilities at the Faro Mine ComplexScheme C: Vangorda with Mining (3)P=40MW, E=134GWh, L=1780m, V=123.6M m3Preliminary Cost Estimate US$2015
Work Item UnitUnit Cost
(2015 US$)Estimated Quantity
Estimated Cost
Direct Costs (supply and install without profit and overhead)
ReservoirsUpper Reservoir Embankment m3 $ 3 34,700,000 $ 104,100,000 Upper Reservoir Liner (50%, because of stormwater run-on) m2 $ 12 2,250,000 $ 27,000,000 Lower Reservoir Embankment m3 $ 3 1,400,000 $ 4,200,000 Lower Reservoir Liner m2 $ 6 - $ - Drainage Slot (included as part of embkt borrow) m3 $ - 230,000 $ - Penstocks & Power Station ComplexPenstocks Excavation/Anchoring/Intake sum $ 2,000,000 1 $ 2,000,000
Penstock pipe (d=1.25m, tav=12mm). 4 m $ 1,500 1,780 $ 2,670,000
Power Station Complex (Above ground) sum $ 3,000,000 1 $ 3,000,000 Maintenance/ Access Roads m $ 100 12,600 $ 1,260,000 EquipmentSubstation sum $ 353,000 1 $ 353,000 Mechanical/ Electrical Equipment sum $ 6,000,000 1 $ 6,000,000 Sub-Total Direct Costs $ 150,583,000
General RequirementsLand acquisition/ rights sum $ 2,000,000 1 $ 2,000,000 Water Fill m3 $ - - $ - Additional Power Line m $ 250 6,000 $ 1,500,000 Feasibility Studies, including geotech investigations. sum $ 1,000,000 1 $ 1,000,000
Engineering Procurement, Permitting/Licensing 1, 2 % $ 2.0 - $ 3,011,660
Construction Management, Surveying, QA/QC % $ 2.0 - $ 3,011,660 Sub-Total General Costs $ 10,523,320
Indirect Costs (as a percentage of direct costs)Contractor Mobilization/ Demobilization % $ 3 - $ 4,517,490 Contractor Site Personnel and Other Indirect Costs % $ 8 - $ 12,046,640 Contractor Profit/ Overhead % $ 10 - $ 15,058,300 Contingency/Unpriced Items/Market Conditions % $ 25 - $ 37,645,750 Sub-Total Indirect Costs $ 69,268,180
Total Project Cost (-20% to +50%) $ 230,374,500 Notes:
1. Percentages are percent of direct costs.
5. Supply and install electromechanical equipment including the turbine-generator(s), governor and controls, electrical protection and control (including remote monitoring system and powerhouse electrical equipment), pumps, gates, powerhouse crane.
2. Assume most environmental compliances are in place
3. Assume waste rock from mine is placed in embankments: reduce rates by 50%.
4. Above-ground penstocks.
Faro Pumped Storage Scheme Costs Financials.xlsx Page 1 of 1

Cost Item UnitScheme A:
Faro Pit
Scheme A: Faro Pit with
Mining (3)
Scheme B: Rose Creek
Scheme B: Rose Creek with
Mining (3)
Scheme C: Vangorda
Scheme C: Vangorda with
Mining (3)
Project Capital Cost 2015 $/kW 22,379$ 3,545$ 5,767$ 4,834$ 9,821$ 5,759$ Capacity MW 4.00 4.00 8.00 8.00 40.00 40.00 Seasonal Storage GWh 9.60 9.60 9.40 9.40 134.00 134.00 Total Capital Cost 89,514,500$ 14,178,580$ 46,139,521$ 38,673,706$ 392,824,500$ 230,374,500$ Debt/Equity 80/20 80/20 80/20 80/20 80/20 80/20Interest Rate (2015) 6% 6% 6% 6% 6% 6%Term Years 40 40 40 40 40 40Principal & Interest ($4,759,417) ($753,864) ($2,453,203) ($2,056,251) ($20,886,176) ($12,248,834)Equity Rate (2015) 9% 9% 9% 9% 9% 9%Equity Return ($1,611,261) ($255,214) ($830,511) ($696,127) ($7,070,841) ($4,146,741)
Annual Amortized Capital Costs /year ($6,370,678) ($1,009,079) ($3,283,714) ($2,752,378) ($27,957,017) ($16,395,575)
Winter Rate $/kWh 0.20$ 0.20$ 0.20$ 0.20$ 0.20$ 0.20$ Summer Rate $/kWh 0.03$ 0.03$ 0.03$ 0.03$ 0.03$ 0.03$ Winter/ Summer Rate 6.67$ 6.67$ 6.67$ 6.67$ 6.67$ 6.67$ Capacity rate $/ kW-yr -$ -$ -$ -$ -$ -$ Transfer Efficiency 82% 82% 82% 82% 82% 82%Winter Energy (generating) GWh 9.60 9.60 9.40 9.40 134.00 134.00Summer Energy (pumping) GWh 11.71 11.71 11.46 11.46 163.41 163.41
Winter Revenue 1,920,000$ 1,920,000$ 1,880,000$ 1,880,000$ 26,800,000$ 26,800,000$ Capacity Revenue -$ -$ -$ -$ -$ -$
Annual Revenue 1,920,000$ 1,920,000$ 1,880,000$ 1,880,000$ 26,800,000$ 26,800,000$
Summer Pumping Cost (351,220)$ (351,220)$ (343,902)$ (343,902)$ (4,902,439)$ (4,902,439)$ Depreciation NA NA NA NA NA NAO&M (2) (232,732) (232,732) (288,515) (288,515) (1,160,514) (1,160,514) Annual Capital Cost (6,370,678)$ (1,009,079)$ (3,283,714)$ (2,752,378)$ (27,957,017)$ (16,395,575)$
Annual Costs (6,954,629)$ (1,593,030)$ (3,916,131)$ (3,384,795)$ (34,019,970)$ (22,458,529)$
Annual Earnings (Pre-Tax) (5,034,629)$ 326,970$ (2,036,131)$ (1,504,795)$ (7,219,970)$ 4,341,471$
Present Value (40 years) (3) (201,385,164)$ 13,078,809$ (81,445,244)$ (60,191,793)$ (288,798,805)$ 173,658,844$ Present Value (50 years) (3, 4) (188,024,675)$ 26,439,298$ (68,969,415)$ (47,715,963)$ (81,428,339)$ 381,029,309$
Notes
1. Shaded cells have variables that can be changed.
2. Based on EPRI Formula. See HDR 2014.
3. Power rates and O&M assumed to increase at rate of inflation for calculation of Present Values.
4. The Present Value based on 50 years assumes that there are no debt payments for the last 10 years.
Conceptual Assessment of Seasonal Pumped Storage Facilities at the Faro Mine ComplexPreliminary Financial Analysis of Options US$2015
Faro Pumped Storage Scheme Costs Financials.xlsx Page 1 of 1