appendix 5 summary of included studies ( 1 ) 5...the levels of postgraduate clinical ratings, ......
TRANSCRIPT

Appendix 5 SUMMARY OF INCLUDED STUDIES
( 1 ) Variables
Citation Time of Measurement
Research Question/ Purpose of Study Design Sample
Size Predictors Outcome
StatisticalAnalysis Used Results/Findings
FollowingMedial School Graduates
Alexander, et al.Acad Med supp. 2000
1996-1998 To assess the contributions of academic assessments at various intervals during medical school to ratings of residency performance
Retrospective cohort
338 USMLE I USMLE II GPA year 2 clerkship year 3 compositeCumulative compositescore at graduationRanking Top third Middlethird Lower third
Performance in residency, by supervisor rating in:
Primary care residency Surgery
Cronbach’salpha of supervisor rating 0.94Pearson correlationsANOVA to compare sub-groups means
i.e. similarity in the subjective assessment by directors of residency programmes and attending ratings of students clinical performance
USMLE I - r =0.2 USMLE II - r = 0.24 GPA year 2 - r = 0.2 GPA year 3 - r = 0.41 clerkship Composite cumulative - r = 0.32 All GPA P = < .000 Year 2 GPA and resident humanistic quality r = 0.07; P = 0.12 /not significant Conclusion: low magnitude correlations, but statistically significant except with humanistic quality Academic performance explained less than 20% of the variance in residency performance Strength of correlation between clerkship GPA and residency assessment may have been due to ‘method effect’ of the ratings.

Appendix 5 SUMMARY OF INCLUDED STUDIES
(2)Variables
Citation Time of Measurement
Research Question/ Purpose of Study Design Sample
Size Predictors Outcome
StatisticalAnalysis Used Results/Findings
Medical School Achievements as Predictors of Performance
Amos, et al.Acad Med 1996
1959-1991 To determine the relationships between medical school achievements and clinical or academic performance of residents in physical medicine and rehabilitation, performance on board examination and entry into academic practice
Retrospective cohort
205Residents
Age, Sex Research experienceAdvanceddegreeFailed classes or clerkshipHonorsgrades, class rank
Annual evaluation scores of residents PublicationsGPA on masters degreeBoard scores Post-residency outcome variables: Fellowship, career selection (academic versus clinical)
Chi-squareanalysis of variance, linear and logistic regression
Clinical residency performance was predicted by clerkship honors grades (P = .0001) Probation was predicted by failing a basic science course (P=.0001) Written board performance was related to Alpha Omega Alpha status (P=.04) Failing written boards on the first attempt was predicted by failing a basic science course (P=.05) Entry into an academic PMR practice was predicted by an interest in the practice in personal statement of the residency application (P=.002) and writing a thesis in medical school (P=.03)

Appendix 5 SUMMARY OF INCLUDED STUDIES
( 3 ) VariablesCitation Time of
Measurement
Research Question/
Purpose of Study Design Sample Size
Predictors Outcome
StatisticalAnalysis Used Results/Findings
The Empirical Association between student and Resident physician Performance.
Arnold &Willoughby; Acad Med supp. 1993
• Medical School
• (1980-1983)• Residency
Are categories of studentsperformance levels associated with their standings on clinical performanceratings as residents? Is the association between performances in combined degree program residency stronger when measures are conceptually similar?
Retrospective cohort
298 (a combined degreeprogram)
Clerkship GPA
Clerkship rating
Final Year MD exam scores and subscores
Supervisor rating for year one residency
Distribution free Statistics Chi-squareFactors analysis
• 45% of subjects in same performance categories as students and residents
• Agreement between high and low levels of student residency performance
• Students clinical performance component was strongest correlate of residency clinical performance (Contextual variables-) r= 0.3 P <.001

Appendix 5 SUMMARY OF INCLUDED STUDIES
( 4 ) Variables
Citation Time of Measurement
Research Question/ Purpose of Study Design Sample
Size Predictors Outcome
StatisticalAnalysis Used Results/Findings
Selection of obstetrics and gynecology residents
Bell, et al.Am J Obs Gyn2002
Medical School and Residency I Obstetrics & Gynecology 1995-1999
Whether USMLE scores predict residents in training examination scores
Retrospective cohort
24Residents
USMLE I USMLE II Number of hours in clinical rotations (five)Globalassessment of applicant compositescore of selection
Supervisors ratings in PGY 1-4 four categories Clinical judgment Patient rapport Surgical ability Work ethics In-training examination PGYs 1-4 ‘GREOG’ Council on ResidentsEducation in Obstetrics and Gynecology
LinearregressionSpearman rank correlation to assess relationshipsamongindividualcomponents and external measures ‘Contents and ConstructValidity’
USMLE I significantly predicted performance on PGY 1-3 GREOG examination P < 0.05 USMLE II significantly predicted performance on GREOG examination in all 4 years P < 0.05 USMLE I did not correlate with PGY4 CREOG scores CREOG did not correlate with resident performance as measured by faculty evaluation No association between medical student composite scores and resident performance scores.

Appendix 5 SUMMARY OF INCLUDED STUDIES
( 5 ) VariablesCitation Time of
Measurement Research Question/ Purpose of Study Design Sample Size
Predictors Outcome
StatisticalAnalysis Used Results/Findings
FurtherPsychometric Evaluations of a Class Ranking Model as a Predictor of Graduates’ Clinical Competence in First Year of Residency.
Blacklow, Goepp, Hojat Acad Med1993
1991, 1992, 1986-19
• Medical school • Internship
To investigate the psychometrics of a class ranking model
Is there a linear relationship between class ranks and ratings of postgraduate competence
Retrospective CohortFaculty judged graduates’potential to become competent physicians.
Studentrankingscompared to ratingsreceived from faculty.
Directors’ rated data-gathering skills of graduates at end of internship.
Part I 215 graduates of Jefferson Part II 598 graduates
• Class Ranks
• Basic science grades
• Clerkship – clinical ratings in 3rd year
Supervisor rating at the end of the first year of residency
Concordancerates between faculty ratings and class ranking model
The means of both measures of medical school performance increased significantly with increases in the levels of postgraduate clinical ratings, suggesting a linear relationship. Concordance rate 85% between ranks and ratings support validity of ranking model.

Appendix 5 SUMMARY OF INCLUDED STUDIES
( 6 ) Variables
Citation Time of Measurement
Research Question/ Purpose of Study Design Sample
Size Predictors Outcome
StatisticalAnalysis Used Results/Findings
InformationCollected During the Residency Match Process Does Not Predict Clinical Performance
Borowitz, Saulsbury & Wilson. ArchPediatr Adolesc, 2000
Pediatric residents over a 7 year period at the University of Virginia
1994 - 1997
To determine whether information collected during the national residency matching program predicts clinical performance during residency as evaluated by 10 faculty members
Retrospective Study
69pediatrichouseofficers
Rank on matching list Score on NBME IGrade on pediatric and internal medicineclerkshipAOAScores of faculty interviews during interim applicationPediatric in service examination Scores of American Board of Pediatrics
Supervisors ratings of clinical performance
Kappa for agreement between raters LinearregressionT-test, analysis of variance
Medical School Grades, Performance on NBME I, Interviews during the interim application process and match-list ranking are not predictors of clinical performance during residency.

Appendix 5 SUMMARY OF INCLUDED STUDIES
( 7 ) VariablesCitation Time of
Measurement Research Question/ Purpose of Study Design Sample
Size Predictors Outcome
StatisticalAnalysis Used Results/Findings
DoesMedical SchoolPerformancePredict Radiology
Boyse, et al. AcadRadiol 2002
1991-2000 To determine the relationships between medical school achievements and clinical or academic performance of residents in physical medicine and rehabilitation, performance on board examination and entry into academic practice
Retrospective cohort
77Radiology Residents
Grades Dean’s letter Letters of recommendation AOANBME I & USMLE I
Rotation evaluations supervisorratingRetrospective faculty recall scoresAmerican College of Radiology (ACR)American Board of Radiology (ABR)examination scores
Student to test Analysis of variance Correlation coefficients
Preclinical grades of honors or A Clinical grades of honors in medicine, surgery, high NBME/USMLE I predicted success on ABR written examination, but did not predict rotation performance Dean’s letter, letter of recommendation AOA, high medical school prestige did not predict high examination scores or supervisor rotation performance.

Appendix 5 SUMMARY OF INCLUDED STUDIES
( 8 ) Variables
Citation Time of Measurement
Research Question/ Purpose of Study Design Sample
Size Predictors Outcome
StatisticalAnalysis Used Results/Findings
Measurement of clinical reflective capacity early in training as a predictor of clinical reasoningperformance at the end of residency: An experimentalstudy on the scriptconcordance test
Brailovsky, etal. Med Edu2001
1996 To verify whether scores obtained by students at the end of the clerkship predict their clinical reasoning performance at the end of residency
Cohortcomparative study prospective of scores
24 students Scores on SC end of clerkship
Scores on Short answer managementproblem (SAMP’s) Simulated Office Orals (SOO) OSCE
Pearson correlation
SC and SAMP correlation r = .451 P = 0.01 SC and SOOs r=0.447 P = 0.015 with OSCE r = 0.340

Appendix 5 SUMMARY OF INCLUDED STUDIES
( 9 )Variables
Citation Time of Measurement
Research Question/ Purpose of Study Design Sample Size
Predictors Outcome
StatisticalAnalysis Used Results/Findings
Validity of faculty ratings of students’ clinical competence in core clerkship in relation to scores on licensing examinations andsupervisors’ratings in residency
Callahan, et al.Acad Medsupp. 2000
1989 – 1998 Medical School Residency
Examine the validity of faculty rating of students clinical competencies in core clinical clerkship in relation to student subsequentperformances on medical licensing examination and program directors’ ratings.
Retrospective cohort
2158 Global ratings of student clinical competencies in six core clerkships
USMLE II USMLE III Supervisorsratings of clinical performancein year 1 Residency “data gathering skillsInterpersonalskills and attitudes Socioeconomic aspects of patient care
BivariatecorrelationMultiple regressionanalysis
All correlations reported are statistically significant, but of low effect size Highest correlations 0.29 and 0.2 between internal medicine clerkship and steps 2 and 3 USMLE lowest correlations 0.17 psychiatry and 0.11 surgery clerkships Correlations with postgraduate clinical competence statistically significant, but low effect size Highest internal medicine clerkship and data gathering skills 0.27, lowest between surgery and psychiatry clerkship and postgraduate clinical competence 0.1 and 0.09

Appendix 5 SUMMARY OF INCLUDED STUDIES
( 10 ) Variables
Citation Time of Measurement
Research Question/ Purpose of Study Design Sample Size
Predictors Outcome
StatisticalAnalysis Used Results/Findings
Validity of NBME part 1 and part II scores for selection of residents in orthopedicsurgery, dermatology, preventivemedicine.
Case &Swanson, Acad Med supp. 1993
1991• Medical
school• Residency
How accurately do NBME scores predict criterion measures of success in residency training?
Retrospective cohort
Ortho= 656 Derm= 219 Prev.=169
NBME I, II Specialty Board Exam Scores
Regressionanalyses correlations
Patterns of high low scores on NBME Parts I and II generally related to skills required in the specialty areas. Is this a reflection of the examinee's preferred specialty or the programs selecting that person. NBME Parts I and II scores provided a good predictor of specialty board performance. Part II, generally better than part I. Part I or II scores below 400, examinee more likely to fail specialty boards. Predict BUT should not be sole criteria.

Appendix 5 SUMMARY OF INCLUDED STUDIES
( 11 ) VariablesCitation Time of
Measurement Research Question/ Purpose of Study Design Sample Size
Predictors Outcome
StatisticalAnalysis Used
Results/Findings
The General Practitioner: A study of medical education and practice in Ontario and Nova Scotia
Clute, Univ Toronto 1963
1961 – 1963 • Medical School • General
Practice
To determine relationship between medical school academic marks and quality of practice in Ontario and Nova Scotia
Survey 85 Canadian GPs
Academic marks in clerkship
Quality of practice
Pearson correlation
Relationship between academic and career performance – slight, positive, significant correlation of .56 in Ontario (N – 23), but also strong negative relationship between age and grades and quality of practice; in Nova Scotia (N = 39), positive, non-significant correlation of .24.

Appendix 5 SUMMARY OF INCLUDED STUDIES
( 12 ) VariablesCitation Time of
Measurement Research Question/ Purpose of Study Design Sample Size
Predictors Outcome
StatisticalAnalysis Used Results/Findings
Relationshipsof intern's performance to their self-assessments of their preparedness for Internship and to their Academic Performancesin Medical school
Fincher, Lewis, Kuske Acad Med supp. 1993
• Medical School
• (1990-1991)• Internship
Do medical students' cumulative GPA correlate with performanceassessments? Do medical students' self assessments of preparedness for internship correlate with internship directors'assessments? Does med school academic performance predict performance in specific competencies as assessed by program directors?
Retrospective cohort
138/114 (1990) 145/104 (1991) 133 self-rating
• Cumulative GPA
• Medial School GPA rank
• Student self-assessment
Supervisorrating for year one residency
• Pearson Correlation Coefficients
• Cross tabs• Chi-square• Multivariate • ANOVA
• GPAs of students who chose university based residencies significantly higher than those who chose community based - GPA predicts overall performance in specific competences in internship year. r = 0.28–0.51
• Ranking between med school internship year was different rather inconclusive.
• Medical school academic performance relates significantly to performance in internship.

Appendix 5 SUMMARY OF INCLUDED STUDIES
( 13 )
VariablesCitation Time of
Measurement Research Question/ Purpose of Study Design Sample Size
Predictors Outcome
StatisticalAnalysis Used Results/Findings
Do criteria predict resident performance
Fine & Hayward, Acad Med supp. 1995
• Medical School
• Residency
Factors considered by Res. Programs when selecting residents and whether factors predict resident performance
Retrospective cohort
123Residents308 appl.
ClerkshipGPA
Overall rating (over several years)
Multivariate liner regression
•Significant independent relationship between medical school clerkship (International Medicine grade) and residency performance.
•ISCs over emphasize of AOA, scores of medical school reputation.
• Best predictor of overall residency performance were internal medicine clerkship honors and graduation from home institution.

Appendix 5 SUMMARY OF INCLUDED STUDIES
( 14 )Variables
Citation Time of Measurement
Research Question/ Purpose of Study Design Sample Size
Predictors Outcome
StatisticalAnalysis Used Results/Findings
Correlation of Standardized Testing Results
Fish, et al. AmJ Phys Med Rehab 2003
2001 (POE) To determine the relationships between medical school achievements and clinical or academic performance of residents in physical medicine and rehabilitation, performance on board examination and entry into academic practice
Survey 86 Residents Self assessment examination (SAE) USMLE I USMLE II USMLE III ComprehensiveMedical Licensing Exam (COMPLEX)
POE scores and ranking
Spearman rank correlation (rho)X2
12 Residents (14%) thought SAE correlated with POE; 53.5% ‘somewhat’ 32% did not correlate well. 60.5% thought the SAE was easy; 8.1% more difficult and 31.4% same difficulty Participation in a board review courses did not correlate with quartile ranking on POE rs = -0.2 All residents in the lowest quartile failed the POE Higher performance on standardized test USMLE I, II, III/ COMPLEX, SAE correlate with POE SAE rs = 0.581 P < 0.001 Passing 1st attempt all USMLE 0.295 P < .007

Appendix 5 SUMMARY OF INCLUDED STUDIES
( 15 ) Variables
Citation Time of Measurement
Research Question/ Purpose of Study Design Sample Size
Predictors Outcome
StatisticalAnalysis Used
Results/Findings
An empirical study of the predictive validity of number grades in medical school using 3 decades of longitudinal data: implications for a grading system
Gonnella,Erdmann & Hojat, Med Edu,2004
1970 – 1999 • Medical School • PG 1
To examine predictive validity of number grades in medical school
Prospectivecohort study
6656 medical students
GPA year 1 Numbergrades
GPA year 2 GPA clerkship Medical school class rank USMLE 1, 2, 3 Supervisor rating PG 1
• Mean comparison X2
ANOVA Effect size
Ratings of clinical competence beyond medical school are predicted by number grades in medical school

Appendix 5 SUMMARY OF INCLUDED STUDIES
( 16 )
VariablesCitation Time of
Measurement Research Question/ Purpose of Study Design Sample Size
Predictors Outcome
Statistical Analysis Used Results/Findings
Premedical and Medical School Performance in Predicting First Yr Residency Performance.
Gunzburger, etal. J Med Edu1987
1982, 1984 (62) (123)• College• Medical School • Residency
(Internship)
Relationships among measures of college and medical school performance and competence in 18 medical care tasks in PGY I.
Retrospective Cohort
185 Graduates of Loyola
• NBME II Scores
• Clerkshipgrade
• NBME I • GPA• MCAT
•Rating by supervisor for year one residency
• Factor analysis • Stepwise multiple
regression• Rash model item
analysis
•College and medical school academic achievement not best predictors of resident’s competence. •High correlation found between: (1) NBME part II scores and residency
competence ratings (i.e. test measures what it should – MBA) P = .005
(2) Clerkship grades.

Appendix 5 SUMMARY OF INCLUDED STUDIES
( 17 )
VariablesCitation Time of
Measurement Research Question/ Purpose of
Study Design Sample Size Predictors Outcome
StatisticalAnalysis Used Results/Findings
Is the Glass Hall Full or Half Empty? A Reexamination of the AssociationsBetween Assessment Measures during Medical School and Clinical Competence after Graduation
Hojat, et al.Acad Med supp. 1993
• Medical School
• Internship(1980 – 1990)
Investigate associations between performance during medical school and in the first year of residency. Hypotheses: 1) There is high correlation between medical school measures of performance and measures obtained at end of internship 2) Objective measures of medical knowledge attained during medical school and one year after graduation are highly correlated3) Students’ low or high academic standings in medical school are directly and significantly associated with their subsequent clinical competence ratings as residents The association between academic standings in medical school and status on clinical competence ratings as residents is stronger for measurements that are conceptually more similar than dissimilar.
Retrospective cohort
1,724graduatesTotal = 2368
• NBME I, II
• Objective Clinical Exam
• Preclinical exam Grades
NBME III • Factor analysis Distribution free statistical measures used
• Chi-square
• Pearson Product-moment correlations
Associations exist between performance measures in medical school and those after graduation.Conceptually similar measures yield stronger associations than dissimilar ones. Need to refine assessment instruments. Associations among performance measures in medical school increase drastically when selected measures of personality are included in prediction models.

Appendix 5 SUMMARY OF INCLUDED STUDIES
( 18 )
VariablesCitation Time of
Measurement Research Question/ Purpose of Study Design Sample Size
Predictors Outcome
StatisticalAnalysis Used Results/Findings
Residency ProgramDirector Evaluations Do not Correlate With Performance on a Required 4th
Year OSCE .
Kahn, et al.Teach & Learn in Med 2001
• (4th Year) Medical School
• Internship
Correlate performance on 4th year OSCE with residency program director assessment also class rank and USMLE scores
Retrospective Cohort25 highest scoring 25 lowest scoring examinees.
5 point Likert Scale used by programdirectors
50 Graduates from Tulane
NBME I, II
Objective Clinical Exam in Senior year
Class ranking
Supervisorrating for year one residency
History taking PE, interpersonal skills and overallmedical knowledge.
Mann-Whitney tests (ordinal data)
Pearson’s correlations
Spearman’s rho analysis
• Program directors scores did not correlate with class rank or USMLE scores, < .26 or TOSCE < .27, P <.08.
• No individual score from prog. Director was significantly different between OSCEHI and OSCELO.
• Strong correlations between USMLE scores and class rank.
• Prog. Directors do poor job of assessing clinical comp.

Appendix 5 SUMMARY OF INCLUDED STUDIES
( 19 )
VariablesCitation Time of
Measurement Research Question/ Purpose of Study Design Sample
Size Predictors Outcome
Statistical Analysis Used Results/Findings
Can Success in the Surgical Residency be Predicted from Pre-residency Evaluation?
Kron, et al.Ann. Surg 1985
• 1973-1982• Medical
School• Residency
Compared level of a clinical performance and success of residents in one training program with information from initial application and interview. Can level of performance in residency be predicted from data in application?
Can successful completion of residency program be predicted from objective and subjective data from medical school?
Retrospective Cohort
62 • Medical school application info
• Election to AOA • NBME scores • Class rank
(honors in basic science and clinical subjects, letters of recommendation, scientific publication during medical school, research experience)
• Residency interview
• Rating by programdirector for year one residency level of clinical performance
Discriminantfunction analysis
No correlation between any of the selection factors and resident’s performance for the 42 who completed the program. Comparison of the 42 with 20 who were dismissed revealed AOA membership; high-class rank; clinical honors; and scientific publications during medical school predicted success with 89% accuracy. Personal interviews are not predictive of success, or performance.

Appendix 5 SUMMARY OF INCLUDED STUDIES
( 20 )
VariablesCitation Time of
Measurement Research Question/ Purpose of Study Design Sample Size
Predictors Outcome
StatisticalAnalysis Used Results/Findings
First-Year Residents’PerformancesCompared with Their Medical School Class Ranks.
Loftus et al.Acad Med1992
• Medical school
• Residency
Does student’s class rank bear strong relationship to subsequent residency performance? What class rank system yields most sig. Correlation with postgraduate med. outcomesIs there a way to strengthen the relationship
Retrospective cohort
124 graduates with med school records
102 for internship records
• Preclinical GPA • Clerkship GPA • NBME I/NBME II• First year student
ranking (Dean’s letter category index)
• Ranking with Criterion Ref.
• Ranking with Norm Ref.
• Honors Society Intern Selection Comm.
Rating by supervisor for year one residency 9 areas of clinical performance
Stepwise multiple regressionPearson’s correlation
Weighted combination of clinical performance measures bore strongest relationship to performance in residency. Low correlation of different ranking methods r (0.23–0.18) P < 0.05

Appendix 5 SUMMARY OF INCLUDED STUDIES
( 21 )Variables
Citation Time of Measurement
Research Question/ Purpose
of Study Design Sample Size
Predictors Outcome
StatisticalAnalysis Used Results/Findings
Therelationship of academic measures in medical school toperformanceafter graduation –
Markert, AcadMed supp. 1993
• Medical School
• Internship(1980 - 1991)
Study 3 hypotheses: Measures of medical school academic performance will correlatesignificantly with postgraduateoutcome.Relationship will be strongest for conceptually similar measures; Studentscategorized as high or low will be categorized similarly on post grad. outcome measures.
Retrospective cohort
947 (628=NBME II scores) (481= physician. Supervisor ratings)
• NBME I, II
• Preclinical GPA
• ClerkshipGPA
• NBME III• Supervisor
Rating for year one residency
Pearson correlation Stepwise regression Factor analysis Chi-square
The medical school variables correlated significantly with NBME part III scores and physician supervisor ratings. First 2 hypotheses are supported. Medical School academic achievement significantly related to clinical competency in residency.
Appendix 5 SUMMARY OF INCLUDED STUDIES
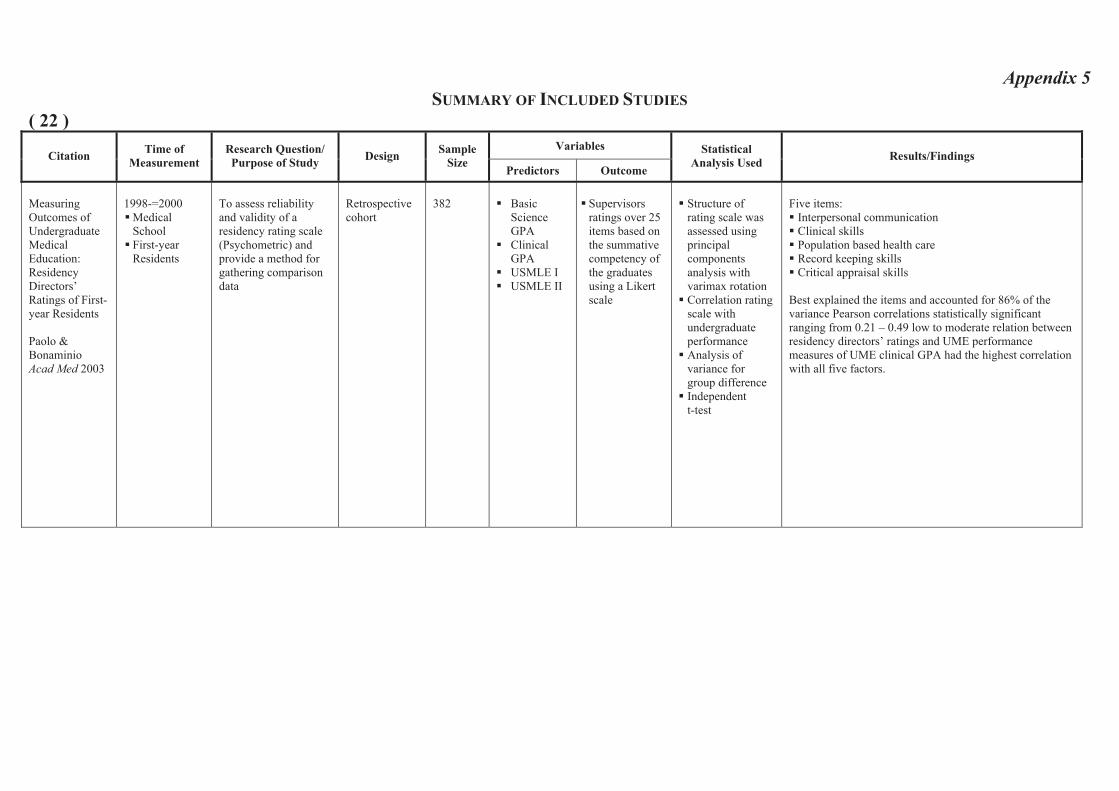
( 22 ) Variables
Citation Time of Measurement
Research Question/ Purpose of Study Design Sample
Size Predictors Outcome
StatisticalAnalysis Used Results/Findings
MeasuringOutcomes of UndergraduateMedical Education:Residency Directors’ Ratings of First-year Residents
Paolo & BonaminioAcad Med 2003
1998-=2000Medical SchoolFirst-year Residents
To assess reliability and validity of a residency rating scale (Psychometric) and provide a method for gathering comparison data
Retrospective cohort
382 BasicScience GPAClinical GPAUSMLE I USMLE II
Supervisorsratings over 25 items based on the summative competency of the graduates using a Likert scale
Structure of rating scale was assessed using principal componentsanalysis with varimax rotation Correlation rating scale with undergraduateperformanceAnalysis of variance for group difference Independent t-test
Five items: Interpersonal communication Clinical skills Population based health care Record keeping skills Critical appraisal skills
Best explained the items and accounted for 86% of the variance Pearson correlations statistically significant ranging from 0.21 – 0.49 low to moderate relation between residency directors’ ratings and UME performance measures of UME clinical GPA had the highest correlation with all five factors.

Appendix 5 SUMMARY OF INCLUDED STUDIES
( 23 )
VariablesCitation Time of
Measurement Research Question/ Purpose of Study Design Sample Size
Predictors Outcome
StatisticalAnalysis Used Results/Findings
Therelationshipbetween assessment measures of NewcastleMedical School (Australia) and performanceratings during internship.
Pearson, Rolfe, & Henry Med Edu 1998
•Medical School•Internship
1991, 1992
Predictive value of academic performance in last 2 years of 5 year program for ratings during internship.
Retrospective Cohort
64 Graduates n=112 eligible
• Professionalskills long case in each department
• Critical reasoning
• Population medicine
• Self-directed learning
• Identification prevention and management of illness.
Supervisorrating for year one residency 13competencies
ANOVA Linear regression
• Significant positive correlations between mean ratings and examination scores from Domains 1,3,5.
• Professional skills; identification, prevention management of illness; self-directed learning.
• Best predictor of intern ratings was identified, prevention and management of illness r = 0.28 P < 0.01

Appendix 5 SUMMARY OF INCLUDED STUDIES
( 24 )Variables
Citation Time of Measurement
Research Question/ Purpose of Study Design Sample
Size Predictors Outcome
StatisticalAnalysis Used
Results/Findings
An analytical study of North Carolina General Practice
Peterson et al.Med Edu 1956
1956• Medical
School• General
Practice
To determine relationship between medical school academic marks and quality of practice in North Carolina
Survey 94 GPs Academic marks in clerkship
Quality of practice Career performance measures - Observation by internist of subject’s clinical history, physical examination, use of laboratory aids, use of therapeutic measures, preventive medicine, and clinical records. Observer made composite ratings on a predetermined scale which gave preponderant weight to the quality of the subject’s clinical history and physical examination.
Pearson correlation
Relationship between academic and career performance – slight, positive significance for younger doctors; no significance for older doctors.

Appendix 5 SUMMARY OF INCLUDED STUDIES
( 25 )
VariablesCitation Time of
Measurement Research Question/ Purpose of Study Design Sample
Size Predictors Outcome
StatisticalAnalysis Used Results/Findings
Measurement of Physician Performance
Price, et al. Med Edu 1964
1964• Medical
School• General
Practice
To determine relationship between medical school GPA and academic and practice performance
Survey 215 GPs and292specialists
Medical school GPA’s
First two years Last two years
Career performance measures – About 80 measures obtained from interviews, records, and colleagues’ opinions, for example, number of journals to which respondent’ssubscribed, peer nominations for outstanding performance, hospital recognition, and publications;composite performance clusters developed with factor analytic techniques.
Pearson correlationFactor analysis
Performance – None; medical school grade point average (GPA), a factor almost completely independent of all factors having to do with professional performance

Appendix 5 SUMMARY OF INCLUDED STUDIES
( 26 )
VariablesCitation Time of
Measurement Research Question/ Purpose of Study Design Sample
Size Predictors Outcome
StatisticalAnalysis Used Results/Findings
Traditional finals and OSCEs in Predicting Consultant and Self-reportedClinical Skills of PRHOs
Probert, et al.Med Edu 2003
Medical School and PRHO 1999
To determine the relationships between medical school achievements and clinical or academic performance of residents in physical medicine and rehabilitation, performance on board examination and entry into academic practice.
Prospectivecohort
20 PRHOs OSCELong case examination
Self assessment of clinical competencies Supervisorassessment of clinical competencies
Z score Pearson Correlation Kendall’s rank correlationsMultiple variable logistic regression O.R. > 1 indicates betterperformance on examination; is associated with increase probability of being classified as better doctor
No correlation between PRHOs self reported performance and consultant reported performance Traditional finals was inversely associated with consultant assessment. Better performing students were not rated as better doctors in surgery but not in medicine OSCE showed positive associations with consultant ratings

Appendix 5 SUMMARY OF INCLUDED STUDIES
( 27 ) Variables
Citation Time of Measurement
Research Question/ Purpose of Study Design Sample
Size Predictors Outcome
StatisticalAnalysis Used Results/Findings
A Comparison of the Modified Essay Question and Multiple ChoiceQuestionFormats: Their Relationship to Clinical Performance
Rabinowitz & Hojat. FamMed, 1989.
1976 – 1985, JeffersonMedical College
Determine the relation between (1) MCQ examination in third year clerkship (2) Modified essay question final examination in family medicine (3) clinical performance in post-graduate training
Retrospective Cohort Study
1458graduates
MCQ 3rd year clerkship. Modified essay examination in family medicine clerkship
NBME I, II, III Supervisor ratings in residency
Pearson correlation andregressionanalysis
Grades on MCQ examination in internal medicine clerkship consistently yielded the higher correlation with NBME scores I, II, III (r=0.59, 0.64 and 0.49). Modified essay in family medicine had the lowest correlation with NBME I, II, III (r=0.37, 0.37, 0.38). Correlations of clerkship examination scores with post-graduate rating of competencies.
Medical knowledge highest: internal medicine clerkship 0.23, lowest: pediatrics 0.12 Data gathering highest: family medicine 0.19, lowest: Ob/Gyn 0.15. Clinical judgment highest: family medicine 0.20, lowest: pediatrics 0.13 Professional attitudes, highest: 0.17, lowest: pediatric 11

Appendix 5 SUMMARY OF INCLUDED STUDIES
( 28 )Variables
Citation Time of Measurement
Research Question/ Purpose of Study Design Sample Size
Predictors Outcome
StatisticalAnalysis Used Results/Findings
The prediction of Medical InternPerformance
Richards, Taylor & Price ApplPsychol 1962
1955-1958• Medical
School• Internship
To determine the relationship between medical school and GPA internship performance
Survey 139 Interns GPA Years 1, 2, 3
Supervisor ratings of internship performance Career performance measures – Evaluation of internship performance by hospital official; judges applied a rating scale to the letters of evaluation. An adjusted rating was also obtained by modifying the above unadjusted rating by an index of hospital quality.
Pearson correlation coefficient
Relationship between academic and career performance – Slight, positive significant correlations of .21 and .24 between first- and second-year grades, respectively, and adjusted rating; positive, significant correlation of .33 and .45 between third-year grades and unadjusted and adjusted ratings, respectively.

Appendix 5 SUMMARY OF INCLUDED STUDIES
( 29 )
VariablesCitation Time of
Measurement Research Question/ Purpose of Study Design Sample
Size Predictors Outcome
StatisticalAnalysis Used Results/Findings
Relationshipbetween past academic performanceand results of specialty in-training examinations
Ronai, Golmon, Shanks,Schafer & Brunner. JMed Educ, 1984
• 1966 – 1981 What is the relationship between College grades, medical school performance and the results of specialty in-training examination of residents in Anesthesia & Orthopedics.
Retrospective Cohort Study
63graduatesof North Western Univ
College Grade GPAMCAT Scores NBME I NBMEII
Scores on the final assessment of their residency in-training examination in Anesthesia & Orthopedics
T-testPearson correlationMultiple linear regression for prediction
No significant difference between the GPA, MCAT scores and NBME I & II between the two groups.Multiple linear regression analysis with stepwise forward inclusion. Best predictor of the anesthesia final in-training examination score was MCAT verbal ability 42%. For Orthopedic scores,GPA-non science inclusion of all variables accounted for 40% of the variance for both groups. GPA non-science negative correlation. NBME I and NBME II minimal effect in predicting in-training examination scores in anesthesia while significant information to the predictors of examination scores in orthopedics were found.

Appendix 5 SUMMARY OF INCLUDED STUDIES
( 30 )
VariablesCitation Time of
Measurement Research Question/ Purpose of Study Design Sample
Size Predictors Outcome
StatisticalAnalysis Used Results/Findings
Validity studies usingstandardized-patient examinations: standardized patient potpourri
Rutala, et al.Acad Med supp. 1992
1989-1990•
To assess whether OSCE with standardized patients could predict performance during residency
Retrospective 76 students
OSCE – Standardized Patients:
InterpersonalskillsDatabasedevelopmentDecision making
Residency directors questionnaire and rating
Pearson correlation coefficient
Correlation of OSCE with residency directors rating:
Interpersonal skills - .42 Database development - .28 Decision making - .28
OSCE with SPs can measure what residency directors look for particularly in the domain of interpersonal skills.

Appendix 5 SUMMARY OF INCLUDED STUDIES
( 31 )
VariablesCitation Time of
Measurement Research Question/ Purpose of Study Design Sample Size
Predictors Outcome
StatisticalAnalysis Used Results/Findings
Correlations between Graduates Performances as First Year Residents and Their Performances as Medical Students.
Smith, Acad Med1993
• Medical School
• Internship 1989 - 1991
Examine relationship (correlation) between performance in internship and Med School performance, on a clinical skill exam
Retrospective Cohort
203Graduates of BrownUniversity
Objective Clinical Exam in Senior Year (OSCE)
Honors and Failing Grades in Preclinical
Clerkship
Clinical Electives
SupervisorRating for year one residency
Pearson correlation coefficients
• Data collection score on the CSE correlated best with internship performance. r = 0.273
• Correlations for clinical net score, number of honors grades in clinical electives, and interpersonal skills score closely clustered behind data collection score.
• Correlations for number of honor grades in preclinical courses and scores on NBME I and II was zero.

Appendix 5 SUMMARY OF INCLUDED STUDIES
( 32 ) Variables
Citation Time of Measurement
Research Question/ Purpose of Study Design Sample
Size Predictors Outcome
StatisticalAnalysis Used Results/Findings
NBMEExamination Part I as Predictor of Clinical and ABIMCertifying Examination Performances
Sosenko,Stekel, Soto & Gelbard. J Gen Int Med, 1993
1980 – 1988 Jackson Memorial Hospital
Whether scores from NBME I are predictive of competence in internal medicine as assessed by clinical performance ratings and American Boar d of Internal Medicine
Retrospective Cohort Study
117internal medicineresidents
NBME I American Board of Internal Medicine ScoresSupervisors rating of clinical competency during residency
Pearson correlation
High correlation between ABIME and NBME I (r = 0.57) Relation between clinical evaluations and the NBME I were considerably weaker (r=0.27)

Appendix 5 SUMMARY OF INCLUDED STUDIES
( 33 )
VariablesCitation Time of
Measurement Research Question/ Purpose of Study Design Sample
Size Predictors Outcome
StatisticalAnalysis Used Results/Findings
Association between licensure examination scores and practice in primary care.
Tamblyn, et al. J Am Med Assoc 2002
1990-1993 - practice
To determine a sustained relationship between certification exam scores and practice performance.
If licensing exams taken at end of medical school are predictive of future practice in primary care.
Retrospective cohort Cohort Outcomevariables: 5 annual measures
912 FPs Final year MD Exam Scores and subscores
• Licensingexaminations
Practice Outcomes in Primary Care
Poissonregression
Multiple linear regression
• Relationships between certification exams were sustained through first 4-7 years of practice.
• Exams taken in final year of medical school were significant predictors of practice performance.
Outcomes
Preventive Care Mammography Screening
Rate
Coordination of Care Continuity of Care, % of
visits
Resource Use Consultation Rate
Acute & Chronic Disease Management
Symptom-relief Prescribing Rate Among Elderly Patients
Disease-specific Prescription Rate Minus Symptom-Relief
Prescription Rate
Contraindicated Prescribing Among Elderly Patients
Continued Tamblyn, et al. J Am Med Assoc2002Predictors β (95% CI) P Value β (95% CI) P
Valueβ (95% CI) P Value β (95% CI) P Value β (95% CI) P Value β (95% CI) P Value
Overall score 16.81 (8.7 to 24.9)
< .001 0.2 (-0.4 to 0.8)
.52 4.93 (2.1 to 7.8
< .001 -7.15 (-15.0 to 1.0)
.08 4.83 (0.9 to 8.8)
.01 0.93 (0.82 to 1.05)
.21
Prevention subscore
8.10 (-1.0 to 17.2)
.08
Clinical Assessment subscore
11.54 (5.5 to 17.6)
.002
Managementsubscore
0.01 (-0.6 to 0.6)
.96 -7.0 (-14.0 to 2.2)
.15 3.0 (-1.0 to 6.9)
.15 0.91 (0.80 to 1.03)
.13
Diagnosissubscore
-5.1 (-12.0 to 2.3)
.18 3.80 (0.3 to 7.3)
.03 0.97 (0.86 to 1.10)
.67
DrugKnowledgesubscore
-6.99 (-14.0 to 0.4)
.06 3.5 (0 to 7.1)
.05 0.88 (0.77 to 1.0)
.05

Appendix 5 SUMMARY OF INCLUDED STUDIES
( 34 )
VariablesCitation Time of
Measurement Research Question/ Purpose of Study Design Sample
Size Predictors Outcome
Statistical Analysis Used Results/Findings
Clinical Performance - based test sensitivity and specificity in predicting first year residency performance.
Vu, et al. Acad Med supp. 1993
• Medical School(1987, 88, 90)
• Internship
To assess the utility of the post clerkship exam in predicting 1st year residency performance : 1) Students who would receive high 2) Students who would receive low.
Retrospective cohort
202reduced to 133
Clinical Competence (Post-clerkshipscore
Supervisor rating for year one residency
• Supervisors are reluctant to give low ratings. • PCX = "Very sensitive"; Correctly identified 91%
of students who received high ratings. • Much lower specificity for low ratings received.

Appendix 5 SUMMARY OF INCLUDED STUDIES
( 35 )
VariablesCitation Time of
Measurement Research Question/ Purpose of Study Design Sample
Size Predictors Outcome
StatisticalAnalysis Used Results/Findings
Six years of comprehensive,clinical, performance-based assessment usingstandardized patients at the Southern Illinois University School of Medicine
Vu, et al. AcadMed 1992
1986-1991•
To determine the validity and reliability of a post-clerkship clinical performance examination
Retrospective 405 students
scores on the PCX
NBME I NBME II Clerkship scores
First year resident supervisor rating
Pearson correlation coefficient
Clerkship rating r = .36 to .62 First year residency supervisor r = .16 to .43, mean .32 NBME I r = .20 to .65, mean .42 NBME II r = 0.30 to .56, mean .40
All correlations were positive and significant, but they were relatively small, suggesting that the measures may assess different aspects of performance with small overlapping.

Appendix 5 SUMMARY OF INCLUDED STUDIES
( 36 )
VariablesCitation Time of
Measurement Research Question/ Purpose of Study Design Sample
Size Predictors Outcome
Statistical Analysis Used Results/Findings
Comprehensiveundergraduatemedical assessments improveprediction of clinical performance
Wilkinson & FramptonMed Edu 2004
2002 - 2003 High correlation using the new assessment method during the intern year OSCE has a higher predictive validity Combining the results is better than relying on any single method
Prospectivebefore and after cohort study
137 year 5 medical studentsfollowedinto their trainee intern year
Essay exam MCQModifiedessay OSCE
Aggregated global ratings by senior directors, junior doctors and nurses evaluating global clinical skills, global humanistic skills and total global score and comprehensivestructured assessment Comparison with the old written examination
Pearson’s correlationMultiple regression and partialcorrelation coefficient
Global total correlations: Old exam: written r = .17 New exam: written r = .54, OSCE r = .59 & combined r = .60

Appendix 5 SUMMARY OF INCLUDED STUDIES
( 37 )
VariablesCitation Time of
Measurement Research Question/ Purpose of Study Design Sample
Size Predictors Outcome
Statistical Analysis Used Results/Findings
Medical School Achievements as Predictors of Residency Performance.
Yindra,Rosenfeld & Donnelly JMed Edu 1998
1983 and 1984 Medical School Internship
Relationships between academic achievement in med school : performance in internship, evaluated by program directors
Retrospective Cohort
119, 158 Medical school performanceAverage course grades years 1, 2, 3, 4 AOADean’s Letter rankingNBME I NBME II
Performancein first year residency
Multiple regressionFactor analysis t-testsANOVA Pearson correlation
Low correlation highest NBME Part II r =0.37, but statistically significant relationships between measures of medical school performance and program directors’ ratings. Confounding effects of specialty on resident’s ratings.

Appendix 5 SUMMARY OF INCLUDED STUDIES
( 38 )
VariablesCitation Time of
Measurement Research Question/ Purpose of Study Design Sample
Size Predictors Outcome
StatisticalAnalysis Used Results/Findings
BoardCertification: AssociationswithPhysicians’ DemographicsandPerformancesduring Medical School and Residency
Xu, Veloski & Hojat. AcadMed, 1988
1976 - 1985 • Jefferson
Medical School
• Specialty BoardCertification
Do physicians who are board certified have records of higher academic credentials during medical school and in residency.
Can academic credentials during medical school and residency predict future board-certification status
What is the effect of age, sex, ethnicity on both questions
Prospective,Longitudinal study
1186 Grades of basic medical sciences (BMS). Year 1 & 2 Grades of clinical sciences – Year 3 GPAs, BMS and clinical sciences NBME I & II
Supervisor ratings (Likert Scale) (PGY1) 33 statement 3 factors (data gathering and processing skills 60% of covariance). (interpersonal and attitudinal 5%), socioeconomicaspects of patient care (4%).Composite score of the three areas of postgraduatecompetence Self reported practice specialty in family medicine, internal medicine Board certification status
Chi-Squaretests for board certification and sex, age, raceT-test, mean differences between board certified and those not certified Multiple linear regressionmodels for correlation NBME and postgraduateclinical competence
Data on 95% of graduates (1,186). 1068 were board certified 90% Rate of certification: 82% in surgery, 92% family practice, 94% internal medicine (x2 = 37.96,P<.001)Differences in Mean Scores of medical schools scores: GPA “BMS”, GPA “CS”, NBME I, NBME II among certified and not certified physicians. Certified had higher academic credentials. Similar certification rates for men and women Older graduates were less likely to be certified Much lower proportion of underrepresented physicians achieved certification NBME Score II better predictor than NBME I with ABM in medicine and surgery. In family medicine, neither NBME I or II was a significant predictor

Meta-Analysis of 19 Included Studies ( Figs 2 – 11)
Study name Sample size
Correlation(Random) 95% CI
Weight %
Correlation(Random) 95% CI
Markert 1993 481 14.95 0.20 [ 0.11 , 0.28]
Smith 1993 203 12.53 0.02 [-0.12 , 0.16]
Sosenko 1993 68 7.94 0.27 [0.03 , 0.48]
Kahn et al. 2001 50 6.57 0.08 [-0.20 , 0.35]
Yindra 1998 a 119 10.43 0.24 [ 0.06 , 0.40]
Yindra 1998 b 158 11.59 0.33 [ 0.18 , 0.46]
Alexander et al. 2000 338 14.11 0.20 [ 0.10 , 0.30]
Borowitz 2000 69 8.01 0.10 [-0.14 , 0.33]
Paolo et al. 2003 308 13.86 0.40 [ 0.30 , 0.49]
Total (95% CI) 1794
100.0 0.22 [0.13 , 0.30] Test of heterogeneity: Q-value = 25.166, Df = 8, P-value = 0.0015
– 1 – 0.5 0 0.5 1
Fig 2: Correlation Coefficient between NBME I (predictor) and Supervisor rating (outcome)
Study name Sample size Correlation(Random) 95% CI
Weight %
Correlation(Random) 95% CI
Markert 1993 481 17.08 0.24 [ 0.15 , 0.32]
Smith 1993 203 14.9 0.02 [-0.12 , 0.16]
Kahn et al. 2001 50 8.69 0.22 [-0.06 , 0.47]
Yindra 1998 a 119 12.86 0.37 [ 0.20 , 0.52]
Yindra 1998 b 158 14.01 0.37 [ 0.23 , 0.50]
Alexander et al. 2000 338 16.35 0.24 [ 0.14 , 0.34]
Paolo et al. 2003 308 16.12 0.42 [ 0.32 , 0.51]
Total (95% CI) 1657
100.0 0.27 [0.16 , 0.38] Test of heterogeneity: Q-value = 26.539, Df = 6, P-value = 0.0002
– 1 – 0.5 0 0.5 1
Fig 3: Correlation Coefficient between NBME II (predictor) and Supervisor rating (outcome)
Study name Sample size Correlation(Random) 95% CI
Weight %
Correlation(Random) 95% CI
Markert 1993 481 11.31 0.30 [ 0.22 , 0.38]
Smith 1993 203 9.09 0.29 [ 0.16 , 0.41]
Kahn et al. 2001 50 4.33 0.30 [ 0.02 , 0.53]
Yindra 1998 a 119 7.30 0.28 [ 0.11 , 0.44]
Yindra 1998 b 158 8.27 0.19 [ 0.04 , 0.34]
Alexander et al. 2000 338 10.52 0.32 [ 0.22 , 0.41]
Paolo et al. 2003 308 10.28 0.49 [ 0.40 , 0.57]
Callhan et al 2000 2158 13.10 0.20 [ 0.16 , 0.24]
Pearson et al 1998 64 5.13 0.27 [ 0.03 , 0.48]
Richard 1962 139 7.84 0.33 [ 0.17 , 0.47]
Rabinowitz 1989 1458 12.82 0.16 [ 0.11 , 0.21]
Total (95% CI) 5476 100.0 0.28 [ 0.22 , 0.35] Test of heterogeneity: Q-value = 46.87, Df = 10, P-value < 0.0005
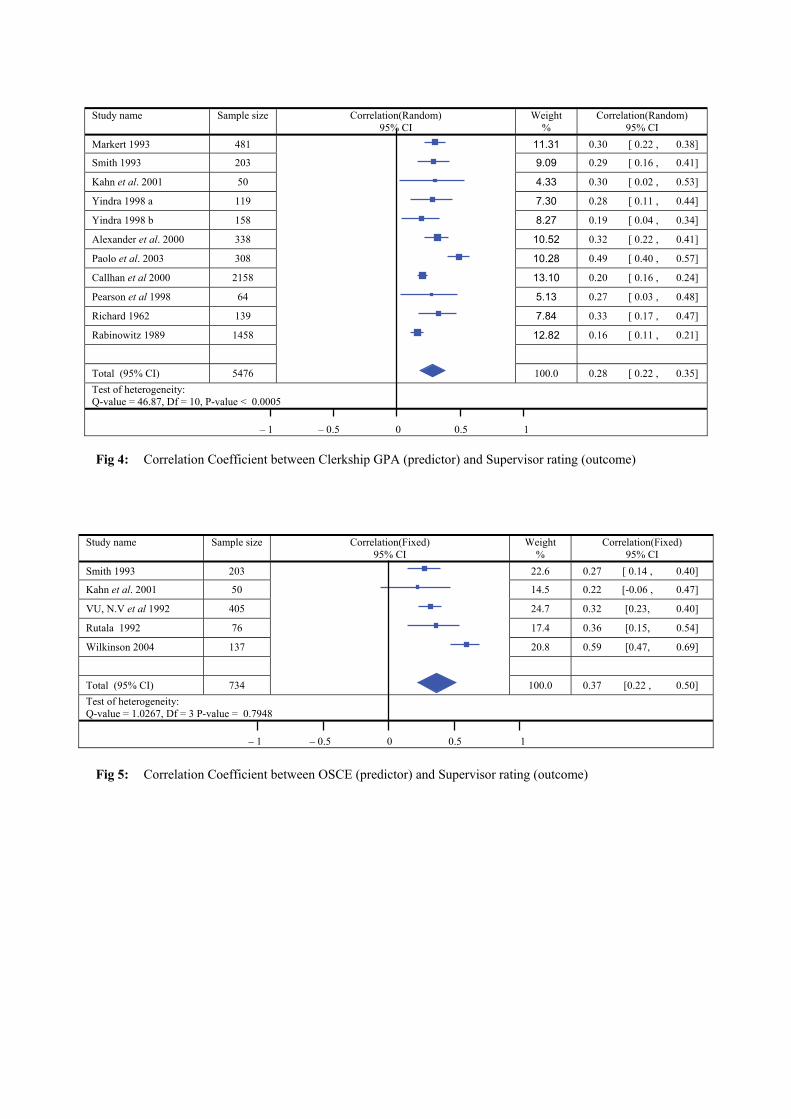
– 1 – 0.5 0 0.5 1
Fig 4: Correlation Coefficient between Clerkship GPA (predictor) and Supervisor rating (outcome)
Study name Sample size Correlation(Fixed) 95% CI
Weight %
Correlation(Fixed) 95% CI
Smith 1993 203 22.6 0.27 [ 0.14 , 0.40]
Kahn et al ]74.0 , 60.0-[ 22.0 5.41 05 1002 .
VU, N.V et al ]04.0 ,32.0[ 23.0 7.42 504 2991
Rutala 1992 76 17.4 0.36 [0.15, 0.54]
Wilkinson 2004 137 20.8 0.59 [0.47, 0.69]
Total (95% CI) 734 100.0 0.37 [0.22 , 0.50] Test of heterogeneity: Q-value = 1.0267, Df = 3 P-value = 0.7948
– 1 – 0.5 0 0.5 1
Fig 5: Correlation Coefficient between OSCE (predictor) and Supervisor rating (outcome)

Study name Sample size Correlation(Fixed) 95% CI
Weight %
Correlation(Fixed) 95% CI
Loftus et al ]14.0 , 40.0 [ 32.0 8.62 201 2991 .
Yindra 1998 a 119 31.4 0.21 [ 0.03 , 0.38]
Yindra 1998 b 158 41.9 0.22 [ 0.07, 0.36]
Total (95% CI) 379 100.0 0.22 [0.12 , 0.31]
Test of heterogeneity: Q-value = 0.024, Df = 2, P-value = 0.988
– 1 – 0.5 0 0.5 1
Fig 6: Correlation Coefficient between Ranking (Dean’s letter) (predictor) and Supervisor rating (outcome)
Study name Sample size Correlation(Fixed) 95% CI
Weight %
Correlation(Fixed) 95% CI
Markert 1993 481 48.52 0.25 [ 0.16 , 0.33]
Loftus et al ]83.0 , 10.0 [ 02.0 70.01 201 2991
Yindra 1998 a 119 11.80 0.28 [ 0.11 , 0.44]
Yindra 1998 b 158 15.77 0.29 [ 0.14 , 0.43]
Richard et al ]83.0 , 70.0 [ 32.0 48.31 931 2691
Total (95% CI) 1657 100.0 0.25 [ 0.19 , 0.31] Test of heterogeneity: Q-value = 0.7399, Df = 4, P-value = 0.9463
– 1 – 0.5 0 0.5 1
Fig 7: Correlation Coefficient between Pre-clinical GPA (predictor) and Supervisor rating (outcome)
Study name Sample size Correlation(Fixed) 95% CI
Weight %
Correlation(Fixed) 95% CI
Markert 1993 628 20.9 0.56 [ 0.50 , 0.61]
Hojat et al ]36.0 , 75.0 [ 06.0 1.97 8632 3991 .
Total (95% CI) 2996 100.0 0.59 [0.57 , 0.61] Test of heterogeneity: Q-value = 1.798, Df = 1, P-value = 0.180
– 1 – 0.5 0 0.5 1
Fig 8: Correlation Coefficient between NBME I (predictor) and NBME III (outcome)

Study name Sample size Correlation(Fixed) 95% CI
Weight %
Correlation(Fixed) 95% CI
Markert 1993 628 20.9 0.71 [ 0.67 , 0.75]
Hojat et al ]47.0 , 07.0 [ 27.0 1.97 8632 3991 .
Total (95% CI) 2996 100.0 0.72 [0.70 , 0.73] Test of heterogeneity: Q-value = 0.207, Df = 1, P-value = 0.649
– 1 – 0.5 0 0.5 1
Fig 9: Correlation Coefficient between NBME II (predictor) and NBME III (outcome)
Study name Sample size Correlation(Fixed) 95% CI
Weight %
Correlation(Fixed) 95% CI
Case 1993 a * 621 34.02 0.59 [ 0.54 , 0.64]
Case 1993 b ** 214 23.47 0.49 [ 0.38 , 0.59]
Case 1993 c *** 133 18.14 0.63 [ 0.52 , 0.72]
Boyse 2002 **** 42 7.62 0.73 [ 0.54 , 0.84]
Sosenko 1993 117 16.75 0.57 [ 0.43 , 0.68]
Total (95% CI) 1127 100.0 0.58 [ 0.54 , 0.62]
Test of heterogeneity: Q-value = 7.112, Df = 4, P-value = 0.130
– 1 – 0.5 0 0.5 1 * American Board of Orthopedic Surgery; ** American Board of Dermatology; *** American Board of Preventive Medicine; **** American Board of Radiology
Fig 10: Correlation Coefficient between NBME I (predictor) and American Board of Specialty Examination Scores (outcome)
Study name Sample size Correlation(Random) 95% CI
Weight %
Correlation(Random) 95% CI
Case 1993 a * 623 38.62 0.64 [ 0.59 , 0.68]
Case 1993 b ** 204 32.02 0.51 [ 0.40 , 0.60]
Case 1993 c *** 151 29.36 0.68 [ 0.58 , 0.76]
Total (95% CI) 978 100.0 0.61 [ 0.51 , 0.70]
Test of heterogeneity: Q-value = 7.5676, Df = 2, P-value = 0.0227
– 1 – 0.5 0 0.5 1 * American Board of Orthopedic Surgery; ** American Board of Dermatology; *** American Board of Preventive Medicine
Fig 11: Correlation Coefficient between NBME II (predictor) and American Board of Specialty Examination