appendix 4e (rule 4.3a) preliminary final report for the
TRANSCRIPT

APPENDIX 4E (Rule 4.3A) PRELIMINARY FINAL REPORT for the year ended 30 June 2011
Results for Announcement to the Market Current Reporting Period: 12 Months ended 30 June 2011 Previous corresponding reporting period: 12 months ended 30 June 2010 (all comparisons to year ended 30 June 2010) 30 June 2011 (AU$’000) Revenues from ordinary activities
up 30.3% from 69,073 to 89,982
Profit/(loss) from ordinary activities after tax attributable to members
up 34.0% from 11,782 to 15,790
Net profit/(loss) for the period attributable to members
up 34.0% from 11,782 to 15,790
Dividend information The Company has not proposed to pay any dividends. Net tangible Assets
30 Jun 11
30 Jun 10
Net tangible assets per security* $0.27 $0.26 *Exploration and evaluation phase assets have been treated as intangible assets Financial Results The following appendix 4E reporting requirements are found in the attached Annual Financial Report. Requirement Title Reference Review of Results Directors’ Report Page 3 A statement of comprehensive income
Statement of comprehensive income Page 34
A statement of financial position Statement of financial position Page 35 A statement of cash flows Statement of cash flows Page 37 A statement of retained earnings Statements of changes in equity Page 36 Earnings per security Earnings per share Page 57 Independent audit report Independent audit report Page 32
Control gained or lost over entities during the period There have been no gains or losses of control over entities in the year ended 30 June 2011. Associate and joint venture entities There are no associate or joint venture entities.
This Report is based on the Annual Financial Report which has been audited.
For
per
sona
l use
onl
y

Silver Lake Resources Limited ABN 38 108 779 782
Annual Financial Report For the year ended 30 June 2011
For
per
sona
l use
onl
y

Corporate Directory
1 | P a g e
Directors
Paul Chapman Non-Executive Chairman Les Davis Managing Director Chris Banasik Executive Director – Exploration and Geology Brian Kennedy Non-Executive Director Peter Johnston Non-Executive Director David Griffiths Non-Executive Director Company Secretary
Peter Armstrong Principal Office
31 Malcolm Street West Perth WA 6005 Tel: +61 8 6313 3800 Fax: +61 8 6313 3888 Email: [email protected] Registered Office
31 Malcolm Street West Perth WA 6005 Solicitors
Gilbert + Tobin 1202 Hay Street West Perth WA 6005 Share Register
Security Transfer Registrars Pty Ltd 770 Canning Highway Applecross WA 6153 Auditors
KPMG 235 St George’s Terrace Perth WA 6000 Internet Address
www.silverlakeresources.com.au ABN 38 108 779 782 ASX Code: SLR
For
per
sona
l use
onl
y

Table of Contents
2 | P a g e
Page
Directors’ Report 3
Auditor’s Independence Declaration 20
Corporate Governance 21
Directors’ Declaration 31
Independent Audit Report 32
Statement of Comprehensive Income 34
Statement of Financial Position 35
Statements of Changes in Equity 36
Statements of Cash Flows 37
Notes to the Financial Statements 38
ASX Additional Information 70
For
per
sona
l use
onl
y

Directors’ Report
3 | P a g e
The Directors present their report on the consolidated entity consisting of Silver Lake Resources Limited (“Silver Lake” or “the Company”) and the entities it controlled at the end of, or during the financial year ended 30 June 2011 (“the Group”). DIRECTORS The names and details of the Company’s Directors in office during the financial year and until the date of this report are as follows. The Directors were in office for the entire period unless otherwise stated. Paul Chapman B Comm, ACA, Grad Dip Tax, CFTP (Snr), MAICD, MAusIMM Non-Executive Chairman Appointed 20 April 2004 Mr Chapman is a chartered accountant with over 20 years experience in the resources sector gained in Australia and the United States. Mr Chapman has experience across a range of commodity businesses including gold, nickel, uranium, manganese, bauxite/alumina and oil/gas. Mr Chapman has held Managing Director and other senior management roles in public companies of various sizes and is Chairman of WA based copper explorer Encounter Resources Ltd (since 7 October 2005) and copper/gold explorer Rex Minerals Ltd (since 2007), and was a Director of Albidon Ltd (from 18 April 2007 to 23 April 2009). Les Davis MSc (Min Econs) Managing Director Appointed 25 May 2007 Mr Davis has over 30 years industry experience including 17 years hands-on experience in mine development and narrow vein mining. Mr Davis’ career incorporates 13 years senior management experience including roles as Mine Manager, Technical Services Manager, Concentrator Manager, Resident Manager and General Manager Expansion Projects with organisations including WMC Resources Ltd, Reliance Mining Ltd and Consolidated Minerals Ltd. Mr Davis has held no other Directorships in publicly listed companies in the last three years. Chris Banasik B App Sc (Physics), MSc (Econ Geol), Grad Dip Ed, MAusIMM Executive Director – Exploration & Geology Appointed 25 May 2007 Mr Banasik has over 25 years experience in the resource industry which includes 10 years hands-on experience in mine geology resource and reserve calculation and a history of successful exploration in the Kambalda region of Western Australia. Mr Banasik has extensive experience in leading geology and exploration teams and managing drilling programmes, surveying, mine planning and other technical services through 11 years in management roles with WMC Resources Ltd, Reliance Mining Ltd and Consolidated Minerals Ltd. Mr Banasik has held no other Directorships in publicly listed companies in the last three years.
For
per
sona
l use
onl
y

Directors’ Report
4 | P a g e
Brian Kennedy Cert Gen Eng Non-Executive Director Appointed 20 April 2004 Mr Kennedy has operated a successful resource consultancy for over 25 years and has worked in the coal, iron ore, nickel, gold and fertilizer industries. During this time Mr Kennedy managed large scale mining operations such as Kambalda and Mount Keith on behalf of WMC Resources Ltd.
Mr Kennedy was a founding shareholder and Director of Reliance Mining Ltd, before its takeover by Consolidated Minerals Ltd.
Mr Kennedy has held no other Directorships in publicly listed companies in the last three years.
Peter Johnston BA, FAICD, FAusIMM Non-Executive Director Appointed 22 May 2007 Mr Johnston’s extensive management career spans 30 years. That time includes senior management roles at WMC Resources Ltd, Alcoa of Australia Limited and Lion Nathan Limited. Mr Johnston has been Chief Executive Officer/Director of Minara Resources Ltd since 20 November 2001. As Executive General Manager at WMC Resources Ltd for over eight years, Mr Johnston was at various times responsible for nickel and gold operations, Olympic Dam operations, Queensland Fertilizers Ltd and human resources.
Mr Johnston is an Executive Council member and a past President of the Chamber of Minerals and Energy, a Director and past Chairman of the Nickel Institute, Chairman of the Minerals Council of Australia, a Director of Emeco Holdings Limited since 1 September 2006, and Vice President of the Australian Mines and Metals Association.
David Griffiths B Bus Non-Executive Director Appointed 25 May 2007 Mr Griffiths has more than 30 years management and strategic communications experience developing from an initial focus on human resources and employee relations to broader, group-wide strategic roles. Previously Mr Griffiths was employed by WMC Resources Ltd and held the roles of Group Manager – Employee Relations and more recently, General Manager Corporate Affairs and Community Relations.
Currently, Mr Griffiths is the Managing Director of the communications strategy and public relations company Gryphon Management Australia Pty Ltd which he established in 2004. Gryphon Management assists companies to develop and implement strategic communication plans, human resources strategies and corporate reputation plans.
Mr Griffiths has held no Directorships in publicly listed companies in the last three years. COMPANY SECRETARY Peter Armstrong ACIS, B Bus(Acct) Appointed 16 January 2009 Mr Armstrong has over 30 years of accounting experience, including the last 25 years in the resources sector. He has extensive experience in senior commercial management roles with Normandy Mining, WMC and Newcrest. This experience involved working across a wide range of commodity businesses including gold, nickel, copper, coal and iron ore.
For
per
sona
l use
onl
y

Directors’ Report
5 | P a g e
COMMITTEE MEMBERSHIP As at the date of this report, the Company has an Audit Committee, Remuneration Committee and a Nomination Committee. Those members acting on the committees of the Board during the year were:
Audit* Remuneration* Nomination*
David Griffiths (c) Brian Kennedy (c) Peter Johnston (c)
Peter Johnston Peter Johnston Brian Kennedy
Paul Chapman David Griffiths David Griffiths
(c) Designates the chairman of the committee * Formed on 17 August 2007 DIRECTORS’ MEETINGS The number of meetings of Directors (including meetings of committees of Directors) held during the year and the number of meetings attended by each Director are as follows: Meetings of Committees
Directors’ Meetings Audit Remuneration Nomination
Number of meetings held:
9 2 1 1
Number of meetings attended:
Paul Chapman 9 2 * *
Les Davis 9 * * *
Chris Banasik 9
* * *
Brian Kennedy 7 * 1 1
Peter Johnston 9 2 1 1
David Griffiths 9 2 1 1
*Not a member of this committee DIRECTORS’ INTERESTS The relevant interest of each Director in the share capital as notified by the Directors to the Australian Stock Exchange in accordance with s205G(1) of the Corporations Act 2001, at the date of this report is as follows: Name of Director Fully Paid Ordinary Shares Unlisted Options
Paul Chapman 4,606,908 4,000,000
Les Davis 4,200,000 4,000,000
Chris Banasik 4,000,000 4,000,000
Brian Kennedy 4,075,377 4,000,000
Peter Johnston 4,318,253 4,000,000
David Griffiths 4,158,377 4,000,000
Note: Details of relevant interest of each Director are outlined at Note 30 to the financial statements.
For
per
sona
l use
onl
y

Directors’ Report
6 | P a g e
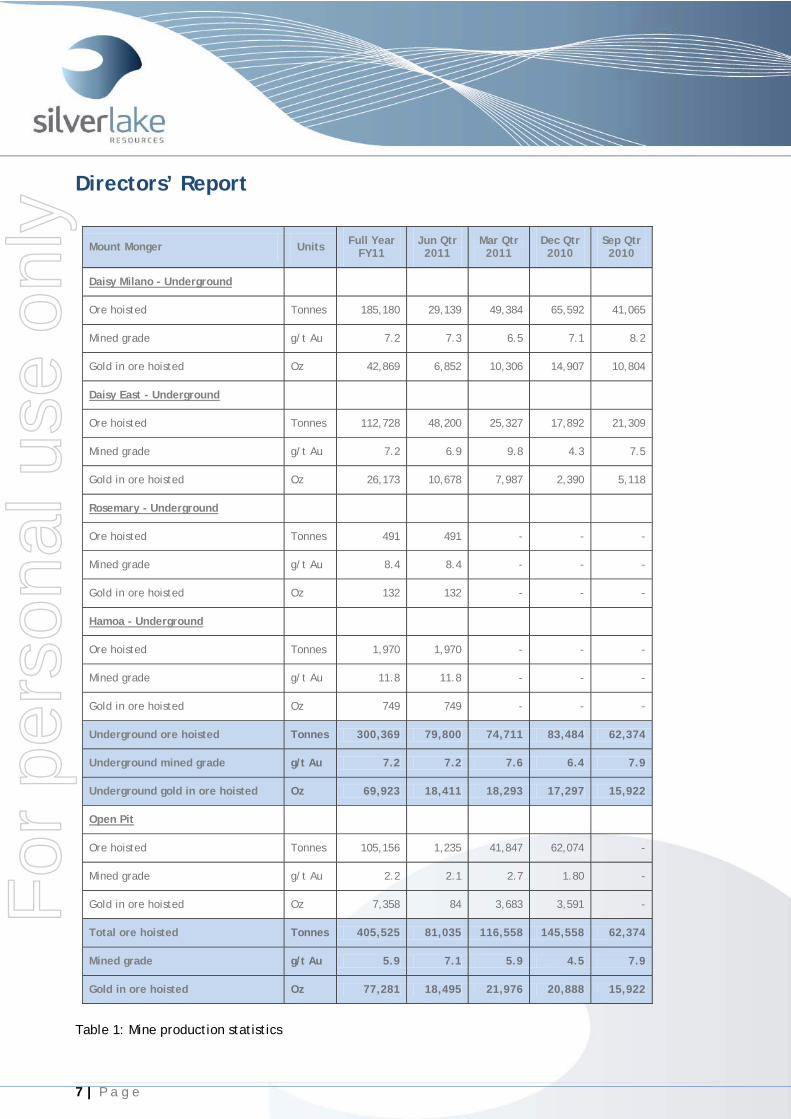
PRINCIPAL ACTIVITIES The principal activities of the Group during the course of the financial year were gold mining and processing from the Mount Monger Operations and exploration and evaluation of projects. CORPORATE STRUCTURE Silver Lake is a company limited by shares and is domiciled and incorporated in Australia. OPERATING REVIEW The Company is an ASX 300 gold producing and exploration company with a resource base of 3.3 million oz in highly prospective regions including the Mount Monger goldfield and the Murchison goldfield. The Group’s strategy is to develop large production centres at Mount Monger and at the Murchison with multiple mines at each centre. The Mount Monger Operation contains the Daisy Milano, Daisy East, Rosemary & Haoma underground mines and is located 50 km south east of Kalgoorlie. Mount Monger has additional multi mine potential underpinned by emerging open pit production from the Wombola Dam, Wombola Pit and Magic deposits. Gold ore from Mount Monger is transported to the Group’s 600,000 tonne per annum Lakewood Gold Processing Facility located 5 km south east of Kalgoorlie and 45 km from the Daisy Milano mine. This facility is currently being expanded to 700,000 tonnes per annum by December 2011 and up to 1 million tonnes per annum by September 2012 quarter. In the Murchison, the strategy is to develop a second mining operation with multiple mines feeding a central processing facility. Accordingly, the focus is on extending resources, particularly below 100 metres depth, to sustain a 100,000 oz per annum operation. A 1.2 million tonne per annum mill has been acquired for this project. A decision to mine in the Murchison is expected late in 2011. The Group’s exploration programme is targeting over 10 million oz Au in resource over time with a short term target of 5 million oz au in resource by June 2012. SAFETY There were five (5) Lost Time Injuries during the period. All incidents were thoroughly investigated and preventative measures put in place to reduce the likelihood of similar occurrences. Silver Lake’s Lost Time Injury Frequency Rate stands at 11.97. UNDERGROUND MINE PRODUCTION Underground production during the period totaled 300,369 tonnes at 7.2 g/t Au for 69,923 ounces (refer to table 1). OPEN PIT PRODUCTION Open pit production during the period totaled 105,156 tonnes at 2.2 g/t Au for 7,358 ounces (refer to table 1). COMBINED MINE PRODUCTION Combined mine production during the period totaled 405,525 tonnes at 5.9 g/t Au for 77,281 ounces (refer to table 1).
For
per
sona
l use
onl
y
Directors’ Report
7 | P a g e
Mount Monger Units Full Year FY11
Jun Qtr 2011
Mar Qtr 2011
Dec Qtr 2010
Sep Qtr 2010
Daisy Milano - Underground
Ore hoisted Tonnes 185,180 29,139 49,384 65,592 41,065
Mined grade g/t Au 7.2 7.3 6.5 7.1 8.2
Gold in ore hoisted Oz 42,869 6,852 10,306 14,907 10,804
Daisy East - Underground
Ore hoisted Tonnes 112,728 48,200 25,327 17,892 21,309
Mined grade g/t Au 7.2 6.9 9.8 4.3 7.5
Gold in ore hoisted Oz 26,173 10,678 7,987 2,390 5,118
Rosemary - Underground
Ore hoisted Tonnes 491 491 - - -
Mined grade g/t Au 8.4 8.4 - - -
Gold in ore hoisted Oz 132 132 - - -
Hamoa - Underground
Ore hoisted Tonnes 1,970 1,970 - - -
Mined grade g/t Au 11.8 11.8 - - -
Gold in ore hoisted Oz 749 749 - - -
Underground ore hoisted Tonnes 300,369 79,800 74,711 83,484 62,374
Underground mined grade g/t Au 7.2 7.2 7.6 6.4 7.9
Underground gold in ore hoisted Oz 69,923 18,411 18,293 17,297 15,922
Open Pit
Ore hoisted Tonnes 105,156 1,235 41,847 62,074 -
Mined grade g/t Au 2.2 2.1 2.7 1.80 -
Gold in ore hoisted Oz 7,358 84 3,683 3,591 -
Total ore hoisted Tonnes 405,525 81,035 116,558 145,558 62,374
Mined grade g/t Au 5.9 7.1 5.9 4.5 7.9
Gold in ore hoisted Oz 77,281 18,495 21,976 20,888 15,922
Table 1: Mine production statistics
For
per
sona
l use
onl
y

Directors’ Report
8 | P a g e
PROCESSING The Lakewood Gold Processing Facility is located 5 km southeast of Kalgoorlie and 45 km from the Daisy Milano mine. 356,684 tonnes were milled during the period at 5.8 g/t Au for 66,571 contained oz. Recovery was 95% resulting in 63,425 oz produced (refer to table 2).
Lakewood Gold Processing Facility Units Full Year
FY11 Jun Qtr
2011 Mar Qtr
2011 Dec Qtr
2010 Sep Qtr
2010
Ore milled Tonnes 356,684 99,500 89,107 80,536 87,541
Head grade g/t Au 5.8 5.7 6.4 5.8 5.3
Contained gold Oz 66,571 18,350 18,404 14,975 14,841
Recovery % 95 95 97 95 95
Gold produced Oz 63,425 17,384 17,800 14,229 14,013
Gold refined & sold Oz 64,703 16,688 18,219 14,820 14,976
Table 2: Processing statistics BUSINESS DEVELOPMENT Silver Lake’s strategy is to develop large production centres at Mount Monger and at the Murchison with multiple mines at each centre. Strategic milestones reached during the period include: MOUNT MONGER OPERATIONS: Substantial progress towards expanding Mount Monger Operations to >100,000 oz in FY12 and 150,000 oz in FY13:
- 520 metre deep ventilation shaft completed on time & on budget; - underground operations debottlenecked with production from four underground mines; - access established to 32 level Haoma & ore development commenced; - low capital upgrade of Lakewood Gold Processing Facility to 1.0 million tonne per annum, in
progress; - commitment to commence open pit production at Wombola Dam; and - significant drill intercepts between Daisy Deeps & Haoma.
MURCHISON PROJECT: The definitive feasibility study, which includes mining reserves and project financials, is continuing. Work completed to the end of the period includes:
- detailed mine designs and schedules for 14 open pit and 4 underground mines; - operating and capital cost estimates; and - infill and extensional drilling in progress at depth.
For
per
sona
l use
onl
y

Directors’ Report
9 | P a g e
Work completed to date supports a production plan of 100,000 oz per annum with an 8 to 10 year mine life. Exploration activities in the Murchison have also identified significant copper targets immediately north of the planned 1.2 million tonne per annum gold mill. UNPROCESSED ORE STOCKS Unprocessed ore stocks at the end of the period totaled 108,600 tonnes containing 13,500 ounces. GOLD IN CIRCUIT Gold in circuit at the end of the period totaled 5,535 ounces. GOLD SALES Gold sales for the period totaled 64,703 oz at an average realised price of A$1,390oz. REVIEW OF FINANCIAL CONDITION The profit of the Group for the financial period, after providing for income tax amounted to $15,790,000. (2010: $11,782,000). At the end of the financial year the Group had $16,085,000 in cash (2010: $29,503,000), $2,364,000 in cash deposits to cover environmental bonds (2010: $2,376,000) and $4,934,000 in gold bullion and dore (2010: $4,248,000). The positive cash flow generated through operating activities was reinvested in growth projects and used mainly to: accelerate exploration ($15.7m) to increase the resource inventory by ~1 million oz; construct a 520 metre ventilation shaft ($5.1m) to debottleneck the underground operations; increase development at Mount Monger operations ($13.3m) resulting in production being sourced from 4 underground mines: acquire the North Monger project ($3.0m); and purchase a treatment plant facility for the Murchison project ($3.1m). Capitalised mineral exploration and evaluation expenditure and mining assets is $75,857,000 (2010: $42,092,000) including capital development $22,967,000 (2010: $8,453,000). The $4,934,000 in gold bullion and dore mentioned above is the market value, its value based on cost of production is $3,331,000 ($1,263,000 in Bullion and $2,068,000 in dore). Expenditure was principally directed to mining and exploration for gold in Western Australia. CAPITAL STRUCTURE As at the report date the Company had 178,882,838 fully paid ordinary shares and 24,240,000 options over ordinary shares on issue. CASH FROM OPERATIONS Details of the Cash from Operations are outlined in Note 15 of the financial statements. DIVIDENDS The Directors have reviewed the dividend policy for the current fiscal year and have decided to defer a dividend and instead conserve cash generated to continue to grow the business through the following projects:
For
per
sona
l use
onl
y

Directors’ Report
10 | P a g e
• continuation of the accelerated exploration programme to grow the current 3.3 million oz JORC resource base;
• expansion of the Lakewood Gold Processing Facility; and • possible decision to develop a second mining operation in the Murchison with multiple mines
feeding a central processing facility. SIGNIFICANT CHANGES IN THE STATE OF AFFAIRS There were no significant changes in the state of affairs of the Company during the period.
LIKELY DEVELOPMENTS AND EXPECTED RESULTS As at the date of this report Silver Lake has announced the following strategic initiatives, however, in some cases the results of these initiatives depend on the results of future exploration and evaluation and are inherently uncertain:
• the Sale of the Rothsay tenements to Auricup Resources Pty Ltd for $1.25m was settled on 18 August 2011;
• the Company plans to open further open pit ore sources at its Mount Monger Operations, with the Wombola pit to commence production in September 2011; and
• the Company is continuing with a definitive feasibility study to determine strategies to open a second multi-source mining centre at its Murchison project.
Further information on likely developments in the operations of the Company and the expected results of those operations in future financial years has not been included in this report because the Directors believe disclosure would be likely to result in unreasonable prejudice to the Company. ENVIRONMENTAL REGULATIONS AND PERFORMANCE The Company’s operations hold licenses issued by the relevant regulatory authorities. These licenses specify limits and regulate the management associated with the operations of the Company. At the date of this report the Company is not aware of any breach of those environmental requirements. SHARE OPTIONS During the financial year, no unlisted options to acquire ordinary shares were issued to employees of the Company. A total of 125,000 ordinary shares were issued on the exercise of options during the financial year. As at the date of this report, the total unissued ordinary shares of the Company under option are:
Number of Options Exercise Price ($) Vesting Date Expiry Date
24,000,000 $0.30 - 31 December 2012
240,000 $0.30 29 January 2009 29 January 2013
EMPLOYEES The consolidated entity had 61 employees as at 30 June 2011. In addition, Silver Lake also engages contractors and consultants.
For
per
sona
l use
onl
y

Directors’ Report
11 | P a g e
INDEMNIFICATION AND INSURANCE OF DIRECTORS AND OFFICERS The Company has agreed to indemnify the current Directors and Officers against any liability (other than the Company or related body corporate) that may arise from their position as Directors and Officers of the Company except where the liability arises out of conduct involving a lack of good faith. During the financial year the Company has paid Directors’ & Officers’ insurance premiums of $12,006 in respect of liability of any current and future Officers, and senior executives of the Company. Silver Lake has not provided any insurance or indemnity to the auditor of the Company. PROCEEDINGS ON BEHALF OF THE COMPANY No person has applied for leave of court to bring proceedings on behalf of Silver Lake or intervene in any proceeding to which the Company is a party for the purpose of taking responsibility on behalf of the Company for all or any part of those proceedings. The Company was not a party to any such proceedings during the year. CORPORATE GOVERNANCE In recognising the need for high standards of corporate behavior and accountability, the Directors of Silver Lake support and have adhered to the principles of good corporate governance. The Company’s corporate governance statement is contained in the following section of this annual report and on the Company’s website. AUDITOR’S INDEPENDENCE Section 307C of the Corporations Act 2001 requires Silver Lake’s auditors, KPMG, to provide the Directors of Silver Lake with an Independence Declaration in relation to the audit of the financial report for the year ended 30 June 2011. This Independence Declaration is attached to the Directors’ Report and forms a part of the Directors’ Report. NON-AUDIT SERVICES The following non-audit services were provided by the Company’s auditor, KPMG. The nature and scope of each type of non-audit service provided means that auditor independence was not compromised. The Board is satisfied that the provision of non-audit services is compatible with the general standard of independence for auditors imposed by the Corporations Act and APES 110. KPMG received the following amounts for the provision of non-audit services:
2011 $
2010 $
Taxation services 51,050 24,700
For
per
sona
l use
onl
y

Directors’ Report
12 | P a g e
REMUNERATION REPORT - AUDITED Silver Lake chooses to remunerate and reward its Directors, Officers and employees in accordance with the Company’s Remuneration Policy. Emoluments of Directors and Officers are set by reference to payments made by other ASX listed companies of similar size, revenue base, employee numbers and profitability. In addition, reference is made to the mining and exploration sectors and to the skills and experience of the Directors and Officers. Details of the nature and amount of emoluments of each Director, Officer and Senior Manager of the Company are disclosed annually in the Company’s annual report. Remuneration Committee The role of the Remuneration Committee and the Board of Directors of Silver Lake is to assist in fulfilling its corporate governance responsibilities with respect to remuneration by reviewing and making appropriate recommendations on:
a) remuneration packages of Executive Directors, Non-Executive Directors and Officers; and
b) employee incentive and equity-based plans including the appropriateness of performance hurdles and total payments proposed.
Non-Executive Director Remuneration The Company’s policy is to remunerate Non-Executive Directors at market rates (for comparable ASX listed companies) for time, commitment and responsibilities. Fees for Non-Executive Directors are not linked to the performance of the Company, however, to align Directors’ interests with shareholders’ interests, Directors are encouraged to hold shares in the Company. It is ensured that:
a) fees paid to Non-Executive Directors are within the aggregate amount approved by shareholders and recommendations to the Board with respect to the need for increases to this aggregate amount at the Company’s annual general meeting;
b) Non-Executive Directors are remunerated by way of fees (in the form of cash and/or superannuation benefits);
c) Non-Executive Directors are not provided with retirement benefits other than statutory superannuation entitlements; and
d) Non-Executive Directors are not entitled to participate in equity-based remuneration schemes designed for executives without due consideration and appropriate disclosure to the Company’s shareholders.
The Constitution provides that the Non-Executive Directors may collectively be paid as remuneration for their services a fixed sum not exceeding the aggregate maximum from time to time determined by the Company in a general meeting. The Directors’ fees payable in aggregate to the Non-Executive Directors of the Company are currently set at $500,000 per annum. The remuneration of Non-Executive Directors is detailed on page 17 of this report. Executive Directors’ and Officers’ Remuneration Executive Directors’ and Officers’ pay and reward consists of a base salary and performance incentives to ensure that:
a) remuneration packages involve a balance between fixed and incentive pay, reflecting short and long term performance objectives appropriate to the Company’s circumstances and objectives;
For
per
sona
l use
onl
y

Directors’ Report
13 | P a g e
Remuneration Report – Audited (cont)
b) a proportion of remuneration is structured in a manner designed to link reward to corporate and individual performances; and
c) recommendations are made to the Board with respect to the quantum of incentive payments to be paid by the remuneration committee.
Executive Directors and Officers are offered a competitive level of base pay at market rates (for comparable ASX listed companies) and are reviewed annually to ensure market competitiveness. Senior Management Senior Management’s pay and reward consists of a base salary and performance incentives. Senior Management are offered a competitive level of base pay at market rates (for comparable ASX listed companies) and are reviewed annually to ensure market competitiveness. Incentive Plans and Benefits Programmes It is the place of the Remuneration Committee to:
a) review and make recommendations concerning long-term incentive compensation plans, including the use of share options and other equity-based plans. Equity-based plans are provided to Executives who are involved in the day to day operations. Except as otherwise delegated by the Board, the committee will act on behalf of the Board to administer equity-based and employee benefit plans, and as such will discharge any responsibilities under those plans, including making and authorising grants, in accordance with the terms of those plans;
b) ensure that incentive plans are designed around appropriate and realistic performance targets that measure relative performance and provide rewards when they are achieved; and
c) continually review and if necessary improve any existing benefit programmes established for employees.
Non-Executive Letters of Engagement All Non-Executive Directors conduct their duties under the following terms:
• a Non-Executive Director may resign from his position and thus terminate their contract on written notice to the Company;
• the Company may by resolution remove any Director before the expiration of their period of office, and may by resolution appoint another person in their place. Payment is paid in lieu of the notice period (based on the fixed component of the Non-Executive Director’s remuneration) if termination is initiated by the Company, except where termination is initiated for serious misconduct; and
• the office of Directors shall automatically become vacant without notice if serious misconduct has occurred.
In consideration of the services provided by Messrs Kennedy, Johnston and Griffiths, the Company will pay each $75,000 per annum plus statutory superannuation, from 1 January 2011, previously $40,000 per
For
per
sona
l use
onl
y

Directors’ Report
14 | P a g e
Remuneration Report – Audited (cont) annum. In consideration of the Chairman services provided by Mr Chapman the Company will pay him $140,000 per annum plus statutory superannuation, from 1 January 2011, previously $70,000 per annum. Messrs Chapman, Kennedy, Johnston and Griffiths are also entitled to fees or other amounts as the Board determines where they perform special duties or otherwise perform extra services or make special exertions on behalf of the Company. There were no such extra fees during the year. They may also be reimbursed for out of pocket expenses incurred as a result of their Directorships. Executive Directors’ and Officer’s Employment Agreements The Company has entered into service agreements with Mr Les Davis and Mr Chris Banasik (each an “Executive”) and Mr Peter Armstrong (an “Officer”) on the following material terms and conditions. Terms defined in this section have the same meaning as contained in the service agreements. Mr Davis was appointed to act as Managing Director of the Company for a minimum term of twenty four months commencing from 7 June 2007. This contract was renewed for a further twenty four month term on 1 January 2010. Mr Davis will receive base salary of $450,000 per annum and the statutory superannuation plus 2.5% to be reviewed annually or as agreed in writing between the Executive and the Company. Previously Mr Davis’ salary was $320,000 per annum up until 31 December 2010. Mr Davis may also receive an annual performance-based bonus of 25% of his current base salary, the performance criteria, assessment and timing of which will be negotiated annually with the Board. Mr Banasik was appointed to act as Exploration and Geology Director of the Company for a minimum term of twenty four months commencing from 1 June 2007. This contract was renewed for a further twenty four month term on 1 January 2010. Mr Banasik will receive an annual base salary of $350,000 per annum and the statutory superannuation plus 2.5% to be reviewed annually or as agreed in writing between the Executive and the Company. Previously Mr Banasik’s salary was $270,000 per annum up until 31 December 2010. Mr Banasik may also receive an annual performance-based bonus of up to 25% of his current base salary, the performance, assessment and timing of which will be negotiated annually with the Board. Mr Armstrong was appointed to act as Company Secretary of the Company. Mr Armstrong will receive an annual base salary of $250,000 per annum plus the statutory superannuation to be reviewed annually or as agreed in writing between Mt Armstrong and the Company. Mr Armstrong may also receive an annual performance-based bonus of up to 20% of his current base salary, the performance, assessment and timing of which will be negotiated annually with the Managing Director. The Executives and Officer can, at their sole discretion, elect for part of their remuneration to be paid in the form of benefits other than salary. The Company is required to provide such facilities, equipment, assistance and services as the Executives and Officers reasonably require and reimburse them for any expenses incurred by them in the course of their employment, including home telephone expenses, travel, accommodation and entertainment expenses, upon presentation of an itemised account to the Company. Senior Manager Employment Agreements Mr Crockford was appointed to act as Mining Manager of the Mount Monger Operations from 1 January 2011. Mr Crockford will receive an annual base salary of $230,000 per annum plus the statutory superannuation to be reviewed annually or as agreed in writing between Mr Crockford and the Company. Mr Crockford may also receive an annual performance-based bonus of up to 20% of his current base salary, commencing in the 2012 financial year, the performance, assessment and timing of which will be negotiated annually with the Managing Director.
For
per
sona
l use
onl
y

Directors’ Report
15 | P a g e
Remuneration Report – Audited (cont) The Executive Directors’, Officer’s and Senior Manager’s Service Agreements may be terminated by:
a) the Executive, Officer, Senior Manager or the Company providing three months notice or, in the case of notice given by the Executive, Officer or Senior Manager, any shorter period as the Company may agree in writing;
b) the death of the Executive, Officer or Senior Manager;
c) the Company giving a notice of dismissal to the Executive, Officer or Senior Manager as a result of the Executive’s, Officer’s or Senior Manager’s misconduct, willful neglect in the discharge of his duties, serious or persistent breach of the provisions of the Service Agreement, the Executive, Officer or Senior Manager being charged with a criminal offence which in the reasonable opinion of the Chairman of the Board brings Silver Lake into disrepute; and
d) the Company or the Executive, Officer or Senior Manager giving one months notice if by reason of the Executive’s, Officer’s or Senior Manager’s illness or incapacity his absence aggregates 26 weeks in any 52 consecutive weeks or the Executive, Officer or Senior Manager becomes permanently incapable of performing the responsibilities and duties of his office.
If a notice is given under paragraph (a) above, then the Company may opt to pay the Executive, Officer or Senior Manager the equivalent of any amount payable to the Executive, Officer or Senior Manager during the remainder of the notice period and the appointment will terminate on the making of that payment. If the Company makes a decision that could have a significant effect on the Executive’s, Officer’s or Senior Manager’s employment, such as major changes in its work force, then the Company must notify and discuss the changes with the Executive, Officer or Senior Manager as soon as possible. In the event of redundancy, the Executive, Officer or Senior Manager is entitled to a severance payment of a lump sum of three months fixed salary for any service period up to 12 years in length. Under the Service Agreement, the Executive, Officer and Senior Manager are employed as full-time employees of the Company and are entitled to 20 business days annual leave and at least the minimum level of long service leave prescribed by law. Short-term Incentive Payment Each year the remuneration committee sets the key performance indicators (KPIs) for the Executive Directors, who in turn set the KPIs for Senior Management personnel. The KPIs generally include measures relating to the Group, the operating segment, and the individual, and include financial, production, people, and risk measures. The measures are chosen as they directly align the individual’s rewards to the KPIs of the Group and to its strategy and performance. The financial performance objective is ‘profit after tax’ which is compared to budget and previous years performances. The non-financial objectives vary with position and responsibility and include measures such as achieving strategic outcomes, risk measures, growing the resource base and achieving production targets. All performance objectives are weighted when calculating the maximum STI. At the end of the year the remuneration committee will assess the actual performance of the Executive Directors and the Managing Director will assess the performance of other Senior Management personnel. The assessment will include the performance of the Group and the individual against the KPIs set at the beginning of the financial year. A percentage of the incentive amount is awarded depending on the results, with no incentive being awarded where the performance falls below the minimum requirement.
For
per
sona
l use
onl
y

Directors’ Report
16 | P a g e
Remuneration Report – Audited (cont) The performance evaluation in respect of the year ended 30 June 2011 has taken place in accordance with this process. Shareholding Qualifications The Directors are not required to hold any shares in Silver Lake under the Constitution. Consequences of Performance on Shareholder Wealth In considering the Group’s performance and benefits for shareholder wealth, the remuneration committee have regard to the following indices in respect of the current financial year and previous financial years. 2011 2010 2009 2008 IPO
Nov 2007
Profit after tax attributable to shareholders $15,790,000 $11,782,000 $10,650,000 ($3,664,000) N/A
Closing share price at 30 June $2.00 $1.75 $0.69 $0.31 $0.30
Dividend paid - - - - N/A Profit after tax is considered as one of the financial performance targets in setting the short term incentives. Profit amounts for 2008 to 2011 have been calculated in accordance with Australian Accounting Standards (AASBs).
For
per
sona
l use
onl
y

Directors’ Report
17 | P a g e
Remuneration Details of the remuneration of each Director, Officer and Senior Manager of Silver Lake who received the highest remuneration for the year ended 30 June 2011 are set out in the following table: 30 June 2011 Short term Post-
employment Other Long
Term
Total $
Proportion of remuneration performance
related
%
Value of options as
proportion of remuneration
%
Base Emolument
$
(A)
STI Cash
Payment $
Total Benefit
$
Superannuation $
Options $
Paul Chapman Non-Executive Chairman
102,308 - 102,308 9,208 - 111,516 - -
Les Davis Managing Director
380,000 78,750 458,750 52,756 - 511,506 15.4% -
Chris Banasik Executive Director –
306,923 61,250 368,173 42,340 - 410,513 14.9% -
Brian Kennedy Non-Executive Director
56,154 - 56,154 5,054 - 61,208 - -
Peter Johnston Non-Executive Director
56,154 - 56,154 5,054 - 61,208 - -
David Griffiths Non-Executive Director
56,154 - 56,154 5,054 - 61,208 - -
Peter Armstrong Company Secretary
239,231 37,500 276,731 24,906 - 301,637 12.4% -
David Crockford Mining Manager Mount Monger
230,000 - 230,000 20,700 - 250,700 - -
Total 1,426,924 177,500 1,604,424 165,072 - 1,769,496 - -
(A) The above short-term incentive payments were cash payments determined and granted in August
2011 after performance reviews were completed and approved by the remuneration committee. The short-term incentive payment is for performance during the respective financial year using the criteria defined on page 15.
For
per
sona
l use
onl
y

Directors’ Report
18 | P a g e
Remuneration Report – Audited (cont) 30 June 2010 Short term Post-
employment Other Long
Term
Total $
Proportion of remuneration performance
related
%
Value of options as
proportion of remuneration
%
Base
Emolument $
Other Benefit
$
Total Benefit
$ Superannuation
$
Base Emolument
$
Paul Chapman Non-Executive Chairman
59,308 - 59,308 5,338 - 64,646 - -
Les Davis Managing Director
271,885 - 271,885 31,267 - 303,152 - -
Chris Banasik Executive Director –
240,596 - 240,596 27,669 - 268,265 - -
Brian Kennedy Non-Executive Director
40,000 - 40,000 3,600 - 43,600 - -
Peter Johnston Non-Executive Director
40,000 - 40,000 3,600 - 43,600 - -
David Griffiths Non-Executive Director
40,000 - 40,000 3,600 - 43,600 - -
Peter Armstrong Company Secretary
205,942 20,000 225,942 20,335 - 246,277 - -
David Crockford Mining Manager Mount Monger
220,000 - 220,000 19,800 - 239,800 - -
Total 1,117,731 - 1,137,731 115,209 - 1,252,940
- -
Details of performance related remuneration Details of the vesting profile of the short-term incentive payments awarded as remuneration to Executive Directors, Officers and Senior Management personnel are detailed below:
Short-term incentive payments
Included in remuneration
$ (A)
% vested in year
(B) % forfeited in
year Les Davis 78,750 70% 30%
Chris Banasik 61,250 70% 30%
Peter Armstrong 37,500 75% 25%
David Crockford N/A N/A N/A
For
per
sona
l use
onl
y

Directors’ Report
19 | P a g e
Remuneration Report – Audited (cont)
(A) Amounts included in remuneration for the financial year represent the amount that vested in the financial year based on achievement and satisfaction of specified performance criteria. No amounts vest in future financial years in respect of the incentive schemes for the 2011 financial year.
(B) The amounts forfeited are due to the performance or service criteria not being met in relation to
the current financial year. Options granted as compensation No options over ordinary shares in the Company were granted as compensation to any key management person during the reporting period and no options vested during the reporting period. Exercise of options granted as compensation No ordinary shares were issued on the exercise of options previously granted as compensation to key management. A total of 125,000 ordinary shares were issued on the exercise of options previously granted to other employees.
Signed in accordance with a resolution of the Directors.
Les Davis
Managing Director
30 August 2011
For
per
sona
l use
onl
y

Auditor’s Independence Declaration
20 | P a g e
For
per
sona
l use
onl
y

Corporate Governance
21 | P a g e
Statement Silver Lake Resources Limited ("Company") has made it a priority to adopt systems of control and accountability as the basis for the administration of corporate governance. Some of these policies and procedures are summarised in this statement. Commensurate with the spirit of the ASX Corporate Governance Council's Corporate Governance Principles and Recommendations ("Principles & Recommendations"), the Company has followed each recommendation where the Board has considered the recommendation to be an appropriate benchmark for its corporate governance practices. Where the Company's corporate governance practices follow a recommendation, the Board has made appropriate statements reporting on the adoption of the recommendation. Where, after due consideration, the Company's corporate governance practices depart from a recommendation, the Board has offered full disclosure and reason for the adoption of its own practice, in compliance with the "if not, why not" regime.
Disclosure of Corporate Governance Practices
Summary Statement
ASX P & R1 If not, why not2
ASX P & R1 If not, why not2
Recommendation 1.1 Recommendation 4.3
Recommendation 1.2 Recommendation 4.4³ n/a n/a
Recommendation 1.3³ n/a n/a Recommendation 5.1
Recommendation 2.1 Recommendation 5.2³ n/a n/a
Recommendation 2.2 Recommendation 6.1
Recommendation 2.3 Recommendation 6.2³ n/a n/a
Recommendation 2.4 Recommendation 7.1
Recommendation 2.5 Recommendation 7.2
Recommendation 2.6³ n/a n/a Recommendation 7.3
Recommendation 3.1 Recommendation 7.4³ n/a n/a
Recommendation 3.2 Recommendation 8.1
Recommendation 3.3³ n/a n/a Recommendation 8.2
Recommendation 4.1 Recommendation 8.3³ n/a n/a
Recommendation 4.2 1 Indicates where the Company has followed the Principles & Recommendations. 2 Indicates where the Company has provided "if not, why not" disclosure. 3 Indicates an information based recommendation. Information based recommendations are not adopted or reported against
using "if not, why not" disclosure – information required is either provided or it is not. Website Disclosures
Further information about the Company's charters, policies and procedures may be found at the Company's website at www.silverlakeresources.com.au, under the section marked Corporate Governance. A list of the charters, policies and procedures which are referred to in this Corporate Governance Statement, together with the recommendations to which they relate, are set out below.
For
per
sona
l use
onl
y

Corporate Governance
22 | P a g e
Charters Recommendation(s)
Board 1.3
Audit Committee 4.4
Nomination Committee 2.6
Remuneration Committee 8.3
Policies and Procedures
Policy and Procedure for Selection and (Re)Appointment of Directors 2.6
Process for Performance Evaluation 1.2, 2.5
Policy for Trading in Company Securities (summary) 3.2, 3.3
Code of Conduct 3.1, 3.3
Compliance Procedures for ASX Listing Rule Disclosure Requirements (summary) 5.1, 5.2
Procedure for Selection, Appointment and Rotation of External Auditor 4.4
Shareholder Communication Strategy 6.1, 6.2
Risk Management Policy (summary) 7.1, 7.4 Disclosure – Principles & Recommendations
The Company reports below on how it has followed (or otherwise departed from) each of the Principles & Recommendations during the 2010/2011 financial year ("Reporting Period"). Principle 1 – Lay solid foundations for management and oversight Recommendation 1.1: Companies should establish the functions reserved to the Board and those delegated to senior executives and disclose those functions. Disclosure: The Company has established the functions reserved to the Board and has set out these functions in its Board Charter. The Board is collectively responsible for promoting the success of the Company through its key functions of overseeing the management of the Company, providing overall corporate governance of the Company, monitoring the financial performance of the Company, engaging appropriate management commensurate with the Company's structure and objectives, involvement in the development of corporate strategy and performance objectives and reviewing, ratifying and monitoring systems of risk management and internal control, codes of conduct and legal compliance. The Company has established the functions delegated to senior executives and has set out these functions in its Board Charter. Senior executives are responsible for supporting the Managing Director and assisting the Managing Director in implementing the running of the general operations and financial business of the Company, in accordance with the delegated authority of the Board.
Senior executives are responsible for reporting all matters which fall within the Company's materiality thresholds at first instance to the Managing Director or, if the matter concerns the Managing Director, then directly to the Chair or the lead independent Director, as appropriate.
For
per
sona
l use
onl
y

Corporate Governance
23 | P a g e
Recommendation 1.2: Companies should disclose the process for evaluating the performance of senior executives. Disclosure: Each year the remuneration committee sets the key performance indicators (KPIs) for the Executives, who in turn set the KPIs for key management personnel. The KPIs generally include measures relating to the Group, the operating segment, and the individual, and include financial, production, people, and risk measures. The measures are chosen as they directly align the individual’s rewards to the KPIs of the Group and to its strategy and performance. The performance evaluations of Executives Directors are undertaken by the Chair on formal and informal basis, as required. Recommendation 1.3: Companies should provide the information indicated in the Guide to reporting on Principle 1. Disclosure: During the Reporting Period, an evaluation of senior executives took place in accordance with the process disclosed at Recommendation 1.2. Please refer to the section above marked Website Disclosures. Principle 2 – Structure the board to add value Recommendation 2.1: A majority of the Board should be independent Directors. Disclosure: The Board has a majority of Directors who are independent. The independent Directors of the Board are Paul Chapman, David Griffiths, Peter Johnston and Brian Kennedy and the non-independent Directors of the Board are Les Davis and Christopher Banasik. Recommendation 2.2: The Chair should be an independent Director. Disclosure: The independent Chair of the Board is Paul Chapman. Recommendation 2.3: The roles of the Chair and Chief Executive Officer should not be exercised by the same individual. Disclosure: The Managing Director is Les Davis who is not Chair of the Board.
For
per
sona
l use
onl
y

Corporate Governance
24 | P a g e
Recommendation 2.4: The Board should establish a Nomination Committee. Disclosure: The Board has established a Nomination Committee. Recommendation 2.5: Companies should disclose the process for evaluating the performance of the Board, its committees and individual Directors. Disclosure: The Nomination Committee is responsible for evaluation of the Managing Director, the Board and, when deemed appropriate, Board committees and individual Directors. The evaluations of the Managing Director, the Board and, when deemed appropriate, Board committees and individual Directors are conducted informally as required. Recommendation 2.6: Companies should provide the information indicated in the Guide to reporting on Principle 2. Disclosure: Skills, Experience, Expertise and term of office of each Director
A profile of each Director containing their skills, experience, expertise and term of office is set out in the Directors' Report.
Identification of Independent Directors The independent Directors of the Company are Paul Chapman, David Griffiths, Peter Johnston and Brian Kennedy. These Directors are independent as they are Non-Executive Directors who are not members of management and who are free of any business or other relationship that could materially interfere with, or could reasonably be perceived to materially interfere with, the independent exercise of their judgment. These Directors are also not substantial shareholders of the Company. Independence is measured having regard to the relationships listed in Box 2.1 of the Principles & Recommendations and the Company's materiality thresholds. The materiality thresholds are set out below.
Company's Materiality Thresholds The Board has agreed on the following guidelines for assessing the materiality of matters, as set out in the Company's Board Charter: • Balance sheet items are material if they have a value of more than 5% of pro-forma net asset. • Profit and loss items are material if they will have an impact on the current year operating result of
5% or more.
For
per
sona
l use
onl
y

Corporate Governance
25 | P a g e
• Items are also material if they impact on the reputation of the Company, involve a breach of legislation, are outside the ordinary course of business, they could affect the Company’s rights to its assets, if accumulated they would trigger the quantitative tests, involve a contingent liability that would have a probable effect of 5% or more on balance sheet or profit and loss items, or they will have an effect on operations which is likely to result in an increase or decrease in net income or dividend distribution of more than 5%.
• Contracts will be considered material if they are outside the ordinary course of business, contain exceptionally onerous provisions in the opinion of the Board, impact on income or distribution in excess of the quantitative tests, there is a likelihood that either party will default, and the default may trigger any of the quantitative or qualitative tests, are essential to the activities of the Company and cannot be replaced, or cannot be replaced without an increase in cost of such a quantum, triggering any of the quantitative tests, contain or trigger change of control provisions, they are between or for the benefit of related parties, or otherwise trigger the quantitative tests.
Statement concerning availability of Independent Professional Advice To assist Directors with independent judgement, it is the Board's policy that if a Director considers it necessary to obtain independent professional advice to properly discharge the responsibility of their office as a Director then, provided the Director first obtains written approval for incurring such expense from the Chair, the Company will pay the reasonable expenses associated with obtaining such advice.
Nomination Matters The Nomination Committee held one meeting during the Reporting Period, which all the members of the Nomination Committee (Peter Johnston, who is the Chair of the Nomination Committee, Brian Kennedy and David Griffiths) attended.
Performance Evaluation During the Reporting Period a performance evaluation of the Board, individual Directors and any applicable committees occurred in accordance with the process disclosed at Recommendation 2.5. Selection and (Re)Appointment of Directors Directors are selected by reference to their background and experience which is relevant to the business needs of the Company. New Directors are invited to join the Board by the Chair, who makes the invitation based on recommendations made by the Nomination Committee and approved by the Board. The Board's Policy and Procedure for Selection and (Re)Appointment of Directors is available on the Company's website. Please refer to the section above marked Website Disclosure. The Board recognises that Board renewal is critical to performance and the impact of Board tenure on succession planning. Each Director other than the Managing Director, must not hold office (without re-election) past the third annual general meeting of the Company following the Director's appointment or three years following that Director's last election or appointment (whichever is the longer). However, a Director appointed to fill a casual vacancy or as an addition to the Board must not hold office (without re-election) past the next annual general meeting of the Company. At each annual general meeting a minimum of one Director or a third of the total number of Directors must resign. A Director who retires at an annual general meeting is eligible for re-election at that meeting. Re-appointment of Directors is not automatic.
For
per
sona
l use
onl
y

Corporate Governance
26 | P a g e
Principle 3 – Promote ethical and responsible decision-making Recommendation 3.1: Companies should establish a Code of Conduct and disclose the code or a summary of the code as to the practices necessary to maintain confidence in the company's integrity, the practices necessary to take into account their legal obligations and the reasonable expectations of their stakeholders and the responsibility and accountability of individuals for reporting and investigating reports of unethical practices. Disclosure: The Company has established a Code of Conduct as to the practices necessary to maintain confidence in the Company's integrity, practices necessary to take into account their legal obligations and the expectations of their stakeholders and the responsibility and accountability of individuals for reporting and investigating reports of unethical practices. Recommendation 3.2: Companies should establish a policy concerning trading in company securities by Directors, senior executives and employees, and disclose the policy or a summary of that policy. Disclosure: The Company has established a policy concerning trading in the Company's securities by Directors, senior executives and employees. Recommendation 3.3: Companies should provide the information indicated in the Guide to reporting on Principle 3. Disclosure: Please refer to the section above marked Website Disclosures. Principle 4 – Safeguard integrity in financial reporting Recommendation 4.1: The Board should establish an Audit Committee. Disclosure: The Company has established an Audit Committee. Recommendation 4.2: The Audit Committee should be structured so that it: • consists only of Non-Executive Directors; • consists of a majority of independent Directors; • is chaired by an independent Chair, who is not Chair of the Board; and • has at least three members.
For
per
sona
l use
onl
y

Corporate Governance
27 | P a g e
Disclosure: The Audit Committee comprises three independent Non-Executive Directors: David Griffiths; Peter Johnston; and Paul Chapman. David Griffiths chairs the Audit Committee and is not chair of the Board.
Recommendation 4.3: The Audit Committee should have a formal charter. Disclosure: The Company has adopted an Audit Committee Charter. Recommendation 4.4: Companies should provide the information indicated in the Guide to reporting on Principle 4. Disclosure: The Audit Committee held two meetings during the Reporting Period, which all the members of the Audit Committee (David Griffiths, Peter Johnston, and Paul Chapman) attended.
Details of each of the Director's qualifications are set out in the Directors' Report.
All of the Directors consider themselves to be financially literate and have relevant industry experience. Paul Chapman has a Bachelor of Commerce, a Graduate Diploma in Taxation and is a chartered accountant with over 20 years experience in the resources sector gained in Australia and the United States.
The Company has established procedures for the selection, appointment and rotation of its external auditor (which is available on the Company's website). The Board is responsible for the initial appointment of the external auditor and the appointment of a new external auditor when any vacancy arises, as recommended by the Audit Committee (or its equivalent). Candidates for the position of external auditor must demonstrate complete independence from the Company through the engagement period. The Board may otherwise select an external auditor based on criteria relevant to the Company's business and circumstances. The performance of the external auditor is reviewed on an annual basis by the Audit Committee (or its equivalent) and any recommendations are made to the Board. Principle 5 – Make timely and balanced disclosure Recommendation 5.1: Companies should establish written policies designed to ensure compliance with ASX Listing Rule disclosure requirements and to ensure accountability at a senior executive level for that compliance and disclose those policies or a summary of those policies. Disclosure: The Company has established written policies designed to ensure compliance with ASX Listing Rule disclosure requirements and accountability at a senior executive level for that compliance. Recommendation 5.2: Companies should provide the information indicated in the Guide to reporting on Principle 5.
For
per
sona
l use
onl
y

Corporate Governance
28 | P a g e
Disclosure: Please refer to the section above marked Website Disclosures. Principle 6 – Respect the rights of shareholders Recommendation 6.1: Companies should design a communications policy for promoting effective communication with shareholders and encouraging their participation at general meetings and disclose their policy or a summary of that policy. Disclosure: The Company has designed a communications strategy for promoting effective communication with shareholders and encouraging shareholder participation at general meetings. Recommendation 6.2: Companies should provide the information indicated in the Guide to reporting on Principle 6. Disclosure: Please refer to the section above marked Website Disclosures. Principle 7 – Recognise and manage risk Recommendation 7.1: Companies should establish policies for the oversight and management of material business risks and disclose a summary of those policies. Disclosure: The Board has adopted a Risk Management Policy, which sets out the Company's risk profile. Under the policy, the Board is responsible for approving the Company's policies on risk oversight and management and satisfying itself that management has developed and implemented a sound system of risk management and internal control.
Under the policy, the Board delegates day-to-day management of risk to the Managing Director, who is responsible for identifying, assessing, monitoring and managing risks. The Managing Director is also responsible for updating the Company's material business risks to reflect any material changes, with the approval of the Board.
In fulfilling the duties of risk management, the Managing Director may have unrestricted access to Company employees, contractors and records and may obtain independent expert advice on any matter they believe appropriate, with the prior approval of the Board.
The Board has established a separate Audit Committee to monitor and review the integrity of financial reporting and the Company's internal financial control systems and risk management systems. In addition, the following risk management measures have been adopted by the Board to manage the Company's material business risks:
For
per
sona
l use
onl
y

Corporate Governance
29 | P a g e
• the Board has established authority limits for management which, if exceeded, will require prior Board approval;
• the Board has adopted a compliance procedure for the purpose of ensuring compliance with the Company's continuous disclosure obligations; and
• the Board has adopted a corporate governance manual which contains other policies to assist the Company to establish and maintain its governance practices.
The Company has established a formal system to manage its material business risks. The Company holds risk review meetings at least annually at Board level and also at the operational and exploration levels. At these meetings the Company's material business risks are identified and risk management strategies established. In addition, the process of management of material business risks is allocated to members of senior management. The Managing Director is responsible for reporting to the Board as to the outcome of the meetings held at the operational and exploration levels. The categories of risk identified by the Company and reported on include financial, operational, human capital, political, technological, economic cycle, legal and compliance. Recommendation 7.2: The Board should require management to design and implement the risk management and internal control system to manage the Company's material business risks and report to it on whether those risks are being managed effectively. The Board should disclose that management has reported to it as to the effectiveness of the management of its material business risks. Disclosure: The Board has required management to design, implement and maintain risk management and internal control systems to manage the Company's material business risks. The Board also requires management to report to it confirming that those risks are being managed effectively. Further, the Board has received a report from the Managing Director as to the effectiveness of the Company's management of its material business risks.
Recommendation 7.3: The Board should disclose whether it has received assurance from the Chief Executive Officer (or equivalent) and the Chief Financial Officer (or equivalent) that the declaration provided in accordance with section 295A of the Corporations Act is founded on a sound system of risk management and internal control and that the system is operating effectively in all material respects in relation to financial reporting risks. Disclosure: The Managing Director and the Chief Financial Officer have provided a declaration to the Board in accordance with section 295A of the Corporations Act and have assured the Board that such declaration is founded on a sound system of risk management and internal control and that the system is operating effectively in all material respects in relation to financial risk.
Recommendation 7.4: Companies should provide the information indicated in the Guide to reporting on Principle 7.
For
per
sona
l use
onl
y
Corporate Governance
30 | P a g e
Disclosure: The Board has received the report from the Managing Director under Recommendation 7.2. The Board has received the assurance from the Managing Director and the Chief Financial Officer under Recommendation 7.3. Principle 8 – Remunerate fairly and responsibly Recommendation 8.1: The Board should establish a Remuneration Committee. Disclosure: The Company has established a Remuneration Committee. Recommendation 8.2: Companies should clearly distinguish the structure of Non-Executive Directors’ remuneration from that of Executive Directors and senior executives. Disclosure: Non-Executive Directors are remunerated at a fixed fee for time, commitment and responsibilities. Remuneration for Non-Executive Directors is not linked to individual performance. Pay and rewards for Executive Directors and senior executives consists of a base salary and performance incentives. Long term performance incentives may include options granted at the discretion of the Board and subject to obtaining the relevant approvals. Executives are offered a competitive level of base pay at market rates and are reviewed annually to ensure market competitiveness. Recommendation 8.3: Companies should provide the information indicated in the Guide to reporting on Principle 8. Disclosure: Details of remuneration, including the Company’s policy on remuneration, are contained in the “Remuneration Report” which forms part of the Directors’ Report.
The Remuneration Committee held one meeting during the Reporting Period, which all the members of the Remuneration Committee (Brian Kennedy who is the Chair of the Remuneration Committee, Peter Johnston, and David Griffiths) attended.
There are no termination or retirement benefits for Non-Executive Directors (other than for superannuation).
The Company's Policy on Trading in Company Securities includes a statement of the Company's policy on prohibiting transactions in associated products which limit the risk of participating in unvested entitlements under any equity based remuneration schemes.
For
per
sona
l use
onl
y

Directors’ Declaration
31 | P a g e
1. In the opinion of the Directors: a) The financial statements and notes of the Company are in accordance with the Corporations Act
2001 including: i) Giving a true and fair view of the Group’s financial position as at 30 June 2011 and of its
performance for the year then ended; and ii) Complying with Australian Accounting Standards (including Australian Accounting
Interpretations) and Corporations Regulations 2001
b) The financial report also complies with International Financial Reporting Standards as disclosed in Note 2;
c) The remuneration disclosures that are contained in the remuneration report in the Directors report comply with Australian Accounting Standards AASB 124 related party disclosures, the Corporations Act 2001and the Corporations Regulations 2001;
d) There are reasonable grounds to believe that the Company will be able to pay its debts as and when they become due and payable.
2. This declaration has been made after receiving the declarations required to be made to the Directors in accordance with s295A of the Corporations Act 2001 for the financial year ended 30 June 2011
The declaration is signed in accordance with a resolution of the Board of Directors.
Les Davis Managing Director 30 August 2011
For
per
sona
l use
onl
y

Independent Audit Report
32 | P a g e
For
per
sona
l use
onl
y

Independent Audit Report
33 | P a g e
For
per
sona
l use
onl
y

Statement of Comprehensive Income
34 | P a g e
For the year ended 30 June 2011 GROUP
Notes
30 June 2011 $,000
30 June 2010 $,000
Revenue 7 89,982 69,073 Cost of sales (64,918) (50,769) Gross Profit 25,064 18,304 Other income - 10 Administrative expenses 8 (3,082) (2,235) Results from operating activities 21,982 16,079 - finance income 958 803 - finance expenses (166) (200) Net Finance Income 11 792 603 Profit Before Income Tax 22,774 16,682 Income tax expense 12 (6,984) (4,900) Profit For the Period 15,790 11,782 Other Comprehensive Income - - Total Comprehensive Income for the period 15,790 11,782 Total Comprehensive Income Attributable to: Owners of the Company
15,790
11,782
Cents Per
Share Cents Per
Share Earnings Per Share Basic earnings per share (cents per share) 13 8.83c 6.88c Diluted earnings per share (cents per share) 13 7.91c 6.22c The above statement of comprehensive income should be read in conjunction with the accompanying notes.
For
per
sona
l use
onl
y

Statement of Financial Position
35 | P a g e
As at 30 June 2011 GROUP
Notes
30 June 2011 $,000
30 June 2010 $,000
ASSETS Current Assets Cash and cash equivalents 14 16,085 29,503 Trade and other receivables 16 1,342 1,904 Inventories 17 14,798 7,802 Assets held for sale 31 1,250 - Prepayments 122 22 Total Current Assets 33,597 39,231 Non-Current Assets Trade and other receivables 16 2,364 2,376 Property, plant and equipment 19 16,165 13,499 Exploration evaluation and mining assets 18 75,857 42,092 Total Non-Current Assets 94,386 57,967 TOTAL ASSETS 127,983 97,198 LIABILITIES Current Liabilities Trade and other payables 20 17,213 11,441 Interest bearing liabilities 21 352 345 Employee benefits 22 573 339 Total Current Liabilities 18,138 12,125 Non-Current Liabilities Rehabilitation and restoration provision 24 4,584 2,340 Interest bearing liabilities 21 54 338 Deferred tax liability 12 13,834 6,850 Total Non-Current Liabilities 18,472 9,528 TOTAL LIABILITIES 36,610 21,653 NET ASSETS 91,373 75,545 EQUITY Share capital 26 56,261 56,224 Reserves 27 150 182 Retained profits 34,962 19,139 TOTAL EQUITY 91,373 75,545 The above statement of financial position should be read in conjunction with the accompanying notes.
For
per
sona
l use
onl
y

Statement of Changes in Equity
36 | P a g e
GROUP
Notes
Share Capital $,000
Option Reserve $,000
Retained Earnings
$,000
Total Equity $,000
Balance at 1 July 2009 38,033 629 6,908 45,570 Total comprehensive income for the period Profit - - 11,782 11,782 Other Comprehensive income - - - - Transactions with owners, recorded directly in equity
Issue of ordinary shares net of transaction costs 26 17,507 - - 17,507 Issue of employee options - 2 2 Exercise of employee options 26 684 (449) 449 684 Balance at 30 June 2010 56,224 182 19,139 75,545 Total comprehensive income for the period Profit - - 15,790 15,790 Other Comprehensive income - - - - Transactions with owners, recorded directly in equity
Issue of ordinary shares net of transaction costs 26 - - - - Issue of employee options - - - Exercise of employee options 26 37 (32) 33 38 Balance at 30 June 2011 56,261 150 34,962 91,373 The above statement of changes in equity should be read in conjunction with the accompanying notes.
For
per
sona
l use
onl
y

Statement of Cash Flows
37 | P a g e
For the year ended 30 June 2011 GROUP
Notes
30 June 2011 $,000
30 June 2010 $,000
Cash Flows From Operating Activities Cash receipts from customers 91,178 67,877 Cash paid to suppliers and employees (57,832) (48,050) Net Cash From Operating Activities 15 33,346 19,827 Cash Flow From Investing Activities Interest received 958 804 Acquisition of plant and equipment (7,752) (7,701) Proceeds from sale of plant and equipment 357 403 Exploration, evaluation and mining assets (40,058) (17,795) Deposit for environmental bonds 12 (400) Net Cash Used In Investing Activities (46,483) (24,689) Cash Flows From Financing Activities Proceeds from borrowing 82 815 Repayment of borrowing (359) (840) Interest paid (42) (42) Proceeds from the issue of share capital 38 19,018 Payments of transaction costs - (1,150) Net Cash (Used In)/ From Financing Activities (281) 17,801 Net increase in cash and cash equivalents (13,418) 12,939 Cash and cash equivalents at 1 July 29,503 16,564 Cash and Cash Equivalents at 30 June 14 16,085 29,503 The above statement of cash flows should be read in conjunction with the accompanying notes.
For
per
sona
l use
onl
y

Notes to the Financial Statements For the year ended 30 June 2011
38 | P a g e
1. Reporting Entity
Silver Lake Resources Limited (“Silver Lake” or “the Company”) is a company domiciled in Australia. The address of the Company’s registered office is 31 Malcolm St, West Perth WA 6005. The Consolidated Financial statements of the Company as at and for the year ended 30 June 2011 comprise the Company and its subsidiaries (together referred to as “the Group” and individually as “Group Entities”). The Group primarily is involved in the production of gold and minerals exploration.
2. Statement of Compliance
The financial statements are general purpose financial statements which have been prepared in accordance with Australian Accounting Standards (“AASBs”) (including Australian Accounting interpretations) adopted by the Australian Accounting Standards Board (“AASB”) and the Corporations Act 2001. The consolidated financial statements of the Group comply with International Financial Reporting Standards (“IFRSs”) and interpretations adopted by the International Accounting Standards Board (“IASB”). The financial statements were approved by the Board of Directors on 30 August 2011.
3. Basis of Preparation
(a) Functional and presentation currency
The financial statements are prepared in Australian dollars, which is the functional currency of the Company and its subsidiaries. The Company is of a kind referred to in ASIC Class Order 98/100 dated 10 July 1998 and in accordance with the Class Order, amounts in the financial report have been rounded off to the nearest thousand dollars, unless otherwise stated. (b) Basis of measurement
The financial statements are presented on the historical cost basis. (c) Use of estimates and judgements
The preparation of financial statements requires management to make judgements, estimates and assumptions that affect the application of accounting policies and reported amounts of assets and liabilities, income and expenses. These estimates and associated assumptions are based on historical experience and various factors that are believed to be reasonable under the circumstances. The results of which forms the basis of making the judgements about carrying values of assets and liabilities that are not readily apparent from other sources. Actual results may differ from these estimates. The estimates and underlying assumptions are reviewed on an ongoing basis. Revisions to accounting estimates are recognised in the period in which the estimate is revised if the revision affects only that period or in the period of the revision and future periods if the revision affects both current and future periods. In particular information about significant areas of estimation, uncertainty and critical judgements in applying accounting policies that have the most significant effect on the amounts recognised in the financial statements are described in the following notes:
o Note 12 (c) – Utilisation of tax losses. o Note 4 (e)(i) – Exploration and evaluation expenditure carry forward o Note 4 (e)(ii) – Amortisation of development expenditure o Note 4 (e)(iii) – Reserves and resources o Note 4(n) – Closure and rehabilitation o Note 4 (s) – Impairment of assets
For
per
sona
l use
onl
y

Notes to the Financial Statements For the year ended 30 June 2011
39 | P a g e
4. Significant Accounting Policies
The accounting policies applied by the Group in these financial statements are the same as those applied by the Group in its financial statements as at and for the year ended 30 June 2010.
(a) Production Stripping Costs
As a result of commencement of production at Christmas Flat, the Group has adopted a policy of deferring stripping costs incurred during the production stage of its operations. This is the case where there are fluctuations in stripping costs over the life of the mine and the effect is material. The amount of stripping costs deferred is based on the ratio obtained by dividing the amount of waste tonnes mined by the quantity of ore tonnes mined. Stripping costs incurred in a period are deferred to the extent that the period’s waste to ore ratio exceeds the life of mine waste to ore ratio, by capitalising these costs to mine properties. Deferred stripping costs are then charged against reported profits to the extent that, in subsequent periods, the period’s ratio falls below the life of mine waste to ore ratio. The life of mine waste to ore ratio is based on economically recoverable resources of the operation. Changes to the estimated life of mine ratio are accounted for prospectively, from the date of the change.
(b) Basis for consolidation
Subsidiaries are entities controlled by the Company. Control exists when the Company has the power to govern the financial and operating policies of an entity so as to obtain future economic benefits from its activities. In assessing control, potential voting rights that currently are exercisable are taken into account. The financial statements of subsidiaries are included in the consolidated financial statements from the date that control commences until the date that control ceases. (c) Non-Derivative Financial Instruments
Non-derivative financial instruments comprise investments in trade and other receivables, cash and cash equivalents, loans and borrowings and trade and other payables. Non-derivative financial instruments are recognised initially at fair value plus, for instruments not at fair value through profit and loss, any directly attributable transaction costs. Subsequent to initial recognition non-derivative financial instruments are measured at amortised costs. A financial instrument is recognised if the Group becomes a party to the contractual provisions of the instrument. Financial assets are derecognised if the Group’s contractual rights to the cash flows from the financial assets expire or if the Group transfers the financial asset to another party without retaining control or substantially all risks and rewards of the asset. Financial liabilities are derecognised if the Group’s obligations specified in the contract expire or are discharged or cancelled. Cash and cash equivalents comprise cash balances and call deposits. Bank overdrafts that are repayable on demand and form an integral part of the Group’s cash management are included as a component of cash and cash equivalents for the purpose of the statement of cash flows. (d) Income Tax
Income tax expense comprises current and deferred tax. Income tax expense is recognised in profit or loss except to the extent that it relates to items recognised directly in equity, in which case it is recognised in equity.
Current tax is the expected tax payable on the taxable income for the year, using tax rates enacted or substantively enacted at the reporting date, and any adjustment to tax payable in respect of previous years.
For
per
sona
l use
onl
y

Notes to the Financial Statements For the year ended 30 June 2011
40 | P a g e
Deferred tax is recognised using the balance sheet method, providing for temporary differences between the carrying amounts of assets and liabilities for financial reporting purposes and the amounts used for taxation purposes. Deferred tax is not recognised for the following temporary differences: the initial recognition of goodwill, the initial recognition of assets or liabilities in a transaction that is not a business combination and that affects neither accounting nor taxable profit, and differences relating to investments in subsidiaries and jointly controlled entities to the extent that they probably will not reverse in the foreseeable future. Deferred tax is measured at the tax rates that are expected to be applied to the temporary differences when they reverse, based on the laws that have been enacted or substantively enacted by the reporting date. A deferred tax asset is recognised for unused tax losses, tax credits and deductible temporary differences to the extent that it is probable that future taxable profits will be available against which they can be utilised. Deferred tax assets are reviewed at each reporting date and reduced to the extent that is no longer probable that the related tax benefit will be realised.
(i) Tax Consolidation
The Company and its wholly-owned Australian resident entities are part of a tax-consolidated group. As a consequence, all members of the tax-consolidated group are taxed as a single entity from 11 November 2007. The head entity within the tax-consolidation group is Silver Lake Resources Limited. Current tax expense/income, deferred tax liabilities and deferred tax assets arising from temporary differences of the members of the tax-consolidated group are recognised in the separate financial statements of the members of the tax-consolidated group using the ‘separate taxpayer within the group’ approach by reference to the carrying amounts of assets and liabilities in the separate financial statements of each entity and the tax values applying under tax consolidation. Any current tax liabilities (or assets) and deferred tax assets arising from unused tax losses of the subsidiaries are assumed by the head entity in the tax-consolidated group and are recognised by the Company as amounts payable (receivable) to/(from) other entities in the tax-consolidated group. Any differences between these amounts are recognised by the Company as an equity contribution or distribution. The Company recognises deferred tax assets arising from unused tax losses of the tax-consolidated group to the extent that it is probable that the future taxable profits of the tax-consolidated group will be available against which the asset can be utilised. Any subsequent period adjustments to deferred tax assets arising from unused tax losses as a result of revised assessments of the probability of recoverability is recognised by the head entity only.
(e) Exploration and Evaluation and Mining Assets
(i) Exploration and Evaluation Expenditure
Exploration for and evaluation of mineral resources is the search for mineral resources after the entity has obtained legal rights to explore in a specific area, as well as the determination of the technical feasibility and commercial viability of extracting the mineral resource. Accordingly, exploration and evaluation expenditures are those expenditures incurred by the Group in connection with the exploration for and evaluation of minerals resources before the technical feasibility and commercial viability of extracting a mineral resource are demonstrable.
For
per
sona
l use
onl
y

Notes to the Financial Statements For the year ended 30 June 2011
41 | P a g e
Accounting for exploration and evaluation expenditures is assessed separately for each ‘area of interest’. An ‘area of interest’ is an individual geological area which is considered to constitute a favourable environment for the presence of a mineral deposit or has been proved to contain such a deposit. Expenditure incurred on activities that precede exploration and evaluation of mineral resources, including all expenditure incurred prior to securing legal rights to explore an area, is expensed as incurred. Exploration and evaluation expenditure incurred is accumulated in respect of each identifiable area of interest. These costs are carried forward only if they relate to an area of interest for which rights of tenure are current and in respect of which:
• such costs are expected to be recouped through successful development and exploitation or from sale of the area; and
• exploration and evaluation activities in the area have not, at balance date, reached a stage which permits a reasonable assessment of the existence or otherwise of economically recoverable resources, and active and significant operations in, or relating to, this area are continuing.
Accumulated costs in respect of areas of interest which are abandoned are written off in full against profit in the year in which the decision to abandon the area is made. A regular review is undertaken of each area of interest to determine the appropriateness of continuing to carry forward costs in relation to that area of interest. Exploration and evaluation assets include:
• Acquisition of rights to explore; • Topographical, geological, geochemical and geophysical studies; • Exploration drilling, trenching and sampling; and • Activities in relation to evaluating the technical feasibility and commercial viability of
extracting the mineral resource. General and administrative costs are allocated to, and included in, the cost of exploration and evaluation assets only to the extent that those costs can be related directly to the operational activities in the area of interest to which the exploration and evaluation assets relate. In all other instances, these costs are expensed as incurred. Exploration and evaluation assets are classified as intangible. As the assets are not yet ready for use, they are not depreciated. Assets that are classified as tangible assets include:
• Piping and pumps; • Tanks; and • Exploration vehicles and drilling equipment.
Assets that are classified as intangible assets include:
• Drilling rights; • Acquired rights to explore; • Exploration drilling costs; and • Trenching and sampling costs
Exploration and evaluation assets are transferred to Development Assets once technical feasibility and commercial viability of an area of interest is demonstrable. Exploration and evaluation assets are tested for impairment, and any impairment loss is recognised, prior to being reclassified.
For
per
sona
l use
onl
y

Notes to the Financial Statements For the year ended 30 June 2011
42 | P a g e
Impairment testing of exploration and evaluation assets Exploration and evaluation assets are assessed for impairment if sufficient data exists to determine technical feasibility and commercial viability or facts and circumstances suggest that the carrying amount exceeds the recoverable amount. Exploration and evaluation assets are tested for impairment when any of the following facts and circumstances exist:
• The term of exploration license in the specific area of interest has expired during the reporting period or will expire in the near future, and is not expected to be renewed;
• Substantive expenditure on further exploration for and evaluation of mineral resources in the specific area are not budgeted or planned;
• Exploration for and evaluation of mineral resources in the specific area have not led to the discovery of commercially viable quantities of mineral resource and the decision was made to discontinue such activities in the specific area; or
• Sufficient data exists to indicate that, although a development in the specific area of interest is likely to proceed, the carrying amount of the exploration and evaluation asset is unlikely to be recovered in full from successful development or by sale.
When a potential impairment is indicated, an assessment is performed for each CGU which is no larger than the area of interest. The Group performs impairment testing in accordance with accounting policy 3(r)(ii).
(ii) Mine Properties and Mining Assets
Mine properties represents the acquisition cost and/or accumulated exploration, evaluation and development expenditure in respect of areas of interest in which mining has commenced. Mine development costs are deferred until commercial production commences. When commercial production is achieved mine development is transferred to mine properties, at which time it is amortised on a unit of production basis based on ounces mined over the total estimated resources related to this area of interest. Significant factors considered in determining the technical feasibility and commercial viability of the project are the completion of a feasibility study, the existence of sufficient resources to proceed with development and approval by the board of Directors to proceed with development of the project. Development expenditure is capitalised as either a tangible or intangible asset depending on the nature of the costs incurred. Development expenditure includes the following:
• Reclassified exploration and evaluation assets; • Direct costs of construction; • Pre-production stripping costs; and • An appropriate allocation of overheads and borrowing costs incurred during the
construction phase. Open pit waste removal costs incurred in the development of a mine before production commences are capitalised as part of the mine development costs, which are subsequently amortised over the life of the open pit resource, once transferred to mine properties.
For
per
sona
l use
onl
y

Notes to the Financial Statements For the year ended 30 June 2011
43 | P a g e
Underground development expenditure incurred in respect of a mine development after the commencement of production is carried forward as part of mine development only when substantial future economic benefits are expected. Otherwise, this expenditure is classified as part of production and expensed as incurred. The Group applies the units of production method for amortisation of its mine properties, which results in an amortisation charge proportional to the depletion of the anticipated remaining life of mine production. These calculations require the use of estimates and assumptions in relation to reserves and resources, metallurgy and the complexity of future capital development requirements. These estimates and assumptions are reviewed annually, changes to these estimates and assumptions may impact the amortisation charge in the income statement and asset carrying values which would be adjusted if appropriate on a prospective basis. The Group uses ounces mined over JORC compliant resources as its basis for depletion of mine properties. In the absence of reserves the Group believes resources in the best measure as evidenced by historical conversion of resources to reserves. The Group applies a discount of 20% to ounces within the inferred resource category and 10% to ounces in the indicated resource category when adopting the units of production method to reflect the risk of conversion from the inferred and indicated categories to reserves. (iii) Reserves and Resources
Resources are estimates of the amount of gold product that can be economically extracted from the Group’s mine properties. In order to calculate resources, estimates and assumptions are required about a range of geological, technical and economic factors, including quantities, grades, production techniques, recovery rates, production costs, future capital requirements short and long term commodity prices and exchange rates. Estimating the quantity and/or grade of resources requires the size, shape and depth of ore bodies to be determined by analysing geological data. This process may require complex and difficult geological judgments and calculations to interpret the data. The Group determines and reports ore resources under the Australian Code of Reporting for Mineral Resource and Ore Reserves December 2004, known as the JORC Code. The JORC Code requires the use of reasonable assumptions to calculate resources. Due to the fact that economic assumptions used to estimate resources change from period to period, and geological data is generated during the course of operations, estimates of resources may change from period to period. Changes in reported resources may affect the Group’s financial results and financial position in a number of ways, including:
• Asset carrying values may be impacted due to changes in estimates of future cash flows; • Amortisation charged in the income statement may change where such charges are
calculated using the units of production basis; • Decommissioning, site restoration and environmental provisions may change due to
changes in estimated resources after expectations about the timing or costs of these activities change; and
• Recognition of deferred tax assets, including tax losses.
(f) Segment Reporting
An operating segment is a component of the Group that engages in business activities from which it may earn revenues and incur expenses, including revenues and expenses that relate to transactions with any of the Group’s other components. All operating segments’ operating results are reviewed regularly by the Group’s Managing Director to make decisions about resources to be allocated to the segment and to assess its performance, and for which discrete financial information is available.
For
per
sona
l use
onl
y

Notes to the Financial Statements For the year ended 30 June 2011
44 | P a g e
Segment results that are reported to the Managing Director include items directly attributable to a segment as well as those that can be allocated on a reasonable basis. Unallocated items comprise mainly corporate assets, corporate expenses, and income tax assets and liabilities. Segment capital expenditure is the total cost incurred during the year to acquire property, plant and equipment, and intangible assets other than goodwill, but including exploration evaluation and mining assets.
(g) Plant and Equipment
Items of plant and equipment are stated at their cost less accumulated depreciation and impairment losses. Cost includes expenditures that are directly attributable to the acquisition of the asset. The cost of self-constructed assets includes the cost of materials and direct labour, any other costs directly attributable to bringing the asset to a working condition for its intended use, and the costs of dismantling and removing the items and restoring the site on which they are located. When parts of an item of property, plant and equipment have different useful lives, they are accounted for as separate items (major components) of property, plant and equipment.
The cost of replacing part of an item of property, plant and equipment is recognised in the carrying amount of the item if it is probable that the future economic benefits embodied within the part will flow to the Group and its cost can be measured reliably. The costs of the day-to-day servicing of property, plant and equipment are recognised in profit or loss as incurred. Depreciation is recognised in profit or loss on a straight-line basis over the estimated useful lives of each part of an item of property, plant and equipment. Leased assets are depreciated over the shorter of the lease term and their useful lives. Land is not depreciated. The estimated useful lives for the current and comparative period is as follows:
Period Buildings 10 Years Plant and equipment 3-5 Years Office furniture and equipment 3-15 Years Motor vehicles 3-5 Years Depreciation methods, useful lives and residual values are reassessed at each reporting date. Capital work in progress is not depreciated until it is ready for use. (h) Employee Benefits
(i) Defined Contribution Superannuation Funds
Obligations for contributions to defined contribution superannuation funds are recognised as an expense in profit or loss when they are incurred. (ii) Other Long-Term Employee Benefits
The Group’s net obligation in respect of long-term employee benefits is the amount of future benefit that employees have earned in return for their service in the current and prior periods plus related on costs; that benefit is discounted to determine its present value, and the fair value of
For
per
sona
l use
onl
y

Notes to the Financial Statements For the year ended 30 June 2011
45 | P a g e
any related assets is deducted. The discount rate is the yield at the reporting date on AA credit-rated or government bonds that have maturity dates approximating the terms of the Group’s obligations. The calculation is performed using the projected unit credit method. (iii) Short-Term Benefits
Liabilities for employee benefits for wages, salaries, annual leave and sick leave represent present obligations resulting from employees’ services provided to reporting date and are calculated at undiscounted amounts based on remuneration wage and salary rates that the Group expects to pay as at reporting date including related on-costs, such as workers compensation insurance and payroll tax. Non-accumulating non-monetary benefits, such as medical care, housing, cars and free or subsidised goods and services, are expensed based on the net marginal cost to the Group as the benefits are taken by the employees. (iv) Share-Based Payment Transactions
The grant date fair value of options granted to employees is recognised as an employee expense, with a corresponding increase in equity, over the period that the employees become unconditionally entitled to the options. The amount recognised as an expense is adjusted to reflect the actual number of share options that vest, except for those that fail to vest due to market conditions not being met.
(i) Revenue
Revenue from the sale of goods is measured at the fair value of the consideration received or receivable. Revenue is recognised when the significant risk and rewards of ownership have been transferred to the buyer, recovery of the consideration is probable, the associated costs and possible return of goods can be estimated reliably, there is no continuing management involvement with the goods, and the amount of revenue can be measured reliably. (j) Lease Payments
Payments made under operating leases are recognised in profit and loss on a straight-line basis over the term of the lease. Lease incentives received are recognised as an integral part of the total lease expense, over the term of the lease. Minimum lease payments made under finance leases are apportioned between the finance expense and the reduction of the outstanding liability. The finance expense is allocated to each period during the lease term so as to produce a constant periodic rate of interest on the remaining balance of the liability. Contingent lease payments are accounted for by revising the minimum lease payments over the remaining term of the lease when the contingency no longer exists and the lease adjustment is known. (k) Finance Income and Expenses
Interest income comprises interest income on funds invested and is recognised as it accrues, using the effective interest method. Finance expenses comprise interest expense on borrowings and unwinding of the discount on provisions. All borrowing costs are recognised in profit and loss using the effective interest method. (l) Goods and Services Tax (“GST”)
Revenues, expenses and assets are recognised net of the amount of GST, except where the amount of GST incurred is not recoverable from the Australian Tax Office (“ATO”). In these circumstances the GST is recognised as part of the cost of acquisition of the asset or as part of an item of the expense. Receivables and payables in the statement of financial position are shown inclusive of GST. The net amount of GST
For
per
sona
l use
onl
y

Notes to the Financial Statements For the year ended 30 June 2011
46 | P a g e
recoverable from, or payable to, the ATO is included as a current asset or liability in the statement of financial position. Cash flows are included in the statement of cash flow on a gross basis. The GST components of cash flows arising from investing and financing activities which are recoverable from, or payable to, the ATO are classified as operating cash flows. (m) Provisions
A provision is recognised in the balance sheet when the Company has a present legal or constructive obligation as a result of a past event, and it is probable that an outflow of economic benefits will be required to settle the obligation. If the effect is material, provisions are determined by discounting the expected future cash flows at a pre-tax rate that reflects current market assessments of the time value of money and, when appropriate, the risks specific to the liability. (n) Closure and rehabilitation
The mining, extraction and processing activities of the Group normally give rise to obligations for site closure or rehabilitation. Closure and rehabilitation works can include facility decommissioning and dismantling; removal or treatment of waste materials; site and land rehabilitation. The extent of work required and the associated costs are dependent on the requirements of relevant authorities and the Group’s environmental policies. Provisions for the cost of each closure and rehabilitation program are recognised when the Group has a present obligation and it is probable that rehabilitation/restoration costs will be incurred at a future date, which generally arises at the time that environmental disturbance occurs. When the extent of disturbance increases over the life of an operation, the provision is increased accordingly. Costs included in the provision encompass all closure and rehabilitation activity expected to occur progressively over the life of the operation and at the time of closure, in connection with disturbances, as at the reporting date. Routine operating costs that may impact the ultimate closure and rehabilitation activities, such as waste material handling conducted as an integral part of a mining or production process, are not included in the provision. Costs arising from unforeseen circumstances, such as the contamination caused by unplanned discharges, are recognised as an expense and liability when the event gives rise to an obligation which is probable and capable of reliable estimation. The timing of the actual closure and rehabilitation expenditure is dependent upon a number of factors such as the life and nature of the asset, the operating licence conditions and the environment in which the mine operates. Expenditure may occur before and after closure and can continue for an extended period of time dependent on closure and rehabilitation requirements. Closure and rehabilitation provisions are measured at the expected value of future cash flows, discounted to their present value and determined according to the probability of alternative estimates of cash flows occurring for each operation. Significant judgements and estimates are involved in forming expectations of future activities and the amount and timing of the associated cash flows. When provisions for closure and rehabilitation are initially recognised, to the extent that it is probable that future economic benefits associated with the rehabilitation, decommissioning and restoration expenditure will flow in the entity, the corresponding cost is capitalised as an asset. The capitalised cost of closure and rehabilitation activities is recognised in exploration evaluation and mine properties and property, plant and equipment as appropriate and depreciated/amortised accordingly. The value of the provision is progressively increased over time as the effect of discounting unwinds, creating an expense recognised in finance expenses. Closure and rehabilitation provisions are also adjusted for changes in estimates. Those adjustments are accounted for as a change in the corresponding capitalised cost, except where a reduction in the provision is greater than the undepreciated capitalised cost of the related assets, where it is probable that future economic benefits will flow to the entity, in which case the capitalised cost is reduced to nil and the remaining adjustment is recognised in the income statement. Adjustments to the estimated amount and timing of future closure and rehabilitation cash flows are a normal occurrence in light of the significant judgements and estimates involved. Factors influencing those changes include:
For
per
sona
l use
onl
y

Notes to the Financial Statements For the year ended 30 June 2011
47 | P a g e
• revisions to estimated reserves, resources and lives of operations; • regulatory requirements and environmental management strategies; • changes in the estimated costs of anticipated activities, including the effects of inflation and
movements in foreign exchange rates; • movements in interest rates affecting the discount rate applied; and • the timing of cash flows.
At each reporting date the rehabilitation and restoration provision is remeasured to reflect any of these changes. (o) Earnings Per Share
The Group presents basic and diluted earnings per share (“EPS”) data for its ordinary shares. Basic EPS is calculated as profit attributable ordinary shareholders of the Company divided by the weighted average number of ordinary shares. Diluted EPS is determined by adjusting the profit or loss attributable to ordinary shareholders and the weighted average number of ordinary shares outstanding for the effects of all dilutive potential ordinary shares, which comprise share options granted to employees. (p) Assets held for sale
Assets that are expected to be recovered primarily through sale rather than through continuing use, are classified as held for sale. Immediately before classification as held for sale, the assets, or components of a disposal group, are measured in accordance with the Group’s accounting policies. Thereafter generally the assets, or disposal group, are measured at the lower of their carrying amount and fair value less cost to sell. Impairment losses on initial classification as held for sale and subsequent gains or losses on remeasurement are recognized in profit or loss. Gains are not recognized in excess of any cumulative impairment loss. (q) Issued Capital
Issued and paid up capital is recognised at the fair value of the consideration received by the Company. Any transaction costs arising on the issue of ordinary shares are recognised directly in equity as a reduction of the share proceeds received. (r) Inventory
Inventories of broken ore, gold in circuit and work in progress are physically measured or estimated and valued at the lower of cost and net realisable value. The cost comprises direct materials, labour and transportation expenditure in bringing such inventories to their existing location and condition, together with an appropriate portion of fixed and variable overhead expenditure based on weighted cost incurred during the period in which such inventories were produced. Net realisable value is the estimated selling price in the ordinary course of business less estimated cost of completion and the estimated cost necessary to perform the sale. Inventories of consumable supplies and spare parts are expected to be used in production are valued at cost. Obsolete or damaged inventories of such items are valued at net realisable value. Insurance and capital (or recirculating) spare parts are capitalised and depreciated over the same remaining life as the equipment with which they are associated. (s) Impairment
(i) Financial Assets
A financial asset is assessed at each reporting date to determine whether there is any objective evidence that it is impaired. A financial asset is considered to be impaired if objective evidence
For
per
sona
l use
onl
y

Notes to the Financial Statements For the year ended 30 June 2011
48 | P a g e
indicates that one or more events have had a negative effect on the estimated future cash flows of the asset. An impairment loss in respect of a financial asset measured at amortised cost is calculated as the difference between its carrying amount, and the present value of the estimated future cash flows discounted at the asset’s original effective interest rate. Individually significant financial assets are tested for impairment on an individual basis. The remaining financial assets are assessed collectively in groups that share similar credit risk characteristics. The impairment losses are recognised in profit and loss. An impairment loss is reversed if the reversal can relate objectively to an event occurring after the impairment loss was recognised. For financial assets measured at amortised cost the reversal is recognised in profit and loss. (ii) Non-Financial Assets
The carrying amounts of the Group’s non-financial assets, other than inventories, exploration and evaluation expenditure and deferred tax assets, are reviewed at each reporting date to determine whether there is any indication of impairment. If any such indication exists then the asset’s recoverable amount is estimated. The recoverable amount of an asset or cash-generating unit is the greater of its value in use and its fair value less costs to sell. In assessing value in use, the estimated future cash flows are discounted to their present value using a pre-tax discount rate that reflects current market assessments of the time value of money and the risks specific to the asset. For the purpose of impairment testing, assets that cannot be tested individually, are grouped together into the smallest group of assets that generates cash inflows from continuing use that are largely independent of the cash inflows of other assets or groups of assets (the “cash-generating unit”). An impairment loss is recognised if the carrying amount of an asset or its cash-generating unit exceeds its recoverable amount. Impairment losses are recognised in profit and loss. Impairment losses recognised in respect of cash-generating units are allocated to reduce the carrying amount of the other assets in the unit (group of units) on a pro rata basis. Impairment losses recognised in prior periods are assessed at each reporting date for any indications that the loss has decreased or no longer exists. An impairment loss is reversed if there has been a change in the estimates used to determine the recoverable amount. An impairment loss is reversed only to the extent that the asset’s carrying amount does not exceed the carrying amount that would have been determined, net of depreciation or amortisation, if no impairment loss had been recognised.
(t) New Standards and Interpretations Not Yet Adopted
The following standards, amendments to standards and interpretations have been identified as those which may impact the Group in the period of the initial application. They are available for early adoption at 30 June 2011, but have not been applied in preparing these financial statements: • AASB 9 Financial Instruments includes requirements for the classification and measurement of
financial assets resulting from the first part of Phase 1 of the project to replace AASB 139 Financial Instruments: Recognition and Measurement. AASB 9 will become mandatory for the Group’s 30 June 2014 financial statements. Retrospective application is generally required, although there are exceptions, particularly if the entity adopts the standard for the year ended 30 June 2012 or earlier. The Group not yet determined the potential effect of the standard;
For
per
sona
l use
onl
y

Notes to the Financial Statements For the year ended 30 June 2011
49 | P a g e
5. Financial Risk Management
(a) Overview
This note presents information about the Group’s exposure to credit, liquidity and market risks, their objectives, policies and processes for measuring and managing risk, and the management of capital. The Group does not generally use any form of derivatives as it is not at a level of exposure that requires the use of derivatives to hedge its exposure. The Board does however regularly review the use of derivatives and opportunities for their use within the Group. Exposure limits are reviewed by management on a continuous basis. The Group does not enter into or trade financial instruments, including derivative financial instruments, for speculative purposes. The Board of Directors has overall responsibility for the establishment and oversight of the risk management framework. Management monitors and manages the financial risks relating to the operations of the Group through regular reviews of the risks. (b) Credit Risk
Credit risk is the risk of financial loss to the Group if a customer or counterparty to a financial instrument fails to meet its contractual obligations, and arises principally from the Group’s receivables from customers. Presently, the Group undertakes gold mining, exploration and evaluation activities exclusively in Australia. At the balance sheet date there were no significant concentrations of credit risk.
i) Cash and Cash Equivalents
The Group limits its exposure to credit risk by only investing in liquid securities and only with counterparties that have an acceptable credit rating. ii) Trade and Other Receivables
The Group’s trade and other receivables relate mainly to gold sales, environmental bonds on deposit and GST refunds. The Group has determined that its exposure to trade receivable credit risk is low, as customers perceived to be reliable and have short contractual payment terms. Management does not expect any counterparty to fail to meet its obligations. Environmental bonds is cash held on deposit with financial institutions with acceptable credit ratings. The Group has not established an allowance for impairment.
(c) Exposure to Credit Risk
The carrying amount of the Group’s financial assets represents the maximum credit exposure. The Group’s maximum exposure to credit risk at the reporting date was: GROUP
Carrying Amount 2011
$,000 2010 $,000
Trade and other receivables 3,706 4,280 Cash and cash equivalents 16,085 29,503 Total 19,791 33,783
None of the Group’s receivables are past due (2010: nil).
For
per
sona
l use
onl
y

Notes to the Financial Statements For the year ended 30 June 2011
50 | P a g e
(d) Liquidity Risk
Liquidity risk is the risk that the Group will not be able to meet its financial obligations as they fall due. The Group’s approach to managing liquidity is to ensure, as far as possible, that it will always have sufficient liquidity to meet its liabilities when due, under both normal and stressed conditions, without incurring unacceptable losses or risking damage to the Group’s reputation. The Group manages liquidity risk by maintaining adequate cash reserves from funds generated from operations and by continuously monitoring forecast and actual cash flows. The following are the contractual maturities of financial liabilities, including estimated interest payments and excluding the impact of netting agreements: GROUP 30 JUNE 2011
Carrying Amount $,000
Contractual Cash Flows
$,000
6 Mths or Less $,000
6-12 Mths
$,000
1-2 Years
$,000
2-5 Years
$,000 Interest bearing liabilities
406 455 208 186 45 16
Trade and other payables
17,213 17,213 17,213 - - -
Total 17,619 17,668 17,421 186 45 16 GROUP 30 JUNE 2010
Carrying Amount $,000
Contractual Cash Flows
$,000
6 Mths or Less $,000
6-12 Mths
$,000
1-2 Years
$,000
2-5 Years
$,000 Interest bearing liabilities
683 763 193 193 363 14
Trade and other payables
11,441 11,441 11,441 - - -
Total 12,124 12,204 11,635 193 363 14 (e) Market Risk
Market risk is the risk that changes in market prices, such as foreign exchange rates, interest rates and equity prices will affect the Group’s income or the value of its holdings of financial instruments. The objective of market risk management is to manage and control market risk exposures within acceptable parameters, while optimising the return. The Group only has exposure to interest rate risk. (f) Interest Rate Risk
The Group is exposed to interest rate risk (primarily on its cash and cash equivalents and its interest bearing liabilities), which is the risk that a financial instrument’s value will fluctuate as a result of changes in the market interest rates on interest-bearing financial instruments. The Group does not use derivatives to mitigate these exposures. The Group ensures that as far as possible it maintains excess cash and cash equivalents in short term deposits at interest rates maturing over 90 day rolling periods. i) Profile
At the reporting date the interest rate profile of the Group’s interest-bearing financial instruments was:
For
per
sona
l use
onl
y

Notes to the Financial Statements For the year ended 30 June 2011
51 | P a g e
GROUP Carrying Amount
2011 $,000
2010 $,000
Fixed Rate Instruments Financial liabilities
Equipment loans (406) (683) Total (406) (683) Variable Rate Instruments Financial assets
Cash and cash equivalents 16,085 29,503 Environmental bonds 2,364 2,376
Total 18,449 31,879
ii) Fair Value Sensitivity Analysis for Fixed Rate Instruments
The Group does not account for any fixed rate financial assets and liabilities at fair value through profit or loss. Therefore a change in interest rates at the reporting date would not affect profit or loss.
iii) Cash Flow Sensitivity Analysis for Variable Rate Instruments
A change of 100 basis points in interest rates at the reporting date would have increased (decreased) equity and profit or loss by the amounts shown below. This analysis assumes that all other variables, remain constant.
GROUP
Profit or Loss/Equity 100bp
Increase $,000
100bp Decrease
$,000 30 June 2011 Variable rate instruments 129 (129)
GROUP
Profit or Loss/Equity 100bp
Increase $,000
100bp Decrease
$,000 30 June 2010 Variable rate instruments 223 (223) (g) Fair Values
The carrying amounts of financial assets and liabilities for the Group approximate fair value.
For
per
sona
l use
onl
y

Notes to the Financial Statements For the year ended 30 June 2011
52 | P a g e
(h) Capital Management
The Board’s policy is to maintain a strong capital base so as to maintain investor, creditor and market confidence and to sustain future development of the business through future exploration and development of its projects. Borrowings have been kept to a minimum with $406,000 outstanding in equipment loans as at 30 June 2011 (2010: $683,000). There were no changes in the Group’s approach to capital management during the year. Risk management policies and procedures are established with regular monitoring and reporting. The Group is not subject to externally imposed capital requirements. 6. Segment Reporting
The Group has two reportable segments, as described below, which are the Group’s strategic business units. The strategic business units are managed separately as they require different processes. The Managing Director reviews internal management reports on a monthly basis. The Group operates in one geographical segment being Western Australia. The following summary describes the operations in each of the Group’s reportable segments:
• Production. Includes mining and treatment of gold. • Exploration. Includes the exploration for mineral resources
The Group has no reliance on any one major customer as gold is sold through an agent at the best spot price.
Information about reportable segments For the year ended 30 June
Production Exploration Total 2011 2010 2011 2010 2011 2010 $’000 $’000 $’000 $’000 $’000 $’000 External revenues 89,982 69,073 - - 89,982 69,073 Interest Income - - - - - - Interest Expense (166) (200) - - (166) (200) Depreciation and Amortisation (11,136) (7,556) - - (11,136) (7,556) Reportable segment profit before income tax
25,728
18,248
(830)
(134)
24,898
18,114
Reportable segment assets 72,011 41,993 37,274 23,141 109,285 65,134 Capital Expenditure 31,573 13,941 16,237 11,476 47,810 25,417
For
per
sona
l use
onl
y

Notes to the Financial Statements For the year ended 30 June 2011
53 | P a g e
GROUP Reconciliation of reportable segment revenue
30 June 2011 $,000
30 June 2010 $,000
Total revenue for reportable segments 89,982 69,073 Consolidated profit before income tax 89,982 69,073
GROUP Reconciliation of reportable segment profit/(loss)
30 June 2011 $,000
30 June 2010 $,000
Total profit or loss for reportable segments 24,898 18,114 Unallocated amounts: Finance income 958 803 Other corporate expenses (3,082) (2,235) Consolidated profit before income tax 22,774 16,682 GROUP Reconciliation of reportable segment assets
30 June 2011 $,000
30 June 2010 $,000
Total assets for reportable segments 109,285 65,134 Unallocated amounts: Cash and cash equivalents 16,085 29,503 Environmental bonds on deposit 2,364 2,376 Corporate assets 249 185 Consolidated total assets 127,983 97,198 The Group has no material reconciliation items between management reports and financial statement figures. 7. Revenue
GROUP 30 June
2011 $,000
30 June 2010 $,000
Gold sales 89,680 68,919 Silver sales 270 154 Other sales 32 - Total Sales 89,982 69,073
For
per
sona
l use
onl
y

Notes to the Financial Statements For the year ended 30 June 2011
54 | P a g e
8. Administrative Expenses
The following expenses were incurred during the period: GROUP 30 June
2011 $,000
30 June 2010 $,000
Salaries and on costs 1,697 1,043 Consultants 47 104 Professional fees 99 107 Travel and accommodation 146 145 Contractors 544 447 Rental expense 138 113 Other 411 276 Total 3,082 2,235 9. Personnel Expenses
GROUP
Note 30 June
2011 $,000
30 June 2010 $,000
Wages and salaries 7,690 5,559 Other associated personnel expenses 558 520 Superannuation contributions 713 610 Increase in liability for annual leave 234 110 Employee option expenses 27 - 2 Total 9,195 6,801 Personnel expenses included in cost of goods sold is $6,289,000 (2010: $5,784,000). 10. Depreciation and Amortisation
Included within cost of sales is an amount of $4,723,000 (2010: $3,325,000) for depreciation and $6,413,000 (2010: $4,231,000) for amortisation. 11. Finance Income and Expenses
GROUP 30 June
2011 $,000
30 June 2010 $,000
Interest income 958 803 Finance Income 958 803 Interest expense on financial liabilities (42) (41) Unwind of discount on site rehabilitation provision (124) (159) Finance expense (166) (200) Net Finance Income and Expense 792 603
For
per
sona
l use
onl
y

Notes to the Financial Statements For the year ended 30 June 2011
55 | P a g e
12. Income Tax Expense
(a) Recognised in the Income Statement
GROUP 30 June
2011 $,000
30 June 2010 $,000
Current Tax Expense Current income tax - 79 Current year tax losses not recognised - - - 79 Deferred Income Tax Expense Origination and reversal of temporary differences 6,984 4,821 Changes in previously unrecognised temporary differences - - 6,984 4,821 Income tax expense reported in income statement 6,984 4,900 Income Tax Recognised Directly in Equity
Share capital transaction costs - 323 Numerical Reconciliation Between Tax Expenses and Pre-Tax Profit
Profit before tax 22,774 16,682 Income tax using the domestic corporation tax rate of 30% (2010: 30%)
6,832 5,005
Increase in income tax expense due to non-deductible expenses
78 49
Decrease in income tax due to: Tax incentives - (154)
Recognition of previously unrecognised tax losses - - Changes in unrecognised temporary differences 74 - Income Tax Expense on Pre-Tax Net Profit 6,984 4,900
For
per
sona
l use
onl
y

Notes to the Financial Statements For the year ended 30 June 2011
56 | P a g e
(b) Deferred Tax Assets and Liabilities
GROUP 30 June
2011 $,000
30 June 2010 $,000
Deferred tax assets and liabilities are attributable to the following:
Deferred Tax Assets/(Liabilities) Receivables (448) (41) Inventories (739) (142) Exploration and evaluation assets (10,146) (6,996) Mine properties (8,307) (4,374) Property, plant and equipment (558) (801) Accrued expenses (1) 19 Provisions 927 804 Share issue costs 412 573 Tax losses recognised 5,026 4,108 Net Tax Liabilities (13,834) (6,850) (c) Tax Losses
At 30 June 2011 the Company has $16,754,004 (2010: $13,693,566) of tax losses that are available for offset against future taxable profits of the Company. The unrecognised deferred tax asset arising on tax losses at 30 June 2011 is nil (2010: nil). The potential benefit of carried forward tax losses will only be obtained if taxable profits are derived of a nature and, of an amount sufficient to enable the benefit from the deductions to be realised or the benefit can be utilised by the Group provided that:
i) the provisions of deductibility imposed by law are complied with; and
ii) no change in tax legislation adversely affect the realisation of the benefit from the deductions.
In accordance with the Group’s accounting policies for deferred taxes, a deferred tax asset is recognised for unused tax losses only if it is probable that future taxable profits will be available to utilise those losses. Determination of future taxable profits requires estimates and assumptions as to future events and circumstances, in particular, whether successful development and commercial exploitation, or alternatively sale, of the respective areas of interest will be achieved. This includes estimates and judgments about commodity prices, ore resources, exchange rates, future capital requirements, future operational performance and the timing of estimated cash flows. Changes in these estimates and assumptions could impact on the amount and probability of estimated taxable profits and accordingly the recoverability of deferred tax assets.
For
per
sona
l use
onl
y

Notes to the Financial Statements For the year ended 30 June 2011
57 | P a g e
13. Earnings Per Share
Basic earnings per share The earnings per share at 30 June 2011 was based on the profit attributable to ordinary shareholders of $15,790,000 (2010: $11,782,000) and the weighted average number of ordinary shares outstanding as at 30 June 2011 of 178,838,660 (2010: 171,362,789). GROUP GROUP 30 June 2011
‘000 30 June 2010
‘000 Weighted Average Number of Ordinary Shares Issued ordinary shares at 1 July 178,758 153,409 Issue of shares pursuant to fund raising - 16,404 Issue of shares on exercise of options 81 1,550 Total 178,839 171,363 Diluted earnings per share The diluted earnings per share at 30 June 2011 was based on the profit attributable to ordinary shareholders of $15,790,000 (2010: $11,782,000) and the weighted average number of ordinary shares outstanding after adjustment for the effects of all dilutive potential ordinary shares of 199,636,522 (2010: 189,279,000). GROUP GROUP 30 June 2011
‘000 30 June 2010
‘000 Weighted Average Number of Ordinary Shares Basic weighted average number of ordinary shares 178,839 171,363 Effect of share options on issue 20,798 17,916 Total 199,637 189,279 14. Cash and Cash Equivalents
GROUP 30 June
2011 $,000
30 June 2010 $,000
Cash at bank and on hand – unrestricted 16,085 29,503 Total 16,085 29,503 The Groups exposure to interest rate risk and a sensitivity analysis for financial assets and liabilities are disclosed in Note 5.
For
per
sona
l use
onl
y

Notes to the Financial Statements For the year ended 30 June 2011
58 | P a g e
15. Reconciliation of Cash Flows From Operating Activities
GROUP 30 June
2011 $,000
30 June 2010 $,000
Cash Flow From Operating Activities Profit after tax 15,790 11,782 Adjustments for:
Depreciation 4,723 3,325 Amortisation 6,413 4,231 Net finance expenses (792) (603) Exploration impairment 829 134 Loss on sale of asset 3 - Equity-settled share-based payments 38 2 Income tax expense 6,984 4,900 Operating profit before changes in working capital and
provisions 33,988 23,771
Change in trade and other receivables 562 (1,341) Change in inventories (6,995) (5,344) Change in trade and other payables 5,772 2,631 Change in prepayments (100) 42 Change in provisions 234 110 Interest paid (115) (42)
Total 33,346 19,827 16. Trade and Other Receivables
GROUP 30 June
2011 $,000
30 June 2010 $,000
Current Bullion sale receivable - 1,196 Other receivables 1,342 708 1,342 1,904 Non-Current Environmental bonds on deposit* 2,364 2,376 2,364 2,376 Total 3,706 4,280 The Groups exposure to interest rate risk and a sensitivity analysis for financial assets and liabilities are disclosed in Note 5. * Relates to security deposits to cover bank guarantees for mining lease bonds.
For
per
sona
l use
onl
y

Notes to the Financial Statements For the year ended 30 June 2011
59 | P a g e
17. Inventories
GROUP 30 June
2011 $,000
30 June 2010 $,000
Materials and supplies – at cost 821 473 Ore stocks – at cost 8,579 2,286 Gold in circuit – at cost 4,135 2,771 Gold bullion – at cost 1,263 2,272 Total 14,798 7,802 18. Exploration, Evaluation and Mining Assets
During the twelve months ended 30 June 2011 the Group incurred and capitalised the following on exploration, evaluation and mining assets: GROUP 30 June
2011 $,000
30 June 2010 $,000
Exploration and Evaluation Assets Cost brought forward 23,141 11,889 Capitalised during the year 16,237 11,476 Expenditure impairment (829) (134) Transferred to mine development (25) (90) Transferred to Assets held for sale (1,250) - Balance at 30 June 37,274 23,141 The ultimate recoupment of deferred exploration and evaluation expenditure carried forward is dependent upon the successful development and exploitation, or alternatively, sale of the respective areas of interest at an amount greater than or equal to the carrying value. GROUP 30 June
2011 $,000
30 June 2010 $,000
Mine Development Cost brought forward 90 - Transfer from exploration and evaluation assets 25 90 Expenditure during the year - - Transferred to mine properties (115) - Balance at 30 June - 90
For
per
sona
l use
onl
y

Notes to the Financial Statements For the year ended 30 June 2011
60 | P a g e
GROUP 30 June
2011 $,000
30 June 2010 $,000
Mine Properties Cost brought forward 18,861 16,852 Transfer from development phase 115 - Expenditure during the year 23,822 6,240 Increase in rehabilitation provision 2,198 - Amortisation expense (6,413) (4,231) Balance at 30 June 38,583 18,861 Total 75,857 42,092
For
per
sona
l use
onl
y

Notes to the Financial Statements For the year ended 30 June 2011
61 | P a g e
19. Property, Plant and Equipment
GROUP Land & Building Plant & Equipment Motor
Vehicles Office
Furniture & Equipment
Capital Work In
Progress
Total
Cost Balance 1 July 2009 178 9,382 399 222 1,781 11,962 Additions 304 7,028 125 107 137 7,701 Transfers 28 1,748 5 (1,781) - Disposals - (519) - - - (519) Balance 30 June 2010 510 17,639 524 334 137 19,144 Balance 1 July 2010 510 17,639 524 334 137 19,144 Additions 15 4,880 84 158 2,615 7,752 Transfers - 133 - 4 (137) - Disposals - (363) - - - (363) Balance 30 June 2011 525 22,289 608 496 2,615 26,533 Depreciation Balance at 1 July 2009 25 2,247 87 76 - 2,435 Depreciation expense 37 3,087 129 72 - 3,325 Disposal - (115) - - - (115) Balance 30 June 2010 62 5,219 216 148 - 5,645 Balance at 1 July 2010 62 5,219 216 148 - 5,645 Depreciation expense 50 4,437 137 99 - 4,723 Disposal - - - - - - Balance 30 June 2011 112 9,656 353 247 - 10,368 Carrying Amount At 1 July 2009 153 7,135 312 146 1,781 9,527 At 30 June 2010 448 12,420 308 186 137 13,499 At 1 July 2010 448 12,420 308 186 137 13,499 At 30 June 2011 413 12,633 255 249 2,615 16,165
For
per
sona
l use
onl
y

Notes to the Financial Statements For the year ended 30 June 2011
62 | P a g e
20. Trade and Other Payables
GROUP 30 June
2011 $,000
30 June 2010 $,000
Trade payables 15,491 10,186 Other payables 1,722 1,255 Total 17,213 11,441 The Groups exposure to interest rate risk and a sensitivity analysis for financial assets and liabilities are disclosed in Note 5. 21. Interest Bearing Liabilities
GROUP
30 June 2011 $,000
30 June 2010 $,000
Current Liability Equipment loan – Crushing Plant* 233 233 Equipment loan – Motor Vehicles 119 112 352 345 Non-Current Liability Equipment loan – Crushing Plant* - 233 Equipment loan – Motor Vehicles 54 105 54 338 Total 406 683
* The Equipment loan – crushing plant was a fixed interest loan over three years. 22. Employee Benefits
GROUP
30 June 2011 $,000
30 June 2010 $,000
Current Liability for annual leave 573 339 Total 573 339
For
per
sona
l use
onl
y

Notes to the Financial Statements For the year ended 30 June 2011
63 | P a g e
23. Share Based Payments
During the 30 June 2008 financial year the Group established a share option programme that entitles employees to purchase shares in the Company. The terms and conditions of the grants are as follows:
Number Vesting Conditions Contractual Life Grant Date/Entitlement Options granted – 24 January 2008 1,935,000 1 year service 5 years Options granted – 14 March 2008 636,560 1 year service 5 years Options granted – 20 August 2008 361,500 1 year service 5 years Total Share Options 2,933,060 The number of and weighted average exercise prices of share options is as follows: Weighted
Average Exercise Price
2011
Number of Options
2011
Weighted Average
Exercise Price 2010
Number of Options
2010
Outstanding at 1 July $0.30 24,365,000 $0.30 26,506,250 Forfeited during period - - - - Granted during the period - - - - Exercised during the period $0.30 (125,000) $0.32 (2,141,250) Outstanding at 30 June $0.30 24,240,000 $0.30 24,365,000 Exercisable at 30 June $0.30 24,240,000 $0.30 24,365,000 The fair value of services received in return for share options granted is based on the fair value of share options granted, measured using the Black-Scholes option pricing model, incorporating the probability of the relative total shareholder return vesting condition being met, with the following inputs: Issued
29 January 2008 Issued
14 March 2008 Issued
20 August 2008
Fair Value of Share Options and Assumptions
Fair value at grant date 25.293c 22.752c 14.763c Share price 35.0c 31.5c 21.5c Exercise price 30.0c 33.0c 39.0c Volatility 86.49% 89.47% 98.87% Risk free rate 6.37% 6.7% 5.66% Expiry date 24 January 2013 14 March 2013 20 August 2013
For
per
sona
l use
onl
y

Notes to the Financial Statements For the year ended 30 June 2011
64 | P a g e
24. Provisions
GROUP
30 June 2011 $,000
30 June 2010 $,000
Closure and Rehabilitation Opening balance at 1 July 2,340 2,303 Additional provisions during the year 2,198 - Unwind of discount 125 159 Rehabilitation expense (79) (122) Closing Balance at 30 June 4,584 2,340 25. Operating Leases
The Group leases its office space in West Perth under a non-cancellable operating lease. The lease is for four years from 17 December 2007 at a cost of $118,000 per annum. The Group rents its communications network which connects Perth Office to operational sites under a non-cancellable rent agreement. The agreement is for three years from 01 May 2009 at a cost of $62,400 per annum. 26. Share Capital
Company Number $,000 Movements in Issued Capital Balance as at 01 July 2009 153,409,424 38,033 Shares issued on exercise of employee options 2,141,250 684 Shares Issued for capital raising 23,207,164 18,334 Capital transaction costs (net of tax) - (827) Balance as at 30 June 2010 178,757,838 56,224 Shares issued on exercise of employee options 125,000 37 Shares Issued for capital raising - - Capital transaction costs (net of tax) - - Balance as at 30 June 2011 178,882,838 56,261 No shares were issued for capital raising (2010: 23,207,164 shares at a price of $0.79 per share). All issued shares are fully paid. Additionally 125,000 shares were issued as a result of the exercise of vested options granted to employees under the share option programme (2010: 2,141,250). All issued shares are fully paid and the holders of ordinary shares are entitled to receive dividends as declared from time to time, and are entitled to one vote per share at meetings of the Company. All shares rank equally with regard to the Company’s residual assets.
For
per
sona
l use
onl
y

Notes to the Financial Statements For the year ended 30 June 2011
65 | P a g e
27. Option Reserves
Number $,000 Movement in Options Reserve Balance as at 1 July 2009 26,506,250 629 Expensed – 20/08/2009 – Employee option - 2 Options Exercised (2,141,250) (449) Balance as at 30 June 2010 24,365,000 182 Balance at 1 July 2010 24,365,000 182 Expensed – 20/08/2009 – Employee option - - Options Exercised (125,000) (32) Balance as at 30 June 2011 24,240,000 150 The fair value of options vesting during the period and recognised in the income statement was nil. The option reserve is established to show the total value of share options vested. 28. Parent Entity
As at, and throughout the financial year ended 30 June 2011 the parent company of the Group was Silver Lake Resources Limited.
Notes
30 June 2011 $,000
30 June 2010 $,000
Results of the parent entity Profit for the period 15,790 11,811 Other comprehensive income - - Total comprehensive income for the period 15,790 11,811 Financial position of parent entity at year end Current assets 33,597 39,231 Total assets 126,865 97,083 Current liabilities 18,138 12,125 Total liabilities 35,463 21,509 Total equity of the parent entity comprising of: Share capital 56,261 56,224 Option reserve 150 182 Retained earnings 34,991 19,168 Total equity 91,402 75,574 The parent entity has commitments of $3,094,865 (2010: $1,430,200) and no other commitments or guarantees.
For
per
sona
l use
onl
y

Notes to the Financial Statements For the year ended 30 June 2011
66 | P a g e
29. Commitments
Commitments for the next financial year total $3,368,465 and are made up of: • The Group holds various mineral titles which require a total minimum exploration expenditure of
$2,206,780 (2010: $1,609,800) in the next financial year. • Contracts signed or orders raised for plant and equipment associated with the expansion of the
Lakewood Gold Processing Facility $1,161,685 (2010: nil). 30. Related Parties
(a) Key Management Personnel Compensation
The key management personnel compensation included in “personnel expenses” is as follows:
GROUP 30 June
2011 $,000
30 June 2010 $,000
Short-term employee benefits 1,604 1,138 Post employment benefits 165 115 Share based payments - - Total 1,769 1,253
(b) Individual Directors and Executives Compensation Disclosures
Information regarding individual Directors and executive’s compensation and some equity instruments disclosures as permitted by Corporations Regulations 2M.3.03 is provided in the remuneration report section of the Directors’ Report. (c) Transactions With Key Management Personnel
A number of key management persons hold positions in other entities that result in them having control or significant influence over the financial or operating policies of those entities. A number of these entities transacted with the Group in the reporting period. The terms and conditions of the transactions with key management persons were no more favorable than those available, or which might be reasonably expected to be available, on similar transactions to non-key management personnel related entities on an arm’s length basis. The aggregate amounts recognised during the year relating to key management personnel and their related parties were as follows: Transaction Value
Year Ended Balance Outstanding
as at 30 June
2011 $,000
30 June 2010 $,000
30 June 2011 $,000
30 June 2010 $,000
Expenses Gryphon Management –
Administrative Services* 1 - 1 -
Total 1 - 1 - * A company controlled by David Griffiths – Non-Executive Director for consulting services.
For
per
sona
l use
onl
y

Notes to the Financial Statements For the year ended 30 June 2011
67 | P a g e
(d) Movement in Options
The movement during the reporting period in the number of options over ordinary shares in Silver Lake Resources Limited held, directly, indirectly or beneficially by each key management person, including their related parties, is as follows:
Key
Management Person
Held at 1 July 2010
Granted as Compen-
sation
Options Exercised
Options Acquired
Held at 30 June
2011
Vested During
The Year
Vested and Exercisable at 30 June
2011 Paul Chapman 4,000,000 - - - 4,000,000 - 4,000,000 Les Davis 4,000,000 - - - 4,000,000 - 4,000,000 Chris Banasik 4,000,000 - - - 4,000,000 - 4,000,000 Brian Kennedy 4,000,000 - - - 4,000,000 - 4,000,000 Peter Johnston 4,000,000 - - - 4,000,000 - 4,000,000 David Griffiths 4,000,000 - - - 4,000,000 - 4,000,000 Peter Armstrong 200,000 - - - 200,000 - 200,000 David Crockford - - - - - - - Total 24,200,000 - - - 24,200,000 - 24,200,000
Key Management
Person
Held at 1 July 2009
Granted as
Compen- sation
Options Exercised
Options Acquired
Held at 30 June
2010
Vested During
The Year
Vested and Exercisable at 30 June
2010 Paul Chapman 4,000,000 - - - 4,000,000 - 4,000,000 Les Davis 4,000,000 - - - 4,000,000 - 4,000,000 Chris Banasik 4,000,000 - - - 4,000,000 - 4,000,000 Brian Kennedy 4,000,000 - - - 4,000,000 - 4,000,000 Peter Johnston 4,000,000 - - - 4,000,000 - 4,000,000 David Griffiths 4,000,000 - - - 4,000,000 - 4,000,000 Peter Armstrong 200,000 - - - 200,000 - 200,000 David Crockford 240,000 - (240,000) - - - - Total 24,440,000 - (240,000) - 24,200,000 - 24,200,000
For
per
sona
l use
onl
y

Notes to the Financial Statements For the year ended 30 June 2011
68 | P a g e
(e) Movement in Shares
The movement during the reporting period in the number of ordinary shares in Silver Lake Resources Limited held, directly, indirectly or beneficially, by each key management person, including their related parties, is as follows:
Key Management
Person
Held at 1 July 2010
Shares Purchased
Shares Exercised
Shares Sold
Held at 30 June 2011
Paul Chapman 4,606,908 - - - 4,606,908 Les Davis 4,200,000 - - - 4,200,000 Chris Banasik 4,000,000 - - - 4,000,000 Brian Kennedy 4,075,377 - - - 4,075,377 Peter Johnston 4,318,253 - - - 4,318,253 David Griffiths 4,158,377 - - - 4,158,377 Peter Armstrong 449,959 - - - 449,959 David Crockford 177,222 - - - 177,222 Total 25,986,096 - - - 25,986,096
Key Management
Person Held at
1 July 2009 Shares
Purchased Shares
Exercised Shares Sold
Held at 30 June 2010
Paul Chapman 4,606,908 - - - 4,606,908 Les Davis 4,200,000 - - - 4,200,000 Chris Banasik 4,000,000 - - - 4,000,000 Brian Kennedy 4,075,377 - - - 4,075,377 Peter Johnston 4,318,253 - - - 4,318,253 David Griffiths 4,158,377 - - - 4,158,377 Peter Armstrong 460,000 75,959 - (86,000) 449,959 David Crockford - - 240,000 (62,778) 177,222
Total 25,818,915 75,959 240,000 (148,778) 25,986,096 (f) Subsidiaries
Loans are made by the Company to wholly owned subsidiaries for capital purchases and continued exploration activities. Loans outstanding between the Company and its subsidiaries have no fixed date of repayment and are non-interest bearing. During the financial year ended 30 June 2011, such loans to subsidiaries totaled $3,635,000 (2010: $2,633,000). 31. Subsequent Events
On 7th June 2011 the Company signed an option agreement with Auricup Resources Pty Limited which gives Auricup the right to purchase the Rothsay leases from the Company for $1.25m. This option was taken up by Auricup and the sale transaction occurred on 18 August 2011. All leases relating to the Rothsay project were transferred to Assets held for sale during the year, pending finalisation of this agreement. There has not been any other matter or circumstance that has arisen since the end of the interim financial period that has significantly affected the operations of the Group, the results of these operations, or the state of affairs of the Group in future financial periods.
For
per
sona
l use
onl
y

Notes to the Financial Statements For the year ended 30 June 2011
69 | P a g e
32. Auditor’s Remuneration
2011 $
2010 $
Audit and review of the Company’s financial statements 107,000 106,931 Taxation services 51,050 24,700 Total 158,050 131,631 33. Group Entities
The Company controlled the following subsidiaries:
Subsidiaries Country of Incorporation
Ownership Interest
2011 2010
Cue Minerals Pty Ltd Australia 100% 100%
For
per
sona
l use
onl
y

ASX Additional Information For the year ended 30 June 2011
70 | P a g e
At 30 June 2011 the Company had issued the following equity securities:
Fully Paid Ordinary Shares
Options Option Exercise Option Expiry
Quoted Securities: 178,882,838 Nil
Unquoted Securities:
Restricted until 14 November 2009 20,999,998 $0.30 31/12/2012
Other unquoted securities: 3,000,002 $0.30 31/12/2012
240,000 $0.30 29/01/2013
Total all Securities 178,882,838 24,240,000
DISTRIBUTION OF HOLDERS Fully Paid Ordinary
Shares Options
1 - 1,000 610 -
1,001 - 5,000 1,488 -
5,001 - 10,000 611 -
10,001 - 100,000 876 1
100,001 - and over 120 7
Total Holders 3,705 8 There are no holders of less than a marketable parcel of shares. VOTING RIGHTS OF SECURITIES Subject to any rights or restrictions for the time being attached to any class or classes of Shares (at present there is only one class of Shares), at meetings of Shareholders of Silver Lake:
a) each Shareholder entitled to vote may vote in person or by proxy, attorney or representative;
b) on a show of hands, every person present who is a Shareholder or a proxy, attorney or representative of a Shareholder has one vote; and
c) on a poll, every person present who is a Shareholder or a proxy, attorney or representative of a Shareholder shall, in respect of each Share held by him, or in respect of which he is appointed a proxy, attorney or representative, have one vote for the Share, but in respect of partly paid Shares, shall have such number of votes as bears the same proportion which the amount paid (not credited) is of the total amounts paid and payable (excluding amounts credited).
Options do not carry any voting rights.
For
per
sona
l use
onl
y

ASX Additional Information For the year ended 30 June 2011
71 | P a g e
SUBSTANTIAL SHAREHOLDERS As at 30 June 2011 the substantial holders disclosed to the Company were:
Registered Holder Beneficial Owner Number of Shares Percentage of Issued Shares
RBC Dexia Investor Service
Cormark Securities Inc
Scotia Capital
Sprott Asset Management LP.
16,559,283
9.3%
HSBC Custody Nominee (Australia) Ltd Eye Investment Fund Ltd
10,000,000
5.6%
Macquarie Group Limited Mcquarie Group Limited 7,003,589 3.9%
TOP 20 HOLDERS OF QUOTED SECURITIES
Registered Holder Number of Quoted
Securities
Percentage of Issued Shares
HSBC Custody Nominees (Australia) Limited 27,583,029 15.4%
National Nominees Limited 14,131,250 7.9%
JP Morgan Nominees Australia Ltd 11,494,058 6.4%
HSBC Custody Nominees (Australia) Limited 10,492,775 5.9%
JP Morgan Nominees Australia Ltd 7,556,699 4.2%
BRGM Nominees Pty Ltd (BRGM Unit Account 4,000,000 2.2%
Goldfields Hotel Pty Ltd (Exchange Hotel Unit Trust) 3,000,000 1.7%
Citicorp Nominees Pty Limited 2,695,320 1.5%
Bond Street Custodians Ltd 2,483,250 1.4%
UBS Nominees Pty Ltd 2,355,708 1.3%
Goldfields Hotel Pty Ltd (Exchange Hotel Unit Trust) 2,000,000 1.1%
Mellett Super Pty Ltd 1,876,185 1.1%
Forsyth Barr Custodians Ltd 1,825,631 1.0%
Bramor Superannuation Pty Ltd 1,150,000 0.6%
Bond Street Custodians Ltd 896,114 0.5%
Aust Executor Trustees NSW Ltd 832,548 0.5%
Kiki Super Fund A/C 800,000 0.5%
HSBC Custody Nominees (Australia) Limited 750,000 0.4%
Dr Bhasin Neelesh 582,502 0.3%
Brispot Nominees Pty Ltd 578,946 0.3%
97,084,015 54.3%
ASX LISTING RULE 4.10.19
For
per
sona
l use
onl
y

ASX Additional Information For the year ended 30 June 2011
72 | P a g e
In accordance with Listing Rule 4.10.19, the Company states that it has used the cash and assets in a form readily convertible to cash that it had at the time of admission in a way consistent with its business objectives, which are exploration and evaluation of projects, gold mining from the Daisy Milano operations and gold processing at Lakewood Gold Processing Facility.
For
per
sona
l use
onl
y