appendix 4e and 2016 financial report - aveo · pdf fileappendix 4e and 2016 financial report...
TRANSCRIPT
Aveo Group (Comprising Aveo Group Limited ABN 28 010 729 950 and its subsidiaries and
Aveo Group Trust ARSN 099 648 754 and its subsidiaries)
Appendix 4E and 2016 Financial Report

Aveo Group
Aveo Group is a stapled group consisting Aveo Group Limited (ABN 28 010 729 950) and its controlled entities and Aveo Group Trust (ARSN 099 648 754), the Responsible Entity of which is Aveo Funds Management Limited (ABN 17 089 800 082), and its controlled entities.
Appendix 4E
for the year ended 30 June 2016
(previous corresponding period being the year ended 30 June 2015)
RESULTS FOR ANNOUNCEMENT TO THE MARKET
Profit after tax $m up/down % movement
Revenue 445.3 up 48.3
Profit after tax attributable to stapled securityholders 116.0 up 100.0
Dividend/distribution information
Total dividends and distributions
Distribution per unit
Dividend per share
Franked amount per
shareFinal dividend/distribution – payable 30 September 2016 $43.5m 8.0 cps - -
Previous corresponding periodFinal dividend/distribution – payable 30 September 2015 $25.8m 5.0 cps - -
The record date for determining entitlements to the final dividend/distribution was 30 June 2016.
The Group’s Dividend/Distribution Reinvestment Plan (‘DRP’) remains suspended and is not operational for the 2016 final distribution.
Additional information 30 June 2016 30 June 2015
Net tangible assets per stapled security1 $3.00 $2.85
Attributable to stapled securityholders, excluding non-controlling interests. 1.
Commentary on the results for the period can be found in the attached 2016 Directors’ Report.
Additional Appendix 4E disclosure requirements can be found in the attached notes to the 2016 consolidated financial statements including details of entities over which control has been gained or lost during the period and details of associates and joint venture entities.
Anna Wyke Company Secretary
Sydney 17 August 2016

Aveo Group 2016 Financial Report
Table of Contents
PageDirectors’ Report 1Auditor’s independence declaration 15Remuneration Report 16Corporate Governance Statement 31Financial Report Consolidated income statements 44 Consolidated statements of comprehensive income 45 Consolidated balance sheets 46 Consolidated statements of changes in equity 47 Consolidated cash flow statements 49 Notes to the consolidated financial statements 50 Section A. How the numbers are calculated 50 Section A1. Profit and loss information 51 Note 1 Revenue 51 Note 2 Particular expenses 53 Note 3 Income tax expense 54 Section A2. Financial assets and liabilities 54 Note 4 Trade and other receivables 55 Note 5 Trade and other payables 56 Note 6 Interest bearing loans and borrowings 56 Note 7 Resident loans 58 Section A3. Non-financial assets and liabilities 59 Note 8 Inventories 59 Note 9 Investment properties 60 Note 10 Deferred tax assets and liabilities 63 Section A4. Equity 65 Note 11 Contributed equity 65 Note 12 Dividends and distributions 66 Section A5. Segment information 67 Note 13 Segment information 67 Section B. Risk management 70 Note 14 Critical estimates and judgements 70 Note 15 Financial risk management 71 Note 16 Capital management 75 Section C. Group structure 76 Note 17 Business combination 76 Note 18 Interests in other entities 77 Note 19 Equity-accounted investments 78 Section D. Unrecognised items 80 Note 20 Subsequent events 80 Appendix 1. How the numbers are calculated – other items 81 Note 21 Earnings per security 81 Note 22 Cash and cash equivalents 82 Note 23 Property, plant and equipment 82 Note 24 Provisions 83

Page Note 25 Reserves and retained profits/(losses) 84 Note 26 Material partly-owned subsidiaries 85 Note 27 Notes to the cash flow statements 86 Appendix 2. Other information 87 Note 28 Related party transactions 87 Note 29 Auditor’s remuneration 89 Note 30 Parent entities 89 Note 31 Deed of cross guarantee 91 Note 32 Other accounting policies 94 Dictionary 97 Directors’ declaration 99Independent Auditor’s Report 100
Aveo Group 2016 Directors’ Report
Page 1
The Directors of Aveo Group Limited and the Directors of Aveo Funds Management Limited, the Responsible Entity of Aveo Group Trust, present their report together with the financial reports of the Group and of Aveo Group Trust for the year ended 30 June 2016 and the Auditor’s Report thereon. The financial report of the Group comprises the consolidated financial report of Aveo Group Limited and its controlled entities including Aveo Group Trust and its controlled entities. The financial report of the Property Trust comprises the consolidated financial report of the Trust Group.
The meaning of defined terms is given in the Dictionary at page 97, which forms part of the Directors’ Report.
DIRECTORS
The Directors of Aveo Group Limited and of Aveo Funds Management Limited during the financial year and up until the date of this report are as follows:
Director Position Period of Directorship S H Lee Non-Executive Chairman Full year J E F Frayne Non-Executive Director Full year E L Lee Non-Executive Director Full year W L McDonald Non-Executive Director Full year L R McKinnon Non-Executive Director Full year S B Muggleton Non-Executive Director Full year G E Grady Executive Director and
Chief Executive Officer Full year
Alternate Directors W Chow Alternate Director for S H Lee Full year W Chow Alternate Director for E L Lee Full year Information on Directors
S H Lee
Non-Executive Chairman (age 42)
Mr Lee joined the Board in February 2006 and was appointed as Chairman in February 2009. Mr Lee was educated at the University of Sydney in Australia and has wide experience in the financial services and real estate investment industry in the Asian region. He has previously served, in various capacities, on the Board of Lippo Limited and Lippo China Resources Limited in Hong Kong, Auric Pacific Group Limited in Singapore and Export and Industry Bank, Inc. in the Philippines. Mr Lee is currently the Group Executive Chairman of Sun Hung Kai & Co. Limited (appointed in January 2007). Listed in Hong Kong, Sun Hung Kai & Co. Limited is the leading non-bank financial institution in Hong Kong. Mr Lee is also a Non-Executive Director of Mudajaya Group Berhad (appointed in March 2011), a company listed on the Bursa Malaysia Securities Berhad, and Executive Chairman of Mulpha International Bhd (appointed in December 2003), a company listed on the Bursa Malaysia Securities Berhad.
J E F Frayne, BCom, FCA, GAICD
Non-Executive Director (age 69)
Mr Frayne joined the Board in July 2008. He has over 40 years’ experience in chartered accountancy in audit and corporate services fields. Mr Frayne was appointed as a partner of PKF Chartered Accountants and Business Advisers (now BDO Chartered Accountants) in 1983 and from that time headed up the Audit and Assurance Division of PKF Brisbane until his retirement in June 2006. He is Chairman of Directors of Black & White Holdings Limited. Mr Frayne was appointed a member of the Audit Committee effective December 2010 and has been a member of the Nomination and Remuneration Committee since July 2012.

Aveo Group 2016 Directors’ Report (continued)
Page 2
E L Lee, Registered Accountant (Malaysia), CPA
Non-Executive Director (age 49)
Mr Lee joined the Board in December 2012. He is currently the Group Chief Financial Officer for Mulpha International Bhd, the holding company of Mulpha Australia Limited, Aveo’s largest single securityholder. Prior to joining Mulpha International Bhd, Mr Lee was the Executive Vice President of Alliance Financial Group. Mr Lee has also held various senior management positions, including 12 years at Microsoft as Chief Financial Officer of Greater China Region and Finance Director of Asia Pacific Region. He is the Non-Executive Director of Thriven Global Berhad (formerly known as Mulpha Land Berhad) (appointed in March 2016), an alternate Director of Mudajaya Group Berhad (appointed in October 2012) and a Director of Mulpha Australia Limited. Mr Lee was appointed as a member of the Audit Committee in February 2013.
W L McDonald, BEc, LLB (Hons)
Non-Executive Director (age 59)
Mr McDonald joined the Board in August 2012. He is recognised as one of Australia’s leading legal practitioners, with many years’ experience in advising major government and corporate clients. Currently, Mr McDonald is a partner in the Corporate Division at Piper Alderman. During his career, Mr McDonald has gained experience across a wide range of areas of law including government, corporate, mergers and acquisitions, energy and resources, corporate finance, intellectual property, workout/recovery, major projects and technology, media and telecommunications. He is a Non-Executive Director of Retirement Villages Australia Limited, the head entity of Retirement Villages Group. Mr McDonald was appointed as Chair of the Nomination and Remuneration Committee effective June 2014.
L R McKinnon, BA, LLB, MCom
Non-Executive Director (age 63)
Mr McKinnon joined the Board in May 2005. He has extensive experience in property financing and investment gained through approximately 30 years in banking and finance. Mr McKinnon established the property financing business of Bankers Trust Australia in 1993. In 2000, in partnership with Gresham Partners, he established the first institutionally supported property mezzanine debt funds in Australia. He was the managing director of the funds until 2005 and continues as a non-executive member of the Investment Committee on Gresham’s follow-on funds. In 2010, he was appointed as Chair of the Investment Committee of AsheMorgan and was instrumental in the establishment of the group’s asset syndication business. He has stepped down as Chairperson. In 2014, Mr McKinnon was appointed as Chair of an independent committee by Parramatta City Council to report on the use of Council owned land in third party developments. This includes the development of a number of projects to deliver the vision of a revitalised city centre in Parramatta Square. Mr McKinnon was appointed Chairman of the Audit Committee effective December 2010.
Adjunct Professor S B Muggleton, BAppSc, MHA, GAICD
Non-Executive Director (age 56)
Mr Muggleton joined the Board in June 2014. He is regarded as an innovative CEO with more than 25 years’ experience managing teaching hospitals and some of Australia’s largest residential aged and community care organisations. He has been a member of a number of industry, state, national and international expert panels and committees on health and ageing. Mr Muggleton holds a Degree in Applied Science and a Master’s Degree in Health Administration from the University of NSW. His contributions to health and aged care have been recognised with an Adjunct Professor title from the University of Queensland, two Ageing Asia Investment Forum Awards and an Institute of Management Award.
Former Directorships of listed entities in the last three years
Mr Muggleton was a Director of Aveo Healthcare Limited from July 2013 to March 2014. This company was removed from the official list of ASX Limited on 22 April 2014.

Aveo Group 2016 Directors’ Report (continued)
Page 3
G E Grady, LLB (Hons), BCom, ACA
Executive Director and Chief Executive Officer (age 57)
Mr Grady joined Aveo Group as Chief Operating Officer in March 2009, having previously been the Chief Executive Officer of Mulpha Sanctuary Cove (Developments) Pty Limited since 2002. He was appointed as Executive Director and Chief Executive Officer of Aveo Group in July 2013. He has also worked as a partner of KPMG. Mr Grady holds degrees in commerce and law with honours from the University of Queensland. He is a chartered accountant and a solicitor of the Supreme Court of Queensland. Mr Grady is also the Chairman of Aveo Healthcare Limited (appointed in March 2014).
Former Directorships of listed entities in the last three years
Mr Grady was an Alternate Director of Tian An Australia Limited (formerly PBD Developments Limited) from July 2011 to October 2013 and was a Director of Metlifecare Limited (listed on the New Zealand Stock Exchange) from September 2012 to November 2013.
W Chow, MEnvPlan, BE (Civil) (Env), BEng (Hons)
Non-Executive Alternate Director (age 54)
Mr Chow was appointed as Alternate Director for Mr Seng Huang Lee in November 2011 and for Mr Eric Lee in March 2014. Mr Chow was appointed Chief Operating Officer of MIB from 1 July 2016. He became Chief Operational Officer of Mulpha Australia Limited in October 2011 and was previously Managing Director at China Resources Group. Mr Chow holds degrees in civil and environmental engineering and environmental planning and has extensive experience in property development, management and construction.
COMPANY SECRETARIES
N A Moodie, BCom, GradDipCorpLaw
Ms Moodie joined Aveo Group in 2012 and was appointed to the position of Company Secretary in June 2014. Ms Moodie has previously been the Company Secretary for a number of other listed entities and is currently the Company Secretary for Aveo Healthcare Limited and Retirement Villages Group. Ms Moodie holds a Bachelor of Commerce from the University of Wollongong and a Graduate Diploma in Corporate Securities and Finance Law from the University of Sydney.
A Wyke, B Econ, Dip in Law, Grad Dip ACG, AGIA
Ms Wyke joined Aveo Group to the position of Company Secretary in March 2016. Ms Wyke is experienced governance professional with over 15 years of legal, compliance and company secretarial experience obtained through the funds management sector, primarily in property and financial services, as well as not-for-profit sectors. Ms Wyke is solicitor of the Supreme Court of NSW and holds a Bachelor of Economics from Macquarie University, Diploma in Law from Legal Practitioners Admission Board and a Graduate Diploma of Applied Corporate Governance from the Governance Institute of Australia.
Aveo Group 2016 Directors’ Report (continued)
Page 4
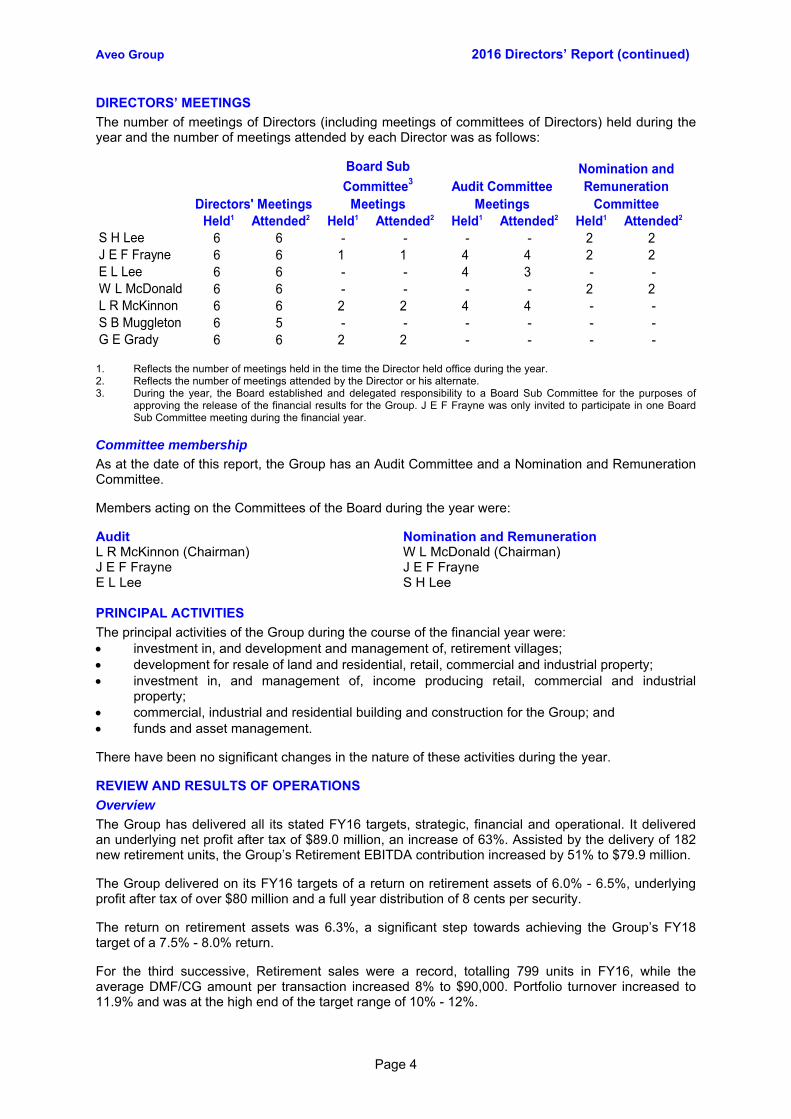
DIRECTORS’ MEETINGS
The number of meetings of Directors (including meetings of committees of Directors) held during the year and the number of meetings attended by each Director was as follows:
Held1 Attended2 Held1 Attended2 Held1 Attended2 Held1 Attended2
S H Lee 6 6 - - - - 2 2J E F Frayne 6 6 1 1 4 4 2 2E L Lee 6 6 - - 4 3 - -W L McDonald 6 6 - - - - 2 2L R McKinnon 6 6 2 2 4 4 - -S B Muggleton 6 5 - - - - - -G E Grady 6 6 2 2 - - - -
Directors' MeetingsAudit Committee
Meetings
Nomination and Remuneration
Committee
Board Sub
Committee3
Meetings
Reflects the number of meetings held in the time the Director held office during the year. 1. Reflects the number of meetings attended by the Director or his alternate. 2. During the year, the Board established and delegated responsibility to a Board Sub Committee for the purposes of 3.
approving the release of the financial results for the Group. J E F Frayne was only invited to participate in one Board Sub Committee meeting during the financial year.
Committee membership
As at the date of this report, the Group has an Audit Committee and a Nomination and Remuneration Committee.
Members acting on the Committees of the Board during the year were:
Audit Nomination and Remuneration L R McKinnon (Chairman) W L McDonald (Chairman) J E F Frayne J E F Frayne E L Lee S H Lee PRINCIPAL ACTIVITIES
The principal activities of the Group during the course of the financial year were: investment in, and development and management of, retirement villages; development for resale of land and residential, retail, commercial and industrial property; investment in, and management of, income producing retail, commercial and industrial
property; commercial, industrial and residential building and construction for the Group; and funds and asset management.
There have been no significant changes in the nature of these activities during the year.
REVIEW AND RESULTS OF OPERATIONS
Overview
The Group has delivered all its stated FY16 targets, strategic, financial and operational. It delivered an underlying net profit after tax of $89.0 million, an increase of 63%. Assisted by the delivery of 182 new retirement units, the Group’s Retirement EBITDA contribution increased by 51% to $79.9 million.
The Group delivered on its FY16 targets of a return on retirement assets of 6.0% - 6.5%, underlying profit after tax of over $80 million and a full year distribution of 8 cents per security.
The return on retirement assets was 6.3%, a significant step towards achieving the Group’s FY18 target of a 7.5% - 8.0% return.
For the third successive, Retirement sales were a record, totalling 799 units in FY16, while the average DMF/CG amount per transaction increased 8% to $90,000. Portfolio turnover increased to 11.9% and was at the high end of the target range of 10% - 12%.

Aveo Group 2016 Directors’ Report (continued)
Page 5
At a strategic level, the acquisition of the remaining minority interest in RVG will give Aveo full operational and strategic control over more than 3,400 units across Sydney and Melbourne. The integration of the recent Freedom acquisition is progressing to schedule, with planning well progressed on expanding the Freedom product offering to existing Aveo villages.
RVG Transaction
The Group has today entered into an unconditional transaction to acquire the remaining 27% minority holding in RVG, with completion scheduled for 24 August 2016. The total acquisition cost of this minority holding of about $100 million (including transaction costs) reflects a purchase price of 25 cents per security, which represents a 13% discount to the RVG current security value.
This completes the progressive acquisition of RVG securityholder interests that began in May 2015 when the Group had only a 23% interest in RVG. The combination of all acquisitions since this date have been achieved at an overall discount of 17% to the relevant current security value.
The removal of all outside interests and consolidation of RVG significantly simplifies the Group’s portfolio structure. It allows the Group to take full control over the strategic and operational direction of the RVG villages and accelerate value-adding development and care initiatives across the portfolio.
Equity raising
The acquisition will be funded via a fully underwritten institutional placement of up to 37.1 million Securities (New Securities) to raise approximately $125 million. The institutional placement price will be determined via a variable price bookbuild with an underwritten floor price of $3.37 per New Security, representing a 2.6% discount to the closing price of $3.46 on 16 August 2016.
Funds raised in excess of the purchase price will be used to reduce debt drawn to fund the acquisition of previous stakes in RVG. Following the acquisition and the equity raising, Aveo’s pro-forma gearing as at 30 June 2016 will be reduced to 15%.
Financial results
Key financial headlines of the Group’s 30 June 2016 results are: statutory profit after tax increased 100% to a profit of $116.0 million; statutory earnings per Security increased 91% to 22.1 cents; underlying profit after tax1 of $89.0 million, up 63%; earnings per Security on underlying profit after tax increased 56% to 17.0 cents; a distribution of 8 cents per security, up 60%; net tangible assets per Security of $3.00; and gearing of 17.4%, up from 13.8%.
Underlying profit reflects statutory profit as adjusted to reflect the Directors’ assessment of the result for the ongoing 1.business activities of the Group, in accordance with AICD/Finsia principles of recording underlying profit. Underlying profit has not been audited.
The Group’s statutory profit after tax for the year ended 30 June 2016 was $116.0 million. A reconciliation of the Group’s statutory profit after tax to the income statement is:
2016 2015$m $m
Profit from continuing operations after income tax 117.6 60.3 Less: Other non-controlling interests (1.6) (2.3)
116.0 58.0 Net profit after tax attributable to stapled securityholders of the Group
Aveo Group 2016 Directors’ Report (continued)
Page 6
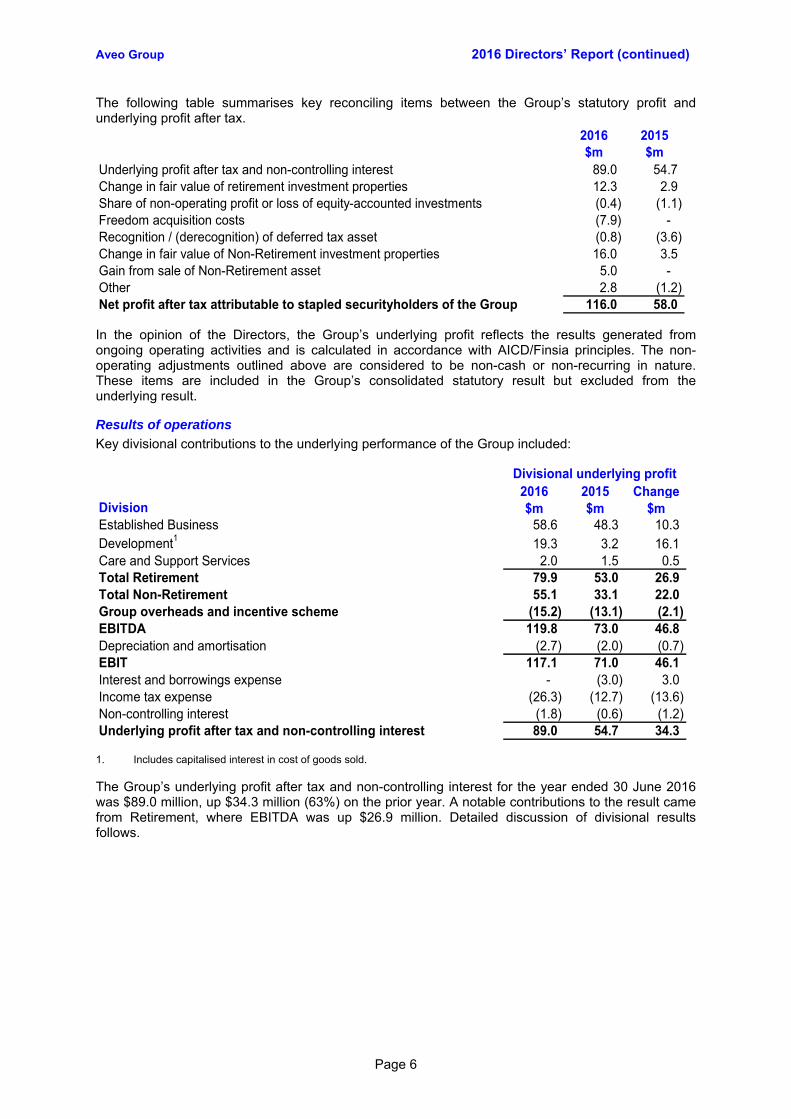
The following table summarises key reconciling items between the Group’s statutory profit and underlying profit after tax.
2016 2015$m $m
Underlying profit after tax and non-controlling interest 89.0 54.7 Change in fair value of retirement investment properties 12.3 2.9 Share of non-operating profit or loss of equity-accounted investments (0.4) (1.1) Freedom acquisition costs (7.9) - Recognition / (derecognition) of deferred tax asset (0.8) (3.6) Change in fair value of Non-Retirement investment properties 16.0 3.5 Gain from sale of Non-Retirement asset 5.0 - Other 2.8 (1.2)
116.0 58.0 Net profit after tax attributable to stapled securityholders of the Group
In the opinion of the Directors, the Group’s underlying profit reflects the results generated from ongoing operating activities and is calculated in accordance with AICD/Finsia principles. The non-operating adjustments outlined above are considered to be non-cash or non-recurring in nature. These items are included in the Group’s consolidated statutory result but excluded from the underlying result.
Results of operations
Key divisional contributions to the underlying performance of the Group included:
2016 2015 Change$m $m $m
Established Business 58.6 48.3 10.3 Development1 19.3 3.2 16.1 Care and Support Services 2.0 1.5 0.5 Total Retirement 79.9 53.0 26.9 Total Non-Retirement 55.1 33.1 22.0 Group overheads and incentive scheme (15.2) (13.1) (2.1) EBITDA 119.8 73.0 46.8 Depreciation and amortisation (2.7) (2.0) (0.7) EBIT 117.1 71.0 46.1 Interest and borrowings expense - (3.0) 3.0 Income tax expense (26.3) (12.7) (13.6) Non-controlling interest (1.8) (0.6) (1.2) Underlying profit after tax and non-controlling interest 89.0 54.7 34.3
Division
Divisional underlying profit
Includes capitalised interest in cost of goods sold. 1.
The Group’s underlying profit after tax and non-controlling interest for the year ended 30 June 2016 was $89.0 million, up $34.3 million (63%) on the prior year. A notable contributions to the result came from Retirement, where EBITDA was up $26.9 million. Detailed discussion of divisional results follows.

Aveo Group 2016 Directors’ Report (continued)
Page 7
Retirement
Retirement EBITDA for the year was $79.9 million, an increase of $26.9 million (51%) on the previous year, driven by improved results from all business units.
2016 2015 Change$m $m $m %
Revenue1
Established Business2 148.9 109.7 39.2 35.7 Development3 103.0 27.9 75.1 269.2 Care and Support Services4 12.3 12.2 0.1 0.8
264.2 149.8 114.4 76.4 EBITDAEstablished Business 58.6 48.3 10.3 21.3 Development 19.3 3.2 16.1 503.1 Care and Support Services 2.0 1.5 0.5 33.3
79.9 53.0 26.9 50.8
Sales volumes Number Number Number %Established Business 736 685 51 7.4 Development 63 36 27 75.0
799 721 78 10.8 Total value of units transacted $220.7m $200.7m $20.0m 10.0
Includes new and buyback sales and share of equity-accounted profits. These items are not included in revenue in the 1.Income Statement, but in other line items.
Includes deferred management fee and capital gains, administration fees and other income relating to the existing 2.business, and share of profits from equity-accounted investments.
Includes new sales income. Development profits are accounted for in the change in fair value of retirement investment 3.property.
Includes aged care and other support income. 4.
Retirement increased its total EBITDA by 51% to $79.9 million, with EBITDA increasing across all business units. It achieved a record total sales volume of 799 units.
The Established Business results were driven by a combination of higher volumes and higher sales prices, whilst the Development result was driven by delivery of a record number of 182 new retirement units.
The increase in Care and Support EBITDA was assisted by an improved performance across the existing aged care facilities.

Aveo Group 2016 Directors’ Report (continued)
Page 8
Established Business
2016 2015$m $m $m %
RevenueDMF/CGResales 55.5 50.9 4.6 9.0 Buyback purchases 12.5 6.2 6.3 101.6
68.0 57.1 10.9 19.1 Other revenueBuyback sales 43.3 23.4 19.9 85.0 RVG1 22.3 17.3 5.0 28.9 Resident commissions 7.2 7.3 (0.1) (1.4) Village administration fees 5.5 4.3 1.2 27.9 Other 2.6 0.3 2.3 766.7
80.9 52.6 28.3 53.8 148.9 109.7 39.2 35.7
EBITDANet DMF/CG 57.0 52.1 4.9 9.4 Net other 1.6 (3.8) 5.4 (142.1)
58.6 48.3 10.3 21.3
Change
Improved EBITDA was mainly due to increased DMF/CG revenue and a higher contribution from RVG.
Net DMF/CG increase was supported by an increase in both volumes and transaction pricing levels.
Higher levels of buyback sales allowed a substantial reinvestment into new buyback purchases and unit refurbishments.
The combination of improved underlying asset performance and a higher ownership interest in RVG resulted in an increase in Other revenue and Net other profit contribution
Established Business sales and margins
2016 2015Number Number Number %
Sales volumesResales 605 602 3 0.5 Buyback sales 131 83 48 57.8
736 685 51 7.4 Buyback purchases 152 90 62 68.9 DMF generating transactions 757 692 65 9.4 Redevelopment buyback purchases 68 17 51 300.0 Deposits on hand 83 96 (13) (13.5) Average DMF/CG transaction price point $287k $267k $20k 7.5 Average DMF/CG per transaction $90k $83k $7k 8.4 DMF/CG margin per transaction 31% 31% 0%Portfolio turnover 11.9% 11.0% 1%Occupancy 92% 96% -4%
Change
The Established Business achieved a strong lift in total sales volumes to 736 units.
Buyback sales and buyback purchases remain broadly in line as capital is recycled into the business to continually upgrade units.
A focus on maximising potential unit price growth has resulted in increases in both average DMF/CG transaction price point and average DMF/CG per transaction.

Aveo Group 2016 Directors’ Report (continued)
Page 9
Improved portfolio turnover assisted by the shorter average stay of Freedom residents
The drop in occupancy was due to a large amount of vacant company owned stock held by Freedom upon acquisition.
New residents continue to enter villages under the Aveo Way contract, which now has an established record of market acceptance
Development
Amount %Revenue $103.0m $27.9m $75.1m 269.2 Gross profit (after capitalised interest) $22.3m $4.5m $17.8m 395.6 EBITDA $19.3m $3.2m $16.1m 503.1 Average margin
before capitalised interest 23% 20% 3%after capitalised interest 22% 16% 6%
Units delivered 182 62 120 193.5 Units sold 63 36 27 75.0 Number of major projects under development 6 6 - -
2016 2015 Change
Retirement Development achieved its target of delivering a record number of 182 new units, across six different villages.
Its EBITDA was assisted by development margins exceeding the target margin rates of 16%-20% (before funding costs).
The timing skew to the final quarter of FY16 for the delivery of newly developed units resulted in the discrepancy between units delivered and units sold. Sell down rates of available delivered units into the beginning of FY17 are proceeding as expected.
Construction programs for the delivery of 301 units in FY17 are proceeding as scheduled. This includes 70 minor development units, relating to the reconfiguration and redevelopment of Freedom villages, to allow the continued roll out of the Freedom product.
Delivery timelines will be similar to FY16, with the majority of new product scheduled for completion in the second half of FY17.
Village FY17 units
Expected completion Development status
Clayfield 65 Q4 Basement complete and ground floor being poured Durack 34 Q2 Practical completion on target to deliver in first half FY17 Island Point 10 Q4 Builder has been contracted and remains on schedule Mingarra 24 Q4 Civil works have commenced and currently assessing builder tenders Peregian 32 Q3 Builder has been contracted and remains on schedule Springfield 66 Q4 Builder has been contracted and remains on schedule 231 Minor 70 Will be delivered progressively through the year 301
The Group’s retirement unit development pipeline has further increased to 5,621 units (excluding minor development). Major sites include Springfield (2,372 units), Southern Gateway (441 units) and the Carindale redevelopment (416 units).

Aveo Group 2016 Directors’ Report (continued)
Page 10
Care and Support Services
2016 2015$m $m $m %
RevenueAged care 10.7 10.8 (0.1) (0.9) Allied health 0.2 0.3 (0.1) (33.3) Other 1.4 1.1 0.3 27.3
12.3 12.2 0.1 0.8 EBITDAAged care 1.7 1.3 0.4 30.8 Allied health 0.2 0.3 (0.1) (33.3) Other 0.1 (0.1) 0.2 (200.0)
2.0 1.5 0.5 33.3
Change
Care and Support’s EBITDA continues to primarily relate to the existing aged care facilities.
The focus on building out the Group’s care and support services is being strategically realigned followed the acquisition of the Freedom portfolio in FY16. This means an adjustment to the expected financial contribution of these services. Following that acquisition, expansion of these services will increasingly focus on Freedom’s business model of delivering direct care on a not-for-profit basis, whilst receiving a relatively higher DMF/CG amount.
This will mean lower Care and Support growth, but higher growth in the Established Business (where the increased DMF/CG is recognised).
Increases in Care and Support EBITDA over the medium term will be driven by the delivery of new aged care facilities and expansion of services such as food and allied health.
The aged care facility development pipeline stands at 1,057 beds. The Group is targeting the delivery of at least one bed aged care facility every year from FY17 onwards.
Non-Retirement
Amount %Sales revenue $277.7m $191.2m $86.5m 45.2 Rental income $14.0m $11.2m $2.8m 25.0 Total revenue $291.7m $202.4m $89.3m 44.1 EBITDA $55.1m $33.1m $22.0m 66.5 Gross profit $54.5m $35.1m $19.4m 55.3 Land lot sales 648 508 140 27.6 Built product sales 283 41 242 590.2 Average margin 20% 18% 2%Contracts on hand 646 762 (116) (15.2) Investment properties held 2 2 - -
2016 2015 Change
Non-Retirement EBITDA has substantially increased due to improved sales across both land and built product. Land lot sales were up 28% to 648 and continued to maintain an average margin of 24%.
Built product sales have been boosted by completion of The Milton apartments with 280 units being sold in FY16 and only 12 units remaining. The sell down of The Milton will complete the Group’s exit from the residential apartment market.
The Group’s Gasometer 1 office and retail investment property at Newstead, Brisbane, has been revalued from $122.3 million at 30 June 2015 to $150.0 million at 30 June 2016. The increase is not included in FY16’s underlying profit of $89.0 million, but is included in statutory profit of $116.0 million.

Aveo Group 2016 Directors’ Report (continued)
Page 11
Other
Gross interest expense declined by $11.4 million, reflecting lower average rates, due to the lower cost of a new finance facility and the termination of interest rate swaps. In addition, reduced interest capitalisation, mainly on lower Non-Retirement development activity, saw net interest expense decline by $3.0 million.
The increase in income tax expense was primarily due to the increase in profit before tax.
Capital management
Capital management metrics
30 June 2016 30 June 2015 Gearing1 17.4% 13.8% Net debt drawn2 $431.3m $280.1m Gross interest bearing liabilities $461.5m $359.0m Undrawn committed lines3 $163.0m $144.5m Available facilities $163.0m $109.1m Weighted average borrowing cost 3.4% 4.0% Weighted average debt maturity 1.7 years 2.2 years
Measured as net debt divided by total assets net of cash and resident loans. 1. Net debt is after deducting the Milton joint venture partner’s share of project debt. 2. Undrawn facilities are dependent upon having sufficient security. 3.
The Group’s syndicated finance facility limit increased by $270m to $520m encompassing the Gasometer refinance, the Freedom acquisition and RVG securities purchases.
Debt remains unhedged, whilst funding cost movements have reduced the weighted average cost of debt to 3.4%.
Pro-forma gearing after the RVG acquisition is 15%, at the mid-point of the target gearing range of 10% - 20%.
Risk
There are a number of risks that could affect the Group’s ability to achieve its staged goals of returns on retirement assets of 7.5% - 8.0% by FY18. These include:
A downturn in the Australian property market could reduce growth in average transaction price points and consequently average DMF/CGs. This risk is partly mitigated by the Group’s introduction of the improved Aveo Way contract terms.
Such a downturn could also reduce the Groups’ ability to sell its retirement and non-retirement developments. This risk could be partly mitigated by the Group reducing the rate of development.
Development margins could be affected by construction delays and cost increases. Wherever possible, the Group controls this risk through fixed price contracts and by including early completion bonuses and/or late completion penalties in its construction contracts. The Group also carefully monitors development progress through regular management review.
The Group may experience difficulties in integrating Freedom, and on executing on its strategy to improve revenue from the Established Business by expanding the Freedom product offering to existing Aveo villages.
The Group may experience difficulties in executing on its strategy to improve revenue from Care and Support Services. The Group is working hard to expand its capacity in this area.

Aveo Group 2016 Directors’ Report (continued)
Page 12
Outlook
The Established Business’ strong sales rates have continued into FY17, whilst the Freedom villages continue to perform in line with acquisition expectations. This sales performance is providing additional scope for unit price increases.
Retirement Development has a pipeline of 301 new units scheduled for delivery in FY17. Planning well advanced on projects scheduled for FY18 delivery. The sell down of new units is progressing well.
In Care and Support, the expansion of the Freedom supported living offering to selected Aveo and RVG serviced apartment villages will contribute positively to second half earnings. Completion of a new Durack 123 bed aged care facility is scheduled for late FY17.
The Group is providing FY17 guidance of: Underlying EPS of 18.3 cents, an increase of 7.6% on FY16 underlying EPS of 17.0 cents; Statutory EPS growth of 7.5% from FY17 to FY18; and A full year FY17 distribution of 9 cents per Security, up from 8 cents per Security in FY16.
STATE OF AFFAIRS
There have been no material changes in the state of the Group’s affairs since the date of the last report, other than as disclosed in this report and the accompanying financial statements.
DIVIDENDS AND DISTRIBUTIONS
Distributions paid or declared by the Group to securityholders since the end of the previous financial year were:
Total amount
$mFinal 2015 5.0 25.8 30 September 2015Final 2016 8.0 43.5 30 September 2016
Cents per
security Date of paymentDistribution
The distribution is 49% of underlying profit after tax and 35% of adjusted funds from operations. The distribution is in line with the Group’s policy of distributing between 40% and 60% of underlying profit after tax.
ENVIRONMENTAL REGULATION
The Group undertakes property development in various states in Australia. It is subject to legislation regulating development. Consents, approvals and licences are generally required for all developments, and it is usual for them to be granted subject to conditions. The Group complies with these requirements by ensuring that all necessary consents, approvals and licences are obtained prior to any project being commenced, and consents, approvals and licences are implemented in order to ensure compliance with conditions. To the best of the Directors’ knowledge, all projects are being, and have been, undertaken in compliance with these requirements.
LIKELY DEVELOPMENTS AND EXPECTED RESULTS OF OPERATIONS
Commentary on likely developments and expected results of operations of the Group are included in this report under Review and Results of Operations.
Further information on likely developments in the operations of the Group and the expected results of operations have not been included in this report because the Directors believe it would be likely to result in an unreasonable prejudice to the Group.
REMUNERATION REPORT
The Remuneration Report set out on pages 16 to 30 provides details of the remuneration and equity holdings of the Directors and Key Management Personnel, including details of options issued or exercised during the financial year, or outstanding at the date of this report, and forms part of the Directors’ Report.

Aveo Group 2016 Directors’ Report (continued)
Page 13
SIGNIFICANT EVENTS AFTER THE BALANCE DATE
No matters or circumstances have arisen since the end of the financial year and up until the date of this report, which significantly affect or may significantly affect the operations of the Group, the results of those operations, or the state of affairs of the Group in subsequent years.
INDEMNIFICATION AND INSURANCE OF OFFICERS AND AUDITOR
Indemnification
Pursuant to the Constitutions of the Parent and the Responsible Entity, all Directors and Company Secretaries (Officers), past and present, have been indemnified against all liabilities allowed under the law. The Parent and the Responsible Entity have also entered into agreements with each of the Directors and Officers to indemnify them against all liabilities to another person that may arise from their positions as officeholders of the Group to the extent permitted by law. The agreements stipulate that the Parent and the Responsible Entity will meet the full amount of any such liabilities, including reasonable legal costs and expenses.
To the extent permitted by law, the Parent and the Responsible Entity have agreed to indemnify their auditor, Ernst & Young, as part of the terms of its audit engagement agreement against claims by third parties arising from the audit (for an unspecified amount). No payment has been made to indemnify Ernst & Young during or since the financial year.
Insurance premiums
During the financial year, the Group paid premiums in respect of Directors and Officers’ liability insurance contracts, for the current and former Directors and Officers, including executive officers and secretaries of the Group.
Under the terms of the insurance contracts, disclosure of the extent of the cover and the amount of the premium is prohibited by a confidentiality clause.
NON-AUDIT SERVICES
The Board has considered the services provided during the year by the external auditor and, in accordance with advice provided by the Audit Committee, is satisfied that the provision of those services during the year is compatible with, and did not compromise, the auditor independence requirements of the Act for the following reasons:
all non-audit services were subject to the corporate governance procedures adopted by the Group and have been reviewed by the Audit Committee to ensure that they do not impact the integrity and objectivity of the external auditor; and
the non-audit services provided do not undermine the general principles relating to auditor independence as set out in the Code of Conduct APES 110 Code of Ethics for Professional Accountants issued by the Accounting Professional and Ethical Standards Board, as they did not involve reviewing or auditing the external auditor’s own work, acting in a management capacity for the Group, acting as an advocate for the Group or jointly sharing risks or rewards.
Details of amounts paid or payable by the Group for non-audit services provided during the year are given in note 29 to the financial statements.

Aveo Group 2016 Directors’ Report (continued)
Page 14
EXTENSION OF ELIGIBILITY TERM OF AUDIT PARTNER
In accordance with section 324DAA of the Act, and in accordance with a recommendation of the Audit and Risk Committee, on 14 August 2014, the Directors granted approval for the Group’s audit partner to play a significant role in the audit of the Group for a further two successive financial years in addition to the his original five successive financial years, such that his term will expire on 30 June 2017.
The Directors noted that the Committee was satisfied that the extension would maintain the quality of the audit and would not give rise to any conflicts of interest for the following reasons:
the existing audit effectiveness protocols within the Committee’s charter are sufficient to ensure that auditor independence would not be diminished by such an extension;
extending the engagement period of the incumbent audit partner would ensure the preservation of knowledge throughout the current transitional period of the Group as it moves towards becoming a pure play-retirement operator; and
the Directors of the Group have the option to reassess the auditor appointment at any time.
AUDITOR’S INDEPENDENCE DECLARATION UNDER SECTION 307C OF THE ACT
We confirm that we have obtained the Auditor’s Independence Declaration, which is set out on page 15.
ROUNDING
The Group is an entity of a kind referred to in ASIC Corporations (Rounding in Financial/Directors’ Reports) Instrument 2016/191 and, in accordance amounts in the Financial Report and the Directors’ Report are rounded to the nearest hundred thousand dollars, unless otherwise stated.
Signed in accordance with a resolution of the Directors:
S H Lee Chairman
G E Grady Executive Director and Chief Executive Officer
Sydney 17 August 2016

A member firm of Ernst & Young Global Limited Liability limited by a scheme approved under Professional Standards Legislation
Page 15
Ernst & Young 200 George Street Sydney NSW 2000 Australia GPO Box 2646 Sydney NSW 2001
Tel: +61 2 9248 5555 Fax: +61 2 9248 5959 ey.com/au
Auditor’s Independence Declaration to the Directors of Aveo Group Limited and the Directors of Aveo Funds Management Limited as Responsible Entity for Aveo Group Trust As lead auditor for the audit of Aveo Group and Aveo Group Trust for the financial year ended 30 June 2016, I declare to the best of my knowledge and belief, there have been:
a) no contraventions of the auditor independence requirements of the Corporations Act 2001 in relation to the audit; and
b) no contraventions of any applicable code of professional conduct in relation to the audit. This declaration is in respect of Aveo Group and the entities it controlled and Aveo Group Trust and the entities it controlled during the financial year.
Ernst & Young
Douglas Bain Partner 17 August 2016

Aveo Group 2016 Remuneration Report
Page 16
1. INTRODUCTION
The Nomination and Remuneration Committee is pleased to provide the Aveo Group’s Remuneration Report for the year ended 30 June 2016, which has been audited in accordance with section 308(3C) of the Act.
The Committee’s primary objective is to provide a remuneration structure that attracts, retains and motivates staff, reflects Aveo’s strategic goals, is aligned with securityholder interests, and addresses current market and stakeholder views.
The meaning of defined terms is given in the Dictionary at page 97, which forms part of this report.
1.1 Key Management Personnel defined
The table below shows the name, position and period of employment or directorship for each KMP whose remuneration is disclosed in this report.
Name Position KMP 2016 KMP 2015 Non-Executive Directors S H Lee Non-Executive Chairman Full year Full year J E F Frayne Non-Executive Director Full year Full year E L Lee Non-Executive Director Full year Full year W L McDonald Non-Executive Director Full year Full year L R McKinnon Non-Executive Director Full year Full year S B Muggleton Non-Executive Director Full year Full year W Chow Non-Executive Alternate Director (for S H Lee
and E L Lee) Full year Full year
Executive Director
G E Grady Executive Director and Chief Executive Officer Full year Full year Other Key Management Personnel D A Hunt Chief Financial Officer Full year Full year 1.2 Actual remuneration received in 2016
The following table provides a summary of remuneration received by KMP (excluding NEDs), for FY16. The figures below are the amounts that each individual received in cash and not the amounts calculated in accordance with Australian Accounting Standards. They contain no allowance for annual or long service leave accrual, nor the STID and Rights expense required to be recognised by Accounting Standard AASB 2 Share-Based Payment. Consequently, the figures below may not correspond to those in later sections of this report. Specific details of the 2016 remuneration received by these executives, prepared in accordance with the statutory obligations and accounting standards, are provided on page 30.
Fixed annual
remuneration1 STI2 STID3 LTI Other4
Total actual 2016
remuneration$ $ $ $ $ $
G E Grady 725,000 264,815 268,026 - 5,092 1,262,933 D A Hunt 544,000 168,000 213,922 - 9,669 935,591
Fixed annual remuneration includes superannuation benefits together with salary-packaged benefits calculated on a 1.‘cost to Aveo’ basis, grossed up for fringe benefits tax payable.
Reflects FY15 STI paid in cash during the year. 2. Reflects FY14 STID that vested during the year, measured at the Group’s closing security price at the date of vesting. 3. Includes fringe benefits that are not salary-packaged. 4.

Aveo Group 2016 Remuneration Report (continued)
Page 17
2. REMUNERATION FRAMEWORK
2.1 Remuneration governance
The Board has established a Nomination and Remuneration Committee, which is responsible for determining and reviewing remuneration arrangements for Directors and other KMP. The members of the Committee during the year and as at 30 June 2016 are: W L McDonald (Chairman); J E F Frayne; and S H Lee
The Committee is responsible for:
providing recommendations to the Board with respect to the necessary and desirable competencies of the Board, the appointment, election and re-election of Directors and reviewing Board succession plans to ensure that the Board has the necessary guidance to facilitate appointments to the Board without disruption; and
ensuring that the remuneration levels for the Group are set at appropriate levels to ensure that the Group has access to the skills and capabilities it needs to operate successfully.
2.2 Remuneration policy
The Group’s remuneration policy is to ensure that remuneration packages properly reflect the person’s duties and responsibilities and that the remuneration is competitive in attracting, retaining and motivating people of the highest quality.
The structure of remuneration, as explained below, is designed to attract suitably qualified candidates, reward the achievement of strategic objectives, and achieve the broader outcome of long-term value creation for securityholders. The remuneration structures take into account a range of factors, including the following: the capability, skills and experience of the KMP; the ability of KMP to impact achievement of the strategic objectives of the Group; the performance of the KMP in their roles; the Group’s overall performance; the remuneration levels being paid by competitors for similar positions; and the need to ensure continuity of executive talent and smooth succession planning.
In assessing the performance of an executive, regard is given to a mix of quantitative and qualitative factors in addition to the Group’s immediate underlying profit performance. The nature of the Group’s activities is such that decisions are constantly being taken that may not generate profit for several years. Examples include the acquisition of land for future development, the process of development itself, and the upgrading of systems and procedures. The likelihood of success of such longer-term projects is considered in establishing measures of executive performance for remuneration purposes.
2.3 Voting and comments made at the Group’s 2015 Annual General Meeting
The remuneration report for FY15 was approved at the Group’s 2015 Annual General Meeting with more than 99% of votes cast in favour. There were no specific comments made on the report at that meeting.
2.4 External advisers
No remuneration consultant made any remuneration recommendation as defined in the Act in relation to any of the KMP for FY16.

Aveo Group 2016 Remuneration Report (continued)
Page 18
3. LINK BETWEEN REMUNERATION AND PERFORMANCE
Profit, EPS and other key financial performance measures over the last five years for the Group are set out below.
2016 2015 2014 2013 2012Net profit/(loss) ($m) 116.0 58.0 26.1 (166.5) (350.3) Underlying profit after tax ($m)1,2,3 89.0 54.7 42.1 39.2 41.3 EPS (cents)4
Statutory 22.1 11.6 5.9 (52.4) (204.7) Underlying 17.0 10.9 9.5 13.6 24.1
Dividends/distributions ($m) 43.5 25.8 20.0 3.2 33.7 DPS - ordinary (cents)4 8.0 5.0 4.0 1.0 19.6 Securities Price at year end ($)4 3.17 2.58 2.06 1.27 2.66 Price / earnings ratio5 18.6 23.7 21.7 9.3 11.0 Market capitalisation ($m) 1,715.3 1,326.7 1,030.2 408.4 460.6
Underlying profit reflects statutory profit as adjusted to reflect the Directors’ assessment of the result for the ongoing 1.business activities of the Group, in accordance with AICD/Finsia principles of recording underlying profit.
Underlying profit for the 2012 financial year, but not the 2011 and earlier financial years, has been restated to reflect the 2.Group’s 2012 decision to change the reporting of underlying profit, so that the entire impact of the revaluation of retirement investment properties is classified as non-operating.
A reconciliation of UPT for the Group to statutory profit after tax for the 2016 and 2015 financial years is given in the 3.Directors’ Report at page 6.
Reported earnings per security, dividends and distributions per security and security price at year-end for the 2012 4.financial year has been adjusted to reflect the seven-for-one stapled security consolidation made on 13 December 2012.
Based on underlying profit after tax. 5.
Remuneration component
Link to Group performance
Fixed remuneration
Fixed remuneration is not linked to Group performance. It is set with reference to the individual’s role, responsibilities and performance and remuneration levels for similar positions in the market.
Variable remuneration
The current CEO was appointed on 1 July 2013, as the Group was finalising its strategy to focus on its retirement business. In February 2014, the Group publicly committed to the key financial goal of that strategy, being to lift ROA to 6.0% - 6.5% by FY16 and 7.5% - 8.0% by FY18. The targets for variable remuneration, comprising STI, LTI and Retention Rights, are chosen to align KMP performance with achievement of this key financial goal.
STI STIs are awarded to individuals based on achievement of financial and other targets in individual balanced scorecards, subject to the Group’s profitability and ability to pay STI awards. The Board maintains the right to adjust downwards the aggregate pool available to fund STIs if the Group’s actual UPT is below target. More information on UPT is given below.

Aveo Group 2016 Remuneration Report (continued)
Page 19
Remuneration component
Link to Group performance
LTI Equity-based executive remuneration is provided by the issue of Rights.
Vesting of Performance Rights is subject to three-year performance hurdles including aggregate UPT and RTSR. Both these measures reflect the Group’s performance as measured by the key financial performance measures shown above. More information on UPT is given below.
RTSR is deemed appropriate because: it helps to align KMP rewards with securityholder returns; and the effects of market cycles are minimised because it measures the Group’s
performance relative to its peers, which are presently considered to be the members of the S&P/ASX 300 A-REIT Index.
Vesting of Retention Rights is subject to performance hurdles including ROA and ROE. Both these measures reflect the Group’s long-term retirement strategy announced in the prior year and appropriately align the outcomes of this strategy with the financial interests of its securityholders.
Further details of the Rights are given in section 5.6. UPT is deemed an appropriate performance measure for the granting of STIs and LTIs to senior executives given that it is the key target hurdle referenced by the Board in preparing its annual budgets and measuring Group performance. UPT reflects the Directors’ assessment of the result for the ongoing business activities of the Group by excluding non-cash, one-off market related items that are usually out of management’s control. The annual UPT target is determined by the Board having regard to the Group’s annual budget. The target could be higher or lower than budget, and is adjusted for the effect of material equity issues. If the Board decides it is appropriate to provide profit guidance to the market for the forthcoming financial year at the time of release of the Group’s results for the previous financial year, the UPT target is at least as high as this guidance. The UPT target is adjusted for the effect of security issues and material buybacks, so that UPT per security is unchanged.
Historical actual and target UPT was:
2016 2015 2014 2013 2012$m $m $m $m $m
Actual1 89.0 54.7 42.1 94.7 41.3 Target1,2 85.9 50.5 37.8 36.8 100.4
Underlying profit for the 2012 and earlier financial years has not been restated to reflect the Group’s 2012 decision to 1.change the reporting of underlying profit, so that the entire impact of the revaluation of retirement investment properties is classified as non-operating.
The UPT target for FY16 was increased from the original target of $84.6 million to $85.9 million to reflect the issue of 2.securities in connection with the acquisition of Freedom.
4. REMUNERATION OF NON-EXECUTIVE DIRECTORS
4.1 Directors’ fees
In 2006, securityholders resolved that the maximum aggregate fee pool available to NEDs be increased to $650,000 per year, excluding retirement benefits.
Mr S H Lee receives a fee of $176,000 as Non-Executive Chairman. All other Directors receive a fee of $85,000 per annum inclusive of superannuation. These fees cover all main Board activities. Additionally, the Chairman of the Audit Committee receives $12,000 per annum and the other members of the Audit Committee, Messrs E Lee and Frayne, receive $2,000 per annum. No additional fees are paid to members of the Nomination and Remuneration Committee. From 1 July 2016, fees for the Nomination and Remuneration committee members will match those for the Audit Committee members.

Aveo Group 2016 Remuneration Report (continued)
Page 20
4.2 Retirement benefits
The Group does not provide any retirement benefits scheme for the NEDs.
4.3 Performance-based remuneration
NEDs do not receive any performance-based remuneration.
4.4 Equity-based remuneration
The Group’s DSP was approved at the 2002 Annual General Meeting (AGM) and amended at the 2003 and 2004 AGMs. Under the DSP, eligible NEDs can elect to receive their Directors’ fees by way of securities in the Group, in lieu of cash, after taking into account any fringe benefits tax payable by the Group. Securities allocated under the DSP can either be issued by the Group or purchased on-market. This plan continues to operate; however, no Directors to date have elected to receive their Directors’ fees by way of securities in the Group.
5. REMUNERATION OF OTHER KMP
5.1 Fixed remuneration
Fixed remuneration consists of base remuneration (which is calculated on a total cost basis and includes salary packaged benefits grossed up for fringe benefits tax payable including motor vehicles, car parking and other specified benefits), as well as employer contributions to superannuation funds.
The Committee reviews remuneration levels periodically.
The total fixed remuneration of the CEO and the CFO is set annually based on role specifications, responsibilities, performance and comparative data for the members of the S&P/ASX 300 A-REIT Index (having regard to relative size).
The TFR for the CFO from 1 July 2016 has been set at $590,000. The TFR for the CEO is unchanged from 1 July 2016, but his remuneration mix was amended by increasing the proportion of at risk remuneration. Mr Grady’s target mix from 1 July 2016 has been set at 40% for TFR and 60% for at risk remuneration, the latter divided equally between the three components of at risk remuneration
These changes were determined taking into account comparative remuneration and the Group’s, and their individual, strong performance over the last two years.
5.2 Termination provisions
The following table provides details of the termination provisions for the KMP (excluding NEDs) identified in this report. Contracts are open-ended in nature rather than being fixed term.
Name Position Notice period
Payment in lieu of notice
Treatment of STI on termination
Treatment of LTI on termination
G E Grady Chief Executive Officer
6 months 6 months Board discretion
Board discretion1
D A Hunt Chief Financial Officer
6 months 6 months Board discretion
Board discretion1
See section 5.6. 1.
Aveo Group 2016 Remuneration Report (continued)
Page 21
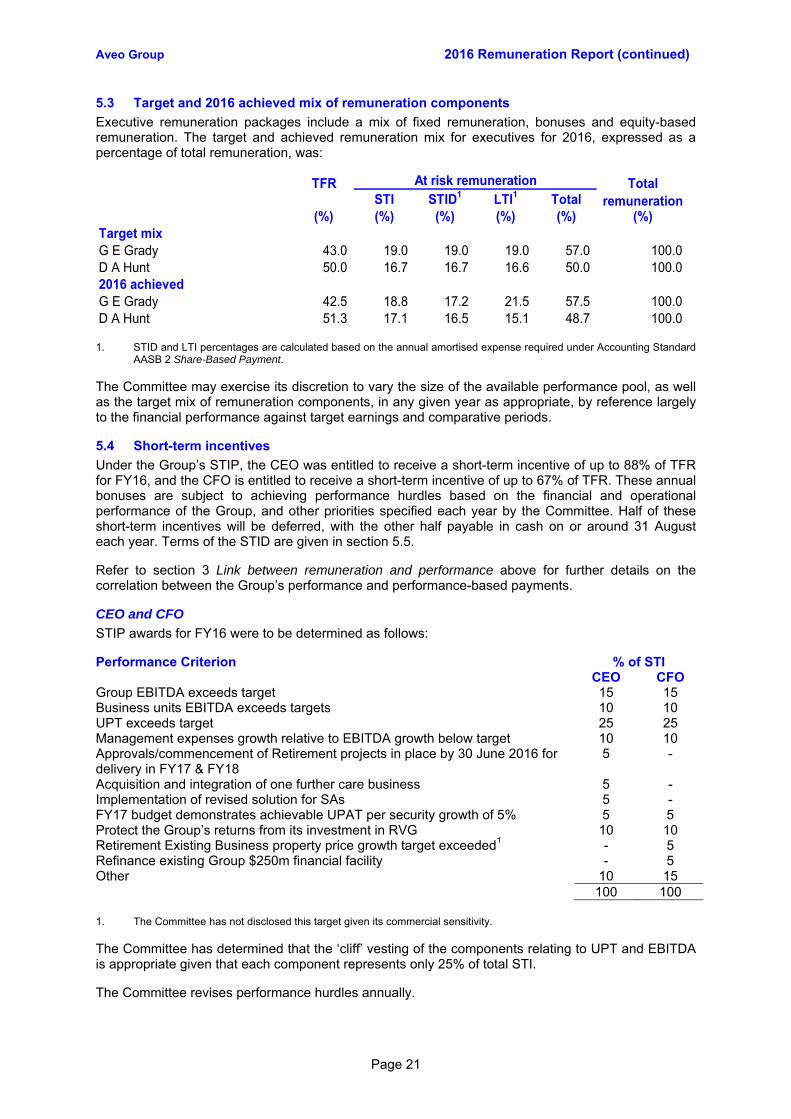
5.3 Target and 2016 achieved mix of remuneration components
Executive remuneration packages include a mix of fixed remuneration, bonuses and equity-based remuneration. The target and achieved remuneration mix for executives for 2016, expressed as a percentage of total remuneration, was:
At risk remunerationSTI STID1 LTI1 Total
(%) (%) (%) (%) (%) (%)Target mixG E Grady 43.0 19.0 19.0 19.0 57.0 100.0 D A Hunt 50.0 16.7 16.7 16.6 50.0 100.0 2016 achievedG E Grady 42.5 18.8 17.2 21.5 57.5 100.0 D A Hunt 51.3 17.1 16.5 15.1 48.7 100.0
Total remuneration
TFR
STID and LTI percentages are calculated based on the annual amortised expense required under Accounting Standard 1.AASB 2 Share-Based Payment.
The Committee may exercise its discretion to vary the size of the available performance pool, as well as the target mix of remuneration components, in any given year as appropriate, by reference largely to the financial performance against target earnings and comparative periods.
5.4 Short-term incentives
Under the Group’s STIP, the CEO was entitled to receive a short-term incentive of up to 88% of TFR for FY16, and the CFO is entitled to receive a short-term incentive of up to 67% of TFR. These annual bonuses are subject to achieving performance hurdles based on the financial and operational performance of the Group, and other priorities specified each year by the Committee. Half of these short-term incentives will be deferred, with the other half payable in cash on or around 31 August each year. Terms of the STID are given in section 5.5.
Refer to section 3 Link between remuneration and performance above for further details on the correlation between the Group’s performance and performance-based payments.
CEO and CFO
STIP awards for FY16 were to be determined as follows:
Performance Criterion % of STI CEO CFO Group EBITDA exceeds target 15 15 Business units EBITDA exceeds targets 10 10 UPT exceeds target 25 25 Management expenses growth relative to EBITDA growth below target 10 10 Approvals/commencement of Retirement projects in place by 30 June 2016 for delivery in FY17 & FY18
5 -
Acquisition and integration of one further care business 5 - Implementation of revised solution for SAs 5 - FY17 budget demonstrates achievable UPAT per security growth of 5% 5 5 Protect the Group’s returns from its investment in RVG 10 10 Retirement Existing Business property price growth target exceeded1 - 5 Refinance existing Group $250m financial facility - 5 Other 10 15 100 100
The Committee has not disclosed this target given its commercial sensitivity. 1.
The Committee has determined that the ‘cliff’ vesting of the components relating to UPT and EBITDA is appropriate given that each component represents only 25% of total STI.
The Committee revises performance hurdles annually.

Aveo Group 2016 Remuneration Report (continued)
Page 22
Financial targets and actual results for 2016 were:
Measure Actual Target$m $m
Group EBITDA 119.8 118.0 YesBusiness units EBITDA:
Retirement 79.9 78.8 YesNon-Retirement 55.1 54.9 YesNon-allocated overhead - (10.7) Yes
UPT 89.0 85.9 Yes
Target Met or Exceeded
The Committee has assessed the performance of these KMP against their various performance hurdles, determined that all performance criteria were satisfied, and awarded STIs, as follows:
` UPTGroup
EBITDA
Other Performance
Hurdles Total STI Total STI STI Cash
STIDFaceValue
STIDNumber of
% % % % $ $ $ Securities1
G E Grady 25 25 50 100 640,698 320,349 320,349 101,056 D A Hunt 25 25 50 100 362,667 181,334 181,333 57,203
The number of STID Securities was calculated as the STID face value divided by the Group’s Securities Price at 30 1.June 2016.
5.5 Deferred short-term incentives
The STID is payable in Securities, which may be sourced either by a new issue or by buying on-market. The Securities will vest on 1 September of the following year, providing only that the executive remains in employment until 30 June of the year following the award. The executive is entitled to dividends and distributions declared during the vesting period.
The CEO’s STID is subject to ratification by securityholders. If the award is not so ratified, it is payable in cash on the Vesting Date.
Where Special Circumstances apply, or the KMP ceases employment and is a Good Leaver, the Board may in its absolute discretion vest any STID Securities issued to the KMP.
In broad terms, if a Change of Control Event occurs, STID Securities will vest immediately.
Details of STID Securities provided as remuneration to KMP during FY16 in relation to FY14, or to be provided during FY17 in relation to FY15, are:
NamePer security Total
G E Grady 12 Nov 14 1 Sep 15 99,638 $2.09 $208,243G E Grady 17 Nov 15 1 Sep 16 102,641 $2.97 $304,844D A Hunt 13 Aug 14 1 Sep 15 79,525 $2.07 $164,616D A Hunt 21 Jul 15 1 Sep 16 65,116 $2.71 $176,464
Date of grant Vesting Date Number
granted1Value at grant date
The number granted was determined by dividing the STID face value by the Group’s Securities Price at the end of the 1.relevant financial year.
5.6 Long-term incentives
The LTIP is designed to align remuneration with the creation of securityholder value over the long-term. Participation in the Plan is at the Board’s discretion and no individual has a contractual right to participate in the Plan. No amount is payable for a Right granted under the Plan or on the exercise of a Right.

Aveo Group 2016 Remuneration Report (continued)
Page 23
The number of Performance Rights granted is determined by firstly calculating a face value, being the KMP’s target total remuneration times the KMP’s target LTI remuneration (as a percentage of total remuneration). Previously, the number of Rights granted was then calculated as that face value divided by the Group’s Securities Price on the day that the Committee approves the grant. From 1 July 2014, face value is divided by the Securities Price on the 30 June preceding the day that the Committee approves the grant.
Performance Rights vest after three years subject to performance conditions. For grants made in FY14, FY15 and FY16, the Board imposed two performance conditions, relating to RTSR and UPT. The link between these measures and performance is discussed at section 3 above.
Up to half of Performance Rights granted will vest depending on the level reached by RTSR at the end of the RTSR three-year testing period as follows:
RTSR Proportion of Rights that may be exercised
Less than the 50th percentile Nil 50th percentile or more but less than or equal to 75th percentile
25%
Higher than 75th percentile 50%
For grants made up to 30 June 2015, there will be no pro-rata vesting of Rights between the 50th and 75th percentiles. For grants made after that date, pro-rata vesting will apply.
The remaining Performance Rights granted will vest if the aggregate UPT for the three-year UPT testing period equals or exceeds the aggregate target UPT for that period. There is no pro-rata vesting of Performance Rights under this condition. The Committee considers that this ‘cliff’ vesting is appropriate since the target is cumulative, so that shortfalls against target in one year may be made up in the following year.
Where Special Circumstances apply, or the KMP ceases employment and is a Good Leaver, any Performance Rights issued to the KMP vest pro rata to the elapsed service period, to the extent that the performance conditions, and any other relevant conditions imposed by the Board, are satisfied at the expiry of the testing periods.
In broad terms, if a Change of Control Event occurs, Performance Rights will vest immediately to the extent that the performance conditions attaching to those Rights have been satisfied as determined by the Board.
Securities required on vesting of Performance Rights may be sourced either by a new issue or by buying on-market.
Performance Rights do not carry any entitlement to distributions until they have vested and Securities provided to the holder.
The Plan’s rules do not stipulate any limits on the grant of Performance Rights. However, the Board expects to limit Performance Rights awarded under the LTIP in respect of any financial year such that their fair value at grant date is less than or equal to $1.5 million.
Details of Performance Rights provided as remuneration to key management personnel are:
Name Expiry datePer Right Total
G E Grady2 1 Nov 13 30 Jun 16 30 Sep 16 310,000 $1.35 $418,50012 Nov 14 30 Jun 17 30 Sep 17 127,930 $1.26 $161,19217 Nov 15 30 Jun 18 30 Sep 18 124,166 $1.93 $239,640
D A Hunt 30 Aug 13 30 Jun 16 30 Sep 16 120,000 $0.78 $93,60022 Aug 14 30 Jun 17 30 Sep 17 81,159 $1.40 $113,62321 Jul 15 30 Jun 18 30 Sep 18 70,284 $1.75 $122,997
Date of grant Vesting and exercise date
Number of Rights granted
Value at grant date1
The value at grant date is calculated in accordance with AASB 2 Share-Based Payment. 1.

Aveo Group 2016 Remuneration Report (continued)
Page 24
Rights granted during FY14 have vested because both performance conditions were met as follows:
Performance condition Target Result 50% of Rights - RTSR over three-year period
> 75th percentile1 RTSR of 185.5% was the highest of the comparator group and thus exceeded the 75th percentile
50% of Rights - UPT over three-year period
$173.2 million2 $186.2 million
If RTSR had been at the 50th percentile or more but less than or equal to 75th percentile, 25% of Rights would have 1.
vested. The UPT target for FY16 was increased from the original target of $84.6 million to $85.9 million to reflect the issue of 1.
securities in connection with the acquisition of Freedom.
No Rights were forfeited during the financial year.
5.7 Long-term retention plan
The current CEO was appointed on 1 July 2013, as the Group was finalising its strategy to focus on its retirement business. In February 2014, the Group publicly committed to the key financial goal of that strategy, being to lift ROA to 6.0% - 6.5% by FY16 and 7.5% - 8.0% by FY18. The Committee considered it essential that there be KMP stability until this strategy is fully delivered and financial targets achieved. Consequently, the Committee deemed it appropriate that there be a retention scheme for KMP, beyond the STI and LTI targets, to align the outcomes of the Group’s long-term retirement strategy with the financial interests of its securityholders. The Committee regards the retention scheme as particularly relevant given the low STI and LTI awarded in previous years.
Accordingly, during FY15 the Committee approved a retention bonus based on a one-off grant of Retention Rights to the CEO and the CFO, to a maximum value of $1,950,000 and $1,008,000 respectively (being three and two times respectively their TFR), subject to service and performance conditions. The number of Retention Rights was determined as the award value divided by net tangible assets per security at 30 June 2014 of $2.78. The grant of 701,439 Retention Rights to the CEO was approved by securityholders at the Group’s 2014 Annual General Meeting. The grant of retention Rights to the CFO was 362,590.
Retention Rights vest after four years subject to performance conditions, relating to ROA and ROE.
Up to 75% of Rights granted will vest depending on the level reached by ROA at the end of the ROA four-year testing period as follows:
Year ROA Proportion of Rights that may be exercised FY16 ≥ 6.5% 15% ≥ 6.25% 11.25% ≥ 6.0% 7.5% < 6.0% nil FY18 ≥ 8.0% 60% ≥ 7.75% 45% ≥ 7.5% 30% < 7.5% nil
If FY18 ROA is greater than or equal to 8.0%, the Board has discretion to award the full 15% for FY16, even if the FY16 ROA target was not met, or only partially met.
FY16 ROA was 6.3%, so that 11.25% of Rights will vest on 1 July 2018.
Details of the calculation of ROA are given in the Dictionary. The starting point of the calculation is the carrying amount of Retirement investment property (including investment property development) and aged care assets at 30 June 2013, being the date from which the retirement strategy began to be implemented with the appointment of the current CEO.

Aveo Group 2016 Remuneration Report (continued)
Page 25
The remaining rights granted will vest depending on the level reached by ROE as follows:
Year ROE Proportion of Rights that may be exercised FY16 - FY18 ≥ 6.5% 25% ≥ 6.0% 12.5%
For FY16, ROE was 7.3%.
To the extent that the conditions are satisfied, Retention Rights vest on 1 July 2018 (including those resulting from meeting the FY16 ROA targets). After vesting, the Securities resulting from exercise of the Retention Rights will be subject to a holding lock as follows:
up to 50% of Securities may be sold immediately;
the next 25% of Securities must be held for a further 12 months before being able to be sold (i.e. 1 July 2019); and
the final 25% of Securities must be held for a further two years before being able to be sold (i.e. 1 July 2020).
Where Special Circumstances apply, or the KMP ceases employment and is a Good Leaver, any Retention Rights issued to the KMP vest pro rata to the elapsed service period, to the extent that the performance conditions and any other relevant conditions imposed by the Board are satisfied at the expiry of the testing periods. In this case, a holding lock will not apply.
The Retention Rights will vest pro-rata to the elapsed service period if a Change of Control Event occurs, and will not be subject to a holding lock. The Board has the discretion to award 100% of the Retention Rights on a Change of Control Event.
Other conditions of these Retention Rights are the same as those applying to Performance Rights.
Details of Retention Rights provided as remuneration to KMP are:
Name Expiry datePer Right Total
G E Grady 12 Nov 14 1 Jul 18 30 Sep 18 701,439 $0.81 $568,166D A Hunt 19 Aug 14 1 Jul 18 30 Sep 18 362,590 $0.84 $304,576
Date of grant Vesting and exercise date
Number of
Rights granted1Value at grant date2
The number of Rights granted was determined by dividing the awarded value of three and two times TFR by net 1.tangible assets per Security at 30 June 2014 of $2.78.
The value at grant date is calculated in accordance with AASB 2 Share-Based Payment. 2.
5.8 Long-term growth plan
In 2016, the Board observed that:
the market has comfort around the clarity of the existing strategy, which expires in less than two years’ time in FY18, but requires further clarity about the Group’s strategic and financial targets post FY18, and the ability to meet these targets; and that
clarity around future targets will assist in creating additional securityholder value.
Consequently, the Board decided to enunciate a financial target of growth in statutory EPS of 6.5% for the period FY17 – FY21.
To complement this decision, and to keep the two key management KMP together (the CEO and CFO have complementary skills), the Committee decided on 2 August 2016 to make a further one-off grant of Growth Rights to key management including the CEO and CFO. The Growth Rights awarded to the CEO and CFO have a value of $2,625,000 and $1,750,000 respectively, subject to service and performance conditions.

Aveo Group 2016 Remuneration Report (continued)
Page 26
The number of Growth Rights was determined as the award value divided by a “stretch pricing” of $3.50 per Security compared to the closing market price as at 30 June 2016 of $3.17 per Security. The grant of 750,000 Growth Rights to the CEO is subject to approval by securityholders not later than the Group’s 2021 Annual General Meeting, but not earlier than the 2018 Annual General meeting given the ASX requirement that such approval be given not earlier than three years before the award of Securities. If the grant is not approved by securityholders, the CEO will receive a cash amount of equivalent value to those Rights that have vested. The grant of Growth Rights to the CFO was 500,000.
Growth Rights vest on 30 June 2021 subject to a performance condition relating to statutory EPS. The number of securities to be awarded for each Right depends on growth in statutory EPS over the period FY17 – FY21 as follows:
Growth in statutory EPS per annum Number of Securities awarded for each Right <5.0% 0 5.0% 0.25 5.5% 0.50 6.0% 0.75 6.5% 1.00 7.0% 1.25 7.5% 1.50 8.0% 1.75 8.5% 2.00
>8.5% 2.00 In calculating statutory EPS to determine if the performance condition has been met, a key input to the valuation of the Group’s Retirement investment properties will be held constant.
Whilst designed as an extension of the retention plan under which Retention Rights were awarded to selected management, and which rewards for performance over the FY15 – FY18 period, the growth plan reaches back to FY17 to ensure smooth growth trends as an aid to market confidence.
After vesting, the Securities resulting from exercise of the Growth Rights will not be subject to a holding lock.
If a Change of Control Event occurs, the greater of:
the number of Securities that would be awarded given actual statutory EPS growth to the date of the event, times the elapsed proportion of the FY17 – FY21 performance period; or
50% of the number of Securities that would be awarded if statutory EPS growth to the date of the event was 6.5% per annum
will be awarded, will immediately vest and will not be subject to a holding lock. The Board has the discretion to award a higher number of Securities.
Other conditions of these Growth Rights are the same as those applying to Retention Rights.

Aveo Group 2016 Remuneration Report (continued)
Page 27
5.9 KMP equity instrument disclosures
Equity holdings and transactions
The movement during the reporting period in the number of stapled securities of the Group held directly, indirectly or beneficially, by key management personnel, including their personally related entities and close family members, was:
Balance at the
beginning of the year Purchased
Received on vesting of
STID Sales
Balance at the end of
the year2016DirectorsS H Lee 131,174,775 - - - 131,174,775 J E F Frayne 30,624 - - - 30,624 L R McKinnon 10,000 - - - 10,000
Other key management personnelG E Grady 83,015 - 99,638 - 182,653 D A Hunt 5,023 - 79,525 - 84,548
2015DirectorsS H Lee 131,174,775 - - - 131,174,775 J E F Frayne 30,624 - - - 30,624 L R McKinnon 10,000 - - - 10,000
Other key management personnelG E Grady 515 82,500 - - 83,015 D A Hunt 5,023 - - - 5,023
Numbers have been adjusted to reflect the seven-for-one stapled security consolidation made on 13 December 2013. 1. KMP not mentioned in this table do not or did not hold any stapled securities. 2.

Aveo Group 2016 Remuneration Report (continued)
Page 28
Options and Rights holdings and transactions
The movement during the reporting period in the number of options over ordinary securities of the Group held directly, indirectly or beneficially, by KMP, including their personally-related entities and close family members was:
Balance at the beginning of
the yearGranted during
the yearVested during
the year
Forfeited/lapsed during
the yearBalance at the
end of the yearPerformance Rights2016G E Grady 437,930 124,166 - - 562,096 D A Hunt 201,159 70,284 - - 271,443
2015G E Grady 310,000 127,930 - - 437,930 D A Hunt 120,000 81,159 - - 201,159
Retention Rights2016G E Grady 701,439 - - - 701,439 D A Hunt 362,590 - - - 362,590
2015G E Grady - 701,439 - - 701,439 D A Hunt - 362,590 - - 362,590
Total Rights2016G E Grady 1,139,369 124,166 - - 1,263,535 D A Hunt 563,749 70,284 - - 634,033
2015G E Grady 310,000 829,369 - - 1,139,369 D A Hunt 120,000 443,749 - - 563,749
STID2016G E Grady 99,638 102,641 (99,638) - 102,641 D A Hunt 79,525 65,116 (79,525) - 65,116
2015G E Grady - 99,638 - - 99,638 D A Hunt - 79,525 - - 79,525
KMP not mentioned in a section of this table do not hold any options or Rights. 1.
5.10 On-market security acquisitions
Details of Securities purchased by the Group on-market during the year for the purpose of employee incentive schemes as follows:
2016 2015Total number of Securities purchased 1,159,370 1,211,891 Average price per Security $2.89 $2.59
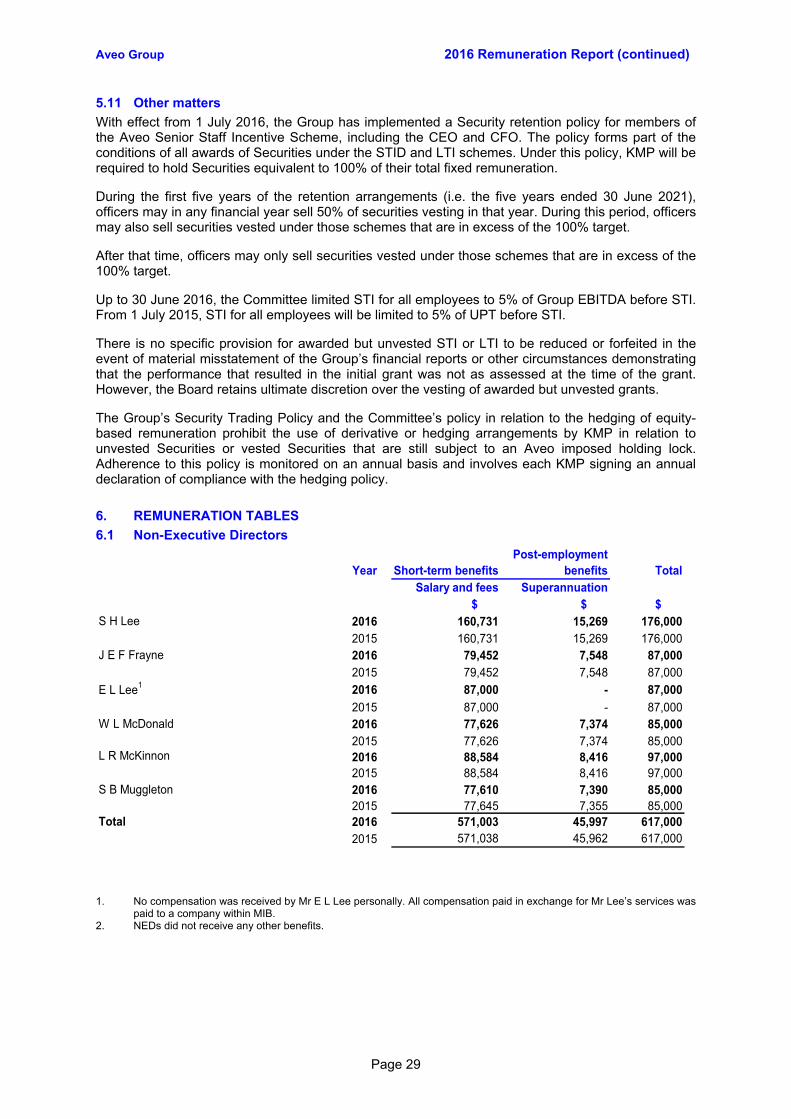
Aveo Group 2016 Remuneration Report (continued)
Page 29
5.11 Other matters
With effect from 1 July 2016, the Group has implemented a Security retention policy for members of the Aveo Senior Staff Incentive Scheme, including the CEO and CFO. The policy forms part of the conditions of all awards of Securities under the STID and LTI schemes. Under this policy, KMP will be required to hold Securities equivalent to 100% of their total fixed remuneration.
During the first five years of the retention arrangements (i.e. the five years ended 30 June 2021), officers may in any financial year sell 50% of securities vesting in that year. During this period, officers may also sell securities vested under those schemes that are in excess of the 100% target.
After that time, officers may only sell securities vested under those schemes that are in excess of the 100% target.
Up to 30 June 2016, the Committee limited STI for all employees to 5% of Group EBITDA before STI. From 1 July 2015, STI for all employees will be limited to 5% of UPT before STI.
There is no specific provision for awarded but unvested STI or LTI to be reduced or forfeited in the event of material misstatement of the Group’s financial reports or other circumstances demonstrating that the performance that resulted in the initial grant was not as assessed at the time of the grant. However, the Board retains ultimate discretion over the vesting of awarded but unvested grants.
The Group’s Security Trading Policy and the Committee’s policy in relation to the hedging of equity-based remuneration prohibit the use of derivative or hedging arrangements by KMP in relation to unvested Securities or vested Securities that are still subject to an Aveo imposed holding lock. Adherence to this policy is monitored on an annual basis and involves each KMP signing an annual declaration of compliance with the hedging policy.
6. REMUNERATION TABLES
6.1 Non-Executive Directors
Year Short-term benefitsPost-employment
benefits TotalSalary and fees Superannuation
$ $ $S H Lee 2016 160,731 15,269 176,000
2015 160,731 15,269 176,000 J E F Frayne 2016 79,452 7,548 87,000
2015 79,452 7,548 87,000
E L Lee1 2016 87,000 - 87,000
2015 87,000 - 87,000 W L McDonald 2016 77,626 7,374 85,000
2015 77,626 7,374 85,000 L R McKinnon 2016 88,584 8,416 97,000
2015 88,584 8,416 97,000 S B Muggleton 2016 77,610 7,390 85,000
2015 77,645 7,355 85,000 2016 571,003 45,997 617,000 2015 571,038 45,962 617,000
Total
No compensation was received by Mr E L Lee personally. All compensation paid in exchange for Mr Lee’s services was 1.paid to a company within MIB.
NEDs did not receive any other benefits. 2.
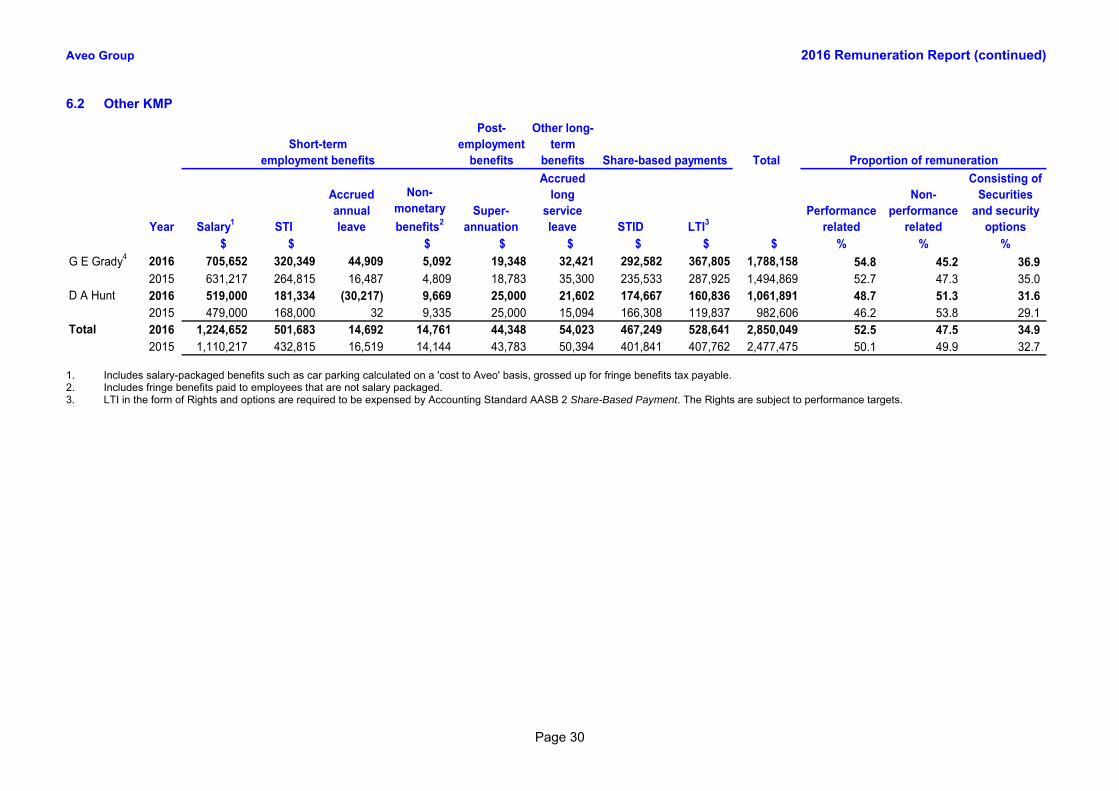
Aveo Group 2016 Remuneration Report (continued)
Page 30
6.2 Other KMP
Short-termemployment benefits
Post-employment
benefits
Other long-term
benefits Share-based payments Total Proportion of remuneration
Year Salary1 STI
Accrued annual leave
Non-monetary
benefits2Super-
annuation
Accrued long
service leave STID LTI3
Performance related
Non-performance
related
Consisting of Securities
and security options
$ $ $ $ $ $ $ $ % % %
G E Grady4 2016 705,652 320,349 44,909 5,092 19,348 32,421 292,582 367,805 1,788,158 54.8 45.2 36.9 2015 631,217 264,815 16,487 4,809 18,783 35,300 235,533 287,925 1,494,869 52.7 47.3 35.0
D A Hunt 2016 519,000 181,334 (30,217) 9,669 25,000 21,602 174,667 160,836 1,061,891 48.7 51.3 31.6 2015 479,000 168,000 32 9,335 25,000 15,094 166,308 119,837 982,606 46.2 53.8 29.1 2016 1,224,652 501,683 14,692 14,761 44,348 54,023 467,249 528,641 2,850,049 52.5 47.5 34.9 2015 1,110,217 432,815 16,519 14,144 43,783 50,394 401,841 407,762 2,477,475 50.1 49.9 32.7
Total
Includes salary-packaged benefits such as car parking calculated on a 'cost to Aveo' basis, grossed up for fringe benefits tax payable. 1. Includes fringe benefits paid to employees that are not salary packaged. 2. LTI in the form of Rights and options are required to be expensed by Accounting Standard AASB 2 Share-Based Payment. The Rights are subject to performance targets. 3.
Aveo Group Corporate Governance Statement
Page 31
CORPORATE GOVERNANCE STATEMENT
The Board of Directors is responsible for the corporate governance of Aveo Group (‘Aveo’, the ‘Group’). This statement outlines the main corporate governance practices in place and the extent to which the Group has followed the recommendations of the ASX Corporate Governance Council (the ‘Council’) throughout the year to 30 June 2016, including the Council’s revised Corporate Governance Principles and Recommendations (‘3rd edition principles’) published in March 2014 (the ‘Guidelines’).
The Guidelines set out core principles and practices that the Council believes underlie good corporate governance, and all listed entities are required to disclose the extent to which they depart from the Guidelines.
A copy of this statement is available from the Investor Centre on the Aveo website at www.aveo.com.au/investor-centre/corporate-governance.
1. THE BOARD AND MANAGEMENT
The Board’s primary role is the creation of long-term securityholder value through the development of the strategic direction of the Group, the implementation of efficient internal delegations and controls, the effective oversight of senior management, the promotion of high ethical standards of behaviour, the offering of high quality products to the market, and commitment to the constant improvement of the Group’s corporate governance practices.
The Board’s responsibilities and functions include: strategic planning; capital management and financial reporting; approving and monitoring major capital expenditure, acquisitions and disposals; appointing or removing, or ratifying the appointment or removal of, senior management; approving and monitoring the risk management framework; and overseeing the Group’s accountability systems and code of conduct.
Further details of the specific philosophy, values and responsibilities of the Board are contained in the Board Charter available from the Investor Centre on the Aveo website.
The Board has delegated to the Executive Director and Chief Executive Officer responsibility for the day-to-day management of the Group and the implementation and delivery of the Board’s strategic direction. The Board delegates authority and functions to the Executive Director and Chief Executive Officer, the Chief Financial Officer and senior management in accordance with a formal delegations of authority protocol (the ‘Delegations’). The Delegations contain the business rules and authorities which govern the operations of the Group on a day-to-day basis. These Delegations are reviewed annually by senior management and presented to the Audit Committee for endorsement and approval in June each year.
During the financial year, the Board comprised the Executive Director (who is also the Chief Executive Officer) and six Non-Executive Directors. The names, skills, experience and expertise of the Directors who held office as at the date of the Directors’ Report and the period of office of each Director are set out in the Directors’ Report.
Independence of Directors
For the purposes of determining Director independence, the Board considers any material previous or current business relationships which could reasonably be perceived to interfere with or compromise each Director’s independent judgement in accordance with the Guidelines.
The following factors and relationships are considered by the Board in assessing whether a Director is independent: whether the Director is a substantial securityholder of the Group or an officer of, or otherwise
associated with, either directly or indirectly, a substantial securityholder of the Group; whether the Director is employed by the Group or has been employed in an executive capacity
by the Group within the last three years;
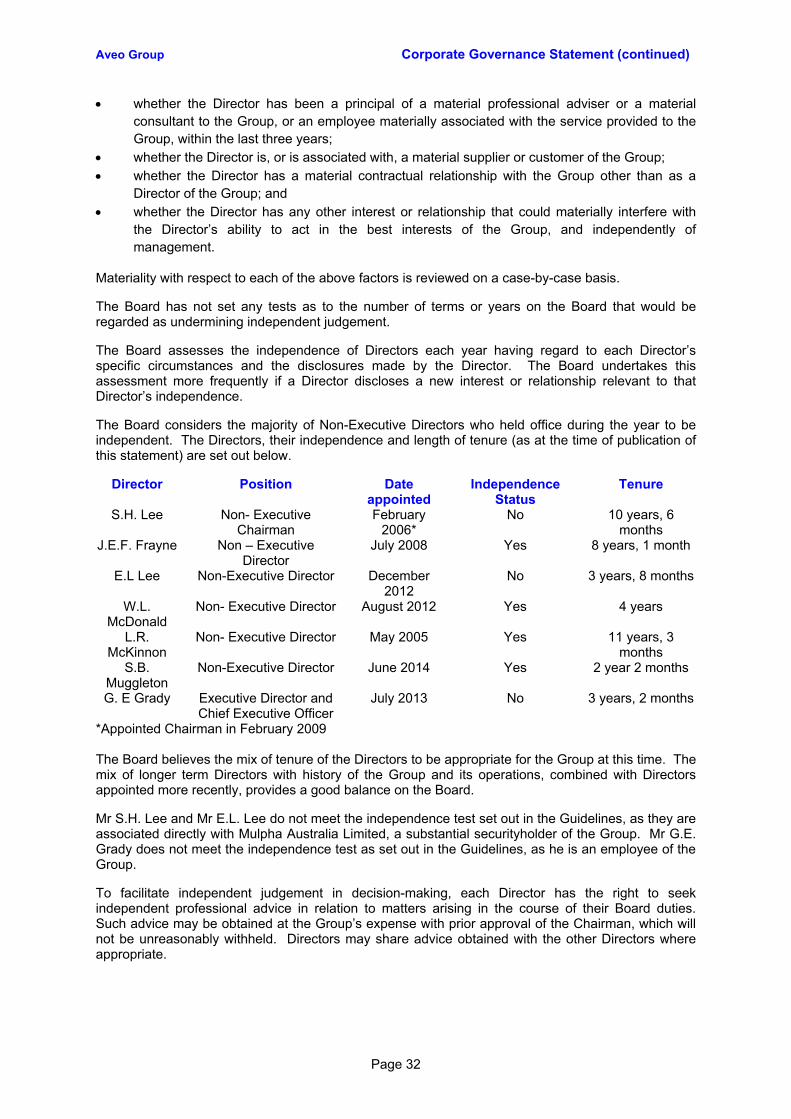
Aveo Group Corporate Governance Statement (continued)
Page 32
whether the Director has been a principal of a material professional adviser or a material consultant to the Group, or an employee materially associated with the service provided to the Group, within the last three years;
whether the Director is, or is associated with, a material supplier or customer of the Group; whether the Director has a material contractual relationship with the Group other than as a
Director of the Group; and whether the Director has any other interest or relationship that could materially interfere with
the Director’s ability to act in the best interests of the Group, and independently of management.
Materiality with respect to each of the above factors is reviewed on a case-by-case basis.
The Board has not set any tests as to the number of terms or years on the Board that would be regarded as undermining independent judgement.
The Board assesses the independence of Directors each year having regard to each Director’s specific circumstances and the disclosures made by the Director. The Board undertakes this assessment more frequently if a Director discloses a new interest or relationship relevant to that Director’s independence.
The Board considers the majority of Non-Executive Directors who held office during the year to be independent. The Directors, their independence and length of tenure (as at the time of publication of this statement) are set out below.
Director Position Date appointed
Independence Status
Tenure
S.H. Lee Non- Executive Chairman
February 2006*
No 10 years, 6 months
J.E.F. Frayne Non – Executive Director
July 2008 Yes 8 years, 1 month
E.L Lee Non-Executive Director December 2012
No 3 years, 8 months
W.L. McDonald
Non- Executive Director August 2012 Yes 4 years
L.R. McKinnon
Non- Executive Director May 2005 Yes 11 years, 3 months
S.B. Muggleton
Non-Executive Director June 2014 Yes 2 year 2 months
G. E Grady Executive Director and Chief Executive Officer
July 2013 No 3 years, 2 months
*Appointed Chairman in February 2009 The Board believes the mix of tenure of the Directors to be appropriate for the Group at this time. The mix of longer term Directors with history of the Group and its operations, combined with Directors appointed more recently, provides a good balance on the Board.
Mr S.H. Lee and Mr E.L. Lee do not meet the independence test set out in the Guidelines, as they are associated directly with Mulpha Australia Limited, a substantial securityholder of the Group. Mr G.E. Grady does not meet the independence test as set out in the Guidelines, as he is an employee of the Group.
To facilitate independent judgement in decision-making, each Director has the right to seek independent professional advice in relation to matters arising in the course of their Board duties. Such advice may be obtained at the Group’s expense with prior approval of the Chairman, which will not be unreasonably withheld. Directors may share advice obtained with the other Directors where appropriate.

Aveo Group Corporate Governance Statement (continued)
Page 33
Conflicts of Interest
Where a Director has an actual or potential conflict of interest or material personal interest, the Board’s governance procedures ensure: that the interest is fully disclosed to the Board and the disclosure is recorded in the Board
minutes; unless the Directors resolve to the contrary in accordance with the Corporations Act 2001 (Cth)
(the ‘Corporations Act’), that the relevant Director is excluded from all considerations of the matter by the Board; and
unless the Directors decide to the contrary, that the relevant Director does not receive any segment of the Board papers or other documents containing any reference to the matter.
A copy of the Board’s Conflict of Interest Policy is available from the Investor Centre on the Aveo website.
Role of Chairman
Mr S.H. Lee was appointed Chairman of the Group on 12 February 2009. Mr S.H. Lee is not an independent Director for the purposes of the Guidelines, as he is directly associated with Mulpha Australia Limited, a substantial securityholder of the Group.
The Board has not appointed a lead independent Director, as the Board does not believe that any such appointment could increase the exercise of independent judgement by the Board, which has comprised a majority of independent Directors since 29 August 2012. The Board considers that the Chairman facilitates the effective contribution of all Directors and promotes constructive and respectful relations between Directors and between the Board and senior management.
The roles of Chairman and Chief Executive Officer are not held by the same individuals. The Board recognises the importance of ensuring that the Chairman and the Chief Executive Officer have defined roles within the organisation and function within clear functional lines. Further information in relation to the role of the Chairman is available from the Investor Centre on the Aveo website.
Company Secretary
The Company Secretary is accountable directly to the Board, through the Chairman, for ensuring that Board processes and procedures operate efficiently and effectively. In addition, the Company Secretary is charged with facilitating the Group’s corporate governance processes and providing counsel on corporate secretarial matters to ensure compliance with the Group’s governance framework. Further details with respect to the role and accountability of the Company Secretary are contained in the Board Charter available from the Investor Centre on the Aveo website.
Nomination and Remuneration Committee
In June 2015, the Board established a Nomination and Remuneration Committee (the ‘Committee’) that operates pursuant to a Board approved charter that is available from the Investor Centre on the Aveo website. Previously, a Remuneration Committee oversaw the responsibilities with respect to the remuneration function of the Group (as delegated by the Board), and the Board maintained oversight of all responsibilities with respect to nomination and succession planning. In acknowledging the recommendations of the Guidelines, and to ensure that a culture of continuous improvement and dedicated resourcing continues to be present with respect to succession planning for both the Executive Director and Non-Executive Directors, the Board resolved that the Committee should be formed and a charter developed to address the specific needs of succession planning of the Group.
The primary responsibilities of the Committee are to review and recommend for approval to the Board:
procedures to assess the performance of Non-Executive Directors and the Board’s Committees;
nomination and selection processes for appointment of Non-Executive Directors to the Board; candidates to fill casual vacancies (as they relate to non-executive vacancies) on the Board
and those Non-Executive Directors who should be considered for election and re-election; the removal of Non-Executive Directors (as required);

Aveo Group Corporate Governance Statement (continued)
Page 34
succession plans for both Directors and senior management which will detail a list of eligible candidates in circumstances where a vacancy arises;
remuneration policies and practices which are consistent with the Group’s strategic goals and which enable the Group to attract and retain senior management and Directors who will create value for securityholders;
the quantum and structure of remuneration for Directors and senior management having regard to the performance of the Group, the performance of senior management and the general remuneration environment; and
policies and procedures to attract motivate and retain appropriately skilled persons to meet the Group’s needs.
The Committee comprises three Non-Executive Directors, with a majority of Directors being independent. An independent Director who is not the Chairman of the Board chairs the Committee. The structure and functions of the Committee comply with Recommendations 2.1 and 8.1 in the Guidelines and therefore Listing Rule 12.8. The current members of the Nomination and Remuneration Committee are Mr W.L. McDonald (Chairman), Mr J.E.F. Frayne, and Mr S.H. Lee, and the qualifications of each member are set out in the Directors’ Report. The number of meetings of the Committee held during the year, and a record of attendance by each member of the Committee at those meetings, is set out in the Directors’ Report.
The Committee reviews, and recommends any changes to the Board for approval, the procedures used to assess the performance of Directors and the Board’s committees. Annually, the Chair is responsible for monitoring and reviewing Board performance.
During FY16, the Board engaged an independent consultant to facilitate a formal Board and Committee evaluation (Evaluation) to:
review the effectiveness and performance of the Board; evaluate the performance of the Audit and Nomination & Remuneration Committees; provide the Board with recommendations of areas for improvement; identify strategies for improving the Board’s compliance against the 3rd edition principles, as
well as reviewing the Board against its own Charter; and undertake a high-level skills assessment.
The Evaluation results were presented to the Board, via the Nomination and Remuneration Committee. The Board has reviewed the findings of the Evaluation and resolved to appoint a working group of Directors, led by the Chairman of the Nomination & Remuneration Committee to undertake a deeper analysis of the results, with the view to developing an action plan to address any recommendations.
The Committee considers when the appointment of a new Director is required and whether to support the re-election of incumbent Directors. The Committee is also responsible for the nomination process for new Directors and provides recommendations to the Board with respect to who should be invited to fill a casual vacancy. When a casual vacancy occurs or where it is considered that there is a gap in necessary expertise, the Committee reviews potential candidates, with advice from external consultants if necessary. All prospective Directors under consideration are subject to employment screening policies to ascertain the good fame and character of those individuals before any appointment or nomination for election is made. The Board invites the most suitable candidate to join the Board in a casual vacancy until their proposed election by the Group’s securityholders at its next Annual General Meeting (‘AGM’). Formal written documentation is provided to all Directors upon commencement confirming the terms and conditions of their appointment. During FY16, there were no new appointments to the Aveo Board, nor were there any resignations.
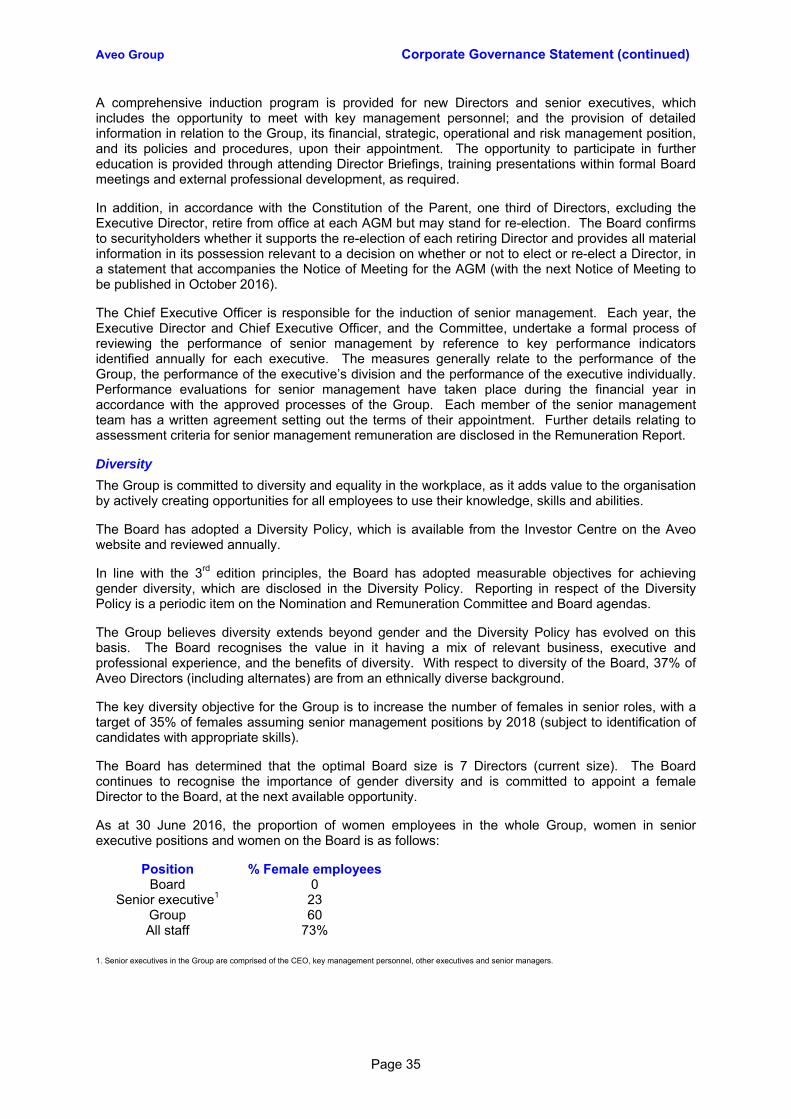
Aveo Group Corporate Governance Statement (continued)
Page 35
A comprehensive induction program is provided for new Directors and senior executives, which includes the opportunity to meet with key management personnel; and the provision of detailed information in relation to the Group, its financial, strategic, operational and risk management position, and its policies and procedures, upon their appointment. The opportunity to participate in further education is provided through attending Director Briefings, training presentations within formal Board meetings and external professional development, as required.
In addition, in accordance with the Constitution of the Parent, one third of Directors, excluding the Executive Director, retire from office at each AGM but may stand for re-election. The Board confirms to securityholders whether it supports the re-election of each retiring Director and provides all material information in its possession relevant to a decision on whether or not to elect or re-elect a Director, in a statement that accompanies the Notice of Meeting for the AGM (with the next Notice of Meeting to be published in October 2016).
The Chief Executive Officer is responsible for the induction of senior management. Each year, the Executive Director and Chief Executive Officer, and the Committee, undertake a formal process of reviewing the performance of senior management by reference to key performance indicators identified annually for each executive. The measures generally relate to the performance of the Group, the performance of the executive’s division and the performance of the executive individually. Performance evaluations for senior management have taken place during the financial year in accordance with the approved processes of the Group. Each member of the senior management team has a written agreement setting out the terms of their appointment. Further details relating to assessment criteria for senior management remuneration are disclosed in the Remuneration Report.
Diversity
The Group is committed to diversity and equality in the workplace, as it adds value to the organisation by actively creating opportunities for all employees to use their knowledge, skills and abilities.
The Board has adopted a Diversity Policy, which is available from the Investor Centre on the Aveo website and reviewed annually.
In line with the 3rd edition principles, the Board has adopted measurable objectives for achieving gender diversity, which are disclosed in the Diversity Policy. Reporting in respect of the Diversity Policy is a periodic item on the Nomination and Remuneration Committee and Board agendas.
The Group believes diversity extends beyond gender and the Diversity Policy has evolved on this basis. The Board recognises the value in it having a mix of relevant business, executive and professional experience, and the benefits of diversity. With respect to diversity of the Board, 37% of Aveo Directors (including alternates) are from an ethnically diverse background.
The key diversity objective for the Group is to increase the number of females in senior roles, with a target of 35% of females assuming senior management positions by 2018 (subject to identification of candidates with appropriate skills).
The Board has determined that the optimal Board size is 7 Directors (current size). The Board continues to recognise the importance of gender diversity and is committed to appoint a female Director to the Board, at the next available opportunity.
As at 30 June 2016, the proportion of women employees in the whole Group, women in senior executive positions and women on the Board is as follows:
Position % Female employees Board 0
Senior executive1 23 Group 60 All staff 73%
1. Senior executives in the Group are comprised of the CEO, key management personnel, other executives and senior managers.
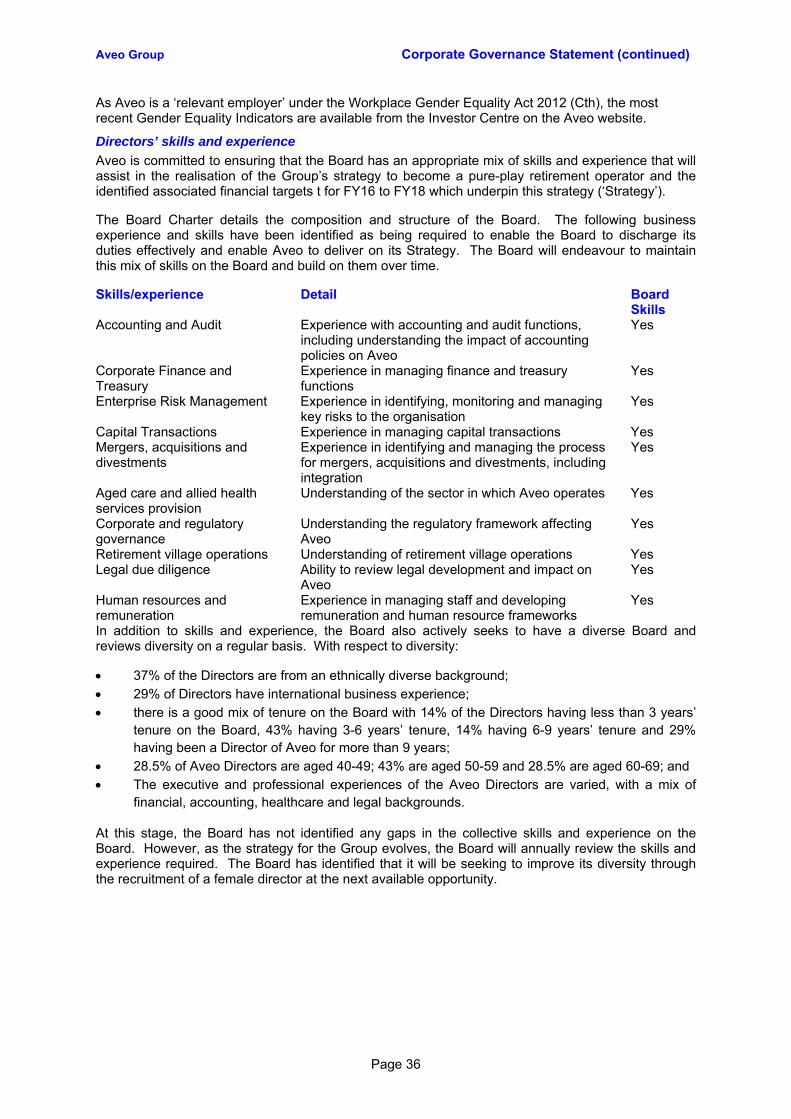
Aveo Group Corporate Governance Statement (continued)
Page 36
As Aveo is a ‘relevant employer’ under the Workplace Gender Equality Act 2012 (Cth), the most recent Gender Equality Indicators are available from the Investor Centre on the Aveo website.
Directors’ skills and experience
Aveo is committed to ensuring that the Board has an appropriate mix of skills and experience that will assist in the realisation of the Group’s strategy to become a pure-play retirement operator and the identified associated financial targets t for FY16 to FY18 which underpin this strategy (‘Strategy’).
The Board Charter details the composition and structure of the Board. The following business experience and skills have been identified as being required to enable the Board to discharge its duties effectively and enable Aveo to deliver on its Strategy. The Board will endeavour to maintain this mix of skills on the Board and build on them over time.
Skills/experience Detail Board Skills
Accounting and Audit Experience with accounting and audit functions, including understanding the impact of accounting policies on Aveo
Yes
Corporate Finance and Treasury
Experience in managing finance and treasury functions
Yes
Enterprise Risk Management Experience in identifying, monitoring and managing key risks to the organisation
Yes
Capital Transactions Experience in managing capital transactions Yes Mergers, acquisitions and divestments
Experience in identifying and managing the process for mergers, acquisitions and divestments, including integration
Yes
Aged care and allied health services provision
Understanding of the sector in which Aveo operates Yes
Corporate and regulatory governance
Understanding the regulatory framework affecting Aveo
Yes
Retirement village operations Understanding of retirement village operations Yes Legal due diligence Ability to review legal development and impact on
Aveo Yes
Human resources and remuneration
Experience in managing staff and developing remuneration and human resource frameworks
Yes
In addition to skills and experience, the Board also actively seeks to have a diverse Board and reviews diversity on a regular basis. With respect to diversity:
37% of the Directors are from an ethnically diverse background; 29% of Directors have international business experience; there is a good mix of tenure on the Board with 14% of the Directors having less than 3 years’
tenure on the Board, 43% having 3-6 years’ tenure, 14% having 6-9 years’ tenure and 29% having been a Director of Aveo for more than 9 years;
28.5% of Aveo Directors are aged 40-49; 43% are aged 50-59 and 28.5% are aged 60-69; and The executive and professional experiences of the Aveo Directors are varied, with a mix of
financial, accounting, healthcare and legal backgrounds.
At this stage, the Board has not identified any gaps in the collective skills and experience on the Board. However, as the strategy for the Group evolves, the Board will annually review the skills and experience required. The Board has identified that it will be seeking to improve its diversity through the recruitment of a female director at the next available opportunity.

Aveo Group Corporate Governance Statement (continued)
Page 37
2. ACTING ETHICALLY AND RESPONSIBLY
Code of conduct
The Group has well-established policies, procedures and codes of conduct which seek to promote ethical standards of behaviour by all employees and a culture of compliance that is risk-aware and embraces good governance practices, underpinned by knowledge of the law and relevant corporate and community expectations.
The Board supports the need for Directors, senior management and all other employees to observe the highest standards of behaviour and business ethics. All Directors and employees are expected to act with integrity, striving at all times to enhance the reputation and performance of the Group. The Board’s policies reflect its requirements in relation to the promotion of ethical and responsible decision-making. Appropriate training programs on the Group’s internal policies support the policies.
A formal Code of Conduct, which requires employees to act honestly and in good faith, not disclose confidential information, avoid conflicts of interest, observe all relevant laws and maintain a culture of lawful and ethical behaviour, is available from the Investor Centre on the Aveo website. The Code of Conduct is supported by various internal policies, including those dealing with avoiding conflicts of interest and ensuring that privacy is respected. To further support Aveo’s business activities, Aveo also has a Fraud, Bribery and Corruption (‘FB&C’) control framework, strengthened by the Aveo Whistleblower Policy. The FB&C control strategy focuses on addressing the elements of awareness, prevention, detection and investigation with continuous monitoring.
The Board Charter sets out the Board’s philosophy for driving the creation of long-term securityholder value through high ethical standards of behaviour, respect for employees’ aspirations, and acting as a good corporate citizen in the community in which the Group operates. The Board Charter also articulates the Board’s values, which include a commitment to a climate of trust and candour, fostering a culture of open constructive dissent and ensuring individual accountability.
The Board has established written guidelines, detailed in its Securities Trading Policy, that restrict dealings by Directors and employees in the Group’s securities and in securities of customers and other entities with which Directors or employees may deal in the course of their duties.
The Securities Trading Policy complies with Listing Rules 12.9 and 12.12. It identifies certain periods when, even in the absence of knowledge of unpublished price-sensitive information, Directors and all employees may not buy or sell securities. These periods are the earlier of the ex-dividend date in circumstances where the Board has declared a dividend for the half year and/or full year reporting periods, or 1 January and 1 July each year, and expiring one day following the release of half year and full year results respectively.
A copy of the Securities Trading Policy is available from the Investor Centre on the Aveo website.
3. INTEGRITY IN CORPORATE REPORTING
The Group has an established Audit and Risk Committee (the ‘Audit Committee’) which operates under written terms of reference approved by the Board and embodied in the Audit and Risk Committee Charter. The Audit Committee assists the Board to verify and safeguard the integrity of the Group’s financial reporting, internal control structures and risk management systems, and oversees the independence of the external auditor.
The Audit Committee is also responsible for making recommendations to the Board in relation to the selection, appointment and rotation of the external audit engagement partners, and overseeing and appraising the quality and effectiveness of audit work performed by the external auditor.
The Audit Committee comprises three Non-Executive Directors, with a majority of Directors being independent. The Audit Committee is chaired by an independent Director who is not the Chairman of the Board. The structure and functions of the Audit Committee comply with the recommendations in the Guidelines, and therefore Listing Rule 12.7.
The primary responsibilities of the Audit Committee are to review and recommend for approval to the Board:

Aveo Group Corporate Governance Statement (continued)
Page 38
the integrity of the Group’s financial reports, including oversight of the external auditor, approval of the external audit plan and compliance with auditor independence requirements;
the appropriateness of the Group’s accounting policies; the effectiveness of the Group’s financial reporting controls and procedures; the effectiveness of the Group’s internal control environment, including oversight of the internal
audit function, approval of the annual internal audit plan and reviewing the results of internal audit engagements; and
compliance with relevant laws and regulations.
The current members of the Audit Committee are Mr L.R. McKinnon (Chairman), Mr J.E.F. Frayne and Mr E.L. Lee, and the qualifications of each member are set out in the Directors’ Report. The Chairman, Mr McKinnon has extensive experience in banking and finance, Mr Frayne is a chartered accountant with extensive experience in audit, accountancy and corporate services and Mr Lee has significant experience in finance and accounting. Together the Committee has extensive accounting and financial expertise and knowledge of the industry in which Aveo operates to discharge the role of the Audit Committee effectively.
Meetings of the Audit Committee are attended, by invitation, by the Chief Financial Officer, the Company Secretary, the engagement partner from the Group’s external auditor, and such other senior staff or professional advisers as may be appropriate from time to time. The number of meetings of the Audit Committee held during the year, and a record of attendance by each member of the Committee at those meetings, is set out in the Directors’ Report. Minutes of all Audit Committee meetings are provided to the Board, and the Chairman of the Audit Committee reports to the Board after each Audit Committee meeting.
When considering the Audit Committee’s review of financial reports at half year and full year, the Board also receives a written statement in accordance with section 295A of the Corporations Act signed by the Executive Director and Chief Executive Officer, and the Chief Financial Officer, affirming that the Group’s Financial Report gives a true and fair view, in all material respects, of the Group’s financial position, and complies, in all material respects, with relevant accounting standards.
The Audit and Risk Committee Charter is available from the Investor Centre on the Aveo website.
The Group’s external auditor has declared its independence to the Audit Committee during the year. The Audit Committee has examined detailed material provided by the external auditor and by management and has satisfied itself that the standards for auditor independence and associated issues have been complied with.
4. TIMELY AND BALANCED DISCLOSURE
The Group has established a Continuous Disclosure Policy and a Communications Policy and also has External Communications and Continuous Disclosure Protocols which are intended to enhance the Group’s compliance with the continuous disclosure requirements of the Corporations Act and the ASX Listing Rules. These documents set out procedures to identify relevant material information, report material information to the Company Secretary for review, and ensure compliance with the continuous disclosure requirements. A copy of the Continuous Disclosure Policy is available from the Investor Centre on the Aveo website.
The Company Secretary has primary responsibility for communications with the ASX, including responsibility for ensuring compliance with the continuous disclosure requirements of the ASX Listing Rules and overseeing information sent to the ASX and securityholders.
The Directors have obligations under a Disclosure of Interests and Transactions in Securities Agreement, entered into by each of them with the Group, to inform the Group of any trading by them in the Group’s securities and of any other interests in contracts the Director may have with a Group entity.
All announcements made by the Group to the ASX are available from the Investor Centre on the Aveo website.

Aveo Group Corporate Governance Statement (continued)
Page 39
5. SECURITYHOLDER ENGAGEMENT
The Group aims to keep securityholders informed of the Group’s performance and all major developments in an ongoing manner. The investor relations program for the Group is governed by a formal Communications Policy to facilitate the protocols for the effective two-way exchange of information between the Group and securityholders.
All of the Group’s corporate governance materials (including the Communications Policy) are available from the Investor Centre on the Aveo website.
Investor relations with the Group’s securityholders is facilitated by communication in the following manner: utilising the Investor Centre on the Aveo website to publish:
o all media releases made by the Group; o announcements made to the ASX during the course of the year; o the corporate calendar; o the Group’s Constitutions and Stapling Deed; o biographies of the Directors; o Annual Reports; o Notices of Meetings and details of Annual and General Meetings;
the Annual Report, which is available for distribution to all securityholders; the Half Year Financial Report, which contains summarised financial information and a review
of the operations during the period since the Annual Report; and other correspondence to securityholders as required.
In addition, management presents at relevant investor conferences and ensures copies of any presentations are released to the ASX for access by all securityholders.
Securityholders are also encouraged to participate in the AGM to ensure a high level of accountability and identification with the Group’s strategies and goals. The AGM provides the opportunity for the Group to update securityholders on the Group’s performance and provides a valuable opportunity for securityholders to ask questions of the Board and senior management. Securityholders can also submit questions to the Chairman and the Executive Director and Chief Executive Officer by mail to the Group’s registered office prior to the AGM, in accordance with the notice period outlined in the Notice of Meetings.
The senior engagement partner of the Group’s external auditor attends the Group’s AGM and is available to answer questions from securityholders about the conduct of the audit and the preparation and content of the auditor’s report. The Chairman advises the securityholders of this at the commencement of each AGM.
In addition, the AGM and the half-year and full year results presentations, and a summary of the transcript of the Chairman’s address from the AGM, are available from the Investor Centre on the Aveo website.
Computershare, the Group’s registry services provider, has assisted the Group to facilitate electronic communication with securityholders. This involves the ability of securityholders to register for email notifications when relevant information, including ASX announcements, are posted to the Investor Centre on the Aveo website. Initiatives that have been implemented by the Group include the offering of an enhanced user experience on the Computershare Investor Centre (including features such as proactive alerts), which has been responsible for an increase in the number of securityholders providing an email address, payment instructions and tax details.
Contact details are included on the Aveo website for securityholders to contact Aveo or Computershare with any queries.
Aveo Group Corporate Governance Statement (continued)
Page 40
6. RECOGNISING AND MANAGING RISK
Oversight of the risk management function
The Group recognises the importance of managing risk and controlling its business activities in a manner which enables it to maximise profitable opportunities, avoid or reduce risks which may cause injury or loss, ensure compliance with applicable laws and regulations, and enhance resilience to external events.
In pursuing its strategy, the Group has established an Enterprise Risk Management Framework (‘Framework’) encompassing an entity-wide risk policy and appetite statement, roles and responsibilities for the oversight and management of risk, and formalised risk management and reporting processes.
The Group’s Framework centres on a clear mandate and commitment to the effective and efficient management of risk in the achievement of objectives. Critical to the delivery of this commitment is the development of a risk aware culture that encourages the proactive identification and management of risk in day-to-day activities and strategic decision making. The Framework establishes a systematic approach to the identification, assessment and management of risk, in addition to relevant and timely reporting of risk information to those charged with governance.
The Board is ultimately responsible for approving and reviewing the Group’s risk management framework, including its risk management strategy and policy. The Audit Committee assists the Board in its oversight function. The proactive identification of risks and the design and implementation of the risk management framework are the responsibilities of management, while business units are responsible for integrating the risk management framework within their business processes and systems.
The Board, in conjunction with senior management, has developed and implemented procedures to ensure that material risks facing the Group are adequately and regularly identified, assessed and managed throughout the organisation. Through the measures referred to below, senior management reports regularly to the Board as to the effectiveness of the Group’s management of its material business risks: annual budgets, divisional business plans and the Group’s strategic plan are prepared for
approval by Directors; actual trading results for the Group and each division are presented to the Board at each Board
meeting and compared against budget and forecasts; comprehensive Board papers containing relevant operational, strategic, financial and legal
information are prepared by senior management and circulated to Directors before each Board meeting;
monthly project reviews are attended by senior management to monitor the progress of each individual project and the risk environment applicable. Material developments or changes are reported to the Board at the next Board meeting;
financial authority limits have been set by the Board (which are reviewed annually) to delegate the Board’s approval process for various matters, including site acquisitions and developments. Where the cost is above those delegated authorities, the approval of the full Board is required;
insurance cover appropriate to the size and nature of the Group’s operations is carried out to reduce the financial impact of any significant insurable losses;
bi-annual reporting on the Group’s risk profile and material business risks as identified by management and captured in divisional risk registers is carried out; and
independent appraisal of the Group’s system of risk management and control is undertaken by the internal audit function or other external party.
Within the Framework, and in addition to the daily management of business activities, each business unit is required to formally profile its risk environment. This is achieved through the completion of a detailed risk register that captures risk items, their classification and description, risk ratings, an assessment of mitigating controls and any action plans and responsible owner(s).

Aveo Group Corporate Governance Statement (continued)
Page 41
Risk registers are reviewed and updated regularly, and form the basis for periodic reporting to the Audit Committee and Board as to the Group’s risk profile and material business risks.
Management and the Audit Committee review the Group’s risk management framework annually. In FY16, a comprehensive enterprise risk management (‘ERM’) assessment was conducted to consider the Group’s risk profile and risk maturity; specifically that the risk management framework was meeting the expectations of the Group. The findings of the ERM review were reported to the Audit Committee and all recommendations were implemented over the course of FY16. Minutes of all Audit Committee meetings are circulated to the full Board, and the Chairman of the Audit Committee reports to the Board after each Audit Committee meeting.
At this time, the Group does not consider that it faces material exposure to economic, environmental or social sustainability risks. The 3rd Edition Principles define ‘material exposure’ as a ‘real possibility that the risk in question could substantively impact the listed entity’s ability to create or preserve value for securityholders over the short, medium or long term’. The Group was able to determine that it does not have a material exposure to economic, environmental or social sustainability risks through a thorough Group-wide ERM identification and assessment process. The Group will continue to monitor its exposure through management’s regular review of the risk environment and risk registers and, if necessary, develop plans to address any identified or emerging risks. Responses to any identified risks would likely include appropriate reporting and escalation processes, inclusion on the enterprise risk register, development of risk mitigation strategies and monitoring of risk indicators to assess the effectiveness of these mitigation strategies.
The Group’s exposure to economic and financial risks that could have an impact on the Group’s financial performance and the management of these risks is detailed in the financial statements in Note 15 and further information with respect to the Group’s compliance with environmental regulation can be found in the Directors’ Report.
It is the responsibility of the senior management of the Group to ensure that the enterprise risk register is regularly reviewed and updated, and to bring any extreme risks promptly to the attention of the Chief Executive Officer and the Chairman for consideration. If it is considered necessary, the Chairman will convene a meeting of the Board to consider and provide direction on how the risk should be managed.
The Board also receives regular updates from the Chief Executive Officer, the Chief Financial Officer, other senior managers and, where relevant, external parties on material risks faced by the Group and the effectiveness of strategies in place to manage the identified risks.
The Chief Financial Officer reports in writing to the Board and attends all Board meetings. The Chief Financial Officer also attends all meetings of the Audit Committee and provides written reports to the Audit Committee, as required.
In addition, the Audit Committee reviews and reports to the Board in relation to the integrity of the Group’s financial reporting, internal control structures and risk management systems with regard to financial risks and the internal and external audit functions.
The Group has established a Risk Management Policy and a Treasury and Financial Risk Management Policy, which are available from the Investor Centre on the Aveo website. These policies and underlying procedures are reviewed annually by the Board to ensure their continued application and relevance.
Internal audit and compliance
The Group has established an in-house internal audit function that operates pursuant to a Board approved charter. The function is internally resourced, and led by the Group Internal Audit and Risk Manager, with supplemental resourcing provided by specialist third parties.
The internal audit function provides the Board with assurance over the adequacy, effectiveness and efficiency of risk management and control and governance processes employed across the Group. Internal audit also assists in the achievement of the Group’s strategy by providing insight and recommendations on business process improvement and the management of material business risks.

Aveo Group Corporate Governance Statement (continued)
Page 42
The internal audit function has no direct authority or responsibility for the activities it reviews. The Group Internal Audit and Risk Manager, reports functionally to the Chair of the Audit Committee and administratively to the Chief Financial Officer. The Group Internal Audit and Risk Manager retains and exercises the right to meet with the Audit Committee and its Chair in the absence of management.
The Audit Committee approves the annual internal audit plan and assurance programme, which is determined using a structured, risk-based approach. The Audit Committee also determines the scope and budget of the function, on recommendation from management and the Group Internal Audit and Risk Manager.
While internal and external audit work closely together, they are separate functions. Aveo’s external audit firm does not provide internal audit services to the Group.
The internal audit function conducts its activities in accordance with the Group‘s policies and other relevant professional standards, including the Institute of Internal Auditors’ International Standards for the Professional Practice of Internal Auditing.
Further details regarding the structure and role of the internal audit function can be found in the Internal Audit Charter, which is available from the Investor Centre on the Aveo website.
The Group’s Compliance Committee was dissolved on 7 December 2012 a due to the Board comprising a majority of independent Directors. While the Board continues to be comprised of a majority of independent Directors, it will oversee the operation of the Managed Investment Schemes (‘Schemes’) associated with the Group. On a quarterly basis, the Board monitors compliance with the Schemes’ risk management systems and compliance plans. Aveo Funds Management Limited, the Responsible Entity of the Schemes, also has a Risk Management Policy in place, which sets out the procedures required to be followed to ensure compliance with its risk management obligations under the Corporations Act and its Australian Financial Services Licence.
Certification of risk management controls
The Chief Executive Officer and the Chief Financial Officer state in writing to the Board each half year and end of financial year that the declarations made by them in accordance with section 295A of the Corporations Act in relation to the integrity of the Group’s Financial Report are founded on a sound system of risk management and internal control, and that the system is operating effectively in all material respects in relation to financial reporting risks.
The declarations from the Chief Executive Officer and the Chief Financial Officer are based on a formal sign-off framework established throughout the Group and reviewed by the Audit Committee as part of the financial reporting process.
7. REMUNERATING FAIRLY AND RESPONSIBLY
The Nomination and Remuneration Committee assists the Board in fulfilling its corporate governance and oversight responsibilities in relation to the remuneration and incentive framework for the Group’s senior executives and Directors. The structure of the Nomination and Remuneration Committee is included on page 33 of this Corporate Governance Statement.
The primary responsibilities of the Nomination and Remuneration Committee with respect to the remuneration and incentive framework are to review and recommend for approval to the Board: remuneration policies and practices which are consistent with the Group’s strategic goals and
which enable the Group to attract and retain executives and Directors who will create value for securityholders;
the quantum and structure of remuneration for Directors and senior executives, having regard to the performance of the Group, the performance of the executives and the general remuneration environment; and
policies and procedures to attract motivate and retain appropriately skilled persons to meet the Group’s needs.
Aveo Group Corporate Governance Statement (continued)
Page 43
The Nomination and Remuneration Committee may invite any executives of the Group and other external advisers to attend any meetings of the Nomination and Remuneration Committee; however, no person is responsible for assessing their own performance or solely responsible for recommending the quantum or structure of their own remuneration for Board approval. The number of meetings of the Nomination and Remuneration Committee held during the year, and a record of attendance by each member of the Committee at those meetings, is set out in the Directors’ Report. Minutes of all Nomination and Remuneration Committee meetings are provided to the Board and the Chairman of the Nomination and Remuneration Committee reports to the Board after each Nomination and Remuneration Committee meeting.
The structure of Non-Executive Directors’ remuneration and that of senior management is set out in the Remuneration Report within the Directors’ Report. Remuneration packages for senior management involve a balance between fixed and incentive-based remuneration, via participation in the Aveo Group Long-Term and Short-Term Incentive Plans (collectively ‘the Plans’), reflecting short and long-term performance objectives appropriate to the Group’s circumstances and goals. Information relating to the prohibition on engaging in activities that limit the economic risks associated with the Plans are disclosed in the Remuneration Report and the Securities Trading Policy, which is available from the Investor Centre on the Aveo website.
Non-Executive Directors’ remuneration is clearly distinguished from that of senior management, with remuneration solely by way of Directors’ fees and statutory superannuation entitlements.
Details of the nature and amount of each element of the remuneration of each Director and the key management personnel for the financial year are also disclosed in the Remuneration Report.
The 2016 Aveo Group Corporate Governance Statement was approved by the Aveo Group Board and the practices are current as of 17 August 2016.

Aveo Group 2016 Financial Report CONSOLIDATED INCOME STATEMENTS For the year ended 30 June 2016
The above consolidated income statements should be read in conjunction with the accompanying notes.
Page 44
Note2016 2015 2016 2015$m $m $m $m
Continuing operations1 319.1 191.2 - -
Revenue from rendering of services 1 108.9 94.0 - 1.0 Other revenue 1 17.3 15.0 20.9 23.6 Revenue 445.3 300.2 20.9 24.6 Cost of sales 2 (273.8) (174.4) - - Gross profit 171.5 125.8 20.9 24.6
Change in fair value of investment properties 9 78.0 37.4 - (0.7) Change in fair value of resident loans 7 (14.9) (20.6) - -
- 4.1 - - Employee expenses (39.4) (31.9) - - Marketing expenses (14.4) (10.4) (0.1) - Occupancy expenses (1.4) (1.4) - - Property expenses (2.9) (2.7) - (0.2) Administration expenses (12.3) (10.8) - - Other expenses (18.5) (7.7) (0.9) (1.1) Finance costs 2 - (3.0) - (0.5)
11.0 2.7 1.0 0.7
156.7 81.5 20.9 22.8 Income tax expense 3 (39.1) (21.2) - - Profit for the year 117.6 60.3 20.9 22.8
Profit for the year is attributable to:Owners of Aveo Group Limited 95.1 35.2 - - Non-controlling interests - owners of Aveo Group Trust 20.9 22.8 20.9 22.8
116.0 58.0 20.9 22.8 Other non-controlling interests 1.6 2.3 - -
117.6 60.3 20.9 22.8
ventures accounted for using the equity method
Sale of goods
Trust Group
Share of net gain/(loss) of associates and joint
Net profit after tax attributable to stapled securityholders of the Group
Change in fair value of derivative financial assets and liabilities
Profit from continuing operations before income tax
Group
Earnings per Security (cents per Security):Basic earnings per stapled security 20 22.1 11.6 4.0 4.6 Diluted earnings per stapled security 20 22.1 11.6 4.0 4.6
Basic earnings per stapled security 20 22.1 11.6 4.0 4.6 Diluted earnings per stapled security 20 22.1 11.6 4.0 4.6
Earnings per Security from continuing operations (cents per Security):

Aveo Group 2016 Financial Report CONSOLIDATED STATEMENTS OF COMPREHENSIVE INCOME For the year ended 30 June 2016
The above consolidated statements of comprehensive income should be read in conjunction with the accompanying notes.
Page 45
2016 2015 2016 2015$m $m $m $m
Profit for the year 117.6 60.3 20.9 22.8
Other comprehensive incomeItems that may be reclassified to profit or loss
0.5 2.2 1.3 1.7 Income tax on items of other comprehensive income - - - -
0.5 2.2 1.3 1.7
Total comprehensive income for the year 118.1 62.5 22.2 24.5
Owners of Aveo Group Limited 94.3 35.7 - - 22.2 24.5 22.2 24.5
116.5 60.2 22.2 24.5 Other non-controlling interests 1.6 2.3 - -
118.1 62.5 22.2 24.5
Total comprehensive income for the year is attributable to:
Foreign currency translation differences for foreign operations
Other comprehensive income for the year, net of tax
Non-controlling interest - owners of Aveo Group Trust
Group Trust Group
Total comprehensive income for the year attributable to stapled securityholders of the Group
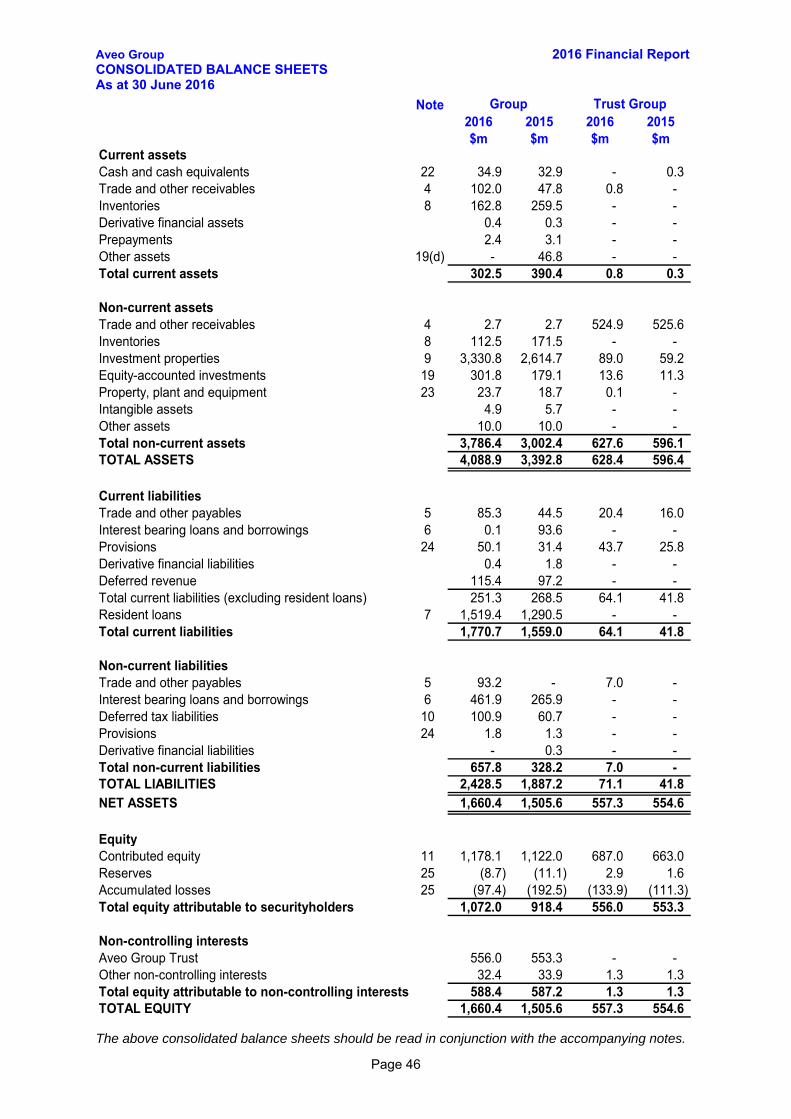
Aveo Group 2016 Financial Report CONSOLIDATED BALANCE SHEETS As at 30 June 2016
The above consolidated balance sheets should be read in conjunction with the accompanying notes.
Page 46
Note2016 2015 2016 2015$m $m $m $m
Current assetsCash and cash equivalents 22 34.9 32.9 - 0.3 Trade and other receivables 4 102.0 47.8 0.8 - Inventories 8 162.8 259.5 - - Derivative financial assets 0.4 0.3 - - Prepayments 2.4 3.1 - - Other assets 19(d) - 46.8 - - Total current assets 302.5 390.4 0.8 0.3
Non-current assetsTrade and other receivables 4 2.7 2.7 524.9 525.6 Inventories 8 112.5 171.5 - - Investment properties 9 3,330.8 2,614.7 89.0 59.2 Equity-accounted investments 19 301.8 179.1 13.6 11.3 Property, plant and equipment 23 23.7 18.7 0.1 - Intangible assets 4.9 5.7 - - Other assets 10.0 10.0 - - Total non-current assets 3,786.4 3,002.4 627.6 596.1 TOTAL ASSETS 4,088.9 3,392.8 628.4 596.4
Current liabilitiesTrade and other payables 5 85.3 44.5 20.4 16.0 Interest bearing loans and borrowings 6 0.1 93.6 - - Provisions 24 50.1 31.4 43.7 25.8 Derivative financial liabilities 0.4 1.8 - - Deferred revenue 115.4 97.2 - - Total current liabilities (excluding resident loans) 251.3 268.5 64.1 41.8 Resident loans 7 1,519.4 1,290.5 - - Total current liabilities 1,770.7 1,559.0 64.1 41.8
Non-current liabilitiesTrade and other payables 5 93.2 - 7.0 - Interest bearing loans and borrowings 6 461.9 265.9 - - Deferred tax liabilities 10 100.9 60.7 - - Provisions 24 1.8 1.3 - - Derivative financial liabilities - 0.3 - - Total non-current liabilities 657.8 328.2 7.0 - TOTAL LIABILITIES 2,428.5 1,887.2 71.1 41.8 NET ASSETS 1,660.4 1,505.6 557.3 554.6
EquityContributed equity 11 1,178.1 1,122.0 687.0 663.0 Reserves 25 (8.7) (11.1) 2.9 1.6 Accumulated losses 25 (97.4) (192.5) (133.9) (111.3) Total equity attributable to securityholders 1,072.0 918.4 556.0 553.3
Non-controlling interestsAveo Group Trust 556.0 553.3 - - Other non-controlling interests 32.4 33.9 1.3 1.3 Total equity attributable to non-controlling interests 588.4 587.2 1.3 1.3 TOTAL EQUITY 1,660.4 1,505.6 557.3 554.6
Group Trust Group

Aveo Group 2016 Financial Report CONSOLIDATED STATEMENTS OF CHANGES IN EQUITY For the year ended 30 June 2016
The above consolidated statements of changes in equity should be read in conjunction with the accompanying notes.
Page 47
Note
Contributed equity Reserves
Accumulatedlosses Total
$m $m $m $m $m $m $mBalance at 1 July 2014 1,093.8 (12.9) (227.7) 853.2 542.4 33.9 1,429.5Comprehensive income:Profit for the year 25 - - 35.2 35.2 22.8 2.3 60.3 Other comprehensive income - 0.5 - 0.5 1.7 - 2.2 Total comprehensive income for the year - 0.5 35.2 35.7 24.5 2.3 62.5 Transactions with owners in their capacity as owners:Dividends and distributions provided for 12 - - - - (25.8) - (25.8) Transactions with non-controlling interests - 0.7 - 0.7 - (2.3) (1.6) Equity-settled employee benefits 25 - 0.6 - 0.6 - - 0.6 Acquisition of treasury securities 11 (2.2) - - (2.2) (0.9) - (3.1) Securities bought back and cancelled 11 (1.0) - - (1.0) (0.4) - (1.4) Issue of securities 11 31.4 - - 31.4 13.5 - 44.9 Total transactions with owners in their capacity as owners 28.2 1.3 - 29.5 (13.6) (2.3) 13.6 Balance at 30 June 2015 1,122.0 (11.1) (192.5) 918.4 553.3 33.9 1,505.6
Comprehensive income:Profit for the year 25 - - 95.1 95.1 20.9 1.6 117.6 Other comprehensive income - (0.8) - (0.8) 1.3 - 0.5 Total comprehensive income for the year - (0.8) 95.1 94.3 22.2 1.6 118.1 Transactions with owners in their capacity as owners: - Dividends and distributions provided for 12 - - - - (43.5) - (43.5) Transactions with non-controlling interests - 1.5 - 1.5 - (3.1) (1.6) Equity-settled employee benefits 11,25 0.4 1.7 - 2.1 0.1 - 2.2 Acquisition of treasury securities 11 (2.3) - - (2.3) (1.0) - (3.3) Securities bought back and cancelled 11 (0.5) - - (0.5) (0.2) - (0.7) Issue of securities 11 58.5 - - 58.5 25.1 - 83.6 Total transactions with owners in their capacity as owners 56.1 3.2 - 59.3 (19.5) (3.1) 36.7 Balance at 30 June 2016 1,178.1 (8.7) (97.4) 1,072.0 556.0 32.4 1,660.4
Non-controlling
interest attributable
to Aveo Group Trust
Other non-controlling interests
Total equity
Attributable to securityholders of Aveo Group Limited
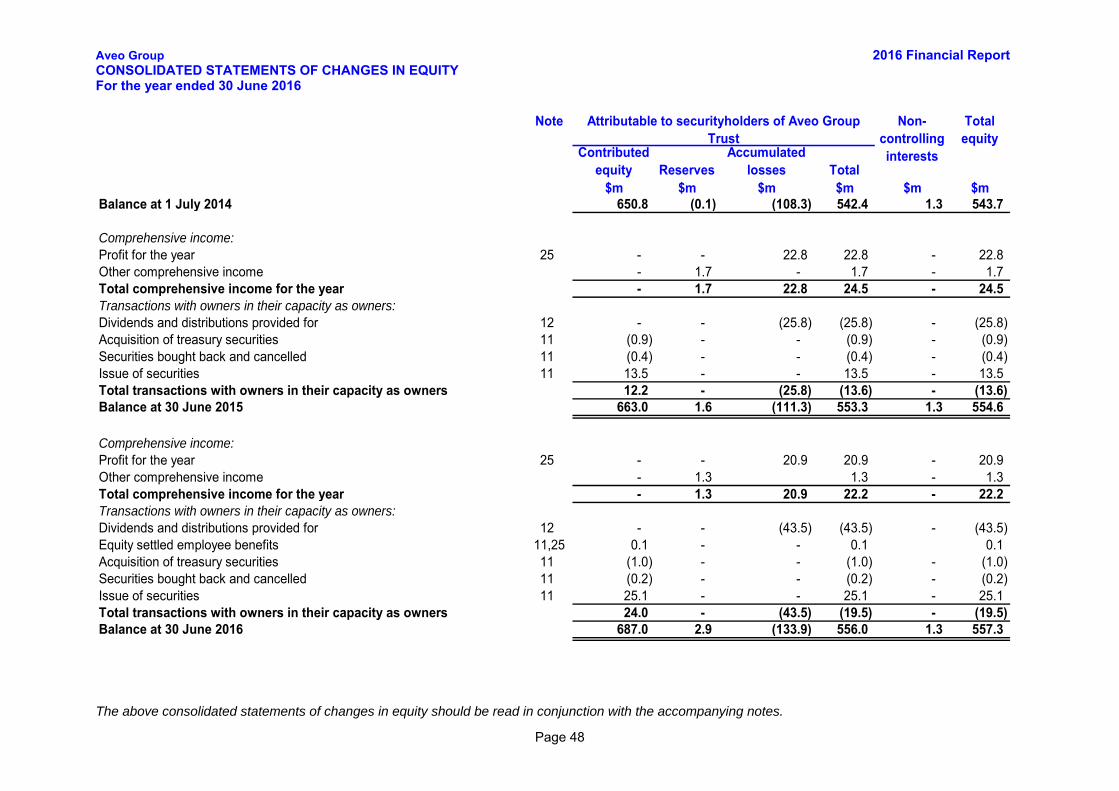
Aveo Group 2016 Financial Report CONSOLIDATED STATEMENTS OF CHANGES IN EQUITY For the year ended 30 June 2016
The above consolidated statements of changes in equity should be read in conjunction with the accompanying notes.
Page 48
Note
Contributed equity Reserves
Accumulated losses Total
$m $m $m $m $m $mBalance at 1 July 2014 650.8 (0.1) (108.3) 542.4 1.3 543.7
Comprehensive income:Profit for the year 25 - - 22.8 22.8 - 22.8 Other comprehensive income - 1.7 - 1.7 - 1.7 Total comprehensive income for the year - 1.7 22.8 24.5 - 24.5 Transactions with owners in their capacity as owners:Dividends and distributions provided for 12 - - (25.8) (25.8) - (25.8) Acquisition of treasury securities 11 (0.9) - - (0.9) - (0.9) Securities bought back and cancelled 11 (0.4) - - (0.4) - (0.4) Issue of securities 11 13.5 - - 13.5 - 13.5 Total transactions with owners in their capacity as owners 12.2 - (25.8) (13.6) - (13.6) Balance at 30 June 2015 663.0 1.6 (111.3) 553.3 1.3 554.6
Comprehensive income:Profit for the year 25 - - 20.9 20.9 - 20.9 Other comprehensive income - 1.3 1.3 - 1.3 Total comprehensive income for the year - 1.3 20.9 22.2 - 22.2 Transactions with owners in their capacity as owners:Dividends and distributions provided for 12 - - (43.5) (43.5) - (43.5) Equity settled employee benefits 11,25 0.1 - - 0.1 0.1 Acquisition of treasury securities 11 (1.0) - - (1.0) - (1.0) Securities bought back and cancelled 11 (0.2) - - (0.2) - (0.2) Issue of securities 11 25.1 - - 25.1 - 25.1 Total transactions with owners in their capacity as owners 24.0 - (43.5) (19.5) - (19.5) Balance at 30 June 2016 687.0 2.9 (133.9) 556.0 1.3 557.3
Attributable to securityholders of Aveo Group Trust
Non-controlling interests
Total equity

Aveo Group 2016 Financial Report CONSOLIDATED CASH FLOW STATEMENTS For the year ended 30 June 2016
The above consolidated cash flow statements should be read in conjunction with the accompanying notes.
Page 49
Note
2016 2015 2016 2015$m $m $m $m
Cash flows from operating activitiesReceipts from customers 562.0 430.8 - 1.0 Payments to suppliers and employees (230.3) (288.6) (0.6) (2.4) Interest received 1.3 1.4 - -
(11.2) (24.6) - (0.5) Dividends and distributions received 0.1 - - - GST (paid)/recovered (28.8) (6.9) - 0.1 Net cash flows from/(used in) operating activities 27(a) 293.1 112.1 (0.6) (1.8)
Cash flows from investing activitiesPayments for property, plant and equipment (6.7) (0.9) - - Proceeds from sale of property, plant and equipment 0.4 - - - Payments for intangible assets (0.9) (4.2) - -
(138.3) (61.2) (20.0) (4.9) Proceeds from the sale of investment properties - 19.8 - 19.8 Payments for equity-accounted investments (111.3) (35.2) - - Return of equity from equity-accounted investments - 7.8 - - Payments for acquisition of non-controlling interests (3.3) (2.9) - - Payments for acquisition of subsidiaries 17(b) (8.8) - - - Loans to related parties - - (24.4) (9.1) Repayment of loans by related parties - - 71.7 27.9 Net cash flows (used in)/from investing activities (268.9) (76.8) 27.3 33.7
Cash flows from financing activitiesPayments for security buyback (4.0) (4.5) (1.2) (1.4) Dividends and distributions paid (25.8) (20.0) (25.8) (20.0) Payments for settlement of derivative - (15.7) - - Proceeds from borrowings 466.3 405.2 - - Repayment of borrowings (458.7) (391.2) - (11.3) Net cash flows used in financing activities (22.2) (26.2) (27.0) (32.7)
Net increase/(decrease) in cash and cash equivalents 2.0 9.1 (0.3) (0.8) Cash and cash equivalents at the beginning of the year 32.9 23.8 0.3 1.1 Cash and cash equivalents at the end of the year 22 34.9 32.9 - 0.3
Group Trust Group
Payments for investment properties, including investment properties classified as held-for-sale
Finance costs including interest and other costs of finance paid

Aveo Group 2016 Financial Report Notes to the consolidated financial statements For the year ended 30 June 2016
Page 50
These are the consolidated financial statements of Aveo Group, which is a stapled entity comprising Aveo Group Limited and its subsidiaries, and Aveo Group Trust and its subsidiaries. The consolidated financial statements of Aveo Group Trust comprise Aveo Group Trust and its subsidiaries. A list of major subsidiaries is given in note 18 in section C. Details of the stapling arrangement are given in note 32(a) in Appendix 2.
The Parent and the Property Trust are domiciled and formed in Australia. Their registered office and principal place of business is Level 5, 99 Macquarie Street, Sydney, New South Wales.
The financial statements are presented in the Australian currency.
The notes to the consolidated financial statements are set out in the following main sections. Each section or note explains the accounting policies relevant to that section or note. Other significant accounting policies are given in note 32 in Appendix 2.
PageSection A. How the numbers are calculated 50Section B. Risk management 70Section C. Group structure 76Section D Unrecognised items 80Appendices:
Appendix 1 How the numbers are calculated – other items 81Appendix 2 Other information 87
Immaterial disclosures have been omitted.
SECTION A. HOW THE NUMBERS ARE CALCULATED
This section provides details of those individual items in the financial statements that the directors consider most relevant in the context of the operations of the Group. It also explains what accounting policies have been applied to determine these items and how their amounts were affected by significant estimates and judgements. The section includes the following notes:
PageSection A1. Profit and loss information Note 1 Revenue 51Note 2 Particular expenses 53Note 3 Income tax expense 54 Section A2. Financial assets and liabilities Note 4 Trade and other receivables 55Note 5 Trade and other payables 56Note 6 Interest bearing loans and borrowings 56Note 7 Resident loans 58 Section A3. Non-financial assets and liabilities Note 8 Inventories 59Note 9 Investment properties 60Note 10 Deferred tax assets and liabilities 63 Section A4. Equity Note 11 Contributed equity 65Note 12 Dividends and distributions 66 Section A5. Segment information Note 13 Segment information 67
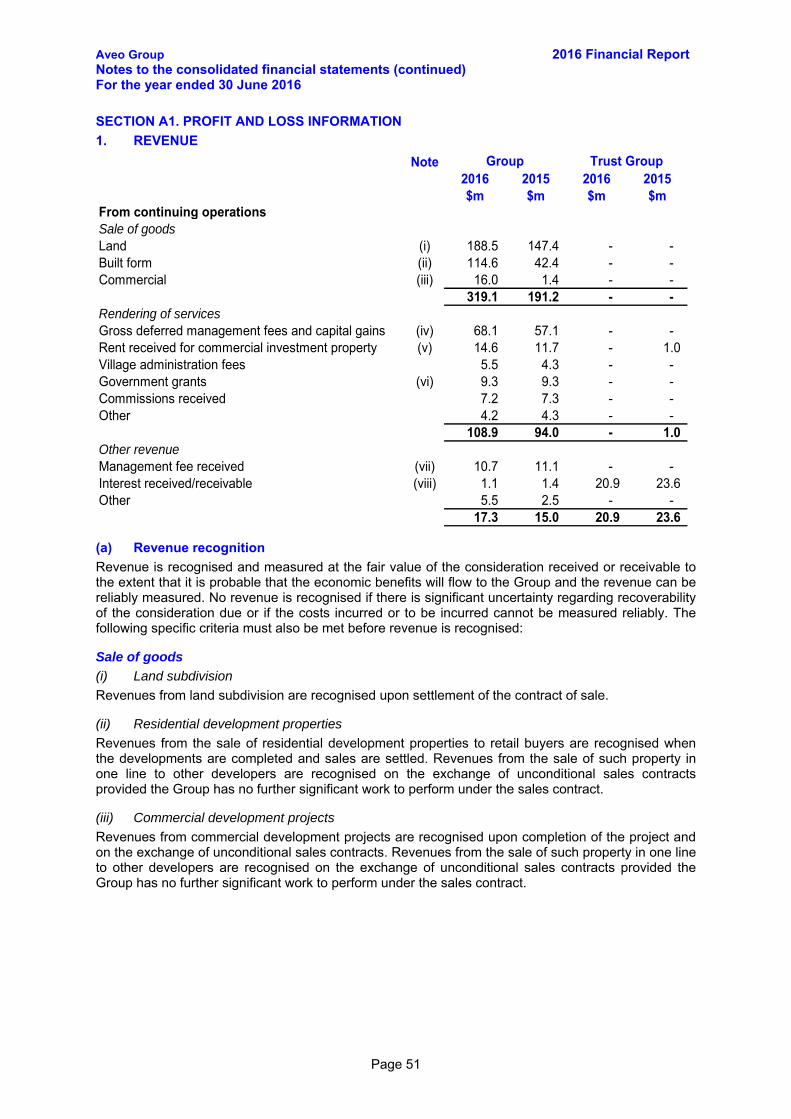
Aveo Group 2016 Financial Report Notes to the consolidated financial statements (continued) For the year ended 30 June 2016
Page 51
SECTION A1. PROFIT AND LOSS INFORMATION
1. REVENUE
Note2016 2015 2016 2015$m $m $m $m
From continuing operationsSale of goods Land (i) 188.5 147.4 - - Built form (ii) 114.6 42.4 - - Commercial (iii) 16.0 1.4 - -
319.1 191.2 - - Rendering of servicesGross deferred management fees and capital gains (iv) 68.1 57.1 - - Rent received for commercial investment property (v) 14.6 11.7 - 1.0 Village administration fees 5.5 4.3 - - Government grants (vi) 9.3 9.3 - - Commissions received 7.2 7.3 - - Other 4.2 4.3 - -
108.9 94.0 - 1.0 Other revenueManagement fee received (vii) 10.7 11.1 - - Interest received/receivable (viii) 1.1 1.4 20.9 23.6 Other 5.5 2.5 - -
17.3 15.0 20.9 23.6
Group Trust Group
(a) Revenue recognition
Revenue is recognised and measured at the fair value of the consideration received or receivable to the extent that it is probable that the economic benefits will flow to the Group and the revenue can be reliably measured. No revenue is recognised if there is significant uncertainty regarding recoverability of the consideration due or if the costs incurred or to be incurred cannot be measured reliably. The following specific criteria must also be met before revenue is recognised:
Sale of goods
(i) Land subdivision
Revenues from land subdivision are recognised upon settlement of the contract of sale.
(ii) Residential development properties
Revenues from the sale of residential development properties to retail buyers are recognised when the developments are completed and sales are settled. Revenues from the sale of such property in one line to other developers are recognised on the exchange of unconditional sales contracts provided the Group has no further significant work to perform under the sales contract.
(iii) Commercial development projects
Revenues from commercial development projects are recognised upon completion of the project and on the exchange of unconditional sales contracts. Revenues from the sale of such property in one line to other developers are recognised on the exchange of unconditional sales contracts provided the Group has no further significant work to perform under the sales contract.
Aveo Group 2016 Financial Report Notes to the consolidated financial statements (continued) For the year ended 30 June 2016
Page 52
1. REVENUE (continued)
Rendering of services
When the outcome of a contract to provide services can be estimated reliably, revenue is recognised by reference to the percentage of the services performed, specifically:
(iv) Gross deferred management fees and capital gain
DMF revenue on retirement village investment property is earned while the resident occupies the independent living unit or serviced apartment and is recognised as income over the resident’s expected tenure. The expected tenure is calculated with reference to Australian Bureau of Statistics current data relating to life expectancy and historical trends of rollovers within the Group. DMF revenue is not discounted to present value, as the income is received by reduction of the existing resident loan on its settlement (see note 7).
DMF revenue from each resident is amortised over the expected period of tenure of the resident and is based on: for ‘entry’-based contracts, the entry market value of the underlying unit; and for ‘exit’-based contracts, the current market value of the underlying unit.
DMF revenue to which the Group is contractually entitled at reporting date is presented in the balance sheet as a deduction from resident loans. The excess of DMF revenue to which the Group is contractually entitled at reporting date, over DMF revenue earned to date by amortisation over the expected period of tenure, is included in deferred revenue in the balance sheet.
(v) Gross rental income
Rental income from operating leases over commercial investment property is recognised on a straight-line basis over the lease term. Rent not received at balance date is reflected in the balance sheet as a receivable, or if paid in advance, as deferred revenue. Lease incentives granted are recognised over the lease term, on a straight-line basis, as a reduction of rent.
(vi) Government grants
Grants from the government are recognised at their fair value when there is reasonable assurance that the grant will be received and the Group will comply with all attached conditions.
(vii) Management fee revenue
Management fees are recognised when the relevant entity has performed the associated services to which the management fees relate.
(viii) Interest revenue
Interest revenue is recognised in the income statement as it accrues using the effective interest method.

Aveo Group 2016 Financial Report Notes to the consolidated financial statements (continued) For the year ended 30 June 2016
Page 53
2. PARTICULAR EXPENSES
2016 2015 2016 2015$m $m $m $m
Depreciation 1.5 1.0 - -
Amortisation 1.2 1.0 - -
Finance costs at amortised cost
13.3 27.1 - 0.5 Less: capitalised finance costs (13.3) (24.1) - -
- 3.0 - 0.5
Group Trust Group
Interest and amortisation of borrowing costs from bank loans and overdraft
Profit from continuing operations before income tax includes the following significant expenses:
Finance costs have been capitalised during the year as part of the carrying amounts of the following assets:
11.1 24.1 - - 2.2 - - -
13.3 24.1 - -
Inventories - land and development properties held for resaleInvestment properties under construction
Interest was capitalised at a weighted average rate of 3.7% (2015: 7.5%).
Utilisation of impairment of assetsInventories (included in cost of goods sold) 34.6 19.8 - -

Aveo Group 2016 Financial Report Notes to the consolidated financial statements (continued) For the year ended 30 June 2016
Page 54
3. INCOME TAX EXPENSE
2016 2015 2016 2015$m $m $m $m
(a) Income tax expenseCurrent income taxCurrent income tax charge - - - - Deferred income taxCurrent year movement 38.4 21.1 - - Under/(over) provisions 0.7 0.1 - -
39.1 21.2 - -
(b)
Accounting profit before income tax 156.7 81.5 20.9 22.8 Income tax at the Australian tax rate of 30% (2015: 30%) 47.0 24.5 6.3 6.8
Non-assessable Trust Group income (6.3) (6.8) (6.3) (6.8) Equity accounted profits (3.0) (0.6) - - Other 0.7 4.0 - -
38.4 21.1 - - Prior years' under provisions 0.7 0.1 - - Income tax expense 39.1 21.2 - -
Trust Group
Income tax expense reported in the income statement
Tax effect of amounts which are not deductible/(taxable) in calculating taxable income
Numerical reconciliation between aggregate tax expense recognised in the incomestatement and tax expense calculated at the statutory income tax rate
Group
(c) Accounting for current income tax
Current tax assets and liabilities for the current period are measured at the amount expected to be recovered from or paid to the taxation authorities based on the current period’s taxable income. The tax rates and tax laws used to compute the amount are those that are enacted or substantively enacted at the reporting date.
Property Trust taxation
Under current tax legislation, the Property Trust is not liable for income tax, provided its unitholders are presently entitled to its income. Any tax allowances for building and plant and equipment are distributed to unitholders in the form of a tax-deferred component of distributions.
Tax losses and realised capital losses are not distributed to unitholders but are carried forward in the Property Trust to be offset against future taxable income and capital gains of the Property Trust.
SECTION A2. FINANCIAL ASSETS AND LIABILITIES
Accounting for financial assets
Financial assets within the scope of AASB 139 Financial Instruments: Recognition and Measurement are classified as either ‘financial assets at fair value through profit or loss’, ‘held-to-maturity investments’, ‘loans and receivables’ or ‘available-for-sale financial assets’. The classification depends on the purpose for which the investments were acquired.
When financial assets are recognised initially, they are measured at fair value plus, in the case of investments not at fair value through profit or loss, directly attributable transaction costs.
The Group does not presently have any financial assets classified as ‘financial assets at fair value through profit or loss’, ‘held-to-maturity investments’ or ‘available-for-sale financial assets’.

Aveo Group 2016 Financial Report Notes to the consolidated financial statements (continued) For the year ended 30 June 2016
Page 55
4. TRADE AND OTHER RECEIVABLES
2016 2015 2016 2015$m $m $m $m
CurrentTrade receivables 80.8 38.5 0.8 - Other receivables 21.8 24.7 - - Allowance for impairment (3.8) (17.4) - -
98.8 45.8 0.8 - Due from other related parties - non-interest bearing 3.2 2.0 - - Total current receivables 102.0 47.8 0.8 -
Non-currentTrade receivables 2.0 2.0 - - Other receivables 0.7 0.7 - -
2.7 2.7 - - Due from Parent - interest bearing1 - - 524.9 525.6 Total non-current receivables 2.7 2.7 524.9 525.6
Group Trust Group
For terms and conditions relating to receivables due from the Parent, refer to note 28(b). 1.
(a) Accounting for trade and other receivables
Loans and receivables are non-derivative financial assets with fixed or determinable payments that are not quoted in an active market. Such assets are carried at amortised cost using the effective interest rate method, less any allowance for impairment. Gains or losses are recognised in profit or loss when the loans and receivables are derecognised or impaired. These assets are classified as current, except for those with maturities greater than 12 months after balance date, which are classified as non-current.
Individual debts that are known to be uncollectible are written off when identified. An impairment is recognised when there is objective evidence that the Group will not be able to collect the receivable. Indicators of impairment include where there is objective evidence of significant financial difficulties, debtor bankruptcy, financial reorganisation or default in payment. The amount of the impairment loss is the receivable’s carrying amount compared to the present value of estimated future cash flows, discounted at the original effective interest rate.
An impairment loss is reversed if the reversal can be related objectively to an event occurring after the impairment loss was recognised.
(b) Fair value and credit risk
The maximum exposure to credit risk is the fair value of receivables, except for receivables secured by first registered mortgage. The fair values of trade and other receivables approximate their carrying amount.

Aveo Group 2016 Financial Report Notes to the consolidated financial statements (continued) For the year ended 30 June 2016
Page 56
5. TRADE AND OTHER PAYABLES
2016 2015 2016 2015$m $m $m $m
CurrentTrade accounts payable 37.5 24.3 - - Other payables 46.0 19.0 4.3 0.4 Payable to Parent - - 16.1 15.6 Interest payable 1.8 1.2 - - Total current payables 85.3 44.5 20.4 16.0
Non-currentDeferred payment for Freedom acquisition (note 17) 30.9 - - - Deferred payment for development land acquired 62.3 - 7.0 - Total non-current trade payables 93.2 - 7.0 -
Group Trust Group
(a) Accounting for trade and other payables
Trade and other payables are carried at amortised cost. They represent liabilities for goods and services provided to the Group prior to the end of the financial year that are unpaid and arise when the Group becomes obliged to make future payments in respect of the purchase of these goods and services.
During the financial year, the Group acquired land for retirement development on deferred payment terms. The carrying amount of the deferred payment for the land has been calculated as the present value of anticipated future payments and is classified as non-current as it is not due in the 12 months subsequent to year end.
6. INTEREST BEARING LOANS AND BORROWINGS
2016 2015 2016 2015$m $m $m $m
CurrentSecuredBank loans (note 6b) - 93.1 - - Other loans 0.1 0.5 - -
0.1 93.6 - -
Non-currentSecuredBank loans (note 6b) 461.5 265.9 - - Other loans 0.4 - - -
461.9 265.9 - -
Group Trust Group
(a) Accounting for interest bearing loans and borrowings
Interest bearing loans and borrowings are initially recognised at the fair value of the consideration received less directly attributable transaction costs. After initial recognition, interest bearing loans and borrowings are subsequently measured at amortised cost using the effective interest rate method. Borrowings are classified as current liabilities unless the Group has an unconditional right to defer settlement of the liability for at least 12 months after the reporting date.

Aveo Group 2016 Financial Report Notes to the consolidated financial statements (continued) For the year ended 30 June 2016
Page 57
6. INTEREST BEARING LOANS AND BORROWINGS (continued)
Borrowing costs
Borrowing costs directly attributable to the acquisition, construction or production of a qualifying asset (i.e. an asset that necessarily takes a substantial period to get ready for its intended use or sale) are capitalised as part of the cost of that asset. For non-specific borrowings, borrowing costs are capitalised using a weighted average capitalisation rate. All other borrowing costs are expensed in the period they occur. Borrowing costs consist of interest and other costs that the Group incurs in connection with the borrowing of funds.
(b) Bank loans
The weighted average interest rate including margin and line fees on all bank loans (including both drawn and undrawn amounts) at 30 June 2016 was 3.4% (2015: 4.0%).
(c) Financing arrangements
The Group has access to the following lines of credit:
2016 2015 2016 2015$m $m $m $m
Group Trust Group
Total facilities availableBank loans (including bank overdraft) 624.4 468.1 - - Bank guarantee and insurance bond facilities 67.6 42.6 - -
692.0 510.7 - - Facilities utilised at balance dateBank loans (including bank overdraft) 461.5 359.0 - - Bank guarantee and insurance bond facilities 36.3 28.4 - -
497.8 387.4 - - Facilities not utilised at balance dateBank loans (including bank overdraft) 162.9 109.1 - - Bank guarantee and insurance bond facilities 31.3 14.2 - -
194.2 123.3 - -
Borrowings not listed in this table are fully drawn.
(d) Restrictions as to use or withdrawal
The facilities are subject to the Group complying with covenants concerning such matters as minimum interest times cover, maximum loan-to-value ratio, current ratios and net tangible assets (see note 16).
(e) Assets pledged as security
In accordance with the security arrangements of the bank loans, all current and non-current assets of the Group are secured by floating charge. Those assets that are also secured by mortgage are:
2016 2015 2016 2015$m $m $m $m
Group Trust Group
CurrentInventories 159.2 258.9 - -
159.2 258.9 - -
Non-currentInventories 112.5 171.5 - - Investment properties 2,904.6 2,556.2 89.0 -
3,017.1 2,727.7 89.0 -

Aveo Group 2016 Financial Report Notes to the consolidated financial statements (continued) For the year ended 30 June 2016
Page 58
6. INTEREST BEARING LOANS AND BORROWINGS (continued)
(f) Defaults and breaches
During the current and prior year, there were no defaults or breaches on any of the loans.
7. RESIDENT LOANS
Resident loans are classified as financial liabilities at fair value through profit and loss with resulting fair value adjustments recognised in the income statement. Fair value is the amount payable on demand and is measured at the principal amount plus the residents’ share of any increases in market value to reporting date less deferred management fees contractually accruing to reporting date.
Resident loans are non-interest bearing and are payable at the end of the resident contract. They are classified as current liabilities because the Group does not have an unconditional right to defer settlement for at least 12 months after reporting date. In practice, the rate at which the Group’s retirement residents vacate their units, and hence the rate at which the resident loans will fall due for repayment, can be estimated based on statistical tables. The Group’s best estimate is that, of the total resident loans of $1,519.4 million (2015: $1,290.5 million), only $82.3 million (2015: $149.0 million) is expected to become payable within the next 12 months.
Resident loans are presented net of deferred management fees contractually accrued to reporting date and other amounts owing by residents, which are offset against the repayment of the loan on settlement following the resident’s departure.
The following table presents the changes in resident loans for the financial year.
2016 2015$m $m
Opening balance 1,290.5 1,258.8 Items recognised in profit or loss:
Deferred management fees (68.1) (57.1) Change in fair value of resident loans 14.9 20.6
Acquisition of Freedom 169.4 - Net cash receipts on resident departures and arrivals 112.7 68.2 Closing balance 1,519.4 1,290.5
Group
Resident loans are classified as level 3 in the fair value hierarchy. This means that a key assumption used in their valuation is not directly observable. This key assumption is the aggregate current market value of the occupied retirement units of $2,212.3 million (2015: $1,835.2 million). This was determined on the same basis as the market value of both occupied and unoccupied units used as an input to the fair value of retirement villages – see note 9(b). If the value used for this input was 5% higher, the fair value of these loans would be $51.1 million higher (2015: $47.5 million higher), and the input was 5% lower, the fair value of these loans would be $55.6 million lower (2015: $51.3 million lower). The effect of changing that current market value on the fair value of the related investment properties would be greater.
An explanation of the fair value hierarchy is given in note 15(e).
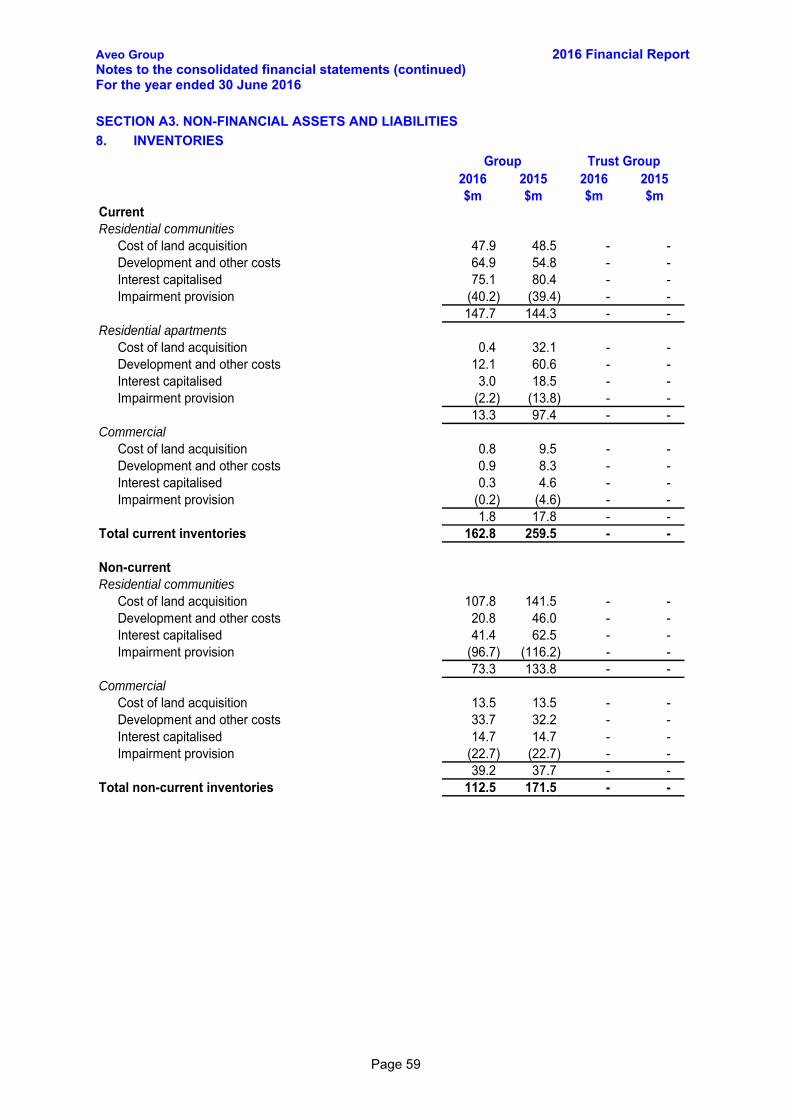
Aveo Group 2016 Financial Report Notes to the consolidated financial statements (continued) For the year ended 30 June 2016
Page 59
SECTION A3. NON-FINANCIAL ASSETS AND LIABILITIES
8. INVENTORIES
2016 2015 2016 2015$m $m $m $m
CurrentResidential communities
Cost of land acquisition 47.9 48.5 - - Development and other costs 64.9 54.8 - - Interest capitalised 75.1 80.4 - - Impairment provision (40.2) (39.4) - -
147.7 144.3 - - Residential apartments
Cost of land acquisition 0.4 32.1 - - Development and other costs 12.1 60.6 - - Interest capitalised 3.0 18.5 - - Impairment provision (2.2) (13.8) - -
13.3 97.4 - - Commercial
Cost of land acquisition 0.8 9.5 - - Development and other costs 0.9 8.3 - - Interest capitalised 0.3 4.6 - - Impairment provision (0.2) (4.6) - -
1.8 17.8 - - Total current inventories 162.8 259.5 - -
Non-currentResidential communities
Cost of land acquisition 107.8 141.5 - - Development and other costs 20.8 46.0 - - Interest capitalised 41.4 62.5 - - Impairment provision (96.7) (116.2) - -
73.3 133.8 - - Commercial
Cost of land acquisition 13.5 13.5 - - Development and other costs 33.7 32.2 - - Interest capitalised 14.7 14.7 - - Impairment provision (22.7) (22.7) - -
39.2 37.7 - - Total non-current inventories 112.5 171.5 - -
Group Trust Group

Aveo Group 2016 Financial Report Notes to the consolidated financial statements (continued) For the year ended 30 June 2016
Page 60
8. INVENTORIES (continued)
(a) Accounting for inventories
Inventories are carried at the lower of cost and net realisable value.
Cost includes the costs of acquisition, development and holding costs such as borrowing costs, rates and taxes. Borrowing costs are capitalised where the development is regarded as a qualifying asset. Holding costs incurred after completion of development are expensed.
Net realisable value is determined based on sales for each class of inventory in the ordinary course of business less estimated costs of completion and the estimated costs necessary to make the sale.
The amount of any write-down of inventories to net realisable value is recognised as an expense in the income statement. The amount of any reversal of write-down of inventory arising from a change in the circumstances that gave rise to the original write-down is recognised as a reduction in the impairment of inventories in the balance sheet and recognised as a reduction of expense in the income statement.
(b) Inventory pledged as security
Inventory is pledged as first mortgage or floating charge security for bank loans. Details are given in note 6(e).
9. INVESTMENT PROPERTIES
2016 2015 2016 2015$m $m $m $m
At fair valueBalance at the beginning of the year 2,614.7 2,491.1 59.2 15.9 Acquisition of Freedom 392.1 - - - Acquisition of investment properties - 39.5 - 39.5 Acquisition of development land 67.3 - 12.0 - Capitalised subsequent expenditure 175.7 46.2 17.8 3.8 Capitalised tenant incentives 4.0 0.1 - - Amortisation of tenant incentives (1.5) (0.8) - - Straight-line lease revenue recognition 0.5 0.5 - - Change in fair value of investment properties1,2 78.0 38.1 - - Balance at the end of the year 3,330.8 2,614.7 89.0 59.2
1 Excludes change in fair value of resident loans.
2 Excludes change in fair value of investment properties classified as held-for-sale at the beginning of the year, being: - (0.7) - (0.7)
Leasing arrangements
Within one year 12.1 9.0 - - Later than one year but not later than five years 42.4 37.5 - - Later than five years 34.5 37.5 - -
89.0 84.0 - -
Group Trust Group
Minimum lease payments due to the Group under non-cancellable operating leases of investment property not recognised in the financial statements are receivable as follows:

Aveo Group 2016 Financial Report Notes to the consolidated financial statements (continued) For the year ended 30 June 2016
Page 61
9. INVESTMENT PROPERTIES (continued)
(a) Accounting for investment properties
Investment properties comprise investment interests in land and buildings (including integral plant and equipment) held to produce rental income and capital appreciation.
Investment properties are measured initially at cost, including transaction costs. The carrying amount includes the cost incurred in replacing part of an existing investment property if it is probable that the future economic benefits embodied within that part will flow to the Group and the cost can be measured reliably. All other costs are recognised in the income statement as an expense as incurred. Subsequent to initial recognition, investment properties are measured at fair value, being the estimated price that would be received on sale in an orderly transaction between market participants at the reporting date. Gains or losses arising from changes in the fair values of investment properties are recognised in the income statement in the year in which they arise.
(b) Retirement villages
Retirement villages are investment properties held to earn revenues and capital appreciation over the long-term, comprising independent living units, serviced apartments, common facilities and integral plant and equipment.
Fair value has been determined by Directors’ valuation using the discounted cash flow valuation methodology. These valuations are based on projected cash flows using resident contracts and the current market value of individual retirement units. In determining these market values, a rolling program of external valuations is undertaken so that each unit is independently valued every three years. During the intervening period, management separately assesses the value of individual units on a six-monthly basis to incorporate current pricing and market conditions.
Estimates of fair value are prepared by management and presented to the Audit Committee, which recommends their adoption to the Directors. The Audit Committee has the benefit of an independent review of management’s estimate.
Retirement villages are classified as level 3 in the fair value hierarchy. This means that key assumptions used in their valuation are not directly observable. These key assumptions are: the discount rate of 12.5% to 14.5% (2015: 12.5%); the aggregate current market value of the individual retirement units of $2,438.7 million (2015:
$1,886.5 million) (the increase mostly reflects the inclusion of the Freedom portfolio); property price growth rates of 3.5% to 4.0% in the medium term and 3.5% to 4.25% in the long
term (2015: 3.5% to 4.0% in the medium term and 3.5% to 4.25% in the long term); and average subsequent tenure period of ten years for independent living units (ILU) and four years
for serviced apartments (SA) (2015: ILU: ten years, SA: four years).
Increasing the assumptions made about the aggregate market value of the individual retirement units and long-term property price growth rates would increase the fair value of the retirement villages (and vice-versa). Increasing the assumptions made about the discount rate and average tenure periods would reduce the fair value of the retirement villages (and vice-versa).
An explanation of the fair value hierarchy is given in note 15(e).
Previously, the Group had a contingent commitment to acquire land for retirement village development. The Group has now acquired that land. The minimum amount payable at 30 June 2015, if the contingency had been removed at that date, was $53.1 million.

Aveo Group 2016 Financial Report Notes to the consolidated financial statements (continued) For the year ended 30 June 2016
Page 62
9. INVESTMENT PROPERTIES (continued)
(c) Commercial and retail properties
The carrying amount of investment property is the fair value of the property as determined by Directors’ valuations. The Directors’ valuations were based on current market offers and external valuations performed during the financial year by an independent appraiser with a recognised professional qualification and recent experience in the location and category of property being valued. In addition, the valuations were updated for market conditions as at 30 June 2016. Fair values of the Group’s investment properties were determined with regard to recent market transactions of similar properties in similar locations to the Group’s investment properties, capitalised rental returns and discounted cash flows.
Commercial and retail properties are also classified as level 3 in the fair value hierarchy. The key assumption used in their valuation is the capitalisation rate used in the Directors’ valuation, which was a range of 6.0% to 9.0% (2015: 7.0% to 8.5%). Increasing the capitalisation rate would reduce the fair value of these properties (and vice-versa).
(d) Valuation reconciliation
Valuations are reconciled to the investment properties carrying amount as follows:
2016 2015 2016 2015$m $m $m $m
Group Trust Group
Carrying amount of investment properties 3,330.8 2,614.7 89.0 59.2 Less:
Resident loans (1,519.4) (1,290.5) - - Deferred revenue (115.4) (97.2) - - Deferred payment for development land (62.3) - (7.0) -
Valuation 1,633.7 1,227.0 82.0 59.2 Comprising:Retirement:
1,157.6 916.5 - - New and buyback units available for occupancy 143.8 46.0 - - Under construction 180.8 140.7 82.0 59.2
1,482.2 1,103.2 82.0 59.2 Commercial and retail properties 151.5 123.8 - -
1,633.7 1,227.0 82.0 59.2
Net present value of annuity streams - units sold or leased
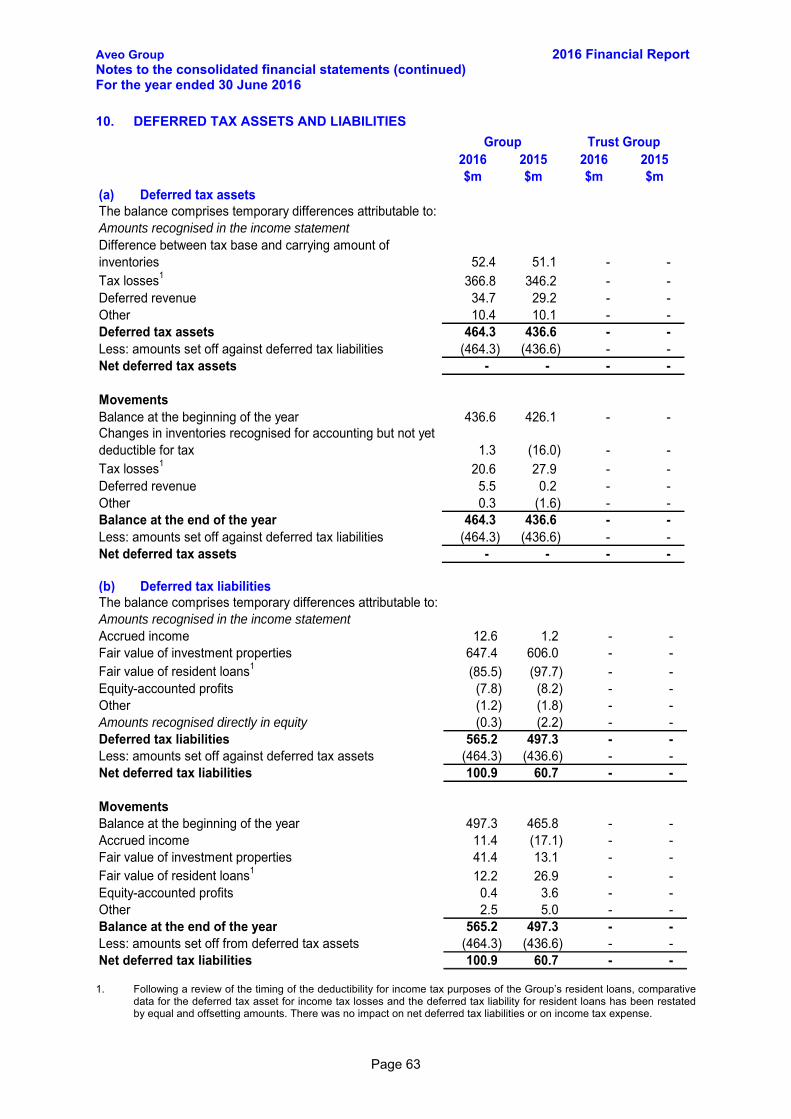
Aveo Group 2016 Financial Report Notes to the consolidated financial statements (continued) For the year ended 30 June 2016
Page 63
10. DEFERRED TAX ASSETS AND LIABILITIES
2016 2015 2016 2015$m $m $m $m
Trust GroupGroup
(a) Deferred tax assetsThe balance comprises temporary differences attributable to:Amounts recognised in the income statement
52.4 51.1 - - Tax losses1 366.8 346.2 - - Deferred revenue 34.7 29.2 - - Other 10.4 10.1 - - Deferred tax assets 464.3 436.6 - - Less: amounts set off against deferred tax liabilities (464.3) (436.6) - - Net deferred tax assets - - - -
MovementsBalance at the beginning of the year 436.6 426.1 - -
1.3 (16.0) - - Tax losses1 20.6 27.9 - - Deferred revenue 5.5 0.2 - - Other 0.3 (1.6) - - Balance at the end of the year 464.3 436.6 - - Less: amounts set off against deferred tax liabilities (464.3) (436.6) - - Net deferred tax assets - - - -
Changes in inventories recognised for accounting but not yet deductible for tax
Difference between tax base and carrying amount of inventories
(b) Deferred tax liabilitiesThe balance comprises temporary differences attributable to:Amounts recognised in the income statementAccrued income 12.6 1.2 - - Fair value of investment properties 647.4 606.0 - - Fair value of resident loans1 (85.5) (97.7) - - Equity-accounted profits (7.8) (8.2) - -
(1.2) (1.8) - - Amounts recognised directly in equity (0.3) (2.2) - - Deferred tax liabilities 565.2 497.3 - - Less: amounts set off against deferred tax assets (464.3) (436.6) - - Net deferred tax liabilities 100.9 60.7 - -
MovementsBalance at the beginning of the year 497.3 465.8 - - Accrued income 11.4 (17.1) - - Fair value of investment properties 41.4 13.1 - - Fair value of resident loans1 12.2 26.9 - - Equity-accounted profits 0.4 3.6 - -
2.5 5.0 - - Balance at the end of the year 565.2 497.3 - - Less: amounts set off from deferred tax assets (464.3) (436.6) - - Net deferred tax liabilities 100.9 60.7 - -
Other
Other
Following a review of the timing of the deductibility for income tax purposes of the Group’s resident loans, comparative 1.data for the deferred tax asset for income tax losses and the deferred tax liability for resident loans has been restated by equal and offsetting amounts. There was no impact on net deferred tax liabilities or on income tax expense.

Aveo Group 2016 Financial Report Notes to the consolidated financial statements (continued) For the year ended 30 June 2016
Page 64
10. DEFERRED TAX ASSETS AND LIABILITIES (continued) (c) Tax losses
156.3 156.3 - -
46.9 46.9 - - Potential tax benefit at Australian tax rate of 30% (2015: 30%)
Unused losses for which no deferred tax asset has been recognised
These mainly comprise Australian capital losses.
(d) Accounting for deferred tax
Deferred income tax is provided on all temporary differences at the reporting date between the tax bases of assets and liabilities and their carrying amount for financial reporting purposes.
Deferred income tax liabilities are recognised for all taxable temporary differences. However, such liabilities are not recognised when the taxable temporary difference is associated with investments in subsidiaries, associates or interests in joint ventures, the timing of the reversal of the temporary difference can be controlled and it is probable that the temporary difference will not reverse in the foreseeable future.
Deferred income tax assets are recognised for all deductible temporary differences, carry-forward or unused tax credits and unused tax losses, to the extent that it is probable that taxable profit will be available against which the deductible temporary differences and the carry-forward of unused tax credits and unused tax losses can be utilised. However, such liabilities are not recognised when the deductible temporary difference is associated with investments in subsidiaries, associates or joint ventures, in which case a deferred tax asset is only recognised to the extent that it is probable that the temporary difference will reverse in the foreseeable future and taxable profit will be available against which the temporary difference can be utilised.
Deferred income tax assets and deferred income tax liabilities are measured at the tax rates that are expected to apply to the financial year when the asset is realised or the liability is settled, based on tax rates (and tax laws) that have been enacted or substantively enacted at the reporting date.
Deferred income tax assets and deferred income tax liabilities are offset only if a legally enforceable right exists to set off current tax assets against current tax liabilities and the deferred tax assets and liabilities relate to the same taxable entity and the same taxation authority.
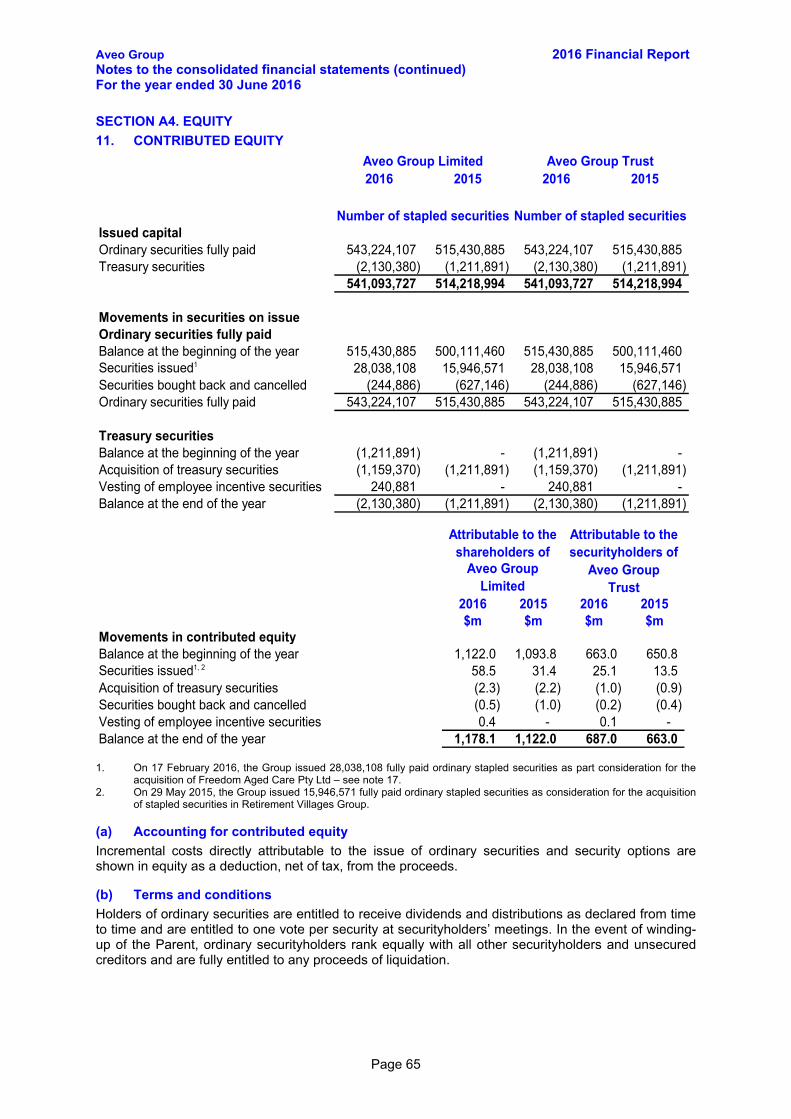
Aveo Group 2016 Financial Report Notes to the consolidated financial statements (continued) For the year ended 30 June 2016
Page 65
SECTION A4. EQUITY
11. CONTRIBUTED EQUITY
2016 2015 2016 2015
Issued capitalOrdinary securities fully paid 543,224,107 515,430,885 543,224,107 515,430,885 Treasury securities (2,130,380) (1,211,891) (2,130,380) (1,211,891)
541,093,727 514,218,994 541,093,727 514,218,994
Movements in securities on issueOrdinary securities fully paid
515,430,885 500,111,460 515,430,885 500,111,460 Securities issued1 28,038,108 15,946,571 28,038,108 15,946,571 Securities bought back and cancelled (244,886) (627,146) (244,886) (627,146)
543,224,107 515,430,885 543,224,107 515,430,885
Treasury securities(1,211,891) - (1,211,891) -
Acquisition of treasury securities (1,159,370) (1,211,891) (1,159,370) (1,211,891) Vesting of employee incentive securities 240,881 - 240,881 - Balance at the end of the year (2,130,380) (1,211,891) (2,130,380) (1,211,891)
Aveo Group Trust
Number of stapled securities Number of stapled securities
Balance at the beginning of the year
Ordinary securities fully paid
Balance at the beginning of the year
Aveo Group Limited
2016 2015 2016 2015$m $m $m $m
Movements in contributed equityBalance at the beginning of the year 1,122.0 1,093.8 663.0 650.8 Securities issued1, 2 58.5 31.4 25.1 13.5 Acquisition of treasury securities (2.3) (2.2) (1.0) (0.9) Securities bought back and cancelled (0.5) (1.0) (0.2) (0.4) Vesting of employee incentive securities 0.4 - 0.1 - Balance at the end of the year 1,178.1 1,122.0 687.0 663.0
Aveo Group Limited
Aveo Group Trust
Attributable to the shareholders of
Attributable to the securityholders of
On 17 February 2016, the Group issued 28,038,108 fully paid ordinary stapled securities as part consideration for the 1.acquisition of Freedom Aged Care Pty Ltd – see note 17.
On 29 May 2015, the Group issued 15,946,571 fully paid ordinary stapled securities as consideration for the acquisition 2.of stapled securities in Retirement Villages Group.
(a) Accounting for contributed equity
Incremental costs directly attributable to the issue of ordinary securities and security options are shown in equity as a deduction, net of tax, from the proceeds.
(b) Terms and conditions
Holders of ordinary securities are entitled to receive dividends and distributions as declared from time to time and are entitled to one vote per security at securityholders’ meetings. In the event of winding-up of the Parent, ordinary securityholders rank equally with all other securityholders and unsecured creditors and are fully entitled to any proceeds of liquidation.

Aveo Group 2016 Financial Report Notes to the consolidated financial statements (continued) For the year ended 30 June 2016
Page 66
12. DIVIDENDS AND DISTRIBUTIONS
Details of dividends and distributions proposed or paid by the Group are:
Total amount
Franked tax rate
Percentage franked
$m % %2016Dividends and distributions recognised in the current year:
Final 2016 distribution 8.0 43.5 30 September 2016 - - 8.0 43.5 - -
Comprising:Aveo Group Limited - - - - Aveo Group Trust 8.0 43.5 - -
8.0 43.5
2015Dividends and distributions recognised in the current year:
Final 2015 distribution 5.0 25.8 30 September 2015 - - 5.0 25.8
Comprising:Aveo Group Limited - - - - Aveo Group Trust 5.0 25.8 - -
5.0 25.8
Cents per
security Date of payment
2016 2015 2016 2015$m $m $m $m
Dividend franking accountBalance of the 30% franking credits at year end 7.9 7.9 - -
Group Trust Group
The above available amounts are based on the balance of the dividend franking account at reporting date adjusted for: franking credits that will arise from the payment of the amount of the provision for income tax; franking debits that will arise from the payment of dividends recognised as a liability at the year-
end; franking credits that will arise from the receipt of dividends recognised at the year-end; and franking credits that the Parent may be prevented from distributing in subsequent years.

Aveo Group 2016 Financial Report Notes to the consolidated financial statements (continued) For the year ended 30 June 2016
Page 67
SECTION A5. SEGMENT INFORMATION
13. SEGMENT INFORMATION
An operating segment is a component of the Group that: engages in business activities from which it may earn revenues and incur expenses (including
revenues and expenses relating to transactions with other components of the Group); whose operating results are regularly reviewed by the Group’s chief operating decision maker
to make decisions about resources to be allocated to the segment and assess its performance; and
for which discrete financial information is available.
The Group also considers other factors in determining operating segments such as the existence of a line manager and the level of segment information presented to the Board.
Operating segments are identified based on internal reports that are regularly reviewed by the chief operating decision maker in order to allocate resources to the segment and assess its performance.
(a) Reportable segments
The Group is organised into two segments: Retirement, which develops and operates retirement villages and aged care facilities to
produce rental and other income; and Non-retirement, which develops residential, commercial and retail property. Developed
residential property is sold, whilst developed commercial and retail property may be sold or held to produce rental income and capital appreciation.
Segment EBITDA, measured on the same basis as UPT, is the primary measure used to assess segment performance.

Aveo Group 2016 Financial Report Notes to the consolidated financial statements (continued) For the year ended 30 June 2016
Page 68
13. SEGMENT INFORMATION (continued)
(e) Segment revenues and results
The following is an analysis of the Group’s revenue and results by reportable operating segment for the periods under review:
RetirementNon-
retirement
Total reportable operating segments
Non-allocated
items1 Group$m $m $m $m $m
2016Segment revenueRevenue from outside the Group2 106.4 338.7 445.1 0.2 445.3 Total segment revenue 106.4 338.7 445.1 0.2 445.3
Segment resultSegment EBITDA 79.9 55.1 135.0 (15.2) 119.8 Change in fair value of retirement investment properties 17.4 - 17.4 - 17.4 Share of non-operating loss of equity-accounted investments (0.4) - (0.4) - (0.4) Freedom acquisition costs (11.3) - (11.3) - (11.3) Change in fair value of Non-Retirement investment properties - 22.8 22.8 - 22.8 Gain from sale of Non-Retirement asset - 7.1 7.1 - 7.1 Other - 4.0 4.0 - 4.0 Statutory EBITA 85.6 89.0 174.6 (15.2) 159.4 Depreciation and amortisation (1.7) (0.1) (1.8) (0.9) (2.7) Net interest expense - - - - - Net profit from continuing operations before income tax 83.9 88.9 172.8 (16.1) 156.7 Income tax expense (39.1) Net profit after income tax 117.6
Includes unallocated Corporate Services. 1. Segment revenue represents an aggregation of revenue from sales of goods, the rendering of services and other 2.
revenue. Each of these is a separate line item in the income statement.

Aveo Group 2016 Financial Report Notes to the consolidated financial statements (continued) For the year ended 30 June 2016
Page 69
13. SEGMENT INFORMATION (continued)
RetirementNon-
retirement
Total reportable operating segments
Non-allocated
items1 Group$m $m $m $m $m
2015Segment revenueRevenue from outside the Group2 94.6 205.0 299.6 0.6 300.2 Total segment revenue 94.6 205.0 299.6 0.6 300.2
Segment resultSegment EBITDA 53.0 33.1 86.1 (13.1) 73.0 Change in fair value of retirement investment properties 6.2 - 6.2 - 6.2 Change in fair value of Non-Retirement investment properties - 5.3 5.3 - 5.3 Change in fair value of derivatives - - - 4.1 4.1 Share of non-operating loss of equity-accounted investments (1.1) - (1.1) - (1.1) Other - (1.0) (1.0) - (1.0) Statutory EBITDA 58.1 37.4 95.5 (9.0) 86.5 Depreciation and amortisation (1.2) (0.1) (1.3) (0.7) (2.0) Net interest expense - - - (3.0) (3.0) Net profit from continuing operations before income tax 56.9 37.3 94.2 (12.7) 81.5 Income tax expense (21.2) Net profit after income tax 60.3
Includes unallocated Corporate Services. 1. Segment revenue represents an aggregation of revenue from sales of goods, the rendering of services and other 2.
revenue. Each of these is a separate line item in the income statement.

Aveo Group 2016 Financial Report Notes to the consolidated financial statements (continued) For the year ended 30 June 2016
Page 70
SECTION B. RISK MANAGEMENT
This section discusses the Group’s exposure to various financial risks, explains how these affect the Group’s financial position and performance and what the Group does to manage these risks. It includes the following notes:
PageNote 14 Critical estimates and judgements 70Note 15 Financial risk management 71Note 16 Capital management 75
14. CRITICAL ESTIMATES AND JUDGEMENTS
The preparation of these financial statements requires the use of certain critical accounting estimates. It also requires management to exercise its judgement in the process of applying the Group’s accounting policies.
Estimates and judgements are continually evaluated and are based on historical experience as adjusted for current market conditions and other factors, including expectations of future events that are believed to be reasonable under the circumstances.
(a) Estimates and assumptions
The estimates and assumptions that have a significant risk of causing a material adjustment to the carrying amounts of assets and liabilities within the next financial year include:
(i) Estimates of net realisable value of inventories
Estimates of net realisable value are based on the most reliable evidence available at the time the estimates are made, of the amount the inventories are expected to realise and the estimate of costs to complete. Refer to note 8 for further details.
(ii) Investment properties
Investment properties are measured at fair value, being the estimated price that would be received on sale in an orderly transaction between market participants at the reporting date. Details of the investment properties and the key assumptions made in estimating fair value are given in note 9.
(iii) Resident loans
Resident loans are also measured at fair value, being the amount payable on demand, measured at the principal amount plus the residents’ share of any increases in market value to reporting date less deferred management fees contractually accruing to reporting date. Details of the resident loans and the key assumptions made in estimating fair value are given in note 7.
(b) Critical accounting judgements in applying the Group’s accounting policies
In the process of applying the Group’s accounting policies, the Group makes various judgements, apart from those involving estimations, that can significantly affect the amounts recognised in the consolidated financial statements. These include whether all the significant risks and rewards of ownership of development properties have been substantially transferred to the purchaser.

Aveo Group 2016 Financial Report Notes to the consolidated financial statements (continued) For the year ended 30 June 2016
Page 71
15. FINANCIAL RISK MANAGEMENT
The Group’s principal financial instruments comprise receivables, payables, bank loans, resident loans, financial assets/liabilities at fair value through profit or loss, finance leases, cash and short-term deposits, syndicate put options and derivatives.
The Group has in place a Treasury and Risk Management Policy, which focuses on the following main financial risks: interest rate risk, foreign currency risk, liquidity risk and credit risk. The Board has ultimate responsibility for the financial risk management process for the Group. The Board reviews and approves the Policy, the approach to the management of financial risks and where appropriate, variations from these policies. The Board also reviews compliance with the Policy at its monthly meetings as appropriate.
Day-to-day responsibility for the monitoring of financial risk exposure, market movements and the development of an appropriate response, rests with the CFO.
The Group’s overall financial risk management focuses on the unpredictability of financial markets and seeks to minimise potentially adverse effects on the Group’s financial performance. The Group uses different methods to measure and mitigate the different types of risks to which it is exposed. These include monitoring levels of exposure to interest rate and foreign exchange risk and assessing market forecasts for interest rate and foreign exchange prices. Ageing analysis and monitoring of specific credit exposures are undertaken to manage credit risk.
(a) Interest rate risk
Interest rate risk is the risk that the fair value of financial instruments or cash flows associated with instruments will fluctuate due to changes in market interest rates, resulting in an adverse impact on financial performance. The Group’s exposure to market interest rates relates primarily to the Group’s borrowings. Borrowings issued at variable rates expose the Group to cash flow interest rate risk. The Group manages this risk exposure by using a range of financial instruments to hedge against changes in interest rates and maintain a mix of fixed and variable debt. The level of debt is disclosed in note 6.
The Group primarily manages this risk exposure through entering into derivative instruments (primarily interest rate swaps), in which the Group agrees to exchange, at specified intervals, the difference between fixed and variable rate interest amounts calculated by reference to an agreed-upon notional principal amount. The level of derivative instruments required to manage interest rate risk is dependent on Group gearing. During the 2015 financial year, the Group terminated all of its interest rate hedges. Consequently, at 30 June 2016, none (2015: none) of the Group’s drawn debt was at a fixed rate of interest.
The amount taken to profit or loss for the year for the Group in relation to interest rate swaps was nil (2015 gain: $4.1 million) and for the Trust Group was nil (2015: nil).

Aveo Group 2016 Financial Report Notes to the consolidated financial statements (continued) For the year ended 30 June 2016
Page 72
15. FINANCIAL RISK MANAGEMENT (continued)
The impact of an increase or decrease in average interest rates of 0.75% (75 basis points) at reporting date, with all other variables held constant, is shown in the table below. This level of sensitivity was considered reasonable given the current level of both short-term and long-term Australian interest rates. The analysis is based on the interest rate risk exposures in existence at reporting date. As the Group has no derivatives that meet the documentation requirements to qualify for hedge accounting, there would be no impact on equity apart from the effect on profit.
2016 2015 2016 2015$m $m $m $m
Consolidated Group+0.75% (75 basis points) 2.6 2.4 - - -0.75% (75 basis points) (2.6) (2.4) - -
Consolidated Property Trust+0.75% (75 basis points) (3.9) (3.9) - - -0.75% (75 basis points) 3.9 3.9 - -
Change in net interest expense
Change in fair value of
derivativeshigher/(lower) higher/(lower)
(b) Foreign currency risk
Foreign currency risk arises as a result of having assets denominated in a currency that is not the Group’s functional currency (balance sheet risk) or from transactions or cash flows denominated in a foreign currency (cash flow risk).
Balance sheet risk can affect net tangible assets whereas cash flow risk is more likely to affect potential equity distributions or other cash requirements such as the repayment of debt.
The Group has no significant concentrations of foreign exchange risk.
(c) Credit risk
Credit risk is the risk of financial loss to the Group if a customer or counterparty to a financial instrument fails to meet contractual obligations, with the maximum exposure being equal to the carrying amount of these instruments. Credit risk arises from the financial assets of the Group, which may include cash and cash equivalents, trade and other receivables, available-for-sale financial assets, financial assets at fair value through profit or loss and derivative financial instruments.
It is the Group’s policy that all customers who wish to trade on credit terms are subject to credit verification procedures, including an assessment of their independent credit rating, financial position, past experience and industry reputation. Risk limits are set for each individual customer in accordance with parameters set by the Board. These risk limits are regularly monitored. For third parties with extended term debt, credit checks are obtained and, in some instances, the receivable is secured by registered mortgage.
In addition, receivable balances are monitored regularly with the intention that the Group’s exposure to bad debts is minimised.
The Group’s cash management policy is to maintain cash in a highly liquid and low risk portfolio with investments made in high quality, short-term money market instruments to ensure the preservation of capital at all times.
The granting of financial guarantees also exposes the Group to credit risk, being the maximum amount that would have to be paid if the guarantee is called on. As the amounts payable under the guarantees are not significantly greater than the original liabilities, this risk is not material.

Aveo Group 2016 Financial Report Notes to the consolidated financial statements (continued) For the year ended 30 June 2016
Page 73
15. FINANCIAL RISK MANAGEMENT (continued)
The Group manages concentrations of credit risk by limiting the maximum exposure to any one financial institution, which varies according to its credit rating.
(d) Liquidity risk
Liquidity risk is the risk that the Group will not be able to meet its financial obligations as they fall due.
The Group’s objective is to achieve continuity of funding and flexibility, due to the dynamic nature of the underlying business, using bank overdrafts, bank loans, finance leases and committed available credit lines, in addition to other sources of funds.
The Group regularly reviews existing funding lines and assesses future requirements based upon known and forecast information provided by each of the business units. This assists flexibility by matching profiles of short-term investments with cash flow requirements and assists in timing the negotiation of credit facilities. Cash forecasts are prepared for review by the CFO and for presentation to the Board as appropriate. In order to ensure that the Group is able to meet short-term commitments (i.e. less than 12 months) and has sufficient time to plan and fund longer term commitments, forward commitment tests must be satisfied unless exemptions are approved by the Board.
Management monitors the maturity and amortisation profile of all debt facilities on a regular basis and reports these to the Board. The CFO presents a draft refinancing plan for the approval of the Board well in advance of material debt facilities maturity.
The current weighted average debt maturity is 1.7 years (2015: 2.2 years).
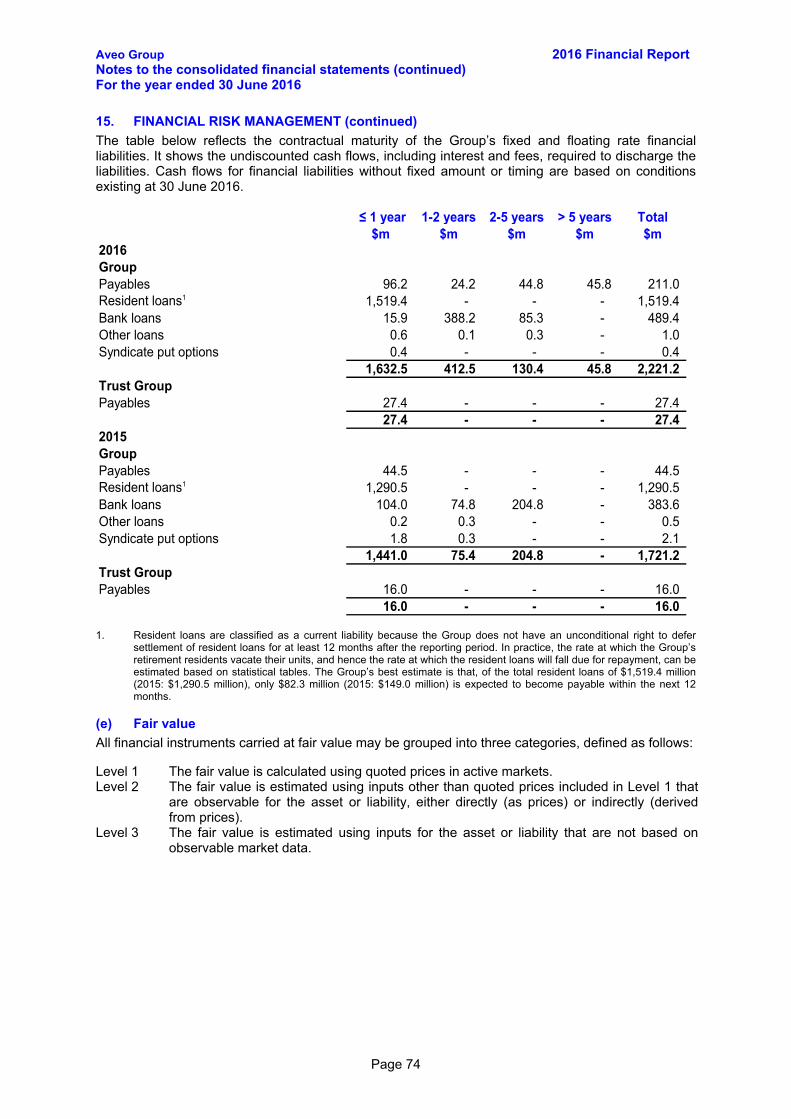
Aveo Group 2016 Financial Report Notes to the consolidated financial statements (continued) For the year ended 30 June 2016
Page 74
15. FINANCIAL RISK MANAGEMENT (continued)
The table below reflects the contractual maturity of the Group’s fixed and floating rate financial liabilities. It shows the undiscounted cash flows, including interest and fees, required to discharge the liabilities. Cash flows for financial liabilities without fixed amount or timing are based on conditions existing at 30 June 2016.
≤ 1 year 1-2 years 2-5 years > 5 years Total$m $m $m $m $m
2016GroupPayables 96.2 24.2 44.8 45.8 211.0 Resident loans1 1,519.4 - - - 1,519.4 Bank loans 15.9 388.2 85.3 - 489.4 Other loans 0.6 0.1 0.3 - 1.0 Syndicate put options 0.4 - - - 0.4
1,632.5 412.5 130.4 45.8 2,221.2 Trust GroupPayables 27.4 - - - 27.4
27.4 - - - 27.4 2015GroupPayables 44.5 - - - 44.5 Resident loans1 1,290.5 - - - 1,290.5 Bank loans 104.0 74.8 204.8 - 383.6 Other loans 0.2 0.3 - - 0.5 Syndicate put options 1.8 0.3 - - 2.1
1,441.0 75.4 204.8 - 1,721.2 Trust GroupPayables 16.0 - - - 16.0
16.0 - - - 16.0
Resident loans are classified as a current liability because the Group does not have an unconditional right to defer 1.settlement of resident loans for at least 12 months after the reporting period. In practice, the rate at which the Group’s retirement residents vacate their units, and hence the rate at which the resident loans will fall due for repayment, can be estimated based on statistical tables. The Group’s best estimate is that, of the total resident loans of $1,519.4 million (2015: $1,290.5 million), only $82.3 million (2015: $149.0 million) is expected to become payable within the next 12 months.
(e) Fair value
All financial instruments carried at fair value may be grouped into three categories, defined as follows:
Level 1 The fair value is calculated using quoted prices in active markets. Level 2 The fair value is estimated using inputs other than quoted prices included in Level 1 that
are observable for the asset or liability, either directly (as prices) or indirectly (derived from prices).
Level 3 The fair value is estimated using inputs for the asset or liability that are not based on observable market data.

Aveo Group 2016 Financial Report Notes to the consolidated financial statements (continued) For the year ended 30 June 2016
Page 75
15. FINANCIAL RISK MANAGEMENT (continued)
As at reporting date, the Group held the following financial instruments measured at fair value:
Level 1 Level 2 Level 3 Total$m $m $m $m
2016GroupFinancial assetsRights to acquire syndicate shares - 0.4 - 0.4 Financial liabilitiesPut option liability to acquire syndicate shares - 0.4 - 0.4 Resident loan obligations at fair value through profit or loss - - 1,519.4 1,519.4
- 0.4 1,519.4 1,519.8 2015GroupFinancial assetsRights to acquire syndicate shares - 0.3 - 0.3 Financial liabilitiesPut option liability to acquire syndicate shares - 2.1 - 2.1 Resident loan obligations at fair value through profit or loss - - 1,290.5 1,290.5
- 2.1 1,290.5 1,292.6
The Trust Group does not have any financial instruments measured at fair value.
The fair value of all other financial instruments approximates their carrying amount.
Further information on the resident loan obligations is given in note 7.
16. CAPITAL MANAGEMENT
When managing capital, management’s objective is to ensure that the Group uses a mix of funding options, while remaining focused on the objective of optimising returns to securityholders. Management aims to maintain a capital structure that ensures the lowest weighted average cost of capital available. The Group aims to maintain reported gearing, measured as net debt divided by cash adjusted assets (net of resident obligations), in the range of 10% to 20%. At 30 June 2016, reported gearing was 17.4% (2015: 13.8%).
Management may adjust the Group’s capital structure to take advantage of favourable changes in the cost of capital. This could include changing the amount of dividends to be paid to securityholders, returning capital to securityholders or adjusting debt levels.
Under the terms of the Group’s major borrowing facility, it is required to comply with certain main financial covenants. The main covenants, their required and actual values were:
Required Group2016
Group FacilityGearing ≤ 30% 17.4%Interest cover - Group (times) ≥ 1.5 9.0 Interest cover - Core (times) ≥ 2.0 3.0

Aveo Group 2016 Financial Report Notes to the consolidated financial statements (continued) For the year ended 30 June 2016
Page 76
SECTION C. GROUP STRUCTURE
This section explains significant aspects of the Group’s structure and the effect of changes in it on the financial position and performance of the Group. It includes the following notes:
PageNote 17 Business combination 76Note 18 Interests in other entities 77Note 19 Equity-accounted investments 78
17. BUSINESS COMBINATION
(a) Summary of acquisition
On 18 February 2016 Aveo Group Limited (Aveo) acquired all of the issued share capital of Freedom. Freedom owns and operates more than 1,000 units in 15 retirement communities across Australia in Queensland, NSW, Victoria and Tasmania, as well as a development pipeline of 533 units.
Details of the purchase consideration are: $m
Purchase consideration (at fair value)Cash paid 10.0 Ordinary shares issued 83.6 Receivable for working capital adjustment at acquisition date (10.0) Contingent consideration 33.0
116.6
The assets and liabilities recognised as a result of the acquisition are as follows: $m
Cash and cash equivalents 1.2 Trade and other receivables 10.8 Investment properties 392.1 Trade and other payables (30.0) Interest bearing loans and borrowings (80.0) Employee benefits (1.2) Other provisions (4.8) Deferred tax liabilities (2.1) Resident loans (169.4) Net assets acquired 116.6
In the event that certain sales levels are achieved by Freedom over four years following the acquisition, additional consideration of up to $33.0 million in present value terms may be payable in cash progressively over the four year period. The Group estimates that the amount payable (before discounting) will be in the range of $35.0 to $40.0 million.
The initial accounting for this acquisition is incomplete, as the receivable for the working capital adjustment at the acquisition date of $10.0 million is an initial estimate, being subject to completion of audit and confirmation of payment arrangements with the vendor. In addition, the assessment of deferred tax liabilities following the acquisition is complex and subject to further revision.
Freedom contributed revenues of $6.4 million and net profit of $8.6 million (including gain on change in fair value of investment properties) to the group for the period from 18 February 2016 to 30 June 2016.
It is impractical to provide consolidated pro-forma revenue and profit for the year ended 30 June 2016 if the acquisition had occurred on 1 July 2015, because Freedom acquired some of its retirement villages after 1 July 2015 but before its acquisition by the Group, and data for the performance of those villages for the period from 1 July 2015 to the date of their acquisition by Freedom is not available.

Aveo Group 2016 Financial Report Notes to the consolidated financial statements (continued) For the year ended 30 June 2016
Page 77
17. BUSINESS COMBINATION (continued)
(b) Purchase consideration – cash outflow
$mOutflow of cash to acquire subsidiary, net of cash acquiredCash consideration 10.0 Less: Balances acquired
Cash 1.2 Net outflow of cash - investing activities 8.8
Acquisition-related costs of $11.4 million (principally landholder duty) are included in other expenses in profit or loss and in operating cash flows in the statement of cash flows.
18. INTERESTS IN OTHER ENTITIES
The consolidated financial statements of the Group include the following material entities:
Entity Activity2016 2015 2016 2015
% % % %Material subsidiariesFKP Commercial Developments Pty Ltd Property developer 100.0 100.0 - - Aveo Retirement Homes Limited Retirement village owner
and operator100.0 100.0 - -
Aveo Retirement Homes (No.2) Pty Ltd Retirement village owner and operator
100.0 100.0 - -
Aveo Healthcare Limited Retirement village owner and operator
86.4 85.6 - -
Aveo Group Trust Property owner 100.0 100.0 - - FKP Lifestyle Pty Ltd Property developer 100.0 100.0 - - Aveo North Shore Retirement Villages Pty Ltd
Retirement village owner and operator
100.0 100.0 - -
Aveo Cleveland Gardens Pty Limited Retirement village owner and operator
100.0 100.0 - -
Aveo Leisure Services Pty Ltd Retirement village owner and operator
100.0 100.0 - -
FKP Residential Developments Pty Ltd Property developer 100.0 100.0 - - Freedom Aged Care Pty Ltd Retirement village owner
and operator100.0 - - -
Aveo Sanctuary Cove Trust Retirement village owner - - 100.0 100.0 Aveo Southern Gateway Trust Retirement village owner - - 100.0 100.0 Aveo Springfield Trust Retirement village owner - - 100.0 100.0 Aveo B/P Land Trust Retirement village owner - - 100.0 100.0
Material equity-accounted investmentsRVG Retirement village owner
and operator72.9 38.8 - -
Group Trust Group
All these entities are formed or incorporated in Australia.
RVG is not consolidated because, notwithstanding its 72.9% interest, the Group does not have the right to appoint a majority of the board of directors of this entity, and thus does not control it.

Aveo Group 2016 Financial Report Notes to the consolidated financial statements (continued) For the year ended 30 June 2016
Page 78
19. EQUITY-ACCOUNTED INVESTMENTS
(a) Carrying amounts
Details of the carrying amounts of equity-accounted investments are as follows:
2016 2015 2016 2015$m $m $m $m
AssociatesRVG 267.0 147.9 - -
16.1 14.9 2.3 2.3
Joint ventures 18.7 16.3 11.3 9.0 301.8 179.1 13.6 11.3
Group Trust Group
Other associates
(b) Accounting for equity-accounted investments
An associate is an entity over which the Group has significant influence. Significant influence is the power to participate in the financial and operating policy decisions of the investee, but is not control or joint control over those policies.
A joint venture is a type of joint arrangement whereby the parties that have joint control of the arrangement have rights to the net assets of the joint venture. Joint control is the contractually agreed sharing of control of an arrangement, which exists only when decisions about the relevant activities require unanimous consent of the parties sharing control.
The Group’s investments in its associates and joint ventures are accounted for using the equity method. Under the equity method, investments in these entities are carried in the consolidated balance sheet at cost plus post-acquisition changes in the Group’s or Trust Group’s share of net assets of these entities.
The Group and Trust Group’s share of these entities’ profits or losses is recognised in the income statement, and its share of movements in reserves is recognised in reserves. The cumulative movements are adjusted against the carrying amount of the investment. Dividends receivable are recognised as a reduction in the equity-accounted investment.
After application of the equity method, the Group determines whether it is necessary to recognise an additional impairment loss on its equity-accounted investments. If there is any objective evidence that the investment in the associate is impaired, the Group calculates the amount of impairment as the difference between the recoverable amount of the investment and its carrying value and recognises it in the income statement.

Aveo Group 2016 Financial Report Notes to the consolidated financial statements (continued) For the year ended 30 June 2016
Page 79
19. EQUITY-ACCOUNTED INVESTMENTS (continued)
(c) Material associates and joint ventures
The Group has an interest in RVG, which owns and operates retirement villages. Summarised financial information for RVG is:
2016 2015$m $m
Current assets 49.8 49.6 Non-current assets 1,583.7 1,501.4 Current liabilities (1,211.8) (1,148.0) Equity 421.7 403.0 Proportion of the Group's ownership 72.9% 38.8%Share of equity 307.4 156.4 Less: ownership acquired at discount to net assets (40.4) (8.5) Carrying amount of the investment 267.0 147.9
Revenue 49.5 40.2 Profit/(loss) before tax 17.5 8.1 Income tax expense - - Profit/(loss) from continuing operations 17.5 8.1 Profit from discontinued operation - - Profit/(loss) for the year 17.5 8.1 Other comprehensive income - - Total comprehensive income 17.5 8.1 Proportion of the Group's ownership 72.9% 38.8%Group's share of profit/(loss) for the year 8.6 2.5 Dividend paid to the Parent - -
Retirement Villages Group
Group
(d) Joint operations
In the 2014 financial year, the Group sold a 50% interest in its Milton development to a former associate, Tian An. The Group has concluded that the relevant contract results in the formation of a joint operation, because the contract transfers the risks and rewards of ownership to Tian An in respect of its 50% interest. The Group recognises its 50% share of the joint revenue, expenses, assets (including inventory) and liabilities. As the related project finance is in the Group’s name, it does not meet the derecognition criteria set out in AASB 139 Financial Instruments: Measurement. Consequently, the Group recognises all of this borrowing in its financial statements and a related asset representing its right to apply a portion of Tian An’s share of the joint revenue to repayment of this borrowing.

Aveo Group 2016 Financial Report Notes to the consolidated financial statements (continued) For the year ended 30 June 2016
Page 80
SECTION D. UNRECOGNISED ITEMS
This section of the notes provides information about items that are not recognised in the financial statements as they do not (yet) satisfy the recognition criteria. In addition to the items and transactions disclosed below, there are also unrecognised tax amounts – see note 10.
20. SUBSEQUENT EVENTS
(a) RVG Transaction
The Group has today entered into an unconditional transaction to acquire the remaining 27% minority holding in RVG, with completion scheduled for 24 August 2016. The total acquisition cost of this minority holding of about $100 million (including transaction costs) reflects a purchase price of 25 cents per security, which represents a 13% discount to the RVG current security value.
This completes the progressive acquisition of RVG securityholder interests that began in May 2015 when the Group had only a 23% interest in RVG. The combination of all acquisitions since this date have been achieved at an overall discount of 17% to the relevant current security value.
The removal of all outside interests and consolidation of RVG significantly simplifies the Group’s portfolio structure. It allows the Group to take full control over the strategic and operational direction of the RVG villages and accelerate value-adding development and care initiatives across the portfolio.
(b) Equity raising
The acquisition will be funded via a fully underwritten institutional placement of up to 37.1 million Securities (New Securities) to raise approximately $125 million. The institutional placement price will be determined via a variable price bookbuild with an underwritten floor price of $3.37 per New Security, representing a 2.6% discount to the closing price of $3.46 on 16 August 2016.
Funds raised in excess of the purchase price will be used to reduce debt drawn to fund the acquisition of previous stakes in RVG. Following the acquisition and the equity raising, Aveo’s pro-forma gearing as at 30 June 2016 will be reduced to 15%.

Aveo Group 2016 Financial Report Notes to the consolidated financial statements (continued) For the year ended 30 June 2016
Page 81
APPENDICES
The appendices set out information that is required under the Standards, the Act or the Regulations, but that, in the Directors’ view, is not critical to understanding the financial statements.
APPENDIX 1. HOW THE NUMBERS ARE CALCULATED – OTHER ITEMS
This section provides information about the basis of calculation of line items in the financial statements that the Directors do not consider significant in the context of the Group’s operations. It includes the following notes:
PageNote 21 Earnings per security 81Note 22 Cash and cash equivalents 82Note 23 Property, plant and equipment 82Note 24 Provisions 83Note 25 Reserves and retained profits/(losses) 84Note 26 Material partly-owned subsidiaries 85Note 27 Notes to the cash flow statements 86
21. EARNINGS PER SECURITY
2016 2015 2016 2015$m $m $m $m
(a) Earnings used in calculating earnings per securityProfit from continuing operations after income tax 117.6 60.3 20.9 22.8 Less: non-controlling interest - external (1.6) (2.3) - -
116.0 58.0 20.9 22.8
Group Trust Group
Net profit after income tax attributable to equity holders adjusted for the effect of dilution
2016 2015 2016 2015(b) Weighted average number of securities used as the denominator
523,836,328 500,762,883 523,836,328 500,762,883
(c) Anti-dilutive instruments
Performance rights 2,617,962 2,560,896 2,617,962 2,560,896 STID 244,610 240,881 244,610 240,881
Weighted average number of ordinary securities used in calculating basic and diluted earnings per security
The following securities could potentially dilute basic earnings per security in the future but were not included in the calculation of diluted earnings per security because they are anti-dilutive:
Group Trust Group
(d) Calculating earnings per security
Basic earnings per security is calculated as net profit attributable to members of the Parent divided by the weighted average number of ordinary shares, adjusted for any bonus element.
Diluted earnings per security is calculated as net profit attributable to members of the Parent, adjusted for non-discretionary changes in revenues or expenses during the period that would result from the dilution of potential ordinary shares, divided by the weighted average number of ordinary shares and dilutive potential ordinary shares, adjusted for any bonus element.

Aveo Group 2016 Financial Report Notes to the consolidated financial statements (continued) For the year ended 30 June 2016
Page 82
22. CASH AND CASH EQUIVALENTS
2016 2015 2016 2015$m $m $m $m
Cash at bank 32.8 30.8 - 0.3 Capital replacement funds1 2.1 2.1 - -
34.9 32.9 - 0.3
Group Trust Group
A statutory charge, imposed under the Retirement Villages Act 1999 (Qld), exists over all amounts held in capital 1.replacement funds, which restricts the use for which these funds can be applied.
23. PROPERTY, PLANT AND EQUIPMENT
2016 2015 2016 2015$m $m $m $m
Freehold landAt cost 7.2 7.2 - - Accumulated impairment (4.6) (4.6) - -
2.6 2.6 - - Residential aged care facilitiesAt cost 20.0 15.4 0.1 - Accumulated depreciation (2.7) (3.2) - -
17.3 12.2 0.1 - Freehold buildingsAt cost 5.7 5.7 - Accumulated depreciation (1.1) (1.0) - - Accumulated impairment (1.7) (1.7)
2.9 3.0 - - Leasehold improvementsAt cost 5.9 5.7 - - Accumulated amortisation (5.4) (5.3) - -
0.5 0.4 - - Plant and equipmentAt cost 7.5 8.3 - - Accumulated depreciation (7.1) (7.8) - -
0.4 0.5 - - Total property, plant and equipment 23.7 18.7 0.1 -
Group Trust Group
(a) Accounting for property, plant and equipment
Property, plant and equipment are stated at historical cost less accumulated depreciation and any accumulated impairment losses. All other repairs and maintenance are recognised in the income statement as incurred.
All items of property, plant and equipment, other than freehold and leasehold land, are depreciated using the straight-line method.

Aveo Group 2016 Financial Report Notes to the consolidated financial statements (continued) For the year ended 30 June 2016
Page 83
23. PROPERTY, PLANT AND EQUIPMENT (continued)
Depreciation rates used are as follows:
Depreciation rate Residential aged care facilities 2.5% Freehold buildings 2.5% Leasehold improvements 2.5% - 20.0% Plant and equipment 6.0% - 40.0%
These rates are consistent with the prior year.
24. PROVISIONS
2016 2015 2016 2015$m $m $m $m
CurrentEmployee benefits 4.4 3.3 - - Warranty maintenance 2.2 2.3 0.2 - Distributions payable 43.5 25.8 43.5 25.8 Total current provisions 50.1 31.4 43.7 25.8
Non-currentEmployee benefits 1.8 1.3 - - Total non-current provisions 1.8 1.3 - -
Group Trust Group
(a) Accounting for provisions
A provision is recognised where there is a present obligation (legal or constructive) as a result of a past event, it is probable that an outflow of resources embodying the economic benefits will be required to settle the obligation and a reliable estimate can be made of the obligation.
Provisions are measured at the present value of management’s best estimate of the expenditure required to settle the present obligation at the reporting date. The discount rate used to determine the present value reflects current market assessments of the time value of money and the risks specific to the liability. The increase in the provision resulting from the passage of time is recognised in finance costs.
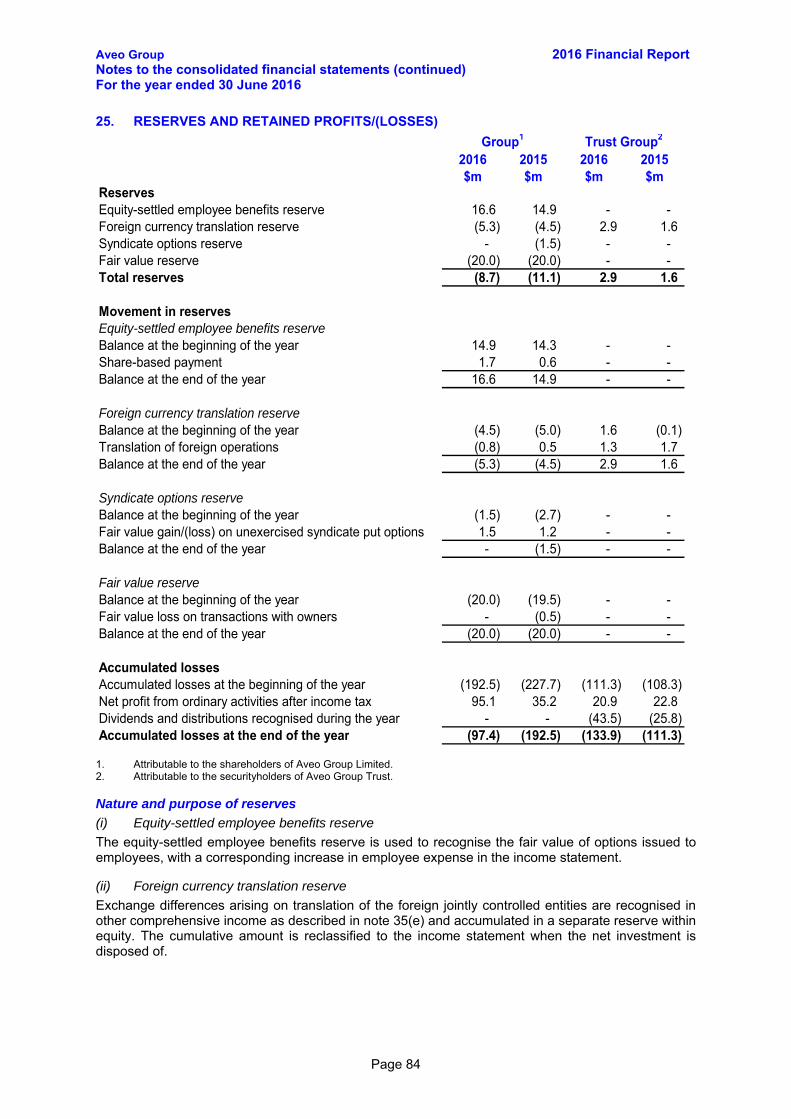
Aveo Group 2016 Financial Report Notes to the consolidated financial statements (continued) For the year ended 30 June 2016
Page 84
25. RESERVES AND RETAINED PROFITS/(LOSSES)
2016 2015 2016 2015$m $m $m $m
ReservesEquity-settled employee benefits reserve 16.6 14.9 - - Foreign currency translation reserve (5.3) (4.5) 2.9 1.6 Syndicate options reserve - (1.5) - - Fair value reserve (20.0) (20.0) - - Total reserves (8.7) (11.1) 2.9 1.6
Movement in reservesEquity-settled employee benefits reserveBalance at the beginning of the year 14.9 14.3 - - Share-based payment 1.7 0.6 - - Balance at the end of the year 16.6 14.9 - -
Foreign currency translation reserveBalance at the beginning of the year (4.5) (5.0) 1.6 (0.1) Translation of foreign operations (0.8) 0.5 1.3 1.7 Balance at the end of the year (5.3) (4.5) 2.9 1.6
Syndicate options reserveBalance at the beginning of the year (1.5) (2.7) - - Fair value gain/(loss) on unexercised syndicate put options 1.5 1.2 - - Balance at the end of the year - (1.5) - -
Fair value reserveBalance at the beginning of the year (20.0) (19.5) - - Fair value loss on transactions with owners - (0.5) - - Balance at the end of the year (20.0) (20.0) - -
Accumulated losses(192.5) (227.7) (111.3) (108.3)
Net profit from ordinary activities after income tax 95.1 35.2 20.9 22.8 Dividends and distributions recognised during the year - - (43.5) (25.8) Accumulated losses at the end of the year (97.4) (192.5) (133.9) (111.3)
Group1 Trust Group2
Accumulated losses at the beginning of the year
Attributable to the shareholders of Aveo Group Limited. 1. Attributable to the securityholders of Aveo Group Trust. 2.
Nature and purpose of reserves
(i) Equity-settled employee benefits reserve
The equity-settled employee benefits reserve is used to recognise the fair value of options issued to employees, with a corresponding increase in employee expense in the income statement.
(ii) Foreign currency translation reserve
Exchange differences arising on translation of the foreign jointly controlled entities are recognised in other comprehensive income as described in note 35(e) and accumulated in a separate reserve within equity. The cumulative amount is reclassified to the income statement when the net investment is disposed of.

Aveo Group 2016 Financial Report Notes to the consolidated financial statements (continued) For the year ended 30 June 2016
Page 85
25. RESERVES AND RETAINED PROFITS/(LOSSES) (continued)
(iii) Syndicate options reserve
The syndicate option reserve represents the fair value of options held by non-controlling interests to require the Group to purchase their units in the Clayfield syndicate.
(iv) Fair value reserve
Transactions with non-controlling interests that do not result in a loss of control result in an adjustment between the carrying amounts of the controlling and non-controlling interests to reflect their relative interests in the subsidiary. Any difference between the amount of the adjustment to non-controlling interests and any consideration paid or received is recognised within the fair value reserve.
26. MATERIAL PARTLY-OWNED SUBSIDIARIES
Financial information of subsidiaries that have material non-controlling interests is:
Proportion of equity interest held by non-controlling interests:
2016 2015
Australia 13.6% 14.4%
2016 2015$m $m
Carrying amount of material non-controlling interest:30.9 32.3
Profit/(loss) allocated to material non-controlling interest:1.6 2.3
Country of incorporation and operation
Group
Group
NameAveo Healthcare Limited
Aveo Healthcare Limited
Aveo Healthcare Limited
2016 2015$m $m
Summarised statement of comprehensive income:Revenue 20.3 19.4 Profit/(loss) after tax 13.9 13.8 Total comprehensive income 13.9 13.8 Attibutable to non-controlling interest 2.7 2.3 Dividends paid to non-controlling interest - -
Aveo Healthcare Limited
The Trust Group has no material partly-owned subsidiaries.

Aveo Group 2016 Financial Report Notes to the consolidated financial statements (continued) For the year ended 30 June 2016
Page 86
26. MATERIAL PARTLY-OWNED SUBSIDIARIES (continued)
2016 2015$m $m
Summarised statement of financial position as at 30 June:Current assets 13.7 11.3 Non-current assets 744.1 659.4 Current liabilities (331.4) (308.5) Non-current liabilities (195.6) (146.8) Total equity 230.8 215.4 Attributable to:
Equity holders of Aveo Healthcare Limited 199.9 183.1 Non-controlling interest 30.9 32.3
Summarised cash flow information:Operating cash flows 22.3 8.3 Investing cash flows (65.0) (40.4) Financing cash flows 43.1 32.8 Net increase in cash and cash equivalents 0.4 0.7
Aveo Healthcare Limited
The Trust Group does not have any non-controlling interest.
27. NOTES TO THE CASH FLOW STATEMENTS
(a) Reconciliation of net cash flow from operating activities to profit after income tax
2016 2015 2016 2015$m $m $m $m
Group Trust Group
Operating profit after income tax 117.6 60.3 20.9 22.8
Depreciation and amortisation 2.7 2.0 - - Share of gain of equity-accounted investments (11.0) (2.7) (1.0) (0.7) Distributions from equity-accounted investments 0.1 - - - Interest receivable - - (20.9) (23.6) Change in fair value of investment properties (78.0) (37.4) - 0.7 Change in fair value of resident loans 14.9 20.6 - - Change in fair value of financial assets and liabilities - (4.1) - - Other (40.2) (22.6) - -
Decrease in receivables 13.3 26.7 - - Decrease in inventories 155.7 12.4 - - Decrease/(increase) in other assets - (1.3) - 0.5 Increase/(decrease) in payables 15.1 (5.3) 0.2 (1.5) Increase in unearned income and resident loans 64.5 40.4 - - Increase in deferred tax liabilities 38.1 21.0 - - Increase in provisions 0.3 2.1 0.2 - Net cash (used in)/provided by operating activities 293.1 112.1 (0.6) (1.8)
Change in operating assets and liabilities net of effects of purchases and disposals of subsidiaries during the year
Adjustments for non-cash items
(b) Non-cash financing and investing activities
In 2016, the Group issued $83.6 million securities to acquire Freedom, refer to note 17(a). In 2015, the Group acquired an additional 15.3% share in RVG for consideration of $10.9 million in cash and $44.9 million in Securities.

Aveo Group 2016 Financial Report Notes to the consolidated financial statements (continued) For the year ended 30 June 2016
Page 87
APPENDIX 2. OTHER INFORMATION
This appendix covers other information that is not directly related to specific line items in the financial statements, including information about related party transactions, share-based payments and other statutory information. It includes the following notes:
PageNote 28 Related party transactions 87Note 29 Auditor’s remuneration 89Note 30 Parent entities 89Note 31 Deed of cross guarantee 91Note 32 Other accounting policies 94
28. RELATED PARTY TRANSACTIONS
(a) Aggregate remuneration of key management personnel
2016 2015 2016 2015$ $ $ $
Short-term employee benefits 2,326,791 2,144,733 - - Post-employment benefits 90,345 89,745 - - Equity compensation 995,890 809,603 - - Other compensation1 54,023 50,394 - - Key management personnel compensation 3,467,049 3,094,475 - -
Group Trust Group
Other compensation comprises accrued long service leave. 1.
Detailed remuneration disclosures are provided in the Remuneration Report.
(b) Loans from the Property Trust to Group entities
Aveo Funds Management Limited, as the Responsible Entity for the Property Trust, has entered into a loan agreement with the Parent to make available a $600.0 million loan facility. Interest is payable quarterly at the rate of the prevailing 90-day bank bill swap reference rate plus a margin of 3.0% from 1 July 2013 and 2.2% from 1 January 2014. Details of movements in the loan are as follows:
2016 2015 2016 2015$'000 $'000 $'000 $'000
Balance at the beginning of the year - - 525,576 487,019 Loans advanced - - 30,377 80,082 Loan repayments made - - (51,960) (65,155) Interest charged - - 20,907 23,630 Balance at the end of the year - - 524,900 525,576
Group Trust Group

Aveo Group 2016 Financial Report Notes to the consolidated financial statements (continued) For the year ended 30 June 2016
Page 88
28. RELATED PARTY TRANSACTIONS (continued)
(c) Other transactions with related parties
Amounts recognised in respect of other transactions with related parties were:
2016 2015 2016 2015$'000 $'000 $'000 $'000
Group Trust Group
Revenue from rendering of services - associates (note i) 7,359 7,225 - -
Management fees received - associates (note ii) 7,636 7,473 - -
Administration expensesManagement fees paid - Responsibile Enttity (note iii) - - 682 831 Rent paid - MIB (note iv) 423 689 - - Asset management fees paid - MIB (note v) 158 - Net cost sharing - MIB (note vi) (109) 549 - - Cost recharges - associate (note vii) 140 310 - -
Other receivables - associates (note vii) 3,204 2,223 - -
(i) Revenue from rendering of services – associates
The Group receives sales commissions, administration and marketing fees from its associate, RVG. Fees are charged at commercial rates.
(ii) Management fees received – associates
The Group derived revenue from providing management services to its associate, RVG. Fees are charged at commercial rates.
(iii) Management fees paid – responsible entity
The Property Trust pays management fees as provided for under its constitution to its responsible entity, a wholly owned subsidiary of the Group.
(iv) Rent paid – MIB
The Group leases office premises at commercial rates from a wholly owned subsidiary of MIB.
(i) Asset management fees – MIB
With effect from 1 May 2016, the Group appointed a wholly owned subsidiary of MIB to provide asset management services in relation to the Group’s investment property situated at Skyring Terrace, Newstead (Gasometer 1 and associated facilities). The services are provided at market rates.
(v) Net cost sharing – MIB
The Group has agreed with a wholly-owned subsidiary of MIB to share certain administrative functions including internal audit, human resources and information technology. Broadly, each party is responsible for nominated functions and provides services for those functions to both itself and the other party. Personnel costs for those functions, including an allowance for on-costs, are shared between the parties in agreed proportions.
(vi) Cost recharges - MFKP
The Group provided personnel, administrative and other services to Mulpha FKP Pty Limited (MFKP). MFKP was sold in FY14.
(vii) Other receivables – associates
These reflect receivables for the services and charges noted above.
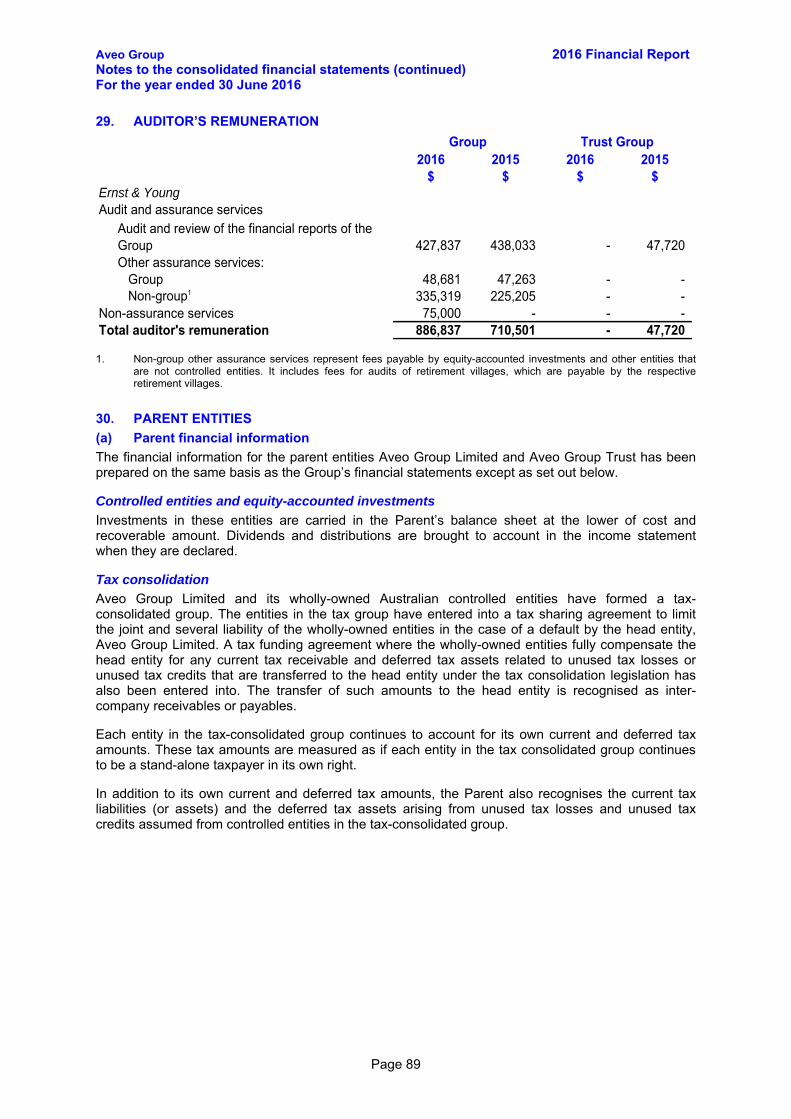
Aveo Group 2016 Financial Report Notes to the consolidated financial statements (continued) For the year ended 30 June 2016
Page 89
29. AUDITOR’S REMUNERATION
2016 2015 2016 2015$ $ $ $
Ernst & YoungAudit and assurance services
427,837 438,033 - 47,720 Other assurance services:
Group 48,681 47,263 - - Non-group1 335,319 225,205 - -
Non-assurance services 75,000 - - - Total auditor's remuneration 886,837 710,501 - 47,720
Group Trust Group
Audit and review of the financial reports of the Group
Non-group other assurance services represent fees payable by equity-accounted investments and other entities that 1.are not controlled entities. It includes fees for audits of retirement villages, which are payable by the respective retirement villages.
30. PARENT ENTITIES
(a) Parent financial information
The financial information for the parent entities Aveo Group Limited and Aveo Group Trust has been prepared on the same basis as the Group’s financial statements except as set out below.
Controlled entities and equity-accounted investments
Investments in these entities are carried in the Parent’s balance sheet at the lower of cost and recoverable amount. Dividends and distributions are brought to account in the income statement when they are declared.
Tax consolidation
Aveo Group Limited and its wholly-owned Australian controlled entities have formed a tax-consolidated group. The entities in the tax group have entered into a tax sharing agreement to limit the joint and several liability of the wholly-owned entities in the case of a default by the head entity, Aveo Group Limited. A tax funding agreement where the wholly-owned entities fully compensate the head entity for any current tax receivable and deferred tax assets related to unused tax losses or unused tax credits that are transferred to the head entity under the tax consolidation legislation has also been entered into. The transfer of such amounts to the head entity is recognised as inter-company receivables or payables.
Each entity in the tax-consolidated group continues to account for its own current and deferred tax amounts. These tax amounts are measured as if each entity in the tax consolidated group continues to be a stand-alone taxpayer in its own right.
In addition to its own current and deferred tax amounts, the Parent also recognises the current tax liabilities (or assets) and the deferred tax assets arising from unused tax losses and unused tax credits assumed from controlled entities in the tax-consolidated group.

Aveo Group 2016 Financial Report Notes to the consolidated financial statements (continued) For the year ended 30 June 2016
Page 90
30. PARENT ENTITIES (continued)
(b) Summary financial information
2016 2015 2016 2015$m $m $m $m
Current assets 30.7 21.2 - 0.3 Total assets 2,411.3 1,967.6 691.4 669.1 Current liabilities 704.1 477.5 61.3 39.6 Total liabilities 1,638.6 1,160.1 61.3 39.6 Issued capital 1,178.1 1,122.1 687.0 663.0 Reserves:
Foreign currency translation (4.9) 0.9 - - Investment revaluation (0.3) (5.2) - - Employee benefits 16.6 14.0 - -
Retained losses (416.8) (324.3) (56.9) (33.5) Total shareholders' equity 772.7 807.5 630.1 629.5 Profit of the parent entity (92.5) (35.8) 20.0 22.5 Total comprehensive income of the parent entity (92.5) (35.8) 20.0 22.5
Aveo Group Limited Aveo Group Trust
(c) Guarantees
Aveo Group Limited has provided the following financial guarantees: guarantees in respect of bank loans of subsidiaries amounting to nil (2015: $65.0 million,
secured by registered mortgages over the freehold properties of the subsidiaries); and cross guarantees under the Deed of Cross Guarantee to the subsidiaries listed in note 31.
No deficiencies of assets exist in any of these companies. No liability was recognised by the Parent in relation to these guarantees, as the fair value is immaterial.

Aveo Group 2016 Financial Report Notes to the consolidated financial statements (continued) For the year ended 30 June 2016
Page 91
31. DEED OF CROSS GUARANTEE
Aveo Group Limited and the wholly-owned subsidiaries identified below entered into a Deed of Cross Guarantee on 25 June 2008. The effect of the deed is that Aveo Group Limited has guaranteed to pay any deficiency in the event of the winding-up of any of the Group entities that are party to the Deed or if they do not meet their obligation under the terms of the liabilities subject to the guarantee. The Group entities that are party to the Deed have also given a similar guarantee in the event that Aveo Group Limited is wound up or if it does not meet its obligations under the terms of the liabilities subject to the guarantee.
Albion Flour Mill Pty Ltd FKP Communities Pty Ltd1 FKP Residential Developments Pty Ltd1
Aveo Leisure Services Pty Ltd FKP Constructions Pty Ltd1 FKP SJYC Pty Ltd Aveo Retirement Homes (No. 2) Pty Ltd
FKP Core Plus Two Pty Ltd Flower Roof Pty Ltd
Aveo Retirement Homes (Sales and Marketing) Pty Ltd
FKP Developments Pty Ltd FP Investments Pty Ltd1
Aveo Retirement Homes Limited1
FKP Golden Key Pty Ltd Home Finance Pty Ltd
Aust-Wide Mini Storage Pty Ltd FKP Holdings Pty Ltd1 Aveo Lindsay Gardens Management Pty Ltd
B/P Asset Pty Ltd FKP Lifestyle (Australia) Pty Ltd1
Aveo North Shore Retirement Villages Pty Ltd
B/P Land Pty Ltd FKP Lifestyle (Development) Pty Ltd
Ntonio Pty Ltd
B/P Sub Land Pty Ltd FKP Lifestyle (Real Estate) Pty Ltd
Peregian Springs Shopping Centre Pty Ltd
Carmist Pty Ltd FKP Lifestyle Pty Ltd1 Ridgewood Estates Pty Ltd Aveo Cleveland Gardens Pty Ltd
FKP Mackay Turf Farm No. 2 Pty Ltd
River Kat Pty Ltd
Data Plan Pty Ltd FKP Maitland Developments Pty Ltd
Skeyer Developments Pty Ltd
Evo-Con Pty Ltd FKP Maitland Properties Pty Ltd SPV Sydney Pty Ltd Aveo Extra Care Services Pty Ltd
FKP Overseas Holdings Pty Ltd Starwisp Pty Ltd
FKP American Holdings Pty Ltd FKP PIP Pty Ltd Aveo Tasmanian Retirement Living Management Pty Ltd
FKP Ann Street Pty Ltd FKP Queen Street Pty Ltd Aveo The Domain Retirement Country Club Pty Ltd
FKP Commercial Developments Pty Ltd
Aveo Real Estate Pty Ltd Freedom Aged Care Pty Ltd
Freedom Aged Care Banora Point (Operations) Pty Ltd
Freedom Aged Care Banora Point (Properties) Pty Ltd
Freedom Aged Care Bendigo (Operations) Pty Ltd
Freedom Aged Care Bendigo (Properties) Pty Ltd
Freedom Aged Care Coffs Harbour (Operations)Pty Ltd
Freedom Aged Care Coffs Harbour (Properties)Pty Ltd
Freedom Aged Care Dromana (Operations) Pty Ltd
Freedom Aged Care Dromana (Properties) Pty Ltd
Freedom Aged Care Fairways (Operations) Pty Ltd
Freedom Aged Care Fairways (Properties) Pty Ltd
Freedom Aged Care Geelong (Operations) Pty Ltd
Freedom Aged Care Geelong (Properties) Pty Ltd
Freedom Aged Care Intellectual Property Pty Ltd
Freedom Aged Care Kawana (Properties) Pty Ltd
Freedom Aged Care Launceston (Operations) Pty Ltd
Freedom Aged Care Launceston (Properties) Pty Ltd
Freedom Aged Care Morayfield (Operations) Pty Ltd
Freedom Aged Care Morayfield (Properties) Pty Ltd
Freedom Aged Care Redland Bay (Operations) Pty Ltd
Freedom Aged Care Redland Bay (Properties) Pty Ltd
Freedom Aged Care Rochedale (Operations) Pty Ltd
Freedom Aged Care Rochedale (Properties) Pty Ltd
Freedom Aged Care Tamworth (Operations) Pty Ltd
Freedom Aged Care Tamworth (Properties) Pty Ltd

Aveo Group 2016 Financial Report Notes to the consolidated financial statements (continued) For the year ended 30 June 2016
Page 92
31. DEED OF CROSS GUARANTEE (continued)
Freedom Aged Care Tanah Merah (Operations) Pty Ltd
Freedom Aged Care Tanah Merah (Properties) Pty Ltd
Freedom Aged Care Toowoomba (Operations) Pty Ltd
Freedom Aged Care Toowoomba (Properties) Pty Ltd
Freedom Aged Care Clayfield (Operations) Pty Ltd
Freedom Aged Care Clayfield (Properties) Pty Ltd
Freedom Home Care Services Pty Ltd
Residence Custodian Pty Ltd Residence Management Pty Ltd
Pursuant to ASIC Class Order 98/1418, relief has been granted from the Act’s requirements for preparation, audit and 1.
lodgement of financial reports.
The consolidated income statement and balance sheet of the entities that are parties to the Deed of Cross Guarantee are as follows:
Consolidated income statement2016 2015$m $m
Continuing operationsSale of goods and construction contract revenue 317.3 191.5 Revenue from rendering of services 92.0 73.8 Other revenue 27.3 11.2 Revenue 436.6 276.5 Cost of sales (268.8) (169.6) Gross profit 167.8 106.9
Change in fair value of investment properties 68.3 (3.8) Change in fair value of resident loans (19.1) 7.0 Change in fair value of financial assets/derivative financial liabilities - 4.1 Employee expenses (39.3) (31.8) Marketing expenses (12.7) (10.2) Occupancy expenses (1.4) (1.3) Administration expenses (11.7) (10.4) Other expense (17.2) (16.5) Finance costs (18.6) (24.1)
(69.4) - Profit from continuing operations before income tax 152.0 19.9 Income tax loss (44.9) (3.6) Profit from continuing operations after income tax 107.1 16.3
Closed Group
Share of profit or loss of associates and joint ventures accounted for using the equity method
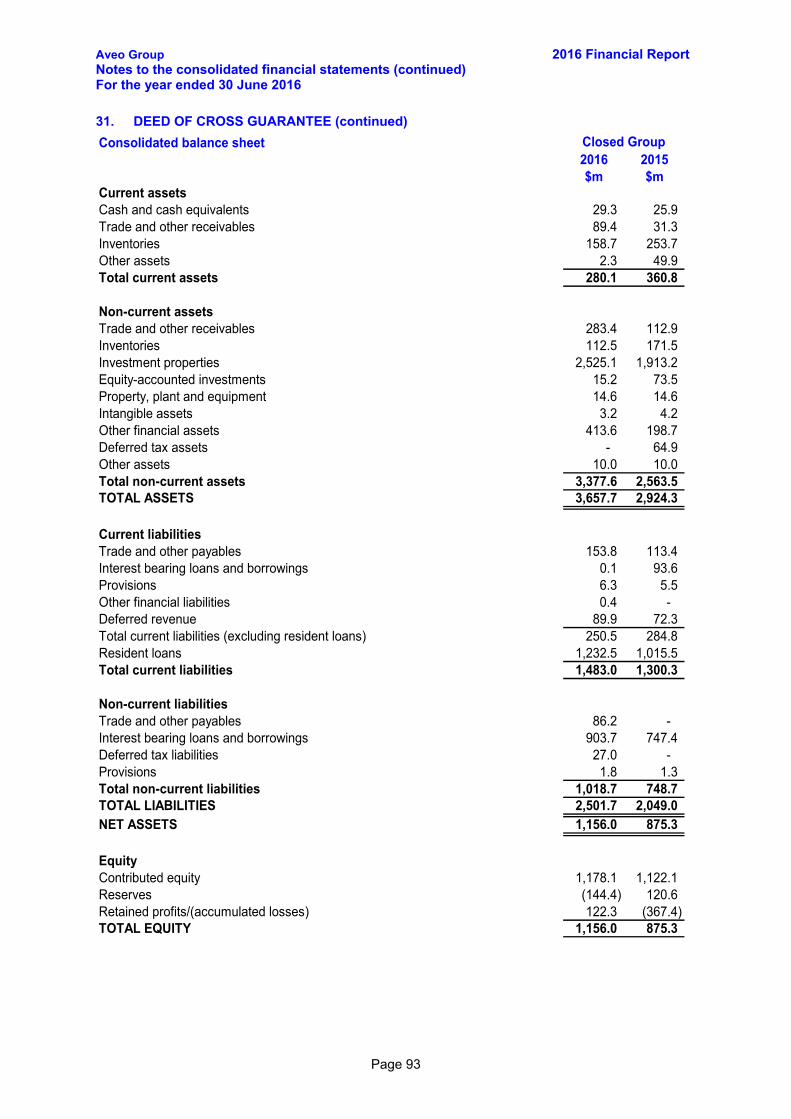
Aveo Group 2016 Financial Report Notes to the consolidated financial statements (continued) For the year ended 30 June 2016
Page 93
31. DEED OF CROSS GUARANTEE (continued)
Consolidated balance sheet2016 2015$m $m
Current assetsCash and cash equivalents 29.3 25.9 Trade and other receivables 89.4 31.3 Inventories 158.7 253.7 Other assets 2.3 49.9 Total current assets 280.1 360.8
Non-current assetsTrade and other receivables 283.4 112.9 Inventories 112.5 171.5 Investment properties 2,525.1 1,913.2 Equity-accounted investments 15.2 73.5 Property, plant and equipment 14.6 14.6 Intangible assets 3.2 4.2 Other financial assets 413.6 198.7 Deferred tax assets - 64.9 Other assets 10.0 10.0 Total non-current assets 3,377.6 2,563.5 TOTAL ASSETS 3,657.7 2,924.3
Current liabilitiesTrade and other payables 153.8 113.4 Interest bearing loans and borrowings 0.1 93.6 Provisions 6.3 5.5 Other financial liabilities 0.4 - Deferred revenue 89.9 72.3 Total current liabilities (excluding resident loans) 250.5 284.8 Resident loans 1,232.5 1,015.5 Total current liabilities 1,483.0 1,300.3
Non-current liabilitiesTrade and other payables 86.2 - Interest bearing loans and borrowings 903.7 747.4 Deferred tax liabilities 27.0 - Provisions 1.8 1.3 Total non-current liabilities 1,018.7 748.7 TOTAL LIABILITIES 2,501.7 2,049.0 NET ASSETS 1,156.0 875.3
EquityContributed equity 1,178.1 1,122.1 Reserves (144.4) 120.6 Retained profits/(accumulated losses) 122.3 (367.4) TOTAL EQUITY 1,156.0 875.3
Closed Group

Aveo Group 2016 Financial Report Notes to the consolidated financial statements (continued) For the year ended 30 June 2016
Page 94
32. OTHER ACCOUNTING POLICIES
Significant accounting policies relating to particular items are set out in the financial report next to the item to which they relate. Other significant accounting policies adopted in the preparation of the financial report are set out below. All these policies have been consistently applied to all years presented, unless otherwise stated.
(a) Basis of preparation
This general purpose financial report has been prepared in accordance with the requirements of the Act, the Standards and other authoritative pronouncements of the AASB. The financial report has been prepared on a historical cost basis except for financial assets and liabilities at fair value through profit or loss, investment property and non-current assets held for sale, which have been measured at fair value.
The financial report also complies with International Financial Reporting Standards as issued by the International Accounting Standards Board.
The financial report has been drawn up in accordance with ASIC Corporations (Stapled Group Reports) Instrument 2015/838 relating to combining accounts under stapling.
Stapling
On 12 November 2004, Aveo Group Trust units were stapled to Aveo Group Limited shares. The Group is a stapled entity that comprises Aveo Group Limited and its subsidiaries and Aveo Group Trust and its subsidiaries. The stapled securities cannot be traded or dealt with separately.
The constitutions of the Parent and the Property Trust ensure that, for as long as the two entities remain jointly quoted on the Australian Securities Exchange, the number of units in the Property Trust and the number of shares in the Parent shall be equal and that unitholders and shareholders will be identical.
Aveo Group Limited has been identified as the acquirer and the parent for the purposes of preparing the Group’s financial statements. The Property Trust has been consolidated under the stapling arrangement and is identified as the acquiree.
The net assets of the acquiree have been identified as non-controlling interests and presented in the balance sheet within equity, separately from the Parent’s equity. The profit of the acquiree has also been separately disclosed in the income statement.
Although the interests of the equity holders of the acquiree are treated as non-controlling interests, the equity holders of the acquiree are also the equity holders in the acquirer by virtue of the stapling arrangement.
(b) New accounting standards and interpretations
The Group has adopted as of 1 July 2015 all of the new and revised Standards and Interpretations issued by the AASB with mandatory effective dates impacting the current period. The adoption of the new and revised Standards and Interpretations had no material impact on the financial position or performance of the Group.
(c) Pending accounting standards
The following new Standards, amendments to Standards and Interpretations have been identified as those that may affect the Group on initial application. They have not been applied in preparing these financial statements.
AASB 9 Financial Instruments: Classification and Measurement
AASB 9 addresses the classification, measurement and derecognition of financial assets and financial liabilities. It also sets out new rules for hedge accounting. The standard is applicable for annual reporting periods beginning on or after 1 January 2018. The Group does not believe that this standard will have any material impact on its financial statements.

Aveo Group 2016 Financial Report Notes to the consolidated financial statements (continued) For the year ended 30 June 2016
Page 95
32. OTHER ACCOUNTING POLICIES (continued)
AASB 15 Revenue from Contracts with Customers
AASB 15 establishes principles for reporting useful information to users of financial statements about the nature, amount, timing and uncertainty of revenue and cash flows arising from an entity’s contracts with customers. The core principle of AASB 15 is that an entity recognises revenue to depict the transfer of promised goods or services to customers in an amount that reflects the consideration to which the entity expects to be entitled in exchange for those goods or services. An entity recognises revenue in accordance with that core principle by applying the following steps:
Step 1: Identify the contract(s) with a customer.
Step 2: Identify the performance obligations in the contract.
Step 3: Determine the transaction price.
Step 4: Allocate the transaction price to the performance obligations in the contract.
Step 5: Recognise revenue when (or as) the entity satisfies a performance obligation.
The standard is expected to be applicable for annual reporting periods beginning on or after 1 July 2018.
The Group has performed a preliminary assessment of the expected impact of the Standard, and does not believe it will have a material effect on the Group’s revenue recognition.
AASB 16 Leases
AASB 16 imposes revised requirement for recognising, measuring and disclosing the financial effects of leases.
Lessee accounting
Lessees will be required to recognise assets and liabilities for all leases with a term of more than 12 months, unless the underlying asset is of low value.
A lessee measures right-of-use assets similarly to other non-financial assets and lease liabilities similarly to other financial liabilities.
Assets and liabilities arising from a lease are initially measured on a present value basis. The measurement includes non-cancellable lease payments (including inflation-linked payments), and also includes payments to be made in optional periods if the lessee is reasonably certain to exercise an option to extend the lease, or not to exercise an option to terminate the lease.
Lessor accounting
AASB 16 substantially carries forward the lessor accounting requirements in AASB 117. Accordingly, a lessor continues to classify its leases as operating leases or finance leases, and to account for those two types of leases differently.
The standard is expected to be applicable for annual reporting periods beginning on or after 1 July 2019.
The Group has performed a preliminary assessment of the expected impact of the Standard. Because of the Group’s limited lease portfolio as lessee, AASB 16 is not expected to have a significant effect on the Group’s accounting treatment and disclosure of leases.

Aveo Group 2016 Financial Report Notes to the consolidated financial statements (continued) For the year ended 30 June 2016
Page 96
32. OTHER ACCOUNTING POLICIES (continued)
(d) Basis of consolidation
Subsidiaries are all entities over which the Group has control. The Group controls an entity when the Group is exposed to, or has rights to, variable returns from its involvement with the entity and has the ability to affect those returns through its power to direct the activities of the entity. Subsidiaries are fully consolidated from the date on which control is transferred to the Group. They are deconsolidated from the date that control ceases.
The financial statements of the subsidiaries are prepared for the same reporting period as the Parent, using consistent accounting policies. In preparing the consolidated financial statements, all intercompany balances, transactions, unrealised gains and losses resulting from intra-group transactions and dividends are eliminated in full.
The acquisition of subsidiaries is accounted for using the acquisition method of accounting. The acquisition method of accounting involves recognising at acquisition date, separately from goodwill, the identifiable assets acquired, the liabilities assumed and any non-controlling interest in the acquiree. The identifiable assets acquired and the liabilities assumed are measured at their acquisition date fair values.
Non-controlling interests in the net assets of consolidated entities are allocated their share of net profit after tax in the income statement and statement of comprehensive income, and are presented within equity in the balance sheet, separately from the equity of the owners of the Parent. Losses are attributed to the non-controlling interest even if that results in a deficit balance. A change in ownership interest of a subsidiary that does not result in loss of control is accounted for as an equity transaction.
(e) Foreign currency translation
Functional and presentation currency
The Group’s financial statements are presented in Australian dollars, which is Aveo Group Limited’s functional and presentation currency.

Aveo Group 2016 Financial Report Dictionary For the year ended 30 June 2016
Page 97
In the Financial and Directors’ Reports, the following terms have the meaning shown:
AASB Australian Accounting Standards Board ACF Aged care facility Act Corporations Act 2001 AICD Australian Institute of Company Directors ASIC Australian Securities and Investments Commission Bad Leaver A KMP whose employment is terminated or cancelled because of voluntary
resignation, for cause or because of unsatisfactory performance or is otherwise determined by the Board to be a Bad Leaver
Board The board of directors of Aveo Group Limited CEO Chief Executive Officer CFO Chief Financial Officer Change of Control Event
A Change of Control Event occurs if a change in control of the Group occurs or is recommended by the Board, or a resolution is passed or order made for the winding up of the Parent or the vesting of the Property Trust
Committee Nomination and Remuneration Committee of the Board Directors Directors of Aveo Group Limited DMF Deferred management fees DMF/CG Deferred management fees and capital gains DPS Dividend/distribution per Security DSP Directors’ Security Plan EBIT Earnings before interest and income tax EBITDA Earnings before interest, income tax, depreciation and amortisation EOP Employee Option Plan subject to performance conditions EPS Earnings per Security Finsia Financial Services Institute of Australasia Freedom Freedom Aged Care Pty Limited FY Financial year FY14 Financial year ended 30 June 2014 FY15 Financial year ended 30 June 2015 FY16 Financial year ended 30 June 2016 FY17 Financial year ended 30 June 2017 FY18 Financial year ended 30 June 2018 FY21 Financial year ended 30 June 2021 Good Leaver A KMP whose employment is terminated or cancelled and is not a Bad Leaver Group Aveo Group, which is a stapled entity comprising Aveo Group Limited and its
subsidiaries, and Aveo Group Trust and its subsidiaries KMP Key Management Personnel: Those persons who, during the course of the year
ended 30 June 2016, had the authority and responsibility for planning, directing and controlling the activities of the Group, directly or indirectly, including any director (whether executive or otherwise)
LTI Long-Term Incentive: LTI is equity-based compensation which provides KMP with securities, options or rights, which may vest into Securities dependent upon performance against defined conditions typically over a three to four year performance period
LTIP The Group’s Long-Term Incentive Plan encompassing the EOP and the Rights Plan
MIB Mulpha International Berhad; the Group is an associate of MIB NED Non-Executive Director NTA Net tangible assets Parent Aveo Group Limited Plan The Aveo Group Performance Rights Plan that was approved at the Group’s 2012
Annual General Meeting Property Trust Aveo Group Trust PRP Performance Rights Plan Regulations Corporations Regulations 2001

Page 98
Rights Performance Rights and Retention Rights: Rights to acquire Securities in the future for nil consideration, subject to achieving performance conditions, granted under the PRP
ROA Return on Retirement Assets: Retirement earnings before interest and tax, divided by average Retirement assets employed. Capitalised interest in Retirement development cost of goods sold is added back. Retirement assets employed at any date will be the sum of the carrying amounts of Retirement investment properties (including those under development), equity-accounted investments and aged care assets, all at 30 June 2013, together with cash expenditure (including development expenditure) on those assets to the date of calculation, less any cash recoveries of or from those assets (excluding any profit element) to the date of calculation
ROE Return on Equity: The sum of the movement in securityholders’ equity (excluding new issues of Securities and any change in fair value of Retirement assets occurring after 30 June 2016, net of income tax) and dividends and distributions declared divided by the opening balance of securityholders’ equity. Average RoE for FY16 – FY18 will be calculated as the arithmetic average of RoE for those years.
RTSR Relative TSR measures the TSR for Aveo Group relative to the TSR of a comparator group of Aveo’s peers over the RTSR testing period
RVG Retirement Villages Group Securities Stapled securities of the Group Securities Price
The price at which the last sale of Securities was traded on the ASX on the referenced day
Special Circumstances
The termination of a KMP’s employment as a result of total and permanent disablement, death or such other circumstances as the Board may determine
Standards Australian Accounting Standards STIP The Group’s Short-Term Incentive Plan: A 12-month incentive plan that provides
cash and Securities awards for performance against key financial and non-financial targets during any one financial year
STI Short-Term Incentive (cash): Cash awards under the STIP STID Deferred STI: Awards of Securities under the STIP Tian An Tian An Australia Limited, formerly PBD Developments Limited TFR Total Fixed Remuneration: The fixed component of remuneration, which includes
base pay and superannuation and excludes movements in accrued annual and long service leave
Trust Group Aveo Group Trust and its controlled entities TSR Total Securityholder Return: Security price growth plus dividends notionally
reinvested in securities, over the assessment period UPT Underlying Profit after Tax: Reflects statutory profit after tax, as adjusted to reflect
the Directors’ assessment of the result for the ongoing business activities of the Group, in accordance with AICD/Finsia principles of recording underlying profit
Vesting Date The date that STID vest, being 1 September of the year following the award

Aveo Group 2016 Financial Report Directors’ declaration
Page 99
In the opinion of the Directors of Aveo Group Limited and Aveo Funds Management Limited as Responsible Entity for Aveo Group Trust (collectively referred to as ‘the Directors’):
(a) the Financial Statements and Notes and the Remuneration Report in the Directors’ Report set out on pages 16 to 30, are in accordance with the Act, including:
(i) giving a true and fair view of the Group’s and the Trust Group’s financial position as at 30 June 2016 and of their performance, for the financial year ended on that date; and
(ii) complying with Australian Accounting Standards (including the Australian Accounting Interpretations) and the Regulations;
(b) the Financial Report also complies with International Financial Reporting Standards issued by the International Accounting Standards Board, as disclosed in note 35(a); and
(c) there are reasonable grounds to believe that the Group and the Trust Group will be able to pay their debts as and when they become due and payable.
At the date of this declaration there are reasonable grounds to believe that Aveo Group Limited and the Group entities named in note 31 will be able to meet any obligations or liabilities to which they are or may have become subject to by virtue of the Deed of Cross Guarantee between Aveo Group Limited and those Group entities pursuant to ASIC Class Order 98/1418 (as described in note 31).
The Directors have been given the declarations by the Chief Executive Officer and the Chief Financial Officer for the financial year ended 30 June 2016 required by section 295A of the Act.
Signed in accordance with a resolution of the Board of Directors:
S H Lee Chairman
G E Grady Executive Director and Chief Executive Officer
Dated at Sydney this 17th day of August 2016

A member firm of Ernst & Young Global Limited Liability limited by a scheme approved under Professional Standards Legislation
Page 100
Ernst & Young 200 George Street Sydney NSW 2000 Australia GPO Box 2646 Sydney NSW 2001
Tel: +61 2 9248 5555 Fax: +61 2 9248 5959 ey.com/au
Independent auditor's report to the security holders of Aveo Group
Aveo Group comprises Aveo Group Limited and the entities it controlled at the year’s end or from time to time during the financial year (“Aveo Group” or “the Group”) and Aveo Group Trust and the entities it controlled at the year’s end or from time to time during the financial year (“Trust Group”).
Report on the financial report
We have audited the accompanying financial report of the Group, which comprises the consolidated balance sheets as at 30 June 2016, the consolidated income statements, the consolidated statements of comprehensive income, the consolidated statements of changes in equity and the consolidated cash flow statements for the year then ended, notes comprising a summary of significant accounting policies and other explanatory information, and the directors' declaration of the Group.
Directors' responsibility for the financial report
The directors of Aveo Group Limited and the directors of Aveo Funds Management Limited as Responsible Entity for Aveo Group Trust (collectively referred to as “the Directors”) are responsible for the preparation of the financial report that gives a true and fair view in accordance with Australian Accounting Standards and the Corporations Act 2001 and for such internal controls as the directors determine are necessary to enable the preparation of the financial report that is free from material misstatement, whether due to fraud or error. In Note 31(a), the directors also state, in accordance with Accounting Standard AASB 101 Presentation of Financial Statements, that the financial statements comply with International Financial Reporting Standards.
Auditor's responsibility
Our responsibility is to express an opinion on the financial report based on our audit. We conducted our audit in accordance with Australian Auditing Standards. Those standards require that we comply with relevant ethical requirements relating to audit engagements and plan and perform the audit to obtain reasonable assurance about whether the financial report is free from material misstatement.
An audit involves performing procedures to obtain audit evidence about the amounts and disclosures in the financial report. The procedures selected depend on the auditor's judgment, including the assessment of the risks of material misstatement of the financial report, whether due to fraud or error. In making those risk assessments, the auditor considers internal controls relevant to the entity's preparation and fair presentation of the financial report in order to design audit procedures that are appropriate in the circumstances, but not for the purpose of expressing an opinion on the effectiveness of the entity's internal controls. An audit also includes evaluating the appropriateness of accounting policies used and the reasonableness of accounting estimates made by the directors, as well as evaluating the overall presentation of the financial report.
We believe that the audit evidence we have obtained is sufficient and appropriate to provide a basis for our audit opinion.
Independence
In conducting our audit we have complied with the independence requirements of the Corporations Act 2001. We have given to the directors of the group a written Auditor’s Independence Declaration, a copy of which is included in the directors’ report.
Opinion
In our opinion:
a. the financial report of Aveo Group is in accordance with the Corporations Act 2001, including:
i giving a true and fair view of the Group and Aveo Group Trust's financial position as at 30 June 2016 and their performance for the year ended on that date; and
ii complying with Australian Accounting Standards and the Corporations Regulations 2001; and

A member firm of Ernst & Young Global Limited Liability limited by a scheme approved under Professional Standards Legislation
Page 101
b. the financial report also complies with International Financial Reporting Standards as disclosed in Note 31(a).
Report on the remuneration report
We have audited the Remuneration Report included in pages 16 to 30 of the directors' report for the year ended 30 June 2016. The directors of Aveo Group Limited are responsible for the preparation and presentation of the Remuneration Report in accordance with section 300A of the Corporations Act 2001. Our responsibility is to express an opinion on the Remuneration Report, based on our audit conducted in accordance with Australian Auditing Standards.
Opinion
In our opinion, the Remuneration Report of Aveo Group for the year ended 30 June 2016, complies with section 300A of the Corporations Act 2001.
Ernst & Young
Douglas Bain Partner Sydney 17 August 2016