appendix 4e – preliminary final report financial year ... · 8/25/2016 · appendix 4e –...
TRANSCRIPT

APPENDIX 4E – PRELIMINARY FINAL REPORT Financial year ended 30 June 2016
1
August 25, 2016 ASX: WSA
Reporting Period The reporting period is the financial year ended 30 June 2016. The previous corresponding period is 30 June 2015. Results for announcement to the market
% Change Amount A$’000
Revenue from ordinary activities Down 33% to 209,117
(Loss)/profit from ordinary activities after tax attributable to members of Western Areas Ltd Down 175% to (26,700)
Net (loss)/profit after tax attributable to members of Western Areas Ltd Down 175% to (26,700)
Dividends Amount per security Unfranked
amount per security
Franked amount per
security
% CFI
Financial year ended 30 June 2016
Final dividend Nil Nil Nil 0%
Interim dividend Nil Nil Nil 0%
Financial year ended 30 June 2015
Final dividend 4.0 cents Nil 4.0 cents 0%
Interim dividend 3.0 cents Nil 3.0 cents 0% Dividend payments No dividends have been declared for the year ended 30 June 2016. Total dividend per security (interim plus final) Current year Previous year
Ordinary securities Nil 7.0 cents Total dividends paid or payable on all securities Current year
A$‘000 Previous year
A$‘000 Ordinary securities 9,337 16,281 F
or p
erso
nal u
se o
nly

APPENDIX 4E – PRELIMINARY FINAL REPORT Financial year ended 30 June 2016
2
Net Tangible Asset Backing
Current year Previous year
The net tangible assets per security 162.3 cents 179.7 cents Investments in Controlled Entities Wholly Owned and Controlled Subsidiaries of Western Areas Ltd:
BioHeap Ltd Western Platinum NL Australian Nickel Investments Pty Ltd Western Areas Nickel Pty Ltd Western Areas Employee Share Trust
Investments in Associates & Joint Ventures Associates of Western Areas Ltd did not contribute to the result of the consolidated group for the financial year ended 30 June 2016. Associates of Western Areas Ltd:
FinnAust Mining Plc - 37% (United Kingdom Entity) Mustang Minerals Inc. 19.9% (Canadian Entity)
Audit Review & Accounting Standards This report is based on Consolidated Financial Statements that have been subject to a full Audit by the Company’s Auditor. All entities incorporated into the Consolidated Group’s result were prepared under AIFRS. Other Information The income statement, statement of financial position, statement of cashflows and associated notes are contained in the financial statements in the attached Financial Report for the year ended 30 June 2016. Other detailed commentary on the variation between the results for the year ended 30 June 2016 and the comparative period is provided in the Directors Report of the Financial Report.
Except for the matters noted above, all the disclosure requirements pursuant to ASX Listing Rule 4.3A are contained within Western Areas Limited 30 June 2016 Consolidated Financial Statements which accompany this Preliminary Final Report. Date: 25 August 2016
Daniel Lougher Managing Director
For
per
sona
l use
onl
y

FINANCIAL REPORT FOR THE YEAR ENDED 30 JUNE 2016
For
per
sona
l use
onl
y
Western Areas Ltd & Controlled Entities ABN 68 091 049 357
Page 2 of 76
CONTENTS
DIRECTORS REPORT ................................................................................................................................. 3
AUDITOR’S INDEPENDENCE DECLARATION ........................................................................................... 23
CONSOLIDATED INCOME STATEMENT................................................................................................... 24
CONSOLIDATED STATEMENT OF COMPREHENSIVE INCOME ................................................................ 25
CONSOLIDATED STATEMENT OF FINANCIAL POSITION ......................................................................... 26
CONSOLIDATED STATEMENT OF CHANGES IN EQUITY .......................................................................... 27
CONSOLIDATED STATEMENT OF CASH FLOWS ...................................................................................... 28
NOTES TO THE FINANCIAL STATEMENTS ............................................................................................... 29
DIRECTORS DECLARATION ..................................................................................................................... 74
INDEPENDANT AUDITOR’S OPINION ..................................................................................................... 75
For
per
sona
l use
onl
y

Western Areas Ltd & Controlled Entities ABN 68 091 049 357
Page 3 of 76
DIRECTORS REPORT
The Directors of Western Areas Limited submit herewith the financial report of the Company for the financial year ended 30 June 2016. Unless noted, all amounts in this report refer to Australian dollars. In order to comply with the provisions of the Corporations Act 2001, the Directors’ report follows:
Information about the Directors
The following persons were directors of Western Areas Ltd for the entire financial year and up to the date of this report unless otherwise stated.
Ian Macliver Non‐Executive
Independent Chairman
Mr Macliver is a Chartered Accountant with many years experience as a senior executive
and Director of both resource and industrial companies, with particular responsibility for
capital raising and other corporate development initiatives. Mr Macliver is Managing
Director of Grange Consulting Group Pty Limited which provides specialist corporate
advisory services to both listed and unlisted companies. Mr Macliver is a member of the
Audit and Risk, Treasury, Remuneration and Nomination Committee.
Daniel Lougher Managing Director
& CEO
Mr Lougher is a qualified Mining Engineer with over 30 years experience in all facets of
mining project exploration, feasibility, development and operational activities in Australia
and overseas. Mr Lougher is a member of the Australasian Institute of Mining &
Metallurgy. Mr Lougher serves on the Nomination Committee.
David Southam Executive
Director
Mr Southam is a Certified Practicing Accountant with over 20 years experience in
accounting, banking and finance across the resources and industrial sectors. Mr Southam
has been responsible for completing significant capital management initiatives and
commodity offtake contracts with large domestic and international companies.
Richard Yeates Non‐Executive &
Independent Director
Mr Yeates is a Geologist with more than 30 years mining industry experience in various
roles and has significant experience across a wide range of resource projects around the
world. He is familiar with the ASX regulatory environments and has had exposure to
international resource funds and financial institutions. Mr Yeates is Chairman of the
Remuneration and Nomination Committee.
Craig Readhead Non‐Executive &
Independent Director
Mr Readhead is a lawyer with over 30 years legal and corporate advisory experience with
specialisation in the resources sector, including the implementation of large scale mining
projects both in Australia and overseas. Mr Readhead is a former president of the
Australian Mining and Petroleum Law Association and until recently was a partner of
specialist mining and corporate law firm, Allion Legal. Mr Readhead is a member of the
WA Council of the Australian Institute of Company Directors. Mr Readhead is Chairman of
the Treasury and Audit & Risk Management Committees.
Tim Netscher Non‐Executive &
Independent Director
Mr Netscher has significant broad‐based international resources experience at senior
levels, in roles spanning marketing, operations management, project management and
business development in Australia and Internationally. Mr Netscher has considerable
experience in the nickel industry with senior executive roles at Impala Platinum Ltd, PT
Inco and QNI Pty Ltd. Mr Netscher is a Chartered Engineer and holds a BSc in Chemical
Engineering, Bachelor of Commerce, a MBA, is a fellow of the Institution of Chemical
Engineers and is a member of the Australian Institute of Company Directors. Mr Netscher
is a member of the Treasury, Audit & Risk and Remuneration Committees.
Julian Hanna Non‐Executive Director
Mr Hanna resigned as a Director of Western as at 15 June 2016.
For
per
sona
l use
onl
y

Western Areas Ltd & Controlled Entities ABN 68 091 049 357
Page 4 of 76
Directorships of Other Listed Companies
Name Company Period of Directorship
I Macliver Otto Energy Ltd Since January 2004
Rent.com.au Ltd (Ceased) September 2010 – June 2015
Range Resources Ltd (Ceased) June 2014 – August 2014
JCurve Solutions Limited (Ceased) July 2000 – October 2013
J Hanna MOD Resources Ltd Since January 2013
Mustang Minerals Corp (Ceased) December 2006 – February 2015
D Lougher FinnAust Mining Plc Mustang Minerals Corp (Ceased) December 2013 – March 2016
Mustang Minerals Corp (Ceased) January 2011 – October 2015
D Southam Troy Resources Ltd Since July 2016
Sundance Resources Ltd (Ceased) September 2013 – January 2016
R Yeates Middle Island Resources Ltd Since March 2010
Atherton Resources Limited (Ceased) October 2014 – November 2015
C Readhead Beadell Resources Ltd Since April 2010
Eastern Goldfields Ltd ‐ (Formerly Swan Gold Mining Ltd) Since March 2013
Redbank Copper Ltd Since April 2013
General Mining Corporation Ltd (Ceased) August 2007 – October 2015
Heron Resources Ltd (Ceased) January 2000 – April 2015
Galaxy Resources Ltd (Ceased) June 2006 ‐ November 2013
T Netscher St Barbara Ltd Since February 2014
Gold Road Resources Ltd Since September 2014
Toro Energy Ltd (Ceased) October 2015 – August 2016
Deep Yellow Ltd (Ceased) January 2013 – December 2015
Aquila Resources Ltd (Ceased) November 2013 – July 2014 (*)
Gindalbie Metals Ltd (Ceased) April 2011 – October 2013 (*) Date co‐insides with de‐listing from the Australian Stock Exchange.
Interests in Shares and Options of the Company
As at 30 June 2016, the interest of the Directors or associates of the Directors in the shares and options of the Company are:
Name Ordinary Shares Performance Rights (i)
I Macliver 36,448 ‐
D Lougher 246,178 970,640
J Hanna (ii) 400,091 ‐
D Southam 128,135 546,093
R Yeates 10,000 ‐
C Readhead ‐ ‐
T Netscher 7,000 ‐
(i) None of the performance rights had vested at 30 June 2016. (ii) Shareholding of Mr Hanna as at 15 June 2016.
All equity transactions with Directors and Executives, other than those arising from the employee share scheme, have been entered into under terms and conditions no more favourable than those the entity would have adopted if dealing at arm’s length.
Share Options
No options were issued, cancelled or remained outstanding during the financial year.
For
per
sona
l use
onl
y

Western Areas Ltd & Controlled Entities ABN 68 091 049 357
Page 5 of 76
Company Secretary
Mr J Belladonna is a Certified Practicing Accountant and has been employed at Western Areas Limited since 2005, originally as Financial Controller and then as the Company Secretary and Chief Financial Officer. In his time at the Company he has been intimately involved in the accounting, debt financing, corporate governance, capital raising and financial initiatives at the Company. Mr Belladonna has over 15 years experience in the resources industry including listed gold and base metal companies in a range of management positions.
Indemnification of Officers and Directors
During the financial year, the parent entity paid a premium under a contract insuring all Directors and Officers of the Company against liability incurred in that capacity. Disclosure of the nature of liabilities insured and the premium is subject to a confidentiality clause under the contract of insurance.
The Company has not otherwise, during or since the end of the financial year, except to the extent permitted by law, indemnified or agreed to indemnify an officer or auditor of the Company against a liability incurred as such an officer or auditor.
Directors’ Benefits
No Directors of the Consolidated Entity have, since the end of the previous financial year, received or become entitled to receive a benefit (other than a benefit included in the total amount of emoluments received or due and receivable by Directors shown on page 20 of the Directors Report) by reason of a contract made by the parent entity or a related body corporate with the director or with any entity in which the director has a substantial financial interest, with the exception of benefits that may be deemed to have arisen in relation to the transactions entered into in the ordinary course of business as disclosed in Note 29 to the accounts.
Directors’ Meetings
The following table sets out the number of meetings of the parent entity’s Directors and meetings of the sub‐committees of the Board held during the year ended 30 June 2016 and the number of meetings attended by each Director.
Meetings of Committees
Directors
Meetings
Audit & Risk
Mgmt Remuneration Nomination Treasury
Meetings held : 13 2 2 1 1
Meetings attended :
I Macliver 13 2 2 1 1
D Lougher 13 ‐ ‐ 1 ‐
D Southam 13 ‐ ‐ ‐ ‐
J Hanna (i) 12 ‐ ‐ ‐ ‐
R Yeates 13 ‐ 2 1 ‐
C Readhead 13 2 ‐ ‐ 1
T Netscher 13 2 2 ‐ 1
(i) Mr Hanna resigned from the Board on 15 June 2016, attending all Board meetings until that date.
Remuneration of Directors and Senior Management
Information about the remuneration of directors and senior management is set out in the remuneration report of this Directors’ Report on page 11.
Performance Rights Granted to Directors and Senior Management
Performance Rights granted to directors and senior management during the financial year ended 30 June 2016 is set out in the Remuneration Report of this Directors’ Report on page 16.
For
per
sona
l use
onl
y

Western Areas Ltd & Controlled Entities ABN 68 091 049 357
Page 6 of 76
Proceedings on behalf of the Company
No person has applied for leave of the Court to bring proceedings on behalf of the Company or intervene in any proceedings to which the Company is a party for the purpose of taking responsibility on behalf of the Company for all or any part of those proceedings.
The Company was not a party to any such proceedings during the year.
Principal Activities
The principal activities of the Consolidated Entity during the year consisted of mining, processing and sale of nickel sulphide concentrate, the continued assessment of development feasibility of the high grade nickel mines and the exploration for nickel sulphides, other base metals and platinum group metals.
Review of Operations
Operational metrics
The Company provides detailed operating reports at the end of every quarter outlining quarterly and year to date production and sales statistics, some of which are shown below.
Financial Year ‐ Physical Summary
2015/16 2014/15
Tonnes Mined Tns 590,246 540,268
Nickel Grade (average) % 4.7% 4.9%
Tonnes Milled Tns 616,279 609,727
Milled Grade (average) % 4.5% 4.7%
Recovery % 90% 90%
Nickel in Concentrate Tns 25,009 25,801
Nickel Sales in Concentrate Tns 24,793 26,036
Total mine ore production increased year on year due to the Spotted Quoll mine reaching full
production allowing mining rate optimisation for delivery of a consistent and reliable ore feed blend
to the concentrator, while maintaining appropriate stockpile levels.
The nickel concentrator processed a record 616,279 ore tonnes compared to the 609,727 ore tonnes
for the previous financial year, with the variance attributed to improved mill throughput rates and
increased plant availability.
The Company continued its exceptional safety performance across the group maintaining a lost time injury frequency rate of zero for the financial year. In addition, the continued high level of environmental management has resulted in no significant environmental incidences occurring throughout the year.
For
per
sona
l use
onl
y

Western Areas Ltd & Controlled Entities ABN 68 091 049 357
Page 7 of 76
Financial Metrics
Income Statement
Full Financial Year – Earnings Results Summary
2015/16 2014/15 Change
$M $M $M
Revenue 209.1 312.7 (103.6)
Gross (Loss)/Profit (5.7) 76.2 (81.9)
(LBIT)/EBIT (36.0) 63.5 (99.5)
(Loss)/Profit Before Tax (38.5) 48.1 (86.6)
Net (Loss)/Profit After Tax (29.8) 35.0 (64.8)
Consolidated net loss after tax (NLAT) for the group was $29.8 million, a decrease of $64.8 million from the results reported in the previous financial year. The overriding factor impacting the change in earnings was the substantial decline in the nickel price.
Accordingly, consolidated revenue for the year was down $103.6 million with the main contributor
being the 28% fall in the average realised nickel price compared to the prior year. The average
realised nickel price for the year decreased from US$6.58/lb (A$7.87) in the prior financial year to
US$4.14/lb (A$5.69) for the year ended 30 June 2016. The Company continued to have an
unrelenting focus on key controllable items, being cost management and productivity
improvements. This focus resulted in cost of sales reducing by $21.7 million for the year, with the
bulk of these savings embedded into future periods.
Other pre‐tax non‐cash items which impacted NLAT of $29.8 million for the year included:
Depreciation charges of $17.0 million;
Amortisation charges of $45.2 million;
Write‐off of non‐current assets of $7.8 and
Impairment losses of $7.0 million.
These non‐cash items amounted to $77.0 million.
Statement of Financial Position
Full Financial Year ‐ Balance Sheet Summary
2015/16 2014/15 Change
$M $M $M
Cash at bank 75.7 195.4 (119.7)
Current Assets 119.9 234.7 (114.8)
Total Assets 489.2 597.6 (108.4)
Current Liabilities 26.3 168.6 (142.3)
Total Liabilities 55.2 196.5 (141.3)
Net Equity 434.0 401.1 32.9
For
per
sona
l use
onl
y

Western Areas Ltd & Controlled Entities ABN 68 091 049 357
Page 8 of 76
Cash at bank decreased by $119.7 million to finish the year at $75.7 million. This was mainly due to the scheduled repayment of the $125.0 million of convertible bonds early in the financial year, the completion of the Cosmos acquisition payments of $24.2 million and lower receipts due to record low nickel prices. This was partially offset by a $75.0 million capital raising and share purchase plan completed in April 2016.
Total assets at reporting date were $489.2 million, representing a decrease of $108.4 million from the prior year, primarily driven by the decrease in cash of $119.7 million. Mine development decreased by $16.9 million as a result of amortisation charges of $43.7 million being offset by new development of $27.8 million. Capitalised exploration and evaluation expenditure increased by $19.4 million, the increase due to recognition of the newly acquired Cosmos exploration assets valued at $27.1 million, offset by the deconsolidation of $11.5 million FinnAust exploration assets and $7.0 million impairment provision raised against the FinnAust exploration assets. Exploration expenditure for the year of $12.9 million related to the Company’s ongoing investment in exploration at Forrestania and the other regional projects. Inventories decreased by $8.6 million mainly as a result of a decrease in ore stockpiles.
Total liabilities of $55.2 million represented a decrease of $141.3 million from the prior year, due to the repayment of the Company’s final convertible bonds and a decrease in income tax liabilities.
Total equity attributable to the shareholders increased by $32.9 million to $434.0 million, primarily due to a capital raising of $75.0 million, offset by the NLAT of $29.8 million.
Statement of Cash Flows
Full Financial Year – Cashflow Summary
2015/16 2014/15 Change
$M $M $M
Net Operating Cashflow 15.6 148.5 (132.9)
Net Investing Cashflow (72.4) (71.9) (0.5)
Net Financing Cashflow (62.8) (111.8) 49.0
Net Cashflow (119.6) (35.2) (84.4)
As outlined earlier in the Directors Report, the 28% reduction in the nickel price for the year had a significant impact on the cash generation of the Company. Notwithstanding, decisive action was taken throughout the year which included a significant reduction in operating costs and the deferral of mine development, capital projects and exploration expenditure.
In respect of capital and exploration expenditure, the Company reduced its spend by $22.0 million versus the prior financial year with a significant portion of this saving generated in the second half.
Furthermore the Company became debt free for the first time in many years following the repayment of $125.0 million in convertible bonds in July. The flow on impact of this debt reduction was a significant fall in interest payments of $6.8 million.
Working capital movements included a higher debtors balance at the end of financial year mainly reflected timing differences with June sales.
For
per
sona
l use
onl
y

Western Areas Ltd & Controlled Entities ABN 68 091 049 357
Page 9 of 76
Material Business Risks
Strategic Long Term Economic Risks
Exploration In order to maintain and enhance our economic base of mineral resources, the Company
continues to invest in exploration. It must be recognised that investing in exploration does
not guarantee that additional mineral resources will be discovered. However exploration is
essential in order to sustain ore reserves at the Forrestania Nickel Operations and establish
new profit generating projects. Strategically the Company continues to invest in the
application of modern exploration techniques within proven nickel regions such as the
Forrestania Nickel Operations (“FNO”), the Cosmos Nickel Complex (“Cosmos”) and the highly
prospective green field West Gawler Project.
Inorganic Growth & Investment Western Areas’ strategy includes investment in business development activities (joint
ventures, mergers, acquisitions and innovation) to enhance the current project portfolio.
Western Areas is debt free and continues to generate positive cash flows from FNO. With any
transaction there is a risk that through the lifecycle of the project, the investment does not
deliver the forecast returns to the Company. Any material investment is subject to strict
governance and due diligence processes to ensure the opportunities and risks are understood
and managed in a way that provides the greatest level of return to shareholders.
Metal & Currency Markets As a mining company, Western Areas is exposed to currency and nickel price fluctuations.
Over the past twelve months the Company has managed to maintain a financially robust
business in the face of historically low nickel prices. Being debt free, and having high grade
operations, provides a significant level of resilience against adverse market conditions. The
Company has a number of strategies available to smooth out the effects of a low Australian
dollar nickel price, including hedging when market conditions permit.
Operating Risks
Business Interruption A significant disruption to FNO could have a significant adverse effect on Western Areas
revenue from operating activities. FNO consists of the Spotted Quoll and Flying Fox
underground mines, the Cosmic Boy concentrator and fully developed supporting
infrastructure. These assets are all within the same geographic area, and are our only revenue
generating assets at this time. Therefore, a significant failure event at one of these assets has
the potential to substantially reduce nickel production and consequent revenue from nickel
sales. Western Areas has well established risk and business continuity management practices
that mitigate and respond to known business interruption risks. This resilience extends
throughout our supply chain to the point of delivery to customers.
Offtake Parties Western Areas relies on nickel offtake customers to purchase and financially settle on nickel
concentrate deliveries. The financial failure of one or more of our offtake customers could
result in delayed payments receipts or new/revised offtake contract terms. Western Areas
conducts due diligence prior to entering into nickel offtake contracts and maintains strong
relationships with its customers. The Company stays abreast of the nickel concentrate
market, while also monitoring alternative and emerging markets for nickel products.
For
per
sona
l use
onl
y
Western Areas Ltd & Controlled Entities ABN 68 091 049 357
Page 10 of 76
Counter Parties Western Areas relies on a number of contractor entities to support exploration and
production activities. The financial failure of a key contractor could result in interruptions to
production plans, and affect the operating costs. Western Areas conducts due diligence prior
to awarding contracts, and continues to actively manage and monitor the activities of our
contractors and suppliers. In addition, through the Company’s Risk Management Framework
there are contingency plans in place for such events.
Sustainability Risks
Safety The safety and well‐being of people undertaking activities on behalf of the Company is a key
priority. There are a number of inherent hazards associated with exploration, mining, mineral
processing and logistics that require ongoing management and assurance to ensure our safety
performance is in line with the high standards expected. Western Areas continues to
demonstrate excellence in safety performance and continues to work with our contractors
and partners to ensure Western Areas is a safe and rewarding place to work.
License to Operate The Company has a number of statutory and regulatory obligations to fulfil including
corporate, financial, heritage, health and safety, environmental, land management, tenure,
and human resources. Western Areas readily accepts that fulfilling compliance obligations is a
necessary and important part of maintaining its license to operate. Compliance management
is built into planning processes and day to day activities, and is an accepted part of Western
Areas culture.
Subsequent Events
Other than matters detailed above, there have been no subsequent events after 30 June 2016 which have a material effect on the financial statements for the year ended 30 June 2016.
Dividends Paid or Recommended
No dividends have been declared or paid in relation to the 30 June 2016 financial year.
In respect of the financial year ended 30 June 2015, the Board declared and paid a final 4 cent, fully franked dividend.
For
per
sona
l use
onl
y

Western Areas Ltd & Controlled Entities ABN 68 091 049 357
Page 11 of 76
REMUNERATION REPORT (AUDITED)
This report outlines the remuneration arrangements in place for Non‐Executive Directors, Executives and other Key Management Personnel of Western Areas Ltd. There has been no material change to the remuneration structures or incentive programmes during the 2016 financial year (FY16).
Key 2016 financial year changes
10% reduction in all Director and Key Management Personnel base salaries effective 1 March 2016 in recognition of the low nickel price environment. This returns base salary levels to pre‐financial year 2012 equivalents.
Base salaries have been frozen for the 2017 financial year (FY17). There has only been one base salary increase in the last 5 years.
Non‐executive director remuneration frozen at the reduced levels.
Reduction in number of Non‐Executive Directors resulting in a further director fee reduction. The report is comprised of the following key sections:
Section A: Who this report covers
Section B: Remuneration governance and philosophy
Section C: 2015 Annual General Meeting voting
Section D: Use of remuneration consultants
Section E: Executive remuneration framework
Section F: Non‐executive director remuneration
Section G: Service contracts
Section H: Link between performance and remuneration outcomes
Section I: Details of remuneration SECTION A: WHO THIS REPORT COVERS
The following persons acted as directors of the Company during the financial year:
Mr I Macliver Independent Non‐Executive Chairman Mr D Lougher Managing Director Mr D Southam Executive Director Mr R Yeates Independent Non‐Executive Director Mr C Readhead Independent Non‐Executive Director Mr T Netscher Independent Non‐Executive Director Mr J Hanna Non‐Executive Director (Resigned ‐ 15 June 2016)
Other Key Management Personnel (‘KMP’) of the Company during the financial year were:
Mr J Belladonna Chief Financial Officer & Company Secretary Mr W Jones General Manager Operations SECTION B: REMUNERATION GOVERNANCE AND PHILOSOPHY
Remuneration Committee
The Remuneration Committee is responsible for assisting the Board in fulfilling its responsibilities relating to the remuneration of Directors, the Managing Director and KMP, remuneration practices, strategies and disclosures generally.
Remuneration levels and other terms of employment for the Directors and the senior management team are reviewed at least annually by the Remuneration Committee, having regard to performance against goals set each year, qualifications and experience, relevant market conditions and independent remuneration benchmarking reports.
For
per
sona
l use
onl
y

Western Areas Ltd & Controlled Entities ABN 68 091 049 357
Page 12 of 76
The Remuneration Committee assesses the appropriateness of remuneration levels to ensure the Company is able to attract and retain high quality Executives. The Remuneration Committee utilises independent salary reports to assist in this regard.
Remuneration Philosophy
The Company recognises that it operates in a global environment and to prosper in such an environment, it must attract, motivate and retain personnel of the highest calibre.
The principles supporting the Company’s remuneration policy are that:
Reward reflects the competitive global market in which we operate;
Individual reward is based on performance across a range of disciplines that apply to delivering results and executing strategies for the Company;
Executive remuneration is linked to the creation of shareholder value; and
Remuneration arrangements are equitable, fair and facilitate the deployment of senior management across the Company.
SECTION C: 2015 ANNUAL GENERAL MEETING VOTING
Western Areas received 97% “yes” votes for the Remuneration Report resolution at the 2015 Annual General Meeting and remuneration practices have remained consistent with the prior year. The Company did not receive any specific feedback at the AGM or throughout the year on its remuneration practices. However, various advisory groups and associations publish critiques and opinions on a subscription basis. SECTION D: USE OF REMUNERATION CONSULTANTS
Western Areas engaged PwC as Remuneration Consultants during FY16 to provide assistance with documentation management and ongoing market trend monitoring and development in relation to the Long Term Incentive (“LTI”) plan, however no ‘remuneration recommendations’ as defined in the Corporation Act 2001 were made or supplied by PwC. SECTION E: EXECUTIVE REMUNERATION FRAMEWORK
The Company aims to reward Executives with a level and mix of remuneration commensurate with their position, experience and responsibilities within the Company. The objective is to:
Reward Executives for their individual performance against targets set by reference to appropriate benchmarks;
Align the interests of Executives with those of the shareholders; and
Ensure that total remuneration is competitive by market standards.
The Company’s Executive reward structure provides a combination of fixed and variable pay, and is
comprised of:
Fixed remuneration, inclusive of base pay, superannuation, allowances, and salary‐sacrifice components;
Short term incentives; and
Long term incentives.
For
per
sona
l use
onl
y

Western Areas Ltd & Controlled Entities ABN 68 091 049 357
Page 13 of 76
Remuneration mixes
In accordance with the Company’s objective to ensure that executive remuneration is aligned to Company performance, a significant portion of executives’ remuneration is placed “at risk”. The relative proportion of target FY16 total remuneration packages split between fixed and variable remuneration is shown below:
Fixed Remuneration Target STI Target LTI
Executive Directors
Mr D Lougher 39% 22% 39%
Mr D Southam 43% 24% 33%
Executives
Mr J Belladonna 43% 24% 33%
Mr W Jones 53% 21% 26%
Calculation based on 1 July 2015 salary level prior to the 10% salary reduction
The target remuneration mix of higher level KMP has been designed with emphasis on LTI exposure. This further aligns executives with shareholders and a focus on long term value generation. Refer to Section H: Link between performance and remuneration outcomes for details of Executives’ actual remuneration mix for FY16.
In the event of serious misconduct or a material misstatement in the Company's financial statements, the Remuneration Committee can cancel or defer performance based remuneration that has not yet been vested or paid. There is currently no formal claw back of performance based remuneration paid in prior financial years. The Company notes that the STI performance indicators are a blend of physical and financial targets which limits the target reward potentially payable based on financial targets or metrics.
Fixed remuneration
Fixed remuneration consists of base salary, superannuation, allowances, and any salary sacrifice components. The fixed remuneration component is reviewed annually by the Remuneration Committee. Base salary for each Executive is benchmarked against market data for comparable roles in the market and the Remuneration Committee refers to external independent salary reports to ensure that the remuneration levels are set to meet the objectives of the Company while remaining competitive in the wider employment market.
Effective 1 March 2016 a 10% reduction in KMP base salary was implemented during FY16 and no remuneration increases have been awarded for FY17. There is no guaranteed base pay increases included in any Executives’ contracts.
Short term incentive (‘STI’)
The objective of STI’s is to link Executives’ remuneration with the achievement of the Company’s key operational and financial targets. The STI plan provides Executives with an opportunity to earn a cash bonus on achievement of individual and group key performance indicators (‘KPIs’). Challenging KPIs are set to ensure payments are only made to high performing employees.
It is the Company’s policy to cap STI payments at a targeted STI level. The percentage is applied against the relevant Executive’s base salary only and excludes all allowances and superannuation.
The KPIs used span across key focus areas of the business (operations, corporate, resource replenishment and exploration), and the respective KPIs and their weightings will vary by role and are designed to align to those measures relevant to the individual’s area of influence.
The full list of KPIs set for Executives in FY16 is below. For each Executive, KPIs relevant to their area of influence are selected from the list below and assigned each year. Rarely is 100% of target STI achieved, which the Company believes demonstrates the challenging nature of the KPI targets.
For
per
sona
l use
onl
y

Western Areas Ltd & Controlled Entities ABN 68 091 049 357
Page 14 of 76
Overview KPI Why KPI was set
Operations
Forrestania safety performance Based on Lost Time Injury performance in each quarter.
Motivate and reward the continued focus on safety standards and procedures.
Forrestania environmental incidents
Based on a minimum reportable environmental incidents quarter.
Motivate and reward the continued focus on best practice environmental management.
Forrestania unit cash cost
Focused on average unit cash costs for Flying Fox (FF) and Spotted Quoll (SQ) mines per pound of nickel produced. Performance better than budget is required.
Motivate and reward the stringent management of production costs outcomes that exceed the Board set business plan.
Forrestania nickel in ore production
Must exceed the budgeted nickel metal in ore production target from FF and SQ mines.
Motivate and reward nickel production outcomes that exceed Board set business plans.
Forrestania mill recoveries
Achieve a set threshold recovery above budget levels for the combined ore feed from FF and SQ mines.
Motivate and reward nickel production outcomes that exceed Board set business plans.
Forrestania nickel in concentrate sales
Sale of nickel metal in concentrate to exceed a set tonnage target.
Motivate and reward nickel sales outcomes that exceed Board set business plans.
Corporate
Earnings Achieve EBIT target above budget.
Motivate and reward financial outcomes that exceed Board set business plans.
Cashflow Achieve pre‐funding cashflow target above budget.
Motivate and reward financial outcomes that exceed Board set business plans.
Business development
Based on business development activities and project pipeline development that provides opportunities to add value or protect value in the Company and for the shareholders.
Motivate and reward business development initiatives that provide market intelligence and enhance corporate growth opportunity identification.
Mineral Resources and Exploration
Nickel resource Establishing replacement nickel reserves or mining inventory tonnages.
Motivate and reward mine life extension outcomes at Board set levels.
New nickel resources Establishing new published nickel resources exceeding a targeted nickel tonnage levels.
Motivate and reward economic nickel discovery.
New nickel discovery Discovery of a new Nickel deposit.
Motivate and reward economic nickel discovery.
The Remuneration Committee is responsible for determining the STI to be paid based on an assessment of whether the KPIs are met. To assist in this assessment, the Remuneration Committee receives detailed reports on performance which are verified against outcomes.
Based on the achievements of the Company in FY16, the Remuneration Committee determined that Executives achieved between 50% to 65% of their target STI opportunity. It is noted that no employee achieved 100% of their target STI award and no financial based STI payments were triggered or awarded in FY16 due to the lower than budgeted nickel price and its impact on earnings.
For
per
sona
l use
onl
y

Western Areas Ltd & Controlled Entities ABN 68 091 049 357
Page 15 of 76
In making this assessment, the Remuneration Committee considered the following factors:
An exceptional safety performance across the group and a continued lost time injury frequency rate of zero;
The high level of environmental management and no significant environmental incidences;
Mine and concentrator nickel production and sales volume were above the Board set budgeted expectation due to productivity and efficiency gains;
Achievement of specific corporate objectives, recommendations and outcomes related to business development activities; and
Achievement of challenging operating cost parameters.
Performance achieved during the year against the above KPIs has resulted in Executives earning the following STI payments:
Name Target STI quantum (% of base salary)
Target FY16 STI quantum ($)
STI quantum earned ($)
STI quantum Forfeited ($)
Executive Directors
Mr D Lougher 55% $404,000 $204,000 $200,000
Mr D Southam 55% $303,000 $175,000 $128,000
Executives
Mr J Belladonna 55% $204,000 $122,000 $82,000
Mr W Jones 40% $160,000 $100,000 $60,000
Target STI was calculated based on 1 July 2015 base salary prior to the 10% salary reduction
Long Term Incentive (‘LTI’)
The LTI plan was reapproved by shareholders at the 2014 Annual General Meeting and has been in operation since FY12. All grants are measured against a 3 year TSR period such that no vesting occurs until the end of the third year. This ensures executives are focused on long‐term shareholder value generation.
Grant frequency and quantum
Under the remuneration structure, Executives will receive a grant of Performance Rights each year, such that the LTI now forms a key component of Executives’ Total Annual Remuneration.
The LTI dollar value that Executives will be entitled to receive is set at a fixed percentage of their base salary, ranging from 50% to 100%, depending on the participant’s position within the Company. This level of LTI remains in line with current market practice.
The number of Performance Rights to be granted is determined by dividing the LTI dollar value of the award by the fair value of a Performance Right as calculated by an independent valuation expert.
For
per
sona
l use
onl
y

Western Areas Ltd & Controlled Entities ABN 68 091 049 357
Page 16 of 76
The quantum of LTI grants made during FY16 was as follows:
Name
LTI quantum
(% of base salary) (i)
LTI quantum
($)
Number of Performance Rights issued
(ii)
Fair value per Performance Right at grant
date (iii)
Exercise date Expiry date
Executive Directors
Mr D Lougher 100% $734,400 299,750 $2.45 Upon receipt of a vesting notice issued in FY19
30/6/19
Mr D Southam 75% $413,185 168,640 $2.45 As above 30/6/19
Executives
Mr J Belladonna 75% $278,400 113,630 $2.45 As above 30/6/19
Mr W Jones 50% $200,200 81,710 $2.45 As above 30/6/19
(i) of base salary was calculated on salary applicable 1 July 2015. (ii) The number of Performance Rights to be issued to each participant is determined by undertaking an indicative valuation at 1 July of each respective year for allocation and Board ratification purposes rounded to zero. The FY16 valuation at 1 July 2015 was $2.45/right.
(iii) Fair value as required under AASB 2. Valuation is determined at the date of the Annual General Meeting held in each respective year.
Performance conditions
Careful consideration was given to the selection of the performance conditions attached to Performance Rights. Based on market practice and the factors controllable by executives, the Board decided that the most appropriate performance measure to track shareholder outcomes is via a relative total shareholder return (‘TSR’) measure. TSR measures the return received by shareholders from holding shares in a company over a particular period and is calculated by taking into account the change in a company share price over the period as well as the dividends received during that period.
Western Areas TSR performance for the FY16 grant will be assessed against a customised peer group
comprising the following 24 companies:
Aditya Birla Minerals Ltd Cudeco Ltd Mt Gibson Iron Poseidon Nickel Ltd
Aquarius Platinum Ltd Gindalbie Metals Ltd Northern Star Resources Ltd Rex Minerals Ltd
Altona Mining Ltd Hillgrove Resources Ltd OM Holdings Ltd Sandfire Resources Ltd
Alumina Ltd Independence Group NL Oz Minerals Ltd Syrah Resources Ltd
Beadell Resources Ltd Medusa Mining Ltd Paladin Energy Ltd Talisman Resources Ltd
Bouganville Copper Ltd Mincor Resources NL Panoramic Resources Ltd Zimplats Holdings Ltd
No Performance Rights will vest unless the percentile ranking of the Company’s TSR for the relevant performance year, as compared to the TSR’s for the peer group companies, is at or above the 50th percentile.
The following table sets out the vesting outcome based on the Company’s relative TSR performance:
Relative TSR performance Performance Vesting Outcomes
Less than 50th percentile 0% vesting
At the 50th percentile 50% vesting
Between 50th and 75th percentile Pro‐rata / progressive vesting from 50% ‐ 100%
At or above 75th percentile 100% vesting
For
per
sona
l use
onl
y
Western Areas Ltd & Controlled Entities ABN 68 091 049 357
Page 17 of 76
Performance period and vesting
FY16 grants made under the LTI plan will only vest subject to meeting the minimum service period and the relative TSR performance condition tested against the peer group over a 3 year period (1 July 2015 to 30 June 2018).
The FY16 grants service based vesting condition provides that, notwithstanding the passing of the performance test, no Performance Rights will vest and become exercisable into shares unless the participant remains employed as at 30 June 2018.
Share trading policy
The trading of shares issued to participants under any of the Company’s employee equity plans is subject to, and conditional upon, compliance with the Company’s employee share trading policy contained in the Corporate Code of Conduct. Executives are prohibited from entering into any hedging arrangements over unvested performance rights under the LTI plan. The Company would consider a breach of this policy as gross misconduct which may lead to disciplinary action and potentially dismissal. SECTION F: NON‐EXECUTIVE DIRECTOR REMUNERATION
Non‐Executive Director remuneration policy and structure
The Board seeks to set aggregate remuneration at a level which provides the Company with the ability to attract and retain Directors of the highest calibre whilst incurring a cost that is acceptable to shareholders.
The aggregate remuneration of Non‐Executive Directors (‘NEDs’) is determined from time to time by shareholders in a General Meeting. An amount not exceeding the approved amount is then divided between the Directors as determined by the Remuneration Committee.
The amount of aggregate remuneration sought to be approved by shareholders and the manner in which it is apportioned amongst Directors is reviewed annually. The Board and the Remuneration Committee considers independent salary reports as well as the fees paid to NEDs of comparable companies when undertaking this annual review.
It is an objective of the Company to encourage Directors to own shares in Western Areas. However share based payments in the form of options or equity in the Company are not offered to NEDs as encouraged by Corporate Governance guidelines.
There is no scheme to provide retirement benefits to NEDs, other than statutory superannuation.
Non‐Executive Director fees limits
NED fees are determined within an aggregated fee limit of $1,000,000, which was approved by shareholders at the 2012 AGM. The following fees (including statutory superannuation) were applicable for the year:
Fees Fin. Year Board Chair Board Member
Actual 2016 $186,855 $161,570
NED’s agreed to a 10% reduction in Directors fees, effective from 1 March 2016.
Non‐Executive Directors fee structure
NED remuneration consists of a base Directors fee for their role as Board members, and is inclusive of compensation for any role on nominated Board sub‐committees. That is, no separate committee fees are payable. NEDs do not receive any performance‐based pay.
For
per
sona
l use
onl
y
Western Areas Ltd & Controlled Entities ABN 68 091 049 357
Page 18 of 76
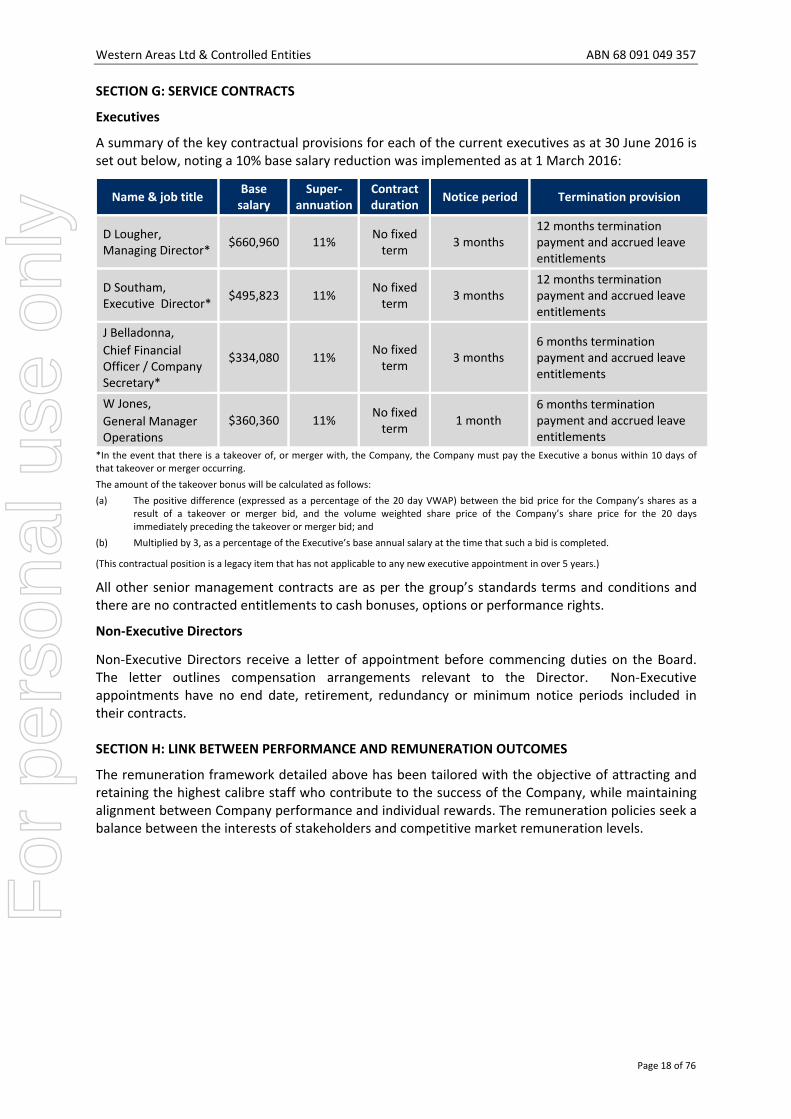
SECTION G: SERVICE CONTRACTS
Executives
A summary of the key contractual provisions for each of the current executives as at 30 June 2016 is set out below, noting a 10% base salary reduction was implemented as at 1 March 2016:
Name & job title Base salary
Super‐annuation
Contract duration
Notice period Termination provision
D Lougher, Managing Director*
$660,960 11% No fixed term
3 months 12 months termination payment and accrued leave entitlements
D Southam, Executive Director*
$495,823 11% No fixed term
3 months 12 months termination payment and accrued leave entitlements
J Belladonna,
Chief Financial Officer / Company Secretary*
$334,080 11% No fixed term
3 months 6 months termination payment and accrued leave entitlements
W Jones,
General Manager Operations
$360,360 11% No fixed term
1 month 6 months termination payment and accrued leave entitlements
*In the event that there is a takeover of, or merger with, the Company, the Company must pay the Executive a bonus within 10 days of that takeover or merger occurring.
The amount of the takeover bonus will be calculated as follows:
(a) The positive difference (expressed as a percentage of the 20 day VWAP) between the bid price for the Company’s shares as a result of a takeover or merger bid, and the volume weighted share price of the Company’s share price for the 20 days immediately preceding the takeover or merger bid; and
(b) Multiplied by 3, as a percentage of the Executive’s base annual salary at the time that such a bid is completed.
(This contractual position is a legacy item that has not applicable to any new executive appointment in over 5 years.)
All other senior management contracts are as per the group’s standards terms and conditions and there are no contracted entitlements to cash bonuses, options or performance rights.
Non‐Executive Directors
Non‐Executive Directors receive a letter of appointment before commencing duties on the Board. The letter outlines compensation arrangements relevant to the Director. Non‐Executive appointments have no end date, retirement, redundancy or minimum notice periods included in their contracts. SECTION H: LINK BETWEEN PERFORMANCE AND REMUNERATION OUTCOMES
The remuneration framework detailed above has been tailored with the objective of attracting and retaining the highest calibre staff who contribute to the success of the Company, while maintaining alignment between Company performance and individual rewards. The remuneration policies seek a balance between the interests of stakeholders and competitive market remuneration levels.
For
per
sona
l use
onl
y
Western Areas Ltd & Controlled Entities ABN 68 091 049 357
Page 19 of 76
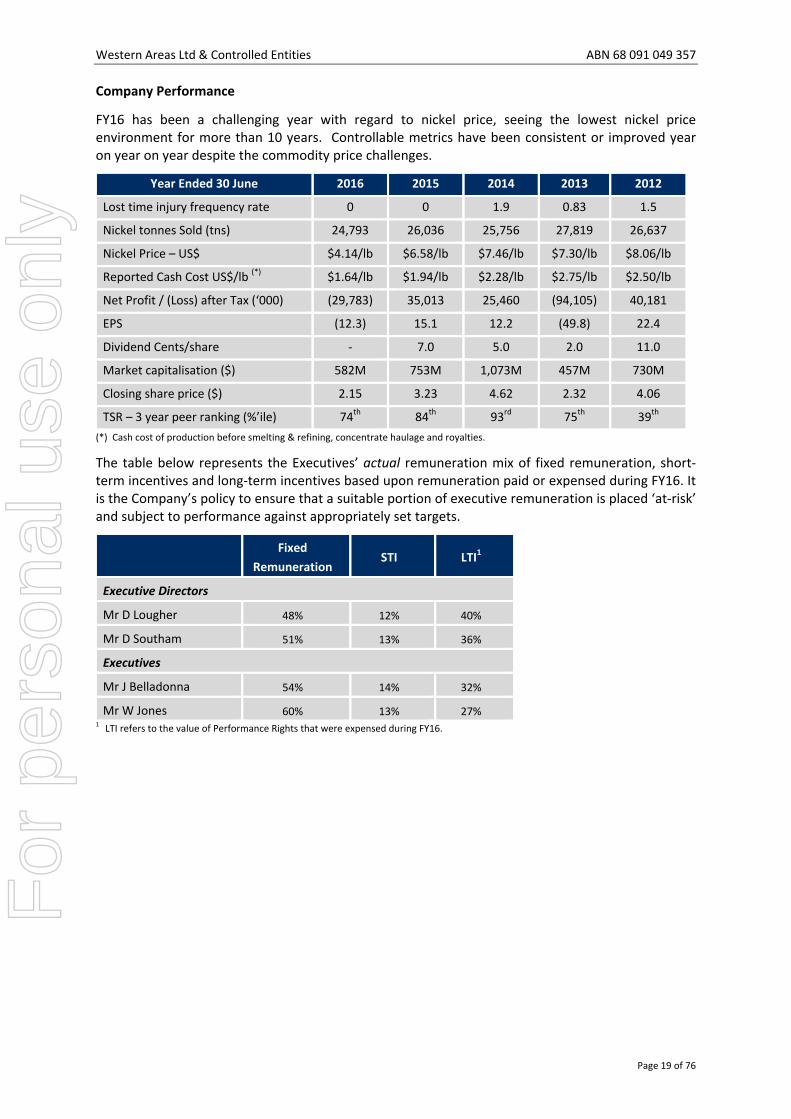
Company Performance
FY16 has been a challenging year with regard to nickel price, seeing the lowest nickel price environment for more than 10 years. Controllable metrics have been consistent or improved year on year on year despite the commodity price challenges.
Year Ended 30 June 2016 2015 2014 2013 2012
Lost time injury frequency rate 0 0 1.9 0.83 1.5
Nickel tonnes Sold (tns) 24,793 26,036 25,756 27,819 26,637
Nickel Price – US$ $4.14/lb $6.58/lb $7.46/lb $7.30/lb $8.06/lb
Reported Cash Cost US$/lb (*) $1.64/lb $1.94/lb $2.28/lb $2.75/lb $2.50/lb
Net Profit / (Loss) after Tax (‘000) (29,783) 35,013 25,460 (94,105) 40,181
EPS (12.3) 15.1 12.2 (49.8) 22.4
Dividend Cents/share ‐ 7.0 5.0 2.0 11.0
Market capitalisation ($) 582M 753M 1,073M 457M 730M
Closing share price ($) 2.15 3.23 4.62 2.32 4.06
TSR – 3 year peer ranking (%’ile) 74th 84th 93rd 75th 39th
(*) Cash cost of production before smelting & refining, concentrate haulage and royalties.
The table below represents the Executives’ actual remuneration mix of fixed remuneration, short‐term incentives and long‐term incentives based upon remuneration paid or expensed during FY16. It is the Company’s policy to ensure that a suitable portion of executive remuneration is placed ‘at‐risk’ and subject to performance against appropriately set targets.
Fixed
Remuneration STI LTI1
Executive Directors
Mr D Lougher 48% 12% 40%
Mr D Southam 51% 13% 36%
Executives
Mr J Belladonna 54% 14% 32%
Mr W Jones 60% 13% 27% 1 LTI refers to the value of Performance Rights that were expensed during FY16.
For
per
sona
l use
onl
y

Western Areas Ltd & Controlled Entities ABN 68 091 049 357
Page 20 of 76
SECTION I: DETAILS OF REMUNERATION
Short Term Employee Benefits Post
Employment
Long Term Employee Benefits
(accounting valuation)
TOTAL
Base
Salary
STI
Payments
/ Bonuses
(ii)
AllowancesNon
Monetary
Super‐
annuation
Long
Service
Leave
Share
Based
Payments
LTI (i)
Non‐executive Directors
I Macliver 167,952 18,475 186,427
FY2015 173,743 ‐ ‐ ‐ 19,112 ‐ ‐ 192,855
C Readhead 145,559 16,011 161,570
FY2015 167,142 ‐ ‐ ‐ ‐ ‐ ‐ 167,142
T Netscher 161,570 ‐ 161,570
FY2015 153,213 ‐ ‐ ‐ ‐ ‐ ‐ 153,213
R Yeates 145,559 16,011 161,570
FY2015 150,578 ‐ ‐ ‐ 16,564 ‐ ‐ 167,142
J Hanna (iv) 139,912 15,390 155,302
FY2015 150,578 ‐ ‐ ‐ 16,564 ‐ ‐ 167,142
R Dunbar ‐ ‐ ‐ ‐ ‐ ‐ ‐ ‐
FY2015 83,570 ‐ ‐ ‐ ‐ ‐ ‐ 83,570
Executive Directors
D Lougher (iii) 753,009 204,000 4,000 51,785 35,000 16,512 705,741 1,770,047
FY2015 780,180 341,000 4,000 48,262 35,000 12,203 562,311 1,782,956
D Southam 561,130 175,000 4,000 51,013 27,500 12,386 459,291 1,290,320
FY2015 581,514 275,000 4,000 51,032 30,000 9,154 292,709 1,243,409
Executive Officers
J Belladonna 368,298 122,000 4,000 42,107 30,000 8,346 274,613 849,364
FY2015 382,032 187,000 4,000 50,595 30,000 6,168 202,406 862,201
W Jones 394,630 100,000 1,900 35,302 35,000 9,002 218,392 794,226
FY2015 409,444 157,000 1,900 38,408 35,000 6,653 145,948 794,353
Total FY2016 5,530,396
Total FY2015 5,613,983
(i) LTI refers to the value of Performance Rights that were expensed during the FY16. No Options were granted or remain outstanding at the end of the financial year.
(ii) Includes all paid and/or accrued bonuses for the applicable year.
(iii) Mr Lougher received a payment in lieu of annual leave in October 2015 to the value of $67,932, this was for the purpose of reducing the balance sheet liability for accrued leave and did not affect the Income Statement.
(iv) Mr Hanna resigned from the Board on 15 June 2016.
For
per
sona
l use
onl
y

Western Areas Ltd & Controlled Entities ABN 68 091 049 357
Page 21 of 76
Related Party Transactions
There were no related party transactions with KMP during FY16. However, Mr Craig Readhead was a partner of Allion Legal until 30 June 2015. Allion is a law firm that the Company engages from time to time for the provision of legal services and advice in relation to operational matters. Fees paid to Allion during FY16 totalled $47,124 (FY15 ‐ $121,080). Mr Readhead provided some services as a consultant to Allion during the financial year, none of which involved any matters related to Western Areas. Mr Readhead ceased consulting to Allion by the end of FY16 and has no ongoing relationship with Allion. Western Areas uses global law firm Ashurst for all corporate, capital raising or substantial legal matters. Ashurst is by far the dominant supplier of legal services to the Company.
Shareholding by Key Management Personnel
The number of shares held by KMP (and their related parties) in the Group during the financial year is as follows:
Balance at
1 July 2015
Granted as
Remuneration
On Vesting of
Performance
Rights
Other Changes
During the Year
Balance at
30 June 2016
I Macliver 28,948 ‐ ‐ 7,500 36,448
D Lougher 126,378 ‐ 294,800 (175,000) 246,178
D Southam 36,735 ‐ 165,900 (74,500) 128,135
J Hanna (i) 600,091 ‐ (200,000) 400,091
R Yeates 10,000 ‐ ‐ ‐ 10,000
T Netscher ‐ ‐ ‐ 7,000 7,000
J Belladonna 70,000 ‐ 104,074 7,500 181,574
W Jones ‐ ‐ 83,476 ‐ 83,476
TOTAL 872,152 ‐ 648,250 (427,500) 1,092,902
(i) Shareholding of Mr Hanna as at 15 June 2016.
Options held by Key Management Personnel
There were no options held by key management at any time during FY16.
Performance Rights held by Key Management Personnel
Details of Performance Rights held by KMP and granted but not yet vested under the LTI plan at 30 June 2016 are outlined below:
Balance at 1 July 2015
Number granted as
Remuneration
Number vested
Number expired / Other(*)
Balance at 30 June 2016
Portion vested (%)
Portion unvested
(%)
D Lougher 965,690 299,750 (294,800) ‐ 970,640 ‐ 100%
D Southam 448,990 168,640 (165,900) 94,363 546,093 ‐ 100%
J Belladonna 346,223 113,630 (104,074) ‐ 355,779 ‐ 100%
W Jones 271,247 81,710 (83,476) ‐ 269,481 ‐ 100%
TOTAL 2,032,150 663,730 (648,250) 94,363 2,141,993 ‐ 100%
(*) Rights granted related to prior financial years that were approved at the 2015 Annual General Meeting.
All Performance Rights issued during FY16 were allotted in accordance with the shareholder approved Western Areas LTI plan. The rights were granted on 27 November 2015 and have a zero exercise price. No Performance Rights will vest unless they meet a relative TSR measure for the period 1 July 2015 to 30 June 2018 as measured against the peer group and satisfaction of the service based vesting condition which requires the participant remains employed as at 30 June 2018. Upon satisfaction of the performance and service condition, the Performance Rights will vest upon receipt of a vesting notice during the 2019 financial year.
End of audited Remuneration Report.
For
per
sona
l use
onl
y

Western Areas Ltd & Controlled Entities ABN 68 091 049 357
Page 22 of 76
Significant Changes in the State of Affairs
No significant changes in the consolidated group’s state of affairs occurred during the financial year.
Future Developments
Disclosure of information regarding likely developments in the operations of the consolidated entity in future financial years and the expected results of those operations is likely to result in unreasonable prejudice to the consolidated entity. Accordingly, this information has not been disclosed in this report.
Environmental Regulation and Performance
The Consolidated Entity has conducted exploration and development activities on mineral tenements. The right to conduct these activities is granted subject to State and Federal environmental legislation and regulations, tenement conditions and Mining Proposal commitments. The Consolidated Entity aims to ensure that a high standard of environmental management is achieved and, as a minimum, to comply with all relevant legislation and regulations, tenement conditions and Mining Proposal commitments. The Company has achieved a high level of compliance with all environmental conditions set for its projects and actively strives for continual improvement.
Auditor's Independence Declaration
The Auditor's Independence Declaration to the Directors of Western Areas Ltd on page 23 forms part of the Directors’ Report for the year ended 30 June 2016.
Non – Audit Services
The entity’s auditor, Crowe Horwath, provided non‐audit services, related to renewable energy lodgements, amounting to $4,500 during FY16 (FY15: $13,750). The Board has the following procedures in place before any non‐audit services are obtained from the auditors:
all non audit services are reviewed and approved by the Board and the Audit & Risk Management Committee prior to commencement to ensure they do not adversely affect the integrity and objectivity of the auditor; and
the nature of the services provided does not compromise the general principles relating to auditor independence as set out in APES 110: Code of Ethics for Professional Accountants set by the Accounting Professional and Ethical Standards Board.
Rounding of Amounts
The Company is a company of the kind referred to in ASIC Class Order 98/100, dated 10 July 1998, and in accordance with that Class Order amounts in the directors’ report and the financial statements are rounded off to the nearest thousand dollars, unless otherwise indicated.
Signed in accordance with a resolution of the Board of Directors.
D Lougher
Managing Director
Perth, 25 August 2016
For
per
sona
l use
onl
y

Western Areas Ltd & Controlled Entities ABN 68 091 049 357
Page 23 of 76
AUDITOR’S INDEPENDENCE DECLARATION
For
per
sona
l use
onl
y

Western Areas Ltd & Controlled Entities ABN 68 091 049 357
Page 24 of 76
CONSOLIDATED INCOME STATEMENT
Year ended 30 June 2016
Notes
Consolidated Entity
2016
$’000
2015
$’000
Sales 209,117 312,680
Cost of sales (214,762) (236,474)
Other income 2 2,670 5,517
Profit on deconsolidation 875 ‐
Finance costs 4 (2,546) (15,472)
Employee benefit expense (9,569) (9,967)
Foreign exchange gain/(loss) 670 (1,468)
Write off of non‐current assets 6,11,12 (7,820) ‐
Share based payments 30 (2,507) (1,569)
Impairment losses 11 (6,963) (247)
Realised derivative gain 4 ‐ 2,181
Changes in fair value of derivatives 4 ‐ 231
Administration expenses (6,231) (6,642)
Care and maintenance expense (592) ‐
Share of loss of associates accounted for using the equity
method 8 (140) ‐
Expense related to deconsolidated entity (747) (704)
(Loss)/profit before income tax (38,545) 48,066
Income tax benefit/(expense) 7 8,762 (13,053)
(Loss)/profit for the year (29,783) 35,013
(Loss)/profit attributable to:
Members of the parent entity (26,700) 35,761
Non controlling interest (3,083) (748)
(29,783) 35,013
Basic (loss)/earnings per share (cents per share) 19 (12.3) 15.1
Diluted (loss)/earnings per share (cents per share) 19 (12.3) 14.9
The accompanying notes form part of these financial statements.For
per
sona
l use
onl
y

Western Areas Ltd & Controlled Entities ABN 68 091 049 357
Page 25 of 76
CONSOLIDATED STATEMENT OF COMPREHENSIVE INCOME
Year Ended 30 June 2016
Notes
Consolidated Entity
2016
$’000
2015
$’000
(Loss)/profit for the year (29,783) 35,013
Other comprehensive (loss)/income, net of tax
Items that may be reclassified to profit or loss
Changes in fair value of hedging instruments 394 281
Changes in financial assets at fair value through other
comprehensive income 327 (426)
Exchange differences on translation of foreign controlled
entities (1,191) 1,114
Total comprehensive (loss)/income for the year (30,253) 35,982
Total Comprehensive (loss)/income attributable to:
Members of the parent entity (27,170) 36,730
Non controlling interest (3,083) (748)
(30,253) 35,982
The accompany notes form part of these financial statements.
For
per
sona
l use
onl
y

Western Areas Ltd & Controlled Entities ABN 68 091 049 357
Page 26 of 76
CONSOLIDATED STATEMENT OF FINANCIAL POSITION As At 30 June 2016
Notes
Consolidated Entity
2016
$’000
2015
$’000
Current Assets
Cash and cash equivalents 20 (b) 75,706 195,355
Trade and other receivables 5 29,275 15,974
Inventories 6 14,761 23,407
Derivative financial instruments 17 171 ‐
Total Current Assets 119,913 234,736
Non Current Assets
Property, plant and equipment 9,10 96,365 99,981
Intangible assets 506 506
Exploration & evaluation expenditure 10,11 80,360 60,979
Mine properties 12 183,579 200,453
Financial assets at fair value through other comprehensive income 1,281 954
Investments accounted for using the equity method 8 7,164 ‐
Total Non Current Assets 369,255 362,873
Total Assets 489,168 597,609
Current Liabilities
Trade and other payables 14 22,723 29,364
Borrowings 15 196 126,786
Provisions 16 3,363 2,457
Current tax liabilities ‐ 9,795
Derivative financial instruments 17 ‐ 224
Total Current Liabilities 26,282 168,626
Non Current Liabilities
Borrowings 15 123 210
Provisions 10,16 22,649 13,523
Deferred tax liabilities 13 6,113 14,135
Total Non Current Liabilities 28,885 27,868
Total Liabilities 55,167 196,494
Net Assets 434,001 401,115
Equity
Contributed equity 18 442,963 369,936
Other reserves 31 15,403 32,757
Retained earnings (24,365) (7,473)
Equity attributable to members of the parent entity 434,001 395,220
Non controlling interest ‐ 5,895
Total Equity 434,001 401,115
The accompany notes form part of these financial statements.
For
per
sona
l use
onl
y
Western Areas Ltd & Controlled Entities ABN 68 091 049 357
Page 27 of 76
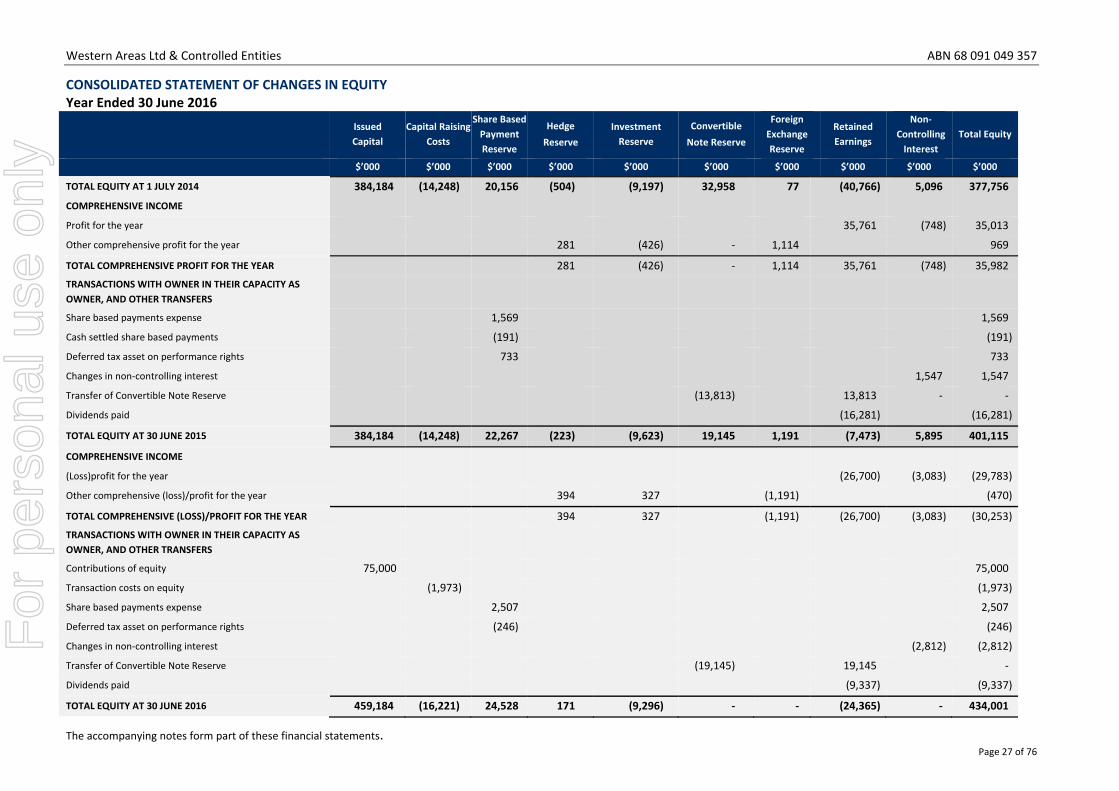
CONSOLIDATED STATEMENT OF CHANGES IN EQUITY Year Ended 30 June 2016
Issued
Capital
Capital Raising
Costs
Share Based
Payment
Reserve
Hedge
Reserve
Investment
Reserve
Convertible
Note Reserve
Foreign
Exchange
Reserve
Retained
Earnings
Non‐
Controlling
Interest
Total Equity
$’000 $’000 $’000 $’000 $’000 $’000 $’000 $’000 $’000 $’000
TOTAL EQUITY AT 1 JULY 2014 384,184 (14,248) 20,156 (504) (9,197) 32,958 77 (40,766) 5,096 377,756
COMPREHENSIVE INCOME
Profit for the year 35,761 (748) 35,013
Other comprehensive profit for the year 281 (426) ‐ 1,114 969
TOTAL COMPREHENSIVE PROFIT FOR THE YEAR 281 (426) ‐ 1,114 35,761 (748) 35,982
TRANSACTIONS WITH OWNER IN THEIR CAPACITY AS
OWNER, AND OTHER TRANSFERS
Share based payments expense 1,569 1,569
Cash settled share based payments (191) (191)
Deferred tax asset on performance rights 733 733
Changes in non‐controlling interest 1,547 1,547
Transfer of Convertible Note Reserve (13,813) 13,813 ‐ ‐
Dividends paid (16,281) (16,281)
TOTAL EQUITY AT 30 JUNE 2015 384,184 (14,248) 22,267 (223) (9,623) 19,145 1,191 (7,473) 5,895 401,115
COMPREHENSIVE INCOME
(Loss)profit for the year (26,700) (3,083) (29,783)
Other comprehensive (loss)/profit for the year 394 327 (1,191) (470)
TOTAL COMPREHENSIVE (LOSS)/PROFIT FOR THE YEAR 394 327 (1,191) (26,700) (3,083) (30,253)
TRANSACTIONS WITH OWNER IN THEIR CAPACITY AS
OWNER, AND OTHER TRANSFERS
Contributions of equity 75,000 75,000
Transaction costs on equity (1,973) (1,973)
Share based payments expense 2,507 2,507
Deferred tax asset on performance rights (246) (246)
Changes in non‐controlling interest (2,812) (2,812)
Transfer of Convertible Note Reserve (19,145) 19,145 ‐
Dividends paid (9,337) (9,337)
TOTAL EQUITY AT 30 JUNE 2016 459,184 (16,221) 24,528 171 (9,296) ‐ ‐ (24,365) ‐ 434,001
The accompanying notes form part of these financial statements.
For
per
sona
l use
onl
y

Western Areas Ltd & Controlled Entities ABN 68 091 049 357
Page 28 of 76
CONSOLIDATED STATEMENT OF CASH FLOWS
Year Ended 30 June 2016
Notes
Consolidated Entity
2016
$’000
2015
$’000
Cash flows from operating activities
Receipts from customers 198,117 331,073
Payments to suppliers and employees (154,482) (154,039)
Interest received 778 5,109
Royalties paid (12,938) (15,951)
Other receipts 396 768
Interest paid (4,289) (11,113)
Realisation on settlement of derivatives 728 1,828
Income tax paid (12,747) (9,206)
Net cash inflow from operating activities 20(a) 15,563 148,469
Cash flows from investing activities
Payments for property, plant and equipment (8,603) (13,610)
Proceeds from insurance refund of property, plant & equipment 1,584 (40)
Mine development expenditure (27,615) (42,403)
Exploration & evaluation expenditure (13,592) (15,723)
Purchase of Cosmos Nickel Complex (24,158) ‐
Purchase of financial assets at fair value through other
comprehensive income ‐ (117)
Net cash outflow from investing activities (72,384) (71,893)
Cash flows from financing activities
Repayment of borrowings (125,000) (95,198)
Proceeds from issues of shares 75,000 ‐
Share issue transaction costs (1,973) ‐
Finance lease payments (262) (268)
Borrowing costs (1,256) (11)
Dividends paid to company’s shareholders (9,337) (16,281)
Net cash outflow from financing activities (62,828) (111,758)
Net decrease in cash and cash equivalents held (119,649) (35,182)
Cash and cash equivalents as at the beginning of the financial year 195,355 230,537
Cash and cash equivalents at end of financial year 75,706 195,355
The accompanying notes form part of these financial statements.
For
per
sona
l use
onl
y

Western Areas Ltd & Controlled Entities ABN 68 091 049 357
Page 29 of 76
NOTES TO THE FINANCIAL STATEMENTS
For The Year Ended 30 June 2016
Note 1: Statement of Significant Accounting Policies
These consolidated financial statements and notes represent those of Western Areas Ltd and
Controlled Entities (the “consolidated group” or “group”).
The separate financial statements of the parent entity, Western Areas Ltd, have not been presented
within this financial report as permitted by amendments made to Corporation Act 2001 effective as
at 28 June 2010.
The group is a for profit entity for financial reporting purposes under Australian Accounting
Standards.
The Financial Report was approved by the Board of Directors on 25 August 2016.
Basis of Preparation
These general purpose financial statements have been prepared in accordance with Australian
Accounting Standards, Australian Accounting Interpretations, other authoritative pronouncements
of the Australian Accounting Standards Board (AASB) and the Corporations Act 2001.
Australian Accounting Standards set out accounting policies that the AASB has concluded would
result in a financial report containing relevant and reliable information about transactions, events
and conditions. Compliance with Australian Accounting Standards ensures that the financial
statements and notes also comply with International Financial Reporting Standards. Material
accounting policies adopted in the preparation of this financial report are presented below and have
been consistently applied unless stated otherwise.
Except for cash flow information, the financial statements have been prepared on an accruals basis
and are based on historical costs, modified, where applicable, by the measurement at fair value of
selected non‐current assets, financial assets and financial liabilities.
Adoption of new and revised Accounting Standards
The consolidated entity has adopted all of the new, revised or amending Accounting Standards and
Interpretations issued by the Australian Accounting Standards Board (‘AASB’) that are mandatory for
the current reporting period.
The adoption of these Accounting Standards and Interpretations did not have any significant impact
on the financial performance or position of the consolidated entity.
(a) Principles of Consolidation
The consolidated financial statements incorporate the assets and liabilities of all subsidiaries of
Western Areas Limited (‘company’ or ‘parent entity’) as at 30 June 2016 and the results of all
subsidiaries for the year then ended. Western Areas Limited and its subsidiaries together are
referred to in these financial statements as the ‘consolidated entity’.
Subsidiaries are all those entities over which the consolidated entity has control. The consolidated entity controls an entity when the consolidated entity is exposed to, or has rights to, variable returns from its involvement with the entity and has the ability to affect those returns through its power to direct the activities of the entity. Subsidiaries are fully consolidated from the date on which control is transferred to the consolidated entity. They are de‐consolidated from the date that control ceases.
For
per
sona
l use
onl
y

Western Areas Ltd & Controlled Entities ABN 68 091 049 357
Page 30 of 76
Note 1: Statement of Significant Accounting Policies
(a) Principles of Consolidation (continued...)
Intercompany transactions, balances and unrealised gains on transactions between entities in the consolidated entity are eliminated. Unrealised losses are also eliminated unless the transaction provides evidence of the impairment of the asset transferred. Accounting policies of subsidiaries have been changed where necessary to ensure consistency with the policies adopted by the consolidated entity.
The acquisition of subsidiaries is accounted for using the acquisition method of accounting. A change in ownership interest, without the loss of control, is accounted for as an equity transaction, where the difference between the consideration transferred and the book value of the share of the non‐controlling interest acquired is recognised directly in equity attributable to the parent.
Non‐controlling interest in the results and equity of subsidiaries are shown separately in the income statement and statement of comprehensive income, statement of financial position and statement of changes in equity of the consolidated entity. Losses incurred by the consolidated entity are attributed to the non‐controlling interest in full, even if that results in a deficit balance.
Where the consolidated entity loses control over a subsidiary, it derecognises the assets including goodwill, liabilities and non‐controlling interest in the subsidiary together with any cumulative translation differences recognised in equity. The consolidated entity recognises the fair value of the consideration received and the fair value of any investment retained together with any gain or loss in profit or loss.
(b) Segment reporting
Operating segments are reported in a manner consistent with the internal reporting provided to the
chief operating decision maker. The chief operating decision maker, who is responsible for
allocating resources and assessing performance of the operating segments, has been identified as
the board of directors.
(c) Foreign Currency Transactions and Balances
The financial statements are presented in Australian dollars, which is Western Areas Limited's
functional and presentation currency.
Foreign currency transactions
Foreign currency transactions are translated into Australian dollars using the exchange rates
prevailing at the dates of the transactions. Foreign exchange gains and losses resulting from the
settlement of such transactions and from the translation at financial year‐end exchange rates of
monetary assets and liabilities denominated in foreign currencies are recognised in profit or loss.
Foreign operations
The assets and liabilities of foreign operations are translated into Australian dollars using the
exchange rates at the reporting date. The revenues and expenses of foreign operations are
translated into Australian dollars using the average exchange rates, which approximate the rates at
the dates of the transactions, for the period. All resulting foreign exchange differences are
recognised in other comprehensive income through the foreign currency reserve in equity.
The foreign currency reserve is recognised in profit or loss when the foreign operation or net
investment is disposed of.
For
per
sona
l use
onl
y

Western Areas Ltd & Controlled Entities ABN 68 091 049 357
Page 31 of 76
Note 1: Statement of Significant Accounting Policies
(d) Revenue recognition
Revenue is recognised when it is probable that the economic benefit will flow to the consolidated
entity and the revenue can be reliably measured. Revenue is measured at the fair value of the
consideration received or receivable.
Sale of Goods
Revenue from the sale of nickel is recognised when the risks and rewards of the products pass to the
buyer, currently being the point at which the product is delivered on site to the buyer or passes the
ships’ rail or as otherwise agreed between Western Areas and the buyer. Revenue is recognised at
estimated sales value. The estimated sales value is determined by reference to the estimated metal
content, metal recovery, the metal price and exchange rate. An adjustment is made to reflect the
final sales value when the actual metal content and metal recovery has been determined. The final
metal content and metal recovery is generally known between 30 and 90 days after delivery to the
customer.
Interest
Interest revenue is recognised on a proportional basis taking into account the interest rates
applicable to the financial assets.
All revenue is stated net of the amount of goods and services tax (GST).
Other revenue
Other revenue is recognised when it is received or when the right to receive payment is established.
(e) Finance Costs
Finance costs attributable to qualifying assets are capitalised as part of the asset. All other finance
costs are expensed in the period in which they are incurred.
(f) Inventories
Inventories are measured at the lower of cost and net realisable value. Costs, including an
appropriate portion of fixed and variable overhead expenses, are assigned to inventories on hand by
the method most appropriate to each class of inventory with the majority being valued on an
average cost basis. Net realisable value represents the estimated selling price less all estimated
costs of completion and costs to be incurred in marketing, selling and distribution.
The cost of mining stocks includes direct materials, direct labour, transportation costs and variable
and fixed overhead costs relating to mining activities.
The cost of consumables and spare parts includes cost of materials and transportation costs.
(g) Property, Plant and Equipment
Each class of property, plant and equipment is carried at cost as indicated less, where applicable,
any accumulated depreciation and impairment losses.
Property
Land and buildings are carried at cost, less accumulated depreciation for buildings.
For
per
sona
l use
onl
y
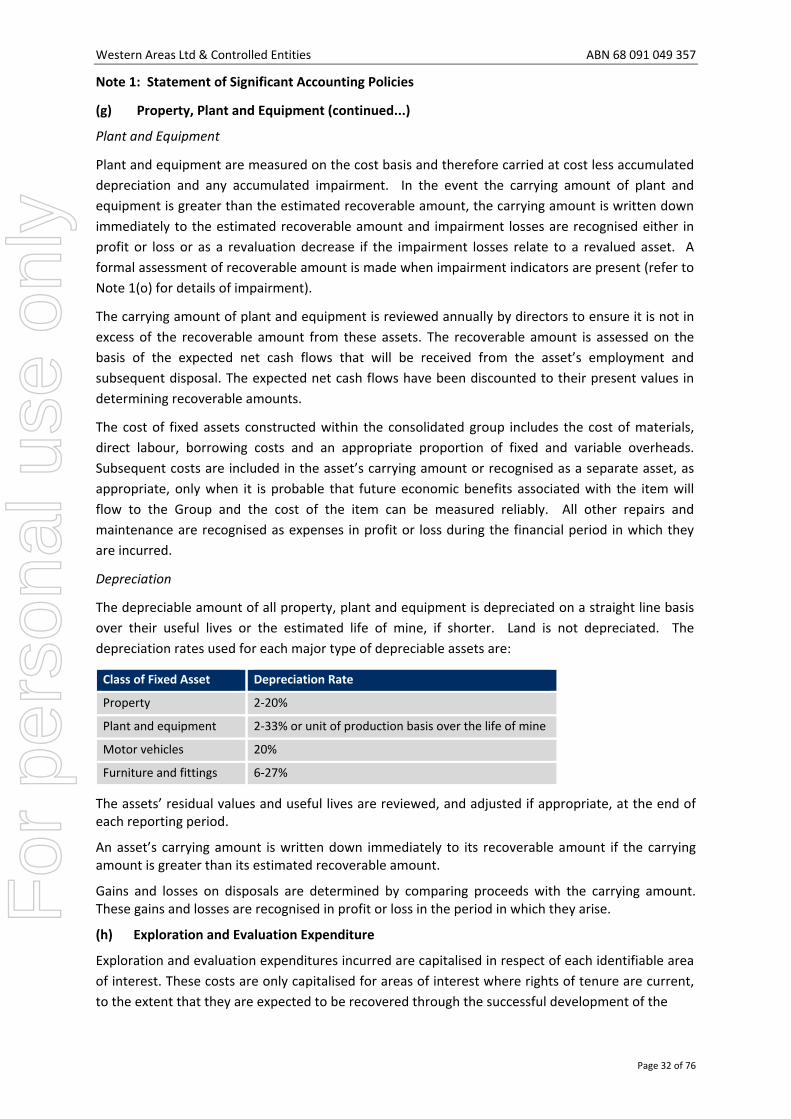
Western Areas Ltd & Controlled Entities ABN 68 091 049 357
Page 32 of 76
Note 1: Statement of Significant Accounting Policies
(g) Property, Plant and Equipment (continued...)
Plant and Equipment
Plant and equipment are measured on the cost basis and therefore carried at cost less accumulated
depreciation and any accumulated impairment. In the event the carrying amount of plant and
equipment is greater than the estimated recoverable amount, the carrying amount is written down
immediately to the estimated recoverable amount and impairment losses are recognised either in
profit or loss or as a revaluation decrease if the impairment losses relate to a revalued asset. A
formal assessment of recoverable amount is made when impairment indicators are present (refer to
Note 1(o) for details of impairment).
The carrying amount of plant and equipment is reviewed annually by directors to ensure it is not in
excess of the recoverable amount from these assets. The recoverable amount is assessed on the
basis of the expected net cash flows that will be received from the asset’s employment and
subsequent disposal. The expected net cash flows have been discounted to their present values in
determining recoverable amounts.
The cost of fixed assets constructed within the consolidated group includes the cost of materials,
direct labour, borrowing costs and an appropriate proportion of fixed and variable overheads.
Subsequent costs are included in the asset’s carrying amount or recognised as a separate asset, as
appropriate, only when it is probable that future economic benefits associated with the item will
flow to the Group and the cost of the item can be measured reliably. All other repairs and
maintenance are recognised as expenses in profit or loss during the financial period in which they
are incurred.
Depreciation
The depreciable amount of all property, plant and equipment is depreciated on a straight line basis
over their useful lives or the estimated life of mine, if shorter. Land is not depreciated. The
depreciation rates used for each major type of depreciable assets are:
Class of Fixed Asset Depreciation Rate
Property 2‐20%
Plant and equipment 2‐33% or unit of production basis over the life of mine
Motor vehicles 20%
Furniture and fittings 6‐27%
The assets’ residual values and useful lives are reviewed, and adjusted if appropriate, at the end of each reporting period.
An asset’s carrying amount is written down immediately to its recoverable amount if the carrying amount is greater than its estimated recoverable amount.
Gains and losses on disposals are determined by comparing proceeds with the carrying amount. These gains and losses are recognised in profit or loss in the period in which they arise.
(h) Exploration and Evaluation Expenditure
Exploration and evaluation expenditures incurred are capitalised in respect of each identifiable area
of interest. These costs are only capitalised for areas of interest where rights of tenure are current,
to the extent that they are expected to be recovered through the successful development of the
For
per
sona
l use
onl
y

Western Areas Ltd & Controlled Entities ABN 68 091 049 357
Page 33 of 76
Note 1: Statement of Significant Accounting Policies
(h) Exploration and Evaluation Expenditure (continued...)
area or where activities in the area have not yet reached a stage that permits reasonable
assessment of the existence of economically recoverable reserves and active and significant
operation in relation to the area of interest are continuing.
Accumulated costs in relation to an abandoned area are written off in full against profit or loss in the
year in which the decision to abandon the area is made.
When production commences, the accumulated costs for the relevant area of interest are amortised
over the life of the area according to the rate of depletion of the economically recoverable reserves.
A regular review is undertaken of each area of interest to determine the appropriateness of
continuing to carry forward costs in relation to that area of interest. Where it is determined that
uncertainty exists as to the ability to recoup carry forward exploration, evaluation and development
costs an impairment loss will be raised against the asset and charged against profit in the year that
determination is made.
(i) Mine Properties
Development expenditure incurred by or on behalf of the consolidated entity is accumulated
separately for each area of interest in which economically recoverable resources have been
identified. Such expenditure comprises costs directly attributable to the construction of a mine, the
related infrastructure and expenditure transferred from the capitalised exploration and evaluation
expenditure phase.
Amortisation is charged using the units‐of production method, with separate calculations being
made for each area of interest. The units‐of‐production basis results in a amortisation charge
proportional to the depletion of proved and probable reserves.
Mine properties are tested for impairment in accordance with the policy in note 1 (o).
Costs of site restoration are provided for over the life of the facility from when exploration
commences and are included in the costs from that stage. Site restoration costs include obligations
relating to dismantling and removing mining plant, reclamation, waste dump rehabilitation and
other costs associated with restoration and rehabilitation of the site. Such costs have been
determined using estimates for current costs and current legal requirements and technology.
Any changes in the estimates for the costs are accounted for on a prospective basis. In determining
the costs of site restoration, there is uncertainty regarding the nature and extent of the restoration
due to community expectations and future legislation. Accordingly the costs have been determined
on the basis that the restoration will be completed within one year of abandoning the site.
(j) Income Tax
The income tax expense or benefit for the period is the tax payable on that period's taxable income
based on the applicable income tax rate for each jurisdiction, adjusted by changes in deferred tax
assets and liabilities attributable to temporary differences, unused tax losses and the adjustment
recognised for prior periods, where applicable.
Deferred tax assets and liabilities are recognised for temporary differences at the tax rates expected
to apply when the assets are recovered or liabilities are settled, based on those tax rates that are
enacted or substantively enacted, except for:
For
per
sona
l use
onl
y

Western Areas Ltd & Controlled Entities ABN 68 091 049 357
Page 34 of 76
Note 1: Statement of Significant Accounting Policies
(j) Income Tax (Continued...)
When the deferred income tax asset or liability arises from the initial recognition of goodwill or an asset or liability in a transaction that is not a business combination and that, at the time of the transaction, affects neither the accounting nor taxable profits; or
When the taxable temporary difference is associated with interests in subsidiaries, associates or joint ventures, and the timing of the reversal can be controlled and it is probable that the temporary difference will not reverse in the foreseeable future.
Deferred tax assets are recognised for deductible temporary differences and unused tax losses only
if it is probable that future taxable amounts will be available to utilise those temporary differences
and losses.
The carrying amount of recognised and unrecognised deferred tax assets are reviewed each
reporting date. Deferred tax assets recognised are reduced to the extent that it is no longer
probable that future taxable profits will be available for the carrying amount to be recovered.
Previously unrecognised deferred tax assets are recognised to the extent that it is probable that
there are future taxable profits available to recover the asset.
Deferred tax assets and liabilities are offset only where there is a legally enforceable right to offset
current tax assets against current tax liabilities and deferred tax assets against deferred tax
liabilities; and they relate to the same taxable authority on either the same taxable entity or
different taxable entity's which intend to settle simultaneously.
Western Areas Limited (the 'head entity') and its wholly‐owned Australian subsidiaries have formed
an income tax consolidated group under the tax consolidation regime. The head entity and each
subsidiary in the tax consolidated group continue to account for their own current and deferred tax
amounts. The tax consolidated group has applied the 'separate taxpayer within group' approach in
determining the appropriate amount of taxes to allocate to members of the tax consolidated group.
In addition to its own current and deferred tax amounts, the head entity also recognises the current
tax liabilities (or assets) and the deferred tax assets arising from unused tax losses and unused tax
credits assumed from each subsidiary in the tax consolidated group.
Assets or liabilities arising under tax funding agreements with the tax consolidated entities are
recognised as amounts receivable from or payable to other entities in the tax consolidated group.
The tax funding arrangement ensures that the intercompany charge equals the current tax liability
or benefit of each tax consolidated group member, resulting in neither a contribution by the head
entity to the subsidiaries nor a distribution by the subsidiaries to the head entity.
(k) Goods and Services Tax (GST)
Revenues, expenses and assets are recognised net of the amount of GST, except where the amount
of GST incurred is not recoverable from the Australian Tax Office. In these circumstances the GST is
recognised as part of the cost of acquisition of the asset or as part of an item of the expense.
Receivables and payables in the statement of financial position are shown inclusive of GST.
Cash flows are presented in the cash flow statement on a gross basis, except for the GST component
of investing and financing activities, which are disclosed as operating cash flows.
For
per
sona
l use
onl
y

Western Areas Ltd & Controlled Entities ABN 68 091 049 357
Page 35 of 76
Note 1: Statement of Significant Accounting Policies
(l) Employee Benefits
Short‐term employee benefits
Liabilities for wages and salaries, including non‐monetary benefits, annual leave and long service
leave expected to be settled within 12 months of the reporting date are measured at the amounts
expected to be paid when the liabilities are settled.
Other long‐term employee benefits obligations
The liabilities for long service leave and annual leave that are not expected to be settled wholly
within 12 months after the end of the period in which the employees render the related service are
recognised as non‐current liabilities and are therefore measured at the present value of expected
future payments to be made in respect of services provided by employees up to the end of the
reporting period. Consideration is given to expected future wage and salary levels, experience of
employee departures and periods of service. Expected future payments are discounted using market
yields at the end of the reporting period of government bonds with terms and currencies that match,
as closely as possible, the estimated future cash outflows.
The obligations are presented as current liabilities in the balance sheet if the entity does not have an
unconditional right to defer settlement for at least twelve months after the reporting period,
regardless of when the actual settlement is expected to occur.
Defined contribution superannuation expense
Contributions to defined contribution superannuation plans are expensed in the period in which
they are incurred.
Share‐based payments
The consolidated entity has provided benefits to its Key Management Personnel in the form of
share‐based payments, whereby services were rendered partly or wholly in exchange for shares or
rights over shares. The Remuneration Committee approved the grant of performance rights as
incentives to attract Executives and to maintain their long term commitment to the Company. These
benefits are awarded at the discretion of the Board, or following approval by shareholders (equity‐
settled transactions).
The costs of these equity‐settled transactions are measured by reference to the fair value of the
equity instruments at the date on which they are granted. The fair value of performance rights
granted is determined using the Black Scholes Option Pricing Model (“BSM”) that includes a Monte
Carlo Simulation Model to value the Rights, further details of which are disclosed in Note 30.
The costs of these equity‐settled transactions is recognised, together with a corresponding increase
in equity, over the period in which the performance and / or service conditions are fulfilled (the
vesting period), ending on the date on which the relevant employees become fully entitled to the
equity instrument (vesting date).
At each subsequent reporting date until vesting, the cumulative charge to the income statement is
the product of (i) the fair value at grant date of the award; (ii) the current best estimate of the
number of equity instruments that will vest, taking into account such factors as the likelihood of
employee turnover during the vesting period and the likelihood of non‐market performance
conditions being met and (iii) the expired portion of the vesting period. The charge to the income
statement for the period is the cumulative amount as calculated above less the amounts already
charged in previous periods. There is a corresponding credit to equity.
For
per
sona
l use
onl
y

Western Areas Ltd & Controlled Entities ABN 68 091 049 357
Page 36 of 76
Note 1: Statement of Significant Accounting Policies
(l) Employee Benefits (continued...)
Until an equity instrument has vested, any amounts recorded will be adjusted if more or fewer
equity instruments vest than were originally anticipated to do so. Any equity instrument subject to a
market condition is considered to vest irrespective of whether or not that market condition is
fulfilled, provided that all other conditions are satisfied.
If the terms of an equity‐settled award are modified, as a minimum, an expense is recognised as if
the terms had not been modified. An additional expense is recognised for any modification that
increases the total fair value of the share based payment arrangement, or is otherwise beneficial to
the recipient of the award, as measured at the date of modification.
If an equity‐settled transaction is cancelled (other than a grant cancelled by forfeiture when the
vesting conditions are not satisfied), it is treated as if it had vested on the date of cancellation, and
any expense not yet recognised for the award is recognised immediately. However, if a new equity
instrument is substituted for the cancelled award and designated as a replacement award on the
date that it is granted, the cancelled and new equity instrument are treated as if they were a
modification of the original award, as described in the preceding paragraph.
(m) Leases
The determination of whether an arrangement is or contains a lease is based on the substance of
the arrangement and requires an assessment of whether the fulfilment of the arrangement is
dependent on the use of a specific asset or assets and the arrangement conveys a right to use the
asset.
A distinction is made between finance leases, which effectively transfer from the lessor to the lessee
substantially all the risks and benefits incidental to the ownership of leased assets, and operating
leases, under which the lessor effectively retains substantially all such risks and benefits.
Finance leases are capitalised. A lease asset and liability are established at the fair value of the
leased assets, or if lower, the present value of minimum lease payments. Lease payments are
allocated between the principal component of the lease liability and the finance costs, so as to
achieve a constant rate of interest on the remaining balance of the liability.
Leased assets acquired under a finance lease are depreciated over the asset's useful life or over the
shorter of the asset's useful life and the lease term if there is no reasonable certainty that the
consolidated entity will obtain ownership at the end of the lease term.
Operating lease payments, net of any incentives received from the lessor, are charged to profit or
loss on a straight‐line basis over the term of the lease.
(n) Financial Instruments
Initial recognition and measurement
Financial assets and financial liabilities are recognised when the entity becomes a party to the
contractual provisions to the instrument. For financial assets, this is equivalent to the date that the
company commits itself to either the purchase or sale of the asset (i.e. trade date accounting is
adopted).
Financial instruments are initially measured at fair value plus transaction costs, except where the
instrument is classified ‘at fair value through profit or loss’, in which case transaction costs are
expensed to the income statement immediately.
For
per
sona
l use
onl
y

Western Areas Ltd & Controlled Entities ABN 68 091 049 357
Page 37 of 76
Note 1: Statement of Significant Accounting Policies
(n) Financial Instruments (Continued...)
Classification and Subsequent Measurement
Financial instruments are subsequently measured at either of fair value, amortised cost using the
effective interest rate method, or cost. Fair value represents the amount for which an asset could
be exchanged or a liability settled, between knowledgeable, willing parties. Where available, quoted
prices in an active market are used to determine fair value. In other circumstances, valuation
techniques are adopted.
Amortised cost is calculated as:
a) the amount at which the financial asset or financial liability is measured at initial recognition;
b) less principal repayments;
c) plus or minus the cumulative amortisation of the difference, if any, between the amount initially recognised and the maturity amount calculated using the effective interest method; and
d) less any reduction for impairment.
The effective interest method is used to allocate interest income or interest expense over the
relevant period and is equivalent to the rate that exactly discounts estimated future cash payments
or receipts (including fees, transaction costs and other premiums or discounts) through the expected
life (or when this cannot be reliably predicted, the contractual term) of the financial instrument to
the net carrying amount of the financial asset or financial liability. Revisions to expected future net
cash flows will necessitate an adjustment to the carrying value with a consequential recognition of
an income or expense in profit or loss.
Financial assets at fair value through profit and loss
As from 1 July 2013 the group classifies its financial assets in the following measurement categories:
those to be measured subsequently at fair value, and
those to be measured at amortised cost.
The classification depends on the entity’s business model for managing the financial assets and the
contractual terms of the cash flows. The group is required to reclassify all affected debt investments
when and only when its business model for managing those assets changes.
At initial recognition, the group measures a financial asset at its fair value plus, in the case of a
financial asset not at fair value through profit or loss, transaction costs that are directly attributable
to the acquisition of the financial asset. Transaction costs of financial assets carried at fair value
through profit or loss are expensed in profit or loss.
A gain or loss on a debt investment that is subsequently measured at fair value and is not part of a
hedging relationship is recognised in profit or loss and presented net in the income statement within
other income or other expenses in the period in which it arises. A gain or loss on a debt investment
that is subsequently measured at amortised cost and is not part of a hedging relationship is
recognised in profit or loss when the financial asset is derecognised or impaired and through the
amortisation process using the effective interest rate method.
The group subsequently measures all equity investments at fair value. Where the group’s management has elected to present fair value gains and losses on equity investments in other comprehensive income, there is no subsequent reclassification of fair value gains and losses to profit
For
per
sona
l use
onl
y

Western Areas Ltd & Controlled Entities ABN 68 091 049 357
Page 38 of 76
Note 1: Statement of Significant Accounting Policies
(n) Financial Instruments (Continued…)
or loss. Dividends from such investments continue to be recognised in profit or loss as other revenue when the group’s right to receive payments is established and as long as they represent a return on investment. This treatment has been selected as the equity investments in Mustang Minerals Inc, and St George Mining Limited, as these are deemed to be strategic equity investments.
Loans and receivables
Loans and receivables are non‐derivative financial assets with fixed or determinable payments that
are not quoted in an active market and are subsequently measured at amortised cost.
Loans and receivables are included in current assets, except for those which are not expected to
mature within 12 months after the end of the reporting period (all other loans and receivables are
classified as non‐current assets).
Financial liabilities
Non‐derivative financial liabilities (excluding financial guarantees) are subsequently measured at
amortised cost.
De‐recognition
Financial assets are de‐recognised where the contractual rights to receipt of cash flows expires or
the asset is transferred to another party whereby the entity no longer has any significant continuing
involvement in the risks and benefits associated with the asset. Financial liabilities are de‐recognised
where the related obligations are discharged, cancelled or expired. The difference between the
carrying value of the financial liability extinguished or transferred to another party and the fair value
of consideration paid, including the transfer of non‐cash assets or liabilities assumed, is recognised in
profit or loss.
Derivative financial instruments
Derivative financial instruments are used by the consolidated entity to hedge exposures to
commodity prices and foreign currency exchange rates.
The Group documents at the inception of a transaction the relationship between hedging
instruments and hedged items, as well as its risk management objective and strategy for undertaking
various hedge transactions. The Group also documents its assessment, both at hedge inception and
on an ongoing basis, of whether the derivatives that are used in hedging transactions have been and
will continue to be highly effective in offsetting changes in fair values or cash flows of hedged items.
Derivatives are initially recognised at fair value on the date the contract is entered into and are
subsequently remeasured to their fair value. The method of recognising the resulting gain or loss
depends on whether the derivative is designated as a hedging instrument, and if so, the nature of
the item being hedged. Hedging derivatives are either Fair Value Hedges or Cashflow Hedges.
Fair Value Hedges
Changes in the fair value of derivatives classified as fair value hedges are recognised in the Income
Statement, together with any changes in the fair value of the hedge asset or liability that are
attributable to the hedged risk.
For
per
sona
l use
onl
y

Western Areas Ltd & Controlled Entities ABN 68 091 049 357
Page 39 of 76
Note 1: Statement of Significant Accounting Policies
(n) Financial Instruments (Continued…)
Cash Flow Hedge
Cash flow hedges are used to cover the consolidated entity’s exposure to variability in cash flows
that is attributable to particular risk associated with a recognised asset or liability or a firm
commitment which could affect profit or loss. The effective portion of the gain or loss on the
hedging instrument is recognised directly in equity, whilst the ineffective portion is recognised in
profit or loss. Amounts taken to equity are transferred out of equity and included in the
measurement of the hedged transaction when the forecast transaction occurs.
Cash flow hedges are tested for effectiveness on a regular basis both retrospectively and prospectively to ensure that each hedge is highly effective and continues to be designated as a cash flow hedge. If the forecast transaction is no longer expected to occur, amounts recognised in equity are transferred to profit or loss.
If the hedging instrument is sold, terminated, expires, exercised without replacement or rollover, or
if the hedge becomes ineffective and is no longer a designated hedge, amounts previously
recognised in equity remain in equity until the forecast transaction occurs.
All Other Derivatives
Changes in the fair value of derivatives that do not qualify for hedge accounting are recognised in
the Income Statement.
(o) Impairment of Assets
At the end of each reporting period, the Group assesses whether there is any indication that an asset
may be impaired. The assessment will include the consideration of external and internal sources of
information including dividends received from subsidiaries, associates or jointly controlled entities
deemed to be out of pre‐acquisition profits. If such an indication exists, an impairment test is carried
out on the asset by comparing the recoverable amount of the asset, being the higher of the asset’s
fair value less costs to sell and value in use, to the asset’s carrying value. Any excess of the asset’s
carrying value over its recoverable amount is expensed to the income statement.
Where it is not possible to estimate the recoverable amount of an individual asset, the Group
estimates the recoverable amount of the cash‐generating unit to which the asset belongs.
Reversal of impairment losses
An impairment loss recognised in prior periods for an asset/CGU is reversed if there has been a
change in the estimates used to determine the asset’s/CGU’s recoverable amount since the last
impairment loss was recognised. When an impairment loss subsequently reverses, the carrying
amount of the asset/CGU is increased to the revised estimate of its recoverable amount, but so that
the increased carrying amount does not exceed the carrying amount that would have been
determined had no impairment loss been recognised for the asset/CGU in prior years.
Impairment testing is performed annually for goodwill and intangible assets with indefinite lives.
(p) Rounding Amounts
The parent entity has applied the relief available to it under the ASIC Class Order 98/100 and
accordingly, amounts in the financial report have been rounded to the nearest $1,000.
For
per
sona
l use
onl
y

Western Areas Ltd & Controlled Entities ABN 68 091 049 357
Page 40 of 76
Note 1: Statement of Significant Accounting Policies
(q) Cash and Cash Equivalents
Cash and cash equivalents comprise cash‐on‐hand, cash in banks and investments in money market
instruments, net of outstanding bank overdrafts.
(r) Provisions
Provisions are recognised where the group has a legal or constructive obligation, as a result of past
events, for which it is probable that an outflow of economic benefits will result and that outflow is
able to be reliably measured.
(s) Convertible Bonds
The component of the convertible bonds that exhibits characteristics of a liability is recognised as a
liability in the statement of financial position, net of transaction costs. On issuance of the
convertible bonds, the fair value of the liability component is determined using a market rate for an
equivalent non‐convertible bond and this is carried as a long term liability. The increase in the
liability due to the passage of time is recognised as a finance cost.
The remainder of the proceeds are allocated and included in shareholder equity, net of transaction
costs. The carrying amount of the convertible bonds is not remeasured in subsequent years.
(t) Critical Accounting Estimates and Balances
The preparation of the financial statements requires management to make judgements, estimates
and assumptions that affect the reported amounts in the financial statements. Management
continually evaluates its judgements and estimates in relation to assets, liabilities, contingent
liabilities, revenue and expenses. Management bases its judgements, estimates and assumptions on
historical experience and on other various factors, including expectations of future events,
management believes to be reasonable under the circumstances. The resulting accounting
judgements and estimates will seldom equal the related actual results. The judgements, estimates
and assumptions that have a significant risk of causing a material adjustment to the carrying
amounts of assets and liabilities (refer to the respective notes) within the next financial year are
discussed below.
Share‐based payment transactions
The consolidated entity measures the cost of equity‐settled transactions with employees by
reference to the fair value of the equity instruments at the date at which they are granted. The fair
value is determined by using the Black‐Scholes model taking into account the terms and conditions
upon which the instruments were granted. The accounting estimates and assumptions relating to
equity‐settled share‐based payments would have no impact on the carrying amounts of assets and
liabilities within the next annual reporting period but may impact profit or loss and equity.
Provision for impairment of inventories
The provision for impairment of inventories assessment requires a degree of estimation and
judgement. Costs incurred in or benefits of the productive process are accumulated as stockpiles,
nickel and other metals in process, ore on run of mine ore pads and product inventory. Net
realisable value tests are performed at least annually and represent the estimated future sales price
of the product based on prevailing metal prices, less estimated costs to complete production and
bring the product to sale.
For
per
sona
l use
onl
y

Western Areas Ltd & Controlled Entities ABN 68 091 049 357
Page 41 of 76
Note 1: Statement of Significant Accounting Policies
(t) Critical Accounting Estimates and Balances (Continued...)
Stockpiles are measured by estimating the number of tonnes added and removed from the
stockpile, the number contained metal tonnes based on assay data, and the estimated recovery
percentage based on the expected processing method.
Although the quantity of recoverable metal is reconciled by comparing the grades of the ore to the
quantities of metals actually recovered (metallurgical balancing), the nature of the process
inherently limits the ability to precisely monitor recoverability levels. As a result the metallurgical
balancing process is constantly monitored and the engineering estimates are refined based on actual
results over time.
Fair value measurement hierarchy
The consolidated entity is required to classify all assets and liabilities, measured at fair value, using a
three level hierarchy, based on the lowest level of input that is significant to the entire fair value
measurement, being: Level 1: Quoted prices (unadjusted) in active markets for identical assets or
liabilities that the entity can access at the measurement date; Level 2: Inputs other than quoted
prices included within Level 1 that are observable for the asset or liability, either directly or
indirectly; and Level 3: Unobservable inputs for the asset or liability. Considerable judgement is
required to determine what is significant to fair value and therefore which category the asset or
liability is placed in can be subjective.
The fair value of assets and liabilities classified as level 3 is determined by the use of valuation
models. These include discounted cash flow analysis or the use of observable inputs that require
significant adjustments based on unobservable inputs.
Estimation of useful lives of assets
The consolidated entity determines the estimated useful lives and related depreciation and
amortisation charges for its property, plant and equipment and finite life intangible assets. The
useful lives could change significantly as a result of technical innovations or some other event. The
depreciation and amortisation charge will increase where the useful lives are less than previously
estimated lives, or technically obsolete or non‐strategic assets that have been abandoned or sold
will be written off or written down.
Impairment of non‐financial assets other than goodwill and other indefinite life intangible assets
The consolidated entity assesses impairment of non‐financial assets other than goodwill and other
indefinite life intangible assets at each reporting date by evaluating conditions specific to the
consolidated entity and to the particular asset that may lead to impairment. If an impairment trigger
exists, the recoverable amount of the asset is determined. This involves fair value less costs of
disposal or value‐in‐use calculations, which incorporate a number of key estimates and assumptions.
It is reasonably possible that the underlying metal price assumption may change which may then
impact the estimated life of mine determinant and may then require a material adjustment to the
carrying value of mining plant and equipment, mining infrastructure and mining development assets.
Furthermore, the expected future cash flows used to determine the value‐in‐use of these assets are
inherently uncertain and could materially change over time. They are significantly affected by a
number of factors including reserves and production estimates, together with economic factors such
as metal spot prices, discount rates, estimates of costs to produce reserves and future capital
For
per
sona
l use
onl
y

Western Areas Ltd & Controlled Entities ABN 68 091 049 357
Page 42 of 76
Note 1: Statement of Significant Accounting Policies
(t) Critical Accounting Estimates and Balances (Continued...)
expenditure. At 30 June 2016, there was $7.0M impairment charge made to Exploration, Evaluation
and Development.
Income tax
The consolidated entity is subject to income taxes in the jurisdictions in which it operates. Significant
judgement is required in determining the provision for income tax. There are many transactions and
calculations undertaken during the ordinary course of business for which the ultimate tax
determination is uncertain.
Provision for restoration and rehabilitation
Provision is made for the costs of Restoration and rehabilitation when the related environmental
disturbance takes place as outlined in Note 16. The provision recognised represents management’s
best estimate of the costs that will be incurred, but significant judgement is required as many of
these costs will not crystallise until the end of the life of the mine. Estimates are reviewed annually
and are based on current regulatory requirements and the estimated useful life of the mine.
Engineering and feasibility studies are undertaken periodically, however significant changes in the
estimates of contamination, restoration standards and techniques will result in changes to
provisions from period to period.
Recovery of deferred tax assets
Deferred tax assets are recognised for deductible temporary differences only if the consolidated
entity considers it is probable that future taxable amounts will be available to utilise those
temporary differences and losses.
Employee benefits provision
As discussed in note (l), the liability for employee benefits expected to be settled more than 12
months from the reporting date are recognised and measured at the present value of the estimated
future cash flows to be made in respect of all employees at the reporting date. In determining the
present value of the liability, estimates of attrition rates and pay increases through promotion and
inflation have been taken into account.
(u) Contributed equity
Ordinary shares are classified as equity. Incremental costs directly attributable to the issue of new
shares or options are shown in equity as a deduction, net of tax, from the proceeds. Incremental
costs directly attributable to the issue of new shares or options for the acquisition of a business are
not included in the cost of the acquisition as part of the purchase consideration.
If the entity reacquires its own equity instruments, for example as the result of a share buy‐back,
those instruments are deducted from equity and the associated shares are cancelled. No gain or loss
is recognised in the profit and loss and the consideration paid including any directly attributable
incremental costs (net of income taxes) is recognised directly in equity.
(v) Comparative figures
Where necessary, comparative figures have been restated to conform with changes in presentation
for the current year.
For
per
sona
l use
onl
y

Western Areas Ltd & Controlled Entities ABN 68 091 049 357
Page 43 of 76
Note 1: Statement of Significant Accounting Policies
(w) Intangibles
Expenditure during the research phase of a project is recognised as an expense when incurred.
Patents and trademarks are capitalised only when technical feasibility studies identify that the
project will deliver future economic benefits and these benefits can be measured reliably.
Patents and trademarks have a finite life and are amortised on a systematic basis matched to the
future economic benefits over the useful life of the project.
(x) Trade and other payables
Trade and other payables represent the liabilities for goods and services received by the entity that
remain unpaid at the end of the reporting period. The balance is recognised as a current liability with
the amounts normally paid within 30 days of recognition of the liability.
(y) Business Combinations
The acquisition method of accounting is used to account for business combinations regardless of whether equity instruments or other assets are acquired.
The consideration transferred for the acquisition is the sum of the acquisition‐date fair values of the assets transferred, equity instruments issued or liabilities incurred by the acquirer to former owners of the acquiree and the amount of any non‐controlling interest in the acquiree. For each business combination, the non‐controlling interest in the acquiree is measured at either fair value or at the proportionate share of the acquiree’s identifiable net assets. All acquisition costs are expensed as incurred to profit or loss.
On the acquisition of a business, the consolidated entity assesses the financial assets acquired and liabilities assumed for appropriate classification and designation in accordance with the contractual terms, economic conditions, the consolidated entity’s operating or accounting policies and other pertinent conditions in existence at the acquisition‐date.
Where the business combination is achieved in stages, the consolidated entity remeasures its previously held equity interest in the acquiree at the acquisition‐date fair value and the difference between the fair value and the previous carrying amount is recognised in profit or loss.
The difference between the acquisition‐date fair value of assets acquired, liabilities assumed and any non‐controlling interest in the acquiree and the fair value of the consideration transferred and the fair value of any pre‐existing investment in the acquire is recognised as goodwill. If the consideration transferred and the pre‐existing fair value is less than the fair value of the identifiable net assets acquired, being a bargain purchase to the acquirer, the difference is recognised as a gain directly in profit or loss by the acquirer on the acquisition‐date, but only after a reassessment of the identification and measurement of the net assets acquired, the non‐controlling interest in the acquiree, if any, the consideration transferred and the acquirer’s previously held equity interest in the acquirer.
Business combinations are initially accounted for on a provisional basis. The acquirer retrospectively adjusts the provisional amounts recognised and also recognises additional assets or liabilities during the measurement period, based on new information obtained about the facts and circumstances that existed at the acquisition‐date. The measurement period ends on either the earlier of (i) 12 months from the date of the acquisition or (ii) when the acquirer receives all the information possible to determine fair value.
(z) Trade and other receivables
Trade receivables are recognised initially at fair value and subsequently measured at amortised cost using the effective interest method, less provision for impairment. Trade receivables are generally due for settlement within 30 days. They are presented as current assets unless collection is not expected for more than 12 months after the reporting date.
For
per
sona
l use
onl
y
Western Areas Ltd & Controlled Entities ABN 68 091 049 357
Page 44 of 76
Note 1: Statement of Significant Accounting Policies
(z) Trade and other receivables (Continued...)
The amount of the impairment loss is recognised in profit or loss within other expenses. When a
trade receivable for which an impairment allowance had been recognised becomes uncollectible in a
subsequent period, it is written off against the allowance account. Subsequent recoveries of
amounts previously written off are credited against other expenses in profit or loss.
(aa) Earnings per share
Basic earnings per share
Basic earnings per share are calculated by dividing:
The profit attributable to equity holders of the company, excluding any costs of servicing equity other than ordinary shares
By the weighted average number of ordinary shares outstanding during the financial year, adjusted for bonus elements in ordinary shares issued during the year (note 19).
Diluted earnings per share
Diluted earnings per share adjusts the figures used in the determination of basic earnings per share
to take into account:
The after income tax effect of interest and other financing costs associated with dilutive potential ordinary shares, and
The weighted average number of additional ordinary shares that would have been outstanding assuming the conversion of all dilutive potential ordinary shares.
(bb) New Accounting Standards and Interpretations not yet mandatory or early adopted
AASB 15 Revenue from Contracts with Customers
This standard is applicable to annual reporting periods beginning on or after 1 January 2017. The standard provides a single standard for revenue recognition.
The core principle of the standard is that an entity will recognise revenue to depict the transfer of promised goods or services to customers in an amount that reflects the consideration to which the entity expects to be entitled in exchange for those goods or services.
The standard will require: contracts (either written, verbal or implied) to be identified, together with the separate performance obligations within the contract; determine the transaction price, adjusted for the time value of money excluding credit risk; allocation of the transaction price to the separate performance obligations on a basis of relative stand‐alone selling price of each distinct good or service, or estimation approach if no distinct observable prices exist; and recognition of revenue when each performance obligation is satisfied.
Credit risk will be presented separately as an expense rather than adjusted to revenue. For goods, the performance obligation would be satisfied when the customer obtains control of the goods. For services, the performance obligation is satisfied when the service has been provided, typically for promises to transfer services to customers. For performance obligations satisfied over time, an entity would select an appropriate measure of progress to determine how much revenue should be recognised as the performance obligation is satisfied.
Contracts with customers will be presented in an entity's statement of financial position as a contract liability, a contract asset, or a receivable, depending on the relationship between the entity's performance and the customer's payment. Sufficient quantitative and qualitative disclosure is required to enable users to understand the contracts with customers; the significant judgments made in applying the guidance to those contracts; and any assets recognised from the costs to obtain or fulfil a contract with a customer. The consolidated entity will adopt this standard from 1 July 2017 but the impact of its adoption is yet to be assessed by the consolidated entity.
For
per
sona
l use
onl
y

Western Areas Ltd & Controlled Entities ABN 68 091 049 357
Page 45 of 76
(bb) New Accounting Standards and Interpretations not yet mandatory or early adopted (continued...)
AASB 16 Leases
This standard is applicable to annual reporting periods beginning on or after 1 January 2019. The
standard replaces AASB 117 'Leases' and for lessees will eliminate the classifications of operating
leases and finance leases. Subject to exceptions, a 'right‐of‐use' asset will be capitalised in the
statement of financial position, measured as the present value of the unavoidable future lease
payments to be made over the lease term. The exceptions relate to short‐term leases of 12 months
or less and leases of low‐value assets (such as personal computers and small office furniture) where
an accounting policy choice exists whereby either a 'right‐of‐use' asset is recognised or lease
payments are expensed to profit or loss as incurred. A liability corresponding to the capitalised lease
will also be recognised, adjusted for lease prepayments, lease incentives received, initial direct costs
incurred and an estimate of any future restoration, removal or dismantling costs. Straight‐line
operating lease expense recognition will be replaced with a depreciation charge for the leased asset
(included in operating costs) and an interest expense on the recognised lease liability (included in
finance costs). In the earlier periods of the lease, the expenses associated with the lease under AASB
16 will be higher when compared to lease expenses under AASB 117. However EBITDA (Earnings
Before Interest, Tax, Depreciation and Amortisation) results will be improved as the operating
expense is replaced by interest expense and depreciation in profit or loss under AASB 16. For
classification within the statement of cash flows, the lease payments will be separated into both a
principal (financing activities) and interest (either operating or financing activities) component. For
lessor accounting, the standard does not substantially change how a lessor accounts for leases. The
consolidated entity will adopt this standard from 1 July 2019 but the impact of its adoption is yet to
be assessed by the consolidated entity.
Note 2: Other income
Consolidated Entity
2016
$’000
2015
$’000
‐ Interest income 780 4,749
‐ Other income 702
‐ Insurance proceeds 1,188
‐ Income on sale of carbon credits ‐ 768
Total other income 2,670 5,517
Note 3: Dividends
Dividends proposed
No final dividend is proposed for the year ended 30 June 2016
(2015: 4 cents fully franked). . ‐ 9,337
Dividends paid ‐
A fully franked final dividend of 4 cents per share was paid for the
year ended 30 June 2015 (2014: 4 cents). 9,337 9,292
No interim dividend for 2016 (2015: 3 cent fully franked) per share ‐ 6,989
9,337 16,281
For
per
sona
l use
onl
y

Western Areas Ltd & Controlled Entities ABN 68 091 049 357
Page 46 of 76
Note 4: Profit before income tax
Consolidated Entity
2016
$’000
2015
$’000
Profit before income tax includes the following specific expenses:
‐ Depreciation of property, plant and equipment 9 16,474 15,077
‐ Depreciation of disposed property, plant and equipment 9 515 ‐
‐ Amortisation of mine development asset 12 43,682 50,737
‐ Rental expenditure relating to operating leases 1,345 1,403
‐ Realised derivative (gains) / losses ‐ (2,181)
‐ Changes in fair value of derivatives ‐ (231)
‐ Employee benefits expense
Defined contribution superannuation expense 2,221 2,288
‐ Finance costs:
Interest expense – borrowings 267 8,046
Provisions: unwinding of discount 767 725
Bond accretion expense ‐ 5,429
Interest expense – finance leases 21 33
Borrowing costs amortised 1,491 1,239
Total borrowing costs 2,546 15,472
Note 5: Trade and Other Receivables
Trade debtors 21,300 11,278
Other debtors 718 830
Income tax prepaid 3,448 ‐
GST refund due 551 629
Prepayments 3,258 3,237
29,275 15,974
There are no balances within trade and other receivables that contain amounts that are past
due. It is expected the balances will be received when due.
Note 6: Inventories
Ore stockpiles – at cost 9,911 18,357
Nickel concentrate stockpiles – at cost 958 1,143
Consumables and spare parts – at cost 3,892 3,907
14,761 23,407
Inventory write‐off Due to the continuing low nickel price an inventory stockpile of Flying Fox low grade ore was written
off that carried an historic cost of $4.6 million. This is in accordance with “AASB 102 Inventory”
where inventory must be carried at the lower of cost or net realisable value. For
per
sona
l use
onl
y
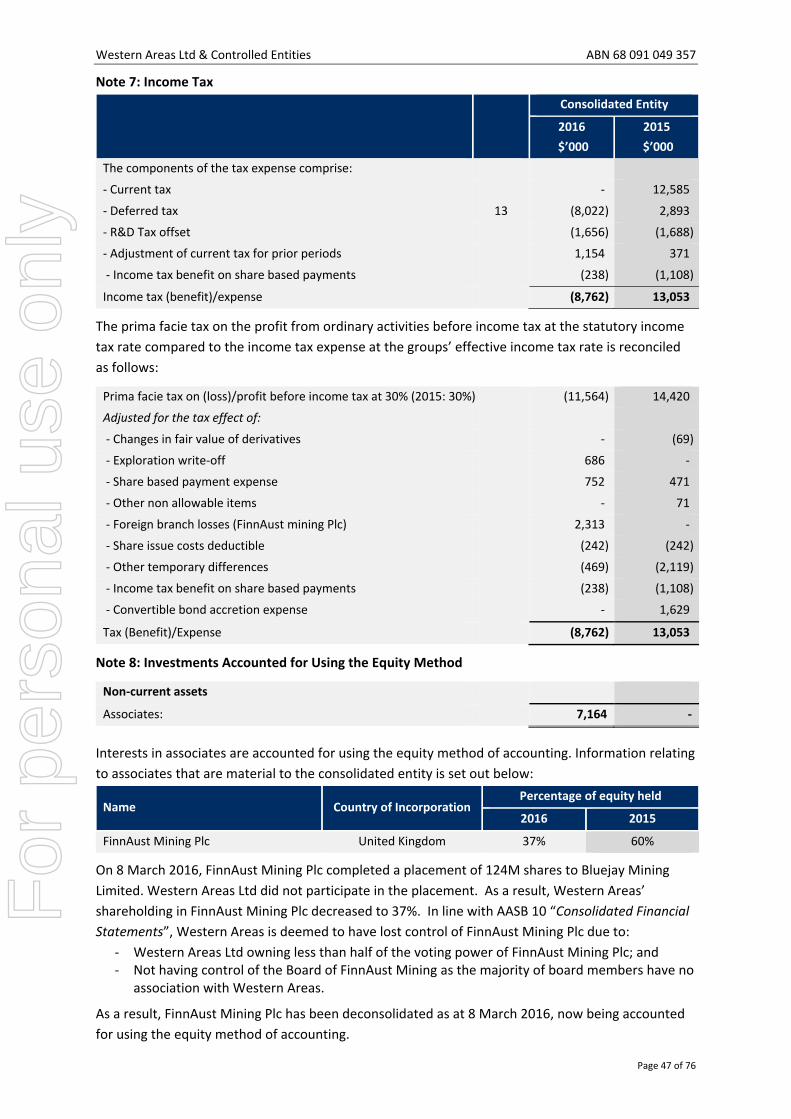
Western Areas Ltd & Controlled Entities ABN 68 091 049 357
Page 47 of 76
Note 7: Income Tax
Consolidated Entity
2016
$’000
2015
$’000
The components of the tax expense comprise:
‐ Current tax ‐ 12,585
‐ Deferred tax 13 (8,022) 2,893
‐ R&D Tax offset (1,656) (1,688)
‐ Adjustment of current tax for prior periods 1,154 371
‐ Income tax benefit on share based payments (238) (1,108)
Income tax (benefit)/expense (8,762) 13,053
The prima facie tax on the profit from ordinary activities before income tax at the statutory income
tax rate compared to the income tax expense at the groups’ effective income tax rate is reconciled
as follows:
Prima facie tax on (loss)/profit before income tax at 30% (2015: 30%) (11,564) 14,420
Adjusted for the tax effect of:
‐ Changes in fair value of derivatives ‐ (69)
‐ Exploration write‐off 686 ‐
‐ Share based payment expense 752 471
‐ Other non allowable items ‐ 71
‐ Foreign branch losses (FinnAust mining Plc) 2,313 ‐
‐ Share issue costs deductible (242) (242)
‐ Other temporary differences (469) (2,119)
‐ Income tax benefit on share based payments (238) (1,108)
‐ Convertible bond accretion expense ‐ 1,629
Tax (Benefit)/Expense (8,762) 13,053
Note 8: Investments Accounted for Using the Equity Method
Non‐current assets
Associates: 7,164 ‐
Interests in associates are accounted for using the equity method of accounting. Information relating
to associates that are material to the consolidated entity is set out below:
Name Country of Incorporation Percentage of equity held
2016 2015
FinnAust Mining Plc United Kingdom 37% 60%
On 8 March 2016, FinnAust Mining Plc completed a placement of 124M shares to Bluejay Mining
Limited. Western Areas Ltd did not participate in the placement. As a result, Western Areas’
shareholding in FinnAust Mining Plc decreased to 37%. In line with AASB 10 “Consolidated Financial
Statements”, Western Areas is deemed to have lost control of FinnAust Mining Plc due to:
‐ Western Areas Ltd owning less than half of the voting power of FinnAust Mining Plc; and ‐ Not having control of the Board of FinnAust Mining as the majority of board members have no
association with Western Areas.
As a result, FinnAust Mining Plc has been deconsolidated as at 8 March 2016, now being accounted
for using the equity method of accounting.
For
per
sona
l use
onl
y

Western Areas Ltd & Controlled Entities ABN 68 091 049 357
Page 48 of 76
Note 8: Investment Accounted for Using the Equity Method (Continued...)
Summarised financial information
Summarised financial information of the subsidiary with non‐controlling interests that are material
to the consolidated entity is set out below
FinnAust Mining Pc
2016
$’000
2015
$’000
Summarised Statement of Financial Position
Current Assets 1,083 1,734
Non Current Assets 22,709 17,286
Total Assets 23,792 19,020
Current Liabilities 708 479
Non Current Liabilities 673 128
Total Liabilities 1,381 607
Net Assets 22,411 18,413
Summarised statement of profit or loss and other comprehensive
income for the period 9 March 2016 to 30 June 2016
Revenue ‐ ‐
Expenses (380) (1,870)
Loss before income tax (380) (1,870)
Income tax ‐ ‐
Loss after income tax (380) (1,870)
Other comprehensive expenses ‐ ‐
Total Comprehensive loss (380) (1,870)
Interest in associate (37%) (140) ‐
Note 9: Property, Plant and Equipment
Property – at cost 47,177 44,264
Accumulated depreciation (24,042) (19,530)
23,135 24,734
Plant & equipment – at cost 150,806 141,000
Accumulated depreciation (78,123) (66,334)
72,683 74,666
Plant & equipment under lease 1,594 1,455
Accumulated depreciation (1,047) (874)
547 581
Total property, plant & equipment – at cost 199,577 186,719
Accumulated Depreciation (103,212) (86,738)
Total 96,365 99,981
Assets Pledged as Security
The property, plant and equipment are assets over which a mortgage has been granted as security
over project loans. The terms of the mortgage preclude the assets from being sold or being used as
security for further mortgages without the permission of the existing mortgagor. Assets under lease
are pledged as security for the associated lease liabilities.
For
per
sona
l use
onl
y

Western Areas Ltd & Controlled Entities ABN 68 091 049 357
Page 49 of 76
Note 9: Property, Plant and Equipment (Continued...)
Movement in carrying amounts:
Movement in the carrying amounts for each class of property, plant and equipment between the
beginning and the end of the current year:
Consolidated Entity
2016
$’000
2015
$’000
Property
Written down value at the beginning of the year 24,734 25,721
‐ Additions 3,805 3,203
‐ Disposals (892) ‐
‐ Depreciation on disposals 497 ‐
‐ Depreciation expense (5,009) (4,190)
Written down value at the end of the year 23,135 24,734
Plant & Equipment
Written down value at the beginning of the year 74,666 76,003
‐ Additions 9,850 9,411
‐ Deconsolidated assets (44) ‐
‐ Depreciation expense on deconsolidated assets 18 ‐
‐ Depreciation expense (11,807) (10,748)
Written down value at the end of the year 72,683 74,666
Plant & Equipment under Lease
Written down value at the beginning of the year 581 566
‐ Additions 139 154
‐ Depreciation expense (173) (139)
Written down value at the end of the year 547 581
Note 10: Asset Acquisition
The Cosmos Nickel Complex (“Cosmos”) is located approximately 370 kilometres northwest of Kalgoorlie in Western Australia and prior to its acquisition by WSA, the project was owned by Xstrata Nickel Australasia Operations Pty Ltd. On 19 June 2015, the Company announced that it had reached an agreement with Xstrata Nickel Australasia Operations Pty Ltd, a subsidiary of Glencore International plc to purchase Cosmos subject to certain conditions precedent. On 1 October 2015, these conditions were satisfied and the transaction was completed. Under the Sale and Purchase Agreement (“SPA”), the total consideration paid by WSA amounted to $24.5 million, comprising a cash payment of $11.5 million on completion of the SPA and deferred payments of $7.0 million and $6.0 million to be settled in nine months and 18 months after completion respectively. The company settled the deferred amount in full on 27 April 2016. The accounting treatment of the acquisition has been considered not to be a business combination under AASB 3, but the acquisition of a group of assets that do not constitute a business.
For
per
sona
l use
onl
y
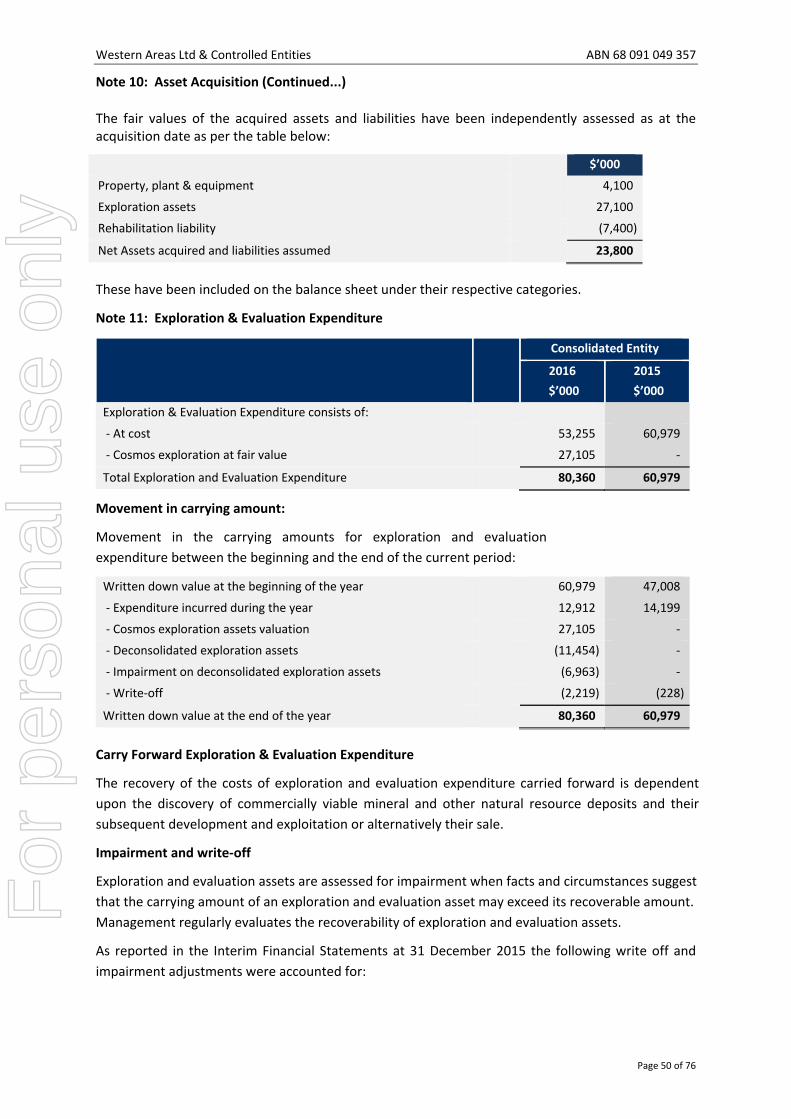
Western Areas Ltd & Controlled Entities ABN 68 091 049 357
Page 50 of 76
Note 10: Asset Acquisition (Continued...)
The fair values of the acquired assets and liabilities have been independently assessed as at the acquisition date as per the table below:
$’000
Property, plant & equipment 4,100
Exploration assets 27,100
Rehabilitation liability (7,400)
Net Assets acquired and liabilities assumed 23,800
These have been included on the balance sheet under their respective categories.
Note 11: Exploration & Evaluation Expenditure
Consolidated Entity
2016
$’000
2015
$’000
Exploration & Evaluation Expenditure consists of:
‐ At cost 53,255 60,979
‐ Cosmos exploration at fair value 27,105 ‐
Total Exploration and Evaluation Expenditure 80,360 60,979
Movement in carrying amount:
Movement in the carrying amounts for exploration and evaluation
expenditure between the beginning and the end of the current period:
Written down value at the beginning of the year 60,979 47,008
‐ Expenditure incurred during the year 12,912 14,199
‐ Cosmos exploration assets valuation 27,105 ‐
‐ Deconsolidated exploration assets (11,454) ‐
‐ Impairment on deconsolidated exploration assets (6,963) ‐
‐ Write‐off (2,219) (228)
Written down value at the end of the year 80,360 60,979
Carry Forward Exploration & Evaluation Expenditure
The recovery of the costs of exploration and evaluation expenditure carried forward is dependent
upon the discovery of commercially viable mineral and other natural resource deposits and their
subsequent development and exploitation or alternatively their sale.
Impairment and write‐off
Exploration and evaluation assets are assessed for impairment when facts and circumstances suggest
that the carrying amount of an exploration and evaluation asset may exceed its recoverable amount.
Management regularly evaluates the recoverability of exploration and evaluation assets.
As reported in the Interim Financial Statements at 31 December 2015 the following write off and
impairment adjustments were accounted for:
For
per
sona
l use
onl
y

Western Areas Ltd & Controlled Entities ABN 68 091 049 357
Page 51 of 76
Note 11: Exploration & Evaluation Expenditure (Continued...)
(i) Exploration and evaluation
In accordance with “AASB 6 Exploration and Evaluation Assets” are regularly assessed for impairment where circumstances suggest that the carrying amount of an asset may exceed its recoverable amount.
Regional exploration expenditure in relation to specific areas of interest that have not lead to the discovery of economic mineral resources, or are currently not scheduled for continued activities, resulted in a $2.2 million write off.
The company had a 60% interest in FinnAust Mining Plc (FinnAust), an exploration company listed on AIM in the UK and was consolidated into the group result. FinnAust had announced a new strategic direction and as such the exploration projects were assessed and historic amounts of exploration and evaluation expenditure that were unlikely to be recovered through successful development or sale have been impaired by $7.0 million. The company’s interest has subsequently decreased to 37% and as a result FinnAust has been deconsolidated on 8 March 2016 (note 8).
Note 12: Mine Properties
Consolidated Entity
2016
$’000
2015
$’000
Capitalised development expenditure consists of:
‐ Mine development 146,203 144,544
‐ Acquisition of mining assets 59,796 59,796
‐ Exploration expenditure transfer 76,000 76,000
‐ Deferred mining expenditure 338,210 313,061
‐ Capitalised restoration costs 11,645 11,645
‐ Capitalised interest 11,175 11,175
‐ Accumulated amortisation (459,450) (415,768)
Total Mine Development 183,579 200,453
Movement in carrying amount:
Movement in the carrying amounts for mine development expenditure between the beginning and
the end of the current period:
Development Expenditure
Written down value at the beginning of the year 200,453 206,434
‐ Additions 27,772 44,756
‐ Evaluation and Feasibility write‐off for the year (964) ‐
‐ Amortisation charge for the year (43,682) (50,737)
Written down value at the end of the year 183,579 200,453
Write‐off of mine property expenditure
Management has reviewed the recoverable amount of each asset or group of assets within the Group’s Cash Generating Unit and has written off $1.0 million feasibility expenditure relating to early stage evaluation projects.
For
per
sona
l use
onl
y

Western Areas Ltd & Controlled Entities ABN 68 091 049 357
Page 52 of 76
Note 13: Deferred Tax Liabilities
Consolidated Entity
2016
$’000
2015
$’000
The balance comprises temporary differences attributable to:
(a) Liabilities
‐ Exploration & evaluation expenditure (50,782) (46,858)
‐ Property, plant and equipment (1,938) (3,106)
‐ Other (286) (40)
(53,006) (50,004)
(b) Assets
‐ Provisions 5,583 4,794
‐ Mine development 27,673 29,742
‐ Tax losses 11,378 ‐
‐ Employee share trust 965 1,222
‐ Other 1,294 111
46,893 35,869
Net deferred tax liabilities (6,113) (14,135)
(c) Reconciliation
(i) Gross movement
The overall movement in the deferred tax account is as follows:
Opening balance (14,135) (11,242)
Debit to income statement 8,022 (2,893)
Closing balance (6,113) (14,135)
(ii) Deferred tax liability The movement in the deferred tax liabilities for each temporary
difference during the year is as follows:
Exploration & development expenditure
Opening balance (46,858) (27,929)
Debit to income statement (3,924) (18,929)
Closing balance (50,782) (46,858)
Property, plant and equipment
Opening balance (3,106) (4,106)
Credit to income statement 1,168 1,000
Closing balance (1,938) (3,106)
Other
Opening balance (40) (376)
(Debit)/credit to income statement (246) 336
Closing balance (286) (40)
For
per
sona
l use
onl
y

Western Areas Ltd & Controlled Entities ABN 68 091 049 357
Page 53 of 76
Note 13 Deferred Tax Liabilities (Continued...)
Consolidated Entity
2016
$’000
2015
$’000
(iii) Deferred tax assets
The movement in the deferred tax assets for each temporary
difference during the year is as follows:
Provisions
Opening balance 4,532 4,532
Credit to income statement 1,051 262
Closing balance 5,583 4,794
Mine development
Opening balance 29,742 16,571
(Debit)/credit to income statement (2,069) 13,171
Closing balance 27,673 29,742
Tax losses ‐
Opening balance ‐ ‐
Credit to income statement 11,378 ‐
Closing balance 11,378 ‐
Employee share trust
Opening balance 1,222 ‐
(Debit)/credit to income statement (257) 1,222
Closing balance 965 1,222
Other
Opening balance 111 66
Credit to income statement 1,183 45
Closing balance 1,294 111
Note 14: Trade & Other Payables
Trade payables 8,555 2,421
Accrued expenses 14,168 22,943
Accrued interest on convertible bonds (note 15b) ‐ 4,000
22,723 29,364
For
per
sona
l use
onl
y

Western Areas Ltd & Controlled Entities ABN 68 091 049 357
Page 54 of 76
Note 15: Borrowings
Consolidated Entity
2016
$’000
2015
$’000
Current
Corporate loan facility 15 (a) ‐ ‐
Convertible bonds 15 (b) ‐ 125,000
Insurance funding ‐ 1,568
Lease liabilities 15 (c) & 21 (b) 196 218
196 126,786
Non Current
Lease liabilities 15 (c) & 21(b) 123 210
123 210
(a) Corporate loan facility
The Corporate Loan facility is available for broad company purposes as agreed between the Australia
and New Zealand Banking Group Ltd (ANZ) and Western Areas Ltd. In December 2015, at the
Company’s request, a variation to the loan facility was executed reducing the existing loan facility
maximum facility limit to $50M. The amortising available limit as at 30 June 2016 was $30M, the
facility remains undrawn with an expiry date in March 2017.
The carrying value of assets secured under the corporate loan facility is as follows:
Mine properties 183,579 200,453
Property, plant & equipment 95,818 99,400
279,397 299,853
(b) Convertible bonds
Current
Convertible bonds (Issued April 2010) ‐ 125,000
The convertible bonds issued in April 2010 were repaid on 2 July 2015.
(c) Lease liabilities
The lease liabilities are secured over the assets under the lease. The finance leases have an
average term of 3 years and an average implicit discount rate of 4.07%. Refer to note 9 for
the carrying value of the assets under lease.
For
per
sona
l use
onl
y

Western Areas Ltd & Controlled Entities ABN 68 091 049 357
Page 55 of 76
Note 16: Provisions
Consolidated Entity
2016
$’000
2015
$’000
Current
Employee Entitlements 16 (a) 3,363 2,457
Non Current
Rehabilitation and restoration cost
Opening balance 16 (b) 13,523 12,798
Additional provision raised 16 (b) 959 ‐
Cosmos rehabilitation provision 16(c) 7,400 ‐
Unwinding of discount 767 725
Rehabilitation expenditure incurred during the period ‐ ‐
Closing balance 22,649 13,523
(a) Employee entitlements relate to the balance of annual leave and long service leave accrued by the consolidated entity’s employees. Recognition and measurement criteria have been disclosed in Note 1.
(b) Rehabilitation and restoration costs relate to an estimate of restoration costs that will result from the development of the Forrestania Nickel Project. Based on the current known mine life restoration activities are not expected to commence within the next 10 years, following full exhaustion of mine life rehabilitation activities will be undertaken.
(c) Rehabilitation costs associated with the Cosmos Nickel Complex (note 10) was valued at $7.4M.
Note 17: Derivative financial instruments
Current Assets
Nickel collar options ‐ ‐
Foreign exchange options 28 (c) 171 ‐
Total 171 ‐
Current Liabilities
Nickel collar options ‐ ‐
Foreign exchange options 28 (c) ‐ 224
Total ‐ 224
Collar options are used to hedge cash flow risk associated with future transactions. Gains and losses
arising from changes in the fair value of derivatives are initially recognised directly in the statement
of comprehensive income. At the date of settlement, amounts included in the hedge reserve are
transferred from equity and included in the income statement.
For
per
sona
l use
onl
y

Western Areas Ltd & Controlled Entities ABN 68 091 049 357
Page 56 of 76
Note 18: Issued Capital
Consolidated Entity
2016
$’000
2015
$’000
270,924,958 fully paid ordinary shares (2015: 233,149,778) 442,963 369,936
Movements in issued capital
Number of
Shares $’000
2016
Balance at beginning of the financial year 233,149,778 369,936
‐ Issued via share placement 30,000,000 60,000
‐ Issued via share purchase plan 7,500,053 15,000
‐ Share issue expense ‐ (1,973)
‐ Performance rights vested issued as shares 275,127 ‐
Balance at end of the financial year 270,924,958 442,963
2015
Balance at beginning of the financial year 232,310,014 369,936
‐ Performance rights vested issued as shares 839,764 ‐
Balance at end of the financial year 233,149,778 369,936
Capital management
The Board’s policy is to maintain a strong capital base so as to maintain investor, creditor, and
market confidence and to sustain future development of the business. There were no changes to
the consolidated entity’s approach to capital management during the year. Neither the Company
nor any of its subsidiaries are subject to externally imposed capital requirements.
The Board effectively manages the Group’s capital by assessing the Group’s financial risks and
adjusting its capital structure in response to changes in these risks and in the market. These
responses include the management of debt levels, distributions to shareholders and share issues.
Performance rights
Information relating to performance rights issued, exercised, lapsed during the year and the
performance rights outstanding at the end of the year are detailed in Note 30 Share Based
Payments.
Terms and conditions of ordinary shares
Ordinary shares have the right to receive dividends as declared and, in the event of winding up the
Company, to participate in the proceeds from the sale of all surplus assets in proportion to the
number of and amounts paid upon shares held.
Ordinary shares entitle their holder to one vote, either in person or by proxy, at a meeting of the
Company.
For
per
sona
l use
onl
y

Western Areas Ltd & Controlled Entities ABN 68 091 049 357
Page 57 of 76
Note 19: Earnings Per Share
Consolidated Entity
2016
$’000
2015
$’000
2016
$’000
2015
$’000
(Loss)/Earnings used to calculate basic / diluted earnings per share (29,783) 35,013
2016
Number
2015
Number
Weighted average number of ordinary shares outstanding
during the year used in calculating earnings per share 241,940,446 232,559,757
Weighted average number of ordinary shares outstanding
during the year used in calculating dilutive earnings per share 245,133,933 234,847,060
Note 20: Cash Flow Information
a) Reconciliation of the net profit after tax to net cash provided
by operating activities
(Loss)/profit after income tax (29,783) 35,013
Depreciation expense 16,989 15,077
Amortisation expense 45,173 51,976
Profit on insured assets written off (1,188) ‐
Convertible bonds accretion expense ‐ 5,429
Impairment / write‐off expenses 14,783 247
Profit on deconsolidation 875 ‐
Other (458) 659
Share based payment expense 2,507 1,569
Rehabilitation provision interest unwound 767 725
Provision for employee entitlements 906 304
Derecognising foreign currency translation reserve (1,191) 1,114
Change in Assets and Liabilities
Decrease in trade and other payables (2,049) (319)
Decrease / (increase) in inventories 4,076 15,914
Decrease / (increase) in trade and other receivables (10,335) 18,401
Decrease in interest payable (4,000) (3,034)
(Decrease) / Increase in tax liabilities (21,509) 3,847
Movement in non‐controlling interest ‐ 1,547
Net cash provided by operating activities 15,563 148,469
b) Reconciliation of Cash and Cash Equivalents
Cash and cash equivalents comprises :
Cash on hand and at bank 75,706 195,355
For
per
sona
l use
onl
y

Western Areas Ltd & Controlled Entities ABN 68 091 049 357
Page 58 of 76
Note 20: Cash Flow Information (Continued...) c) Financing Facilities Available
As at the reporting date the Consolidated Entity had the following financing facilities in place:
Total Facility Utilised at Balance Date Available Facilities (*)
$’000 $’000 $’000
Banking Facilities:‐
ANZ Banking Group
‐ Cash advance facility* 30,000 ‐ 30,000
Performance Guarantees:‐
ANZ Banking Group
‐ Security bond facility 5,000 636 4,364
35,000 636 34,364
* The Corporate Loan facility is available for broad company purposes as agreed between the Australia and New Zealand Banking Group Ltd (ANZ) and
Western Areas Ltd. In December 2015, at the Company’s request, a variation to the loan facility was executed reducing the existing loan facility maximum
facility limit to $50M. The amortising available limit as at 30 June 2016 was $30M, the facility remains undrawn with an expiry date in March 2017.
d) Non Cash Financing Activities
During the year, the consolidated entity acquired plant & equipment by means of a finance lease to
the value of $139k (2015: $154k).
Note 21: Commitments
The Directors are not aware of any commitments as at the date of these financial statements other
than those listed below.
Consolidated Entity
2016
$’000
2015
$’000
a) Operating Lease Commitments
Non‐cancellable operating leases contracted for but not capitalised in the accounts.
‐ no later than 1 year 685 968
‐ later than 1 year and not later than 5 years 2,602 2,956
Lease expenditure contracted for at year end 3,287 3,924
The operating leases are for miscellaneous office equipment and office premises in West Perth. The
West Perth office lease expires August 2021.
b) Finance Lease Commitments
‐ no later than 1 year 196 218
‐ later than 1 year and not later than 5 years 123 210
Total Minimum Lease Payments 319 428
‐ future finance charges 13 22
Total Lease Liability 332 450
‐ current 205 227
‐ non current 127 223
332 450
The finance lease commitments relate primarily to motor vehicles, but also include some office equipment. Motor vehicles are finance leased under 3 year contracts at normal commercial rates, balloon payments are generally required at the expiry of the finance lease, at which point the Company takes ownership of the vehicle.
For
per
sona
l use
onl
y
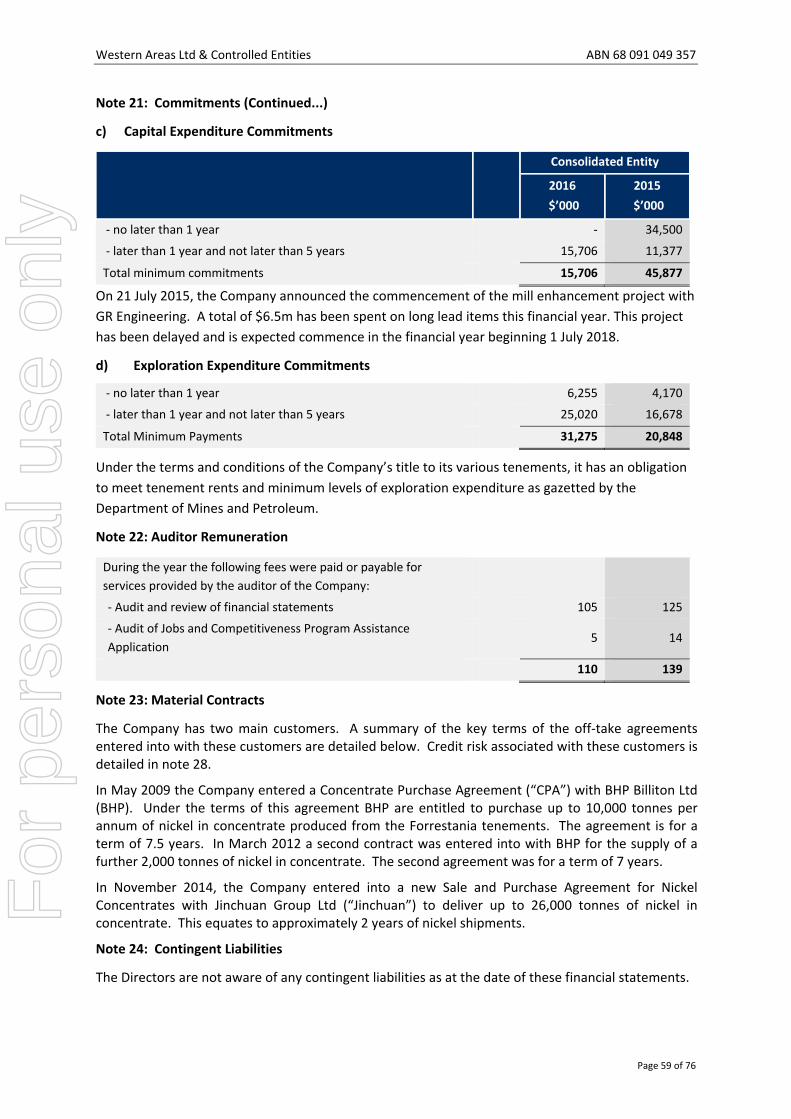
Western Areas Ltd & Controlled Entities ABN 68 091 049 357
Page 59 of 76
Note 21: Commitments (Continued...)
c) Capital Expenditure Commitments
Consolidated Entity
2016
$’000
2015
$’000
‐ no later than 1 year ‐ 34,500
‐ later than 1 year and not later than 5 years 15,706 11,377
Total minimum commitments 15,706 45,877
On 21 July 2015, the Company announced the commencement of the mill enhancement project with
GR Engineering. A total of $6.5m has been spent on long lead items this financial year. This project
has been delayed and is expected commence in the financial year beginning 1 July 2018.
d) Exploration Expenditure Commitments
‐ no later than 1 year 6,255 4,170
‐ later than 1 year and not later than 5 years 25,020 16,678
Total Minimum Payments 31,275 20,848
Under the terms and conditions of the Company’s title to its various tenements, it has an obligation
to meet tenement rents and minimum levels of exploration expenditure as gazetted by the
Department of Mines and Petroleum.
Note 22: Auditor Remuneration
During the year the following fees were paid or payable for
services provided by the auditor of the Company:
‐ Audit and review of financial statements 105 125
‐ Audit of Jobs and Competitiveness Program Assistance
Application 5 14
110 139
Note 23: Material Contracts
The Company has two main customers. A summary of the key terms of the off‐take agreements entered into with these customers are detailed below. Credit risk associated with these customers is detailed in note 28.
In May 2009 the Company entered a Concentrate Purchase Agreement (“CPA”) with BHP Billiton Ltd (BHP). Under the terms of this agreement BHP are entitled to purchase up to 10,000 tonnes per annum of nickel in concentrate produced from the Forrestania tenements. The agreement is for a term of 7.5 years. In March 2012 a second contract was entered into with BHP for the supply of a further 2,000 tonnes of nickel in concentrate. The second agreement was for a term of 7 years.
In November 2014, the Company entered into a new Sale and Purchase Agreement for Nickel Concentrates with Jinchuan Group Ltd (“Jinchuan”) to deliver up to 26,000 tonnes of nickel in concentrate. This equates to approximately 2 years of nickel shipments.
Note 24: Contingent Liabilities
The Directors are not aware of any contingent liabilities as at the date of these financial statements.
For
per
sona
l use
onl
y

Western Areas Ltd & Controlled Entities ABN 68 091 049 357
Page 60 of 76
Note 25: Subsequent Events
There have been no subsequent events after 30 June 2016 which had a material effect on the financial statements for the year ended 30 June 2016.
Note 26: Statement of Operations by Segments
Identification of reportable segment
The group identifies its operating segments based on the internal reports that are reviewed and used
by the board of directors (chief operating decision makers) in assessing performance and
determining the allocation of resources.
Basis of accounting for purposes of reporting by operating segments
Accounting policies adopted
Unless stated otherwise, all amounts reported to the Board of Directors as the chief decision maker
is in accordance with accounting policies that are consistent to those adopted in the annual financial
statements of the Group.
Note 27: Key Management Personnel
Key Management Personnel
Key management personnel of the Consolidated Entity (as defined by AASB 124: Related Party transactions) include the following:
I Macliver Chairman (Non‐Executive)
R Yeates Director (Non‐Executive)
C Readhead Director (Non‐Executive)
T Netscher Director (Non‐Executive)
J Hanna Director (Non‐Executive) (Resigned 15 June 2016)
D Lougher Managing Director
D Southam Executive Director
J Belladonna Chief Financial Officer / Company Secretary
W Jones General Manager Operations
Refer to the remuneration report contained in the Directors’ report for details of the remuneration
paid or payable to each member of the group’s key management personnel for the year ended
30 June 2016.
The total of remuneration paid to key management personnel of the Consolidated Entity during the
year is detailed below:
Consolidated Entity
2016
$’000
2015
$’000
Short term employee benefits 3,631 4,194
Share based payments 1,658 1,203
Post‐employment benefits 241 217
5,530 5,614
For
per
sona
l use
onl
y

Western Areas Ltd & Controlled Entities ABN 68 091 049 357
Page 61 of 76
Note 28: Financial Risk Management
Financial Risk Management Policies
The Treasury Committee consisting of senior management and non executive board members meets on a regular basis to analyse and discuss amongst other issues, monitoring and managing financial risk exposures of the consolidated entity. The Treasury Committee monitors the consolidated entity financial risk management policies and exposures and approves financial transactions within the scope of its authority. It also reviews the effectiveness of internal controls relating to commodity price risk, counter party credit risk, currency risk, financing risk and interest rate risk.
The Treasury Committee’s overall risk management strategy seeks to assist the consolidated entity
in meeting its financial targets, while minimising potential adverse effects on financial performance.
Its functions include the review of the use of hedging derivative instruments, credit risk policies and
future cash flow requirements.
Specific Financial Risk Exposures and Management
The main risks the Group is exposed to through its financial instruments are credit risk, liquidity risk
and market risk consisting of interest rate risk, foreign currency risk and commodity and equity price
risk.
a) Credit Risk
Credit risk refers to the risk that a counterparty will default on its contractual obligations resulting in financial loss to the consolidated entity. The consolidated entity has adopted a policy of only dealing with creditworthy counterparties as a means of mitigating the risk of financial loss from defaults.
The carrying amount of financial assets exposed to credit risk is detailed below:
Consolidated Entity
2016
$’000
2015
$’000
Cash and cash equivalents 75,706 195,355
Trade and other receivables 29,275 15,974
Financial assets at fair value through other comprehensive income 1,281 954
Derivative financial instruments 171 ‐
Cash and cash equivalents and derivative financial instruments
The credit risk on liquid funds and derivative financial instruments is limited because the counterparties are banks with high credit‐ratings.
Trade and other receivables
The consolidated entity does not have significant credit risk exposure to trade receivables as the
consolidated entity’s customers are considered to be of high credit quality. There were no balances
within trade and other receivables that are past due. It is expected these balances will be received
when due. Export sales are conducted under an irrevocable letter of credit.
Financial assets at fair value through other comprehensive income
Credit risk on financial assets at fair value through other comprehensive income is minimised by
undertaking transactions with recognised counterparties on recognised exchanges.
For
per
sona
l use
onl
y

Western Areas Ltd & Controlled Entities ABN 68 091 049 357
Page 62 of 76
Note 28: Financial Risk Management (Continued…)
b) Liquidity Risk
Liquidity risk arises from the possibility that the Group might encounter difficulty in settling its debts or otherwise meeting its obligations related to financial liabilities. The Group manages this risk through the following mechanisms which include:
preparing forward looking cash flow analysis in relation to its operational, investing and financing activities
using derivatives that are only traded in highly liquid markets
monitoring undrawn credit facilities, to the extent that they exist
obtaining funding from a variety of sources
maintaining a reputable credit profile
managing credit risk related to financial assets
investing surplus cash only with major financial institutions
comparing the maturity profile of financial liabilities with the realisation profile of financial
assets
The tables below reflect an undiscounted contractual maturity analysis for financial assets and
liabilities. Cash flows realised from financial assets reflect management’s expectation as to the
timing of realisation. Actual timing may therefore differ from that disclosed. The timing of cash flows
presented in the table to settle financial liabilities reflects the earliest contractual settlement dates
and does not reflect management’s expectations that banking facilities will be rolled forward.
Financial liability and financial asset maturity analysis
The Consolidated Entity’s contractual maturity analysis of financial assets and financial liabilities is
shown below:
For
per
sona
l use
onl
y

Western Areas Ltd & Controlled Entities ABN 68 091 049 357
Page 63 of 76
Note 28: Financial Risk Management (Continued…)
b) Liquidity Risk (Continued…)
2016 Consolidated Entity
1 year or
less
$’000
Over 1 to 5
years
$’000
More than 5
Years
$’000
Total
contractual
cash flows
$’000
Financial Assets – Non Derivative
Cash and Cash Equivalents 75,706 ‐ ‐ 75,706
Trade and Other Receivables 29,275 ‐ ‐ 29,275
Financial assets at fair value through other
comprehensive income ‐ ‐ 1,281 1,281
Financial Assets –Derivative
Derivative Collar Options (net settled) 171 ‐ ‐ 171
105,152 ‐ 1,281 106,433
Financial Liabilities – Non Derivative
Trade and Other Payables 22,723 ‐ ‐ 22,723
Lease Liabilities 196 123 319
22,919 123 ‐ 23,042
Net Financial Assets/(Liabilities) 82,233 (123) 1,281 83,391
2015 Consolidated Entity
1 year or
less
$’000
Over 1 to 5
years
$’000
More than 5
Years
$’000
Total
contractual
cash flows
$’000
Financial Assets – Non Derivative
Cash and Cash Equivalents 195,355 ‐ ‐ 195,355
Trade and Other Receivables 15,974 ‐ ‐ 15,974
Financial assets at fair value through other
comprehensive income ‐ ‐ 954 954
211,329 ‐ 954 212,283
Financial Liabilities – Non Derivative
Trade and Other Payables 29,364 ‐ ‐ 29,364
Convertible Bonds 125,000 ‐ ‐ 125,000
Insurance funding 1,568 ‐ ‐ 1,568
Lease Liabilities 218 210 428
Financial Liabilities –Derivative
Derivative Collar Options (net settled) 224 ‐ ‐ 224
156,374 210 ‐ 156,584
Net Financial Assets/(Liabilities) 54,955 (210) 954 55,699
For
per
sona
l use
onl
y

Western Areas Ltd & Controlled Entities ABN 68 091 049 357
Page 64 of 76
Note 28: Financial Risk Management (Continued…)
c) Market Risk
Market risk is the risk that the fair value or future cash flows of a financial instrument will fluctuate
because of changes in market prices. Market risk comprises three types of risk: interest rate risk,
price risk and currency risk.
i) Interest Rate Risk
Exposure to interest rate risk arises on financial assets and financial liabilities recognised at reporting
date whereby a future change in interest rates will affect future cash flows or the fair value of fixed
rate financial instruments. Interest rate risk is managed using a mix of fixed and floating rate debt.
At the reporting date, the interest rate risk profile of the consolidated entity’s interest bearing
financial instruments was as follows:
2016 Consolidated Entity
Floating
Interest
Rate
$’000
Fixed Interest maturing in: Non‐
Interest
Bearing
$’000
Total
$’000
Weighted
Average
Interest
Rate
1 year or
less
$’000
Over
1 to 5
years
$’000
More
than 5
Years
$’000
Financial Assets
Cash and Cash Equivalents 75,706 ‐ ‐ ‐ ‐ 75,706 2.9%
Trade and Other
Receivables ‐ ‐ ‐ ‐ 29,275 29,275
Financial assets at fair
value through other
comprehensive income
‐ ‐ ‐ ‐ 1,281 1,281
75,706 ‐ ‐ ‐ 30,556 106,262
Financial Liabilities
Trade and Other Payables ‐ ‐ ‐ (22,723) (22,723)
Lease liability ‐ (196) (123) ‐ ‐ (319) 5.1%
‐ (196) (123) ‐ (22,723) (23,042)
Net Financial Assets /
(Liabilities) 75,706 (196) (123) ‐ 7,833 83,220
For
per
sona
l use
onl
y

Western Areas Ltd & Controlled Entities ABN 68 091 049 357
Page 65 of 76
Note 28: Financial Risk Management (Continued…)
c) Market Risk (Continued...)
i) Interest Rate Risk (Continued...)
2015 Consolidated Entity
Floating
Interest
Rate
$’000
Fixed Interest maturing in: Non‐
Interest
Bearing
$’000
Total
$’000
Weighted
Average
Interest
Rate
1 year or
less
$’000
Over 1 to
5 years
$’000
More
than 5
Years
$’000
Financial Assets
Cash and Cash Equivalents 195,355 195,355 2.0%
Trade and Other
Receivables 15,974 15,974
Financial assets at fair
value through other
comprehensive income
954 954
195,355 ‐ ‐ ‐ 16,928 212,283
Financial Liabilities
Trade and Other Payables ‐ ‐ ‐ ‐ (29,786) (29,786)
Convertible bonds ‐ (125,000) ‐ ‐ ‐ (125,000) 6.4%
Insurance funding ‐ (1,568) ‐ ‐ ‐ (1,568) 2.5%
Lease liability ‐ (218) (210) ‐ ‐ (428) 5.1%
‐ (126,786) (210) ‐ (29,786) (156,782)
Net Financial Assets /
(Liabilities) 195,355 (126,786) (210) ‐ (12,858) 55,501
Interest rate sensitivities have not been included in the financial report as the changes in profit
before tax due to changes in interest rate is not material to the results of the Consolidated Entity.
ii) Price Risk
a) Equity Price Risk
The consolidated entity is exposed to equity securities price risk. This arises from investments held by the Group and classified on the statement of financial position as financial assets at fair value through other comprehensive income.
A majority of the consolidated entity’s equity investments are publicly traded and are quoted either on the ASX or the TSX.
The table below summarises the impact of increases/decreases of these two indexes on the
Consolidated Entity's comprehensive income. The analysis is based on the assumption that the
equity indexes had increased by 10% / decreased by 10% (2015 – increased by 10% / decreased by
10%) and foreign exchange rate increased by 5% / decrease by 5% (2015 increased by 5% / decrease
by 5%) with all other variables held constant and all the Consolidated Entity’s equity instruments
moved according to the historical correlation with the index. The percentages are the sensitivity
rates used when reporting equity price risk internally to key management personnel and represents
management’s assessment of the possible change in equity prices.
For
per
sona
l use
onl
y
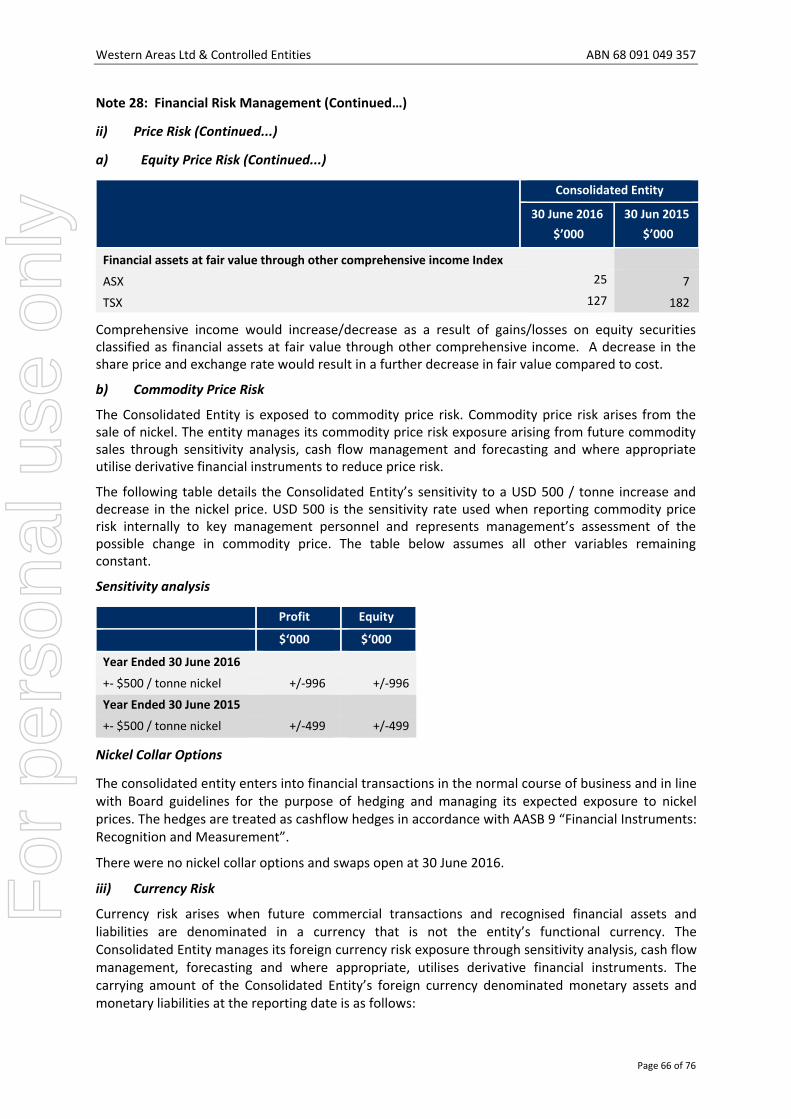
Western Areas Ltd & Controlled Entities ABN 68 091 049 357
Page 66 of 76
Note 28: Financial Risk Management (Continued…)
ii) Price Risk (Continued...)
a) Equity Price Risk (Continued...)
Consolidated Entity
30 June 2016
$’000
30 Jun 2015
$’000
Financial assets at fair value through other comprehensive income Index
ASX 25 7
TSX 127 182
Comprehensive income would increase/decrease as a result of gains/losses on equity securities classified as financial assets at fair value through other comprehensive income. A decrease in the share price and exchange rate would result in a further decrease in fair value compared to cost.
b) Commodity Price Risk
The Consolidated Entity is exposed to commodity price risk. Commodity price risk arises from the sale of nickel. The entity manages its commodity price risk exposure arising from future commodity sales through sensitivity analysis, cash flow management and forecasting and where appropriate utilise derivative financial instruments to reduce price risk.
The following table details the Consolidated Entity’s sensitivity to a USD 500 / tonne increase and decrease in the nickel price. USD 500 is the sensitivity rate used when reporting commodity price risk internally to key management personnel and represents management’s assessment of the possible change in commodity price. The table below assumes all other variables remaining constant.
Sensitivity analysis
Profit Equity
$‘000 $‘000
Year Ended 30 June 2016
+‐ $500 / tonne nickel +/‐996 +/‐996
Year Ended 30 June 2015
+‐ $500 / tonne nickel +/‐499 +/‐499
Nickel Collar Options
The consolidated entity enters into financial transactions in the normal course of business and in line with Board guidelines for the purpose of hedging and managing its expected exposure to nickel prices. The hedges are treated as cashflow hedges in accordance with AASB 9 “Financial Instruments: Recognition and Measurement”.
There were no nickel collar options and swaps open at 30 June 2016.
iii) Currency Risk
Currency risk arises when future commercial transactions and recognised financial assets and liabilities are denominated in a currency that is not the entity’s functional currency. The Consolidated Entity manages its foreign currency risk exposure through sensitivity analysis, cash flow management, forecasting and where appropriate, utilises derivative financial instruments. The carrying amount of the Consolidated Entity’s foreign currency denominated monetary assets and monetary liabilities at the reporting date is as follows:
For
per
sona
l use
onl
y
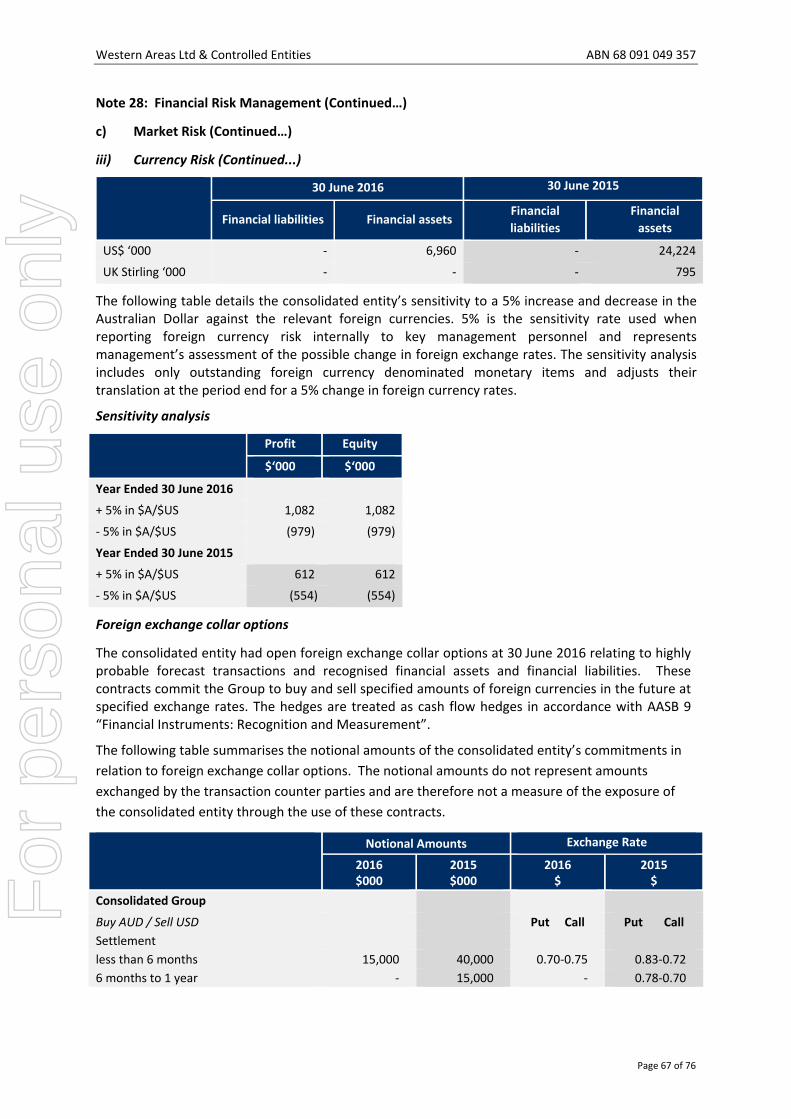
Western Areas Ltd & Controlled Entities ABN 68 091 049 357
Page 67 of 76
Note 28: Financial Risk Management (Continued…)
c) Market Risk (Continued…)
iii) Currency Risk (Continued...)
30 June 2016 30 June 2015
Financial liabilities Financial assets Financial
liabilities
Financial
assets
US$ ‘000 ‐ 6,960 ‐ 24,224
UK Stirling ‘000 ‐ ‐ ‐ 795
The following table details the consolidated entity’s sensitivity to a 5% increase and decrease in the Australian Dollar against the relevant foreign currencies. 5% is the sensitivity rate used when reporting foreign currency risk internally to key management personnel and represents management’s assessment of the possible change in foreign exchange rates. The sensitivity analysis includes only outstanding foreign currency denominated monetary items and adjusts their translation at the period end for a 5% change in foreign currency rates.
Sensitivity analysis
Profit Equity
$‘000 $‘000
Year Ended 30 June 2016
+ 5% in $A/$US 1,082 1,082
‐ 5% in $A/$US (979) (979)
Year Ended 30 June 2015
+ 5% in $A/$US 612 612
‐ 5% in $A/$US (554) (554)
Foreign exchange collar options
The consolidated entity had open foreign exchange collar options at 30 June 2016 relating to highly probable forecast transactions and recognised financial assets and financial liabilities. These contracts commit the Group to buy and sell specified amounts of foreign currencies in the future at specified exchange rates. The hedges are treated as cash flow hedges in accordance with AASB 9 “Financial Instruments: Recognition and Measurement”.
The following table summarises the notional amounts of the consolidated entity’s commitments in
relation to foreign exchange collar options. The notional amounts do not represent amounts
exchanged by the transaction counter parties and are therefore not a measure of the exposure of
the consolidated entity through the use of these contracts.
Notional Amounts Exchange Rate
2016 $000
2015 $000
2016 $
2015 $
Consolidated Group
Buy AUD / Sell USD Put Call Put Call
Settlement
less than 6 months 15,000 40,000 0.70‐0.75 0.83‐0.72
6 months to 1 year ‐ 15,000 ‐ 0.78‐0.70
For
per
sona
l use
onl
y

Western Areas Ltd & Controlled Entities ABN 68 091 049 357
Page 68 of 76
Note 28: Financial Risk Management (Continued…)
d) Net fair values
The fair values of financial assets and financial liabilities are presented in the following table and can
be compared to their carrying values as presented in the balance sheet. Fair values are those
amounts at which an asset could be exchanged, or a liability settled, between knowledgeable, willing
parties in an arm’s length transaction.
Fair values derived may be based on information that is estimated or subject to judgment, where
changes in assumptions may have a material impact on the amounts estimated. Areas of judgment
and the assumptions have been detailed below. Where possible, valuation information used to
calculate fair value is extracted from the market, with more reliable information available from
markets that are actively traded. In this regard, fair values for listed securities are obtained from
quoted market bid prices. Where securities are unlisted and no market quotes are available, fair
value is obtained using discounted cash flow analysis and other valuation techniques commonly
used by market participants.
Differences between fair values and carrying values of financial instruments with fixed interest rates
are due to the change in discount rates being applied by the market since their initial recognition by
the Group. Most of these instruments which are carried at amortised cost are to be held until
maturity and therefore the net fair value figures calculated bear little relevance to the Group.
2016 2015
Carrying
Amount
$’000
Net Fair
Value
$’000
Carrying
Amount
$’000
Net Fair
Value
$’000
Financial Assets
Cash and cash equivalents (i) 75,706 75,706 195,355 195,355
Financial assets at fair value through other
comprehensive income (ii) 1,281 1,281 954 954
Derivative financial assets (iii) 171 171 ‐ ‐
Loans and receivables (i) 29,275 29,275 15,974 15,974
106,433 106,433 212,283 212,283
Financial Liabilities
Trade and other payables (i) 22,723 22,723 29,364 29,364
Convertible bonds ‐ ‐ 125,000 125,000
Derivative financial liabilities (iii) ‐ ‐ 224 224
Insurance premium facility ‐ ‐ 1,568 1,568
Other liabilities (i) 319 319 428 428
23,042 23,042 156,584 156,584
The fair values disclosed in the above table have been determined based on the following
methodologies:
i) Cash and cash equivalents, trade and other receivables and trade and other liabilities are short‐term instruments in nature whose carrying value is equivalent to fair value. Trade and other payables exclude amounts provided for annual leave, which is not considered a financial instrument.
ii) Quoted closing bid prices at reporting date. iii) Fair valuation performed by financial risk management firm which include valuation
techniques incorporating observable market data relevant to the hedged position.
For
per
sona
l use
onl
y

Western Areas Ltd & Controlled Entities ABN 68 091 049 357
Page 69 of 76
Note 28: Financial Risk Management (Continued…)
Financial Instruments Measured at Fair Value
The financial instruments recognised at fair value in the statement of financial position have been
analysed and classified using a fair value hierarchy reflecting the significance of the inputs used in
making the measurements. The fair value hierarchy consists of the following levels:
‐ quoted prices in active markets for identical assets or liabilities (Level 1);
‐ inputs other than quoted prices included within Level 1 that are observable for the asset or
liability, either directly (as prices) or indirectly (derived from prices) (Level 2); and
‐ inputs for the asset or liability that are not based on observable market data (unobservable
inputs) (Level 3).
Level 1
$000
Level 2
$000
Level 3
$000
Total
$000
2016
Financial assets:
Financial assets at fair value through other
comprehensive income 1,281 ‐ ‐ 1,281
Derivative financial instruments 171 171
1,281 171 ‐ 1,452
2015
Financial assets:
Financial assets at fair value through other
comprehensive income 954 ‐ ‐ 954
Financial liabilities
Derivative financial instruments ‐ 224 ‐ 224
Note 29: Related Party Transactions
There were no other related party transactions during the financial year other than those included in the key management compensation as disclosed in the Remuneration Report contained in the Directors’ Report.
Note 30: Share Based Payments
(a) Expenses arising from share based transactions
Consolidated Entity
2016
$’000
2015
$’000
Equity settled share options and performance rights granted during:
Year ended 30 June 2016 655 ‐
Year ended 30 June 2015 898 551
Year ended 30 June 2014 954 761
Year ended 30 June 2013 ‐ 257
Total expense recognised as employee costs 2,507 1,569
For
per
sona
l use
onl
y
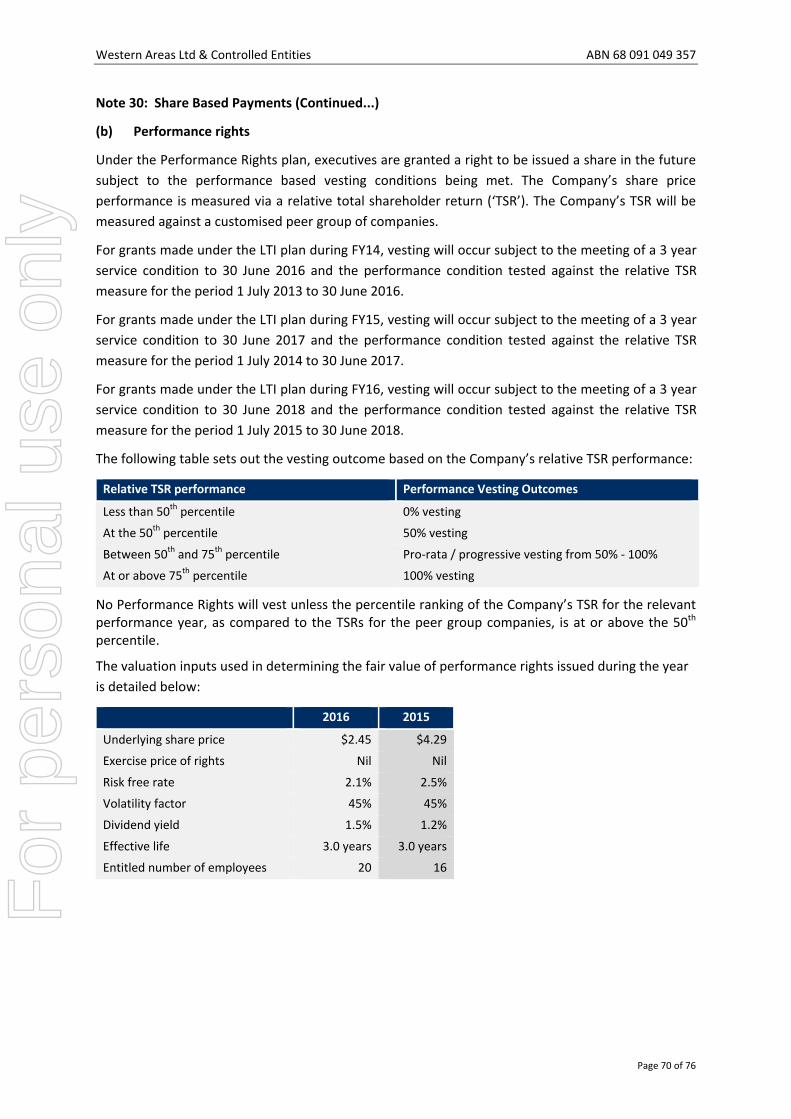
Western Areas Ltd & Controlled Entities ABN 68 091 049 357
Page 70 of 76
Note 30: Share Based Payments (Continued...)
(b) Performance rights
Under the Performance Rights plan, executives are granted a right to be issued a share in the future
subject to the performance based vesting conditions being met. The Company’s share price
performance is measured via a relative total shareholder return (‘TSR’). The Company’s TSR will be
measured against a customised peer group of companies.
For grants made under the LTI plan during FY14, vesting will occur subject to the meeting of a 3 year
service condition to 30 June 2016 and the performance condition tested against the relative TSR
measure for the period 1 July 2013 to 30 June 2016.
For grants made under the LTI plan during FY15, vesting will occur subject to the meeting of a 3 year
service condition to 30 June 2017 and the performance condition tested against the relative TSR
measure for the period 1 July 2014 to 30 June 2017.
For grants made under the LTI plan during FY16, vesting will occur subject to the meeting of a 3 year
service condition to 30 June 2018 and the performance condition tested against the relative TSR
measure for the period 1 July 2015 to 30 June 2018.
The following table sets out the vesting outcome based on the Company’s relative TSR performance:
Relative TSR performance Performance Vesting Outcomes
Less than 50th percentile 0% vesting
At the 50th percentile 50% vesting
Between 50th and 75th percentile Pro‐rata / progressive vesting from 50% ‐ 100%
At or above 75th percentile 100% vesting
No Performance Rights will vest unless the percentile ranking of the Company’s TSR for the relevant performance year, as compared to the TSRs for the peer group companies, is at or above the 50th percentile.
The valuation inputs used in determining the fair value of performance rights issued during the year
is detailed below:
2016 2015
Underlying share price $2.45 $4.29
Exercise price of rights Nil Nil
Risk free rate 2.1% 2.5%
Volatility factor 45% 45%
Dividend yield 1.5% 1.2%
Effective life 3.0 years 3.0 years
Entitled number of employees 20 16
For
per
sona
l use
onl
y

Western Areas Ltd & Controlled Entities ABN 68 091 049 357
Page 71 of 76
Note 30: Share Based Payments (Continued...)
(b) Performance rights (Continued...)
Performance Rights held by Key Management Personnel at 30 June 2016
Balance at
1 July 2015
Granted as
Remuneration
Exercise of
Performance
Rights
Lapsed /
Cancelled /
Other
Balance at
30 June 2016
Performance
Rights
Vested
D Lougher 965,690 299,750 (294,800) ‐ 970,640 ‐
D Southam 448,990 168,640 (165,900) 94,363 546,093 ‐
J Belladonna 346,223 113,630 (104,074) ‐ 355,779 ‐
W Jones 271,247 81,710 (83,476) ‐ 269,481 ‐
TOTAL 2,032,150 663,730 (648,250) 94,363 2,141,993 ‐
Performance Rights held by Key Management Personnel at 30 June 2015
Balance at
1 July 2014
Granted as
Remuneration
Exercise of
Performance
Rights
Expired /
Lapsed /
Cancelled
Balance at
30 June 2015
Performance
Rights
Vested
D Lougher 836,971 205,140 (76,421) ‐ 965,690 ‐
D Southam 434,465 86,560 (72,035) ‐ 448,990 ‐
J Belladonna 270,584 118,859 (43,220) ‐ 346,223 ‐
W Jones 149,396 121,851 ‐ ‐ 271,247 ‐
TOTAL 1,691,416 532,410 (191,676) ‐ 2,032,150 ‐
(c) Option Plans
There were no options outstanding as at 30 June 2016.
Note 31: Reserves
(i) Share Based Payment reserve
The share based payment reserve records the items recognised as expenses on valuation of
employee share options and performance rights.
(ii) Hedge reserve
The hedge reserve records revaluations of items designated as hedges.
(iii) Investment Revaluation reserve
The investment revaluation reserve records revaluations of financial assets at fair value through
other comprehensive income.
(iv) Convertible Bond Reserve
The Convertible bond reserve records the equity proportion value of the convertible bonds.
(v) Foreign Exchange Reserve
The reserve is used to recognise exchange differences arising from translation of the financial statements of foreign operations to Australian dollars.
For
per
sona
l use
onl
y

Western Areas Ltd & Controlled Entities ABN 68 091 049 357
Page 72 of 76
Note 32: Interests in Subsidiaries
The consolidated financial statements incorporate the assets, liabilities and results of the following
wholly‐owned subsidiaries in accordance with the accounting policy described in note 1:
Name Country of Incorporation Percentage of equity held
2016 2015
Western Platinum NL Australia 100% 100%
Australian Nickel Investments Pty Ltd Australia 100% 100%
Bioheap Ltd Australia 100% 100%
Western Areas Nickel Pty Ltd Australia 100% 100%
Western Areas Employee Share Trust Australia 100% 100%
All the entities above are members of the tax consolidated group of which Western Areas Ltd is the
head entity. Western Areas Ltd is the parent entity and is incorporated and domiciled in Australia.
Note 33: Parent Information
The following information has been extracted from the books of the parent and has been prepared
in accordance with the accounting standards.
Statement of Financial Position
Parent Entity
2016
$’000
2015
$’000
Assets
Current Assets 118,016 236,312
Non Current Assets 405,697 398,112
Total Assets 523,713 634,424
Liabilities
Current Liabilities 25,726 169,761
Non Current Liabilities 42,973 45,227
Total Liabilities 68,699 214,988
Net Assets 455,014 419,436
Equity
Issued capital 442,963 369,936
Reserves 15,403 31,565
Retained Earnings (3,352) 17,935
Total Equity 455,014 419,436
Statement of Comprehensive (Loss)/Income
(Loss)/profit for the year (31,097) 37,371
Total comprehensive (loss)/income for the year (30,376) 38,340
Guarantees
Western Areas Ltd has not entered into any guarantees, in the current or previous financial year, in
relation to the debts of its subsidiaries.
For
per
sona
l use
onl
y

Western Areas Ltd & Controlled Entities ABN 68 091 049 357
Page 73 of 76
Note 33: Parent Information (Continued...)
Contingent Liabilities
The Directors are not aware of any contingent liabilities as at the date of these financial
statements.
Contractual Commitments
Refer to Note 21, all commitments were entered into by Western Areas Ltd.
Note 34: Additional Company Information
Western Areas Ltd is a Public Company, incorporated and domiciled in Australia.
Registered office and Principal place of business:
Level 2
2 Kings Park Road
West Perth WA 6005
Tel: +61 8 9334 7777
Fax: +61 8 9486 7866
Web: www.westernareas.com.au
Email: [email protected]
For
per
sona
l use
onl
y

Western Areas Ltd & Controlled Entities ABN 68 091 049 357
Page 74 of 76
DIRECTORS DECLARATION
1. In the opinion of the Directors of Western Areas Ltd:
(a) the Consolidated Entity’s financial statements and notes set out on pages 24 to 73 are in accordance with the Corporations Act 2001, including:
(i) giving a true and fair view of the Consolidated Entity’s financial position as at 30 June 2016 and of its performance, for the financial year ended on that date; and
(ii) complying with Australian Accounting Standards and the Corporations Regulations 2001;
(b) the financial report also complies with International Financial Reporting Standards as set out in note 1;
(c) the remuneration disclosures that are contained in the remuneration report in the Directors’ report comply with Australian Accounting Standard AASB 124 Related Party Disclosures, the Corporations Act 2001 and the Corporations Regulations 2001;
(d) there are reasonable grounds to believe that the Consolidated Entity will be able to pay its debts as and when they become due and payable.
2. the Directors have been given the declarations required by Section 295A of the Corporations Act 2001 from the Chief Executive Officer, Managing Director, Executive Director and Chief Financial Officer for the financial year ended 30 June 2016.
Signed in accordance with a resolution of the Board of Directors.
D Lougher
Managing Director
Dated – 25 August 2016
For
per
sona
l use
onl
y

Western Areas Ltd & Controlled Entities ABN 68 091 049 357
Page 75 of 76
INDEPENDANT AUDITOR’S OPINION
For
per
sona
l use
onl
y

Western Areas Ltd & Controlled Entities ABN 68 091 049 357
Page 76 of 76
For
per
sona
l use
onl
y