appendix 4d asx 20 february - investor.qantas.com · appendix 4d and consolidated interim financial...
TRANSCRIPT

QANTAS AIRWAYS LIMITED AND CONTROLLED ENTITIES
APPENDIX 4D AND
CONSOLIDATED INTERIM FINANCIAL REPORT
FOR THE HALF-YEAR ENDED
31 DECEMBER 2018
ABN 16 009 661 901
ASX CODE: QAN
QANTAS AIRWAYS LIMITED
ABN 16 009 661 901
Page 1
Table of Contents
ASX APPENDIX 4D Results for Announcement to the Market 2
Other Information 2
DIRECTORS’ REPORT
Directors 4
Review of Operations 5
CONSOLIDATED INTERIM FINANCIAL REPORT
Consolidated Income Statement 15
Consolidated Statement of Comprehensive Income 16
Consolidated Balance Sheet 17
Consolidated Statement of Changes in Equity 18
Consolidated Cash Flow Statement 20
Condensed Notes to the Consolidated Interim Financial Report 21
Lead Auditor’s Independence Declaration 36
Directors’ Declaration 37
Independent Auditor’s Review Report to the Members of Qantas Airways Limited 38
ADDITIONAL INFORMATION
Operational Statistics 39

QANTAS AIRWAYS LIMITED ASX APPENDIX 4D ABN 16 009 661 901 HALF-YEAR ENDED 31 DECEMBER 2018
Page 2
Results for Announcement to the Market Qantas Airways Limited (Qantas) and its controlled entities (the Qantas Group or Group) Results for Announcement to the Market are detailed below.
December 2018
$M
December 2017 (restated)
$M
Change
$M
Change
%
Revenue and other income 9,206 8,699 507 5.8
Statutory profit after tax 498 595 (97) (16.3)
Statutory profit after tax attributable to members of Qantas 498 595 (97) (16.3)
Underlying profit before tax 780 959 (179) (18.7)
DIVIDENDS AND OTHER SHAREHOLDER DISTRIBUTIONS
(A) Dividends disclosed and paid
In February 2019, the Directors declared a fully franked interim dividend of 12 cents per ordinary share, totalling $195 million. The record date for determining entitlements to the interim dividend is 5 March 2019. The dividend will be paid on 28 March 2019.
During the period ended 31 December 2018, the Group paid a fully franked dividend of 10 cents per ordinary share, totalling $168 million on 10 October 2018.
(B) Other shareholder distributions
In February 2019, the Directors announced an on-market share buy-back of up to $305 million.
During the half-year ended 31 December 2018, the Group completed an on-market share buy-back of $332 million, which was announced in August 2018. The Group purchased 57.9 million ordinary shares on issue at an average share price of $5.73.
EXPLANATION OF RESULTS
Please refer to the Review of Operations for explanation of the results. This information should be read in conjunction with the Consolidated Annual Financial Report of the Qantas Group for the year ended 30 June 2018. This report should also be read in conjunction with any public announcements made by Qantas in accordance with the continuous disclosure requirements arising under the Corporations Act 2001 and ASX Listing Rules.
The information provided in this report contains all the information required by ASX Listing Rule 4.2A.
Other Information
December 2018 June 2018 (restated)
Net assets per ordinary share1 $ 2.07 2.20
Net tangible assets per ordinary share1 $ 1.82 2.10
December 2018 December 2017
(restated)
Basic earnings per share (Statutory Earnings per share)2 cents 30.0 33.3
Diluted earnings per share2 cents 30.0 33.3
Underlying Earnings per share3 cents 31.8 38.0
1 Based on number of shares outstanding at the end of the period. 2 Based on the weighted average number of shares outstanding during the period. 3 Underlying Earnings per share is calculated as Underlying Profit Before Tax less tax expense (based on the Group’s effective tax rate of 32.2 per cent (2018: 29.2 per cent)) divided by the weighted average
number of shares outstanding during the period.

QANTAS AIRWAYS LIMITED ASX APPENDIX 4D ABN 16 009 661 901 HALF-YEAR ENDED 31 DECEMBER 2018
Page 3
Other Information continued
ENTITIES OVER WHICH CONTROL, JOINT CONTROL OR SIGNIFICANT INFLUENCE WAS GAINED OR LOST DURING THE PERIOD
The Qantas Group disposed of/deregistered the following entities during the period:
Q Catering Limited (disposed of on 31 October 2018)
Qantas Catering Group Limited (disposed of on 31 October 2018)
Snap Fresh Pty Limited (disposed of on 31 October 2018)
QF A320 2014 No.1 Pty Limited (deregistered on 13 January 2019)1
QF A320 2014 No.2 Pty Limited (deregistered on 13 January 2019)1
QF A320 2014 No.3 Pty Limited (deregistered on 13 January 2019)1
QF A320 2014 No.4 Pty Limited (deregistered on 13 January 2019)1
1 Application for deregistration lodged with ASIC in November 2018.
OWNERSHIP INTEREST IN INVESTMENTS ACCOUNTED FOR UNDER THE EQUITY METHOD
December
2018
June
2018
% %
Fiji Resorts Pte Limited 21 21
Hallmark Aviation Services L.P. 49 49
HT & T Travel Philippines, Inc. 28 28
Holiday Tours and Travel (Thailand) Ltd 37 37
Holiday Tours and Travel Vietnam Co. Ltd 37 37
Holiday Tours and Travel (GSA) Ltd 37 37
Helloworld Limited1 15 17
Jetstar Japan Co. Ltd. 33 33
Jetstar Pacific Airlines Aviation Joint Stock Company 30 30
PT Holidays Tours & Travel 37 37
1 The Group’s shareholding reduced to 15.4 per cent following the sale of two million shares on 28 September 2018 at $5.50 per share.
QANTAS AIRWAYS LIMITED DIRECTORS’ REPORT ABN 16 009 661 901 HALF-YEAR ENDED 31 DECEMBER 2018
Page 4
The Directors present their report together with the Consolidated Interim Financial Report for the half-year ended 31 December 2018and the Independent Auditor's Review Report thereon.
Directors
The Directors of Qantas Airways Limited at any time during or since the end of the half-year were as follows:
Name Period of Directorship
Richard Goyder, AO Chairman
Current, appointed 17 November 2017 – appointed Chairman 26 October 2018
Leigh Clifford, AO Ceased. Appointed 9 August 2007 – appointed Chairman 14 November 2007. Ceased 26 October 2018
Alan Joyce, AC Chief Executive Officer
Current, appointed 28 July 2008 – appointed Chief Executive Officer
28 November 2008
Maxine Brenner Current, appointed 29 August 2013
Richard Goodmanson Current, appointed 19 June 2008
Jacqueline Hey Current, appointed 29 August 2013
Belinda Hutchinson, AM Current, appointed 12 April 2018
Michael L’Estrange, AO Current, appointed 7 April 2016
Antony Tyler Current, appointed 26 October 2018
Paul Rayner Current, appointed 16 July 2008
Todd Sampson Current, appointed 25 February 2015
Barbara Ward, AM Current, appointed 19 June 2008

QANTAS AIRWAYS LIMITED DIRECTORS’ REPORT ABN 16 009 661 901 HALF-YEAR ENDED 31 DECEMBER 2018
Page 5
Review of Operations For the half-year ended 31 December 2018
RESULT HIGHLIGHTS
The Qantas Group applied AASB 15 Revenue from Contracts with Customers from 1 July 2018. The results for the six months to 31 December 2017 have been restated on the same basis for comparison purposes.
The Qantas Group reported an Underlying Profit Before Tax1 (PBT) of $780 million for the six months ended 31 December 2018, a decrease of $179 million from the first half of 2017/18 as revenue strength substantially offset the headwinds of a $416 million increase in fuel costs, and other increases in costs associated with FX on non-fuel costs, selling costs on higher revenue and depreciation.
The Group’s Statutory Profit Before Tax of $735 million decreased by $105 million from the first half of 2017/18, with the Statutory result for the first half of 2018/19 including $45 million of net costs which were not included in Underlying PBT. These costs included transformation costs such as those associated with the introduction of the Dreamliner fleet, redundancies, discretionary non-executive employee bonuses, offset by the net gain on the sale of the catering business and the reversal of the impairment of an associate. This compares with $119 million of costs which were not included in Underlying PBT from the first half of 2017/18.
Fuel costs increased compared to the prior corresponding period and the Group moved rapidly to substantially offset this headwind. Capacity discipline in the domestic market supported record performances from Group Domestic2, Qantas Domestic and Jetstar Domestic. The international businesses3 have a more significant exposure to higher fuel costs and operate in highly competitive markets which dampened the ability to recover these costs. The fundamentals of Qantas International and Jetstar’s international businesses remain strong with revenue increases helping to deliver resilient earnings in the face of significant fuel and foreign exchange headwinds. Qantas Loyalty successfully navigated the credit card interchange fee changes, growing and diversifying earnings through both the coalition and new businesses to deliver another record result.
Financial highlights for the first half 2018/19 are: – Statutory earnings per share of 30.0 cents per share, reflecting current earnings and the accretive benefit of the on-market share
buy-back – Continued strong Group Return on Invested Capital (ROIC)4 of 19.3 per cent compared with 20.7 per cent for the same time in 2017/18 – All operating segments delivering ROIC greater than the Group’s Weighted Average Cost of Capital (WACC)5 – Record results in Group Domestic, Qantas Domestic, Jetstar Domestic and Qantas Loyalty – Ongoing transformation is on track to deliver gross benefits of greater than $400 million in 2018/19 with $206 million delivered as at
31 December 2018
The balance sheet remains strong with Net Debt6 at $5.2 billion, which is at the bottom of the target Net Debt range of $5.2 billion to $6.5 billion. The Group’s strong cash flow generation ability delivered $1.3 billion in operating cash flow, lower than the prior corresponding period due to temporary working capital movements and timing of option premium outflows. The first half of 2017/18 benefited from reduced outflows while the first half 2018/19 incurred additional outflows to hedge the Group’s 2019/20 financial year fuel cost. $1.0 billion was invested in the business and $500 million of surplus capital returned to shareholders through a 10 cents per share fully franked dividend, totalling $168 million and an on-market share buy-back of $332 million.
With all the targets of the Group’s financial framework met, a disciplined approach to capital investment and strong net free cash flow of $218 million, the Board resolved to distribute up to a further $500 million of surplus capital to shareholders, through an increase in the base dividend per half from 10 to 12 cents per share fully franked interim dividend totalling $195 million and an additional on-market share buy-back of up to $305 million.
1 Underlying Profit Before Tax (Underlying PBT) is the primary reporting measure used by the Qantas Group’s chief operating decision-making bodies, being the Chief Executive Officer, Group Management
Committee and the Board of Directors, for the purpose of assessing the performance of the Group. The primary reporting measure of the Qantas International, Qantas Domestic, Jetstar Group and Qantas Loyalty operating segments is Underlying Earnings Before Net Finance Costs and Income Tax Expense (Underlying EBIT). The primary reporting measure of the Corporate segment is Underlying PBT as net finance costs are managed centrally. Refer to the reconciliation of Underlying PBT to Statutory Profit/(Loss) Before Tax on page 12.
2 Group Domestic includes Qantas Domestic and Jetstar Domestic. 3 International businesses or Group International includes Qantas International, Jetstar International Australian operations, Jetstar New Zealand (including Jetstar Regionals), Jetstar Asia (Singapore) and the
contributions from Jetstar Japan and Jetstar Pacific. 4 Return on Invested Capital is calculated as ROIC EBIT for the 12 months ended 31 December, divided by the 12 month Average Invested Capital. ROIC EBIT is derived by adjusting Underlying EBIT for the
period to exclude non-cancellable aircraft operating lease rentals and include notional depreciation for these aircraft to account for them as if they are owned aircraft. 5 Weighted Average Cost of Capital is calculated on a pre-tax basis. 6 Net Debt under the Group’s Financial Framework includes net on balance sheet debt and off balance sheet aircraft operating lease liabilities.
Underlying Profit Before Tax Statutory Profit After Tax Twelve-month Return on Invested Capital
1H19 780 1H19 498 1H19 19.3%
1H18 959 1H18 595 1H18 20.7%
1H17 852 1H17 515 1H17 21.7%
1H16 921 1H16 688 1H16 22.8%
498780 19.31H19
1H18
1H17
1H16
$M
1H19
1H18
1H17
1H16
%
1H19
1H18
1H17
1H16
$M
QANTAS AIRWAYS LIMITED DIRECTORS’ REPORT ABN 16 009 661 901 HALF-YEAR ENDED 31 DECEMBER 2018
Page 6
Review of Operations continued
For the half-year ended 31 December 2018
FINANCIAL FRAMEWORK ALIGNED WITH SHAREHOLDER OBJECTIVES
Qantas’ Financial Framework aligns our objectives with those of our shareholders. With the aim of generating maintainable Earnings per Share (EPS) growth over the cycle, which in turn should generate Total Shareholder Return (TSR) in the top quartile of the ASX100 and a basket of global airlines7. The Financial Framework has three clear priorities and associated long-term targets:
1. Maintaining an Optimal Capital Structure 2. ROIC > WACC8 Through the Cycle 3. Disciplined Allocation of Capital
Minimise cost of capital by targeting a Net Debt range of $5.2 billion to $6.5 billion9
Deliver ROIC > 10 per cent10 through the cycle
Grow Invested Capital with disciplined investment, return surplus capital
Maintaining an Optimal Capital Structure
– The Group’s Financial Framework targets an optimal capital structure to achieve the lowest cost of capital. This results in a Net Debt range of between $5.2 billion and $6.5 billion, based on the current average Invested Capital of approximately $8.9 billion. It is defined as Net Debt/ROIC EBITDA range of 2.0-2.5 times. This capital structure lowers the Group’s cost of capital, preserves financial strength and therefore enhances long-term shareholder value.
– Net Debt was $5.2 billion as at 31 December 2018, at the bottom of the Group’s target range. – Capital allocation decisions, including distributions to shareholders, are sized to ensure Net Debt remains within the target Net Debt
range on a forward looking basis. – The Group’s optimal capital structure is consistent with investment grade credit metrics. The Group is rated Baa2 with Moody’s Investor
Services.
ROIC > WACC Through the Cycle
The rolling twelve month Return on Invested Capital (ROIC) of 19.3 per cent was above the Group’s threshold ROIC of 10 per cent. The current average Invested Capital is approximately $8.9 billion.
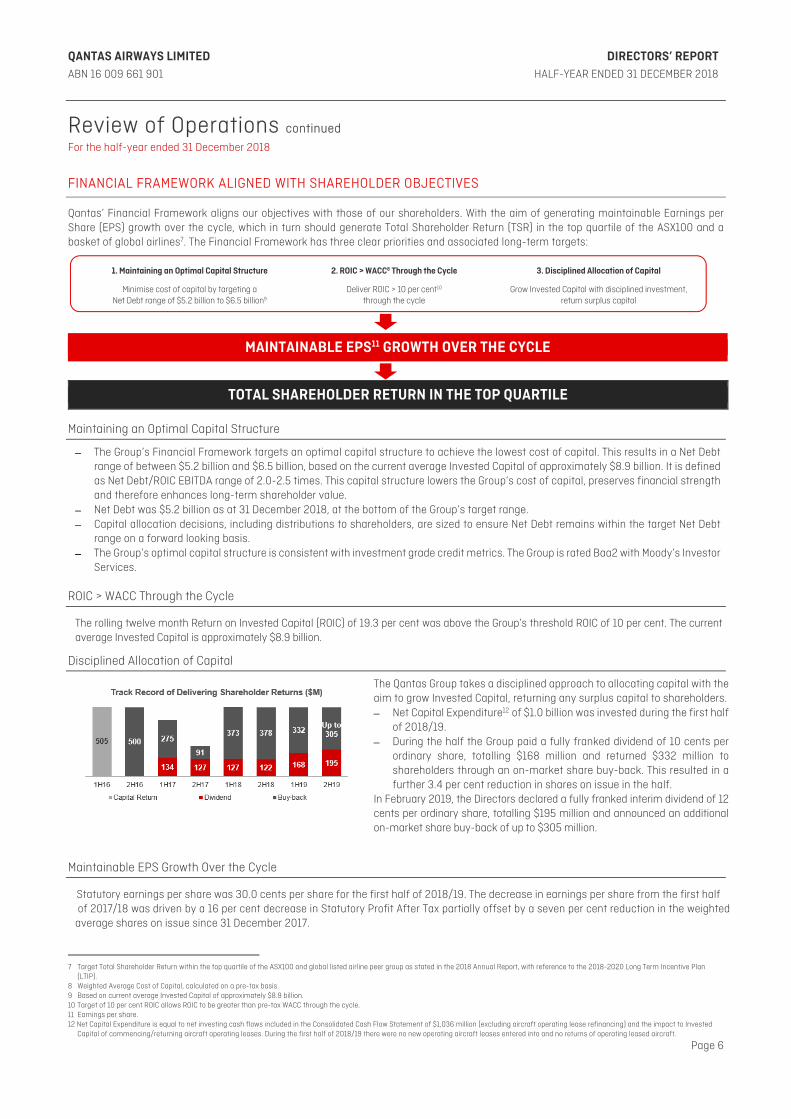
Disciplined Allocation of Capital
The Qantas Group takes a disciplined approach to allocating capital with the aim to grow Invested Capital, returning any surplus capital to shareholders. – Net Capital Expenditure12 of $1.0 billion was invested during the first half
of 2018/19. – During the half the Group paid a fully franked dividend of 10 cents per
ordinary share, totalling $168 million and returned $332 million to shareholders through an on-market share buy-back. This resulted in a further 3.4 per cent reduction in shares on issue in the half.
In February 2019, the Directors declared a fully franked interim dividend of 12 cents per ordinary share, totalling $195 million and announced an additional on-market share buy-back of up to $305 million.
Maintainable EPS Growth Over the Cycle
Statutory earnings per share was 30.0 cents per share for the first half of 2018/19. The decrease in earnings per share from the first half of 2017/18 was driven by a 16 per cent decrease in Statutory Profit After Tax partially offset by a seven per cent reduction in the weighted average shares on issue since 31 December 2017.
7 Target Total Shareholder Return within the top quartile of the ASX100 and global listed airline peer group as stated in the 2018 Annual Report, with reference to the 2018-2020 Long Term Incentive Plan
(LTIP). 8 Weighted Average Cost of Capital, calculated on a pre-tax basis. 9 Based on current average Invested Capital of approximately $8.9 billion. 10 Target of 10 per cent ROIC allows ROIC to be greater than pre-tax WACC through the cycle. 11 Earnings per share. 12 Net Capital Expenditure is equal to net investing cash flows included in the Consolidated Cash Flow Statement of $1,036 million (excluding aircraft operating lease refinancing) and the impact to Invested
Capital of commencing/returning aircraft operating leases. During the first half of 2018/19 there were no new operating aircraft leases entered into and no returns of operating leased aircraft.
MAINTAINABLE EPS11 GROWTH OVER THE CYCLE
TOTAL SHAREHOLDER RETURN IN THE TOP QUARTILE

QANTAS AIRWAYS LIMITED DIRECTORS’ REPORT ABN 16 009 661 901 HALF-YEAR ENDED 31 DECEMBER 2018
Page 7
Review of Operations continued
For the half-year ended 31 December 2018
GROUP PERFORMANCE
The Qantas Group reported a solid result of an Underlying PBT of $780 million for the first half of 2018/19, 19 per cent lower than the first half of 2017/18. Revenue strength substantially offset a $416 million increase in fuel costs, the impact of foreign exchange on non-fuel costs, increased selling costs on higher revenue and depreciation. Net passenger revenue increased by six per cent, helping to offset higher fuel and other costs. This was achieved through Unit Revenue increases, supported by increased yields and higher load factors and higher ancillary revenue in both the domestic and selected international markets. The benefits of transformation and other non-passenger related revenues assisted in partially offsetting the impact of inflation, selling expenses, foreign exchange impacts on non-fuel costs and increased depreciation.
Group Underlying Income Statement Summary13
December2018
$M
December2017
(restated)$M
Change $M
Change%
Net passenger revenue 8,027 7,607 420 6
Net freight revenue 525 455 70 15
Other revenue 654 637 17 3
Revenue and Other Income 9,206 8,699 507 6
Operating expenses (excluding fuel) (5,436) (5,239) (197) (4)
Fuel (1,963) (1,547) (416) (27)
Depreciation and amortisation (814) (747) (67) (9)
Non-cancellable aircraft operating lease rentals (135) (141) 6 4
Share of net profit of investments accounted for under the equity method
13 21 (8) (38)
Total Expenditure (8,335) (7,653) (682) (9)
Underlying EBIT 871 1,046 (175) (17)
Net finance costs (91) (87) (4) (5)
Underlying PBT 780 959 (179) (19)
Operating Statistics December
2018
December2017
(restated) Change
Change
%
Available Seat Kilometres (ASK)14 M 76,854 77,240 (386) (0.5)
Revenue Passenger Kilometres (RPK)15 M 64,958 64,512 446 0.7
Passengers carried ‘000 28,500 28,138 362 1.3
Revenue seat factor16 % 84.5 83.5 1.0pts n/a
Operating margin17 % 9.5 12.0 (2.5)pts n/a
Unit Revenue (RASK)18 c/ASK 8.94 8.45 0.48 5.7
Total unit cost19 c/ASK (7.92) (7.21) (0.71) (9.8)
Ex-fuel unit cost20 c/ASK (5.37) (5.30) (0.07) (1.3)
Group capacity (Available Seat Kilometres) decreased by 0.5 per cent, and demand (measured by Revenue Passenger Kilometres) increased by 0.7 per cent, resulting in a 1.0 percentage point increase in Revenue Seat Factor. Group Unit Revenue increased 5.7 per cent in the first half of 2018/19 supported by transformation, capacity discipline and increased load factors in the competitive domestic and international markets. Group Domestic Unit Revenue was up 6.1 per cent and Group International Unit Revenue was up 5.4 per cent.
13 Underlying expenses differ from equivalent statutory expenses due to items excluded from Underlying PBT. Refer to the reconciliation on page 12. 14 ASK – total number of seats available for passengers, multiplied by the number of kilometres flown. 15 RPK – total number of passengers carried, multiplied by the number of kilometres flown. 16 Revenue seat factor – RPKs divided by ASKs. Also known as seat factor, load factor or load. 17 Operating margin is Group Underlying EBIT divided by Group total revenue. 18 Unit Revenue (RASK) is ticketed passenger revenue divided by Available Seat Kilometre (ASK). 19 Total Unit Cost is Underlying PBT less ticketed passenger revenue per ASK. 20 Ex-fuel Unit Cost is measured as Underlying PBT less ticketed passenger revenue, fuel and share of profit/(loss) of investments accounted for under the equity method, adjusted for the impact of changes
in FX rates, discount rates and other actual assumptions per ASK.
QANTAS AIRWAYS LIMITED DIRECTORS’ REPORT ABN 16 009 661 901 HALF-YEAR ENDED 31 DECEMBER 2018
Page 8
Review of Operations continued
For the half-year ended 31 December 2018
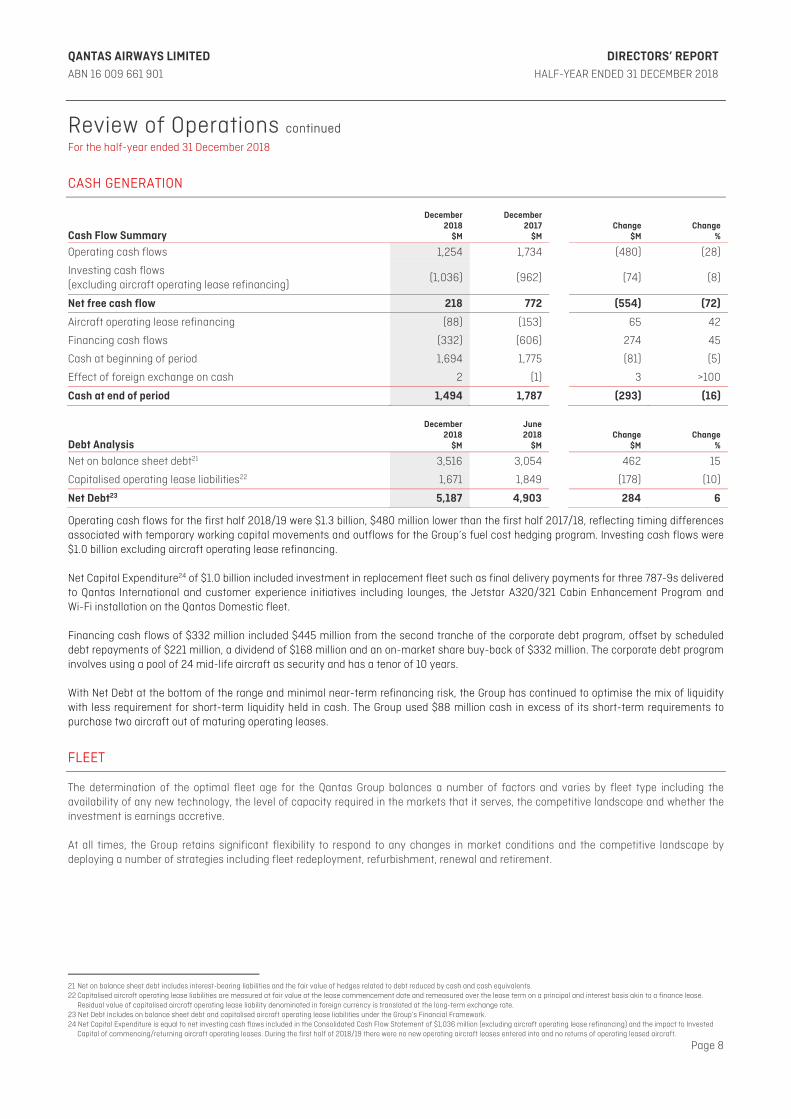
CASH GENERATION
Cash Flow Summary
December 2018
$M
December 2017
$M Change
$M Change
%
Operating cash flows 1,254 1,734 (480) (28)
Investing cash flows (excluding aircraft operating lease refinancing)
(1,036) (962) (74) (8)
Net free cash flow 218 772 (554) (72)
Aircraft operating lease refinancing (88) (153) 65 42
Financing cash flows (332) (606) 274 45
Cash at beginning of period 1,694 1,775 (81) (5)
Effect of foreign exchange on cash 2 (1) 3 >100
Cash at end of period 1,494 1,787 (293) (16)
Debt Analysis
December 2018
$M
June 2018
$M Change
$M Change
%
Net on balance sheet debt21 3,516 3,054 462 15
Capitalised operating lease liabilities22 1,671 1,849 (178) (10)
Net Debt23 5,187 4,903 284 6
Operating cash flows for the first half 2018/19 were $1.3 billion, $480 million lower than the first half 2017/18, reflecting timing differences associated with temporary working capital movements and outflows for the Group’s fuel cost hedging program. Investing cash flows were $1.0 billion excluding aircraft operating lease refinancing. Net Capital Expenditure24 of $1.0 billion included investment in replacement fleet such as final delivery payments for three 787-9s delivered to Qantas International and customer experience initiatives including lounges, the Jetstar A320/321 Cabin Enhancement Program and Wi-Fi installation on the Qantas Domestic fleet. Financing cash flows of $332 million included $445 million from the second tranche of the corporate debt program, offset by scheduled debt repayments of $221 million, a dividend of $168 million and an on-market share buy-back of $332 million. The corporate debt program involves using a pool of 24 mid-life aircraft as security and has a tenor of 10 years. With Net Debt at the bottom of the range and minimal near-term refinancing risk, the Group has continued to optimise the mix of liquidity with less requirement for short-term liquidity held in cash. The Group used $88 million cash in excess of its short-term requirements to purchase two aircraft out of maturing operating leases.
FLEET
The determination of the optimal fleet age for the Qantas Group balances a number of factors and varies by fleet type including the availability of any new technology, the level of capacity required in the markets that it serves, the competitive landscape and whether the investment is earnings accretive. At all times, the Group retains significant flexibility to respond to any changes in market conditions and the competitive landscape by deploying a number of strategies including fleet redeployment, refurbishment, renewal and retirement.
21 Net on balance sheet debt includes interest-bearing liabilities and the fair value of hedges related to debt reduced by cash and cash equivalents. 22 Capitalised aircraft operating lease liabilities are measured at fair value at the lease commencement date and remeasured over the lease term on a principal and interest basis akin to a finance lease.
Residual value of capitalised aircraft operating lease liability denominated in foreign currency is translated at the long-term exchange rate. 23 Net Debt includes on balance sheet debt and capitalised aircraft operating lease liabilities under the Group’s Financial Framework. 24 Net Capital Expenditure is equal to net investing cash flows included in the Consolidated Cash Flow Statement of $1,036 million (excluding aircraft operating lease refinancing) and the impact to Invested
Capital of commencing/returning aircraft operating leases. During the first half of 2018/19 there were no new operating aircraft leases entered into and no returns of operating leased aircraft.

QANTAS AIRWAYS LIMITED DIRECTORS’ REPORT ABN 16 009 661 901 HALF-YEAR ENDED 31 DECEMBER 2018
Page 9
Review of Operations continued
For the half-year ended 31 December 2018 During the half, the Group continued to cross utilise the A330-200 and 737-800 aircraft between Qantas Domestic and Qantas International and increased utilisation of F100 and 717 aircraft to optimise capacity to match demand. The Jetstar Cabin Enhancement Program for the domestic fleet is 80 per cent complete. The Group also took delivery of the three additional 787-9 aircraft for Qantas International, taking that fleet to a total of eight aircraft and retired one additional 747-400. As at 31 December 2018, the Qantas Group fleet25 totalled 315 aircraft, 55 per cent of which is unencumbered (with an approximate value of US$3.7 billion26), including all the Qantas International 787-9 aircraft.
SEGMENT PERFORMANCE
Segment Performance Summary
December 2018
$M
December 2017
(restated)$M
Change $M
Change%
Qantas Domestic 453 449 4 1
Qantas International27 90 224 (134) (60)
Jetstar Group 253 315 (62) (20)
Qantas Loyalty 175 168 7 4
Corporate (93) (93) – –
Unallocated/Eliminations (7) (17) 10 59
Underlying EBIT 871 1,046 (175) (17)
Net finance costs (91) (87) (4) (5)
Underlying PBT 780 959 (179) (19)
QANTAS DOMESTIC
Metrics December 2018 December 2017 Change
ASKs M 17,314 17,681 (2.1)%
Seat factor % 79.6 78.7 0.9pts Qantas Domestic reported a record first half Underlying EBIT of $453 million, up 0.9 per cent from the first half of 2017/18 as revenue strength supported recovery of the increased fuel cost. Unit Revenue was up 7.5 per cent driven by disciplined capacity management, transformation and resources sector revenue growth28. Capacity reduced by 2.1 per cent, including the impact of increased pilot training. Seat factor improved by 0.9 percentage points. Qantas Domestic maintained a leadership position in the corporate market while growing its share of the Small to Medium Enterprise (SME) market. Operating margins remained strong at 14.0 per cent.
Qantas Domestic continues to focus on customer experience with: – Two thirds of 737-800s and approximately half of the A330 fleets now Wi-Fi equipped – Over 15 percentage point customer advocacy advantage to competitor29 – Highest on time performance for domestic market30 for 5 out of 6 months for the half – Resident fares expanded to selected regional markets – Melbourne Domestic lounges upgrade and Tamworth lounge refresh completed
25 Includes Qantas Airways, Jetstar Australia and New Zealand, Jetstar Asia, Qantas Freight and Network Aviation and excludes aircraft operated by Jetstar Japan and Jetstar Pacific. 26 Based on AVAC market values. 27 The Qantas Freight segment which was previously a separate operating segment has been consolidated into the Qantas International segment. 28 Resource market ticketed passenger revenue compared to 1H18. Based on Qantas internal reporting. 29 Customer advocacy measured as Net Promoter Score (NPS). Competitor refers to Virgin Australia. Based on Qantas internal reporting. 30 On time performance (OTP) of Qantas Domestic operations. Measured as departures within 15 minutes of scheduled departure time for first half of 2018/19. Source: BITRE.
Revenue Underlying EBIT Operating Margin
1H19 3,230 1H19 453 1H19 14.0%
1H18 3,057 1H18 449 1H18 14.7%
1H17 2,916 1H17 371 1H17 12.7%
1H16 3,007 1H16 387 1H16 12.9%
453 14.03,230 $M $M
1H19
1H18
1H17
1H16
1H19
1H18
1H17
1H16
1H19
1H18
1H17
1H16
%

QANTAS AIRWAYS LIMITED DIRECTORS’ REPORT ABN 16 009 661 901 HALF-YEAR ENDED 31 DECEMBER 2018
Page 10
Review of Operations continued
For the half-year ended 31 December 2018
QANTAS INTERNATIONAL
Metrics December 2018 December 2017 Change
ASKs M 35,151 34,714 1.3%
Seat factor % 85.5 84.4 1.1pts Qantas International reported a strong Unit Revenue growth of 5.0 per cent, as the competitive environment eased slightly, as competitor capacity growth plans moderated to 3.8 per cent in the half. Strong competition was evident in the USA market while the restructured London services performed well. A $219 million increase in fuel costs, together with increases in selling costs and foreign exchange impacts on non-fuel costs offset the benefits from higher revenues. Underlying EBIT was $90 million and Operating Margin was 2.4 per cent. Qantas International achieved a 2.5 per cent increase in Revenue Passenger Kilometres and a 1.1 percentage point increase in seat factor from a 1.3 per cent increase in capacity. In the strategy to build a resilient Qantas International, 2018/19 is a transition year with the expansion of the 787-9 Dreamliner fleet while continuing to operate the 747-400 fleet. In the half, Qantas International took delivery of three additional 787-9 aircraft taking that fleet to a total of eight, improving the premium seat mix with benefits to flow into the second half of 2018/19. The success of the Perth to London direct route gives confidence in the strategy to pursue long haul routes that provide a unique competitive advantage, allowing the Group to use its domestic network to create an onshore hub in Perth. The focus on strengthening airline partnerships, including Emirates and China Eastern, continued in the half with additional codeshare partnerships announced with Cathay and KLM. During the first half of 2018/19 the freight business delivered a steady performance. Qantas International is continuing its investment in customer experience with the: – New Singapore First lounge set to open towards the end of 2019 – Preparation for the A380 cabin upgrades which will commence in mid 2019
JETSTAR GROUP
Metrics December 2018 December 2017 Change
ASKs M 24,389 24,845 (1.8)%
Seat factor % 86.6 85.7 0.9pts
Revenue Underlying EBIT Operating Margin
1H19 3,693 1H19 90 1H19 2.4%
1H18 3,460 1H18 224 1H18 6.5%
1H17 3,204 1H17 235 1H17 7.3%
1H16 3,354 1H16 308 1H16 9.2%
2.43,693 901H19
1H18
1H17
1H16
$M $M
1H19
1H18
1H17
1H16
1H19
1H18
1H17
1H16
%
Revenue Underlying EBIT Operating Margin
1H19 2,048 1H19 253 1H19 12.4%
1H18 1,949 1H18 315 1H18 16.2%
1H17 1,859 1H17 275 1H17 14.8%
1H16 1,913 1H16 262 1H16 13.7%
2,048 253 12.4$M $M
1H19
1H18
1H17
1H16
1H19
1H18
1H17
1H16
1H19
1H18
1H17
1H16
%
QANTAS AIRWAYS LIMITED DIRECTORS’ REPORT ABN 16 009 661 901 HALF-YEAR ENDED 31 DECEMBER 2018
Page 11
Review of Operations continued
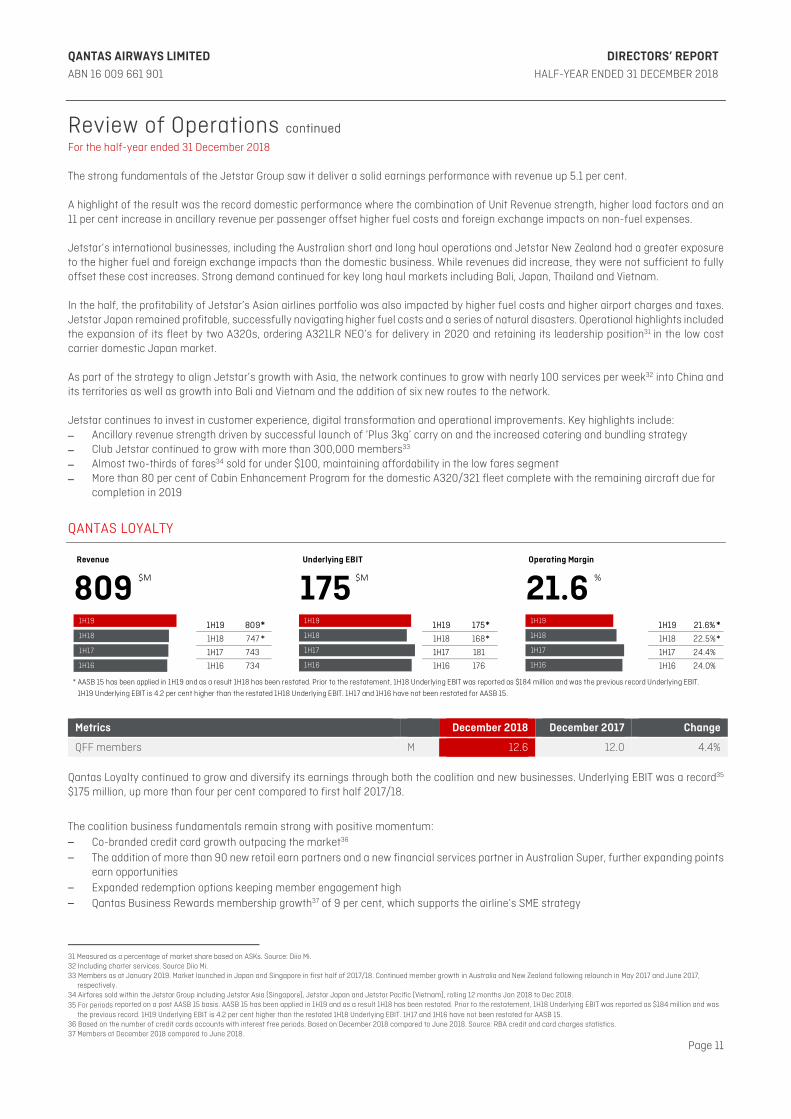
For the half-year ended 31 December 2018 The strong fundamentals of the Jetstar Group saw it deliver a solid earnings performance with revenue up 5.1 per cent. A highlight of the result was the record domestic performance where the combination of Unit Revenue strength, higher load factors and an 11 per cent increase in ancillary revenue per passenger offset higher fuel costs and foreign exchange impacts on non-fuel expenses. Jetstar’s international businesses, including the Australian short and long haul operations and Jetstar New Zealand had a greater exposure to the higher fuel and foreign exchange impacts than the domestic business. While revenues did increase, they were not sufficient to fully offset these cost increases. Strong demand continued for key long haul markets including Bali, Japan, Thailand and Vietnam. In the half, the profitability of Jetstar’s Asian airlines portfolio was also impacted by higher fuel costs and higher airport charges and taxes. Jetstar Japan remained profitable, successfully navigating higher fuel costs and a series of natural disasters. Operational highlights included the expansion of its fleet by two A320s, ordering A321LR NEO’s for delivery in 2020 and retaining its leadership position31 in the low cost carrier domestic Japan market. As part of the strategy to align Jetstar’s growth with Asia, the network continues to grow with nearly 100 services per week32 into China and its territories as well as growth into Bali and Vietnam and the addition of six new routes to the network. Jetstar continues to invest in customer experience, digital transformation and operational improvements. Key highlights include: – Ancillary revenue strength driven by successful launch of ‘Plus 3kg’ carry on and the increased catering and bundling strategy – Club Jetstar continued to grow with more than 300,000 members33 – Almost two-thirds of fares34 sold for under $100, maintaining affordability in the low fares segment – More than 80 per cent of Cabin Enhancement Program for the domestic A320/321 fleet complete with the remaining aircraft due for
completion in 2019
QANTAS LOYALTY
Metrics December 2018 December 2017 Change
QFF members M 12.6 12.0 4.4% Qantas Loyalty continued to grow and diversify its earnings through both the coalition and new businesses. Underlying EBIT was a record35 $175 million, up more than four per cent compared to first half 2017/18.
The coalition business fundamentals remain strong with positive momentum: – Co-branded credit card growth outpacing the market36 – The addition of more than 90 new retail earn partners and a new financial services partner in Australian Super, further expanding points
earn opportunities – Expanded redemption options keeping member engagement high – Qantas Business Rewards membership growth37 of 9 per cent, which supports the airline’s SME strategy
31 Measured as a percentage of market share based on ASKs. Source: Diio Mi. 32 Including charter services. Source Diio Mi. 33 Members as at January 2019. Market launched in Japan and Singapore in first half of 2017/18. Continued member growth in Australia and New Zealand following relaunch in May 2017 and June 2017,
respectively. 34 Airfares sold within the Jetstar Group including Jetstar Asia (Singapore), Jetstar Japan and Jetstar Pacific (Vietnam), rolling 12 months Jan 2018 to Dec 2018. 35 For periods reported on a post AASB 15 basis. AASB 15 has been applied in 1H19 and as a result 1H18 has been restated. Prior to the restatement, 1H18 Underlying EBIT was reported as $184 million and was
the previous record. 1H19 Underlying EBIT is 4.2 per cent higher than the restated 1H18 Underlying EBIT. 1H17 and 1H16 have not been restated for AASB 15. 36 Based on the number of credit cards accounts with interest free periods. Based on December 2018 compared to June 2018. Source: RBA credit and card charges statistics. 37 Members at December 2018 compared to June 2018.
Revenue Underlying EBIT Operating Margin
1H19 809 1H19 175 1H19 21.6%
1H18 747 1H18 168 1H18 22.5%
1H17 743 1H17 181 1H17 24.4%
1H16 734 1H16 176 1H16 24.0%
* AASB 15 has been applied in 1H19 and as a result 1H18 has been restated. Prior to the restatement, 1H18 Underlying EBIT was reported as $184 million and was the previous record Underlying EBIT.
1H19 Underlying EBIT is 4.2 per cent higher than the restated 1H18 Underlying EBIT. 1H17 and 1H16 have not been restated for AASB 15.
21.6809 175$M $M
1H19
1H18
1H17
1H16
1H19
1H18
1H17
1H16
1H19
1H18
1H17
1H16
%
**
**
**
QANTAS AIRWAYS LIMITED DIRECTORS’ REPORT ABN 16 009 661 901 HALF-YEAR ENDED 31 DECEMBER 2018
Page 12
Review of Operations continued
For the half-year ended 31 December 2018
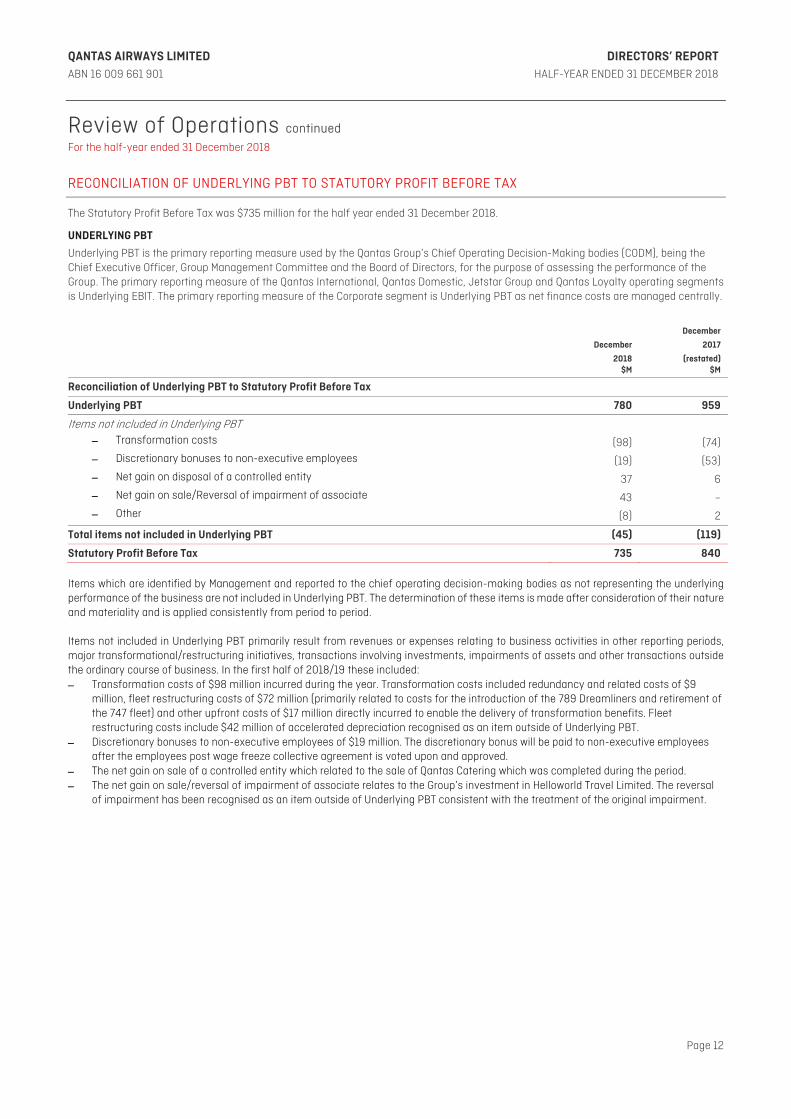
RECONCILIATION OF UNDERLYING PBT TO STATUTORY PROFIT BEFORE TAX
The Statutory Profit Before Tax was $735 million for the half year ended 31 December 2018.
UNDERLYING PBT
Underlying PBT is the primary reporting measure used by the Qantas Group’s Chief Operating Decision-Making bodies (CODM), being the Chief Executive Officer, Group Management Committee and the Board of Directors, for the purpose of assessing the performance of the Group. The primary reporting measure of the Qantas International, Qantas Domestic, Jetstar Group and Qantas Loyalty operating segments is Underlying EBIT. The primary reporting measure of the Corporate segment is Underlying PBT as net finance costs are managed centrally.
December
2018 $M
December
2017
(restated)$M
Reconciliation of Underlying PBT to Statutory Profit Before Tax
Underlying PBT 780 959
Items not included in Underlying PBT
– Transformation costs (98) (74)
– Discretionary bonuses to non-executive employees (19) (53)
– Net gain on disposal of a controlled entity 37 6
– Net gain on sale/Reversal of impairment of associate 43 –
– Other (8) 2
Total items not included in Underlying PBT (45) (119)
Statutory Profit Before Tax 735 840 Items which are identified by Management and reported to the chief operating decision-making bodies as not representing the underlying performance of the business are not included in Underlying PBT. The determination of these items is made after consideration of their nature and materiality and is applied consistently from period to period. Items not included in Underlying PBT primarily result from revenues or expenses relating to business activities in other reporting periods, major transformational/restructuring initiatives, transactions involving investments, impairments of assets and other transactions outside the ordinary course of business. In the first half of 2018/19 these included: – Transformation costs of $98 million incurred during the year. Transformation costs included redundancy and related costs of $9
million, fleet restructuring costs of $72 million (primarily related to costs for the introduction of the 789 Dreamliners and retirement of the 747 fleet) and other upfront costs of $17 million directly incurred to enable the delivery of transformation benefits. Fleet restructuring costs include $42 million of accelerated depreciation recognised as an item outside of Underlying PBT.
– Discretionary bonuses to non-executive employees of $19 million. The discretionary bonus will be paid to non-executive employees after the employees post wage freeze collective agreement is voted upon and approved.
– The net gain on sale of a controlled entity which related to the sale of Qantas Catering which was completed during the period. – The net gain on sale/reversal of impairment of associate relates to the Group’s investment in Helloworld Travel Limited. The reversal
of impairment has been recognised as an item outside of Underlying PBT consistent with the treatment of the original impairment.
QANTAS AIRWAYS LIMITED DIRECTORS’ REPORT ABN 16 009 661 901 HALF-YEAR ENDED 31 DECEMBER 2018
Page 13
Review of Operations continued
For the half-year ended 31 December 2018
MATERIAL BUSINESS RISKS
The aviation industry is subject to a number of inherent risks. These include, but are not limited to, exposure to changes in economic conditions, changes in government regulations, fuel and foreign exchange volatility and other exogenous events such as aviation incidents, natural disasters, war or an epidemic. Qantas is subject to a number of specific business risks which may impact the achievement of the Group's strategy and financial prospects. The Group’s focus is on continuously improving the controls to manage or mitigate these risks as the nature of these risks and the risk landscape for the Qantas Group has not materially changed compared with the previous year. The Qantas Group continues to operate in a domestic and international environment where elevated political risk for the business will be the norm. The increased level of unpredictability makes it imperative that the Group continues to plan for wide ranges of scenarios and risks to ensure its robustness. Competitive intensity: Market capacity growth ahead of underlying demand impacts industry profitability. – Australia's liberal aviation policy settings coupled with the strength of the Australian economy has attracted more offshore
competitors to the Australian international aviation market, predominantly state-sponsored airlines. Qantas remains focused on building key strategic airline partnerships with strong global partners and optimising its network. Qantas brings domestic strength and the unrivalled customer offering of Qantas Loyalty. Qantas International continues to build a resilient and sustainable business through transformation.
– The Australian domestic aviation market is highly competitive. The Qantas Group's market-leading domestic position and dual brand strategy allow Qantas to effectively mitigate the impact of market changes. This strategy leverages Qantas Domestic (including QantasLink) to serve business and premium leisure customers and Jetstar to serve price-sensitive customers. Qantas Domestic continues to focus on managing its cost base through sustainable transformation initiatives to ensure it remains competitive, while maintaining a revenue premium. Jetstar is working to maintain its lowest seat cost and yield advantage. These priorities result in Qantas Domestic and Jetstar Domestic delivering the highest Underlying EBITs in their respective markets, enabling the Group to retain Underlying EBIT share in excess of capacity share.
Fuel and foreign exchange volatility: The Qantas Group is subject to fuel and foreign exchange risks. These risks are an inherent part of the operations of an airline. The Qantas Group manages these risks through a comprehensive hedging program. For 2018/19, the Group's hedging profile is positioned such that 2018/19 fuel costs are expected to be $3.9038 million with an average 73 per cent participation39 to lower fuel prices. Fuel price is 90 per cent hedged for the remainder of 2018/19. Complementing the hedging program, increased focus on forecasting and the operational agility of our aviation operations are supporting the Group to manage the residual uncertainty. Cyber security and privacy regulation: The cyber security and data environment is continuously evolving. The Qantas Group remains focused on further strengthening its governance, processes and technology controls to continue to protect the integrity and privacy of data and maintain compliance with regulatory requirements. The Group continues to embed cyber security into its organisational culture through a comprehensive cyber education and awareness program and using secure by design principles. The Group's ongoing investment in cyber transformation initiatives, together with its extensive Control and Risk Framework40, operate to reduce the likelihood of cyber security and data privacy incidents, assisting with the early detection and mitigation of impact. Given the nature of this risk, the appropriateness of the controls is continuously reviewed by the Group Cyber and Privacy Committee and is subject to independent assurance on a periodic basis. Key business partners and alliances: The Qantas Group has relationships with a number of key business partners. Any potential exposures as a result of these partnerships are mitigated through the Group Risk Management Framework. Climate change: The Qantas Group is subject to short-term and long-term climate-related physical and transition risks. These risks are an inherent part of the operations of an airline and are managed by strengthening governance, technology, operational and market-based controls, including proactive consideration of how changing factors (including global climate policies) impact the proximity and severity of climate related risks. The Qantas Group recognises the demand for increased transparency on identification and management of climate-related risks and opportunities, and the necessity to consider these risks and opportunities in safeguarding future operations. In response, from 2017/18 Qantas commenced the process of aligning its corporate disclosures with the Taskforce on Climate-Related Financial Disclosures (TCFD), a summary table for which can be found on the Qantas Group corporate site.
38 As at 18 February 2019. This assumes forward market rates of Jet Fuel US$81.70 per barrel and AUD/USD 0.7135. 2018/19 fuel cost could be impacted by a breakdown in correlation or by increases in
refining margins. 39 As at 18 February 2019. Participation from current market Brent prices down US$10 per barrel for the remainder of 2018/19. 40 An overview of the Group Risk Management Framework is contained in the Qantas Group Business Practices Document available on www.qantas.com.au

QANTAS AIRWAYS LIMITED DIRECTORS’ REPORT ABN 16 009 661 901 HALF-YEAR ENDED 31 DECEMBER 2018
Page 14
LEAD AUDITOR'S INDEPENDENCE DECLARATION UNDER SECTION 307C OF THE CORPORATIONS ACT 2001 The Directors have received the Lead Auditor's Independence Declaration under section 307C of the Corporations Act 2001. The Lead Auditor's Independence Declaration is set out on page 36 and forms part of the Directors' Report for the half-year ended 31 December 2018. ROUNDING Qantas is a company of the kind referred to in ASIC Corporations (Rounding in Financial/Directors’ Reports) Instrument 2016/191. In accordance with that Instrument, all financial information presented has been rounded to the nearest million dollars, unless otherwise stated. ASIC GUIDANCE In December 2011 ASIC issued Regulatory Guide 230. To comply with this Guide, Qantas is required to make a clear statement about whether information disclosed in documents other than the financial report has been audited or reviewed in accordance with Australian Auditing Standards. In line with previous years and in accordance with the Corporations Act 2001, the Directors’ Report is unaudited. Notwithstanding this, the Directors’ Report (including the Review of Operations) contains disclosures which are extracted or derived from the Consolidated Interim Financial Report for the half-year ended 31 December 2018 which has been reviewed by the Group’s Independent Auditor. Signed pursuant to a Resolution of the Directors:
RICHARD GOYDER, AO Chairman
ALAN JOYCE, AC Chief Executive Officer Sydney 21 February 2019
QANTAS AIRWAYS LIMITED CONSOLIDATED INTERIM FINANCIAL REPORT ABN 16 009 661 901 HALF-YEAR ENDED 31 DECEMBER 2018
Page 15
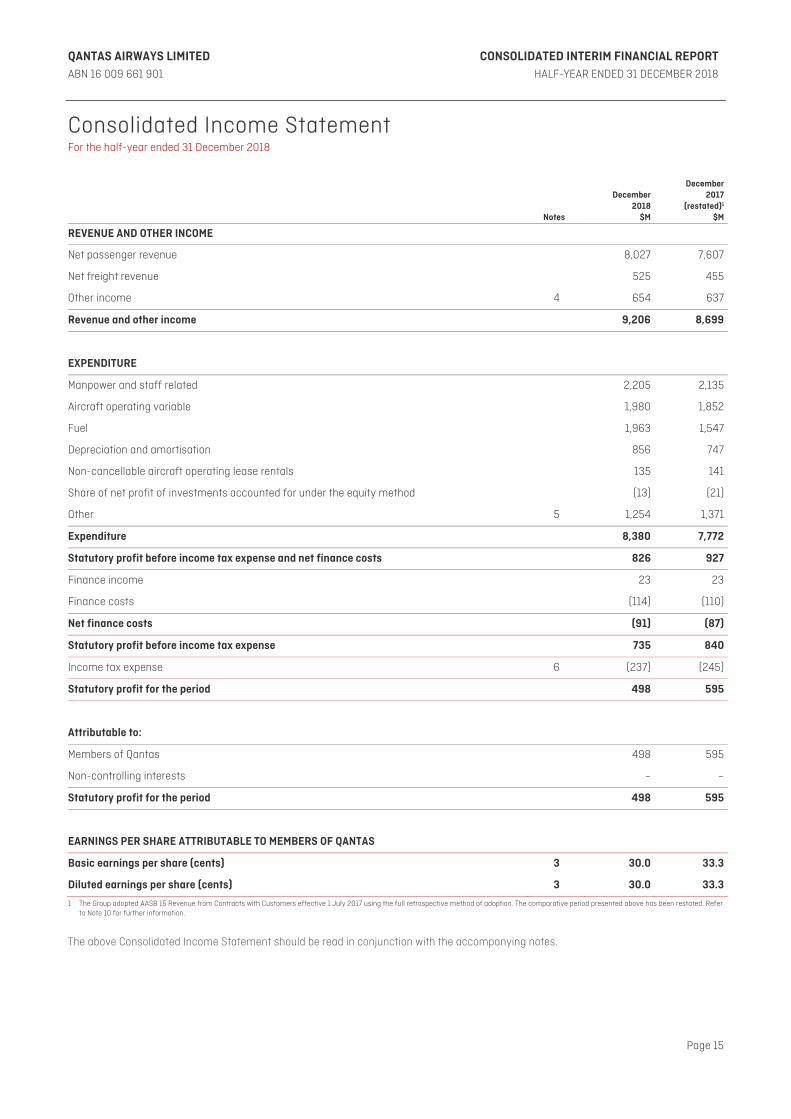
Consolidated Income Statement For the half-year ended 31 December 2018
Notes
December 2018
$M
December 2017
(restated)1
$M
REVENUE AND OTHER INCOME
Net passenger revenue 8,027 7,607
Net freight revenue 525 455
Other income 4 654 637
Revenue and other income 9,206 8,699
EXPENDITURE
Manpower and staff related 2,205 2,135
Aircraft operating variable 1,980 1,852
Fuel 1,963 1,547
Depreciation and amortisation 856 747
Non-cancellable aircraft operating lease rentals 135 141
Share of net profit of investments accounted for under the equity method (13) (21)
Other 5 1,254 1,371
Expenditure 8,380 7,772
Statutory profit before income tax expense and net finance costs 826 927
Finance income 23 23
Finance costs (114) (110)
Net finance costs (91) (87)
Statutory profit before income tax expense 735 840
Income tax expense 6 (237) (245)
Statutory profit for the period 498 595
Attributable to:
Members of Qantas 498 595
Non-controlling interests – –
Statutory profit for the period 498 595
EARNINGS PER SHARE ATTRIBUTABLE TO MEMBERS OF QANTAS
Basic earnings per share (cents) 3 30.0 33.3
Diluted earnings per share (cents) 3 30.0 33.3
1 The Group adopted AASB 15 Revenue from Contracts with Customers effective 1 July 2017 using the full retrospective method of adoption. The comparative period presented above has been restated. Refer to Note 10 for further information.
The above Consolidated Income Statement should be read in conjunction with the accompanying notes.

QANTAS AIRWAYS LIMITED CONSOLIDATED INTERIM FINANCIAL REPORT ABN 16 009 661 901 HALF-YEAR ENDED 31 DECEMBER 2018
Page 16
Consolidated Statement of Comprehensive Income For the half-year ended 31 December 2018
December 2018
$M
December2017
(restated)2
$M
Statutory profit for the period 498 595
Items that are or may be subsequently reclassified to profit or loss
Effective portion of changes in fair value of cash flow hedges, net of tax (140) 190
Transfer of hedge reserve to the Consolidated Income Statement, net of tax1 (186) (69)
Recognition of effective cash flow hedges on capitalised assets, net of tax (13) 11
Net changes in hedge reserve for time value of options, net of tax (156) 43
Foreign currency translation of controlled entities 1 2
Foreign currency translation of investments accounted for under the equity method 3 (10)
Share of other comprehensive income of investments accounted for under the equity method (11) 3
Items that will not subsequently be reclassified to profit or loss
Defined benefit actuarial (losses)/gains, net of tax (91) (6)
Other comprehensive income for the period (593) 164
Total comprehensive income for the period (95) 759
Attributable to:
Members of Qantas (95) 759
Non-controlling interests – –
Total comprehensive income for the period (95) 759
1 These amounts were allocated to fuel expenditure of $(266) million (2017: $(97) million), and income tax of $80 million (2017: income tax of $28 million) in the Consolidated Income Statement.
2 The Group adopted AASB 15 Revenue from Contracts with Customers effective 1 July 2017 using the full retrospective method of adoption. The comparative period presented above has been restated. Refer to Note 10 for further information.
The above Consolidated Statement of Comprehensive Income should be read in conjunction with the accompanying notes.

QANTAS AIRWAYS LIMITED CONSOLIDATED INTERIM FINANCIAL REPORT ABN 16 009 661 901 HALF-YEAR ENDED 31 DECEMBER 2018
Page 17
Consolidated Balance Sheet As at 31 December 2018
December 2018
$M
June 2018
(restated)1
$M
CURRENT ASSETS
Cash and cash equivalents 1,494 1,694
Receivables 953 840
Other financial assets 233 474
Inventories 367 351
Assets classified as held for sale 1 118
Other 198 161
Total current assets 3,246 3,638
NON-CURRENT ASSETS Receivables 110 110
Other financial assets 106 112
Investments accounted for under the equity method 250 222
Property, plant and equipment 13,263 12,851
Intangible assets 1,161 1,113
Other 455 601
Total non-current assets 15,345 15,009
Total assets 18,591 18,647
CURRENT LIABILITIES Payables 2,373 2,220
Revenue received in advance 3,969 4,012
Interest-bearing liabilities 373 404
Other financial liabilities 199 34
Provisions 818 853
Income tax liabilities 153 7
Liabilities classified as held for sale – 64
Total current liabilities 7,885 7,594
NON-CURRENT LIABILITIES Revenue received in advance 1,434 1,412
Interest-bearing liabilities 4,637 4,344
Other financial liabilities 134 25
Provisions 383 367
Deferred tax liabilities 759 922
Total non-current liabilities 7,347 7,070
Total liabilities 15,232 14,664
Net assets 3,359 3,983
EQUITY Issued capital 2,176 2,508
Treasury shares (117) (115)
Reserves (139) 479
Retained earnings 1,436 1,108
Equity attributable to the members of Qantas 3,356 3,980
Non-controlling interests 3 3
Total equity 3,359 3,9831 The Group adopted AASB 15 Revenue from Contracts with Customers effective 1 July 2017 using the full retrospective method of adoption. The comparative period presented above has been restated. Refer
to Note 10 for further information.
The above Consolidated Balance Sheet should be read in conjunction with the accompanying notes.
QANTAS AIRWAYS LIMITED CONSOLIDATED INTERIM FINANCIAL REPORT ABN 16 009 661 901 HALF-YEAR ENDED 31 DECEMBER 2018
Page 18
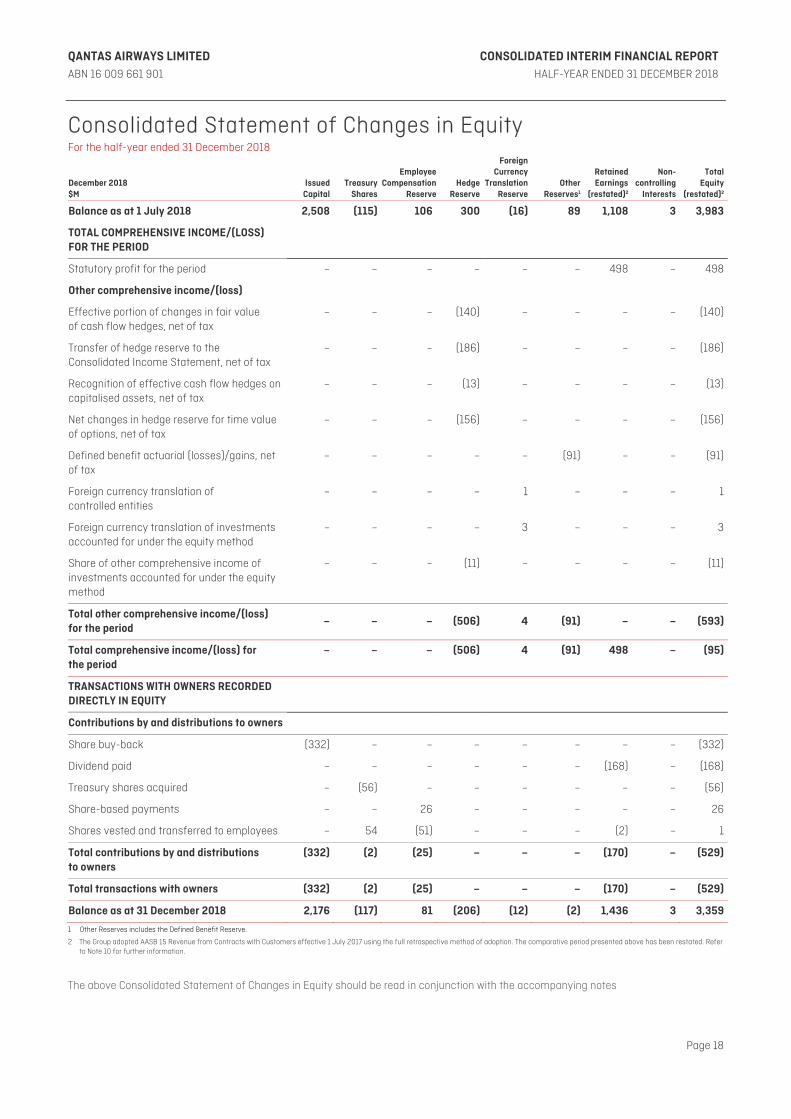
Consolidated Statement of Changes in Equity For the half-year ended 31 December 2018
December 2018 $M
IssuedCapital
TreasuryShares
EmployeeCompensation
ReserveHedge
Reserve
ForeignCurrency
TranslationReserve
Other Reserves1
Retained Earnings
(restated)2
Non- controlling
Interests
Total Equity
(restated)2
Balance as at 1 July 2018 2,508 (115) 106 300 (16) 89 1,108 3 3,983
TOTAL COMPREHENSIVE INCOME/(LOSS) FOR THE PERIOD
Statutory profit for the period – – – – – – 498 – 498
Other comprehensive income/(loss)
Effective portion of changes in fair value of cash flow hedges, net of tax
– – – (140) – – – – (140)
Transfer of hedge reserve to the Consolidated Income Statement, net of tax
– – – (186) – – – – (186)
Recognition of effective cash flow hedges on capitalised assets, net of tax
– – – (13) – – – – (13)
Net changes in hedge reserve for time value of options, net of tax
– – – (156) – – – – (156)
Defined benefit actuarial (losses)/gains, net of tax
– – – – – (91) – – (91)
Foreign currency translation of controlled entities
– – – – 1 – – – 1
Foreign currency translation of investments accounted for under the equity method
– – – – 3 – – – 3
Share of other comprehensive income of investments accounted for under the equity method
– – – (11) – – – – (11)
Total other comprehensive income/(loss) for the period
– – – (506) 4 (91) – – (593)
Total comprehensive income/(loss) for the period
– – – (506) 4 (91) 498 – (95)
TRANSACTIONS WITH OWNERS RECORDED DIRECTLY IN EQUITY
Contributions by and distributions to owners
Share buy-back (332) – – – – – – – (332)
Dividend paid – – – – – – (168) – (168)
Treasury shares acquired – (56) – – – – – – (56)
Share-based payments – – 26 – – – – – 26
Shares vested and transferred to employees – 54 (51) – – – (2) – 1
Total contributions by and distributions to owners
(332) (2) (25) – – – (170) – (529)
Total transactions with owners (332) (2) (25) – – – (170) – (529)
Balance as at 31 December 2018 2,176 (117) 81 (206) (12) (2) 1,436 3 3,359
1
Other Reserves includes the Defined Benefit Reserve.
2 The Group adopted AASB 15 Revenue from Contracts with Customers effective 1 July 2017 using the full retrospective method of adoption. The comparative period presented above has been restated. Refer to Note 10 for further information.
The above Consolidated Statement of Changes in Equity should be read in conjunction with the accompanying notes
QANTAS AIRWAYS LIMITED CONSOLIDATED INTERIM FINANCIAL REPORT ABN 16 009 661 901 HALF-YEAR ENDED 31 DECEMBER 2018
Page 19
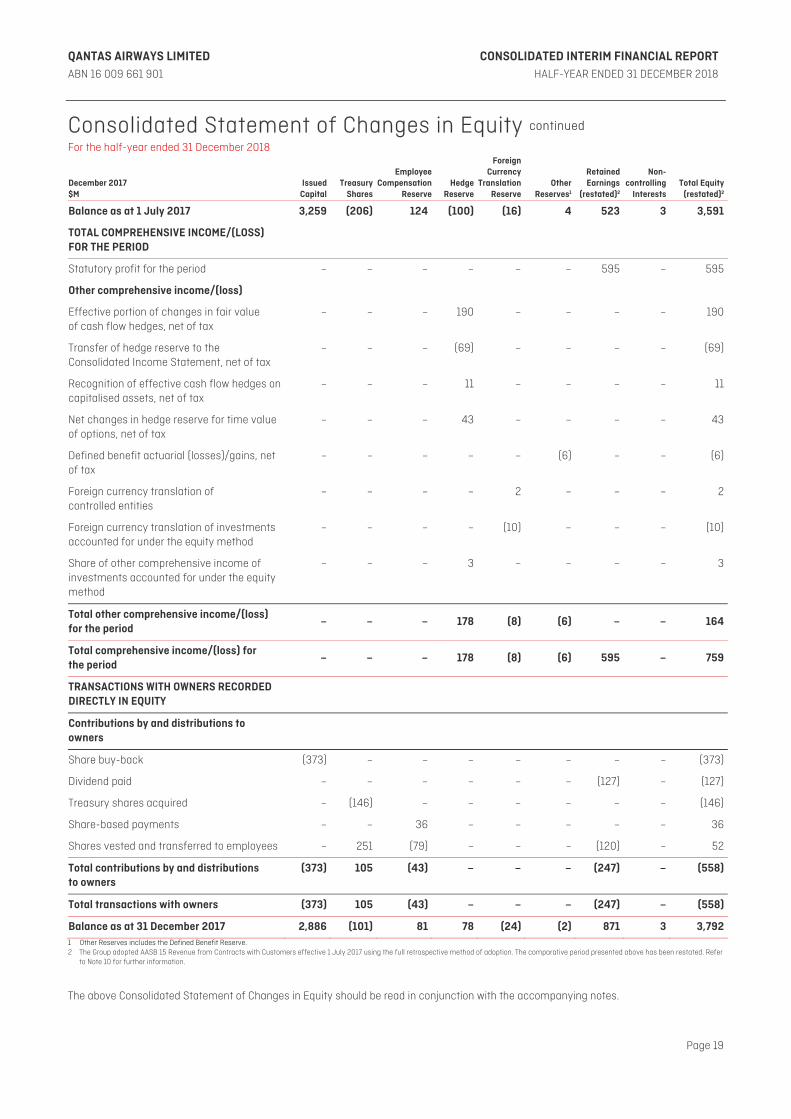
Consolidated Statement of Changes in Equity continued For the half-year ended 31 December 2018
December 2017 $M
Issued Capital
TreasuryShares
EmployeeCompensation
ReserveHedge
Reserve
ForeignCurrency
TranslationReserve
Other Reserves1
Retained Earnings
(restated)2
Non- controlling
InterestsTotal Equity
(restated)2
Balance as at 1 July 2017 3,259 (206) 124 (100) (16) 4 523 3 3,591
TOTAL COMPREHENSIVE INCOME/(LOSS) FOR THE PERIOD
Statutory profit for the period – – – – – – 595 – 595
Other comprehensive income/(loss)
Effective portion of changes in fair value of cash flow hedges, net of tax
– – – 190 – – – – 190
Transfer of hedge reserve to the Consolidated Income Statement, net of tax
– – – (69) – – – – (69)
Recognition of effective cash flow hedges on capitalised assets, net of tax
– – – 11 – – – – 11
Net changes in hedge reserve for time value of options, net of tax
– – – 43 – – – – 43
Defined benefit actuarial (losses)/gains, net of tax
– – – – – (6) – – (6)
Foreign currency translation of controlled entities
– – – – 2 – – – 2
Foreign currency translation of investments accounted for under the equity method
– – – – (10) – – – (10)
Share of other comprehensive income of investments accounted for under the equity method
– – – 3 – – – – 3
Total other comprehensive income/(loss) for the period
– – – 178 (8) (6) – – 164
Total comprehensive income/(loss) for the period
– – – 178 (8) (6) 595 – 759
TRANSACTIONS WITH OWNERS RECORDED DIRECTLY IN EQUITY
Contributions by and distributions to owners
Share buy-back (373) – – – – – – – (373)
Dividend paid – – – – – – (127) – (127)
Treasury shares acquired – (146) – – – – – – (146)
Share-based payments – – 36 – – – – – 36
Shares vested and transferred to employees – 251 (79) – – – (120) – 52
Total contributions by and distributions to owners
(373) 105 (43) – – – (247) – (558)
Total transactions with owners (373) 105 (43) – – – (247) – (558)
Balance as at 31 December 2017 2,886 (101) 81 78 (24) (2) 871 3 3,7921 Other Reserves includes the Defined Benefit Reserve. 2 The Group adopted AASB 15 Revenue from Contracts with Customers effective 1 July 2017 using the full retrospective method of adoption. The comparative period presented above has been restated. Refer
to Note 10 for further information.
The above Consolidated Statement of Changes in Equity should be read in conjunction with the accompanying notes.

QANTAS AIRWAYS LIMITED CONSOLIDATED INTERIM FINANCIAL REPORT ABN 16 009 661 901 HALF-YEAR ENDED 31 DECEMBER 2018
Page 20
Consolidated Cash Flow Statement For the half-year ended 31 December 2018
December 2018
$M
December 2017
(restated)1
$M
CASH FLOWS FROM OPERATING ACTIVITIES
Cash receipts from customers 9,548 9,057
Cash payments to suppliers and employees (excluding cash payments to employees for redundancies and related costs and discretionary bonus payments to non-executive employees)
(8,215) (7,168)
Cash generated from operations 1,333 1,889
Cash payments to employees for redundancies and related costs (11) (25)
Discretionary bonus payments to non-executive employees (15) (74)
Interest received 20 18
Interest paid (84) (77)
Dividends received from investments accounted for under the equity method 10 5
Foreign Income taxes paid 1 (2)
Net cash from operating activities 1,254 1,734
CASH FLOWS FROM INVESTING ACTIVITIES
Payments for property, plant and equipment and intangible assets (1,176) (959)
Interest paid and capitalised on qualifying assets (21) (25)
Payments for investments held at fair value – (2)
Proceeds from sale of a controlled entity 139 17
Proceeds from disposal of property, plant and equipment 11 7
Proceeds from sale of shares in associate 11 –
Net cash used in investing activities (excluding aircraft operating lease refinancing) (1,036) (962)
Aircraft operating lease refinancing (88) (153)
Net cash used in investing activities (1,124) (1,115)
CASH FLOWS FROM FINANCING ACTIVITIES
Payments for share buy-back (332) (373)
Payments for treasury shares (56) (146)
Proceeds from borrowings 445 346
Repayments of borrowings (221) (306)
Dividends paid to shareholders (168) (127)
Net cash used in financing activities (332) (606)
Net increase/(decrease) in cash and cash equivalents held (202) 13
Cash and cash equivalents at the beginning of the period 1,694 1,775
Effect of exchange rate changes on cash and cash equivalents 2 (1)
Cash and cash equivalents at the end of the period 1,494 1,7871 The Group adopted AASB 15 Revenue from Contracts with Customers effective 1 July 2017 using the full retrospective method of adoption. The comparative period presented above has been restated. Refer
to Note 10 for further information.
The above Consolidated Cash Flow Statement should be read in conjunction with the accompanying notes.
QANTAS AIRWAYS LIMITED CONSOLIDATED INTERIM FINANCIAL REPORT ABN 16 009 661 901 HALF-YEAR ENDED 31 DECEMBER 2018
Page 21
Condensed Notes to the Consolidated Interim Financial Report For the half-year ended 31 December 2018
1 STATEMENT OF SIGNIFICANT ACCOUNTING POLICIES
(A) REPORTING ENTITY
Qantas Airways Limited (Qantas) is a for-profit company limited by shares, incorporated in Australia, whose shares are publicly traded on the Australian Securities Exchange (ASX) and which is subject to the operation of the Qantas Sale Act.
The Consolidated Interim Financial Report of Qantas for the half-year ended 31 December 2018 comprises Qantas and its controlled entities (together referred to as the Qantas Group) and the Qantas Group's interest in investments accounted for using the equity method. The Consolidated Annual Financial Report of the Qantas Group as at and for the year ended 30 June 2018 is available at www.qantas.com.au or upon request from the registered office of Qantas at 10 Bourke Road, Mascot NSW 2020, Australia.
This Consolidated Interim Financial Report for the half-year ended 31 December 2018 was authorised for issue in accordance with a resolution of the Directors on 21 February 2019.
(B) STATEMENT OF COMPLIANCE
The Consolidated Interim Financial Report has been prepared in accordance with AASB 134: Interim Financial Reporting and the Corporations Act 2001. International Financial Reporting Standards (IFRS) form the basis of Australian Accounting Standards (AASB) adopted by the Australian Accounting Standards Board (AASB). The Financial Report of the Qantas Group also complies with International Accounting Standard IAS 34: Interim Financial Reporting.
The Consolidated Interim Financial Report does not include all of the information required for an Annual Financial Report and should be read in conjunction with the Consolidated Annual Financial Report of the Qantas Group for the year ended 30 June 2018. This report should also be read in conjunction with any public announcements made by Qantas in accordance with the continuous disclosure requirements arising under the Corporations Act 2001 and ASX Listing Rules.
The Consolidated Interim Financial Report is presented in Australian dollars, which is the functional currency of the Qantas Group, and has been prepared on the basis of historical cost except in accordance with relevant accounting policies where assets and liabilities are stated at their fair values.
Qantas is a company of the kind referred to in ASIC Corporations (Rounding in Financial/Directors’ Reports) Instrument 2016/191. In accordance with that Instrument, all financial information presented has been rounded to the nearest million dollars, unless otherwise stated.
(C) NEW STANDARDS, INTERPRETATIONS AND AMENDMENTS ADOPTED BY THE GROUP
The accounting policies adopted in the preparation of the consolidated interim financial report are consistent with those followed in the preparation of the Group’s annual consolidated financial statements for the year ended 30 June 2018, except for the adoption of new standards effective as of 1 July 2018.
From 1 July 2018, the Group applied, for the first time, AASB 15 Revenue from Contracts with Customers which requires retrospective restatement of previous financial statements. The nature and effect of these changes are disclosed in Note 10. From 1 July 2018, the Group also applied AASB 9 Financial Instruments; Impairment (2014), which has no material impact on the Group’s financial statements. The Group has not early adopted any other standard, interpretation or amendment that has been issued but is not yet effective.
(D) COMPARATIVES
Where applicable, comparative balances have been reclassified to align with current period presentation.
(E) CRITICAL ACCOUNTING ESTIMATES AND JUDGEMENTS
The preparation of the Consolidated Financial Statements requires management to make judgements, estimates and assumptions that affect the application of accounting policies and reported amounts of assets, liabilities, income and expenses. The estimates and associated assumptions are based on historical experience and various other factors that are believed to be reasonable under the circumstances, the results of which form the basis for making the judgements about carrying values of assets and liabilities that are not readily apparent from other sources. Actual results may differ from these estimates.
Estimates and underlying assumptions are reviewed on an ongoing basis. Revisions to accounting estimates are recognised in the period in which the estimate is revised and in any future periods affected. In preparing this Report, judgements made by Management in the application of Australian Accounting Standards that have a significant effect on the Consolidated Financial Statements and estimates with a significant risk of material adjustment in future periods were the same as those applied to the Qantas Annual Report for the year ended 30 June 2018.
QANTAS AIRWAYS LIMITED CONSOLIDATED INTERIM FINANCIAL REPORT ABN 16 009 661 901 HALF-YEAR ENDED 31 DECEMBER 2018
Page 22
Condensed Notes to the Consolidated Interim Financial Report continued For the half-year ended 31 December 2018
2 UNDERLYING PROFIT BEFORE TAX, OPERATING SEGMENTS AND RETURN ON INVESTED CAPITAL
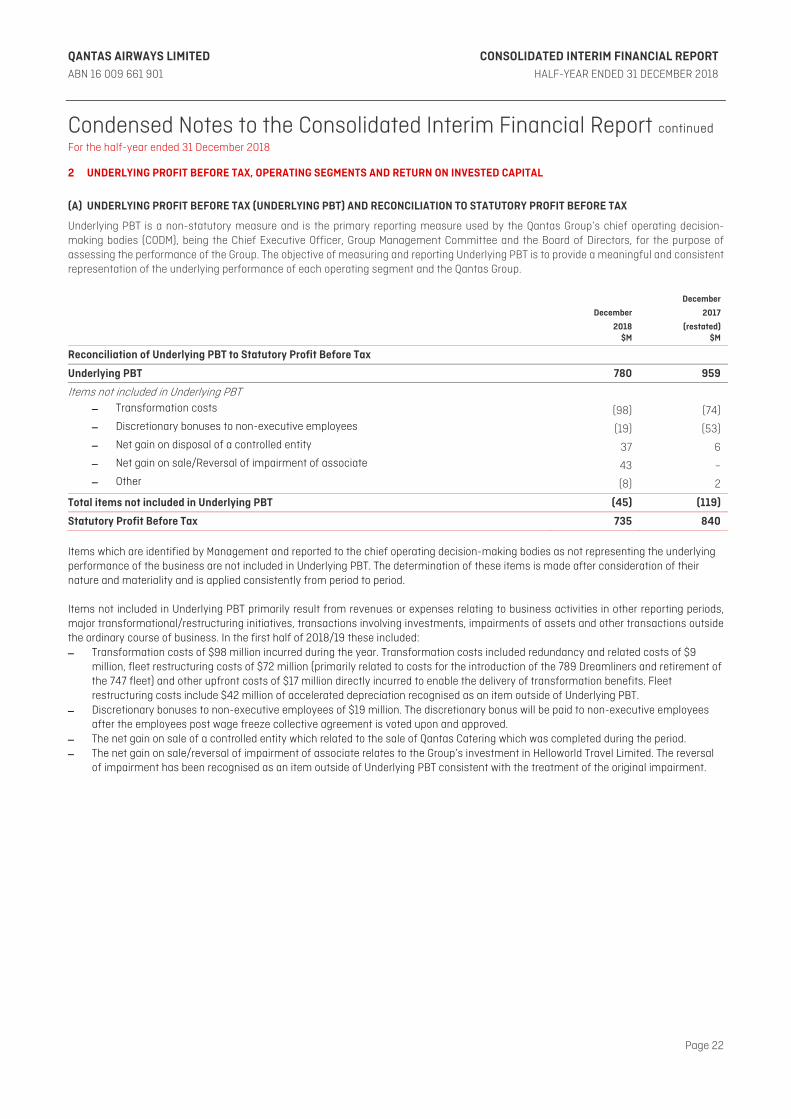
(A) UNDERLYING PROFIT BEFORE TAX (UNDERLYING PBT) AND RECONCILIATION TO STATUTORY PROFIT BEFORE TAX
Underlying PBT is a non-statutory measure and is the primary reporting measure used by the Qantas Group’s chief operating decision-making bodies (CODM), being the Chief Executive Officer, Group Management Committee and the Board of Directors, for the purpose of assessing the performance of the Group. The objective of measuring and reporting Underlying PBT is to provide a meaningful and consistent representation of the underlying performance of each operating segment and the Qantas Group.
December
2018 $M
December
2017
(restated)$M
Reconciliation of Underlying PBT to Statutory Profit Before Tax
Underlying PBT 780 959
Items not included in Underlying PBT
– Transformation costs (98) (74)
– Discretionary bonuses to non-executive employees (19) (53)
– Net gain on disposal of a controlled entity 37 6
– Net gain on sale/Reversal of impairment of associate 43 –
– Other (8) 2
Total items not included in Underlying PBT (45) (119)
Statutory Profit Before Tax 735 840 Items which are identified by Management and reported to the chief operating decision-making bodies as not representing the underlying performance of the business are not included in Underlying PBT. The determination of these items is made after consideration of their nature and materiality and is applied consistently from period to period. Items not included in Underlying PBT primarily result from revenues or expenses relating to business activities in other reporting periods, major transformational/restructuring initiatives, transactions involving investments, impairments of assets and other transactions outside the ordinary course of business. In the first half of 2018/19 these included: – Transformation costs of $98 million incurred during the year. Transformation costs included redundancy and related costs of $9
million, fleet restructuring costs of $72 million (primarily related to costs for the introduction of the 789 Dreamliners and retirement of the 747 fleet) and other upfront costs of $17 million directly incurred to enable the delivery of transformation benefits. Fleet restructuring costs include $42 million of accelerated depreciation recognised as an item outside of Underlying PBT.
– Discretionary bonuses to non-executive employees of $19 million. The discretionary bonus will be paid to non-executive employees after the employees post wage freeze collective agreement is voted upon and approved.
– The net gain on sale of a controlled entity which related to the sale of Qantas Catering which was completed during the period. – The net gain on sale/reversal of impairment of associate relates to the Group’s investment in Helloworld Travel Limited. The reversal
of impairment has been recognised as an item outside of Underlying PBT consistent with the treatment of the original impairment.
QANTAS AIRWAYS LIMITED CONSOLIDATED INTERIM FINANCIAL REPORT ABN 16 009 661 901 HALF-YEAR ENDED 31 DECEMBER 2018
Page 23
Condensed Notes to the Consolidated Interim Financial Report continued For the half-year ended 31 December 2018
2 UNDERLYING PROFIT BEFORE TAX, OPERATING SEGMENTS AND RETURN ON INVESTED CAPITAL (CONTINUED)
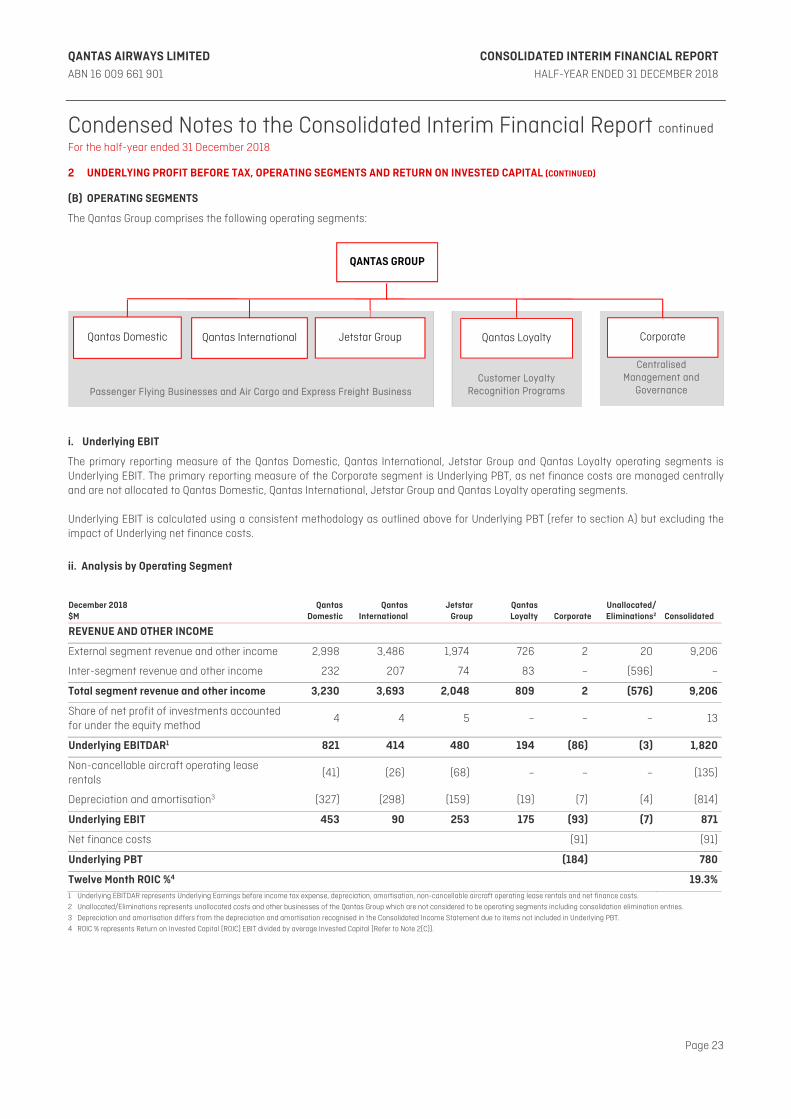
(B) OPERATING SEGMENTS
The Qantas Group comprises the following operating segments:
i. Underlying EBIT
The primary reporting measure of the Qantas Domestic, Qantas International, Jetstar Group and Qantas Loyalty operating segments is Underlying EBIT. The primary reporting measure of the Corporate segment is Underlying PBT, as net finance costs are managed centrally and are not allocated to Qantas Domestic, Qantas International, Jetstar Group and Qantas Loyalty operating segments. Underlying EBIT is calculated using a consistent methodology as outlined above for Underlying PBT (refer to section A) but excluding the impact of Underlying net finance costs.
ii. Analysis by Operating Segment
December 2018 $M
Qantas Domestic
QantasInternational
JetstarGroup
Qantas Loyalty Corporate
Unallocated/Eliminations2
Consolidated
REVENUE AND OTHER INCOME
External segment revenue and other income 2,998 3,486 1,974 726 2 20 9,206
Inter-segment revenue and other income 232 207 74 83 – (596) –
Total segment revenue and other income 3,230 3,693 2,048 809 2 (576) 9,206
Share of net profit of investments accounted for under the equity method
4 4 5 – – – 13
Underlying EBITDAR1 821 414 480 194 (86) (3) 1,820
Non-cancellable aircraft operating lease rentals
(41) (26) (68) – – – (135)
Depreciation and amortisation3 (327) (298) (159) (19) (7) (4) (814)
Underlying EBIT 453 90 253 175 (93) (7) 871
Net finance costs (91) (91)
Underlying PBT (184) 780
Twelve Month ROIC %4 19.3%1 Underlying EBITDAR represents Underlying Earnings before income tax expense, depreciation, amortisation, non-cancellable aircraft operating lease rentals and net finance costs.
2 Unallocated/Eliminations represents unallocated costs and other businesses of the Qantas Group which are not considered to be operating segments including consolidation elimination entries.
3 Depreciation and amortisation differs from the depreciation and amortisation recognised in the Consolidated Income Statement due to items not included in Underlying PBT.
4 ROIC % represents Return on Invested Capital (ROIC) EBIT divided by average Invested Capital (Refer to Note 2(C)).
Customer Loyalty Recognition Programs
Centralised Management and
Governance
Corporate
Passenger Flying Businesses and Air Cargo and Express Freight Business
Qantas Loyalty Jetstar Group Qantas International Qantas Domestic
QANTAS GROUP

QANTAS AIRWAYS LIMITED CONSOLIDATED INTERIM FINANCIAL REPORT ABN 16 009 661 901 HALF-YEAR ENDED 31 DECEMBER 2018
Page 24
Condensed Notes to the Consolidated Interim Financial Report continued For the half-year ended 31 December 2018
2 UNDERLYING PROFIT BEFORE TAX, OPERATING SEGMENTS AND RETURN ON INVESTED CAPITAL (CONTINUED)
ii. Analysis by Operating Segment
December 2017 (restated) $M
Qantas Domestic
QantasInternational
JetstarGroup
QantasLoyalty Corporate
Unallocated/Eliminations2 Consolidated
REVENUE AND OTHER INCOME
External segment revenue and other income 2,833 3,251 1,880 684 10 41 8,699
Inter-segment revenue and other income 224 209 69 63 – (565) –
Total segment revenue and other income 3,057 3,460 1,949 747 10 (524) 8,699
Share of net profit of investments accounted for under the equity method
2 2 17 – – – 21
Underlying EBITDAR1 807 516 529 183 (87) (14) 1,934
Non-cancellable aircraft operating lease rentals (40) (33) (68) – – – (141)
Depreciation and amortisation (318) (259) (146) (15) (6) (3) (747)
Underlying EBIT 449 224 315 168 (93) (17) 1,046
Net finance costs (87) (87)
Underlying PBT (180) 959
Twelve Month ROIC %3 20.7%1 Underlying EBITDAR represents Underlying Earnings before income tax expense, depreciation, amortisation, non-cancellable aircraft operating lease rentals and net finance costs. 2 Unallocated/Eliminations represents unallocated costs and other businesses of the Qantas Group which are not considered to be operating segments including consolidation elimination entries. 3 ROIC % represents Return on Invested Capital (ROIC) EBIT divided by average Invested Capital (Refer to Note 2(C)).
(C) RETURN ON INVESTED CAPITAL
Return on Invested Capital (ROIC %) is a non-statutory measure and is the financial return measure of the Group. ROIC % is calculated as the Return on Invested Capital EBIT (ROIC EBIT) divided by average Invested Capital for the period. Twelve month ROIC % is the ROIC EBIT for the twelve months ended 31 December divided by the average Invested Capital for the period 1 January to 31 December. i. ROIC EBIT
ROIC EBIT is derived by adjusting Underlying EBIT for the period to exclude non-cancellable aircraft operating lease rentals and include notional depreciation for these aircraft to account for them as if they were owned aircraft. The objective of this adjustment is to show an EBIT result which is indifferent to the financing or ownership structure of aircraft assets. ROIC EBIT therefore excludes the finance costs implicit within operating lease rental payments.
Twelve months to 31 December 2018
$M
Twelve months to 31 December 2017
(restated)2
$M
Underlying EBIT
– For the six months ended 30 June 701 641
– For the six months ended 31 December 871 1,046
Total Underlying EBIT for the period 1,572 1,687
Add: Non-cancellable aircraft lease rentals for the twelve months ended 31 December 266 305
Less: Notional depreciation1 for the twelve months ended 31 December (113) (138)
ROIC EBIT for the twelve months ended 31 December 1,725 1,854
Average Invested Capital for the twelve months ended 31 December 8,928 8,967
ROIC %3 19.3% 20.7%1 For calculating ROIC, capitalised operating leased aircraft are included in the Group’s Invested Capital at the AUD market value (referencing AVAC) of the aircraft at the date of commencing operations at
the prevailing AUD/USD rate. This value is depreciated notionally in accordance with the Group’s accounting policies with the calculated depreciation reported above known as notional depreciation. 2 ROIC EBIT has been restated from 1 July 2017 as a result of adoption of AASB 15 Revenue from Contracts with Customers 3 ROIC % represents Return on Invested Capital (ROIC) EBIT divided by average Invested Capital (Refer to Note 2(C)).
QANTAS AIRWAYS LIMITED CONSOLIDATED INTERIM FINANCIAL REPORT ABN 16 009 661 901 HALF-YEAR ENDED 31 DECEMBER 2018
Page 25
Condensed Notes to the Consolidated Interim Financial Report continued For the half-year ended 31 December 2018
2 UNDERLYING PROFIT BEFORE TAX, OPERATING SEGMENTS AND RETURN ON INVESTED CAPITAL (CONTINUED)
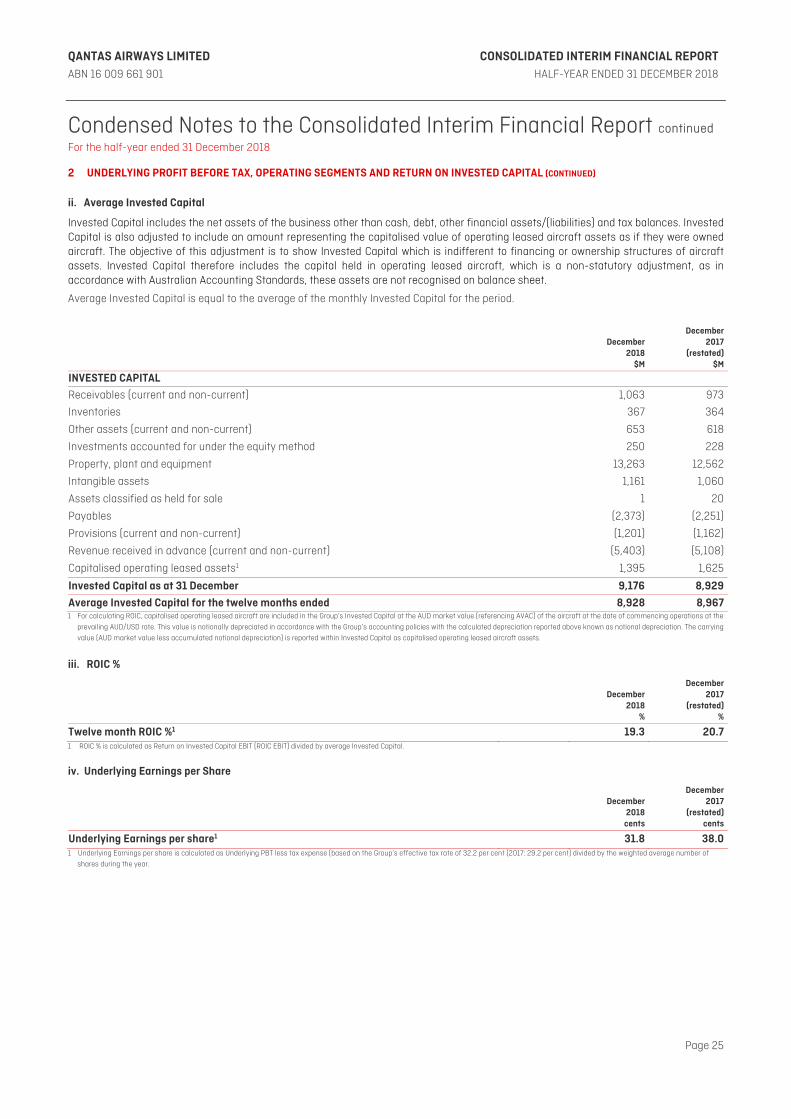
ii. Average Invested Capital
Invested Capital includes the net assets of the business other than cash, debt, other financial assets/(liabilities) and tax balances. Invested Capital is also adjusted to include an amount representing the capitalised value of operating leased aircraft assets as if they were owned aircraft. The objective of this adjustment is to show Invested Capital which is indifferent to financing or ownership structures of aircraft assets. Invested Capital therefore includes the capital held in operating leased aircraft, which is a non-statutory adjustment, as in accordance with Australian Accounting Standards, these assets are not recognised on balance sheet.
Average Invested Capital is equal to the average of the monthly Invested Capital for the period.
December 2018
$M
December 2017
(restated)$M
INVESTED CAPITAL Receivables (current and non-current) 1,063 973
Inventories 367 364
Other assets (current and non-current) 653 618
Investments accounted for under the equity method 250 228
Property, plant and equipment 13,263 12,562
Intangible assets 1,161 1,060
Assets classified as held for sale 1 20
Payables (2,373) (2,251)
Provisions (current and non-current) (1,201) (1,162)
Revenue received in advance (current and non-current) (5,403) (5,108)
Capitalised operating leased assets1 1,395 1,625
Invested Capital as at 31 December 9,176 8,929Average Invested Capital for the twelve months ended 8,928 8,9671 For calculating ROIC, capitalised operating leased aircraft are included in the Group’s Invested Capital at the AUD market value (referencing AVAC) of the aircraft at the date of commencing operations at the
prevailing AUD/USD rate. This value is notionally depreciated in accordance with the Group’s accounting policies with the calculated depreciation reported above known as notional depreciation. The carrying
value (AUD market value less accumulated notional depreciation) is reported within Invested Capital as capitalised operating leased aircraft assets.
iii. ROIC %
December
2018 %
December 2017
(restated)%
Twelve month ROIC %1 19.3 20.71 ROIC % is calculated as Return on Invested Capital EBIT (ROIC EBIT) divided by average Invested Capital.
iv. Underlying Earnings per Share
December
2018 cents
December 2017
(restated)cents
Underlying Earnings per share1 31.8 38.01 Underlying Earnings per share is calculated as Underlying PBT less tax expense (based on the Group’s effective tax rate of 32.2 per cent (2017: 29.2 per cent) divided by the weighted average number of
shares during the year.

QANTAS AIRWAYS LIMITED CONSOLIDATED INTERIM FINANCIAL REPORT ABN 16 009 661 901 HALF-YEAR ENDED 31 DECEMBER 2018
Page 26
Condensed Notes to the Consolidated Interim Financial Report continued For the half-year ended 31 December 2018
3 EARNINGS PER SHARE
December 2018
cents
December 2017
(restated)cents
Basic earnings per share 30.0 33.3
Diluted earnings per share 30.0 33.3
$M $M
Statutory profit attributable to members of Qantas 498 595
Number M
NumberM
NUMBER OF SHARES
Issued shares as at 1 July 1,684 1,808
Shares bought back and cancelled (58) (63)
Issued shares as at 31 December 1,626 1,745
Weighted average number of shares as at 31 December 1,662 1,787 4 REVENUE AND OTHER INCOME
The Group’s operations and main revenue streams are consistent with those described in the Group’s annual consolidated statements for the year ended 30 June 2018. The nature and effect of initially applying AASB 15 on the Group’s interim financial statements are disclosed in Note 10. (i) Revenue and other income by geographic area Net passenger and freight revenue are attributed to a geographic region based on the point of sale, or where not directly available, on a pro-rata basis. Other revenue/income is not allocated to a geographic region as it is impractical to do so.
December 2018
$M
December 2017
(restated)$M
Net passenger and freight revenue
Australia 6,182 5,878
Overseas 2,370 2,184
Total net passenger and freight revenue 8,552 8,062
Other income 654 637
Total revenue and other income 9,206 8,699 (ii) Other income
December
2018 $M
December 2017
(restated)$M
Frequent Flyer marketing revenue and other Qantas Loyalty businesses 232 209
Third party service revenue 196 206
Qantas store and other redemption revenue1,2 53 53
Other 173 169
Total other income 654 6371 Frequent Flyer redemption revenue excludes redemptions on Qantas Group flights which are reported as net passenger revenue in the Consolidated Income Statement. 2 Where the Group acts as an agent for redemptions, an adjustment is made within consolidation eliminations to present these redemptions on a net basis.
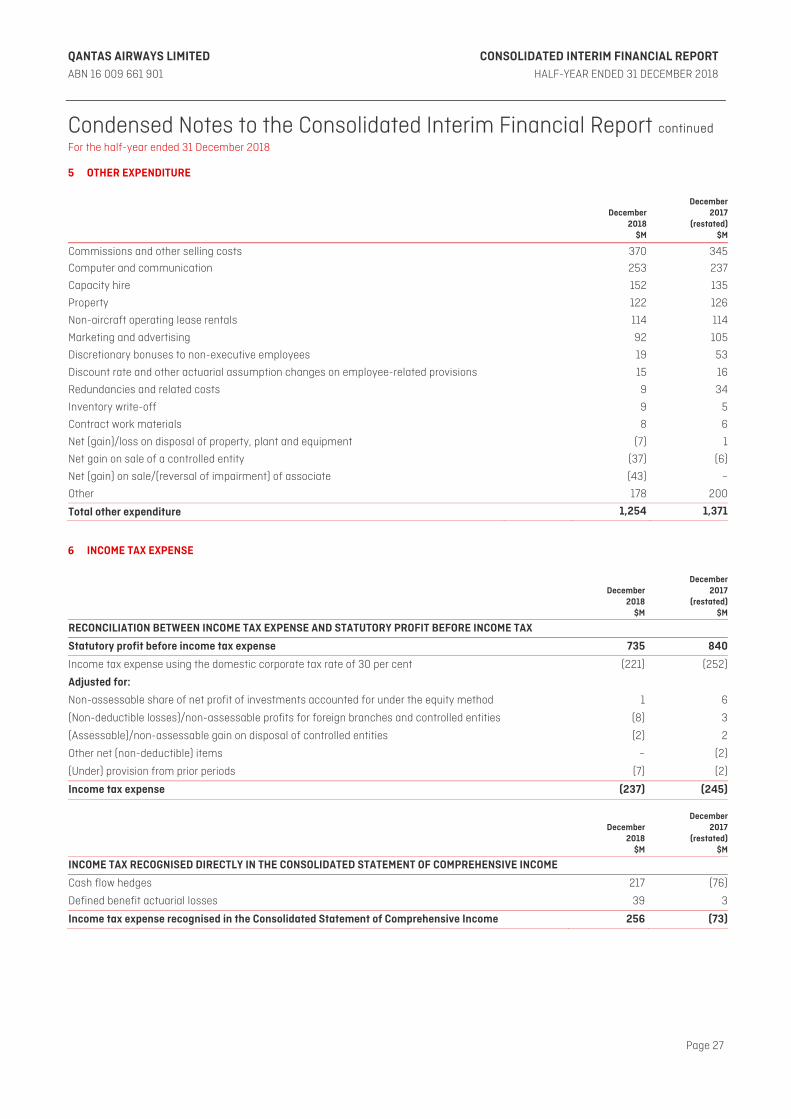
QANTAS AIRWAYS LIMITED CONSOLIDATED INTERIM FINANCIAL REPORT ABN 16 009 661 901 HALF-YEAR ENDED 31 DECEMBER 2018
Page 27
Condensed Notes to the Consolidated Interim Financial Report continued For the half-year ended 31 December 2018
5 OTHER EXPENDITURE
December
2018 $M
December 2017
(restated)$M
Commissions and other selling costs 370 345
Computer and communication 253 237
Capacity hire 152 135
Property 122 126
Non-aircraft operating lease rentals 114 114
Marketing and advertising 92 105
Discretionary bonuses to non-executive employees 19 53
Discount rate and other actuarial assumption changes on employee-related provisions 15 16
Redundancies and related costs 9 34
Inventory write-off 9 5
Contract work materials 8 6
Net (gain)/loss on disposal of property, plant and equipment (7) 1
Net gain on sale of a controlled entity (37) (6)
Net (gain) on sale/(reversal of impairment) of associate (43) –
Other 178 200
Total other expenditure 1,254 1,371
6 INCOME TAX EXPENSE
December
2018 $M
December2017
(restated)$M
RECONCILIATION BETWEEN INCOME TAX EXPENSE AND STATUTORY PROFIT BEFORE INCOME TAX
Statutory profit before income tax expense 735 840
Income tax expense using the domestic corporate tax rate of 30 per cent (221) (252)
Adjusted for:
Non-assessable share of net profit of investments accounted for under the equity method 1 6
(Non-deductible losses)/non-assessable profits for foreign branches and controlled entities (8) 3
(Assessable)/non-assessable gain on disposal of controlled entities (2) 2
Other net (non-deductible) items – (2)
(Under) provision from prior periods (7) (2)
Income tax expense (237) (245)
December
2018 $M
December2017
(restated)$M
INCOME TAX RECOGNISED DIRECTLY IN THE CONSOLIDATED STATEMENT OF COMPREHENSIVE INCOME
Cash flow hedges 217 (76)
Defined benefit actuarial losses 39 3
Income tax expense recognised in the Consolidated Statement of Comprehensive Income 256 (73)

QANTAS AIRWAYS LIMITED CONSOLIDATED INTERIM FINANCIAL REPORT ABN 16 009 661 901 HALF-YEAR ENDED 31 DECEMBER 2018
Page 28
Condensed Notes to the Consolidated Interim Financial Report continued For the half-year ended 31 December 2018
7 DIVIDENDS AND OTHER SHAREHOLDER DISTRIBUTIONS
(A) DIVIDENDS DECLARED AND PAID
In February 2019, the Directors declared a franked interim dividend of 12 cents per ordinary share, totalling $195 million. The record date for determining entitlements to the interim dividend is 5 March 2019. The dividend will be paid on 28 March 2019.
During the period ended 31 December 2018, the Group paid a fully franked dividend of 10 cents per ordinary share, totalling $168 million on 10 October 2018.
(B) OTHER SHAREHOLDER DISTRIBUTIONS
In February 2019, the Directors announced an on-market share buy-back of up to $305 million.
During the half-year ended 31 December 2018, the Group completed an on-market share buy-back of $332 million, which was announced in August 2018. The Group purchased 57.9 million ordinary shares on issue at an average share price of $5.73.
8 COMMITMENTS
(A) CAPITAL EXPENDITURE COMMITMENTS
The Group’s capital expenditure commitments as at 31 December 2018 are $9,269 million (30 June 2018: $12,478 million). The reduction in capital expenditure commitments includes the formal cancellation of the order for eight A380 aircraft. The Group has certain rights within its aircraft purchase contracts which can defer the above capital commitments. The Group’s capital expenditure commitments are predominantly denominated in US Dollars. Reported capital expenditure commitments are translated to the Australian dollar presentational currency at the 31 December 2018 closing exchange rate of $0.72 (30 June 2018: $0.74).
(B) FINANCE LEASE AND HIRE PURCHASE COMMITMENTS
December 2018
$M
June 2018
$M
AS LESSEE
Finance lease and hire purchase liabilities (included in the Consolidated Balance Sheet)
Aircraft and engines – payable:
Not later than one year 149 147
Later than one year but not later than five years 1,120 944
Later than five years 184 404
Total aircraft and engines 1,453 1,495
Less: future lease and hire purchase finance charges and deferred lease benefits (189) (207)
Total finance lease and hire purchase liabilities 1,264 1,288
Finance lease and hire purchase liabilities (included in the Consolidated Balance Sheet)
Current liabilities 114 109
Non-current liabilities 1,150 1,179
Total finance lease and hire purchase liabilities 1,264 1,288 The Qantas Group leases aircraft under finance leases with expiry dates between one and 10 years. Most finance leases contain purchase options exercisable at the end of the lease term. The Qantas Group has the right to negotiate extensions on most leases.

QANTAS AIRWAYS LIMITED CONSOLIDATED INTERIM FINANCIAL REPORT ABN 16 009 661 901 HALF-YEAR ENDED 31 DECEMBER 2018
Page 29
Condensed Notes to the Consolidated Interim Financial Report continued For the half-year ended 31 December 2018
8 COMMITMENTS (CONTINUED) (C) OPERATING LEASE COMMITMENTS
December 2018
$M
June2018
$M
AS LESSEE
Non-cancellable operating lease commitments
Aircraft and engines – payable:
Not later than one year 248 249
Later than one year but not later than five years 595 634
Later than five years 37 58
Total aircraft and engines 880 941
Non-aircraft – payable:
Not later than one year 163 162
Later than one year but not later than five years 410 395
Later than five years but not later than 10 years 247 290
Later than 10 years 190 272
Less: provision for potential under-recovery of rentals on unused premises available for sub-lease (included in onerous contract provision) (2) (2)
Total non-aircraft 1,008 1,117
Total non-cancellable operating lease commitments 1,888 2,058
9 FINANCIAL ASSETS AND FINANCIAL LIABILITIES The fair value of cash, cash equivalents and non-interest-bearing financial assets and liabilities approximates their carrying value due to their short maturity. The fair value of financial assets and liabilities is determined by valuing them at the present value of future contracted cash flows. Cash flows are discounted using standard valuation techniques at the applicable market yield, having regard to the timing of the cash flows. The fair value of forward foreign exchange and fuel contracts is determined as the unrealised gain/loss at balance date by reference to market exchange rates and fuel prices. The fair value of interest rate swaps is determined as the present value of future contracted cash flows. Cash flows are discounted using standard valuation techniques at the applicable market yield, having regard to the timing of the cash flows. The fair value of options is determined using standard valuation techniques. Other financial assets and liabilities represent the fair value of derivative financial instruments recognised on the Consolidated Balance Sheet in accordance with AASB 9.
December 2018
June 2018 (restated)
Carrying Amount Held at Carrying Amount Held at
$M
Fair Value Through Profit
And Loss
Amortised Cost
Fair Value Fair Value Through Profit
And Loss
Amortised Cost
Fair Value
Financial assets Cash and cash equivalents – 1,494 1,497 – 1,694 1,699
Receivables – 1,063 1,063 – 950 950
Other financial assets1 339 – 339 586 – 586
Financial liabilities
Payables – 2,373 2,373 – 2,220 2,220
Interest-bearing liabilities – 5,010 5,385 – 4,748 5,079
Other financial liabilities1 333 – 333 59 – 591 Other financial assets and liabilities represent the fair value of derivative financial instruments recognised on the Consolidated Balance Sheet in accordance with AASB 9. These derivative financial instruments have been measured at fair value using Level 2 inputs in estimating their fair values.
QANTAS AIRWAYS LIMITED CONSOLIDATED INTERIM FINANCIAL REPORT ABN 16 009 661 901 HALF-YEAR ENDED 31 DECEMBER 2018
Page 30
Condensed Notes to the Consolidated Interim Financial Report continued For the half-year ended 31 December 2018
10 AASB 15 REVENUE FROM CONTRACTS WITH CUSTOMERS
AASB 15 Revenue from Contracts with Customers supersedes AASB 111 Construction Contracts, AASB 118 Revenue and Interpretation 13 Customer Loyalty Programmes. AASB 15 provides a single, principles-based five-step model that applies to all revenue contracts based on the transfer of control of goods and services to customers. AASB 15 requires separation of distinct performance obligations. Revenue is recognised when the performance obligations are satisfied and recognised at an amount that reflects the consideration to which the Group expects to be entitled in exchange for goods and services. The Group adopted AASB 15 using the full retrospective method of adoption. The Group’s restated Consolidated Balance Sheet and Consolidated Income Statement, which reflect the adoption of AASB 15, are presented in the following tables.
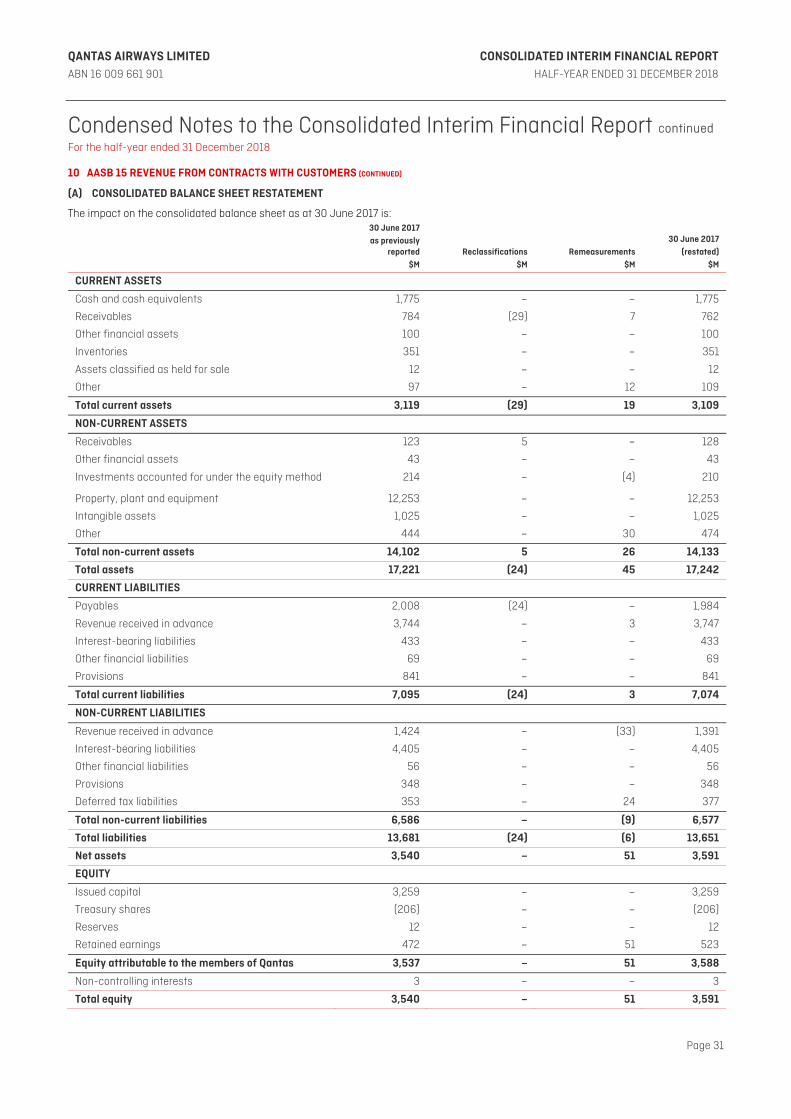
QANTAS AIRWAYS LIMITED CONSOLIDATED INTERIM FINANCIAL REPORT ABN 16 009 661 901 HALF-YEAR ENDED 31 DECEMBER 2018
Page 31
Condensed Notes to the Consolidated Interim Financial Report continued For the half-year ended 31 December 2018
10 AASB 15 REVENUE FROM CONTRACTS WITH CUSTOMERS (CONTINUED)
(A) CONSOLIDATED BALANCE SHEET RESTATEMENT
The impact on the consolidated balance sheet as at 30 June 2017 is:
30 June 2017 as previously
reported $M
Reclassifications $M
Remeasurements $M
30 June 2017 (restated)
$M
CURRENT ASSETS
Cash and cash equivalents 1,775 – – 1,775
Receivables 784 (29) 7 762
Other financial assets 100 – – 100
Inventories 351 – – 351
Assets classified as held for sale 12 – – 12
Other 97 – 12 109
Total current assets 3,119 (29) 19 3,109
NON-CURRENT ASSETS
Receivables 123 5 – 128
Other financial assets 43 – – 43
Investments accounted for under the equity method 214 – (4) 210
Property, plant and equipment 12,253 – – 12,253
Intangible assets 1,025 – – 1,025
Other 444 – 30 474
Total non-current assets 14,102 5 26 14,133
Total assets 17,221 (24) 45 17,242
CURRENT LIABILITIES
Payables 2,008 (24) – 1,984
Revenue received in advance 3,744 – 3 3,747
Interest-bearing liabilities 433 – – 433
Other financial liabilities 69 – – 69
Provisions 841 – – 841
Total current liabilities 7,095 (24) 3 7,074
NON-CURRENT LIABILITIES
Revenue received in advance 1,424 – (33) 1,391
Interest-bearing liabilities 4,405 – – 4,405
Other financial liabilities 56 – – 56
Provisions 348 – – 348
Deferred tax liabilities 353 – 24 377
Total non-current liabilities 6,586 – (9) 6,577
Total liabilities 13,681 (24) (6) 13,651
Net assets 3,540 – 51 3,591
EQUITY
Issued capital 3,259 – – 3,259
Treasury shares (206) – – (206)
Reserves 12 – – 12
Retained earnings 472 – 51 523
Equity attributable to the members of Qantas 3,537 – 51 3,588
Non-controlling interests 3 – – 3
Total equity 3,540 – 51 3,591
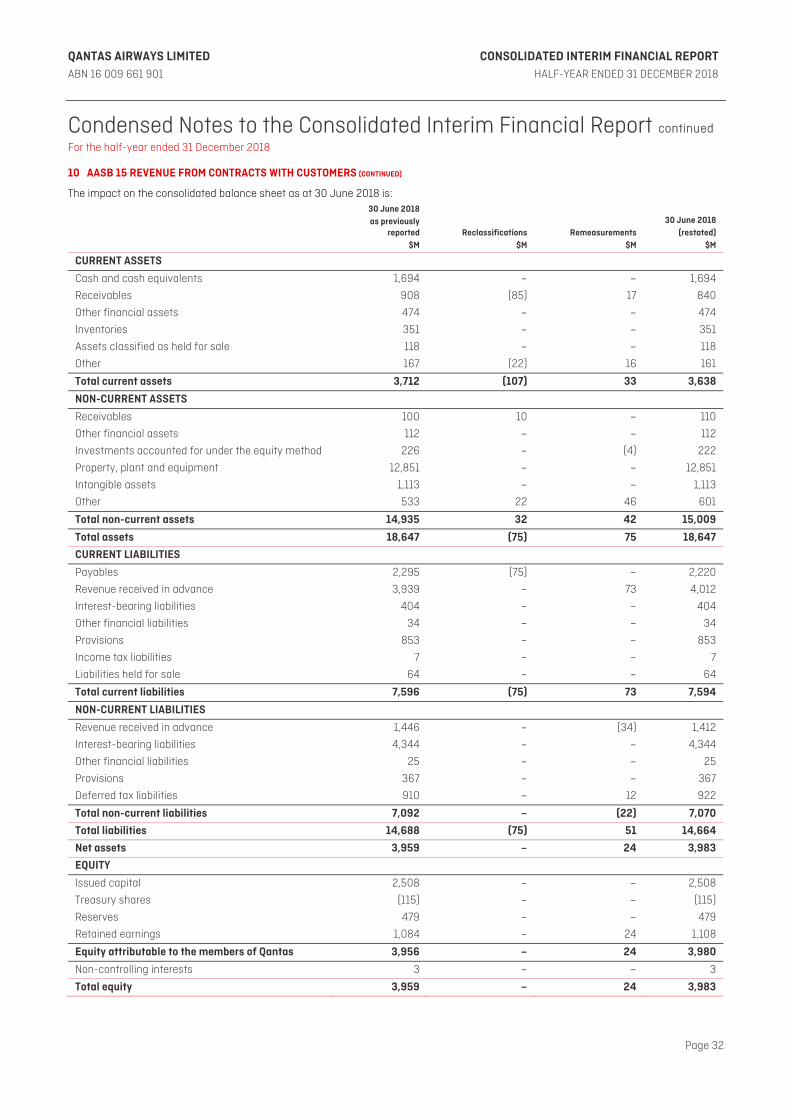
QANTAS AIRWAYS LIMITED CONSOLIDATED INTERIM FINANCIAL REPORT ABN 16 009 661 901 HALF-YEAR ENDED 31 DECEMBER 2018
Page 32
Condensed Notes to the Consolidated Interim Financial Report continued For the half-year ended 31 December 2018
10 AASB 15 REVENUE FROM CONTRACTS WITH CUSTOMERS (CONTINUED)
The impact on the consolidated balance sheet as at 30 June 2018 is:
30 June 2018 as previously
reported $M
Reclassifications $M
Remeasurements $M
30 June 2018 (restated)
$M
CURRENT ASSETS
Cash and cash equivalents 1,694 – – 1,694
Receivables 908 (85) 17 840
Other financial assets 474 – – 474
Inventories 351 – – 351
Assets classified as held for sale 118 – – 118
Other 167 (22) 16 161
Total current assets 3,712 (107) 33 3,638
NON-CURRENT ASSETS
Receivables 100 10 – 110
Other financial assets 112 – – 112
Investments accounted for under the equity method 226 – (4) 222
Property, plant and equipment 12,851 – – 12,851
Intangible assets 1,113 – – 1,113
Other 533 22 46 601
Total non-current assets 14,935 32 42 15,009
Total assets 18,647 (75) 75 18,647
CURRENT LIABILITIES
Payables 2,295 (75) – 2,220
Revenue received in advance 3,939 – 73 4,012
Interest-bearing liabilities 404 – – 404
Other financial liabilities 34 – – 34
Provisions 853 – – 853
Income tax liabilities 7 – – 7
Liabilities held for sale 64 – – 64
Total current liabilities 7,596 (75) 73 7,594
NON-CURRENT LIABILITIES
Revenue received in advance 1,446 – (34) 1,412
Interest-bearing liabilities 4,344 – – 4,344
Other financial liabilities 25 – – 25
Provisions 367 – – 367
Deferred tax liabilities 910 – 12 922
Total non-current liabilities 7,092 – (22) 7,070
Total liabilities 14,688 (75) 51 14,664
Net assets 3,959 – 24 3,983
EQUITY
Issued capital 2,508 – – 2,508
Treasury shares (115) – – (115)
Reserves 479 – – 479
Retained earnings 1,084 – 24 1,108
Equity attributable to the members of Qantas 3,956 – 24 3,980
Non-controlling interests 3 – – 3
Total equity 3,959 – 24 3,983

QANTAS AIRWAYS LIMITED CONSOLIDATED INTERIM FINANCIAL REPORT ABN 16 009 661 901 HALF-YEAR ENDED 31 DECEMBER 2018
Page 33
Condensed Notes to the Consolidated Interim Financial Report continued For the half-year ended 31 December 2018
10 AASB 15 REVENUE FROM CONTRACTS WITH CUSTOMERS (CONTINUED)
(B) CONSOLIDATED INCOME STATEMENT RESTATEMENT
The impact on the consolidated income statement for the six months ended 31 December 2017 is:
31 December 2017as previously
reported $M
Reclassifications $M
Remeasurements $M
31 December 2017
(restated) $M
REVENUE AND OTHER INCOME
Net Passenger Revenue 7,493 115 (1) 7,607
Net Freight Revenue 440 15 – 455
Other 727 (74) (16) 637
Revenue and other income 8,660 56 (17) 8,699
EXPENDITURE
Manpower and staff related 2,141 (6) – 2,135
Aircraft operating variable 1,823 29 – 1,852
Fuel 1,547 – – 1,547
Depreciation and amortisation 747 – – 747
Non-cancellable aircraft operating lease rentals 141 – – 141
Share of net (profit)/loss of investments accounted for under the equity method
(21) – – (21)
Other 1,338 33 – 1,371
Expenditure 7,716 56 – 7,772Statutory profit before income tax expense and net finance costs 944 – (17) 927Net finance costs (87) – – (87)
Income tax expense (250) – 5 (245)
Statutory profit for the period 607 – (12) 595
The impact on the consolidated income statement for the year ended 30 June 2018 is:
30 June 2018as previously
reported $M
Reclassifications $M
Remeasurements $M
30 June 2018 (restated)
$M
REVENUE AND OTHER INCOME
Net Passenger Revenue 14,715 238 (9) 14,944
Net Freight Revenue 862 33 – 895
Other 1,483 (164) (30) 1,289
Revenue and other income 17,060 107 (39) 17,128EXPENDITURE
Manpower and staff related 4,300 (9) – 4,291
Aircraft operating variable 3,596 57 – 3,653
Fuel 3,232 – – 3,232
Depreciation and amortisation 1,528 – – 1,528
Non-cancellable aircraft operating lease rentals 272 – – 272
Share of net (profit)/loss of investments accounted for under the equity method
(15) – – (15)
Other 2,574 59 – 2,633
Expenditure 15,487 107 – 15,594Statutory profit before income tax expense and net finance costs 1,573 – (39) 1,534Net finance costs (182) – – (182)
Income tax expense (411) – 12 (399)
Statutory profit for the period 980 – (27) 953

QANTAS AIRWAYS LIMITED CONSOLIDATED INTERIM FINANCIAL REPORT ABN 16 009 661 901 HALF-YEAR ENDED 31 DECEMBER 2018
Page 34
Condensed Notes to the Consolidated Interim Financial Report continued For the half-year ended 31 December 2018
10 AASB 15 REVENUE FROM CONTRACTS WITH CUSTOMERS (CONTINUED)
(C) CASHFLOW RESTATEMENT
The adoption of AASB 15 had no impact to Cash Flow from Operations, Cash Flow from Investing Activities, Cash Flow from Financing Flows or net movements in cash. Reclassifications between ‘Cash receipts from customers’ and ‘Payment to suppliers and employees’ have resulted from reclassifications between income and expenditure in the Consolidated Income Statement.
(D) EARNINGS PER SHARE
The impact on basic and diluted EPS is as follows:
31 December 2017 as previously
reported Remeasurements 31 December 2017
(restated)
Basic earnings per share (cents) 34.0 (0.7) 33.3
Diluted earnings per share (cents) 34.0 (0.7) 33.3
The Group has identified the following significant changes to revenue recognition accounting policies on adoption of the standard: (i) Allocation of revenue AASB 15 requires the allocation of a transaction price to distinct performance obligations based on their relative stand-alone selling prices. As such, the allocation of revenue between passenger travel and Qantas Points changed at a Group level under the new revenue standard. Previously, revenue was allocated using the residual method. Under AASB 15, the allocation changed to a proportional basis based on the relative stand-alone selling prices. This has resulted in a higher allocation to passenger travel at a Group level, which is recognised earlier than the redemption of the Qantas Points earned on that travel.
(ii) Net passenger revenue – Ancillary services AASB 15 requires the identification of distinct performance obligations and where performance obligations are not distinct, an entity shall combine them and account for them as a single performance obligation. Under AASB 15, revenue associated with certain ancillary services related to passenger travel such as credit card fees and change fees are not considered to be distinct from the passenger flight. Revenue relating to these ancillary services has been deferred from booking until uplift to align with the recognition of revenue from the related passenger travel. (iii) Frequent Flyer Revenue AASB 15 provides new guidance for the accounting for Qantas Points issued which are expected to expire unredeemed, which results in revenue being recognised earlier than under previous accounting standards. The impact of this change has resulted in an increase in revenue recognised in reporting periods prior to the transition to AASB 15 (recognised as an increase in retained earnings as at 1 July 2017) but a decrease in revenue recognised in reporting periods following the transition to AASB 15. This change is expected to have a declining impact in future periods. The adoption of AASB 15 also aligns the pattern of recognition of certain incentives with the principal activity to which the incentive related. (iv) Principal versus agent considerations AASB 15 provides additional guidance for determining whether the Group is acting as a principal or an agent in an arrangement. As a result, some revenue streams are recognised net of related costs rather than on a gross basis where the Group is acting as an agent. This results in lower revenue and lower expenses being presented, with no net impact on the Group Consolidated Income Statement. For some other revenue streams such as Freight interline revenue, revenue is presented on a gross basis rather than net of related costs where the Group is acting as a principal. This means there are higher revenues and higher expenses being presented with no net impact on the Group Consolidated Income Statement. The timing of revenue recognition for some revenue streams where the Group is acting as an agent have changed to align with the principal performance obligations associated with the services provided to the principal. For the purposes of segment reporting the Qantas Loyalty segment continues to report Frequent Flyer redemptions on a gross basis. Frequent Flyer redemption revenue for Qantas Group flights is recognised within Net Passenger Revenue at a Group level. Additionally under AASB 15, where the Group acts as an agent for Frequent Flyer redemptions, an adjustment is made within consolidation eliminations to present these redemptions on a net basis within Other Revenue.
QANTAS AIRWAYS LIMITED CONSOLIDATED INTERIM FINANCIAL REPORT ABN 16 009 661 901 HALF-YEAR ENDED 31 DECEMBER 2018
Page 35
Condensed Notes to the Consolidated Interim Financial Report continued For the half-year ended 31 December 2018
10 AASB 15 REVENUE FROM CONTRACTS WITH CUSTOMERS (CONTINUED)
(v) Other adjustments In addition to the adjustments described above, upon adoption of AASB 15, other items of the primary financial statements such as investments in associates, share of profit of associates, deferred taxes and income tax expense were adjusted as necessary. Together with the adoption of AASB 15, the Group reviewed the presentation of revenue transactions which resulted in some changes to descriptions and classification which have no net impact on statutory profit.
11 POST BALANCE DATE EVENTS Other than as noted in Note 7 - Dividends and Other Shareholder Distributions, there has not arisen in the interval between 31 December 2018 and the date of this Report any other event that would have had a material effect on the Consolidated Interim Financial Report as at 31 December 2018.
Page 36
KPMG, an Australian partnership and a member firm of the KPMG network of independent member firms affiliated with KPMG International Cooperative (“KPMG International”), a Swiss entity. Liability limited by a scheme approved under Profession Standards Legislation.
Lead Auditor’s Independence Declaration under Section 307C of the Corporations Act 2001 To: the Directors of Qantas Airways Limited
I declare that, to the best of my knowledge and belief, in relation to the review for the half-year ended 31 December 2018 there have been:
i. no contraventions of the auditor independence requirements as set out in the Corporations Act 2001 in relation to the review; and
ii. no contraventions of any applicable code of professional conduct in relation to the review, except as set out below:
An immediate family member of a KPMG Partner in the office of the KPMG Lead Audit Engagement Partner recently became aware of885 shares held by the immediate family member in Qantas Airways Limited. As a result, there was an inadvertent breach by KPMG of paragraph 290.108 of the APES 110 Code of Ethics for Professional Accountants. The KPMG Partner is not a member of the KPMG review team. The immediate family member disposed of this interest on 15 February 2019.
KPMG Sydney 21 February 2019
Andrew Yates Partner

QANTAS AIRWAYS LIMITED CONSOLIDATED INTERIM FINANCIAL REPORT ABN 16 009 661 901 HALF-YEAR ENDED 31 DECEMBER 2018
Page 37
DIRECTORS' DECLARATION In the opinion of the Directors of Qantas Airways Limited: (a) the Consolidated Interim Financial Report and notes set out on pages 15 to 35 are in accordance with the Corporations Act 2001,
including: i. giving a true and fair view of the financial position of the Qantas Group as at 31 December 2018 and of its performance, as
represented by the results of its operations and cash flows for the half-year ended on that date; and ii. complying with Australian Accounting Standard AASB 134: Interim Financial Reporting and the Corporations Regulations 2001; and
(b) there are reasonable grounds to believe that Qantas Airways Limited and its controlled entities will be able to pay its debts as and when
they become due and payable. Signed pursuant to a Resolution of the Directors:
RICHARD GOYDER, AO Chairman
ALAN JOYCE, AC Chief Executive Officer Sydney 21 February 2019
Page 38
KPMG, an Australian partnership and a member firm of the KPMG network of independent member firms affiliated with KPMG International Cooperative (“KPMG International”), a Swiss entity. Liability limited by a scheme approved under Profession Standards Legislation.
Independent Auditor’s Review Report
To the members of Qantas Airways Limited
Conclusion
We have reviewed the accompanying Consolidated Interim Financial Report of Qantas Airways Limited (Interim Financial Report).
Based on our review, which is not an audit, we have not become aware of any matter that makes us believe that the Interim Financial Report is not in accordance with the Corporations Act 2001, including:
i) giving a true and fair view of the Group’s financial position as at 31 December 2018 and of its performance for the Interim Period ended on that date; and
ii) complying with Australian Accounting Standard AASB 134 Interim Financial Reporting and the Corporations Regulations 2001.
The Interim Financial Report comprises:
the Consolidated Balance Sheet as at 31 December 2018;
the Consolidated Income Statement, Consolidated Statement of Comprehensive Income, Consolidated Statement of Changes in Equity and Consolidated Cash Flow Statement for the Interim Period ended on that date;
notes 1 to 11 comprising a summary of significant accounting policies and other explanatory information; and
the Directors’ declaration.
The Group comprises Qantas Airways Limited (the Company) and the entities it controlled at the Interim Period’s end or from time to time during the Interim Period.
The Interim Period is the six months ending on 31 December 2018.
Responsibilities of the Directors for the Interim Financial Report
The Directors of the Company are responsible for:
• the preparation of the Interim Financial Report that gives a true and fair view in accordance with Australian Accounting Standards and the Corporations Act 2001; and
• for such internal control as the Directors determine is necessary to enable the preparation of the Interim Financial Report that is free from material misstatement, whether due to fraud or error.
Auditor’s responsibility for the review of the Interim Financial Report
Our responsibility is to express a conclusion on the Interim Financial Report based on our review. We conducted our review in accordance with Auditing Standard on Review Engagements ASRE 2410 Review of a Financial Report Performed by the Independent Auditor of the Entity, in order to state whether, on the basis of the procedures described, we have become aware of any matter that makes us believe that the Interim Financial Report is not in accordance with the Corporations Act 2001 including: giving a true and fair view of the Group’s financial position as at 31 December 2018 and its performance for the Interim Period ended on that date; and complying with Australian Accounting Standard AASB 134 Interim Financial Reporting and the Corporations Regulations 2001. As auditor of Qantas Airways Limited, ASRE 2410 requires that we comply with the ethical requirements relevant to the audit of the annual financial report. A review of an interim period consists of making enquiries, primarily of persons responsible for financial and accounting matters, and applying analytical and other review procedures. A review is substantially less in scope than an audit conducted in accordance with Australian Auditing Standards and consequently does not enable us to obtain assurance that we would become aware of all significant matters that might be identified in an audit. Accordingly, we do not express an audit opinion.
Independence
In conducting our review, we have complied with the independence requirements of the Corporations Act 2001.
KPMG Sydney 21 February 2019
Andrew Yates Partner
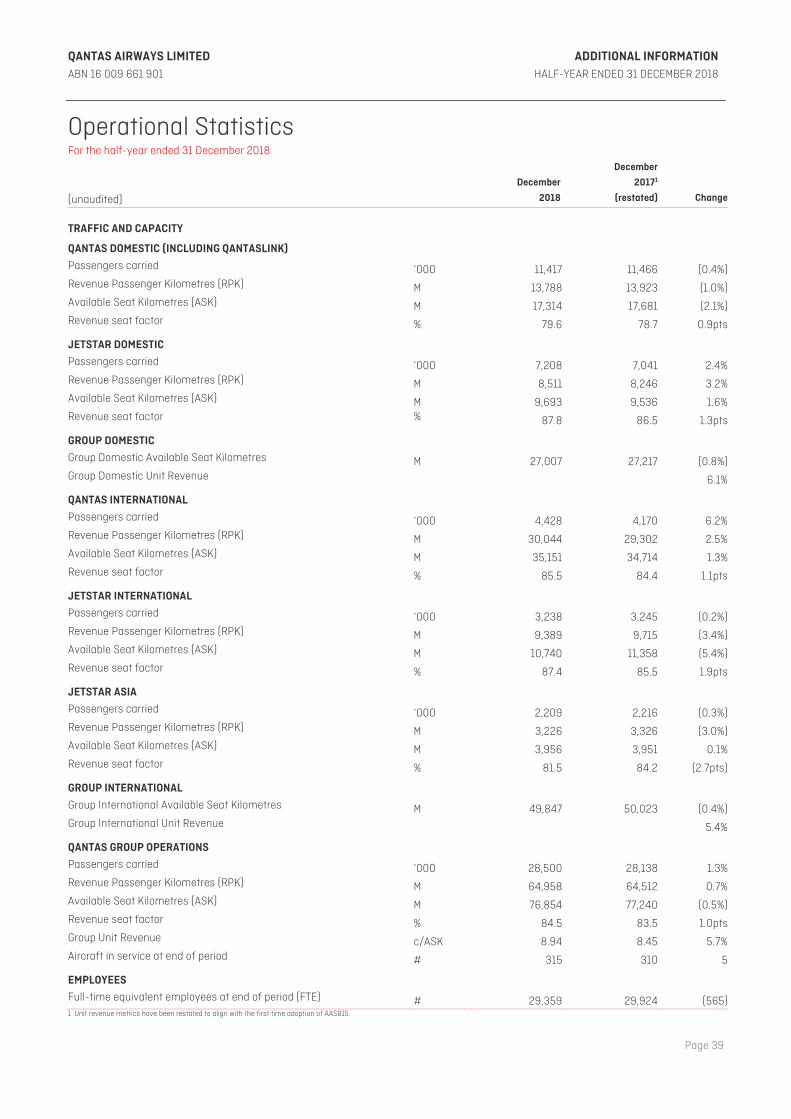
QANTAS AIRWAYS LIMITED ADDITIONAL INFORMATION ABN 16 009 661 901 HALF-YEAR ENDED 31 DECEMBER 2018
Page 39
Operational Statistics For the half-year ended 31 December 2018
(unaudited)
December
2018
December
20171
(restated) Change
TRAFFIC AND CAPACITY
QANTAS DOMESTIC (INCLUDING QANTASLINK)
Passengers carried ‘000 11,417 11,466 (0.4%)Revenue Passenger Kilometres (RPK) M 13,788 13,923 (1.0%)Available Seat Kilometres (ASK) M 17,314 17,681 (2.1%)Revenue seat factor % 79.6 78.7 0.9pts
JETSTAR DOMESTIC
Passengers carried ‘000 7,208 7,041 2.4%Revenue Passenger Kilometres (RPK) M 8,511 8,246 3.2%Available Seat Kilometres (ASK) M 9,693 9,536 1.6%Revenue seat factor % 87.8 86.5 1.3pts
GROUP DOMESTIC
Group Domestic Available Seat Kilometres M 27,007 27,217 (0.8%)Group Domestic Unit Revenue 6.1%
QANTAS INTERNATIONAL
Passengers carried ‘000 4,428 4,170 6.2%Revenue Passenger Kilometres (RPK) M 30,044 29,302 2.5%Available Seat Kilometres (ASK) M 35,151 34,714 1.3%Revenue seat factor % 85.5 84.4 1.1pts
JETSTAR INTERNATIONAL
Passengers carried ‘000 3,238 3,245 (0.2%)Revenue Passenger Kilometres (RPK) M 9,389 9,715 (3.4%)Available Seat Kilometres (ASK) M 10,740 11,358 (5.4%)Revenue seat factor % 87.4 85.5 1.9pts
JETSTAR ASIA
Passengers carried ‘000 2,209 2,216 (0.3%)Revenue Passenger Kilometres (RPK) M 3,226 3,326 (3.0%)Available Seat Kilometres (ASK) M 3,956 3,951 0.1%Revenue seat factor % 81.5 84.2 (2.7pts)
GROUP INTERNATIONAL
Group International Available Seat Kilometres M 49,847 50,023 (0.4%)Group International Unit Revenue 5.4%
QANTAS GROUP OPERATIONS
Passengers carried ‘000 28,500 28,138 1.3%Revenue Passenger Kilometres (RPK) M 64,958 64,512 0.7%Available Seat Kilometres (ASK) M 76,854 77,240 (0.5%)Revenue seat factor % 84.5 83.5 1.0ptsGroup Unit Revenue c/ASK 8.94 8.45 5.7%Aircraft in service at end of period # 315 310 5
EMPLOYEES
Full-time equivalent employees at end of period (FTE) # 29,359 29,924 (565)1 Unit revenue metrics have been restated to align with the first time adoption of AASB15.