appendix 3 standard error tables - national center for...
TRANSCRIPT

Appendix 3Standard Error Tables

This appendix includes tables of standard errors for indicator tables and figures thatpresent data collected through sample surveys. There are no standard error tables forindicator tables and figures that present data from universe surveys (such as all schooldistricts), compilations of administrative records, or statistical projections.
Standard errors for supplemental tables are not included here but can be found athttp://[email protected]
Appendix 3 Standard Error Tables
Page 228 | The Condition of Education 2001
The information presented in this report wasobtained from many sources, including federaland state agencies, private research organiza-tions, and professional associations. The datawere collected using many research methods,including surveys of a universe (such as allschool districts) or of a sample, compilationsof administrative records, and statistical pro-jections. Users of The Condition of Educa-tion should take particular care when com-paring data from different sources. Differ-ences in procedures, timing, phrasing of ques-tions, interviewer training, and so forth meanthat the results are not strictly comparable.Following the general discussion of data ac-curacy below, descriptions of the informationsources and data collection methods are pre-sented, grouped by sponsoring organization.More extensive documentation of proceduresused in one survey as compared with anotherdoes not imply more problems with the data,only that more information is available.
STATISTICAL SIGNIFICANCE
Unless otherwise noted, all statements cited inthe text were tested for statistical significanceand are statistically significant at the 0.05level. Several test procedures were used. Theprocedure used depended upon the type of datainterpreted and the nature of the statementtested. The most commonly used test proce-dures were (1) t-tests, (2) multiple t-tests witha Bonferroni adjustment to the significancelevel, and (3) linear trend tests. When a simplecomparison between two sample estimates wasmade, for example, between males and fe-males, a t-test was used. When multiple com-parisons between more than two groups weremade, and even if only one comparison is citedin the text, a Bonferroni adjustment to the sig-nificance level was made to ensure that thesignificance level for the tests as a group wasat the 0.05 level. The Bonferroni adjustmentis commonly used when making comparisonsbetween racial/ethnic groups and between theUnited States and other countries. A linear trend
test was used when a statement describing atrend, such as the growth of enrollment ratesover time, was made or when a statementdescribing a relationship, such as the relation-ship between a parent’s educational attainmentand a student’s reading proficiency, was made.
The accuracy of any statistic is determined bythe joint effects of “sampling” and “nonsam-pling” errors. Estimates based on a sample willdiffer somewhat from the figures that wouldhave been obtained if a complete census hadbeen taken using the same survey instruments,instructions, and procedures. In addition to suchsampling errors, all surveys, both universe andsample, are subject to design, reporting, andprocessing errors due to nonresponse. To theextent possible, these nonsampling errors arekept to a minimum by methods built into thesurvey procedures; however, the effects ofnonsampling errors are more difficult to gaugethan those produced by sampling variability.
The estimated standard error of a statistic is ameasure of the variation due to sampling andcan be used to examine the precision obtainedin a particular sample. The sample estimateand an estimate of its standard error permitthe construction of interval estimates with pre-scribed confidence that the interval includesthe average result of all possible samples. Ifall possible samples were selected, and eachwas surveyed under the same conditions, andan estimate and its standard error were calcu-lated from each sample, then approximately90 percent of the intervals from 1.6 standarderrors below the estimate to 1.6 standard er-rors above the estimate would include the ac-tual value; 95 percent of the intervals fromtwo standard errors below the estimate to twostandard errors above the estimate would in-clude the actual value; and 99 percent of allintervals from 2.5 standard errors below theestimate to 2.5 standard errors above the esti-mate would include the actual value. Theseintervals are called 90 percent, 95 percent, and99 percent confidence intervals, respectively.
Standard Errors
Appendix 3 Standard Error Tables
The Condition of Education 2001 | Page 229
To illustrate this further, consider the figure forIndicator 1 and the standard error table S1 forestimates from the National Household Edu-cation Surveys Program (NHES). For the 1999estimate of the percentage of children ages 3–5who were enrolled in preprimary educationprograms (59.7 percent), table S1 shows a stan-dard error of 0.6. Therefore, we can constructa 95 percent confidence interval from 58.5 to60.9 (59.7 ± 2 x 0.6). If this procedure wasfollowed for every possible sample, about 95percent of the intervals would include the ac-tual percentage of children ages 3–5 enrolledin preprimary education programs.
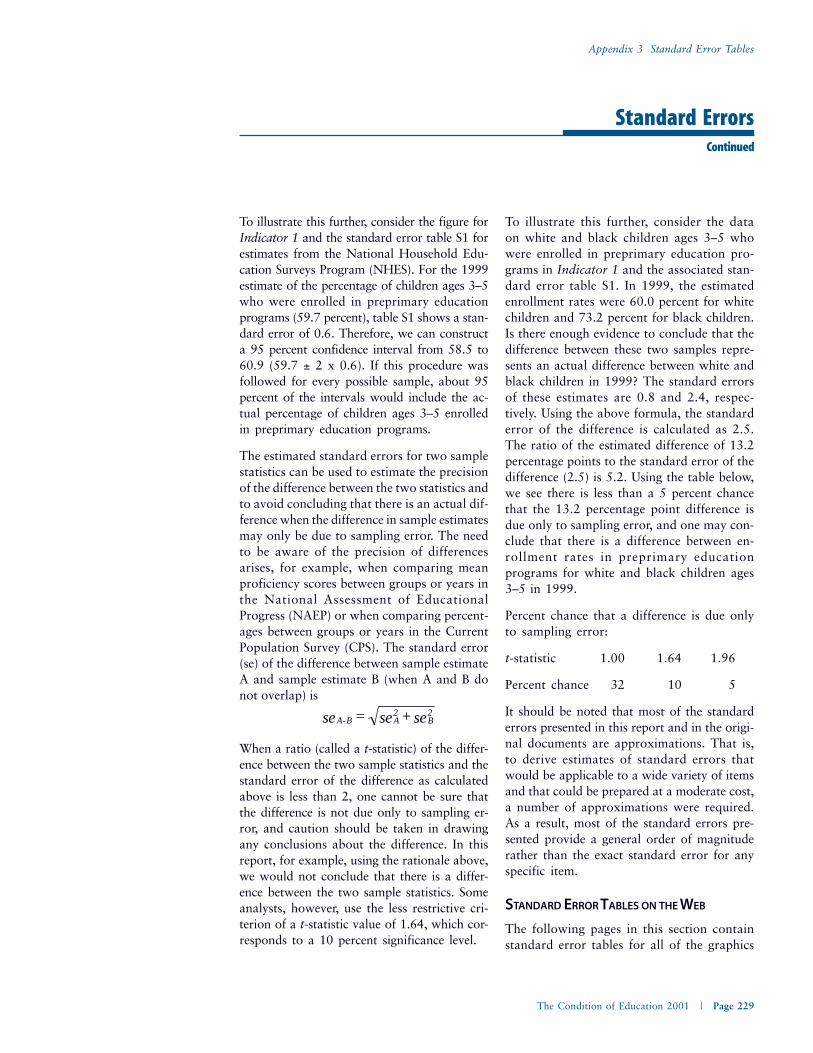
The estimated standard errors for two samplestatistics can be used to estimate the precisionof the difference between the two statistics andto avoid concluding that there is an actual dif-ference when the difference in sample estimatesmay only be due to sampling error. The needto be aware of the precision of differencesarises, for example, when comparing meanproficiency scores between groups or years inthe National Assessment of EducationalProgress (NAEP) or when comparing percent-ages between groups or years in the CurrentPopulation Survey (CPS). The standard error(se) of the difference between sample estimateA and sample estimate B (when A and B donot overlap) is
When a ratio (called a t-statistic) of the differ-ence between the two sample statistics and thestandard error of the difference as calculatedabove is less than 2, one cannot be sure thatthe difference is not due only to sampling er-ror, and caution should be taken in drawingany conclusions about the difference. In thisreport, for example, using the rationale above,we would not conclude that there is a differ-ence between the two sample statistics. Someanalysts, however, use the less restrictive cri-terion of a t-statistic value of 1.64, which cor-responds to a 10 percent significance level.
To illustrate this further, consider the dataon white and black children ages 3–5 whowere enrolled in preprimary education pro-grams in Indicator 1 and the associated stan-dard error table S1. In 1999, the estimatedenrollment rates were 60.0 percent for whitechildren and 73.2 percent for black children.Is there enough evidence to conclude that thedifference between these two samples repre-sents an actual difference between white andblack children in 1999? The standard errorsof these estimates are 0.8 and 2.4, respec-tively. Using the above formula, the standarderror of the difference is calculated as 2.5.The ratio of the estimated difference of 13.2percentage points to the standard error of thedifference (2.5) is 5.2. Using the table below,we see there is less than a 5 percent chancethat the 13.2 percentage point difference isdue only to sampling error, and one may con-clude that there is a difference between en-rollment rates in preprimary educationprograms for white and black children ages3–5 in 1999.
Percent chance that a difference is due onlyto sampling error:
t-statistic 1.00 1.64 1.96
Percent chance 32 10 5
It should be noted that most of the standarderrors presented in this report and in the origi-nal documents are approximations. That is,to derive estimates of standard errors thatwould be applicable to a wide variety of itemsand that could be prepared at a moderate cost,a number of approximations were required.As a result, most of the standard errors pre-sented provide a general order of magnituderather than the exact standard error for anyspecific item.
STANDARD ERROR TABLES ON THE WEB
The following pages in this section containstandard error tables for all of the graphics
A-B A2
B2se = se +se
Standard ErrorsContinued

Appendix 3 Standard Error Tables
Page 230 | The Condition of Education 2001
or tables found on the indicator pages in sec-tions 1 through 6. Standard error tables forall of the supplemental tables are located onthe NCES Web site. Go to nces.ed.gov andselect The Condition of Education volume
Standard ErrorsContinued
appearing on the home page. The supplemen-tal and standard error tables for any indica-tor (and all other supporting information) canbe found in that volume.

Appendix 3 Standard Error Tables
The Condition of Education 2001 | Page 231
Table S1 Standard errors for the percentage of children ages 3–5 who were enrolled in center-based earlychildhood care and education programs, by race/ethnicity: Selected years 1991–99 .................................... 234
Table S3 Standard errors for the percentage of public school students enrolled in grades K–12 who were minorities,by region: October 1972–99 ....................................................................................................................... 235
Table S4 Standard errors for the percentage of 6- to 18-year-olds with mothers who completed at leasthigh school or a bachelor’s degree or more: 1974–99 .................................................................................. 237
Table S6 Standard errors for the percentage distribution of graduate and first-professional students accordingto selected enrollment and employment characteristics: Academic year 1995–96 ....................................... 237
Table S7 Standard errors for the percentage of adults ages 18–44 who participated in credential or othertypes of learning programs in the past 12 months: 1999 .............................................................................. 238
Table S8 Standard errors for the children’s overall reading and mathematics performance from kindergartenthrough 1st grade, by mother’s education: 1998–2000 ................................................................................. 238
Table S9 Standard errors for the percentage of children with specific reading skills and proficiency fromkindergarten through 1st grade: 1998–2000 ................................................................................................ 239
Table S10 Standard errors for the average reading performance, by age: 1971–99 ..................................................... 239
Table S11a Standard errors for the difference in average reading scale scores of 9-, 13-, and 17-year-oldwhite and black students: 1971–99 ............................................................................................................ 240
Table S11b Standard errors for the change in average reading scale scores for 17-year-olds,by score quartile and race/ethnicity: 1971–88 and 1988–99 ....................................................................... 240
Table S12 Standard errors for the average mathematics performance, by age: 1973–99 ............................................ 240
Table S13 Standard errors for the average science performance, by age: 1970–99 ..................................................... 241
Table S15 Standard errors for the percentage of adults age 25 and above who reported having read regularly,by selected characteristics: 1999 ................................................................................................................. 241
Table S16 Standard errors for the percentage of students in grades 6–12 who participated in community service,by sex and race/ethnicity: 1996 and 1999 .................................................................................................... 242
Table S17 Standard errors for the percentage of the population age 25 and above who reported being inexcellent or very good health, by educational attainment and family income: 1997 ...................................... 242
Table S18 Standard errors for the ratio of median annual earnings of all wage and salary workers ages 25–34whose highest level of education was grades 9–11, some college, or a bachelor’s degree or higher, compared with those with a high school diploma or equivalent, by sex: March 1970–99 ............................. 243
Table S19 Standard errors for the percentage of high school seniors who reported definite plans forpostsecondary education: 1983, 1990, and 1998 ......................................................................................... 244
Table S20 Standard errors for the percentages of 12th-graders who thought that various student characteristicswere greatly important for having high status in their school, by sex: 1998 ................................................... 244
Table S21 Standard errors for the percentage of high school seniors who reported spending any time on home-work per week, and percentage distribution of high school seniors according to homework hours,by work status : 1998 .................................................................................................................................. 245
Table S22 Standard errors for the percentage of 9-, 13-, and 17-year-olds who were watching 3 or morehours of television, assigned homework, and reading for fun daily: 1984 and 1999 ...................................... 245
Table S23 Standard errors for the dropout rates of 16- to 24-year olds, by race/ethnicity: October 1972–99 ................ 246
Contents
Appendix 3 Standard Error Tables
Page 232 | The Condition of Education 2001
Table S24 Standard errors for the percentage of 1992 high school graduates who had enrolled in a 4-year institutionas of 1994, by highest level of mathematics completed in high school and parents’ education ...................... 247
Table S25 Standard errors for the percentage distribution of tuition and fees charged at public 4-year institutionsand estimates reported by 6th- to 12th-graders and their parents: 1999 ........................................................ 247
Table S26 Standard errors for the percentage of high school completers who were enrolled in college the Octoberafter completing high school, by sex and race/ethnicity: October 1972–99 .................................................. 248
Table S27 Standard errors for the percentage distribution of 1995–96 beginning postsecondary students accordingto attainment by 1998, by initial goal and type of first institution .................................................................. 249
Table S28 Standard errors for the percentage of 1995–96 beginning postsecondary students who persisted towarda bachelor’s degree, by the academic rigor of their secondary school curriculum and first-generationstatus: June 1998 ........................................................................................................................................ 249
Table S29 Standard errors for the percentage of postsecondary education students with varying patterns ofremedial courses who completed 2- or 4-year degrees: 1980–93 ............................................................... 250
Table S31 Standard errors for the percentage of 25- to 29-year-olds who attained selected levels of education,by race/ethnicity: March 1971 and 2000 ...................................................................................................... 250
Table S33 Standard errors for the percentage distribution of high school graduates according to level of coursescompleted: Selected years 1982–98 ........................................................................................................... 250
Table S34a Standard errors for the percentage of 1998 high school graduates who had taken advanced academicEnglish courses and a foreign language, by selected characteristics: 1998 .................................................... 251
Table S34b Standard errors for the percentage distribution of high school graduates according to the type of Englishcourses taken, by student and school characteristics: 1998 .......................................................................... 251
Table S34c Standard errors for the percentage distribution of high school graduates according to the highest levelof foreign language completed, by student and school characteristics: 1998 ................................................ 252
Table S35 Standard errors for the average credits earned in vocational education by public high school graduates,by vocational curriculum: 1982–98 ............................................................................................................. 253
Table S36 Standard errors for the percentage distribution of 8th-grade lessons rated as having low-, medium-,and high-quality mathematical content, by country: 1994–95 ..................................................................... 253
Table S37 Standard errors for the percentage distribution of kindergarten classrooms according to control ofschool and class size: Fall 1998 .................................................................................................................... 254
Table S39 Standard errors for the percentage distribution of public school teachers according to how well preparedthey felt to use computers and the Internet for classroom instruction, by number of years of teachingexperience: 1999 ........................................................................................................................................ 254
Table S41 Standard errors for the percentage of students in grades 3–12 whose parents reported being verysatisfied with aspects of their child’s school, by type of choice: 1999 ............................................................. 254
Table S42 Standard errors for the percentage of 1992–93 college graduates in the top and bottom quartileof SAT or ACT scores, by selected characteristics: 1997 .................................................................................. 255
Table S43 Standard errors for the percentage of 8th-graders taught mathematics by teachers who reported variousmain areas of study for their bachelor’s and master’s degrees: 1999 ............................................................ 255
Table S44 Standard errors for the percentage of high school students who reported being threatened or injuredwith a weapon, engaging in a physical fight, and carrying a weapon on school property: 1993, 1995,1997, and 1999 .......................................................................................................................................... 256
ContentsContinued

Appendix 3 Standard Error Tables
The Condition of Education 2001 | Page 233
Table S45 Standard errors for the percentage distribution of public schools reporting that they are underenrolled,at capacity, or overcrowded, by school enrollment size and region: 1999 ...................................................... 256
Table S46 Standard errors for the percentage of postsecondary instructional faculty and staff who used specificinstructional and grading methods in some or all of their classes, by teaching discipline: Fall 1998 ................ 257
Table S47 Standard errors for the percentage of full-time instructional faculty and staff in 4-year institutions whotaught at least one undergraduate class for credit or who taught only undergraduate classes for credit,by academic rank: Fall 1998 ........................................................................................................................ 257
Table S48 Standard errors for the percentage of full-time postsecondary instructional faculty and staff who had access to and used telecommunications technology, by type of institution: Fall 1998 .................................... 258
Table S49 Standard errors for the percentage distribution of instructional faculty and staff and average workloadand compensation, by participation in distance education and full- or part-time employment: Fall 1998 ............ 258
Table S50 Standard errors for the percentage of postsecondary instructional faculty and staff who were employedpart time, by sex, academic rank, and type of institution: Fall 1998 ............................................................... 259
Table S51 Standard errors for the average number of hours worked per week and percentage distribution oftime spent on various work activities by full-time instructional faculty, by type of institution andacademic rank: Fall 1998 ............................................................................................................................. 259
Table S52 Standard errors for the percentage of 3- to 5-year-old children not yet enrolled in kindergarten whoparticipated in home literacy activities with a family member three or more times in the week beforethe survey, by number of risk factors: 1999 .................................................................................................. 260
Table S53 Standard errors for the percentage of children in grades K–8 who received various types of carebefore and after school: 1999 ..................................................................................................................... 260
Table S54 Standard errors for the percentage of students in grades K–12 whose parents reported involvementin specific activities in their child’s school: 1999 ............................................................................................ 260
Table S55 Standard errors for the percentage of children in grades 3–12 whose parents were very satisfiedwith various aspects of their schools, by family income: 1993 and 1999 ....................................................... 261
Table S58 Standard errors for the average price of college attendance and student financial aid for dependentfull-time, full-year undergraduates, by type of institution and family income: Academic year 1995–96 ........ 261
Table S59 Standard errors for the percentage distribution of 1992–93 bachelor’s degree recipients repayingtheir loans according to the size of their debt burden in 1997, by 1996 income and amountborrowed for undergraduate education ....................................................................................................... 262
ContentsContinued

Appendix 3 Standard Error Tables
Page 234 | The Condition of Education 2001
Indicator 1
Enrollment in Preprimary Education
SOURCE: U.S. Department of Education, NCES. National Household Education Surveys Program (NHES), and Federal Interagency Forum on Child and Family Statistics, America’s Children: Key National Indicators ofWell-Being, 2000.
Table S1 Standard errors for the percentage of children ages 3–5 who were enrolled in center-based early childhood care and education programs, byrace/ethnicity: Selected years 1991–99
Race/ethnicity 1991 1993 1995 1996 1999
Total 0.9 0.8 1.0 0.7 0.6
White 1.0 1.0 1.4 1.2 0.8
Black 2.5 2.1 3.3 2.7 2.4
Hispanic 2.2 2.1 2.2 2.6 2.2

Appendix 3 Standard Error Tables
The Condition of Education 2001 | Page 235
Indicator 3
Racial/Ethnic Distribution of Public School Students
Table S3 Standard errors for the percentage of public school students enrolled in grades K–12 who were minorities, by region: October 1972–99
Minority enrollment Minority enrollment
October Black Hispanic Other Black Hispanic OtherNortheast Midwest
1972 0.5 0.4 0.1 0.5 0.2 0.1
1973 0.5 0.4 0.1 0.5 0.2 0.1
1974 0.5 0.4 0.1 0.5 0.2 0.1
1975 0.5 0.4 0.1 0.5 0.2 0.1
1976 0.5 0.5 0.2 0.5 0.2 0.1
1977 0.5 0.4 0.2 0.5 0.2 0.1
1978 0.6 0.4 0.1 0.5 0.2 0.2
1979 1.0 0.8 0.2 0.8 0.4 0.3
1980 0.7 0.6 0.3 0.7 0.3 0.3
1981 0.6 0.5 0.2 0.5 0.3 0.2
1982 0.6 0.6 0.3 0.6 0.3 0.2
1983 0.6 0.6 0.3 0.6 0.3 0.2
1984 0.6 0.6 0.3 0.6 0.3 0.2
1985 0.6 0.7 0.3 0.6 0.4 0.3
1986 0.6 0.8 0.3 0.6 0.4 0.2
1987 0.6 0.7 0.3 0.6 0.4 0.3
1988 0.7 0.8 0.3 0.7 0.5 0.3
1989 0.7 0.9 0.4 0.7 0.5 0.3
1990 0.7 0.8 0.4 0.6 0.4 0.3
1991 0.7 0.8 0.3 0.6 0.4 0.3
1992 0.7 0.7 0.4 0.6 0.4 0.3
1993 0.7 0.7 0.4 0.6 0.4 0.3
1994 0.6 0.5 0.3 0.6 0.4 0.2
1995 0.6 0.6 0.3 0.5 0.3 0.2
1996 0.6 0.6 0.3 0.5 0.4 0.3
1997 0.6 0.6 0.3 0.5 0.4 0.3
1998 0.6 0.6 0.3 0.5 0.4 0.3
1999 0.6 0.6 0.3 0.6 0.4 0.3

Appendix 3 Standard Error Tables
Page 236 | The Condition of Education 2001
Indicator 3
Racial/Ethnic Distribution of Public School Students
Table S3 Standard errors for the percentage of public school students enrolled in grades K–12 who were minorities, by region: October 1972–99—Continued
Minority enrollment Minority enrollment
October Black Hispanic Other Black Hispanic OtherSouth West
1972 0.6 0.4 0.1 0.5 0.8 0.4
1973 0.6 0.4 0.1 0.5 0.8 0.4
1974 0.6 0.4 0.1 0.5 0.8 0.4
1975 0.6 0.4 0.1 0.5 0.8 0.5
1976 0.6 0.4 0.1 0.5 0.8 0.4
1977 0.6 0.4 0.1 0.5 0.8 0.5
1978 0.6 0.4 0.2 0.5 0.9 0.5
1979 1.1 0.7 0.2 0.9 1.5 0.8
1980 0.8 0.6 0.2 0.6 1.2 0.6
1981 0.6 0.5 0.2 0.5 0.9 0.5
1982 0.7 0.5 0.2 0.5 1.0 0.6
1983 0.7 0.5 0.2 0.5 1.0 0.6
1984 0.7 0.5 0.2 0.5 1.0 0.6
1985 0.7 0.6 0.2 0.5 1.1 0.6
1986 0.7 0.6 0.2 0.5 1.1 0.6
1987 0.7 0.6 0.2 0.5 1.1 0.6
1988 0.7 0.7 0.2 0.5 1.3 0.7
1989 0.7 0.7 0.3 0.5 1.3 0.6
1990 0.7 0.6 0.2 0.5 1.1 0.6
1991 0.7 0.6 0.2 0.5 1.1 0.6
1992 0.7 0.6 0.3 0.5 1.1 0.6
1993 0.7 0.6 0.3 0.5 1.1 0.6
1994 0.6 0.4 0.2 0.4 0.8 0.5
1995 0.6 0.4 0.2 0.4 0.8 0.4
1996 0.6 0.5 0.2 0.4 0.8 0.5
1997 0.6 0.5 0.2 0.4 0.8 0.5
1998 0.6 0.5 0.2 0.4 0.8 0.5
1999 0.6 0.5 0.2 0.4 0.8 0.5
SOURCE: U.S. Department of Commerce, Bureau of the Census. October Current Population Surveys, 1972–99.

Appendix 3 Standard Error Tables
The Condition of Education 2001 | Page 237
Indicators 4, 6
Parental Education, by Race/Ethnicity
Table S4 Standard errors for the percentage of 6- to 18-year-olds with mothers who completed at least high school or a bachelor’s degree or more: 1974–99
Parents’ highest education leveland child’s race/ethnicity 1974 1979 1984 1989 1994 1999
White
High school education or higher 0.4 0.4 0.4 0.4 0.4 0.3
Bachelor’s degree or higher 0.3 0.3 0.4 0.5 0.5 0.6
Black
High school education or higher 1.5 1.5 1.6 1.5 1.5 1.3
Bachelor’s degree or higher 0.6 0.7 0.8 1.0 1.1 1.1
Hispanic
High school education or higher 1.8 1.9 1.9 2.2 2.5 1.7
Bachelor’s degree or higher 0.7 0.8 0.7 1.0 1.2 0.9
SOURCE: U.S. Department of Commerce, Bureau of the Census. March Current Population Surveys, various years.
Graduate/Professional Enrollment and Employment
Table S6 Standard errors for the percentage distribution of graduate and first-professional students according to selected enrollment and employmentcharacteristics: Academic year 1995–96
M.A.T, M.Ed., M.A./M.S. LawEnrollment and M.A./M.S. in (except (LL.B.employment characteristics M.B.A. education education) Ph.D. Ed.D. M.D. or J.D.)
Total — — — — — — —
Attendance pattern
Full-time, full-year 2.5 1.6 2.0 4.5 5.3 2.2 2.2
Part-time, full-year 3.0 2.3 2.0 4.0 6.9 0.7 2.1
Other 2.2 2.2 2.4 1.8 7.6 2.0 1.2
Employment status
Worked at all 3.1 2.5 2.7 4.4 2.6 4.3 3.5
Worked full time if worked 4.0 2.9 2.4 5.0 6.9 3.9 2.5
Primary role if working
Student meeting expenses 3.3 3.2 4.0 4.7 7.1 9.7 3.1
Employee enrolled in school 3.3 3.2 4.0 4.7 7.1 9.7 3.1
— Not applicable.
SOURCE: U.S. Department of Education, NCES. National Postsecondary Student Aid Study (NPSAS:1996), Graduate Data Analysis System.

Appendix 3 Standard Error Tables
Page 238 | The Condition of Education 2001
Indicators 7, 8
Participation in Adult Learning
Table S7 Standard errors for the percentage of adults ages 18–44 who participated in credential or other types of learning programs in the past 12months: 1999
Age Credential program All other activities
18–20 3.5 4.0
21–22 4.4 3.3
23–24 3.7 4.7
25–26 3.1 4.2
27–28 2.7 3.9
29–30 2.4 3.9
31–32 2.7 4.2
33–34 2.0 4.1
35–36 2.1 3.8
37–38 1.5 3.8
39–40 1.4 3.8
41–42 1.9 4.0
43–44 1.7 3.6
NOTE: Data have been revised from previously published figures.
SOURCE: U.S. Department of Education, NCES. National Household Education Surveys Program (NHES), 1999 (Adult Education Survey).
Table S8 Standard errors for the children’s overall reading and mathematics performance from kindergarten through 1st grade, by mother’s education:1998–2000
Kindergarten 1st grade
Mother’s education Fall Spring Fall Spring
Reading
Less than high school 0.2 0.3 0.5 0.5
High school diploma or equivalent 0.2 0.2 0.4 0.3
Some college, including vocational/technical 0.2 0.2 0.5 0.3
Bachelor’s degree or higher 0.2 0.3 0.7 0.3
Mathematics
Less than high school 0.2 0.3 0.6 0.4
High school diploma or equivalent 0.2 0.2 0.4 0.2
Some college, including vocational/technical 0.1 0.2 0.4 0.2
Bachelor’s degree or higher 0.2 0.2 0.4 0.2
SOURCE: U.S. Department of Education, NCES. Early Childhood Longitudinal Study, Kindergarten Class of 1998–99 (ECLS-K) Public-use file.
Students’ Overall Reading and Mathematics Performance Through 1st Grade

Appendix 3 Standard Error Tables
The Condition of Education 2001 | Page 239
Indicators 9, 10
Children’s Skills and Proficiency in Reading and Mathematics Through 1st Grade
Table S9 Standard errors for the percentage of children with specific reading skills and proficiency from kindergarten through 1st grade: 1998–2000
Kindergarten 1st grade
Reading skill Fall Spring Fall Spring
Letter recognition 0.7 0.3 0.2 0.1
Beginning sounds 0.8 0.8 0.8 0.1
Ending sounds 0.5 0.9 1.2 0.3
Sight words 0.1 0.5 1.3 0.6
Words in context 0.1 0.2 0.7 0.8
SOURCE: U.S. Department of Education, NCES. Early Childhood Longitudinal Study, Kindergarten Class of 1998–99 (ECLS-K) Public-use file.
Table S10 Standard errors for the average reading performance, by age: 1971–99
Year Age 9 Age 13 Age 17
1971 1.0 0.9 1.2
1975 0.7 0.8 0.8
1980 1.0 0.9 1.2
1984 0.7 0.5 0.6
1988 1.1 1.0 1.0
1990 1.2 0.8 1.1
1992 0.9 1.2 1.1
1994 1.2 0.9 1.3
1996 1.0 1.0 1.1
1999 1.3 1.0 1.3
SOURCE: U.S. Department of Education, NCES. NAEP 1999 Trends in Academic Progress: Three Decades of Student Performance (NCES 2000–469), 2000.
Trends in the Reading Performance of 9-, 13-, and 17-Year-Olds

Appendix 3 Standard Error Tables
Page 240 | The Condition of Education 2001
Table S11a Standard errors for the difference in average reading scale scores of 9-, 13-, and 17-year-old white and black students: 1971–99
Age 1971 1975 1980 1984 1988 1990 1992 1994 1996 1999
9 1.9 1.4 1.9 1.3 2.8 3.2 2.4 2.6 2.8 2.8
13 1.4 1.4 1.6 1.1 2.6 2.4 2.7 2.7 2.8 2.7
17 2.0 2.1 2.0 1.2 2.7 2.6 2.5 4.2 3.0 2.3
SOURCE: U.S. Department of Education, NCES. National Assessment of Educational Progress (NAEP), 1999 Long-Term Trend Assessment, and NAEP 1999 Trends in Academic Progress: Three Decades of StudentPerformance (NCES 2000–469), 2000.
Indicators 11, 12
Trends in the Achievement Gap in Reading Between White and Black Students
Table S11b Standard errors for the change in average reading scale scores for 17-year-olds, by score quartile and race/ethnicity: 1971–88 and 1988–99
Score quartile and race/ethnicity Difference from 1971–88 Difference from 1988–99
Black
Lower quartile 1.3 3.8
Middle two quartiles 0.8 2.2
Upper quartile 1.5 3.8
White
Lower quartile 0.8 1.3
Middle two quartiles 0.6 1.0
Upper quartile 0.7 1.4
SOURCE: U.S. Department of Education, NCES. National Assessment of Educational Progress (NAEP), 1999 Long-Term Trend Assessment, and NAEP 1999 Trends in Academic Progress: Three Decades of StudentPerformance (NCES 2000–469), 2000.
Table S12 Standard errors for the average mathematics performance, by age: 1973–99
Year Age 9 Age 13 Age 17
1973 0.8 1.1 1.1
1978 0.8 1.1 1.0
1982 1.1 1.1 0.9
1986 1.0 1.2 0.9
1990 0.8 0.9 0.9
1992 0.8 0.9 0.9
1994 0.8 1.0 1.0
1996 0.8 0.8 1.2
1999 0.8 0.8 1.0
SOURCE: U.S. Department of Education, NCES. NAEP 1999 Trends in Academic Progress: Three Decades of Student Performance (NCES 2000–469), 2000.
Trends in the Mathematics Performance of 9-, 13-, and 17-Year-Olds
Appendix 3 Standard Error Tables
The Condition of Education 2001 | Page 241
Indicators 13, 15
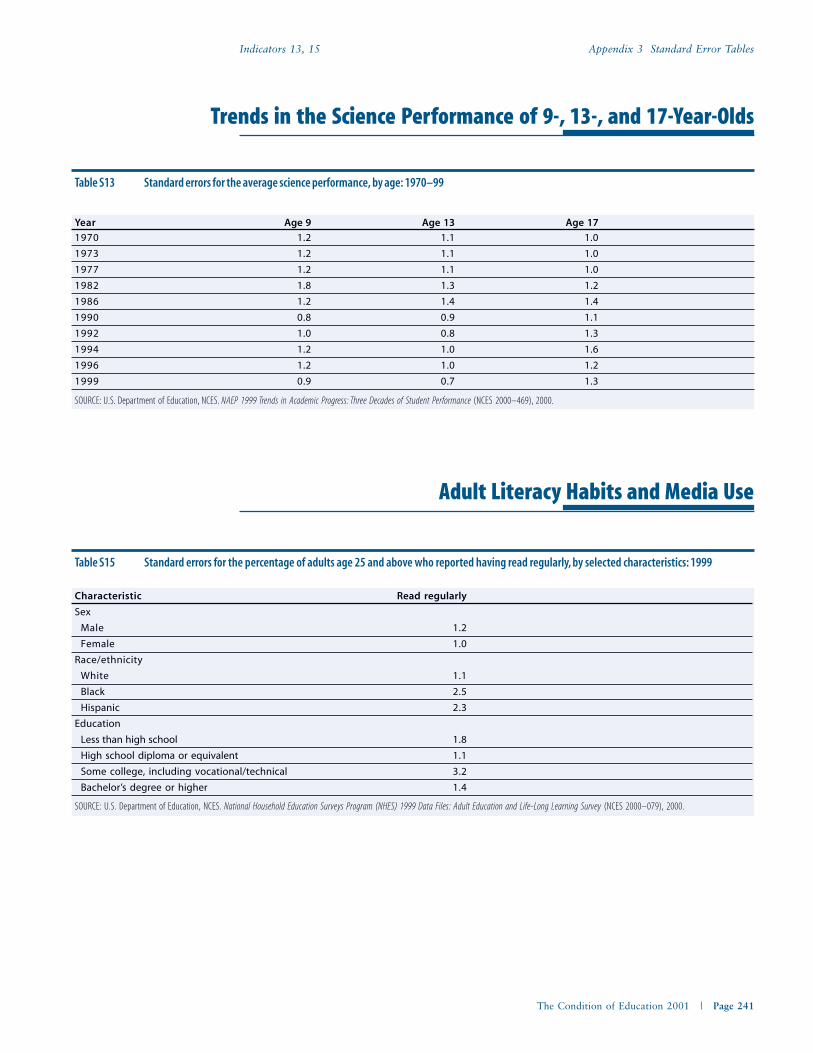
Table S13 Standard errors for the average science performance, by age: 1970–99
Year Age 9 Age 13 Age 17
1970 1.2 1.1 1.0
1973 1.2 1.1 1.0
1977 1.2 1.1 1.0
1982 1.8 1.3 1.2
1986 1.2 1.4 1.4
1990 0.8 0.9 1.1
1992 1.0 0.8 1.3
1994 1.2 1.0 1.6
1996 1.2 1.0 1.2
1999 0.9 0.7 1.3
SOURCE: U.S. Department of Education, NCES. NAEP 1999 Trends in Academic Progress: Three Decades of Student Performance (NCES 2000–469), 2000.
Trends in the Science Performance of 9-, 13-, and 17-Year-Olds
Adult Literacy Habits and Media Use
Characteristic Read regularly
Sex
Male 1.2
Female 1.0
Race/ethnicity
White 1.1
Black 2.5
Hispanic 2.3
Education
Less than high school 1.8
High school diploma or equivalent 1.1
Some college, including vocational/technical 3.2
Bachelor’s degree or higher 1.4
Table S15 Standard errors for the percentage of adults age 25 and above who reported having read regularly, by selected characteristics: 1999
SOURCE: U.S. Department of Education, NCES. National Household Education Surveys Program (NHES) 1999 Data Files: Adult Education and Life-Long Learning Survey (NCES 2000–079), 2000.

Appendix 3 Standard Error Tables
Page 242 | The Condition of Education 2001
Indicators 16, 17
Community Service Participation in Grades 6–12
Table S16 Standard errors for the percentage of students in grades 6–12 who participated in community service, by sex and race/ethnicity: 1996 and 1999
Characteristic 1996 1999
Sex
Male 0.9 0.9
Female 1.1 1.0
Race/ethnicity
White 0.9 0.8
Black 1.9 1.8
Hispanic 1.8 1.4
SOURCE: U.S. Department of Education, NCES. Youth Service-Learning and Community Service Among 6th- Through 12th-Grade Students in the United States: 1996 and 1999 (NCES 2000–028), 2000.
Education and Health
Table S17 Standard errors for the percentage of the population age 25 and above who reported being in excellent or very good health, by educationalattainment and family income: 1997
Some college,High school including Bachelor’s
Less than diploma or vocational/ degree orFamily income high school equivalent technical higher
Less than $20,000 1.2 0.3 0.4 1.4
$20,000–34,999 0.6 0.3 0.5 0.3
$35,000–54,999 0.8 0.4 0.4 0.6
$55,000–74,999 1.7 0.7 0.9 0.5
$75,000 or more 3.2 0.9 0.3 0.5
SOURCE: U.S. Department of Health and Human Services, Centers for Disease Control, National Center for Health Statistics. National Health Interview Survey, 1997.

Appendix 3 Standard Error Tables
The Condition of Education 2001 | Page 243
Annual Earnings of Young Adults
Table S18 Standard errors for the ratio of median annual earnings of all wage and salary workers ages 25–34 whose highest level of education was grades9–11, some college, or a bachelor’s degree or higher, compared with those with a high school diploma or equivalent, by sex: March 1970–99
Some college, including
Grades 9–11 vocational/technical Bachelor’s degree or higher
Year Male Female Male Female Male Female
1970 0.02 0.04 0.02 0.09 0.02 0.09
1971 0.02 0.05 0.02 0.08 0.02 0.08
1972 0.02 0.05 0.02 0.07 0.02 0.07
1973 0.02 0.05 0.02 0.06 0.02 0.06
1974 0.02 0.05 0.02 0.05 0.02 0.06
1975 0.03 0.03 0.02 0.05 0.02 0.06
1976 0.02 0.04 0.02 0.05 0.02 0.05
1977 0.03 0.05 0.02 0.04 0.02 0.05
1978 0.03 0.02 0.03 0.04 0.03 0.05
1979 0.02 0.04 0.02 0.04 0.02 0.04
1980 0.02 0.04 0.02 0.04 0.02 0.04
1981 0.02 0.03 0.02 0.03 0.02 0.04
1982 0.02 0.04 0.02 0.03 0.02 0.05
1983 0.02 0.04 0.02 0.04 0.02 0.04
1984 0.03 0.04 0.04 0.03 0.05 0.04
1985 0.02 0.04 0.02 0.03 0.02 0.04
1986 0.02 0.04 0.02 0.04 0.03 0.04
1987 0.03 0.04 0.02 0.03 0.03 0.04
1988 0.03 0.03 0.02 0.04 0.04 0.03
1989 0.03 0.05 0.02 0.03 0.03 0.04
1990 0.03 0.04 0.03 0.03 0.03 0.04
1991 0.03 0.05 0.03 0.03 0.02 0.04
1992 0.03 0.04 0.03 0.04 0.03 0.05
1993 0.03 0.03 0.02 0.04 0.03 0.06
1994 0.03 0.04 0.03 0.03 0.03 0.05
1995 0.02 0.03 0.03 0.04 0.05 0.06
1996 0.02 0.04 0.02 0.04 0.03 0.05
1997 0.02 0.05 0.02 0.04 0.03 0.05
1998 0.02 0.04 0.03 0.04 0.04 0.05
1999 0.03 0.03 0.02 0.03 0.02 0.03
SOURCE: U.S. Department of Commerce, Bureau of the Census. March Current Population Surveys, various years.
Indicator 18

Appendix 3 Standard Error Tables
Page 244 | The Condition of Education 2001
Table S19 Standard errors for the percentage of high school seniors who reported definite plans for postsecondary education: 1983, 1990, and 1998
Indicators 19, 20
Educational Plans
Postsecondary plans 1983 1990 1998
Attend a technical/vocational school 0.4 0.4 0.5
Graduate from a 2-year college program 0.6 0.6 0.5
Graduate from a 4-year college program 0.8 0.8 0.7
Attend graduate or professional school 0.6 0.6 0.5
SOURCE: University of Michigan, Institute for Social Research. Monitoring the Future Survey: 1983, 1990, and 1998.
Peer Culture of High School Seniors
Table S20 Standard errors for the percentages of 12th-graders who thought that various student characteristics were greatly important for having highstatus in their school, by sex: 1998
SOURCE: University of Michigan, Institute for Social Research. Monitoring the Future Survey: 1998.
Student characteristics Male Female
Being a good athlete 1.9 1.8
Planning to attend college 1.9 1.8
Getting good grades 1.9 1.8
Leading student activities 1.9 1.8
Coming from the right family 1.8 1.7
Having a nice car 1.8 1.6
Knowing a lot about intellectual matters 1.7 1.6

Appendix 3 Standard Error Tables
The Condition of Education 2001 | Page 245
Indicators 21, 22
Table S21 Standard errors for the percentage of high school seniors who reported spending any time on homework per week, and percentage distributionof high school seniors according to homework hours, by work status: 1998
Time Spent on Homework and on the Job
Hours spent doing homework per weekHours at a job Total Any homework 0–4 5–9 10 or more Total — 1.3 1.3 1.1 1.1Any (more than 0) 1.3 1.0 1.5 1.2 1.2
Hours per week at a job0–5 2.0 2.2 2.1 1.7 1.9
6–20 1.9 2.1 2.0 1.7 1.6
More than 20 2.0 2.1 2.0 1.6 1.5
—Not applicable.
SOURCE: University of Michigan, Institute for Social Research. Monitoring the Future Survey: 1998.
Students’ Use of Time
Table S22 Standard errors for the percentage of 9-, 13-, and 17-year-olds who were watching 3 or more hours of television, assigned homework, and readingfor fun daily: 1984 and 1999
SOURCE: U.S. Department of Education, NCES. National Assessment of Educational Progress (NAEP), 1984 and 1999 Long-Term Assessment.
Watched Time on homework Readtelevision Any Less More daily3 or more homework Assigned, than 1 to 2 than for
hours daily assigned not done 1 hour hours 2 hours fun
Age 91984 0.7 1.3 0.3 1.0 0.5 0.2 1.0
1999 1.1 1.6 0.3 1.4 0.7 0.5 1.6
Age 131984 0.9 0.8 0.2 0.7 0.5 0.3 1.0
1999 1.2 1.2 0.4 1.4 1.0 0.8 1.7
Age 171984 0.8 0.9 0.3 0.4 0.5 0.6 0.8
1999 1.2 1.0 0.7 1.0 0.8 0.9 1.7
Appendix 3 Standard Error Tables
Page 246 | The Condition of Education 2001
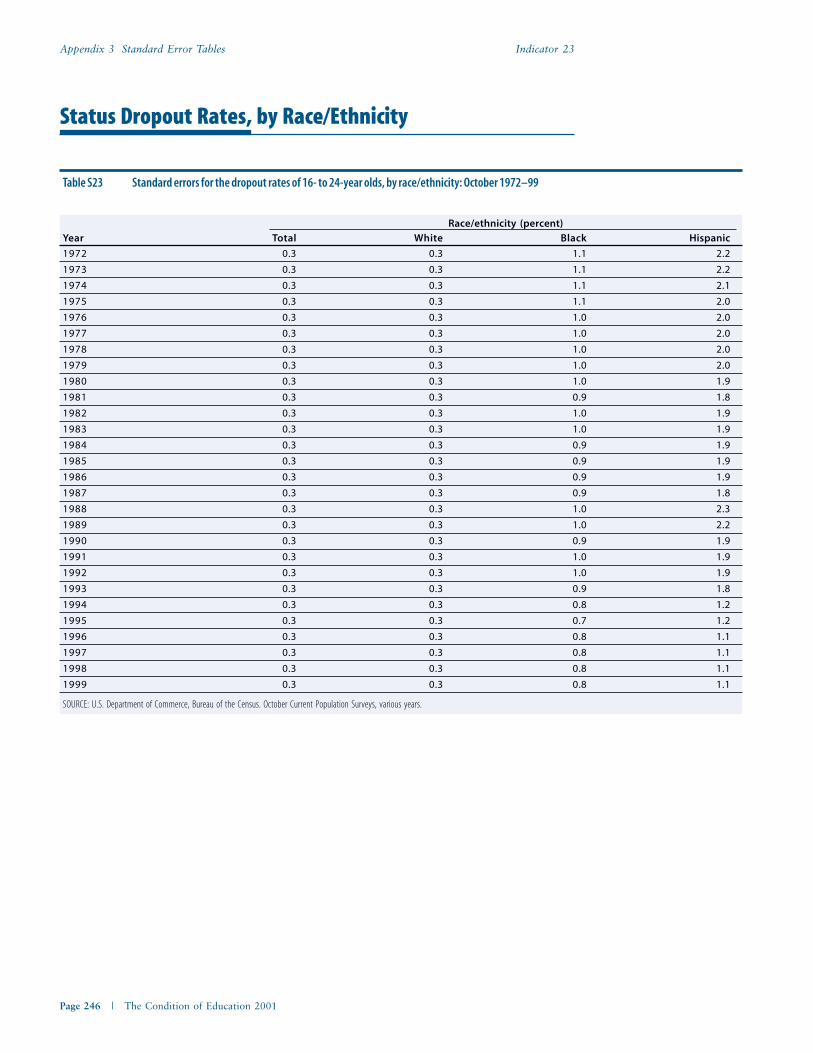
Indicator 23
Table S23 Standard errors for the dropout rates of 16- to 24-year olds, by race/ethnicity: October 1972–99
Status Dropout Rates, by Race/Ethnicity
SOURCE: U.S. Department of Commerce, Bureau of the Census. October Current Population Surveys, various years.
Race/ethnicity (percent)
Year Total White Black Hispanic
1972 0.3 0.3 1.1 2.2
1973 0.3 0.3 1.1 2.2
1974 0.3 0.3 1.1 2.1
1975 0.3 0.3 1.1 2.0
1976 0.3 0.3 1.0 2.0
1977 0.3 0.3 1.0 2.0
1978 0.3 0.3 1.0 2.0
1979 0.3 0.3 1.0 2.0
1980 0.3 0.3 1.0 1.9
1981 0.3 0.3 0.9 1.8
1982 0.3 0.3 1.0 1.9
1983 0.3 0.3 1.0 1.9
1984 0.3 0.3 0.9 1.9
1985 0.3 0.3 0.9 1.9
1986 0.3 0.3 0.9 1.9
1987 0.3 0.3 0.9 1.8
1988 0.3 0.3 1.0 2.3
1989 0.3 0.3 1.0 2.2
1990 0.3 0.3 0.9 1.9
1991 0.3 0.3 1.0 1.9
1992 0.3 0.3 1.0 1.9
1993 0.3 0.3 0.9 1.8
1994 0.3 0.3 0.8 1.2
1995 0.3 0.3 0.7 1.2
1996 0.3 0.3 0.8 1.1
1997 0.3 0.3 0.8 1.1
1998 0.3 0.3 0.8 1.1
1999 0.3 0.3 0.8 1.1

Appendix 3 Standard Error Tables
The Condition of Education 2001 | Page 247
Indicators 24, 25
Mathematics Curriculum and College Enrollment
Table S24 Standard errors for the percentage of 1992 high school graduates who had enrolled in a 4-year institution as of 1994, by highest level of math-ematics completed in high school and parents’ education
Parents with no college Parents with bachelor’sHigh school mathematics level (first-generation) Parents with some college degree or higher
No mathematics/nonacademic 0.8 1.4 5.0
Algebra I and geometry 1.7 1.5 3.3
Algebra II 2.4 2.1 2.4
Advanced (beyond algebra II) 2.8 1.7 1.4
SOURCE: U.S. Department of Education, NCES. National Education Longitudinal Study of 1988 Eighth Graders, “Third Follow-up” (NELS:1988/1994), Data Analysis System.
Table S25 Standard errors for the percentage distribution of tuition and fees charged at public 4-year institutions and estimates reported by 6th- to 12th-graders and their parents: 1999
NOTE: The actual tuition and fees are taken from a universe survey of institutions so there are no sampling standard errors associated with them, and thus they do not appear in this table.
SOURCE: U.S. Department of Education, NCES. National Household Education Surveys Program (NHES), 1999 (Parent and Youth Interview Surveys).
Perceptions of College Costs
Tuition and fees 6th- to 12th-graders’ estimates 6th- to 12th-graders’ parents’ estimates
$8,000 or more 3.1 2.1
$5,000–7,999 3.3 2.1
$4,000–4,999 1.8 1.4
$3,000–3,999 2.6 1.5
$2,000–2,999 2.1 2.0
Less than $2,000 2.0 1.1
Average tuition and fees $430 $228
Appendix 3 Standard Error Tables
Page 248 | The Condition of Education 2001
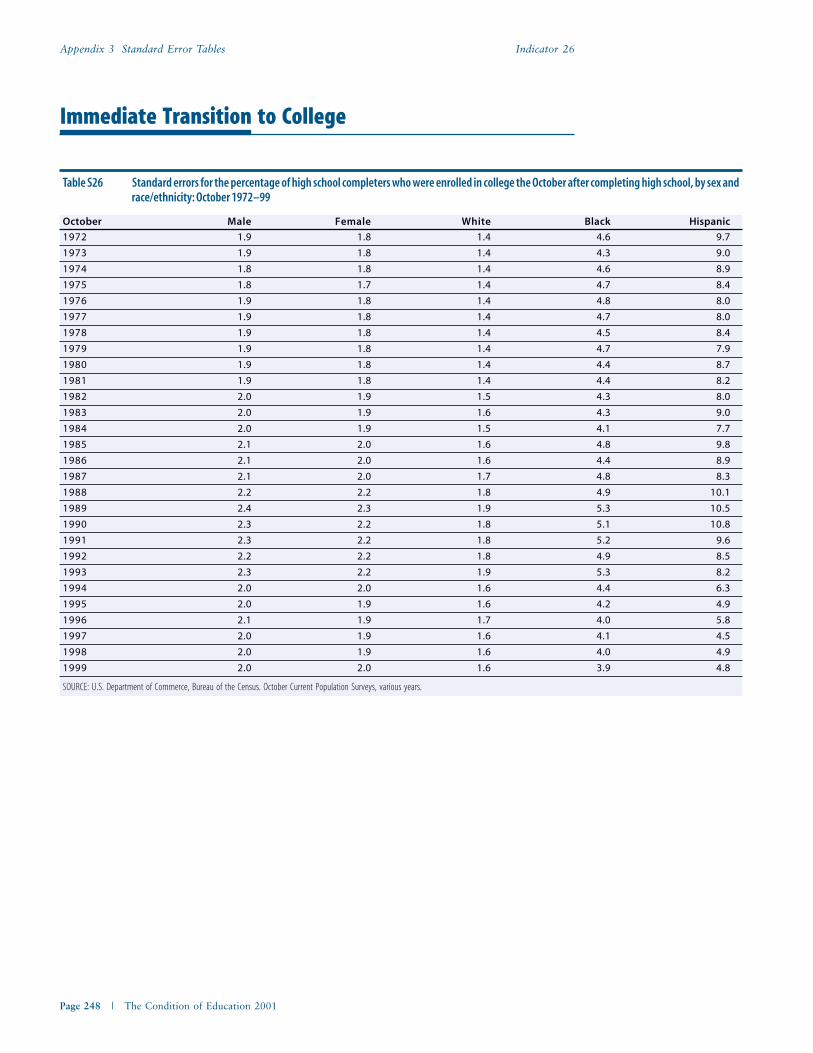
Indicator 26
Immediate Transition to College
Table S26 Standard errors for the percentage of high school completers who were enrolled in college the October after completing high school, by sex andrace/ethnicity: October 1972–99
October Male Female White Black Hispanic
1972 1.9 1.8 1.4 4.6 9.7
1973 1.9 1.8 1.4 4.3 9.0
1974 1.8 1.8 1.4 4.6 8.9
1975 1.8 1.7 1.4 4.7 8.4
1976 1.9 1.8 1.4 4.8 8.0
1977 1.9 1.8 1.4 4.7 8.0
1978 1.9 1.8 1.4 4.5 8.4
1979 1.9 1.8 1.4 4.7 7.9
1980 1.9 1.8 1.4 4.4 8.7
1981 1.9 1.8 1.4 4.4 8.2
1982 2.0 1.9 1.5 4.3 8.0
1983 2.0 1.9 1.6 4.3 9.0
1984 2.0 1.9 1.5 4.1 7.7
1985 2.1 2.0 1.6 4.8 9.8
1986 2.1 2.0 1.6 4.4 8.9
1987 2.1 2.0 1.7 4.8 8.3
1988 2.2 2.2 1.8 4.9 10.1
1989 2.4 2.3 1.9 5.3 10.5
1990 2.3 2.2 1.8 5.1 10.8
1991 2.3 2.2 1.8 5.2 9.6
1992 2.2 2.2 1.8 4.9 8.5
1993 2.3 2.2 1.9 5.3 8.2
1994 2.0 2.0 1.6 4.4 6.3
1995 2.0 1.9 1.6 4.2 4.9
1996 2.1 1.9 1.7 4.0 5.8
1997 2.0 1.9 1.6 4.1 4.5
1998 2.0 1.9 1.6 4.0 4.9
1999 2.0 2.0 1.6 3.9 4.8
SOURCE: U.S. Department of Commerce, Bureau of the Census. October Current Population Surveys, various years.

Appendix 3 Standard Error Tables
The Condition of Education 2001 | Page 249
Table S27 Standard errors for the percentage distribution of 1995–96 beginning postsecondary students according to attainment by 1998, by initial goaland type of first institution
* Value less than 0.05.
SOURCE: U.S. Department of Education, NCES. Beginning Postsecondary Students Longitudinal Study, “First Follow-up” (BPS:1996/1998).
Persistence of Beginning Postsecondary Students
No degree
Still enrolled
Initial goal and type Highest degree attained by 1998 Less-than Notof first institution Certificate Associate’s Bachelor’s 4-year 4-year enrolled
Total 0.7 0.5 0.1 0.9 0.9 1.1
Certificate 3.0 0.7 ( * ) 1.9 0.3 3.0Public 2-year 6.7 1.8 ( * ) 4.6 0.2 6.8
Private, for-profit 2.6 0.1 ( * ) 1.3 0.3 2.4
Associate’s degree 0.9 1.6 0.1 2.2 1.0 2.5Public 2-year 1.1 1.7 ( * ) 2.6 1.2 2.9
Bachelor’s degree or transfer 0.3 0.4 0.2 1.0 1.1 1.0Public 2-year 1.0 1.5 ( * ) 3.7 3.0 3.8
Public 4-year 0.2 0.3 0.3 0.5 1.0 0.8
Private, not-for-profit 4-year 0.4 0.4 0.3 0.5 1.2 0.9
Indicators 27, 28
High School Academic Preparation and Postsecondary Progress
Table S28 Standard errors for the percentage of 1995–96 beginning postsecondary students who persisted toward a bachelor’s degree, by the academicrigor of their secondary school curriculum and first-generation status: June 1998
Curriculum First-generation At least one parent has bachelor’s degree
Total 1.7 1.2
Core New Basics or below 3.3 2.6
Beyond Core New Basics I and II 2.9 2.2
Rigorous 4.1 2.0
SOURCE: U.S. Department of Education, NCES. Beginning Postsecondary Students Longitudinal Study, “First Follow-up” (BPS:1996/1998).
Appendix 3 Standard Error Tables
Page 250 | The Condition of Education 2001
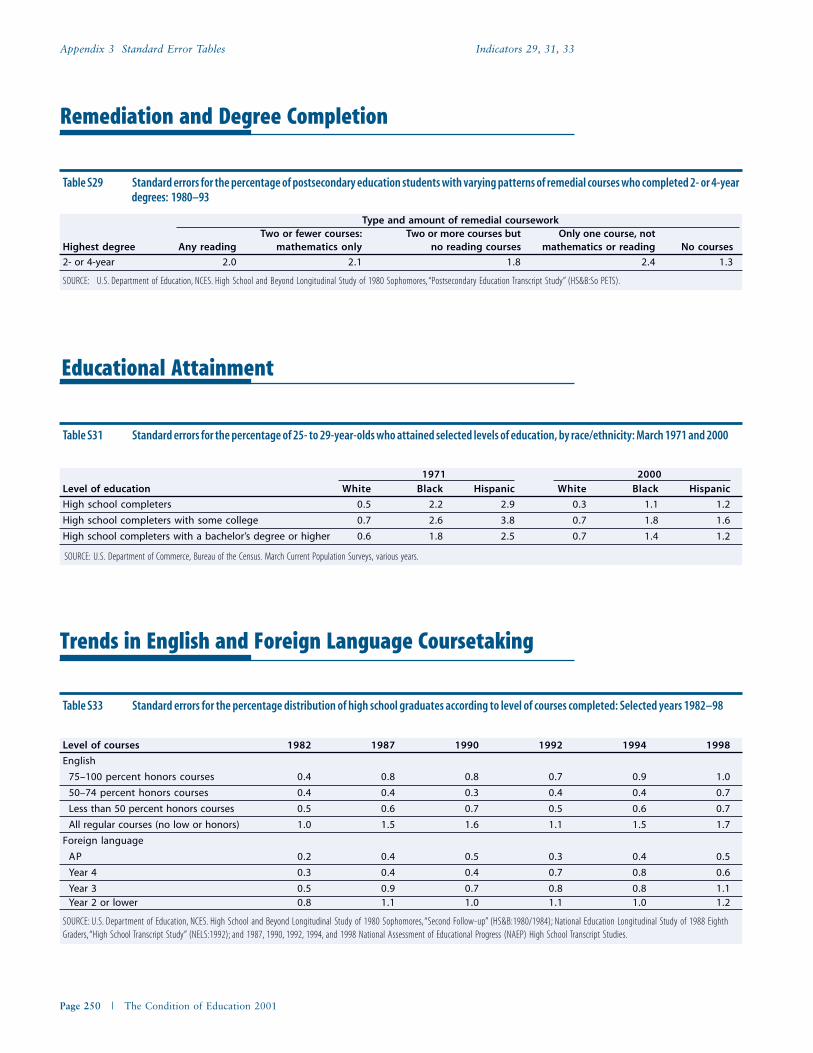
Type and amount of remedial courseworkTwo or fewer courses: Two or more courses but Only one course, not
Highest degree Any reading mathematics only no reading courses mathematics or reading No courses
2- or 4-year 2.0 2.1 1.8 2.4 1.3
Table S29 Standard errors for the percentage of postsecondary education students with varying patterns of remedial courses who completed 2- or 4-yeardegrees: 1980–93
SOURCE: U.S. Department of Education, NCES. High School and Beyond Longitudinal Study of 1980 Sophomores, “Postsecondary Education Transcript Study” (HS&B:So PETS).
Indicators 29, 31, 33
Remediation and Degree Completion
Educational Attainment
Table S31 Standard errors for the percentage of 25- to 29-year-olds who attained selected levels of education, by race/ethnicity: March 1971 and 2000
1971 2000Level of education White Black Hispanic White Black Hispanic
High school completers 0.5 2.2 2.9 0.3 1.1 1.2
High school completers with some college 0.7 2.6 3.8 0.7 1.8 1.6
High school completers with a bachelor’s degree or higher 0.6 1.8 2.5 0.7 1.4 1.2
SOURCE: U.S. Department of Commerce, Bureau of the Census. March Current Population Surveys, various years.
Table S33 Standard errors for the percentage distribution of high school graduates according to level of courses completed: Selected years 1982–98
Level of courses 1982 1987 1990 1992 1994 1998
English
75–100 percent honors courses 0.4 0.8 0.8 0.7 0.9 1.0
50–74 percent honors courses 0.4 0.4 0.3 0.4 0.4 0.7
Less than 50 percent honors courses 0.5 0.6 0.7 0.5 0.6 0.7
All regular courses (no low or honors) 1.0 1.5 1.6 1.1 1.5 1.7
Foreign language
AP 0.2 0.4 0.5 0.3 0.4 0.5
Year 4 0.3 0.4 0.4 0.7 0.8 0.6
Year 3 0.5 0.9 0.7 0.8 0.8 1.1Year 2 or lower 0.8 1.1 1.0 1.1 1.0 1.2
SOURCE: U.S. Department of Education, NCES. High School and Beyond Longitudinal Study of 1980 Sophomores, “Second Follow-up” (HS&B:1980/1984); National Education Longitudinal Study of 1988 EighthGraders, “High School Transcript Study” (NELS:1992); and 1987, 1990, 1992, 1994, and 1998 National Assessment of Educational Progress (NAEP) High School Transcript Studies.
Trends in English and Foreign Language Coursetaking

Appendix 3 Standard Error Tables
The Condition of Education 2001 | Page 251
Table S34a Standard errors for the percentage of 1998 high school graduates who had taken advanced academic English courses and a foreign language,by selected characteristics: 1998
Characteristic Completed some honors English courses Completed Year 3 or higher of a foreign language
Male 1.4 1.4
Female 1.3 1.7
Public 1.4 1.4
Private 2.7 5.6
White 1.6 1.8
Black 2.2 2.2
Hispanic 1.7 2.3
Asian/Pacific Islander 4.3 2.7
American Indian/Alaskan Native 3.0 3.3
SOURCE: U.S. Department of Education, NCES. 1998 National Assessment of Educational Progress (NAEP) High School Transcript Study.
Coursetaking in English and Foreign Languages
Indicator 34
Regular
English
50% or Less than (no low or Less than
No more of 50% of honors) 50% 50–74% 75–100%
Characteristic English courses courses Total courses honors honors honors Total
Total 0.1 0.6 1.0 1.5 1.7 0.7 0.7 1.0 1.3
Sex
Male 0.2 0.7 1.2 1.8 1.9 0.7 0.6 1.0 1.4
Female 0.1 0.5 1.0 1.3 1.6 0.8 0.8 1.1 1.3
Race/ethnicity
White 0.1 0.6 1.2 1.6 1.8 0.9 0.8 1.3 1.6
Black 0.3 1.2 1.3 2.0 2.8 0.8 1.0 1.2 2.2
Hispanic 0.4 1.6 1.8 3.2 3.2 0.9 0.7 1.0 1.7
Asian/Pacific Islander 0.2 1.1 1.8 2.5 6.4 1.3 1.9 2.8 4.3
American Indian/
Alaskan Native 0.3 2.1 2.7 3.6 4.9 2.3 1.9 1.9 3.0
Met Core New Basics?
Yes 0.1 0.2 0.8 0.9 2.1 1.0 1.1 1.4 1.9
No 0.2 1.0 1.5 2.1 2.3 0.6 0.6 0.9 1.4
Control of school
Public 0.1 0.6 1.1 1.5 1.8 0.6 0.7 1.0 1.4
Private — — 1.7 1.7 3.1 3.3 3.1 4.1 2.7
Table S34b Standard errors for the percentage distribution of high school graduates according to the type of English courses taken, by student and schoolcharacteristics: 1998
Advanced academic levelLow academic level
— Not available.
SOURCE: U.S. Department of Education, NCES. 1998 National Assessment of Educational Progress (NAEP) High School Transcript Study.
Appendix 3 Standard Error Tables
Page 252 | The Condition of Education 2001
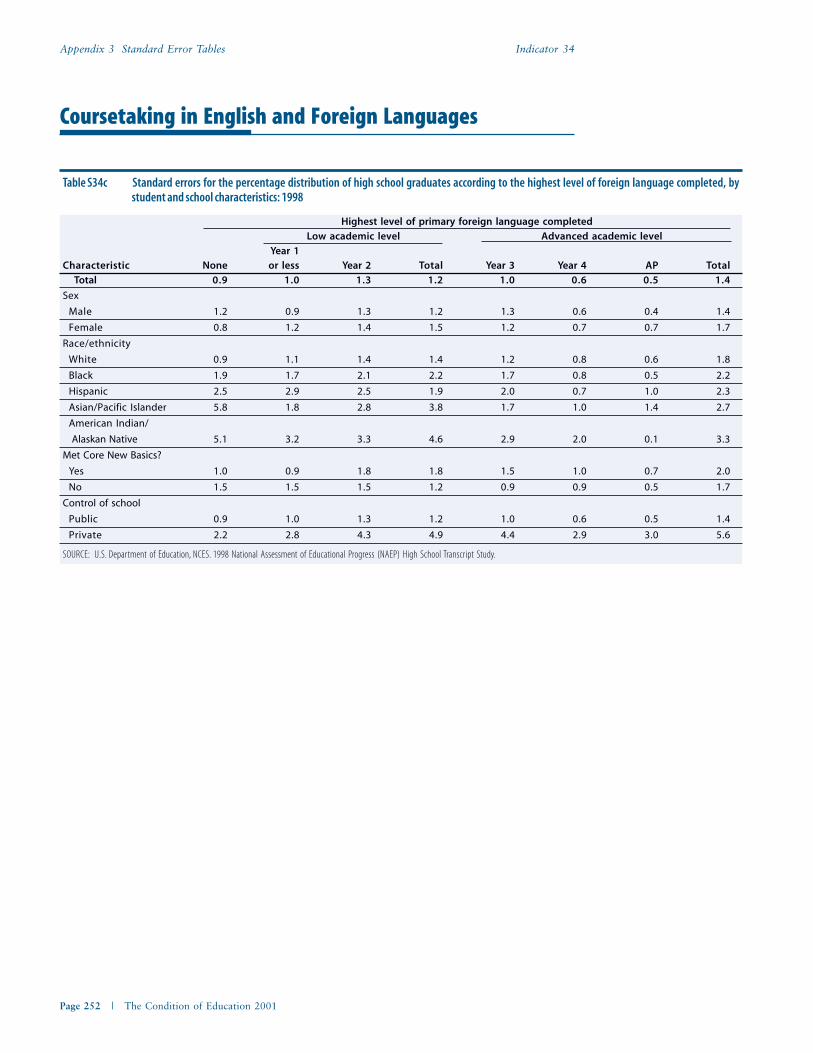
SOURCE: U.S. Department of Education, NCES. 1998 National Assessment of Educational Progress (NAEP) High School Transcript Study.
Coursetaking in English and Foreign Languages
Highest level of primary foreign language completed
Low academic level Advanced academic level
Year 1Characteristic None or less Year 2 Total Year 3 Year 4 AP Total
Total 0.9 1.0 1.3 1.2 1.0 0.6 0.5 1.4
Sex
Male 1.2 0.9 1.3 1.2 1.3 0.6 0.4 1.4
Female 0.8 1.2 1.4 1.5 1.2 0.7 0.7 1.7
Race/ethnicity
White 0.9 1.1 1.4 1.4 1.2 0.8 0.6 1.8
Black 1.9 1.7 2.1 2.2 1.7 0.8 0.5 2.2
Hispanic 2.5 2.9 2.5 1.9 2.0 0.7 1.0 2.3
Asian/Pacific Islander 5.8 1.8 2.8 3.8 1.7 1.0 1.4 2.7
American Indian/
Alaskan Native 5.1 3.2 3.3 4.6 2.9 2.0 0.1 3.3
Met Core New Basics?
Yes 1.0 0.9 1.8 1.8 1.5 1.0 0.7 2.0
No 1.5 1.5 1.5 1.2 0.9 0.9 0.5 1.7
Control of school
Public 0.9 1.0 1.3 1.2 1.0 0.6 0.5 1.4
Private 2.2 2.8 4.3 4.9 4.4 2.9 3.0 5.6
Table S34c Standard errors for the percentage distribution of high school graduates according to the highest level of foreign language completed, bystudent and school characteristics: 1998
Indicator 34
Appendix 3 Standard Error Tables
The Condition of Education 2001 | Page 253
Indicators 35, 36
Trends in High School Occupational Coursetaking
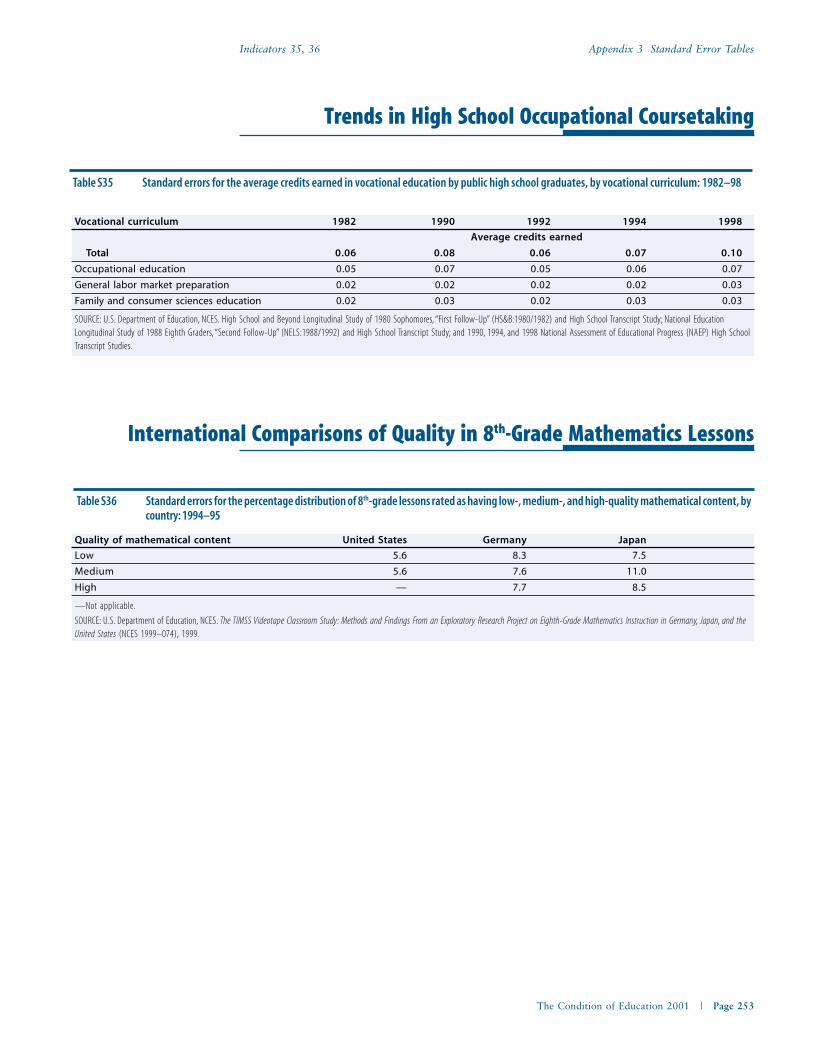
Table S35 Standard errors for the average credits earned in vocational education by public high school graduates, by vocational curriculum: 1982–98
Vocational curriculum 1982 1990 1992 1994 1998
Average credits earned
Total 0.06 0.08 0.06 0.07 0.10
Occupational education 0.05 0.07 0.05 0.06 0.07
General labor market preparation 0.02 0.02 0.02 0.02 0.03
Family and consumer sciences education 0.02 0.03 0.02 0.03 0.03
SOURCE: U.S. Department of Education, NCES. High School and Beyond Longitudinal Study of 1980 Sophomores, “First Follow-Up” (HS&B:1980/1982) and High School Transcript Study; National EducationLongitudinal Study of 1988 Eighth Graders, “Second Follow-Up” (NELS:1988/1992) and High School Transcript Study; and 1990, 1994, and 1998 National Assessment of Educational Progress (NAEP) High SchoolTranscript Studies.
Table S36 Standard errors for the percentage distribution of 8th-grade lessons rated as having low-, medium-, and high-quality mathematical content, bycountry: 1994–95
Quality of mathematical content United States Germany Japan
Low 5.6 8.3 7.5
Medium 5.6 7.6 11.0
High — 7.7 8.5
—Not applicable.
SOURCE: U.S. Department of Education, NCES. The TIMSS Videotape Classroom Study: Methods and Findings From an Exploratory Research Project on Eighth-Grade Mathematics Instruction in Germany, Japan, and theUnited States (NCES 1999–074), 1999.
International Comparisons of Quality in 8th-Grade Mathematics Lessons

Appendix 3 Standard Error Tables
Page 254 | The Condition of Education 2001
Teachers’ Readiness to Use Computers and the Internet
Table S39 Standard errors for the percentage distribution of public school teachers according to how well prepared they felt to use computers and theInternet for classroom instruction, by number of years of teaching experience: 1999
Years of teaching experience Not at all prepared Somewhat prepared Well prepared Very well prepared
3 or fewer 2.5 3.6 3.0 2.5
4–9 2.0 2.8 2.4 1.9
10–19 1.6 2.7 2.6 1.5
20 or more 1.2 2.0 1.6 1.1
SOURCE: U.S. Department of Education, NCES. Fast Response Survey System, “Public School Teachers’ Use of Computers and the Internet,” FRSS 70, 1999.
Indicators 37, 39, 41
Class Size of Kindergartens
Table S37 Standard errors for the percentage distribution of kindergarten classrooms according to control of school and class size: Fall 1998
SOURCE: U.S. Department of Education, NCES. Early Childhood Longitudinal Study, “Kindergarten Class of 1998–99,” Fall 1998.
Control of school 15 or fewer students More than 15 studentsPublic 1.9 1.9
Private 3.8 3.8
School Choice and Parental Satisfaction
Table S41 Standard errors for the percentage of students in grades 3–12 whose parents reported being very satisfied with aspects of their child’s school,by type of choice: 1999
School’s academic School’s order
School choice Child’s school Child’s teachers standards and discipline
Public-assigned 0.7 0.6 0.8 0.8
Public-chosen 1.0 1.0 1.3 1.3
Private 1.4 1.5 1.4 1.4
NOTE: Data have been revised from previously published figures.
SOURCE: U.S. Department of Education, NCES. National Household Education Surveys Program (NHES), 1999 (Parent Interview Survey).
Appendix 3 Standard Error Tables
The Condition of Education 2001 | Page 255
Indicators 42, 43
Qualifications of College Graduates Who Enter Teaching
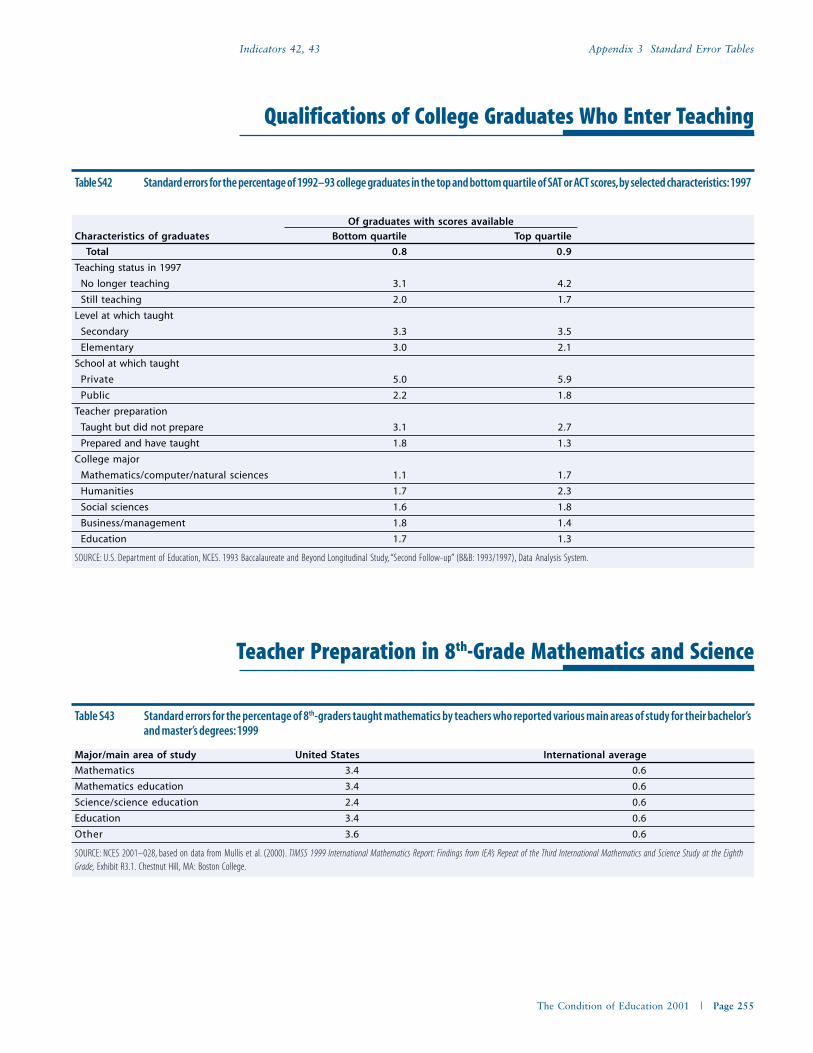
Table S42 Standard errors for the percentage of 1992–93 college graduates in the top and bottom quartile of SAT or ACT scores, by selected characteristics: 1997
Of graduates with scores available
Characteristics of graduates Bottom quartile Top quartile
Total 0.8 0.9
Teaching status in 1997
No longer teaching 3.1 4.2
Still teaching 2.0 1.7
Level at which taught
Secondary 3.3 3.5
Elementary 3.0 2.1
School at which taught
Private 5.0 5.9
Public 2.2 1.8
Teacher preparation
Taught but did not prepare 3.1 2.7
Prepared and have taught 1.8 1.3
College major
Mathematics/computer/natural sciences 1.1 1.7
Humanities 1.7 2.3
Social sciences 1.6 1.8
Business/management 1.8 1.4
Education 1.7 1.3
SOURCE: U.S. Department of Education, NCES. 1993 Baccalaureate and Beyond Longitudinal Study, “Second Follow-up” (B&B: 1993/1997), Data Analysis System.
Teacher Preparation in 8th-Grade Mathematics and Science
Table S43 Standard errors for the percentage of 8th-graders taught mathematics by teachers who reported various main areas of study for their bachelor’sand master’s degrees: 1999
Major/main area of study United States International average
Mathematics 3.4 0.6
Mathematics education 3.4 0.6
Science/science education 2.4 0.6
Education 3.4 0.6
Other 3.6 0.6
SOURCE: NCES 2001–028, based on data from Mullis et al. (2000). TIMSS 1999 International Mathematics Report: Findings from IEA’s Repeat of the Third International Mathematics and Science Study at the EighthGrade, Exhibit R3.1. Chestnut Hill, MA: Boston College.

Appendix 3 Standard Error Tables
Page 256 | The Condition of Education 2001
Indicators 44, 45
School-Related Violence and Safety
Table S44 Standard errors for the percentage of high school students who reported being threatened or injured with a weapon, engaging in a physicalfight, and carrying a weapon on school property: 1993, 1995, 1997, and 1999
Risk behaviors 1993 1995 1997 1999
Was threatened or injured with a weapon
within the past 12 months 0.4 0.5 0.5 0.4
In a physical fight within the past 12 months 0.6 0.8 0.6 0.3
Carried a weapon within the past 30 days 0.7 0.5 0.6 0.6
SOURCE: U.S. Department of Health and Human Services, Public Health Service, Centers for Disease Control and Prevention, National Center for Health Statistics. National Health Interview Survey—YouthRisk Behavior Survey, 1993, 1995, 1997, and 1999.
Overcrowding in Schools
Table S45 Standard errors for the percentage distribution of public schools reporting that they are underenrolled, at capacity, or overcrowded, by schoolenrollment size and region: 1999
Underenrolled OvercrowdedMore than More than
25 percent 6–25 percent Within 5 percent 6–25 percent 25 percent
Characteristic under capacity under capacity of capacity over capacity over capacity Total 1.5 1.7 1.5 1.2 0.9
Enrollment
600 or more 1.4 3.4 2.0 1.6 1.8
300–599 2.5 2.8 2.6 2.5 1.2
Less than 300 5.0 4.2 3.4 2.9 1.6
Region
Northeast 3.3 4.2 4.3 3.9 1.6
South 3.0 2.7 2.9 2.1 1.6
Midwest 3.0 3.5 2.8 2.1 1.5
West 3.2 3.3 3.1 3.2 2.7
SOURCE: U.S. Department of Education, NCES. Fast Response Survey System (FRSS), Condition of America’s Public School Facilities: 1999 (NCES 2000–032), 2000, and unpublished data.

Appendix 3 Standard Error Tables
The Condition of Education 2001 | Page 257
Primary instructional method Grading methods
Lab/ Field- Competency-Teaching discipline Lecture Seminar clinic work Other Curve based Total 0.5 0.5 0.5 0.3 0.3 0.6 0.6
Agriculture/home economics 2.9 2.2 4.4 3.0 1.3 3.7 3.5
Business 1.4 1.3 1.5 0.6 1.1 2.0 2.1
Education 2.0 1.8 1.4 1.5 1.1 1.9 2.1
Engineering 2.4 1.9 2.4 0.7 1.4 2.6 3.1
Fine arts 2.0 1.5 2.1 1.1 1.6 1.6 2.0
Health sciences 1.5 1.1 1.7 1.1 0.8 1.7 1.9
Humanities 1.1 1.0 1.0 0.6 0.7 1.2 1.4
Natural sciences 1.1 0.8 1.2 0.3 0.7 1.3 1.4
Social sciences 1.2 2.0 1.1 0.7 0.8 2.2 2.0
Table S46 Standard errors for the percentage of postsecondary instructional faculty and staff who used specific instructional and grading methods in someor all of their classes, by teaching discipline: Fall 1998
Instructional Methods of Postsecondary Faculty
SOURCE: U.S. Department of Education, NCES. National Study of Postsecondary Faculty (NSOPF:1999), Data Analysis System.
Indicators 46, 47
Instructional Faculty and Staff Who Teach Undergraduates
Table S47 Standard errors for the percentage of full-time instructional faculty and staff in 4-year institutions who taught at least one undergraduateclass for credit or who taught only undergraduate classes for credit, by academic rank: Fall 1998
Taught at least one Taught only undergraduateundergraduate class for credit classes for credit
Academic rank All Doctoral Nondoctoral All Doctoral Nondoctoral
Total 1.0 1.4 1.3 1.2 1.3 1.7
Professor 1.4 2.0 1.7 1.7 1.9 2.6
Associate professor 1.6 2.3 1.7 1.7 2.2 2.3
Assistant professor 1.5 2.0 2.0 1.8 2.4 2.3
Instructor 1.8 3.4 1.9 2.3 4.2 2.6
Lecturer 3.0 4.7 1.8 4.0 5.1 6.2
SOURCE: U.S. Department of Education, NCES. National Study of Postsecondary Faculty (NSOPF:1999), Data Analysis System.
Appendix 3 Standard Error Tables
Page 258 | The Condition of Education 2001
Indicators 48, 49
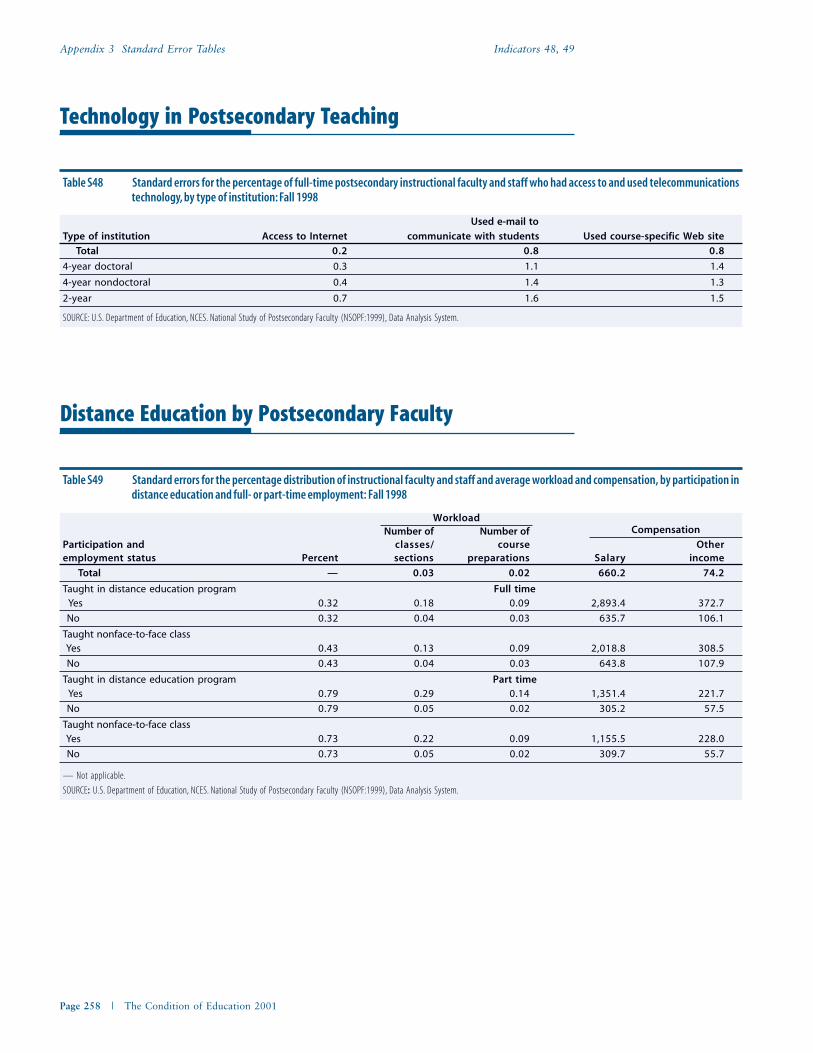
Table S48 Standard errors for the percentage of full-time postsecondary instructional faculty and staff who had access to and used telecommunicationstechnology, by type of institution: Fall 1998
Technology in Postsecondary Teaching
Used e-mail to
Type of institution Access to Internet communicate with students Used course-specific Web site
Total 0.2 0.8 0.8
4-year doctoral 0.3 1.1 1.4
4-year nondoctoral 0.4 1.4 1.3
2-year 0.7 1.6 1.5
SOURCE: U.S. Department of Education, NCES. National Study of Postsecondary Faculty (NSOPF:1999), Data Analysis System.
Table S49 Standard errors for the percentage distribution of instructional faculty and staff and average workload and compensation, by participation indistance education and full- or part-time employment: Fall 1998
Number of Number ofParticipation and classes/ course Otheremployment status Percent sections preparations Salary income
Total — 0.03 0.02 660.2 74.2
Taught in distance education program Full time Yes 0.32 0.18 0.09 2,893.4 372.7
No 0.32 0.04 0.03 635.7 106.1
Taught nonface-to-face class Yes 0.43 0.13 0.09 2,018.8 308.5
No 0.43 0.04 0.03 643.8 107.9
Taught in distance education program Part time Yes 0.79 0.29 0.14 1,351.4 221.7
No 0.79 0.05 0.02 305.2 57.5
Taught nonface-to-face class Yes 0.73 0.22 0.09 1,155.5 228.0
No 0.73 0.05 0.02 309.7 55.7
— Not applicable.
SOURCE: U.S. Department of Education, NCES. National Study of Postsecondary Faculty (NSOPF:1999), Data Analysis System.
Distance Education by Postsecondary Faculty
WorkloadCompensation
Appendix 3 Standard Error Tables
The Condition of Education 2001 | Page 259
Part-Time Instructional Faculty and Staff
Indicators 50, 51
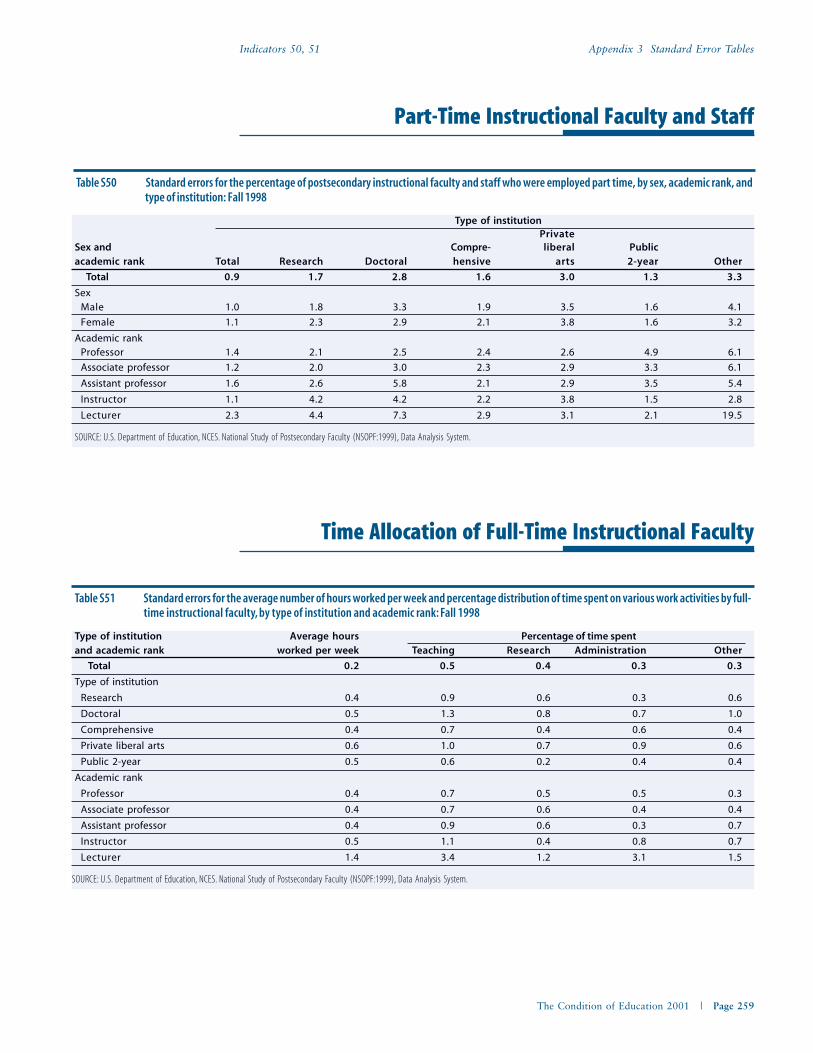
Type of institutionPrivate
Sex and Compre- liberal Publicacademic rank Total Research Doctoral hensive arts 2-year Other
Total 0.9 1.7 2.8 1.6 3.0 1.3 3.3
SexMale 1.0 1.8 3.3 1.9 3.5 1.6 4.1
Female 1.1 2.3 2.9 2.1 3.8 1.6 3.2
Academic rankProfessor 1.4 2.1 2.5 2.4 2.6 4.9 6.1
Associate professor 1.2 2.0 3.0 2.3 2.9 3.3 6.1
Assistant professor 1.6 2.6 5.8 2.1 2.9 3.5 5.4
Instructor 1.1 4.2 4.2 2.2 3.8 1.5 2.8
Lecturer 2.3 4.4 7.3 2.9 3.1 2.1 19.5
Table S50 Standard errors for the percentage of postsecondary instructional faculty and staff who were employed part time, by sex, academic rank, andtype of institution: Fall 1998
SOURCE: U.S. Department of Education, NCES. National Study of Postsecondary Faculty (NSOPF:1999), Data Analysis System.
Time Allocation of Full-Time Instructional Faculty
Table S51 Standard errors for the average number of hours worked per week and percentage distribution of time spent on various work activities by full-time instructional faculty, by type of institution and academic rank: Fall 1998
Type of institution Average hours Percentage of time spentand academic rank worked per week Teaching Research Administration Other
Total 0.2 0.5 0.4 0.3 0.3
Type of institution
Research 0.4 0.9 0.6 0.3 0.6
Doctoral 0.5 1.3 0.8 0.7 1.0
Comprehensive 0.4 0.7 0.4 0.6 0.4
Private liberal arts 0.6 1.0 0.7 0.9 0.6
Public 2-year 0.5 0.6 0.2 0.4 0.4
Academic rank
Professor 0.4 0.7 0.5 0.5 0.3
Associate professor 0.4 0.7 0.6 0.4 0.4
Assistant professor 0.4 0.9 0.6 0.3 0.7
Instructor 0.5 1.1 0.4 0.8 0.7
Lecturer 1.4 3.4 1.2 3.1 1.5
SOURCE: U.S. Department of Education, NCES. National Study of Postsecondary Faculty (NSOPF:1999), Data Analysis System.

Appendix 3 Standard Error Tables
Page 260 | The Condition of Education 2001
Table S54 Standard errors for the percentage of students in grades K–12 whose parents reported involvement in specific activities in their child’s school:1999
Parental Involvement in Schools
Parental involvement K–12 K–5 6–8 9–12
Attended general meeting 0.5 0.5 0.9 0.9Attended scheduled meeting
with teacher 0.5 0.4 0.9 1.1
Attended school event 0.4 0.6 0.8 0.9Acted as a volunteer or
served on a committee 0.4 0.5 0.8 0.8Indicated involvement in any
of the four activities 0.3 0.2 0.5 0.7
NOTE: Data have been revised from previously published figures.
SOURCE: U.S. Department of Education, NCES. National Household Education Surveys Program (NHES), 1999 (Parent Interview Survey).
Indicators 52, 53, 54
Early Reading Activities
Table S52 Standard errors for the percentage of 3- to 5-year-old children not yet enrolled in kindergarten who participated in home literacy activitieswith a family member three or more times in the week before the survey, by number of risk factors: 1999
Taught letters, Taught songs Did arts
Number of risk factors Read to Told a story words, or numbers or music and crafts
None 0.7 1.4 1.2 1.4 1.4
One 1.7 2.0 2.2 2.2 2.2
Two or more 1.6 2.0 1.8 1.7 1.7
SOURCE: U.S. Department of Education, NCES. Home Literacy Activities and Signs of Children’s Emerging Literacy, 1993 and 1999 (NCES 2000–026), and National Household Education Surveys Program(NHES), 1993 and 1999.
Before and After School Care
Table S53 Standard errors for the percentage of children in grades K–8 who received various types of care before and after school: 1999
NOTE: Data have been revised from previously published figures.
SOURCE: U.S. Department of Education, NCES. National Household Education Surveys Program (NHES), 1999 (Parent Interview Survey).
Type of care Total K–5 6–8
Received care from relative 0.5 0.6 0.7
Received care from nonrelative 0.3 0.4 0.4
Attended center-based program 0.4 0.5 0.6
Child cared for self 0.4 0.3 0.8
Parental care only 0.6 0.7 0.9
Appendix 3 Standard Error Tables
The Condition of Education 2001 | Page 261
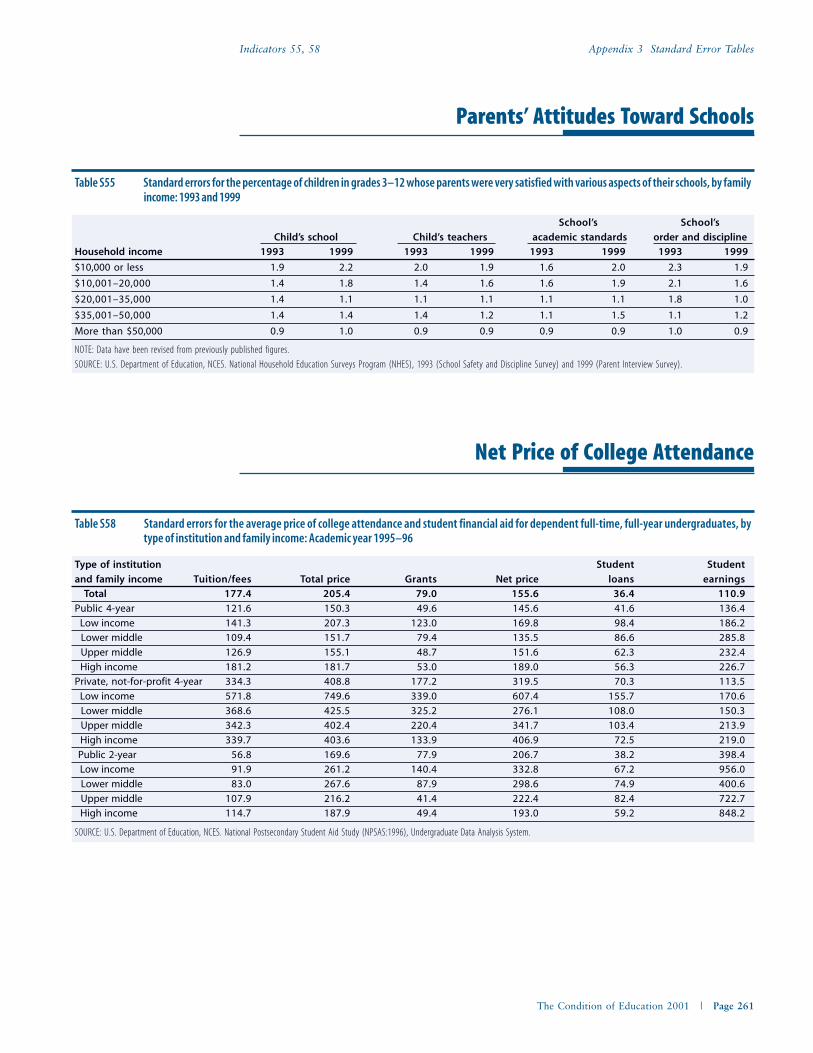
Table S58 Standard errors for the average price of college attendance and student financial aid for dependent full-time, full-year undergraduates, bytype of institution and family income: Academic year 1995–96
Type of institution Student Student
and family income Tuition/fees Total price Grants Net price loans earnings Total 177.4 205.4 79.0 155.6 36.4 110.9
Public 4-year 121.6 150.3 49.6 145.6 41.6 136.4
Low income 141.3 207.3 123.0 169.8 98.4 186.2
Lower middle 109.4 151.7 79.4 135.5 86.6 285.8
Upper middle 126.9 155.1 48.7 151.6 62.3 232.4
High income 181.2 181.7 53.0 189.0 56.3 226.7
Private, not-for-profit 4-year 334.3 408.8 177.2 319.5 70.3 113.5
Low income 571.8 749.6 339.0 607.4 155.7 170.6
Lower middle 368.6 425.5 325.2 276.1 108.0 150.3
Upper middle 342.3 402.4 220.4 341.7 103.4 213.9
High income 339.7 403.6 133.9 406.9 72.5 219.0
Public 2-year 56.8 169.6 77.9 206.7 38.2 398.4
Low income 91.9 261.2 140.4 332.8 67.2 956.0
Lower middle 83.0 267.6 87.9 298.6 74.9 400.6
Upper middle 107.9 216.2 41.4 222.4 82.4 722.7
High income 114.7 187.9 49.4 193.0 59.2 848.2
Net Price of College Attendance
SOURCE: U.S. Department of Education, NCES. National Postsecondary Student Aid Study (NPSAS:1996), Undergraduate Data Analysis System.
Parents’ Attitudes Toward Schools
Table S55 Standard errors for the percentage of children in grades 3–12 whose parents were very satisfied with various aspects of their schools, by familyincome: 1993 and 1999
School’s School’s
Child’s school Child’s teachers academic standards order and disciplineHousehold income 1993 1999 1993 1999 1993 1999 1993 1999
$10,000 or less 1.9 2.2 2.0 1.9 1.6 2.0 2.3 1.9
$10,001–20,000 1.4 1.8 1.4 1.6 1.6 1.9 2.1 1.6
$20,001–35,000 1.4 1.1 1.1 1.1 1.1 1.1 1.8 1.0
$35,001–50,000 1.4 1.4 1.4 1.2 1.1 1.5 1.1 1.2
More than $50,000 0.9 1.0 0.9 0.9 0.9 0.9 1.0 0.9
NOTE: Data have been revised from previously published figures.
SOURCE: U.S. Department of Education, NCES. National Household Education Surveys Program (NHES), 1993 (School Safety and Discipline Survey) and 1999 (Parent Interview Survey).
Indicators 55, 58

Appendix 3 Standard Error Tables
Page 262 | The Condition of Education 2001
Indicator 59
Debt Burden 4 Years After College
Table S59 Standard errors for the percentage distribution of 1992–93 bachelor’s degree recipients repaying their loans according to the size of their debtburden in 1997, by 1996 income and amount borrowed for undergraduate education
SOURCE: U.S. Department of Education, NCES. Baccalaureate and Beyond Longitudinal Study, “Second Follow-up” (B&B:1993/1997), Data Analysis System.
Amount borrowed for Medianundergraduate education debt burden Less than 5–9 10–14 15 percentand 1996 personal income (percent) 5 percent percent percent or more
Total 0.5 1.8 1.7 1.0 0.8Total amount borrowed
Less than $5,000 0.4 3.3 2.9 1.8 0.8
$5,000–9,999 0.3 3.1 2.7 1.6 1.1
$10,000–14,999 0.9 3.0 3.1 1.5 1.4
$15,000 or more 1.0 2.9 3.5 2.3 2.3
Total 1996 personal income
Less than $20,000 1.7 3.3 3.6 3.5 3.6
$20,000–24,999 1.2 5.0 4.5 2.7 1.9
$25,000–34,999 1.2 2.9 3.1 1.9 0.8
$35,000–49,999 1.1 3.7 3.6 1.2 1.4
$50,000 or more 0.5 3.8 3.8 0.1 0.4
Debt burden in 1997

THIS PAGE INTENTIONALLY LEFT BLANK