appendix 13g - financial resilience analysis · ratios included within the covenants of our bonds...
TRANSCRIPT

Appendix 13g – Financial resilience analysis
Appendix 13g:
Financial resilience analysis

Appendix 13g – Financial resilience analysis
Contents Objective 3 Method 3 Reverse stress testing 3 a. Method 3 b. Results 4 Forward stress testing 7 a. Method 7 b. Results 7 c. Summary 9 Scenarios prescribed by Ofwat 11 a. Method 11 b. Results 11 c. Summary 19 Financial resilience beyond AMP7 20 a. Method 20 b. Base results 20 c. Sensitivity analysis 20 d. Summary 25 Conclusion 26

Appendix 13g – Financial resilience analysis
Objective
To ensure that the Company is financially resilient throughout AMP7 and beyond.
Method
In order to ensure that the Company is financially resilient we have conducted the
following sensitivity analysis:
i) Reverse stress testing – assessing how much headroom is inherent in our target
financial ratios
ii) Forward stress testing – Scenarios conducted as part of our long-term viability
analysis conducted for our 2018 annual report
iii) Scenarios prescribed by Ofwat in their April 2018 consultation
The first two elements above are consistent with the analysis we undertook as part of
our long term viability (“LTV”) assessment for our annual accounts.
Sensitivity analysis has been conducted on both a notional and actual balance sheet
basis. The actual balance sheet basis testing provides more consistency with our LTV
analysis as this is the basis for our LTV that is provided in the accounts.
Further detail on each of these elements of analysis is provided below.
Reverse stress testing
a. Method
Our reverse stress testing is focussed on, but not limited to, the following key ratios:
• Adjusted interest cover (on an Ofwat, Ratings Agency and YW covenanted
basis)
• Funds from operations (“FFO”) to debt (on both an Ofwat and Ratings Agency
basis)
We have focused on these two broad categories of ratios as these are the applicable
ratios included within the covenants of our bonds and are also the ratios most commonly
referenced by the Ratings Agencies. On this basis we believe they are the most relevant
ratios when assessing our financial resilience.
We have tested the amount of headroom within the key financial ratios above to a
number of different levels:
• Headroom to target levels. Reaching these levels in themselves does not lead
to an impact on our credit rating, as the Ratings Agency’s also arrive at a

Appendix 13g – Financial resilience analysis
subjective view on other factors such as the stability and predictability of the
regulatory environment, trends, cost and investment recovery and the level of
revenue risk
• Default levels contained within our covenants. These levels are more absolute
in terms of consequences, although they are at significantly lower levels than the
target ratios.
Target levels
To determine the target levels on a notional basis, we have considered the targets
required to achieve a rating between A and BBB grade, as these are the ratings used
within the business plan methodology to determine the notional cost of debt.
Based on ratings guidance provided by Moody’s and S&P, we have set a target for
adjusted interest cover ratio of 1.50 times and FFO to debt of 9.0%.
When assessing on an actual basis, we have considered our financial ratios against the
targets required to safely maintain our current rating.
For the principal adjusted interest cover ratio this equates to a target of 1.30 times and
for FFO to debt this equates to a target of 6.0%.
Ratio calculation
Ratios have been calculated using our own financial model as follows:
Headroom calculation
We measure the amount of headroom by converting the excess over the target into an
earnings before interest, tax, depreciation and amortisation (EBITDA), an interest impact
and a debt impact, caused by the need to fund capex that the company can stand.
For example, if the interest coverage ratio (ICR) is 10bp higher than the target level, this
10bp of headroom equates to approximately a £20m impact on EBITDA or interest and
additional debt (capex) of approximately £500m, that is £500m at an assumed interest
rate of 4% = £20m.
The benefit of reverse stress testing is that it provides an excellent indication of the
amount of resilience in the plan, irrespective of the risks identified. In other words,
whether risks are identified through detailed bottom up analysis, historical precedent, or
expert opinion and judgement, the envelope to cope with shocks is explicit and
quantified.
b. Results

Appendix 13g – Financial resilience analysis
The tables below summarise the results of the reverse stress testing analysis
undertaken.
Further detail, including results for each of the five years of AMP7, together with the
average across the AMP is provided below. In line with Ofwat’s method of assessment
the key figure used in our assessment is the average figure for each ratio.
Notional results
The table below shows the output of notional testing conducted within our financial
model:
Reverse stress testing
EBITDA headroom levels (£m)
Adjusted ICR (Ofwat basis)
FFO to debt (Ofwat basis)
Adjusted ICR (Moody's methodology)
FFO to debt (S&P methodology)
Adjusted ICR (YW senior covenanted)
Adjusted ICR (YW class A covenanted - default)
13.1
Notional
headroom £m
110.5
35.2
Actual
headroom £m
117.8
95.2
7.7
n/a
n/a
23.0
10.2
38.6
100.2
EBITDA headroom - Notional
£mTrigger FY21 FY22 FY23 FY24 FY25 Average
Adjusted ICR (Ofwat basis) 1.50 115.4 105.1 110.5 106.8 114.9 110.5
FFO to debt (Ofwat basis) 9.0% 52.3 30.8 29.4 25.4 37.9 35.2
Adjusted ICR (Moody's methodology) 1.50 18.5 15.5 11.8 9.6 10.2 13.1
FFO to debt (S&P methodology) 9.0% 31.2 6.4 1.3 (5.7) 5.3 7.7
Adjusted ICR (YW senior covenanted) n/a n/a n/a n/a n/a n/a
Adjusted ICR (YW class A covenanted - default) n/a n/a n/a n/a n/a n/a
Interest headroom - Notional
£mTrigger FY21 FY22 FY23 FY24 FY25 Average
Adjusted ICR (Ofwat basis) 1.50 79.6 72.5 76.2 73.7 79.3 76.3
FFO to debt (Ofwat basis) 9.0% 52.3 30.8 29.4 25.4 37.9 35.2
Adjusted ICR (Moody's methodology) 1.50 12.7 10.7 8.2 6.6 7.1 9.1
FFO to debt (S&P methodology) 9.0% 31.2 6.4 1.3 (5.7) 5.3 7.7
Adjusted ICR (YW senior covenanted) n/a n/a n/a n/a n/a n/a
Adjusted ICR (YW class A covenanted - default) n/a n/a n/a n/a n/a n/a

Appendix 13g – Financial resilience analysis
The analysis shows that:
• There is a considerable amount of headroom against Ofwat’s key metrics
Whilst the analysis above shows that Ratings Agency ratios might fall below target in
some years, this will not necessarily have an impact on credit ratings as the levels are
trigger levels for further investigation and assessment; not default levels. Other factors
would come into the assessment such as: trend, reason for cost shock; management
response; mitigation put in place; exceptional nature of shock.
Actual results
The table below shows the output of testing against the actual balance sheet conducted
within our financial model:
Capex headroom - Notional
£mTrigger FY21 FY22 FY23 FY24 FY25 Average
Adjusted ICR (Ofwat basis) 1.50 2,274.7 2,071.4 2,177.6 2,105.5 2,264.9 2,178.8
FFO to debt (Ofwat basis) 9.0% 1,493.0 880.1 840.0 724.9 1,083.6 1,004.3
Adjusted ICR (Moody's methodology) 1.50 364.2 304.7 233.5 189.4 202.1 258.8
FFO to debt (S&P methodology) 9.0% 890.0 183.9 37.0 (161.5) 151.3 220.1
Adjusted ICR (YW senior covenanted) n/a n/a n/a n/a n/a n/a
Adjusted ICR (YW class A covenanted - default) n/a n/a n/a n/a n/a n/a
EBITDA headroom - Actual
£mTrigger FY21 FY22 FY23 FY24 FY25 Average
Adjusted ICR (Ofwat basis) 1.30 165.7 112.9 101.6 100.6 108.5 117.8
FFO to debt (Ofwat basis) 6.0% 94.3 82.9 89.6 97.6 111.6 95.2
Adjusted ICR (Moody's methodology) 1.30 21.9 20.3 18.1 26.5 28.1 23.0
FFO to debt (S&P methodology) 6.0% 14.5 0.5 4.7 9.9 21.2 10.2
Adjusted ICR (YW senior covenanted) 1.20 84.6 40.7 21.8 22.5 23.4 38.6
Adjusted ICR (YW class A covenanted - default) 1.00 137.7 100.5 86.0 87.4 89.7 100.2
Interest headroom - Actual
£mTrigger FY21 FY22 FY23 FY24 FY25 Average
Adjusted ICR (Ofwat basis) 1.30 131.9 89.9 80.9 80.1 86.4 93.8
FFO to debt (Ofwat basis) 6.0% 94.3 82.9 89.6 97.6 111.6 95.2
Adjusted ICR (Moody's methodology) 1.30 17.5 16.2 14.4 21.1 22.3 18.3
FFO to debt (S&P methodology) 6.0% 14.5 0.5 4.7 9.9 21.2 10.2
Adjusted ICR (YW senior covenanted) 1.20 73.0 35.1 18.8 19.4 20.2 33.3
Adjusted ICR (YW class A covenanted - default) 1.00 142.5 104.0 89.0 90.4 92.9 103.8

Appendix 13g – Financial resilience analysis
The analysis shows that:
• Headroom of £39m (£19m above our £20m targeted headroom) against
covenanted ratios
• Headroom of £23m and £10m against key Ratings Agency metrics
• Over £100m of EBITDA headroom against the default level on our covenanted
ratios
• Significant headroom of £118m and £95m against Ofwat’s two key metrics
• Interest headroom levels are similar to EBITDA headroom levels
• Capex headroom levels are significantly higher than EBITDA headroom levels
Forward stress testing
a. Method
This is a more traditional method that identifies the underlying risks and then tests them
against our base plan.
We have assessed the impact of the “severe but plausible” scenario included within our
long-term viability (LTV) statement in our statutory accounts on our base plan to ensure
consistency between our financial resilience assessment and the work undertaken
when assessing our long term viability.
b. Results
The tables below summarise the results of the forward stress testing analysis
undertaken.
Capex headroom - Actual
£mTrigger FY21 FY22 FY23 FY24 FY25 Average
Adjusted ICR (Ofwat basis) 1.30 3,768.6 2,568.2 2,311.4 2,287.7 2,467.4 2,680.7
FFO to debt (Ofwat basis) 6.0% 2,695.3 2,368.1 2,561.0 2,788.1 3,189.0 2,720.3
Adjusted ICR (Moody's methodology) 1.30 499.2 461.5 411.4 603.2 638.1 522.7
FFO to debt (S&P methodology) 6.0% 415.2 15.7 133.9 283.8 605.0 290.7
Adjusted ICR (YW senior covenanted) 1.20 2,085.8 1,002.4 537.9 554.1 575.9 951.2
Adjusted ICR (YW class A covenanted - default) 1.00 4,071.7 2,970.8 2,542.1 2,583.7 2,653.2 2,964.3

Appendix 13g – Financial resilience analysis
Further detail is provided below with results included for each of the five years of AMP7,
together with the average across the AMP. In line with Ofwat’s method of assessment
the key figure used in our assessment is the average figure for each ratio.
Notional results
A summary of the impact of our LTV severe but plausible scenario on a notional basis
against our base case is shown in the table below:
Ofwat ratios are above target levels. Ratings Agency ratios are below target levels;
however the results above are before remedial measures, such as withholding the
payment of dividends. If we were to retain the dividends as per our proposed dividend
policy the ratios would be improved as shown by the table below.
LTV - Severe but plausible scenario
Key ratio analysis
Notional
target
Notional
ratio
Actual
target
Actual
ratio
Gearing n/a 65.3% n/a 80.2%
Adjusted ICR (Ofwat basis) 1.50 2.13 1.30 1.92
FFO to debt (Ofwat basis) 9.0% 9.40% 6.0% 7.37%
Adjusted ICR (Moody's methodology) 1.50 1.44 1.30 1.30
FFO to debt (S&P methodology) 9.0% 8.48% 6.0% 5.69%
Adjusted ICR (YW senior covenanted) - n/a 1.20 1.30
Adjusted ICR (YW class A covenanted - default) - n/a 1.00 1.43
Key ratios
NotionalTarget FY21 FY22 FY23 FY24 FY25 Average
Gearing 62.1% 64.4% 66.0% 66.8% 67.0% 65.3%
Adjusted ICR (Ofwat basis) 1.50 2.24 2.10 2.12 2.08 2.10 2.13
FFO to debt (Ofwat basis) 9.0% 9.92% 9.26% 9.29% 9.18% 9.36% 9.40%
Adjusted ICR (Moody's methodology) 1.50 1.44 1.42 1.45 1.45 1.45 1.44
FFO to debt (S&P methodology) 9.0% 9.03% 8.37% 8.37% 8.23% 8.39% 8.48%
Adjusted ICR (YW senior covenanted) n/a n/a n/a n/a n/a n/a
Adjusted ICR (YW class A covenanted - default) n/a n/a n/a n/a n/a n/a
Key ratios
NotionalTarget FY21 FY22 FY23 FY24 FY25 Average
Gearing 60.2% 60.7% 60.5% 59.6% 55.8% 59.4%
Adjusted ICR (Ofwat basis) 1.50 2.28 2.20 2.28 2.29 2.38 2.29
FFO to debt (Ofwat basis) 9.0% 10.29% 9.98% 10.37% 10.64% 11.71% 10.60%
Adjusted ICR (Moody's methodology) 1.50 1.46 1.49 1.56 1.60 1.65 1.55
FFO to debt (S&P methodology) 9.0% 9.38% 9.07% 9.43% 9.67% 10.66% 9.64%
Adjusted ICR (YW senior covenanted) n/a n/a n/a n/a n/a n/a
Adjusted ICR (YW class A covenanted - default) n/a n/a n/a n/a n/a n/a

Appendix 13g – Financial resilience analysis
The analysis above shows that if dividends were to be retained, all of the ratios would
be above target levels.
Actual results
A summary of the impact of our LTV severe but plausible scenario on an actual balance
sheet basis against our base case is shown in the table below:
Most ratios are above target levels. The S&P FFO to debt is slightly below target;
however the results above are before remedial measures, such as withholding the
payment of dividends. If we were to retain the dividends as per our proposed dividend
policy the ratios would be improved as shown by the table below:
c. Summary
Ofwat’s ratios are above target levels for both the notional and actual balance sheet.
Some Ratings Agency ratios are below target; however when mitigating actions are
taken into account, particularly the withholding of dividends, ratios are improved,
resulting in all ratios being above target, except for S&P’s FFO to debt.
Our sensitivity analysis indicates that Ratings Agency ratios might fall below target for
both the notional and actual balance sheet. If this scenario occurred it would be difficult
to conclude with certainty what the impact would be on credit ratings as the levels are
trigger levels and not default levels. Other factors would come into the assessment
Key ratios
ActualTarget FY21 FY22 FY23 FY24 FY25 Average
Gearing 78.3% 79.7% 80.7% 81.1% 81.1% 80.2%
Adjusted ICR (Ofwat basis) 1.30 1.98 1.86 1.89 1.92 1.95 1.92
FFO to debt (Ofwat basis) 6.0% 7.53% 7.15% 7.27% 7.35% 7.53% 7.37%
Adjusted ICR (Moody's methodology) 1.30 1.27 1.26 1.29 1.34 1.35 1.30
FFO to debt (S&P methodology) 6.0% 5.73% 5.46% 5.64% 5.73% 5.88% 5.69%
Adjusted ICR (YW senior covenanted) 1.20 1.56 1.28 1.21 1.23 1.23 1.30
Adjusted ICR (YW class A covenanted - default) 1.00 1.80 1.49 1.41 1.42 1.43 1.43
Key ratios
ActualTarget FY21 FY22 FY23 FY24 FY25 Average
Gearing 77.7% 78.5% 78.9% 78.8% 78.2% 78.4%
Adjusted ICR (Ofwat basis) 1.30 1.99 1.89 1.93 1.98 2.03 1.96
FFO to debt (Ofwat basis) 6.0% 7.60% 7.30% 7.49% 7.65% 7.92% 7.60%
Adjusted ICR (Moody's methodology) 1.30 1.28 1.28 1.32 1.38 1.40 1.33
FFO to debt (S&P methodology) 6.0% 5.79% 5.58% 5.82% 5.99% 6.22% 5.88%
Adjusted ICR (YW senior covenanted) 1.20 1.57 1.30 1.24 1.26 1.28 1.33
Adjusted ICR (YW class A covenanted - default) 1.00 1.81 1.51 1.44 1.47 1.49 1.49

Appendix 13g – Financial resilience analysis
such as: trend, reason for cost shock, management response, mitigation put in place,
exceptional nature of shock.

Appendix 13g – Financial resilience analysis
Scenarios prescribed by Ofwat
a. Method
We have performed the sensitivities as required in Ofwat’s methodology, which are as
follows:
• Totex underperformance of 10%
• ODI penalty of 3.0% of RORE in one year
• High inflation scenario of RPI 4%, CPIH 3%
• Low inflation scenario of RPI 2%, CPIH 1%
• Increase in the level of bad debt of 5% above current levels
• New debt and refinanced debt at an interest rate 2% above base projections
• Financial penalty equivalent to 3% of one year Appointee turnover
• Combined scenario;
o 10% cost underperformance in each year
o ODI penalty of 1.5% RORE in each year
o Financial penalty equivalent to 1% turnover in one year
The sensitivities have been run through our own internal model to ensure consistency
with our LTV analysis and forward stress testing analysis discussed above.
b. Results
The tables below summarise the results of the Ofwat sensitivity analysis undertaken.
Gearing r a a a a a a r Ofwat ratios above target a a a a a a a r Covenanted ratios above default a r a a a a a r Ratings Agency ratios above target r r r a r r r r
Ofwat adjusted ICR above target a a a a a a a r Ofwat FFO to debt above target r r a a a a a r Ratings Agency ratios above target r r r r r r r r
r Ratio below target in one year, but average ratio above target
r Average ratio below target
Low
inflation
Bad
debtInterest
Financial
penaltyCombined
Financial resilience analysis
Notional gearing
10%
Totex
3% ODI
penalty
High
inflation
10%
Totex
3% ODI
penalty
High
inflation
Low
inflation
Bad
debtInterest
Financial
penaltyCombined
Financial resilience analysis
Actual gearing

Appendix 13g – Financial resilience analysis
The results above are before remedial measures, such as withholding the payment of
dividends.
Further detail is provided below with results included for each of the five years of AMP7,
together with the average across the AMP. In line with Ofwat’s method of assessment
the key figure used in our assessment is the average figure for each ratio.
10% Totex sensitivity
Gearing 85.0% 82.6% 79.5% 77.3% 78.8% 78.2% 78.5% 78.4% 83.6%
ICR (Ofwat basis) 1.30 1.72 1.75 2.08 2.05 2.05 1.92 2.02 1.53
FFO:Debt (Ofwat basis) 6.00% 6.64% 6.89% 8.01% 7.81% 7.87% 7.64% 7.75% 6.03%
ICR (Moody's basis) 1.30 1.06 1.12 1.44 1.42 1.42 1.33 1.39 0.87
FFO:Debt (S&P basis) 6.00% 5.00% 5.19% 5.71% 6.66% 6.15% 5.92% 6.04% 4.41%
ICR (Covenanted default) 1.00 1.29 1.30 1.67 1.64 1.65 1.63 1.61 1.08
Gearing 60.0% 67.7% 64.6% 61.9% 64.5% 63.2% 63.9% 63.5% 68.7%
ICR (Ofwat basis) 1.50 1.90 1.94 2.33 2.24 2.28 2.01 2.24 1.69
FFO:Debt (Ofwat basis) 9.00% 8.45% 8.85% 10.38% 9.86% 10.09% 9.55% 9.94% 7.70%
ICR (Moody's basis) 1.50 1.23 1.25 1.61 1.55 1.58 1.39 1.54 1.03
FFO:Debt (S&P basis) 9.00% 7.54% 7.93% 9.14% 9.24% 9.16% 8.63% 9.01% 6.79%
CombinedHigh
inflation
Low
inflation
Bad
debtInterest
Financial
penalty
Financial resilience analysis AMP7
Notional gearingTarget
10%
Totex
3% ODI
penalty
Low
inflation
Bad
debtInterest
Financial
penaltyCombined
Financial resilience analysis AMP7
Actual gearing
10%
Totex
3% ODI
penalty
High
inflationTarget
Key ratios
NotionalTarget FY21 FY22 FY23 FY24 FY25 Average
Gearing 62.9% 66.0% 68.4% 70.1% 71.0% 67.7%
Adjusted ICR (Ofwat basis) 1.50 2.10 1.93 1.88 1.80 1.79 1.90
FFO to debt (Ofwat basis) 9.0% 9.39% 8.57% 8.31% 7.99% 7.99% 8.45%
Adjusted ICR (Moody's methodology) 1.50 1.30 1.26 1.23 1.20 1.17 1.23
FFO to debt (S&P methodology) 9.0% 8.51% 7.69% 7.40% 7.06% 7.02% 7.54%
Adjusted ICR (YW senior covenanted) n/a n/a n/a n/a n/a n/a
Adjusted ICR (YW class A covenanted - default) n/a n/a n/a n/a n/a n/a
Key ratios
ActualTarget FY21 FY22 FY23 FY24 FY25 Average
Gearing 79.1% 81.3% 83.2% 84.4% 85.1% 82.6%
Adjusted ICR (Ofwat basis) 1.30 1.86 1.71 1.68 1.67 1.67 1.72
FFO to debt (Ofwat basis) 6.0% 7.12% 6.63% 6.52% 6.44% 6.47% 6.64%
Adjusted ICR (Moody's methodology) 1.30 1.07 1.06 1.05 1.06 1.05 1.06
FFO to debt (S&P methodology) 6.0% 5.34% 4.97% 4.93% 4.87% 4.89% 5.00%
Adjusted ICR (YW senior covenanted) 1.20 1.44 1.14 1.02 1.00 0.98 1.12
Adjusted ICR (YW class A covenanted - default) 1.00 1.66 1.33 1.19 1.16 1.13 1.13
Appendix 13g – Financial resilience analysis
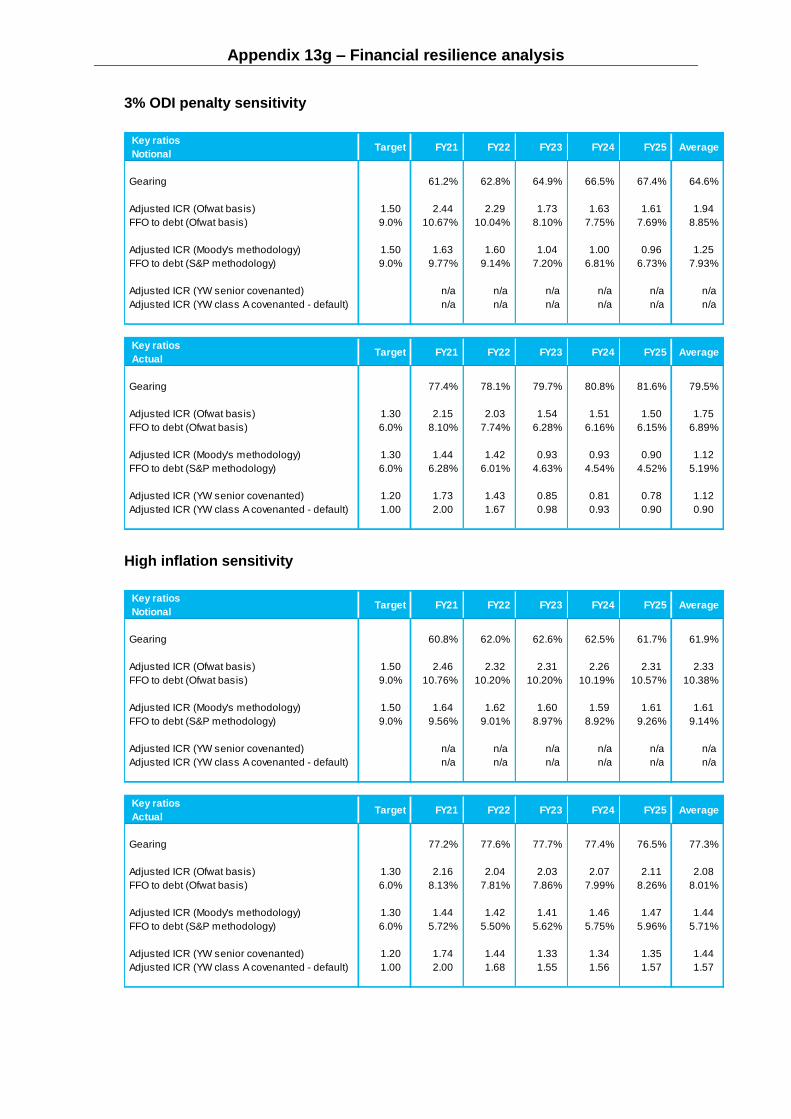
3% ODI penalty sensitivity
High inflation sensitivity
Key ratios
NotionalTarget FY21 FY22 FY23 FY24 FY25 Average
Gearing 61.2% 62.8% 64.9% 66.5% 67.4% 64.6%
Adjusted ICR (Ofwat basis) 1.50 2.44 2.29 1.73 1.63 1.61 1.94
FFO to debt (Ofwat basis) 9.0% 10.67% 10.04% 8.10% 7.75% 7.69% 8.85%
Adjusted ICR (Moody's methodology) 1.50 1.63 1.60 1.04 1.00 0.96 1.25
FFO to debt (S&P methodology) 9.0% 9.77% 9.14% 7.20% 6.81% 6.73% 7.93%
Adjusted ICR (YW senior covenanted) n/a n/a n/a n/a n/a n/a
Adjusted ICR (YW class A covenanted - default) n/a n/a n/a n/a n/a n/a
Key ratios
ActualTarget FY21 FY22 FY23 FY24 FY25 Average
Gearing 77.4% 78.1% 79.7% 80.8% 81.6% 79.5%
Adjusted ICR (Ofwat basis) 1.30 2.15 2.03 1.54 1.51 1.50 1.75
FFO to debt (Ofwat basis) 6.0% 8.10% 7.74% 6.28% 6.16% 6.15% 6.89%
Adjusted ICR (Moody's methodology) 1.30 1.44 1.42 0.93 0.93 0.90 1.12
FFO to debt (S&P methodology) 6.0% 6.28% 6.01% 4.63% 4.54% 4.52% 5.19%
Adjusted ICR (YW senior covenanted) 1.20 1.73 1.43 0.85 0.81 0.78 1.12
Adjusted ICR (YW class A covenanted - default) 1.00 2.00 1.67 0.98 0.93 0.90 0.90
Key ratios
NotionalTarget FY21 FY22 FY23 FY24 FY25 Average
Gearing 60.8% 62.0% 62.6% 62.5% 61.7% 61.9%
Adjusted ICR (Ofwat basis) 1.50 2.46 2.32 2.31 2.26 2.31 2.33
FFO to debt (Ofwat basis) 9.0% 10.76% 10.20% 10.20% 10.19% 10.57% 10.38%
Adjusted ICR (Moody's methodology) 1.50 1.64 1.62 1.60 1.59 1.61 1.61
FFO to debt (S&P methodology) 9.0% 9.56% 9.01% 8.97% 8.92% 9.26% 9.14%
Adjusted ICR (YW senior covenanted) n/a n/a n/a n/a n/a n/a
Adjusted ICR (YW class A covenanted - default) n/a n/a n/a n/a n/a n/a
Key ratios
ActualTarget FY21 FY22 FY23 FY24 FY25 Average
Gearing 77.2% 77.6% 77.7% 77.4% 76.5% 77.3%
Adjusted ICR (Ofwat basis) 1.30 2.16 2.04 2.03 2.07 2.11 2.08
FFO to debt (Ofwat basis) 6.0% 8.13% 7.81% 7.86% 7.99% 8.26% 8.01%
Adjusted ICR (Moody's methodology) 1.30 1.44 1.42 1.41 1.46 1.47 1.44
FFO to debt (S&P methodology) 6.0% 5.72% 5.50% 5.62% 5.75% 5.96% 5.71%
Adjusted ICR (YW senior covenanted) 1.20 1.74 1.44 1.33 1.34 1.35 1.44
Adjusted ICR (YW class A covenanted - default) 1.00 2.00 1.68 1.55 1.56 1.57 1.57

Appendix 13g – Financial resilience analysis
Low inflation sensitivity
Bad debt sensitivity
Key ratios
NotionalTarget FY21 FY22 FY23 FY24 FY25 Average
Gearing 61.6% 63.6% 65.1% 66.0% 66.3% 64.5%
Adjusted ICR (Ofwat basis) 1.50 2.43 2.26 2.22 2.15 2.16 2.24
FFO to debt (Ofwat basis) 9.0% 10.59% 9.88% 9.70% 9.50% 9.62% 9.86%
Adjusted ICR (Moody's methodology) 1.50 1.62 1.58 1.54 1.52 1.51 1.55
FFO to debt (S&P methodology) 9.0% 9.99% 9.28% 9.09% 8.86% 8.97% 9.24%
Adjusted ICR (YW senior covenanted) n/a n/a n/a n/a n/a n/a
Adjusted ICR (YW class A covenanted - default) n/a n/a n/a n/a n/a n/a
Key ratios
ActualTarget FY21 FY22 FY23 FY24 FY25 Average
Gearing 77.5% 78.5% 79.2% 79.5% 79.4% 78.8%
Adjusted ICR (Ofwat basis) 1.30 2.15 2.02 2.00 2.02 2.04 2.05
FFO to debt (Ofwat basis) 6.0% 8.08% 7.70% 7.68% 7.71% 7.88% 7.81%
Adjusted ICR (Moody's methodology) 1.30 1.44 1.41 1.39 1.43 1.42 1.42
FFO to debt (S&P methodology) 6.0% 6.86% 6.54% 6.56% 6.60% 6.75% 6.66%
Adjusted ICR (YW senior covenanted) 1.20 1.73 1.43 1.31 1.30 1.30 1.41
Adjusted ICR (YW class A covenanted - default) 1.00 2.00 1.67 1.52 1.51 1.50 1.50
Key ratios
NotionalTarget FY21 FY22 FY23 FY24 FY25 Average
Gearing 61.2% 62.8% 63.9% 64.3% 64.0% 63.2%
Adjusted ICR (Ofwat basis) 1.50 2.44 2.28 2.26 2.20 2.22 2.28
FFO to debt (Ofwat basis) 9.0% 10.65% 10.02% 9.92% 9.80% 10.05% 10.09%
Adjusted ICR (Moody's methodology) 1.50 1.62 1.59 1.56 1.55 1.55 1.58
FFO to debt (S&P methodology) 9.0% 9.75% 9.12% 9.00% 8.85% 9.07% 9.16%
Adjusted ICR (YW senior covenanted) n/a n/a n/a n/a n/a n/a
Adjusted ICR (YW class A covenanted - default) n/a n/a n/a n/a n/a n/a
Key ratios
ActualTarget FY21 FY22 FY23 FY24 FY25 Average
Gearing 77.4% 78.1% 78.6% 78.6% 78.2% 78.2%
Adjusted ICR (Ofwat basis) 1.30 2.15 2.02 2.00 2.03 2.06 2.05
FFO to debt (Ofwat basis) 6.0% 8.08% 7.72% 7.73% 7.81% 8.02% 7.87%
Adjusted ICR (Moody's methodology) 1.30 1.43 1.41 1.39 1.43 1.44 1.42
FFO to debt (S&P methodology) 6.0% 6.26% 5.99% 6.06% 6.14% 6.31% 6.15%
Adjusted ICR (YW senior covenanted) 1.20 1.73 1.43 1.31 1.31 1.31 1.42
Adjusted ICR (YW class A covenanted - default) 1.00 1.99 1.67 1.52 1.52 1.53 1.53

Appendix 13g – Financial resilience analysis
Interest rate sensitivity
Financial penalty sensitivity
Key ratios
NotionalTarget FY21 FY22 FY23 FY24 FY25 Average
Gearing 61.3% 63.1% 64.5% 65.3% 65.4% 63.9%
Adjusted ICR (Ofwat basis) 1.50 2.31 2.05 1.96 1.86 1.87 2.01
FFO to debt (Ofwat basis) 9.0% 10.47% 9.62% 9.35% 9.10% 9.24% 9.55%
Adjusted ICR (Moody's methodology) 1.50 1.54 1.43 1.36 1.31 1.30 1.39
FFO to debt (S&P methodology) 9.0% 9.57% 8.73% 8.43% 8.15% 8.26% 8.63%
Adjusted ICR (YW senior covenanted) n/a n/a n/a n/a n/a n/a
Adjusted ICR (YW class A covenanted - default) n/a n/a n/a n/a n/a n/a
Key ratios
ActualTarget FY21 FY22 FY23 FY24 FY25 Average
Gearing 77.4% 78.1% 78.8% 79.1% 79.0% 78.5%
Adjusted ICR (Ofwat basis) 1.30 2.20 1.96 1.86 1.78 1.80 1.92
FFO to debt (Ofwat basis) 6.0% 8.16% 7.63% 7.50% 7.36% 7.51% 7.64%
Adjusted ICR (Moody's methodology) 1.30 1.47 1.37 1.29 1.26 1.25 1.33
FFO to debt (S&P methodology) 6.0% 6.34% 5.90% 5.83% 5.70% 5.83% 5.92%
Adjusted ICR (YW senior covenanted) 1.20 1.77 1.38 1.22 1.15 1.15 1.33
Adjusted ICR (YW class A covenanted - default) 1.00 2.15 1.70 1.48 1.41 1.40 1.40
Key ratios
NotionalTarget FY21 FY22 FY23 FY24 FY25 Average
Gearing 61.2% 62.8% 64.3% 64.7% 64.4% 63.5%
Adjusted ICR (Ofwat basis) 1.50 2.44 2.29 2.05 2.19 2.22 2.24
FFO to debt (Ofwat basis) 9.0% 10.67% 10.04% 9.22% 9.75% 9.99% 9.94%
Adjusted ICR (Moody's methodology) 1.50 1.63 1.60 1.36 1.54 1.55 1.54
FFO to debt (S&P methodology) 9.0% 9.77% 9.14% 8.30% 8.80% 9.01% 9.01%
Adjusted ICR (YW senior covenanted) n/a n/a n/a n/a n/a n/a
Adjusted ICR (YW class A covenanted - default) n/a n/a n/a n/a n/a n/a
Key ratios
ActualTarget FY21 FY22 FY23 FY24 FY25 Average
Gearing 77.4% 78.1% 79.0% 79.0% 78.5% 78.4%
Adjusted ICR (Ofwat basis) 1.30 2.15 2.03 1.82 2.03 2.06 2.02
FFO to debt (Ofwat basis) 6.0% 8.10% 7.74% 7.17% 7.77% 7.98% 7.75%
Adjusted ICR (Moody's methodology) 1.30 1.44 1.42 1.21 1.43 1.43 1.39
FFO to debt (S&P methodology) 6.0% 6.28% 6.01% 5.50% 6.11% 6.28% 6.04%
Adjusted ICR (YW senior covenanted) 1.20 1.73 1.43 1.13 1.31 1.31 1.38
Adjusted ICR (YW class A covenanted - default) 1.00 2.00 1.67 1.32 1.52 1.52 1.52

Appendix 13g – Financial resilience analysis
Combined sensitivity
The results above show that, before any mitigating actions are taken into account, on an
average AMP basis:
• We have sufficient capacity within our gearing covenant to fund any of the
sensitivities above.
• Ofwat’s key ratios on an actual balance sheet basis remain above target against
all of the sensitivities above.
• Our covenanted ratio remains above the default level against all the sensitivities
above.
Our sensitivity analysis indicates that Ratings Agency ratios might fall below target for
both the notional and actual balance sheet. If these sensitivities occurred it would be
difficult to conclude with certainty what the impact would be on credit ratings as the
levels are trigger levels and not default levels. Other factors would come into the
assessment such as: trend, reason for cost shock, management response, mitigation
put in place, exceptional nature of shock.
Mitigating factors
The results above are before any mitigating actions have been taken into account. If
one of these sensitivities were to arise there are a number of mitigating actions, at a
strategic level, that could be implemented that would reduce the financial impact of the
event. Examples of mitigating actions that would be implemented include:
Key ratios
NotionalTarget FY21 FY22 FY23 FY24 FY25 Average
Gearing 62.9% 66.3% 69.3% 71.6% 73.2% 68.7%
Adjusted ICR (Ofwat basis) 1.50 2.07 1.82 1.60 1.50 1.48 1.69
FFO to debt (Ofwat basis) 9.0% 9.26% 8.21% 7.31% 6.91% 6.79% 7.70%
Adjusted ICR (Moody's methodology) 1.50 1.27 1.16 0.95 0.91 0.88 1.03
FFO to debt (S&P methodology) 9.0% 8.39% 7.33% 6.42% 5.99% 5.83% 6.79%
Adjusted ICR (YW senior covenanted) n/a n/a n/a n/a n/a n/a
Adjusted ICR (YW class A covenanted - default) n/a n/a n/a n/a n/a n/a
Key ratios
ActualTarget FY21 FY22 FY23 FY24 FY25 Average
Gearing 79.2% 81.6% 84.1% 85.9% 87.3% 83.6%
Adjusted ICR (Ofwat basis) 1.30 1.82 1.62 1.43 1.40 1.38 1.53
FFO to debt (Ofwat basis) 6.0% 7.03% 6.34% 5.72% 5.57% 5.50% 6.03%
Adjusted ICR (Moody's methodology) 1.30 1.03 0.97 0.80 0.80 0.77 0.87
FFO to debt (S&P methodology) 6.0% 5.25% 4.69% 4.15% 4.03% 3.96% 4.41%
Adjusted ICR (YW senior covenanted) 1.20 1.41 1.05 0.77 0.74 0.71 0.94
Adjusted ICR (YW class A covenanted - default) 1.00 1.63 1.22 0.90 0.85 0.81 0.81

Appendix 13g – Financial resilience analysis
• Management action in line with our established approach to risk management
and overall resilience (described elsewhere) – In the event of any of the
sensitivities above occurring Management would immediately seek to reduce the
impact through a number of different actions, such as the re-allocation of
resources, or cost restructuring. The impact of these mitigating actions would be
expected to significantly reduce the cost impact in subsequent years, reducing
the total impact of the sensitivities above.
• Impact of insurance and hedging – We have insurance cover in place that will
reimburse us in the event of additional costs arising as a result of specific
incidents such as flooding. We also have hedging in place for significant costs,
such as electricity. Applying the benefit of insurance claims and hedging would
significantly reduce the impact of the sensitivities above
• Dividend retention – As we have demonstrated throughout the current period,
we can retain dividends to strengthen our balance sheet and improve our
financial resilience. The results above do not include any retention of dividends.
If we were to retain dividends this would provide up to c£250m of additional cash
headroom. Our revised dividend policy is explicit in stating that dividends will be
paid only when the appropriate level of financial resilience testing has been
undertaken.
• Equity injection – If all of the above mitigating actions had been exhausted we
could obtain an equity injection from our investors to ensure our ongoing
financial resilience.
The results above also don’t take into account the benefits of any potential totex
outperformance or ODI rewards within the base case. As a leading company we would
reasonably expect our base plan to be enhanced by the rewards available for providing
upper quartile service and for upper quartile efficiency.
Impact of group companies
The results above include the impact of the following group costs financed by YW:
• Head office costs paid through Kelda Group Ltd
• Third party interest costs paid through Kelda Finance Group
Both of the above costs have been financed through YW’s base dividend, resulting in
our proposed base dividend to external shareholders being lower than the notional base
dividend. Further detail on our dividend is provided within the Financeability section of
our Business Plan.

Appendix 13g – Financial resilience analysis
Likelihood of Ofwat’s sensitivities arising
We consider that some of the sensitivities analysed above, in particular the 10% totex,
ODI penalty and combined sensitivities, are very unlikely to arise.
The EBITDA and total cost impact of these three sensitivities can be summarised as
follows:
The table above only includes three years of ODI figures for the ODI and combined
sensitivities, due to the two year deferral meaning a proportion would apply in AMP8. If
the additional two years were included this would result in a higher total cost.
Maintaining sufficient headroom to cover the above costs would not enable us to
operate as efficiently as we currently do, which would not be to the long term benefit of
our customers.
The costs above are considerably higher than any exceptional costs we have incurred
historically as shown by the graph below.
The graph above shows that exceptional costs have average £7m across the last 19
years, with a maximum one-off cost of £47m. The average cost above of £7m is
considerably lower than the annual costs included within the sensitivity analysis above.
EBITDA Cost EBITDA Cost EBITDA Cost
Total AMP cost impact 209 503 256 256 371 665
Annual cost impact 42 101 85 85 89 148
10% Totex 3% RORE ODI penalty Combined Sensitivity cost impact
£m (17/18 prices)

Appendix 13g – Financial resilience analysis
As part of our RORE analysis we also asked Economic Insight to look at the actual cost
performance of the Industry against totex allowances for the first two years of this AMP.
The results are as follows:
The analysis above shows that across the first two years of this AMP the industry has
on average incurred costs comparable with the allowance provided by Ofwat.
We have outperformed our allowance, which as mentioned above would improve our
base case, reducing the impact of the sensitivities shown above.
c. Summary
In summary:
• The results of sensitivity analysis, before any mitigating actions are taken into
account, show that on an average AMP basis:
We have sufficient capacity within our gearing covenant to fund all of the
sensitivities.
Our covenanted ratio remains above the default level against all the
sensitivities.
• There are a number of mitigating actions that would be implemented to
significantly reduce the impact of the sensitivities on the financial robustness of
the company
• A number of the sensitivities requested by Ofwat are considered unlikely to occur
In light of the above we can conclude that the Company is financially resilient throughout
AMP7.
Totex under / (out) performance
Wholesale water totex 2.7% (1.3%)
Wholesale wastewater totex (4.4%) (6.4%)
Totex (0.1%) (4.2%)
Industry analysis
2015/16 and 2016/17
Industry
averageYW

Appendix 13g – Financial resilience analysis
Financial resilience beyond AMP7
a. Method
In order to determine whether we are financially resilient beyond AMP7, we have made
a preliminary assessment of our possible base performance in AMP8, assuming there
are no significant deviations from AMP7.
Our core assumptions for AMP8 are as follows:
• Totex: Consistent with AMP7 (on a pre RPE basis)
• WACC: Consistent with AMP7
• Cost recovery rates: Natural, as per AMP7
• Legacy: No legacy revenue adjustment / RCV log down
• Inflation: Consistent with AMP7
• Interest rates: Consistent with AMP7
• CPIH transition: 70%, versus 50% in AMP7
The above assumptions result in a forecast bill change in AMP8 of £7
b. Base results
The table below summarises forecast performance in AMP8 to that in AMP7.
Based on the assumptions above, the key ratios are expected to improve slightly from
AMP7 to AMP8.
c. Sensitivity analysis
LTV “Severe but plausible” sensitivity
Key ratio analysis
AMP7 & AMP8
Notional
target
Notional
ratio AMP7
Notional
ratio AMP8
Actual
target
Actual
ratio AMP7
Actual
ratio AMP8
Gearing n/a 63.2% 62.6% n/a 78.1% 80.6%
Adjusted ICR (Ofwat basis) 1.50 2.29 2.25 1.30 2.06 2.10
FFO to debt (Ofwat basis) 9.0% 10.12% 10.08% 6.0% 7.89% 7.85%
Adjusted ICR (Moody's methodology) 1.50 1.58 1.57 1.30 1.43 1.47
FFO to debt (S&P methodology) 9.0% 9.19% 9.15% 6.0% 6.17% 6.16%
Adjusted ICR (YW senior covenanted) - n/a n/a 1.20 1.42 1.47
Adjusted ICR (YW class A covenanted - default) n/a n/a n/a 1.00 1.53 1.74

Appendix 13g – Financial resilience analysis
10% Totex sensitivity
3% ODI penalty sensitivity
Sensitivity analysis
2025 to 2030
Notional
target
Notional
base
Notional
sensitivity
Actual
target
Actual
base
Actual
sensitivity
Gearing n/a 62.6% 64.6% n/a 80.6% 81.8%
Adjusted ICR (Ofwat basis) 1.50 2.25 2.10 1.30 2.10 1.96
FFO to debt (Ofwat basis) 9.0% 10.08% 9.40% 6.0% 7.85% 7.36%
Adjusted ICR (Moody's methodology) 1.50 1.57 1.44 1.30 1.47 1.35
FFO to debt (S&P methodology) 9.0% 9.15% 8.47% 6.0% 6.16% 5.71%
Adjusted ICR (YW senior covenanted) n/a n/a n/a 1.20 1.47 1.35
Adjusted ICR (YW class A covenanted - default) n/a n/a n/a 1.00 1.74 1.63
Key ratios
NotionalTarget FY26 FY27 FY28 FY29 FY30 Average
Gearing 62.2% 64.3% 66.7% 68.8% 70.9% 66.6%
Adjusted ICR (Ofwat basis) 1.50 2.04 1.96 1.89 1.81 1.75 1.89
FFO to debt (Ofwat basis) 9.0% 9.40% 8.98% 8.48% 8.09% 7.73% 8.54%
Adjusted ICR (Moody's methodology) 1.50 1.32 1.28 1.24 1.21 1.18 1.25
FFO to debt (S&P methodology) 9.0% 8.49% 8.06% 7.57% 7.17% 6.81% 7.62%
Adjusted ICR (YW senior covenanted) 1.50 n/a n/a n/a n/a n/a n/a
Adjusted ICR (YW class A covenanted - default) n/a n/a n/a n/a n/a n/a
Key ratios
ActualTarget FY26 FY27 FY28 FY29 FY30 Average
Gearing 79.6% 84.0% 85.4% 83.6% 83.3% 83.2%
Adjusted ICR (Ofwat basis) 1.30 1.82 1.84 1.78 1.71 1.70 1.77
FFO to debt (Ofwat basis) 6.0% 7.04% 6.96% 6.70% 6.48% 6.35% 6.71%
Adjusted ICR (Moody's methodology) 1.30 1.13 1.16 1.09 1.08 1.08 1.11
FFO to debt (S&P methodology) 6.0% 5.40% 5.38% 5.10% 4.82% 4.72% 5.08%
Adjusted ICR (YW senior covenanted) 1.20 1.18 1.20 1.17 1.14 1.15 1.17
Adjusted ICR (YW class A covenanted - default) 1.00 1.37 1.40 1.37 1.33 1.33 1.33
Key ratios
NotionalTarget FY26 FY27 FY28 FY29 FY30 Average
Gearing 60.9% 61.6% 63.9% 65.9% 67.8% 64.0%
Adjusted ICR (Ofwat basis) 1.50 2.34 2.30 1.68 1.61 1.55 1.90
FFO to debt (Ofwat basis) 9.0% 10.55% 10.36% 8.07% 7.70% 7.35% 8.80%
Adjusted ICR (Moody's methodology) 1.50 1.61 1.59 1.01 0.98 0.96 1.23
FFO to debt (S&P methodology) 9.0% 9.62% 9.42% 7.16% 6.78% 6.43% 7.88%
Adjusted ICR (YW senior covenanted) 1.50 n/a n/a n/a n/a n/a n/a
Adjusted ICR (YW class A covenanted - default) n/a n/a n/a n/a n/a n/a

Appendix 13g – Financial resilience analysis
High inflation sensitivity
Low inflation sensitivity
Key ratios
ActualTarget FY26 FY27 FY28 FY29 FY30 Average
Gearing 78.3% 81.0% 82.3% 83.6% 83.3% 81.7%
Adjusted ICR (Ofwat basis) 1.30 2.09 2.15 2.09 2.01 1.99 2.06
FFO to debt (Ofwat basis) 6.0% 7.90% 7.97% 7.70% 7.46% 7.31% 7.67%
Adjusted ICR (Moody's methodology) 1.30 1.44 1.49 0.94 0.92 0.92 1.14
FFO to debt (S&P methodology) 6.0% 6.23% 6.35% 4.66% 4.39% 4.31% 5.18%
Adjusted ICR (YW senior covenanted) 1.20 1.44 1.49 0.94 0.92 0.92 1.14
Adjusted ICR (YW class A covenanted - default) 1.00 1.68 1.75 1.10 1.07 1.07 1.07
Key ratios
NotionalTarget FY26 FY27 FY28 FY29 FY30 Average
Gearing 60.5% 60.8% 61.4% 61.8% 62.2% 61.4%
Adjusted ICR (Ofwat basis) 1.50 2.36 2.33 2.30 2.26 2.24 2.30
FFO to debt (Ofwat basis) 9.0% 10.63% 10.53% 10.31% 10.18% 10.07% 10.35%
Adjusted ICR (Moody's methodology) 1.50 1.62 1.61 1.60 1.59 1.59 1.60
FFO to debt (S&P methodology) 9.0% 9.39% 9.28% 9.08% 8.94% 8.83% 9.10%
Adjusted ICR (YW senior covenanted) 1.50 n/a n/a n/a n/a n/a n/a
Adjusted ICR (YW class A covenanted - default) n/a n/a n/a n/a n/a n/a
Key ratios
ActualTarget FY26 FY27 FY28 FY29 FY30 Average
Gearing 78.0% 77.5% 77.3% 83.6% 83.3% 79.9%
Adjusted ICR (Ofwat basis) 1.30 2.09 2.16 2.13 2.10 2.13 2.12
FFO to debt (Ofwat basis) 6.0% 7.93% 8.06% 7.97% 7.93% 7.97% 7.97%
Adjusted ICR (Moody's methodology) 1.30 1.44 1.50 1.49 1.48 1.51 1.48
FFO to debt (S&P methodology) 6.0% 5.72% 5.89% 5.75% 5.60% 5.67% 5.73%
Adjusted ICR (YW senior covenanted) 1.20 1.44 1.50 1.49 1.48 1.51 1.48
Adjusted ICR (YW class A covenanted - default) 1.00 1.68 1.76 1.75 1.73 1.78 1.78
Key ratios
NotionalTarget FY26 FY27 FY28 FY29 FY30 Average
Gearing 61.3% 62.5% 64.0% 65.4% 66.7% 64.0%
Adjusted ICR (Ofwat basis) 1.50 2.33 2.27 2.21 2.15 2.09 2.21
FFO to debt (Ofwat basis) 9.0% 10.47% 10.18% 9.79% 9.49% 9.20% 9.83%
Adjusted ICR (Moody's methodology) 1.50 1.60 1.57 1.54 1.51 1.49 1.54
FFO to debt (S&P methodology) 9.0% 9.84% 9.56% 9.17% 8.86% 8.57% 9.20%
Adjusted ICR (YW senior covenanted) 1.50 n/a n/a n/a n/a n/a n/a
Adjusted ICR (YW class A covenanted - default) n/a n/a n/a n/a n/a n/a

Appendix 13g – Financial resilience analysis
Bad debt sensitivity
Interest rate sensitivity
Key ratios
ActualTarget FY26 FY27 FY28 FY29 FY30 Average
Gearing 78.6% 79.9% 80.3% 83.6% 83.3% 81.1%
Adjusted ICR (Ofwat basis) 1.30 2.08 2.13 2.09 2.04 2.05 2.08
FFO to debt (Ofwat basis) 6.0% 7.87% 7.90% 7.74% 7.62% 7.58% 7.74%
Adjusted ICR (Moody's methodology) 1.30 1.43 1.48 1.46 1.44 1.46 1.45
FFO to debt (S&P methodology) 6.0% 6.75% 6.82% 6.64% 6.46% 6.44% 6.62%
Adjusted ICR (YW senior covenanted) 1.20 1.43 1.48 1.46 1.44 1.46 1.45
Adjusted ICR (YW class A covenanted - default) 1.00 1.67 1.74 1.71 1.68 1.70 1.70
Key ratios
NotionalTarget FY26 FY27 FY28 FY29 FY30 Average
Gearing 60.9% 61.7% 62.7% 63.6% 64.4% 62.7%
Adjusted ICR (Ofwat basis) 1.50 2.33 2.29 2.24 2.20 2.15 2.24
FFO to debt (Ofwat basis) 9.0% 10.53% 10.33% 10.02% 9.80% 9.60% 10.05%
Adjusted ICR (Moody's methodology) 1.50 1.61 1.59 1.57 1.55 1.53 1.57
FFO to debt (S&P methodology) 9.0% 9.59% 9.39% 9.09% 8.87% 8.66% 9.12%
Adjusted ICR (YW senior covenanted) 1.50 n/a n/a n/a n/a n/a n/a
Adjusted ICR (YW class A covenanted - default) n/a n/a n/a n/a n/a n/a
Key ratios
ActualTarget FY26 FY27 FY28 FY29 FY30 Average
Gearing 78.3% 78.8% 78.9% 83.6% 83.3% 80.6%
Adjusted ICR (Ofwat basis) 1.30 2.08 2.14 2.10 2.06 2.08 2.09
FFO to debt (Ofwat basis) 6.0% 7.88% 7.95% 7.83% 7.74% 7.73% 7.83%
Adjusted ICR (Moody's methodology) 1.30 1.43 1.48 1.47 1.45 1.47 1.46
FFO to debt (S&P methodology) 6.0% 6.21% 6.33% 6.17% 6.00% 6.02% 6.14%
Adjusted ICR (YW senior covenanted) 1.20 1.43 1.48 1.47 1.45 1.47 1.46
Adjusted ICR (YW class A covenanted - default) 1.00 1.67 1.74 1.72 1.69 1.73 1.73
Key ratios
NotionalTarget FY26 FY27 FY28 FY29 FY30 Average
Gearing 61.0% 61.9% 63.1% 64.3% 65.4% 63.1%
Adjusted ICR (Ofwat basis) 1.50 2.26 2.15 2.03 1.93 1.84 2.04
FFO to debt (Ofwat basis) 9.0% 10.43% 10.11% 9.64% 9.27% 8.91% 9.67%
Adjusted ICR (Moody's methodology) 1.50 1.56 1.49 1.42 1.36 1.30 1.43
FFO to debt (S&P methodology) 9.0% 9.49% 9.17% 8.71% 8.34% 7.98% 8.74%
Adjusted ICR (YW senior covenanted) 1.50 n/a n/a n/a n/a n/a n/a
Adjusted ICR (YW class A covenanted - default) n/a n/a n/a n/a n/a n/a
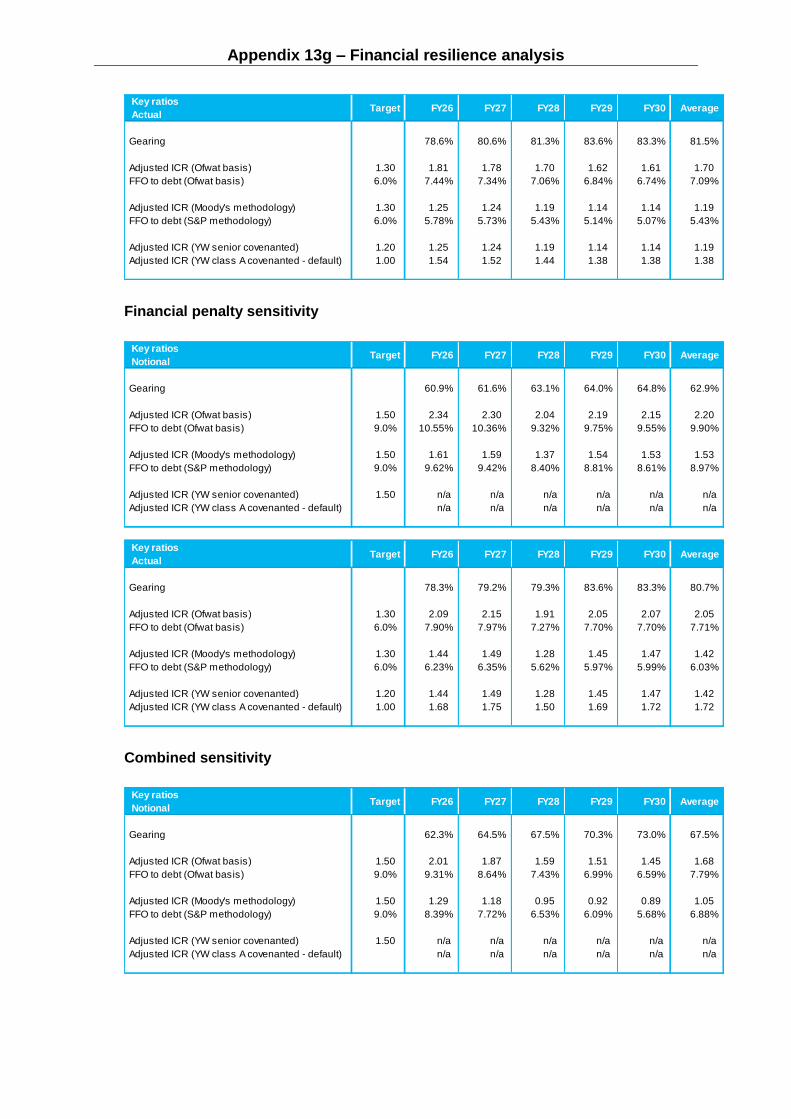
Appendix 13g – Financial resilience analysis
Financial penalty sensitivity
Combined sensitivity
Key ratios
ActualTarget FY26 FY27 FY28 FY29 FY30 Average
Gearing 78.6% 80.6% 81.3% 83.6% 83.3% 81.5%
Adjusted ICR (Ofwat basis) 1.30 1.81 1.78 1.70 1.62 1.61 1.70
FFO to debt (Ofwat basis) 6.0% 7.44% 7.34% 7.06% 6.84% 6.74% 7.09%
Adjusted ICR (Moody's methodology) 1.30 1.25 1.24 1.19 1.14 1.14 1.19
FFO to debt (S&P methodology) 6.0% 5.78% 5.73% 5.43% 5.14% 5.07% 5.43%
Adjusted ICR (YW senior covenanted) 1.20 1.25 1.24 1.19 1.14 1.14 1.19
Adjusted ICR (YW class A covenanted - default) 1.00 1.54 1.52 1.44 1.38 1.38 1.38
Key ratios
NotionalTarget FY26 FY27 FY28 FY29 FY30 Average
Gearing 60.9% 61.6% 63.1% 64.0% 64.8% 62.9%
Adjusted ICR (Ofwat basis) 1.50 2.34 2.30 2.04 2.19 2.15 2.20
FFO to debt (Ofwat basis) 9.0% 10.55% 10.36% 9.32% 9.75% 9.55% 9.90%
Adjusted ICR (Moody's methodology) 1.50 1.61 1.59 1.37 1.54 1.53 1.53
FFO to debt (S&P methodology) 9.0% 9.62% 9.42% 8.40% 8.81% 8.61% 8.97%
Adjusted ICR (YW senior covenanted) 1.50 n/a n/a n/a n/a n/a n/a
Adjusted ICR (YW class A covenanted - default) n/a n/a n/a n/a n/a n/a
Key ratios
ActualTarget FY26 FY27 FY28 FY29 FY30 Average
Gearing 78.3% 79.2% 79.3% 83.6% 83.3% 80.7%
Adjusted ICR (Ofwat basis) 1.30 2.09 2.15 1.91 2.05 2.07 2.05
FFO to debt (Ofwat basis) 6.0% 7.90% 7.97% 7.27% 7.70% 7.70% 7.71%
Adjusted ICR (Moody's methodology) 1.30 1.44 1.49 1.28 1.45 1.47 1.42
FFO to debt (S&P methodology) 6.0% 6.23% 6.35% 5.62% 5.97% 5.99% 6.03%
Adjusted ICR (YW senior covenanted) 1.20 1.44 1.49 1.28 1.45 1.47 1.42
Adjusted ICR (YW class A covenanted - default) 1.00 1.68 1.75 1.50 1.69 1.72 1.72
Key ratios
NotionalTarget FY26 FY27 FY28 FY29 FY30 Average
Gearing 62.3% 64.5% 67.5% 70.3% 73.0% 67.5%
Adjusted ICR (Ofwat basis) 1.50 2.01 1.87 1.59 1.51 1.45 1.68
FFO to debt (Ofwat basis) 9.0% 9.31% 8.64% 7.43% 6.99% 6.59% 7.79%
Adjusted ICR (Moody's methodology) 1.50 1.29 1.18 0.95 0.92 0.89 1.05
FFO to debt (S&P methodology) 9.0% 8.39% 7.72% 6.53% 6.09% 5.68% 6.88%
Adjusted ICR (YW senior covenanted) 1.50 n/a n/a n/a n/a n/a n/a
Adjusted ICR (YW class A covenanted - default) n/a n/a n/a n/a n/a n/a
Appendix 13g – Financial resilience analysis
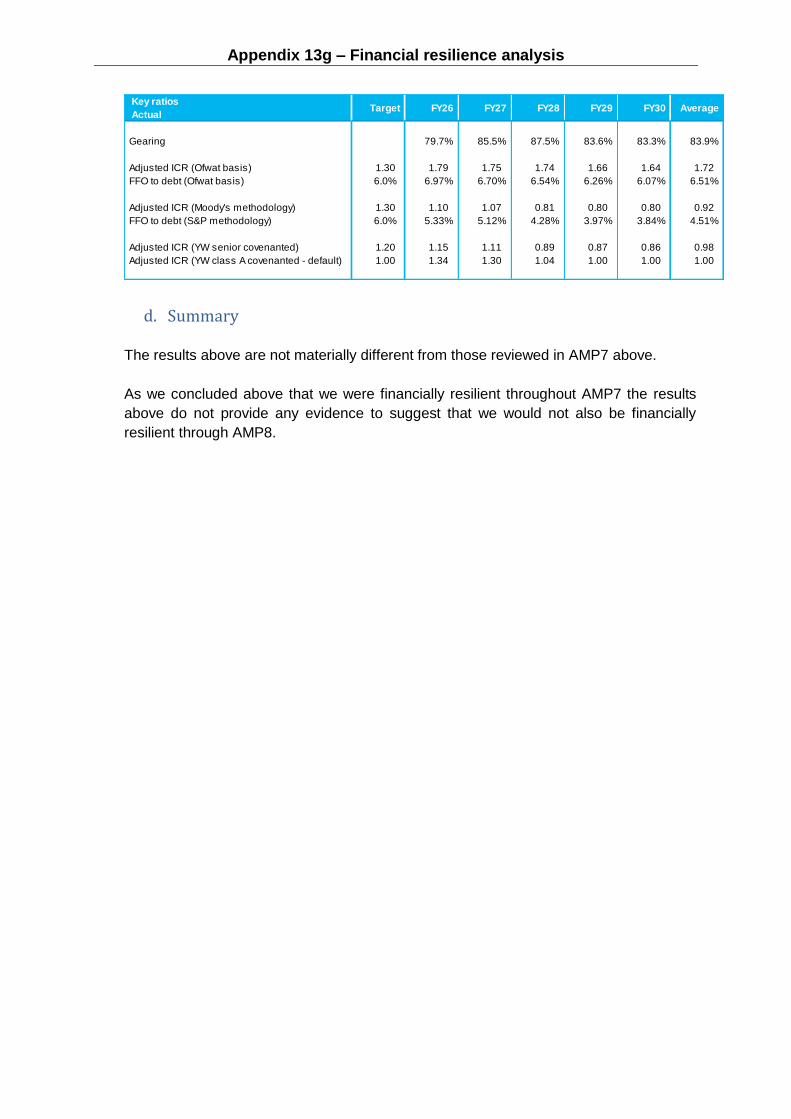
d. Summary
The results above are not materially different from those reviewed in AMP7 above.
As we concluded above that we were financially resilient throughout AMP7 the results
above do not provide any evidence to suggest that we would not also be financially
resilient through AMP8.
Key ratios
ActualTarget FY26 FY27 FY28 FY29 FY30 Average
Gearing 79.7% 85.5% 87.5% 83.6% 83.3% 83.9%
Adjusted ICR (Ofwat basis) 1.30 1.79 1.75 1.74 1.66 1.64 1.72
FFO to debt (Ofwat basis) 6.0% 6.97% 6.70% 6.54% 6.26% 6.07% 6.51%
Adjusted ICR (Moody's methodology) 1.30 1.10 1.07 0.81 0.80 0.80 0.92
FFO to debt (S&P methodology) 6.0% 5.33% 5.12% 4.28% 3.97% 3.84% 4.51%
Adjusted ICR (YW senior covenanted) 1.20 1.15 1.11 0.89 0.87 0.86 0.98
Adjusted ICR (YW class A covenanted - default) 1.00 1.34 1.30 1.04 1.00 1.00 1.00

Appendix 13g – Financial resilience analysis
Conclusion
Based on the above analysis we conclude that company plan is financially resilient
throughout AMP7 and beyond.