appendix 1 executive summary - bhp
TRANSCRIPT

1
Appendix 1
Executive Summary
Changes to Western Australia Iron Ore (WAIO) Ore Reserves for Marra Mamba iron ore type
· Material increase to Marra Mamba (MM) Ore Reserves due to first time declaration of Ore Reserves of South Flankproject.
· South Flank project comprises the Grand Central, Vista Oriental and Highway deposits.· South Flank project capital approval underpinned by a Definition Phase Study (equivalent to Feasibility Study).

2
Table 1: Marra Mamba ore type Mineral Resources (inclusive of Ore Reserves) as at 30 June 2018 in 100% terms reported in accordance with the ASX Listing Rules 2014
Table 2: Marra Mamba ore type Ore Reserves as at 30 June 2018 in 100% terms reported in accordance with the US SEC Industry Guide 7 and ASX Listing Rules 2014
Footnotes to Table 1 and Table 2
(1) The information in this report that relates to Mineral Resources and Ore Reserves is based on information compiled by M Lowry (MAusIMM), M Smith (MAusIMM), A Williamson (MAIG)and C Allison (MAusIMM) for Mineral Resources, and D Blechynden (P. Eng. PEGNL), B Hall (MAusIMM) and D Magee (MAusIMM) for Ore Reserves, all are Competent Persons whoare Members of the Australasian Institute of Mining and Metallurgy (AusIMM), the Australian Institute of Geoscientists (AIG) or a ‘Recognised Professional Organisation’ (RPO) included ina list that is posted on the ASX website from time to time. All are full-time employees of BHP and have sufficient experience that is relevant to the style of mineralisation and type ofdeposit under consideration and to the activity being undertaken to qualify as a Competent Person as defined in the 2012 Edition of the ‘Australasian Code for Reporting of ExplorationResults, Mineral Resources and Ore Reserves’. All of the Competent Persons consent to the inclusion in the report of the matters based on his or her information in the form and contextin which it appears.
(2) Mineral Resource classification is based on drill spacing, assessments of geostatistical parameters, geological confidence and data quality considerations as appropriate and OreReserves classification is based on the Mineral Resource classification.
(3) Mineral Resources and Ore Reserves in this report are exclusively Marra Mamba (MM) ore type, while the WAIO Mineral Resources reported by BHP are divided into the ore types: MM,BKM – Brockman, CID – Channel Iron Deposits and NIM – Nimingarra.
(4) The grades listed above (Fe – iron, P – phosphorous, SiO2 – silica and Al2O3 – alumina) refer to in situ mass percentage on a dry weight basis. LOI (loss on ignition) refers to loss of mass(dry basis) during the assaying process. Tonnages are reported as wet million tonnes (Mt) including approximate moisture content of 4% for MM ore-type.
(5) For estimation of Mineral Resources a single Fe cut-off value of 54% Fe was applied and cut-off grades used to estimate Ore Reserves range from 54% to 60% Fe.(6) Changes to MM Mineral Resources after consideration of mining depletion compared to reporting as at 30 June 2017 are a result of new drilling and updated resource estimates for eight
MM ore type deposits. Changes to MM Ore Reserves after consideration of mining depletion compared to reporting as at 30 June 2017 are the result of scheduled ore tonnage utilisingforecast prices causing Reserve changes and a material increase due to first time declaration of Ore Reserves for Grand Central, Highway and Vista Oriental deposits in the South Flankproject.
(7) Product recovery (tonnage basis) is 100%.(8) Iron ore is marketed for WAIO as Lump (direct blast furnace feed) and Fines (sinter plant feed).(9) Ore Reserves are all located on State Agreement Mining Leases that guarantee the right to mine. Across WAIO, State Government approvals (including environmental and heritage
clearances) are required before commencing mining operations in a particular area. Included in the Ore Reserves are select areas where one or more approvals remain outstanding, butwhere, based on the technical investigations carried out as part of the mine planning process and company knowledge and experience of the approvals process, it is expected that suchapprovals will be obtained as part of the normal course of business and within the time frame required by the current mine schedule.
(10) BHP ownership varies between 85% and 100%.(11) Tonnes are rounded to nearest 10 million tonnes.
MtFe(%)
P(%)
SiO2(%)
Al2O3(%)
LOI(%) Mt
Fe(%)
P(%)
SiO2(%)
Al2O3(%)
LOI(%) Mt
Fe(%)
P(%)
SiO2(%)
Al2O3(%)
LOI(%) Mt
Fe(%)
P(%)
SiO2(%)
Al2O3(%)
LOI(%) Mt
Fe(%)
P(%)
SiO2(%)
Al2O3(%)
LOI(%)
MM 700 62.2 0.07 2.8 1.6 6.0 1,650 61.1 0.06 3.5 1.9 6.7 5,380 59.7 0.07 4.6 2.3 7.0 7,730 60.2 0.07 4.2 2.1 6.9 7,380 60.2 0.07 4.2 2.1 6.9
OreType
As at 30 June 2018 As at 30 June 2017Measured Resources Indicated Resources Inferred Resources Total Resources Total Resources
MtFe(%)
P(%)
SiO2(%)
Al2O3(%)
LOI(%) Mt
Fe(%)
P(%)
SiO2(%)
Al2O3(%)
LOI(%) Mt
Fe(%)
P(%)
SiO2(%)
Al2O3(%)
LOI(%) Mt
Fe(%)
P(%)
SiO2(%)
Al2O3(%)
LOI(%)
MM 360 62.4 0.06 2.7 1.6 5.9 1,320 61.5 0.06 3.3 1.8 6.5 1,680 61.7 0.06 3.2 1.7 6.3 720 61.3 0.07 3.6 1.9 6.2
OreType
As at 30 June 2018 As at 30 June 2017Proved Ore Reserves Probable Ore Reserves Total Ore Reserves Total Ore Reserves

3
1 IntroductionThis report is issued in support of the declaration of Mineral Resources and Ore Reserves for Marra Mamba (MM) ore type as at30 June 2018, for BHP’s Western Australia Iron Ore (WAIO) asset. The Mineral Resources and Ore Reserves are estimated inaccordance with the relevant assessment criteria contained in Table 1 of the JORC Code (2012) as described further below.WAIO’s Mineral Resources and Ore Reserves comprise Marra Mamba, Brockman (BKM), Channel Iron Deposits (CID) andNimingarra (NIM) ore types spread across multiple mining areas. The focus of this report is on the material changes in the MarraMamba Ore Reserves primarily resulting from the first time declaration of the South Flank project consisting of the Grand Central,Highway and Vista Oriental deposits (Figure 1).
The Mineral Resources and Ore Reserves in this report underpin the operating mines and include the South Flank project thathas been approved by BHP. The total Marra Mamba Ore Reserves increase is mainly driven by the first time inclusion of theSouth Flank project. This report outlines the key underlying assumptions and outcomes supporting the Marra Mamba OreReserves and South Flank Definition Phase Study (DPS), equivalent to a Feasibility Study.
Ownership entities representing WAIO tenure relevant to Marra Mamba inclusive of the South Flank project are shown in Figure2 and described in Table 3.
Figure 1: South Flank Project – Deposit locations
4
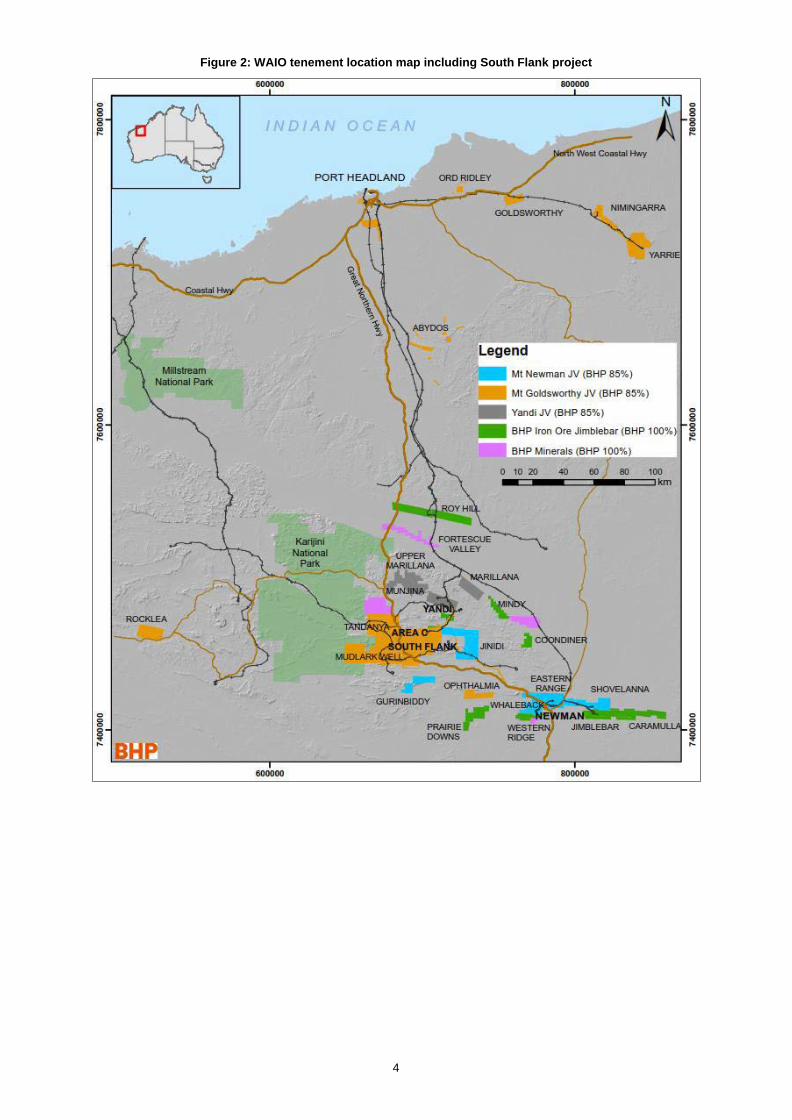
Figure 2: WAIO tenement location map including South Flank project
5
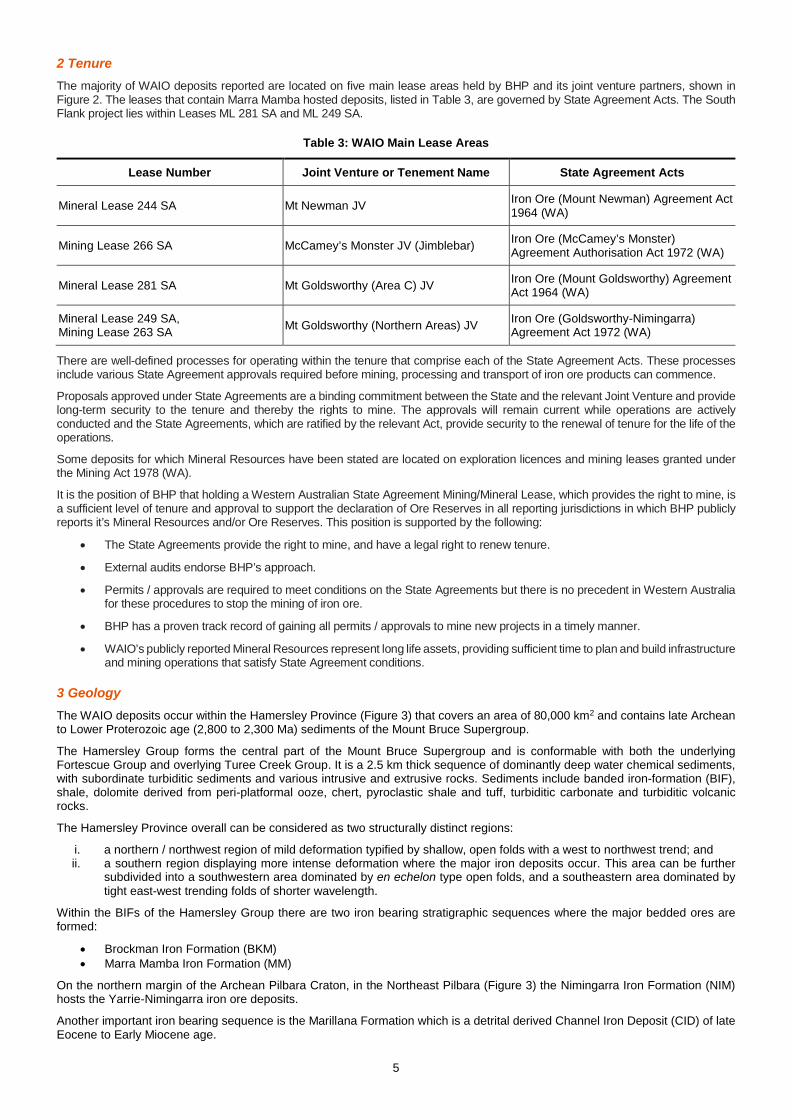
2 TenureThe majority of WAIO deposits reported are located on five main lease areas held by BHP and its joint venture partners, shown inFigure 2. The leases that contain Marra Mamba hosted deposits, listed in Table 3, are governed by State Agreement Acts. The SouthFlank project lies within Leases ML 281 SA and ML 249 SA.
Table 3: WAIO Main Lease Areas
Lease Number Joint Venture or Tenement Name State Agreement Acts
Mineral Lease 244 SA Mt Newman JV Iron Ore (Mount Newman) Agreement Act1964 (WA)
Mining Lease 266 SA McCamey’s Monster JV (Jimblebar) Iron Ore (McCamey’s Monster)Agreement Authorisation Act 1972 (WA)
Mineral Lease 281 SA Mt Goldsworthy (Area C) JV Iron Ore (Mount Goldsworthy) AgreementAct 1964 (WA)
Mineral Lease 249 SA,Mining Lease 263 SA Mt Goldsworthy (Northern Areas) JV Iron Ore (Goldsworthy-Nimingarra)
Agreement Act 1972 (WA)
There are well-defined processes for operating within the tenure that comprise each of the State Agreement Acts. These processesinclude various State Agreement approvals required before mining, processing and transport of iron ore products can commence.
Proposals approved under State Agreements are a binding commitment between the State and the relevant Joint Venture and providelong-term security to the tenure and thereby the rights to mine. The approvals will remain current while operations are activelyconducted and the State Agreements, which are ratified by the relevant Act, provide security to the renewal of tenure for the life of theoperations.
Some deposits for which Mineral Resources have been stated are located on exploration licences and mining leases granted underthe Mining Act 1978 (WA).
It is the position of BHP that holding a Western Australian State Agreement Mining/Mineral Lease, which provides the right to mine, isa sufficient level of tenure and approval to support the declaration of Ore Reserves in all reporting jurisdictions in which BHP publiclyreports it’s Mineral Resources and/or Ore Reserves. This position is supported by the following:
· The State Agreements provide the right to mine, and have a legal right to renew tenure.
· External audits endorse BHP’s approach.
· Permits / approvals are required to meet conditions on the State Agreements but there is no precedent in Western Australiafor these procedures to stop the mining of iron ore.
· BHP has a proven track record of gaining all permits / approvals to mine new projects in a timely manner.
· WAIO’s publicly reported Mineral Resources represent long life assets, providing sufficient time to plan and build infrastructureand mining operations that satisfy State Agreement conditions.
3 GeologyThe WAIO deposits occur within the Hamersley Province (Figure 3) that covers an area of 80,000 km2 and contains late Archeanto Lower Proterozoic age (2,800 to 2,300 Ma) sediments of the Mount Bruce Supergroup.
The Hamersley Group forms the central part of the Mount Bruce Supergroup and is conformable with both the underlyingFortescue Group and overlying Turee Creek Group. It is a 2.5 km thick sequence of dominantly deep water chemical sediments,with subordinate turbiditic sediments and various intrusive and extrusive rocks. Sediments include banded iron-formation (BIF),shale, dolomite derived from peri-platformal ooze, chert, pyroclastic shale and tuff, turbiditic carbonate and turbiditic volcanicrocks.
The Hamersley Province overall can be considered as two structurally distinct regions:
i. a northern / northwest region of mild deformation typified by shallow, open folds with a west to northwest trend; andii. a southern region displaying more intense deformation where the major iron deposits occur. This area can be further
subdivided into a southwestern area dominated by en echelon type open folds, and a southeastern area dominated bytight east-west trending folds of shorter wavelength.
Within the BIFs of the Hamersley Group there are two iron bearing stratigraphic sequences where the major bedded ores areformed:
· Brockman Iron Formation (BKM)· Marra Mamba Iron Formation (MM)
On the northern margin of the Archean Pilbara Craton, in the Northeast Pilbara (Figure 3) the Nimingarra Iron Formation (NIM)hosts the Yarrie-Nimingarra iron ore deposits.
Another important iron bearing sequence is the Marillana Formation which is a detrital derived Channel Iron Deposit (CID) of lateEocene to Early Miocene age.

6
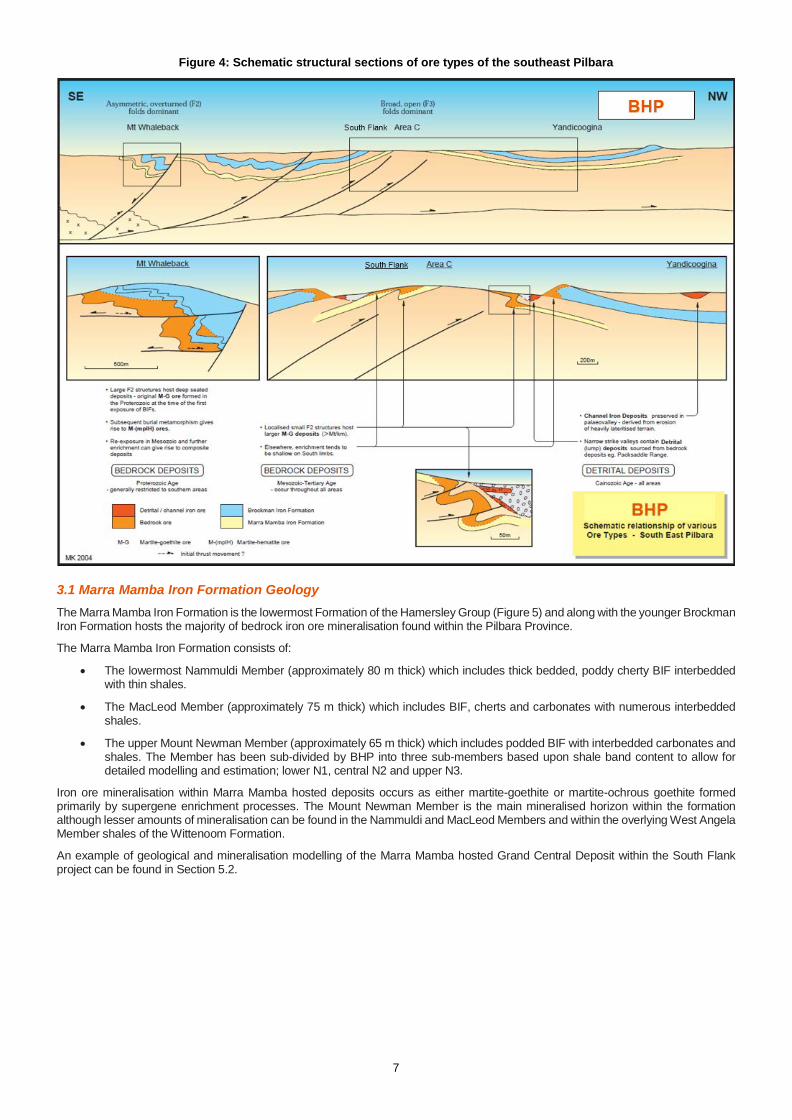
Detrital Iron deposits (DID) are colluvial-alluvial fans adjacent to some bedded iron deposits with their chemistry aligned to theirsource rocks. A schematic structural relationship of the various ore types in the southeast Pilbara is represented as Figure 4.
Figure 3: Hamersley Province – Pilbara geological sketch map
7
Figure 4: Schematic structural sections of ore types of the southeast Pilbara
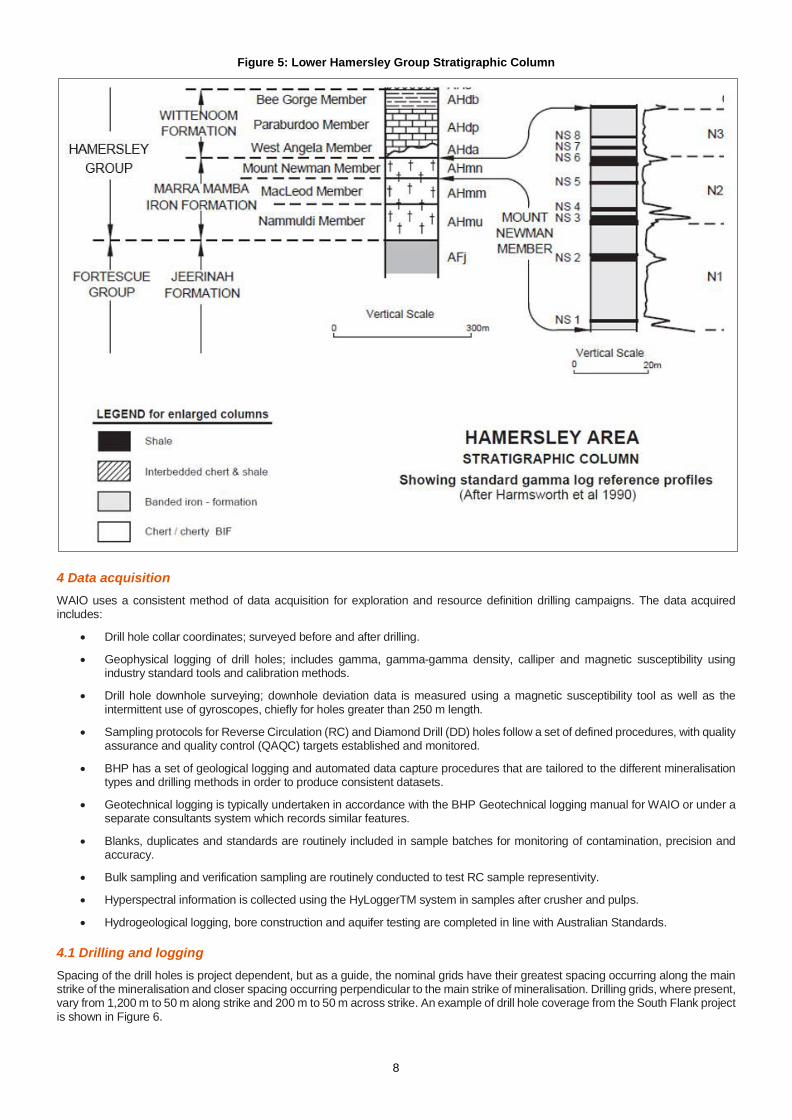
3.1 Marra Mamba Iron Formation GeologyThe Marra Mamba Iron Formation is the lowermost Formation of the Hamersley Group (Figure 5) and along with the younger BrockmanIron Formation hosts the majority of bedrock iron ore mineralisation found within the Pilbara Province.
The Marra Mamba Iron Formation consists of:
· The lowermost Nammuldi Member (approximately 80 m thick) which includes thick bedded, poddy cherty BIF interbeddedwith thin shales.
· The MacLeod Member (approximately 75 m thick) which includes BIF, cherts and carbonates with numerous interbeddedshales.
· The upper Mount Newman Member (approximately 65 m thick) which includes podded BIF with interbedded carbonates andshales. The Member has been sub-divided by BHP into three sub-members based upon shale band content to allow fordetailed modelling and estimation; lower N1, central N2 and upper N3.
Iron ore mineralisation within Marra Mamba hosted deposits occurs as either martite-goethite or martite-ochrous goethite formedprimarily by supergene enrichment processes. The Mount Newman Member is the main mineralised horizon within the formationalthough lesser amounts of mineralisation can be found in the Nammuldi and MacLeod Members and within the overlying West AngelaMember shales of the Wittenoom Formation.
An example of geological and mineralisation modelling of the Marra Mamba hosted Grand Central Deposit within the South Flankproject can be found in Section 5.2.
8
Figure 5: Lower Hamersley Group Stratigraphic Column
4 Data acquisitionWAIO uses a consistent method of data acquisition for exploration and resource definition drilling campaigns. The data acquiredincludes:
· Drill hole collar coordinates; surveyed before and after drilling.
· Geophysical logging of drill holes; includes gamma, gamma-gamma density, calliper and magnetic susceptibility usingindustry standard tools and calibration methods.
· Drill hole downhole surveying; downhole deviation data is measured using a magnetic susceptibility tool as well as theintermittent use of gyroscopes, chiefly for holes greater than 250 m length.
· Sampling protocols for Reverse Circulation (RC) and Diamond Drill (DD) holes follow a set of defined procedures, with qualityassurance and quality control (QAQC) targets established and monitored.
· BHP has a set of geological logging and automated data capture procedures that are tailored to the different mineralisationtypes and drilling methods in order to produce consistent datasets.
· Geotechnical logging is typically undertaken in accordance with the BHP Geotechnical logging manual for WAIO or under aseparate consultants system which records similar features.
· Blanks, duplicates and standards are routinely included in sample batches for monitoring of contamination, precision andaccuracy.
· Bulk sampling and verification sampling are routinely conducted to test RC sample representivity.
· Hyperspectral information is collected using the HyLoggerTM system in samples after crusher and pulps.
· Hydrogeological logging, bore construction and aquifer testing are completed in line with Australian Standards.
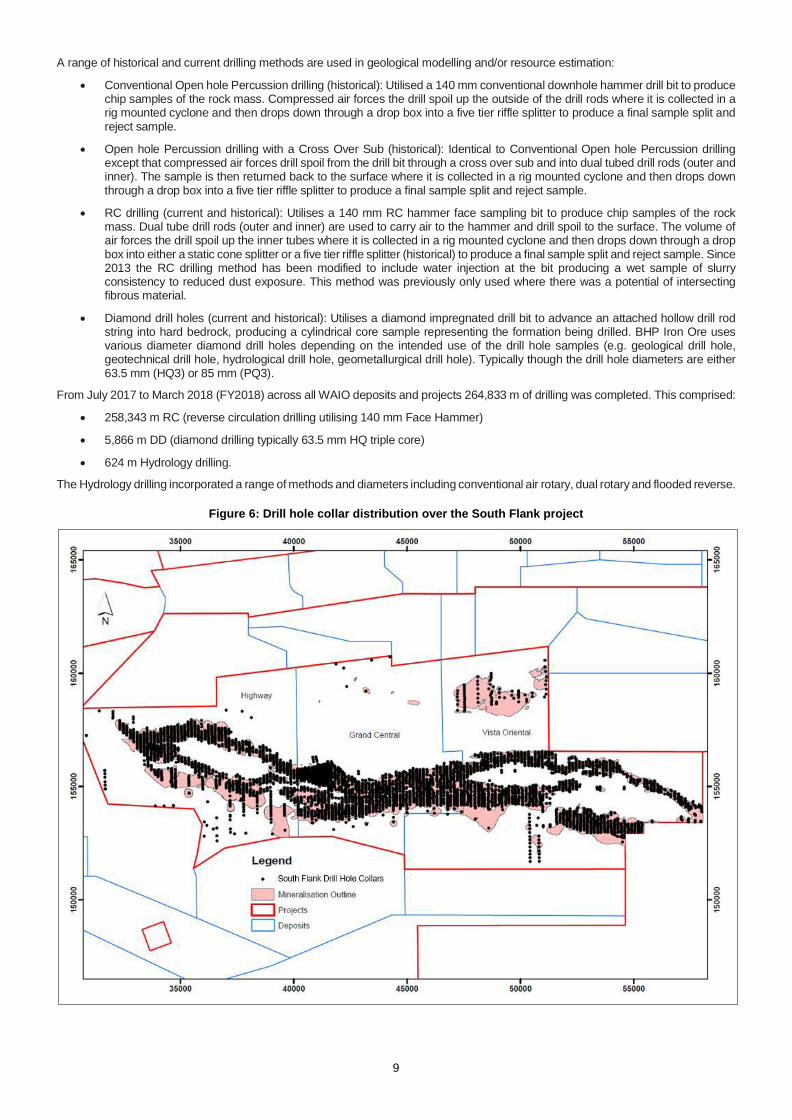
4.1 Drilling and loggingSpacing of the drill holes is project dependent, but as a guide, the nominal grids have their greatest spacing occurring along the mainstrike of the mineralisation and closer spacing occurring perpendicular to the main strike of mineralisation. Drilling grids, where present,vary from 1,200 m to 50 m along strike and 200 m to 50 m across strike. An example of drill hole coverage from the South Flank projectis shown in Figure 6.
9
A range of historical and current drilling methods are used in geological modelling and/or resource estimation:
· Conventional Open hole Percussion drilling (historical): Utilised a 140 mm conventional downhole hammer drill bit to producechip samples of the rock mass. Compressed air forces the drill spoil up the outside of the drill rods where it is collected in arig mounted cyclone and then drops down through a drop box into a five tier riffle splitter to produce a final sample split andreject sample.
· Open hole Percussion drilling with a Cross Over Sub (historical): Identical to Conventional Open hole Percussion drillingexcept that compressed air forces drill spoil from the drill bit through a cross over sub and into dual tubed drill rods (outer andinner). The sample is then returned back to the surface where it is collected in a rig mounted cyclone and then drops downthrough a drop box into a five tier riffle splitter to produce a final sample split and reject sample.
· RC drilling (current and historical): Utilises a 140 mm RC hammer face sampling bit to produce chip samples of the rockmass. Dual tube drill rods (outer and inner) are used to carry air to the hammer and drill spoil to the surface. The volume ofair forces the drill spoil up the inner tubes where it is collected in a rig mounted cyclone and then drops down through a dropbox into either a static cone splitter or a five tier riffle splitter (historical) to produce a final sample split and reject sample. Since2013 the RC drilling method has been modified to include water injection at the bit producing a wet sample of slurryconsistency to reduced dust exposure. This method was previously only used where there was a potential of intersectingfibrous material.
· Diamond drill holes (current and historical): Utilises a diamond impregnated drill bit to advance an attached hollow drill rodstring into hard bedrock, producing a cylindrical core sample representing the formation being drilled. BHP Iron Ore usesvarious diameter diamond drill holes depending on the intended use of the drill hole samples (e.g. geological drill hole,geotechnical drill hole, hydrological drill hole, geometallurgical drill hole). Typically though the drill hole diameters are either63.5 mm (HQ3) or 85 mm (PQ3).
From July 2017 to March 2018 (FY2018) across all WAIO deposits and projects 264,833 m of drilling was completed. This comprised:
· 258,343 m RC (reverse circulation drilling utilising 140 mm Face Hammer)
· 5,866 m DD (diamond drilling typically 63.5 mm HQ triple core)
· 624 m Hydrology drilling.
The Hydrology drilling incorporated a range of methods and diameters including conventional air rotary, dual rotary and flooded reverse.
Figure 6: Drill hole collar distribution over the South Flank project

10
4.2 SurveySurvey practices have improved over time, ground-truthing and re-survey of historic data are completed where issues are identifiedand it is practical to do so. All surveys are referenced to Geocentric Datum of Australia 1994 (GDA94) and the Australian Height Datum(AHD). The survey methodologies utilised for each data source are as follows (and conducted by or under the supervision of a qualifiedsurveyor):
· Mapping and relief modelling, aerial surveying is used. This has a positional accuracy of 2.5 m horizontally and 1 m vertically.
· Collar surveys surveyed using Real Time Kinematic or Post-Processed Kinematic Global Positioning System survey. Thishas a positional accuracy of 0.3 m horizontally and 0.1 m vertically. Drill holes pre-2000 were surveyed using terrestrial basedtechniques including trigonometric heighting and gridding by theodolite.
· Downhole surveys use a magnetic susceptibility tool for measuring downhole deviation data for all boreholes; in-rodgyroscopic survey is conducted for holes greater than 250 m length and holes drilled for slope stability and other geotechnicalstudies.
Collar and downhole surveys include QAQC programs requiring the resurvey of five per cent of each drill program. Deviations beyonddefined thresholds are investigated. For the FY2018 drill program, of the 3,609 holes drilled, 151 were resurveyed.
4.3 Sampling and analytical proceduresSampling procedures in the field are aligned with BHP’s commitment to maintaining International Standards Organisation (ISO) 9001Quality Assurance accreditation and BHP QAQC guidelines.
Historical assaying processes were employed by Mt Newman Mining Ltd and Goldsworthy Mining Ltd in the 1960s and 1970s wheresamples were processed in company-owned laboratories. Mt Newman Mining Ltd regularly assayed samples for Fe, P, SiO2 and Al2O3by X-Ray Fluorescence (XRF) and sporadically for other elements such Mn, CaO, K2O, MgO, S and TiO2. During very early scout drillcampaigns in the 1960s at Mining Area C, Goldsworthy Mining Ltd assayed Fe using a wet chemical titration method for analysis whichonly determined soluble Fe. Later drill programs were assayed for Fe, P, SiO2 and Al2O3 by X-Ray Fluorescence (XRF). Post 1980,BHP Iron Ore has employed third party owned laboratories to process and assay drill hole samples.
During the FY2018 drilling campaign, 147,351 of the samples (97.1 per cent) collected were drilled using RC drilling and 4,390 samples(2.9 per cent) using diamond drilling. The standard sample interval for the majority of drill holes is 3 m in length for RC drill holes.Diamond core was primarily sampled at 1.5 m intervals per geometallurgical and geotechnical requirements.
Bureau Veritas Australia laboratories processed approximately 99 per cent of the operative samples. SGS Australia laboratories werealso used for processing project samples, chiefly from Bulk Sampling programs and ALS laboratories were used for processing ofgeometallurgical samples. All three laboratories are ISO 17025 certified and followed the same procedures.
The RC method of sampling uses a vertical, static cone splitter, with duplicate samples taken simultaneously from a secondary chute.A sample is collected over 3 m intervals (above and below water table) in Marra Mamba hosted BIF. The average sample weighsapproximately 5 kg to 6 kg. Upon receipt by the laboratory, the samples are dried, crushed, split and pulverised to produce a 0.66 gcharge for X-Ray Fluorescence (XRF) to assay for Fe, P, SiO2, Al2O3, MnO, CaO, K2O, MgO, Na2O, S and TiO2 and Robotic Thermo-Gravimetric Analysis (ROBTGA) to determine Loss On Ignition (LOI).
The majority of diamond core was drilled for geotechnical or geometallurgical analysis. Diamond drill core that is not used forgeometallurgical test work is logged by geologists and dispatched directly to Bureau Veritas Australia where the core is then crushed,split and pulverised to produce a 0.66 g charge and analysed as per the RC samples. Drill core intended for metallurgical studies aresent to the ALS laboratories Iron Ore Technical Centre where it is crushed split into lump and fines fractions prior to being sent toBureau Veritas Australia for analysis.
Sample preparation protocols (drying temperatures and times, crushing and pulverising sizing requirements, etc.) at laboratories meetstandards defined in contracts in line with ISO standards, with QAQC targets established.
A diagrammatic flow chart of the sample preparation process is shown in Figure 7.

11
Figure 7: Sampling and analytical flow diagram
4.4 Quality of assay data and laboratory testsDrilling prior to 2000 had little to no QAQC data available, drilling up to 2007 introduced a number of QAQC elements includingduplicates, blanks and Certified Reference Material (CRM). Post-2007 drilling can be expected to contain all current QAQC controls.
Since 2012, additional measures to ensure sample collection and representativeness have been introduced as standard practiceincluding closer communication with field teams about QAQC, a monthly rig performance review, tighter controls on the sample weightrepeatability and the widespread application of bulk sampling programs and drill hole re-logging using the BHP Downhole Assay Tool(DHAT).
The DHAT technology is a highly sensitive method based on the detection and measurement of characteristic gamma rays emittedfrom radioactive isotopes produced from material when they are bombarded with neutrons. The tool collects the data within a 30 cmradius from the drill hole, and therefore may be considered a twin with the added benefit of minimised short scale geological variation.
This technology has replaced the old practice of drilling five per cent of Diamond Drill hole twins, because results are not affected bygeological variability, and thus has become a more effective methodology to assess potential sampling bias in the RC data. In addition,the DHAT has also been used as method of verifying a substantial amount of historical data (via logging of historic open drill holes).
The FY2018 QAQC program includes routine controls for approximately ten per cent of the samples sent for chemical analysis.Sampling and analysis control samples include CRM’s, duplicate sample splits from RC drill holes, and blanks (Table 4).
All WAIO CRM standards are matrix-matched prepared by Ore Research & Exploration, an independent company specialising inCRMs preparation. Standards were prepared in 2013 and new series in 2014, 2015 and 2017. Similar to previous series, the 2017standards use the “pigeon pair” method, by which two standards of similar grade are slightly offset so that the laboratory cannotdifferentiate between the two.

12
Table 4: FY2018 sampling and analysis controls for RC and diamond drilling
Control Source Frequency Measure Error
Field Duplicate(RC only) WAIO Fixed intervals after primary samples ending in 15,
30, 60 and 90 Precision Sampling / Splitter Errors
Coarse Blank WAIOFor RC drilling and Diamond core sampling:
Fixed intervals as sample bags ending 00, 35 and70
Contamination Sample Preparation
CRM(standards) WAIO A random mix of CRM inserted at fixed intervals
as samples ending in 01, 36 and 71 Accuracy Analytical bias
Sample Weight(RC only) WAIO All Field Duplicates Sample
RepresentivitySample Collection -
Recovery
Bulk Sampling and re-logging programs were undertaken across a number of WAIO projects during FY2018 to evaluate therepresentativeness of RC samples both above and below the in-situ water table. Bulk samples (Number=337) have been collected atthree main project areas, including the South Flank project, and approximately 20 per cent of drill holes were logged by the DHAT.Results for the FY2018 drilling campaign show a good correlation between RC samples, the bulk samples and DHAT data supportingthe current sampling and assaying methodologies.
4.5 Sample security – Chain of custodyMeasures taken to ensure the sample security are:
1. A reconciliation is completed by field assistants at the time of sample pick-up from the drill pad. Sample Identifications, whichhave been logged by field geologists, are reconciled against samples physically present on the pad.
2. A request for analysis generated using a web-based despatch application, which populates samples directly from thedatabase.
3. A laboratory sample receipt is returned to the Geochemistry Team upon sample receipt at the laboratory. The laboratoryreconciles samples received against samples identified on the request.
4. An assay crosscheck is conducted on five per cent of samples selected at random, by which the assay values reported onthe laboratory certificate are reconciled against the data file loaded into the database.
Issues identified at any reconciliation stage are investigated immediately.
4.6 Database management and securityWAIO drill hole data is managed internally using processes and systems including:
· Computerised field logging system that incorporates controlled input through drop down lists and inbuilt validation checks totrap erroneous data at the earliest possible stage,
· Comprehensive SQL Server relational database that is structured such that quality data and relevant meta-data are integratedwith the primary geological, geochemical and geophysical data, and
· Strict validation rules including confirmation of acceptable QAQC results for each batch of samples assayed. Data is onlyloaded to the master database after all data for the hole has been validated and signed off by the field geologist.
The WAIO master geological database has a security model which requires user access to have supervisor approval. The system isbacked up per standard backup procedures nightly. Disaster recovery tests are conducted periodically involving recovery of thedatabase from a server image and backup.
Primary data sources for all drill hole data are stored on the database server in a secure archive directory. As part of standard workprocedures, five per cent of the assay data stored in the drill hole database are physically checked by geologists against hardcopylaboratory certificates. The details of these checks and approvals are stored in the database.
Data exported from the drill hole database for modelling contains summary statistics, and on the upload of the exported data into themodelling systems, work procedures require statistical checks to ensure the data loaded is the same as exported.
4.7 Physical parametersIn situ bulk density is measured using gamma-gamma single detector density tool (pre-2015). Post 2015 bulk density has beenmeasured using a dual density tool.
The single detector density tool used a cobalt source and was calibrated every fortnight at designated calibration sites against knownphysical densities. The tool measures electron density which is then converted to bulk density using the calibration points.

13
The dual density tool has two detectors spaced at 19 cm and 35 cm. For the short spacing detector, most of the signal comes fromwithin few centimetres of the borehole wall whereas the signal from the long spaced detector penetrates further from the drill hole. Acompensated density is calculated from the short and long spaced detector response to remove the effect of the drill hole rugosity andcavities.
The following QAQC measures are taken to monitor data quality and ensure the credibility of the density data (both tools) for geologicalmodelling and resource evaluation:
· Calibration of log responses to known engineering units (accuracy).
· Logging a repeatability borehole (demonstrate accuracy and determine precision / repeatability).
· Resurveying of five to ten per cent of drill holes on a drill program (repeatability / reproducibility check).
· Comparison of independent density measures, i.e. downhole gamma-gamma density versus density measurements madeon diamond drill core samples ('volume and weight' method).
4.8 Audits and reviewsThe WAIO resource drill hole process has been periodically, independently audited including all aspects from drill planning to datamanagement in the WAIO geological database. No material risks have been identified and all key recommendations have beenactioned.
5 Resource estimationThe resource estimation process followed by WAIO is well established and is consistent with standard industry practice. A set ofprocedures governs geological interpretation, estimation and reporting of Mineral Resources including, peer reviews and independentauditing.
Documentation of the modelling work performed for each resource model used for reporting is stored electronically in a securecentralised location. These reports contain information on deposit extents, geometry, detailed geological and geostatistical modelling,data preparation and compositing and classification parameters including discussion of data spacing’s.
Mineral Resource Competent Persons and Resource Geologists visit site regularly for project planning, project reviews and depositspecific field inspections of both exploration and active mining areas.
5.1 Assumptions
5.1.1 Cut-off parametersA single cut-off value is applied per deposit however cut-offs range from 50 to 55 per cent Fe across the WAIO Mineral Resourceinventory. A 54 per cent Fe cut-off is used for Mineral Resource reporting of Marra Mamba Formation hosted deposits.
Optimised pit designs and mining cut-off grades are re-evaluated each year as part of the WAIO Life of Asset (LOA) Optimised BasePlan (OBP) process, which defines the optimal way to produce each blended ore type to the market whilst getting the highest returnpossible. The LOA optimisation process is based upon updated price, penalties, operating costs and operating capabilities for eachmining hub. Following the LOA process the Mineral Resource cut-off values and lateral and depth extents are reviewed against theoutcomes at each mining hub.
It is reasonable to consider that all material above the Mineral Resource cut-off grades would be eligible for sale via blending withhigher grade ores or via beneficiation, either now or in the future as indicated by WAIO’s strategic mine planning. Mineral Resourcesoutside of current pit design will increase or decrease depending on the financial inputs year on year, however as these represent asmall percentage of overall reported Mineral Resources it is deemed acceptable to include these as they are well within the margin oferror appropriate to their respective Mineral Resource Classification.
5.1.2 Mining factorsReported Mineral Resources assume extraction will continue with open pit bulk mining methods similar to the methods in operationcurrently with bench heights not decreasing below composite lengths. The current bench heights vary from mine to mine dependingon deposit style, ranging from 6 m to12 m. Mineralisation volume modelling including internal waste and internal dilution considercontinuity of volumes across multiple holes such that there is prospect for bulk mining extraction. Operating data and reconciliationoutcomes support that the estimated Mineral Resources can be extracted using current open-pit bulk mining methods.
5.1.3 Metallurgical factorsWAIO Mineral Resources are reported as in-situ wet tonnes and dry head grades. However multi-variate geometallurgical algorithms,derived from metallurgical test work to simulate lump and fines product generation through the supply chain from primary crushing tothe final shipped product, are applied to each resource estimate on a block-by-block basis as a post-processing step prior to handingthe model over for mine planning work.

14
5.1.4 Environmental factorsAll mineralised and waste material is regularly assessed during resource estimation to evaluate if any material could potentially causeAcid and Metalliferous Drainage (AMD) when extracted and stored in waste dumps or when exposed in, or is proximal to (i.e. within20 to 30 m ) a final pit wall/floor.
All mineralised and waste material is coded in each resource model as outlined in Table 5. The coding is based on a series ofcalculations applied to each model following resource estimation:
· a calculation of the Maximum Potential Acidity (MPA) which is based on sulphur (S) estimates;
· a calculation of the Acid Neutralising Capacity (ANC) which is based on calcium (in the form of CaO), magnesium (in the formof MgO) and loss on ignition (LOI) estimates; and
· a final calculation of the Net Acid Production Potential (NAPP = MPA – ANC).
A conservative NAPP cut-off of 3 kg H2SO4 per tonne of material is used to identify at risk material within each resource model. Materialabove this cut-off is coded as either AMD=1; Potentially Acid Forming (PAF) material that needs to be stored in a purpose built wastedump, or AMD=2 or 3; which is oxidised material that may pose a risk in the future and must be tracked into standard waste dumps incase it needs to be redeployed at a later date.
Table 5: AMD classification
AMD Classification AMD code
NAF (beneficial material) 0
PAF (acid generating material) 1
Weathered AMD Hazard 2
Detrital AMD Hazard 3
Environment impacts from potential AMD are considered in waste management strategies during mine planning and at times lead tomodification of the extracted resource.
5.2 Estimation and modelling techniquesGeological modelling techniques employed by WAIO for models include Pre-2012, cross sectional interpretation followed by wire-framemodelling to produce a three dimensional interpretation of the geology and mineralised zones of the deposit and post-2012, implicitmodelling of geology, relying less on sectional interpretation to focus directly on the three-dimensional consistency of the resultinggeology model.
The interpretation heavily relies on downhole wireline logs of natural gamma supported by geochemistry, HyLogger-based mineralogyand surface mapping. Downhole televiewer data is also utilised when it exists in the project area. Alternate interpretations are generatedas part of the iterative process to arrive at a consistent model. Interpretations undergo an internal peer review process to ensureaccuracy and consistency. Areas of uncertainty in the interpretation are captured. The work performed is documented in detail in theGeological Modelling Report for each model.
Data preparation for resource modelling involves flagging the original sample intervals to the geological interpretation, then compositingthe data to a uniform composite length (breaking at the geology contacts) for statistical and geostatistical analysis (typically 3 m forbedded deposits). Missing data in the database is restricted to historic drill holes and therefore limited; missing intervals are ignoredduring compositing. Where sample records contain only a sub-set of the standard 11 analytes, the Competent Person decides howthis data is to be used as detailed in the respective modelling reports; generally at least the five major variables (Fe, P, SiO2, Al2O3,LOI) need to be assayed for a sample to be used in estimation. Below-detection limit values are replaced with two-thirds of the detectionlimit.
Mineralisation domains are based on ‘natural’ cut-offs identifying stationary in situ mineralisation volumes. They incorporate un-mineralised samples and/or low grade mineralised samples depending on the globally assessed mineralisation cut-offs and the degreeof local continuity found during interpretation. Depending on grade continuity, dilution of mineralised domains ranges from a few toabout ten per cent of samples within a domain. Any outlier deleterious values can be locally constrained during estimation.
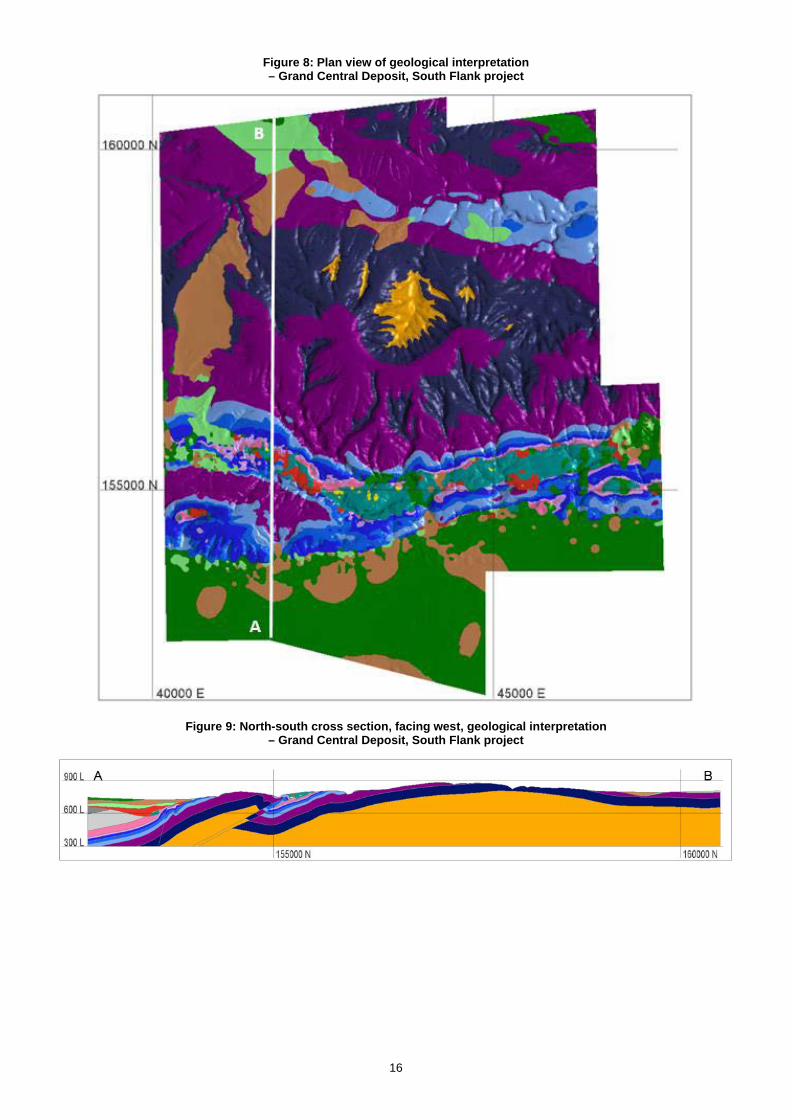
An example of the geological and mineralisation modelling for the Marra Mamba hosted Grand Central deposit within the South Flankproject is shown in Figure 8 to Figure 11 with legend shown in Table 6.

15
Table 6: Grand Central Deposit, South Flank project – stratigraphic legend
Legend BHP Geology Code BHP Sub-Member Delineation Member FormationSZ Surface Scree
ST3 SiltstoneGS3 Gravelly SiltstoneWP3 Welded PisoliteCA2 CalcreteVB2 Vuggy BrecciaCY2 ClayLT2 Lignite ClayHC1 Hematite ConglomerateCY1 Ferruginous ClayOC Shaley Bee Gorge Bee GorgeOB Paraburdoo Paraburdoo
WA2 West Angela Shale 2WA1 West Angela Shale 1N3 Mount Newman 3N2 Mount Newman 3N1 Mount Newman 3MM MacLeod MacLeodMU Nammuldi NammuldiJN Jeerinah Shale Jeerinah
Tertiary Detritals
Wittenoom
Mount NewmanMarra Mamba
West Angela Member
16
Figure 8: Plan view of geological interpretation– Grand Central Deposit, South Flank project
Figure 9: North-south cross section, facing west, geological interpretation– Grand Central Deposit, South Flank project

17
Figure 10: Plan view of mineralisation interpretation– Grand Central Deposit, South Flank project
Figure 11: North-south cross section, facing west, of mineralisation interpretation– Grand Central Deposit, South Flank project
Block models are constructed with geological, mineralisation and weathering domains, based on the wire-framed interpretation. Blockmodels use estimation parent cells with dimensions usually half drill hole spacing in easting/northing direction and three-metre cellheight, creating a possible range from 25mE x 25mN x 3mRL up to 600mN x 150mE x 15mRL. Sub-cells are used to ensure robustrepresentation of geological boundaries and domain volumes.
WAIO use Vulcan software to produce geological resource models and Isatis software for exploratory data analysis, optimising krigingparameters and for other geostatistical applications such as global change of support investigations.

18
In some cases where the evaluation is at an early stage and drill information is broadly spaced, cross-sectional area of influence typeestimates have been generated for global resource reporting purposes. Currently only three deposits representing approximately threeper cent of WAIO’s total Mineral Resource tonnes still have estimates by cross-sectional area of influence.
Grade interpolation into parent cells is typically achieved by Ordinary Kriging (OK) for mineralised domains and Inverse DistanceWeighted (IDW) for waste domains, where data is generally more limited. More recently, S, CaO, MgO and LOI have been estimatedby OK in certain waste lithologies to assess the risk of AMD. Some deposits have been estimated using Inverse Distance Weighting(IDW), representing approximately 16 per cent of WAIO’s total Mineral Resource tonnes.
Search neighbourhood optimisation is performed to define estimation parameters for the resource estimates to balance the risk of localconditional bias and smoothing of the estimate. Models employ either a single pass search with large search radii, for early stagemodels with wide spaced data or for well drilled deposits, up to three passes to either produce more localised estimates or to mitigatethe effects of clustered data. In each case, the relevant Competent Person reviews the resource estimation strategy. Sample correlationis taken into account in estimation by selecting the same samples for all variables. Outlier spatial restraining is applied on a case-by-case basis depending on spatial continuity or discontinuity of the underlying geological feature.
Appropriate selectivity of the resource estimates is validated by applying the geostatistical technique Global Change of Support (GCoS);these comparative global resource estimates are used for assessing the degree of smoothing in the OK estimates, and determiningthe sensitivity of the resource using different Selective Mining Units (SMU) for mine planning. Reconciliation confirms that overall,selectivity represented in the resource models mimics mining practise
In situ (wet) bulk density is typically estimated into the models based on geophysical wireline data. When there is only limited or nowireline data available bulk density is assigned using domain averages of filtered density data from geophysical wirelines or from coremeasurements. These assigned densities can be from the deposit being estimated or a nearby proxy.
Validation of the estimates include:
· Visual validation of representative plans and sections with drill hole grades and estimated block grades;
· Global statistical comparison of volume weighted average cell grades to both raw and de-clustered length weighted drill holegrades;
· Statistical comparison of volume weighted average cell grades (north, east and elevation panels) to length weighted drill holegrades;
· Comparison to Gaussian Change of Support techniques to evaluate smoothing;
· Review of estimation performance data (e.g. cell grade totals, slope of regression);
· Comparison to previous resource estimates;
· Comparison to mining reconciliation data.
An internal peer review process is also followed and documented throughout each resource estimation project. After completion, eachestimate is submitted to a Technical Committee comprising all WAIO Competent Person’s for approval.
6 Mineral Resources statement
6.1 ClassificationClassification of WAIO Minerals Resources is project dependent. Factors influencing Mineral Resource classification include:
· Location of BHP tenure boundaries;
· Data density/spacing in three dimensions; which approximates to minimum drill spacing’s of 50 m x 50 m for Measured,150 m x 50 m for Indicated Mineral Resource classifications;
· Location, grade and geophysical data quality;
· Geological continuity and/or complexity;
· Grade variability;
· Estimation quality;
· Weathering zones and proximity to the water table;
· The possibility of eventual economic extraction:
o Size (horizontal extents and depth) and continuity of mineralisation;
o Location of the deposit in relation to existing WAIO infrastructure;
o Mineralisation “ore type” (standard BKM, MM, CID and NIM ore types vs non standard detrital, Yandicoogina,Weeli Wolli or Boogeeda hosted mineralisation) and quality;
o A review of heritage and environmental modifying factors.

19
6.2 Discussion of relative accuracy/confidenceThe relative accuracy and confidence of the resource estimates is deemed appropriate for their intended purpose of global resourcereporting and medium to long-term mine planning studies. The underlying assumptions as stated in Section 5.1 effecting the accuracyand confidence are taken into consideration during classification of the model and are therefore addressed by the Competent Personin the attributed resource classification.
Reconciliations are carried out on a quarterly and annual basis and support the confidence WAIO has in the estimations and relatedresource classifications.
6.3 Mineral Resources declaredTable 1 contains the statement of Marra Mamba ore type Mineral Resources for WAIO as at 30 June 2018.
Changes to the Marra Mamba ore type Mineral Resources after consideration of mining depletion compared to FY2017 reporting area result of new drilling and resource estimates for eight deposits (Figure 12 and Figure 13) including:
· Early extents drilling programs at the Silver Knight and Orebody 29 deposits
· Infill and final drill out programs at the Grand Central and Vista Oriental South Flank deposits
· Final drill out programs conducted at Dead End, Eastern Syncline and Sylvania deposits
· Operational drilling program conducted at Orebody 35
Figure 12: Marra Mamba hosted deposits in the Central Pilbara Region with updated Resource Estimates in FY2018

20
Figure 13: Marra Mamba hosted deposits in the Eastern Pilbara Region with updated Resource Estimates in FY2018
7 Independent reviewSelected operations and deposits are targeted for external audit if they form part of a major capital project, are being reported for thefirst time or have materially changed as defined by BHP’s internal requirements.
The most recent external review of Mineral Resources was completed by SRK Consulting (Australasia) Ltd in July 2016 on theHighway, Grand Central and Vista Oriental deposits within the South Flank Project area. There were no major outcomes orrecommendations for improvement from the review. Since this review the Grand Central and Vista Oriental deposits have had newresource estimates completed following infill drilling programs. No changes in the geological modelling or resource estimate processeshave been implemented since the 2016 review.
8 Further workStrategic drilling programs and subsequent geological modelling and resource estimation projects are aligned to the WAIO Life of Assetand Five Year Plan processes to ensure Mineral Inventory extents are first defined and then subsequently drilled out to provide anappropriate level of geological certainty for long and medium term business planning.
Tactical drilling programs and subsequent geological modelling and resource estimation are aligned to the WAIO Two Year Plan andexecution schedules to ensure there is sufficient detail in operating deposits to allow for efficient extraction.
9 General mine planning criteriaBHP internal requirements states that the Ore Reserves to be scheduled in the approved Life of Asset (LoA) Optimised Base Plan(OBP).
The approved mine plan for South Flank is the LoA plan for the South Flank Definition Phase Study (DPS), equivalent to FeasibilityStudy level, completed in FY2018 in accordance with the BHP requirements for Major Capital Projects.
21
9.1 Assumptions
9.1.1 Mineral Resource estimate for conversion to Ore ReservesThe latest and approved resource models (and estimates) for all Marra Mamba deposits have been used for the mine planning andconversion to the Ore Reserves. The Mineral Resources reported are inclusive of the Ore Reserves.
9.1.2 Site VisitsThe Ore Reserves Competent Persons visited the respective sites regularly during FY2018. The Ore Reserves Competent Personsare Mine Planning Superintendents for their respective sites and the site visits are conducted regularly for site inspection, engagementwith site based personnel and routine tours of active mining areas.
South Flank is presently not an active mining site. Four separate site visits have been conducted specific to South Flank project areaby the Competent Person. The first site visit was focused on reviewing the site in relation to government approvals. This includedtouring and inspecting the major drainage lines across the Highway deposit and also tours of heritage sites located on the Highwaydeposit in the company of Traditional Owners and representatives from the BHP Heritage Department. The second tour was focusedon the terrain and exploration results and involved a tour of the entire South Flank Range in the company of a representative from theResource Engineering Department (the long term mine planner) and a representative from the Geoscience Department (the explorationgeologist). The third and fourth site visits focused on the early works progress and key infrastructure areas and knowledge sharing withMine Manager and the superintendent of site based scheduling team.
9.1.3 Study StatusThe deposits underpinning Marra Mamba Ore Reserves are either currently existing operations or Definition Phase Study (BHPequivalent of a feasibility) level studies have been completed to enable Mineral Resources to be converted to Ore Reserves. Thestudies have determined a mine plan that is technically achievable and economically viable, and that material Modifying Factors havebeen considered.
9.1.4 Cut-off parametersBHP utilises variable cut-off grades to define the schedulable ore (Proved and Probable Ore Reserves plus Inferred MineralResources and minor quantity of potential mineralisation) that are determined through value optimisation process to match theproduct specifications of the market and the characteristics of the ore body. There is a process of continual review of cut-off gradesby mine planning and marketing personnel to ensure that the resultant product quality targets continue to meet business needs.The range of cut-off grades used to estimate Marra Mamba Ore Reserves is from 54 to 60 per cent Fe and for South Flank is 56to 60 per cent Fe.
9.1.5 Mining factorsThe WAIO mine plans are continually optimised as part of the BHP Corporate Alignment Planning (CAP) cycle using the optimised pitshells together with Mining Models (WAIO equivalent of a Reserve Model), cost, revenue and production rate factors to generate LoAschedules. No material naturally occurring risks have been identified in the LoA and the South Flank DPS mine plan.
The Mining Model undergoes a validation check and a peer review, prior to being endorsed for use. The Mining Model blocks (alsoknown as selective mining units or SMUs) are generated to have a single material type and set of grades. The selected size of theSMUs is a reflection of the mining method, the mining equipment and integrity of the supporting resource model.
Geometallurgical algorithms have been developed after extensive test work and refined over the several years of historic production.Geometallurgical models are applied to the Resource Models in order to model product tonnage, grades, Lump/Fines yields. Thisinformation is carried through to the Mining Models used for mine planning. The application of geometallurgical algorithms for SouthFlank project has been studied during the DPS and appropriate testwork has been completed.
The geotechnical parameters are provided by the WAIO Geotechnical Engineering team, supported by external consultants. Theseparameters are developed after comprehensive studies for each deposit assessing the geological conditions and factors of safety. Thepit slope angles are based on these study outcomes and recommendations. The Inter Ramp Angles (IRA) for Marra Mamba depositsvary between 27 and 50 degrees. The geotechnical domain parameters guide the mine design to achieve the recommended IRA usinga combination of single/double batter height, berm width and batter slope angle.
Optimised pit limits are determined utilising the Mining Model together with cost, revenue and geotechnical inputs. Optimised pit shellsare then imported into industry standard mine design software to generate pushback and final pit design limits with crest and toe strings,haul road access and minimum mining widths. Designs are reviewed using internal geotechnical expertise and recognised independentgeotechnical consultancy. The Mining Model, optimisation and design outputs are each peer reviewed regularly and audited as requiredby internal governance department to ensure WAIO quality standards are met.
The pit designs in conjunction with the Mining Models are then used to generate the input files for the mine plan scheduling process.Key design parameters for South Flank pits and waste dumps are presented in Table 7.

22
Table 7: Pit and Waste Dump Design Parameters
Pit Design Parameters
Design Parameters Dimensions
Minimum Mining Width 35 m
Minimum Ramp Width with Light Vehicle separation 51 m
Maximum Ramp Gradient 10%
Minimum radius of turning circle 20 m
Bench Height 12 m
Batter Height 12 m; 24 m
Berm Width Variable, according to inter-ramp angle batter height
Inter ramp angle Variable by geotechnical domains
Batter Angle 65o
Waste Dump Design Parameters
Design Parameters Dimensions
Bench Height 20 m
Berm Width 65 m
Batter Angle 37o
Overall Slope Angle 15o
Swell Factor 30%
Minimum Ramp Width 57 m
Maximum Ramp Gradient 10%
WAIO operations involve open-cut mining using face shovels, front-end loaders or backhoe excavators. All mining operations areconducted by the Company. The full bench is drilled and blasted for a 12 m bench, sampled at three times in 4 m increments and three4 m flitches being mined. WAIO has several years’ experience in the mining method and it is considered appropriate for South Flankproject based on the historical performance of other Marra Mamba deposits e.g. North Flank deposits at Mining Area C.
A feasibility level study has been completed in the DPS to identify and timely secure the infrastructure required for the South Flankproject. The major infrastructure requirements are processing plants, Run of Mine (ROM) pads, overland conveyors, mobilemaintenance workshop, explosive magazine, fuel storage, administration facilities, accommodation facilities, supportingcommunication infrastructure etc. The construction schedule has been defined in the South Flank DPS completed in FY2018 inaccordance with the BHP requirements for Major Capital Projects.
Ore loss (mining recovery) and dilution are applied by regularising the Resource Models (used to report Mineral Resources) to theSMU size. As previously mentioned, selecting an SMU size is predominantly based on the equipment to be used for mining and theselected bench height. SMU sizes range from 10x10x4 m (XYZ) for excavator operations to 10x10x12 m for face shovel operations.This approach to defining ore loss and dilution has been calibrated by reconciliation processes at the mine sites or in similar WAIO oretypes. The net recovery factor after application of ore loss and dilution for South Flank is approximately 92 per cent.
Minimum mining widths are based on the mining equipment utilised for standard truck and shovel mining methods and has beenapplied to all pit designs.
Inferred Mineral Resources were allowed to contribute to the pit optimisation and the mine schedules but are not included in the OreReserves estimate. The inclusion of Inferred Mineral Resources in pit optimisation has negligible effect on the selected pit shells andpushback sequence. This was tested in the LoA mine plan by deferring the Inferred Mineral Resources to test if the Inferred MineralResources were enabling some of the Measured or Indicated Mineral Resources to become economic. This was found not to be thecase.
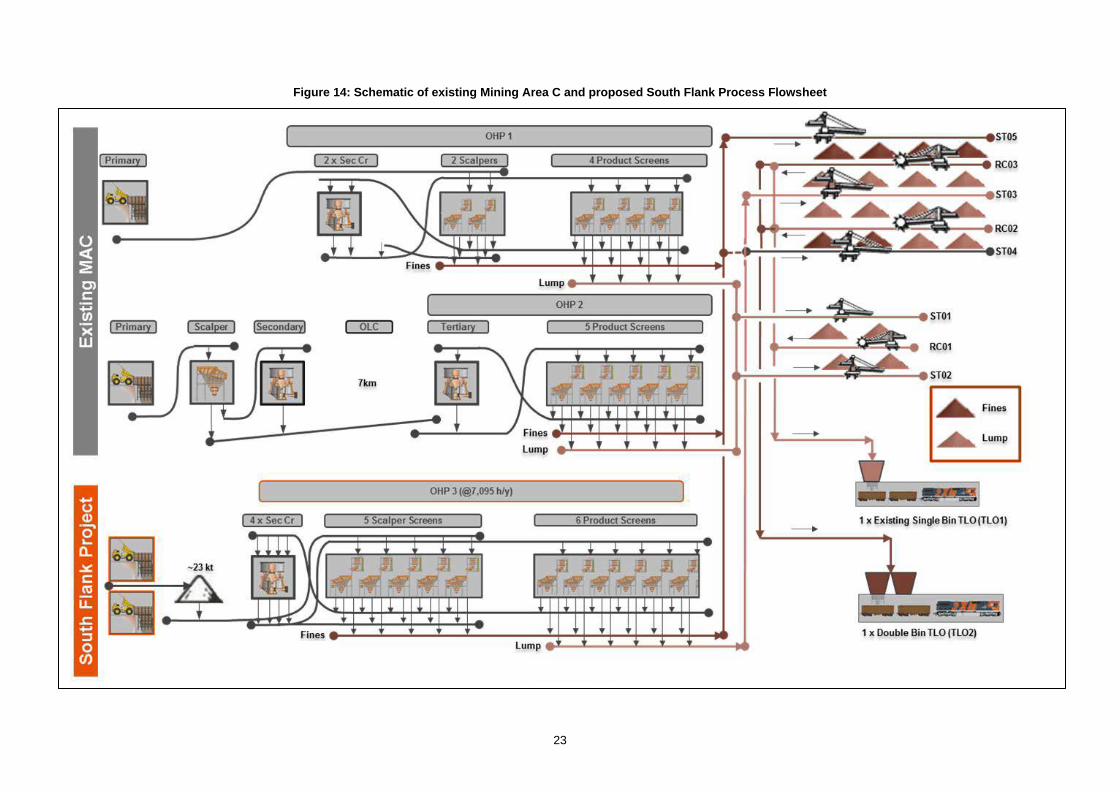
9.1.6 Metallurgical factorsThe processing of high-grade iron ores for sale is simple and well understood with a primary and secondary crushing process andthen screening into product defined lump and fines fractions. Lump for Marra Mamba is defined as nominal >6 mm size. Nosubstantial change in processing method is forecast for future Ore Reserves. Hence, there is inherently low reserve risk due toprocessing complications.
The ore type and material characteristics in the South Flank project are similar to the ore type WAIO has been mining andprocessing for several years. The proposed metallurgical process is well-tested and proven methodology. Figure 14 shows anexample of the proposed process flowsheet for South Flank.
23
Figure 14: Schematic of existing Mining Area C and proposed South Flank Process Flowsheet

24
9.1.7 EnvironmentalAll WAIO operations comply with the Western Australia (WA) and the Federal Australian legislations and requirements. All necessaryapprovals under the Environmental Protection Act 1986 and Environment Protection and Biodiversity Conservation Act 1999 (EPBCAct) are obtained before the commencement of mining execution.
Detailed Environmental Impact Assessments (EIAs) for South Flank were undertaken to support the Public Environmental Review(PER) document. BHP referred the proposal to develop and operate South Flank project under Part IV of the Environmental ProtectionAct 1986. A Ministerial Statement of Approval was issued by the Minister for Environment in February 2018. All works will be undertakenin accordance with the conditions of Ministerial Statement. Other required approval applications are in progress and based on theapprovals framework and historical approvals it is reasonably expected to secure the approvals within required time frame.
Potentially Acid Forming (PAF) waste has been coded in the Resource Models and this coding is carried through to the Mining Modelsfor planning purposes.
Environment impacts from potential AMD are considered in waste management strategies during mine planning. Identified potentialacid mine drainage material is encapsulated within specially designed areas of larger waste dumps, acid neutralising waste material isutilised to encapsulate where practicable.
Acid Mine Drainage (AMD) potential at South Flank has been assessed as low to negligible with 97 per cent of waste classed as Non-Acid Forming.
BHP employs a Closure Planning Standard and Rehabilitation Standard across its Pilbara sites. The Closure Standard provides theoverarching framework for the development of the mine closure strategy and supporting closure provision. The Rehabilitation Standardprovides the overarching framework for successful restoration of areas impacted by BHP operations in the Pilbara. These standardsas well as the BHP requirements for closure provide a consistent approach for closure and rehabilitation across WAIO operations.
9.1.8 InfrastructureWAIO has a company-owned rail network linked to the Nelson Point shipping facility at Port Hedland. The operation is currentlycomprised of an integrated system of four inland mining operations (Yarrie operations were suspended February 2014), morethan 1,000 km of rail, stock yards and two separate port facilities located in Port Hedland. These are shown below in Figure 15.
Figure 15: Schematic of WAIO operations
25
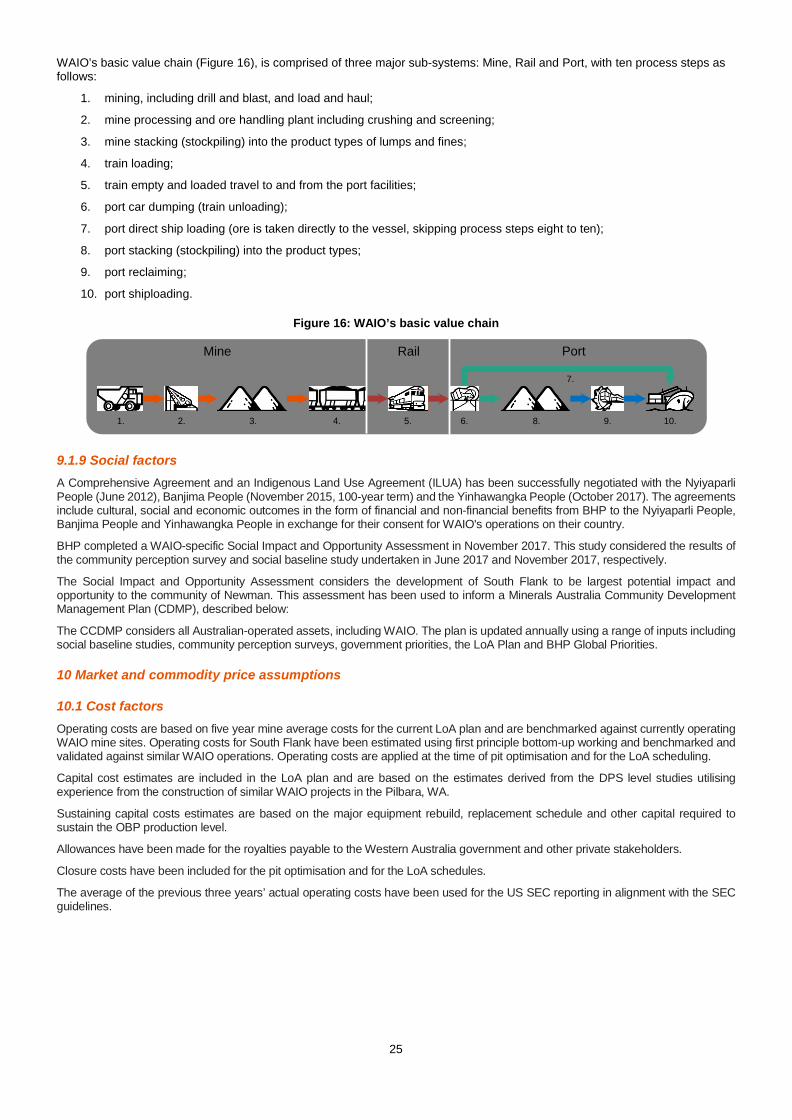
WAIO’s basic value chain (Figure 16), is comprised of three major sub-systems: Mine, Rail and Port, with ten process steps asfollows:
1. mining, including drill and blast, and load and haul;
2. mine processing and ore handling plant including crushing and screening;
3. mine stacking (stockpiling) into the product types of lumps and fines;
4. train loading;
5. train empty and loaded travel to and from the port facilities;
6. port car dumping (train unloading);
7. port direct ship loading (ore is taken directly to the vessel, skipping process steps eight to ten);
8. port stacking (stockpiling) into the product types;
9. port reclaiming;
10. port shiploading.
Figure 16: WAIO’s basic value chain
9.1.9 Social factorsA Comprehensive Agreement and an Indigenous Land Use Agreement (ILUA) has been successfully negotiated with the NyiyaparliPeople (June 2012), Banjima People (November 2015, 100-year term) and the Yinhawangka People (October 2017). The agreementsinclude cultural, social and economic outcomes in the form of financial and non-financial benefits from BHP to the Nyiyaparli People,Banjima People and Yinhawangka People in exchange for their consent for WAIO's operations on their country.
BHP completed a WAIO-specific Social Impact and Opportunity Assessment in November 2017. This study considered the results ofthe community perception survey and social baseline study undertaken in June 2017 and November 2017, respectively.
The Social Impact and Opportunity Assessment considers the development of South Flank to be largest potential impact andopportunity to the community of Newman. This assessment has been used to inform a Minerals Australia Community DevelopmentManagement Plan (CDMP), described below:
The CCDMP considers all Australian-operated assets, including WAIO. The plan is updated annually using a range of inputs includingsocial baseline studies, community perception surveys, government priorities, the LoA Plan and BHP Global Priorities.
10 Market and commodity price assumptions
10.1 Cost factorsOperating costs are based on five year mine average costs for the current LoA plan and are benchmarked against currently operatingWAIO mine sites. Operating costs for South Flank have been estimated using first principle bottom-up working and benchmarked andvalidated against similar WAIO operations. Operating costs are applied at the time of pit optimisation and for the LoA scheduling.
Capital cost estimates are included in the LoA plan and are based on the estimates derived from the DPS level studies utilisingexperience from the construction of similar WAIO projects in the Pilbara, WA.
Sustaining capital costs estimates are based on the major equipment rebuild, replacement schedule and other capital required tosustain the OBP production level.
Allowances have been made for the royalties payable to the Western Australia government and other private stakeholders.
Closure costs have been included for the pit optimisation and for the LoA schedules.
The average of the previous three years’ actual operating costs have been used for the US SEC reporting in alignment with the SECguidelines.
Mine Rail Port
1. 2. 3. 4. 5. 6.
7.
8. 9. 10.
26
10.2 Revenue factorsBHP utilises a common process for generation of commodity prices and foreign exchange (FOREX) rate across the group and WAIOuses the latest Iron Ore price and FOREX from the approved Price Protocol informed by the group.
Pit Optimisation is completed using the forecast mid-case anchor year price and FOREX from the iron ore price-protocol for the yearthat the pit optimisation was completed. Each pit optimisation includes an analysis of the sensitivity to fluctuations in price.
The FY2019 LoA schedules are completed using the price and FOREX from the Iron Ore price protocols endorsed and released beforethe LoA plans commenced.
The commodity price protocols include the short to long term Value in Use (VIU) curves over time for the impurities present in theproduct. In this process, price-protocol is used along with VIU curves to develop estimates of mine returns over the life of the project.The detail of this process is commercially sensitive and is not disclosed in this report; however, it follows BHP internal requirements forCorporate Alignment Planning.
The average of the previous three years’ actual product price and foreign exchange rates are used for the US SEC reporting inalignment with the SEC guidelines.
10.3 Market assessmentThe supply and demand for iron ore is affected by a wide range of factors including changes in the global Iron and Steel consumptiondue to economic development. WAIO delivers products that optimises the utilisation of WAIO’s mineral inventory, while remainingcompetitive in the market.
The volume provided by the South Flank project replaces the existing volumes from the Yandi hub, maintaining the total WAIO volume.
10.4 EconomicsEconomic analysis (calculation of the net present value (NPV)) is conducted using discount rates, estimated inflation and tax ratesapproved by WAIO Finance.
Sensitivity testing on the LoA mine plan using a range of prices, FOREX and cost scenarios demonstrates a positive NPV.
The sensitivity analysis for the South Flank mine plan was completed during the DPS and demonstrated a positive NPV.
11 Ore Reserves estimationAs per BHP internal requirements, Ore Reserves estimates are based on the scheduled Ore Reserves within the Life of AssetOptimised Base Plan (OBP).
The approved mine plan for South Flank is the LoA plan for the South Flank Definition Phase Study (DPS) completed in FY2018 inaccordance with the BHP requirements for Major Capital Projects.
Mine schedules are optimised on value and take into consideration operational and capital costs, production system constraints andmarket conditions. Only the material that generates positive value is scheduled as ore, the remaining is mined as waste or not minedat all. As a result, minimum Fe cut-offs for Ore Reserves do vary between deposits and, over time, range from 54 to 60 per cent Fe.The reported Ore Reserves only include the Mineral Resources classified as Measured or Indicated.
11.1 Reserves generationOre Reserves within the OBP schedule are generated from the process described in section 9 of this report to produce Mining Modelsand pit designs. The Ore Reserves are classified as Proved or Probable in accordance with the guidance provided by the JORC 2012Code.
Confidence in the Ore Reserves estimates is derived from:
· a systematic evaluation procedure used to estimate Ore Reserves;
· procedures are documented, reviewed and audited regularly to ensure Ore Reserves are derived in a consistent mannerand to a high standard;
· Ore Reserves are generated and peer reviewed by a specialised Mine Planning group;
· WAIO mining operations are characterised by simple operating strategies;
· Operations and mine planning have developed over 30 years of operating experience.
As part of the WAIO mine planning processes and procedures, a selection of Ore Reserves are independently reviewed by externalconsultants. Internal WAIO reviews are conducted annually and external reviews are conducted there is a material change. Approvalof South Flank Project contributed to a material change to the Marra Mamba Ore Reserves compared to FY2017 and therefore anexternal review was completed in FY2018 by SRK Consulting (Australasia) Pty Ltd.
Cost, revenue, market assessment along with product strategy are all considered during the LoA planning process and the DPS levelstudies.
27
11.2 US SEC complianceFor WAIO FY2018 Ore Reserves for all ore types, there is no difference between the Ore Reserve Estimates that are reported inaccordance with the JORC 2012 Code for the ASX, and those reported under the US SEC Industry Guide 7.
12 Ore Reserves statement
12.1 ClassificationWAIO has a standard approach to Ore Reserve classification where Proved Ore Reserves are derived from Measured MineralResources, and in nearly all cases Probable Ore Reserves are derived from Indicated Mineral Resources. The only exceptions beingthe Orebody 32 and South Jimblebar deposits where Measured Mineral Resources were downgraded to Probable Ore Reserves. TheOrebody 32 Measured Mineral Resources were downgraded to Probable Ore Reserves to account for the additional risk in theprocessability of below water table material. The Measured Mineral Resources in the South Jimblebar pushbacks towards the end ofmine life were downgraded to Probable Ore Reserves because the detailed geotechnical study has not been completed for thoseareas.
This approach is based on high confidence in our ‘modifying factors’ being applied to the Mineral Resources as described in Section9. Therefore the Ore Reserves is based on the geological confidence in the Mineral Resource category.
For South Flank deposits, the Measured Mineral Resources convert to Proved Ore Reserves and the Indicated Mineral Resourcesconvert to Probable Ore Reserves after the application of the modifying factors. Inferred Mineral Resource was considered as wasteand no Probable Ore Reserves were derived from the Measured Mineral Resources. The South Flank Ore Reserve estimateappropriately reflects the Competent Person’s views.
No social uncertainties have been identified that would downgrade the reported confidence category of Ore Reserve.
12.2 Discussion of relative accuracy/confidenceThe relative accuracy and therefore confidence of the Reserve Estimates is deemed appropriate for their intended purpose of globalOre Reserves reporting and short to medium-term production planning. The application of modifying factors effecting the accuracy andconfidence as stated in Section 9 are taken into consideration during classification of the model and are therefore addressed by theCompetent Person in the attributed Reserve classification.
In the Competent Person’s view, the South Flank DPS achieves the required level of confidence in the modifying factors to provide asound basis for estimation of an Ore Reserve. The DPS determined a mine plan and production schedule that is technically achievableand economically viable.
12.3 Ore Reserves declaredTable 2 presents the statement of Ore Reserves for Marra Mamba ore type as at 30 June 2018.
Updated forecast price penalties and mining cost assumptions utilised within the FY2019 approved LoA OBP have resulted in OreReserves tonnage changes for all deposits.
The overall WAIO Marra Mamba Ore Reserves estimate has materially increased from the FY2017 estimate and the main contributingfactors for this increase are, as follows:
· First time declaration of the Ore Reserves for South Flank Project comprising Grand Central, Highway and Vista OrientalMarra Mamba deposits;
· Minor increases for South Jimblebar deposits due to Mineral Resource classification upgrade.
Total Reserve life including other ore types in WAIO has increased from 14 to 16 years (after mine depletion) predominately due toaddition of Ore Reserves in the South Flank project at the planned nominated production rate.
13 Independent reviewAnnual Risk Review for Ore Reserves reporting are conducted by the BHP Resource Engineering Centre of Excellence (RECoE)and BHP Geoscience Centre of Excellence (GCoE). Internal technical assessments of resources and reserves estimates arescheduled every two years and the last review was conducted for WAIO in 2018.
An independent external review of the process used by BHP to support the South Flank Ore Reserve was conducted by SRKConsulting (Australasia) Pty Ltd in FY2018 focusing on the Ore Reserve estimation of the Highway, Grand Central and VistaOriental deposits occurring within the South Flank project. There were no material issues identified with the reserve estimationprocess and no major outcomes or recommendations for improvement from this review.
14 ReferencesHarmsworth RA, Kneeshaw M, Morris RC, Robinson CJ and Shrivastava PK, 1990. BIF-Derived Iron Ores of the HamersleyProvince in Monograph 14, Geology of the Mineral Deposits of Australia and Papua New Guinea, pp 617 -642. (AusIMM,Melbourne).
Joint Ore Reserves Committee of The Australasian Institute of Mining and Metallurgy, Australian Institute of Geoscientists andMinerals Council of Australia (JORC), 2012. Australasian Code for Reporting of Exploration Results, Mineral Resources and OreReserves.