appendices - new mexico department of …dot.state.nm.us/content/dam/nmdot/infrastructure/hydrology...
TRANSCRIPT

APPENDICES
DECEMBER 1995
NMSHTD DRAINAGE MANUAL PAGE NUMBER A

APPENDIX A PHOTOGRAPHIC GUIDE TO HYDROLOGICCONDITIONS
DECEMBER 1995
NMSHTD DRAINAGE MANUAL PAGE NUMBER A-1

PHOTOGRAPHIC GUIDE TO HYDROLOGIC CONDITIONS
General Notes
These photographs are intended as an aide in selecting an appropriate Curve Number.
Examples of different cover type and hydrologic condition are provided, along withestimates of percent of cover.
Hydrologic soil group values and curve numbers listed below each photograph are forgeneral information purposes only.
Actual hydrologic soil group values should be determined from field inspections andSoil Conservation Service soil surveys.
Actual curve numbers will vary from one project to the next even though the covertype and hydrologic condition may appear similar to a particular photograph.
Cover type and density will vary from one slope aspect to another (i.e., north vs.south). For a particular slope aspect, cover density will vary seasonally throughout theyear.
Note: White measuring stick seen in some photos is 6 ft. in length.
DECEMBER 1995
NMSHTD DRAINAGE MANUAL PAGE NUMBER A-2

Photo No. 1A, General ViewLocation: Near Santa Fe, Santa Fe CountyAspect: South Facing Photo Date: August 1995Cover Description: Pition and Juniper with Bunch GrassHydrologic Condition: Poor HSG: B Percent Cover: 30Soil Series: Pojoaque Soil Description: Gravely SandEstimated Runoff Curve Number: 75
Photo No. 1B, Ground View
DECEMBER 1995
NMSHTD DRAINAGE MANUAL PAGE NUMBER A-3

Photo No. 2A, General ViewLocation: Northwest Albuquerque, Bernalillo CountyAspect: East Facing Photo Date: June, 1995Cover Description: Sagebrush, Saltbush, Weeds, Bunch GrassesHydrologic Condition: Fair HSG: A Percent Cover: 40%Soil Series: Bluepoint Soil Description: SandyEstimated Runoff Curve Number: 65
Photo No. 2B, Ground View
DECEMBER 1995
NMSHTD DRAINAGE MANUAL PAGE NUMBER A-4

Photo No. 3A, General ViewLocation: Near Hondo, Lincoln CountyAspect: South Facing Photo Date: June, 1995Cover Description: Juniper and Bunch GrassesHydrologic Condition: Fair HSG: D Percent Cover: 40%Soil Series: Deama Soil Description: Rocky
Estimated Runoff Curve Number: 80
Photo No. 3B, Ground View
DECEMBER 1995
NMSHTD DRAINAGE MANUAL
PAGE NUMBER A-5

Photo No. 4A, General ViewLocation: Near Radium Springs, Doila Ana CountyAspect: Gently Sloping West Photo Date: June, 1995Cover Description: Desert Brush, Yucca, Cactus, Bunch GrassesHydrologic Condition: Fair HSG: A Percent Cover: 30%Soil Series: Bluepoint Soil Description: Sandy LoamEstimated Runoff Curve Number: 60
Photo No, 4B, Ground View
DECEMBER 1995
NMSHTD DRAINAGE MANUAL PAGE NUMBER A-6

Photo No. 5A, General ViewLocation: West of San Marcial, Socorro CountyAspect: Southeast Sloping Photo Date: June, 1995Cover Description: Desert Shrub, MesquiteHydrologic Condition: Poor HSG: C Percent Cover: 10%Soil Series: Nickel Soil Description: GravelyEstimated Runoff Curve Number: 85
Photo No. 5B, Ground View
DECEMBER 1995
NMSHTD DRAINAGE MANUAL PAGE NUMBER A-7
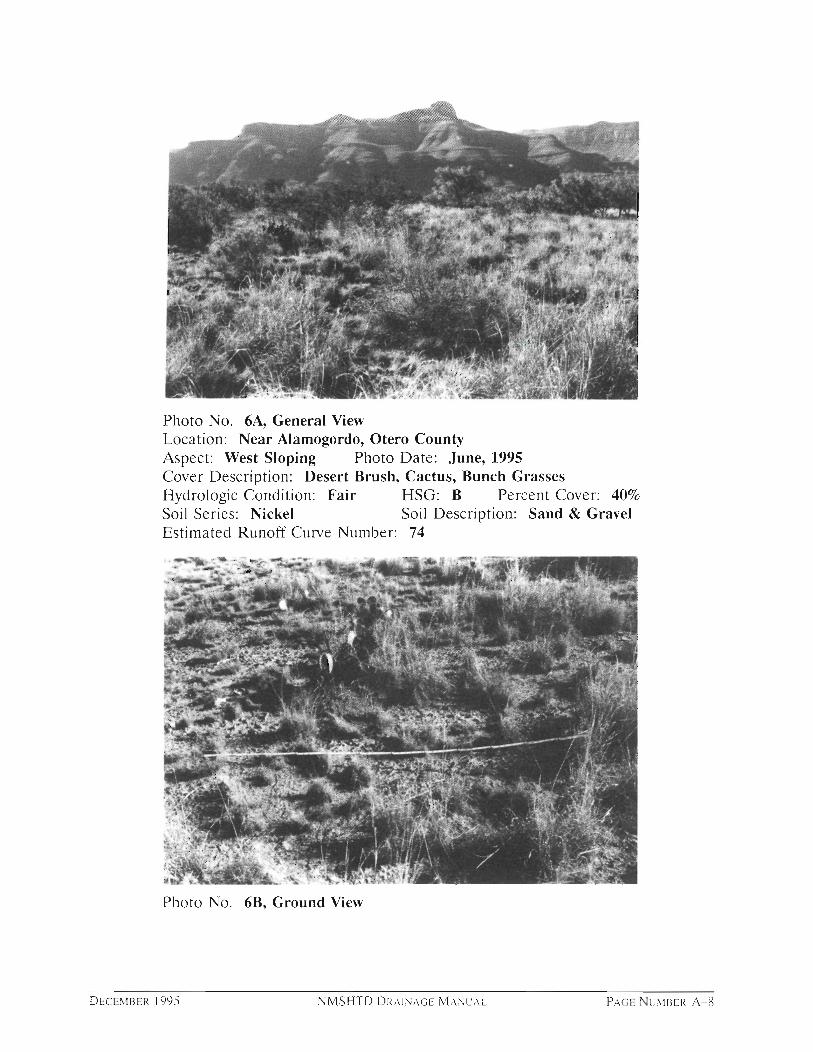
Photo No. 6A, General ViewLocation: Near Alamogordo, Otero CountyAspect: West Sloping Photo Date: June, 1995Cover Description: Desert Brush, Cactus, Bunch GrassesHydrologic Condition: Fair HSG: B Percent Cover: 40%Soil Series: Nickel Soil Description: Sand & GravelEstimated Runoff Curve Number: 74
Photo No. 6B, Ground View
DECEMBER 1995
NMSHTD DRAINAGE MANUAL PAGE NUMBER A-8

Photo No. 7A, General ViewLocation: South of Taos, Taos CountyAspect: West Sloping Photo Date: August 1995Cover Description: Sagebrush and PinonHydrologic Condition: Fair HSG: C Percent Cover: 50%Soil Series: not available Soil Description: Sandy ClayEstimated Runoff Curve Number: 67
Photo No. 7B, Ground View
DECEMBER 1995
NMSHTD DRAINAGE MANUAL PAGE NUMBER A-9

Photo No. 8A, General ViewLocation: North of Taos, Taos CountyAspect: Level Photo Date: August 1995Cover Description: Sagebrush and Bunch GrassesHydrologic Condition: Fair HSG: C Percent Cover: 60%Soil Series: not available Soil Description: Silty ClayEstimated Runoff Curve Number: 63
Photo No. 8B, Ground View
DECEMBER 1995
NMSHTD DRAINAGE MANUAL PAGE NUMBER A-I

Photo No. 9A, General ViewLocation: South of Espanola, Rio Arriba CountyAspect: West Facing Photo Date: August 1995Cover Description: RangelandHydrologic Condition: Poor HSG: A Percent Cover: 20%Soil Series: not available Soil Description: Silty SandEstimated Runoff Curve Number: 78
Photo No. 9B, Ground View
DECEMBER 1995
NMSHTD DRAINAGE MANUAL PAGE NUMBER A-11

Photo No. 10A, General ViewLocation: North Central Mountains Near Taos, Taos CountyAspect: South Sloping Photo Date: August 1995Cover Description: Pine ForestHydrologic Condition: Good HSG: C Percent Cover: 70%Soil Series: not available Soil Description: Thin Gravely TopsoilEstimated Runoff Curve Number: 70
Photo No. 10B, Ground View
DECEMBER 1995
NMSHTD DRAINAGE MANUAL PAGE NUMBER A-12

Photo No. 11A, General ViewLocation: Near Cloudcroft, Otero CountyAspect: West Facing Photo Date: June, 1995Cover Description: Pine Forest with Partial Brush UnderstoryHydrologic Condition: Good HSG: D Percent Cover: 80%Soil Series: Not Mapped Soil Description: RockyEstimated Runoff Curve Number: 77
Photo No. 11B, Ground View
DECEMBER 1995
NMSHTD DRAINAGE MANUAL PAGE NUMBER A-I3

Photo No. 12Location: North of Ragland, Quay CountyAspect: West Facing Photo Date: June, 1995Cover Description: Juniper, Shrubs and Grasses, RangelandHydrologic Condition: Fair HSG: B Percent Cover: 60%Soil Series: Quay Loam Soil Description: Silty LoamEstimated Runoff Curve Number: 72
Photo No. 13Location: Near Grady, Curry CountyAspect: Level Photo Date: June, 1995Cover Description: Grassed Rangeland, Heavily GrazedHydrologic Condition: Fair HSG: C Percent Cover: 75%Soil Series: Potter Soil Description: Clay LoamEstimated Runoff Curve Number: 79
DECEMBER 1995
NMSHTD DRAINAGE MANUAL PAGE NUMBER A-14

Photo No. 14Location: South of Broadview, Curry CountyAspect: Nearly Level Photo Date: June, 1995Cover Description: Mixed Prairie Grass, Some WeedsHydrologic Condition: Good HSG: C Percent Cover: 100%Soil Series: Potter Soil Description: Clay LoamEstimated Runoff Curve Number: 71
Photo No. 15Location: North of Clovis, Curry CountyAspect: Nearly Level Photo Date: June, 1995Cover Description: Dense Prairie GrassHydrologic Condition: Good HSG: C Percent Cover: 100%Soil Series: Potter Soil Description: Clay LoamEstimated Runoff Curve Number: 66
DECEMBER 1995
NMSHTD DRAINAGE MANUAL PAGE NUMBER A-15

Photo No. 16Location: North of Clovis, Curry CountyAspect: Nearly Level Photo Date: June, 1995Cover Description: Agricultural, Tilled, Bare SoilHydrologic Condition: Poor HSG: B Percent Cover: 0%Soil Series: Amarillo Soil Description: Clayey LoamEstimated Runoff Curve Number: 85
Photo No. 17Location: Near Doria Ana, Dona Ana CountyAspect: Nearly Level Photo Date: June, 1995Cover Description: Row Crops, Young ChiliHydrologic Condition: Poor HSG: B Percent Cover: 10%Soil Series: Harkey Soil Description: Silty LoamEstimated Runoff Curve Number: 79
DECEMBER 1995 NMSHTD DRAINAGE MANUAL
PAGE NUMBER A-16

Photo No. 18Location: North of Clovis, Curry CountyAspect: Nearly Level Photo Date: June, 1995Cover Description: Row Crop, Young CornHydrologic Condition: Fair HSG: B Percent Cover: 30%Soil Series: Amarillo Soil Description: Clayey LoamEstimated Runoff Curve Number: 78
DECEMBER 1995
NMSHTD DRAINAGE MANUAL PAGE NUMBER A-17

APPENDIX B GLOSSARY OF TERMS
DECEMBER 1995
NMSHTD DRAINAGE MANUAL PAGE NUMBER B-1

GLOSSARY
Absorption
Abstraction
Accretion
The act or process of taking in water by inflow of atmospheric vapor,hygroscopic absorption, wetting, infiltration, influent seepage, and gravity flowof streams into sinkholes or other large openings.
That portion of rainfall which does not become runoff. It includes interception,infiltration, and storage in depression. It is affected by land use, land treatmentand condition, and antecedent soil moisture.
0 A process of accumulation by flowing water whether of silt, sand, pebbles,etc. Accretion may be due to any cause and includes alluviation. CD Thegradual building up of a beach by wave action. 0 The gradual building of thechannel bottom, bank, or bar due to silting or wave action.
Acre—Foot The amount of water that will cover 1 acre to a depth of 1 foot. It equals43,560 cubic feet. Abbreviated ac—ft.
Aggradation General and progressive upbuilding of the longitudinal profile of a channel bydeposition of sediment.
The depth or elevation of impounded water at the entrance to a hydraulicstructure, above which flooding or some other unfavorable result could occur.
A channel wholly in alluvium with no bedrock exposed in the channel at lowflow or likely to be exposed by erosion during major flow.
Unconsolidated clay, silt, sand, or gravel deposited by a stream in a channel,flood plain, delta, alluvial fan, or pediment.
AllowableHeadwater
AlluvialChannel
Alluvium
Annual Flood The highest peak discharge in a water year.
Annual
A frequency series in which only the largest value in each year is used, such asSeries annual floods.
Annual Yield The total amount of water obtained in a year from a stream, spring, artesianwell, etc. Usually expressed in inches depth, acre—feet, millions of gallons, orcubic feet.
Antecedent The amount of moisture in the soil and plants at the beginning of the storm.
Moisture Antecedent moisture conditions affect the volume of runoff generated by a
Condition particular storm event. As storm magnitudes increase, antecedent moisture has(AMC) a rapidly decreasing influence on runoff because the soils become saturated.
PAGE NUMBER B-2
NMSHTD DRAINAGE MANUAL DECEMBER 1995

Area Rainfall The average rainfall over an area, usually as derived from, or discussed incontrast with point rainfall.
Bank
Base Flow
Lateral boundaries of a channel or stream, as indicated by a scarp, or on theinside of bends, by the streamward edge of permanent vegetal growth.
Stream discharge derived from groundwater sources. Sometimes considered toinclude flows from regulated lakes or reservoirs. Fluctuates much less thanstorm runoff.
The area of land drained by a watercourse.
The amount of time from the centroid of the rainfall hyetograph to thehydrograph peak.
The part of a channel without permanent vegetation, bounded by banks, overwhich water normally flows.
A narrow shelf or ledge; also a form of dike.
A structure including supports erected over a depression or an obstruction, suchas a watercourse, highway, or railway, and having a tract or passageway forcarrying traffic or moving loads. A bridge has an opening measured along thecenter of the roadway of more than 20 feet between undercopings of abutmentsor spring lines of arches, or extreme ends of openings for multiple boxes. Abridge may also include multiple pipes, where the clear distance betweenopenings is less than half of the smaller contiguous opening. A bridge isdesigned hydraulically using the principles of open channel flow to operatewith a free water surface, but may be inundated under flood conditions.
The cross—sectional area beneath a bridge that is available for conveyance ofwater.
A measure of the ability of a channel or conduit to convey water.
A structure with a sump for inletting drainage from a gutter or median anddischarging the water through a conduit. In common usage it is a grated inletwith or without a sump.
The watershed. (Implying all physical characteristics.)
The area tributary to a lake, stream, or drainage system.
Basin,Drainage
Basin Lag
Bed (of achannel orstream)
Berm
Bridge
BridgeOpening
Capacity
Catch Basin
Catchment
CatchmentArea
DECEMBER 1995
NMSHTD DRAINAGE MANUAL PAGE NUMBER B-3

CFS Abbreviation for cubic feet per second. A unit of water flow. Sometimescalled "second feet."
CMS
Abbreviation for cubic meters per second. A unit of water flow.
Channel
ControlSection
O The bed and banks that confine the surface flow of a natural or artificialstream. Braided streams have multiple subordinate channels which are withinthe main stream channel. Anabranched streams have more than one channel.0 The course where a stream of water runs, or the closed course or conduitthrough which water runs, such as a pipe.
The process whereby a peak flow and/or its associated streamflow hydrographis mathematically transposed to another site downstream.
A low structure, dam or weir, across a channel for the control of water stage orvelocity, or to control channel erosion.
A cross section, such as a bridge crossing, reach of channel, or dam, withlimited flow capacity, in which the discharge is related to the upstreamwater—surface elevation.
ChannelRouting
Check Dam
Conveyance A measure, K, of the ability of a stream, channel, or conduit to convey water.In Manning's formula, K = (1.49/n)Ale3.
Cover
CrossSection
Culvert
The depth of soil above the crown of a pipe or culvert. The vegetation, orvegetational debris such as mulch that exists on the soil surface. The percentof ground cover and cover types are fundamental parameters for determiningrunoff curve numbers.
A standard, rule, or test on which a judgement can be based.
The runoff from contributing drainage areas both inside and outside thehighway right—of—way and the transmission thereof from the upstream side ofthe highway facility to the downstream side.
The shape of a channel, stream, or valley, viewed across its axis. In watershedinvestigations it is determined by a line approximately perpendicular to themain path of water flow, along which measurements of distance and elevationare taken to define the cross—sectional area.
A structure which is sometimes designed hydraulically to take advantage ofsubmergence to increase hydraulic capacity. A structure used to conveysurface runoff through embankments. A structure, as distinguished frombridges, which is usually covered with embankment and is composed ofstructural material around the entire perimeter, although some are supported onspread footings with the streambed serving as the bottom of the culvert. Also,
Criterion
CrossDrainage
PAGE NUMBER B-4
NMSHTD DRAINAGE MANUAL DECEMBER 1995

a structure which is 20 feet or less in centerline length between extreme endsof openings for multiple boxes.
Debris Material transported by the stream, either floating or submerged, such as logsor brush.
Degradation General and progressive lowering of the longitudinal profile of a channel byerosion.
Deposition The setting of material from the stream flow onto the bottom.
Depression The natural depressions within a watershed that store runoff. Generally afterStorage the depression storage is filled runoff will commence.
Design The rate of flow for which a facility is designed.Discharge orFlow
Design Flood A flood that does not overtop the roadway.
Design Flood The recurrence interval that is expected to be accommodated withoutFrequency contravention of the adopted design constraints. The return interval (recurrence
interval or reciprocal of probability) used as a basis for the design discharge.
Design Storm A given rainfall amount, areal distribution, and time distribution, used toestimate runoff. The rainfall amount is either a given frequency (25—year,50—year, etc.) or a specific large value.
DirectRunoff
Discharge
DrainageArea
A basin or reservoir incorporated into the watershed whereby runoff istemporarily stored, thus attenuating the peak of the runoff hydrograph.
A temporary change in the roadway alignment. It may be localized at astructure or may be along an alternate route.
The water that enters the stream channels during a storm or soon after, forminga runoff hydrograph. May consist of rainfall on the stream surface, surfacerunoff, and seepage of infiltrated water (rapid subsurface flow).
The rate of the volume of flow of a stream per unit of time, usually expressedin cfs.
The area draining into a stream at a given point. The area may be of differentsizes for surface runoff, subsurface flow, and base flow, but generally thesurface flow area is used as the drainage area.
DetentionBasin
Detour
DECEMBER 1995
NMSHTD DRAINAGE MANUAL PAGE NUMBER B-5

Drainage A conduit for conveying storm water away from or under a roadway. Often a
Structure closed conduit such as a culvert, but could also be a bridge.
The time in a storm during which the water supply for direct runoff isproduced. Also used to mean the duration of excess rainfall.
A stream or reach of a stream that does not flow continuously for most of theyear.
The wearing away or scouring of material in a channel, opening, or outletworks caused by flowing water.
Plant transpiration plus evaporation from the soil. Difficult to determineseparately, therefore used as a unit for study.
Direct runoff.
The process by which stormwater leaks or flows to the surrounding soilthrough openings in a conduit.
EffectiveDuration
EphemeralStream
Erosion
Evapotrans-piration
ExcessRainfall
Exfiltration
Flood In common usage, an event that overflows the normal banks. In technicalusage, it refers to a given discharge based, typically, on a statistical analysis ofan annual series of events.
FloodRouting
The average time interval, in years, in which a given storm or amount of waterin a stream will be exceeded.
Reference to the maximum estimated or measured discharge that has occurredat a site.
The alluvial land bordering a stream, formed by stream processes, that issubject to inundation by floods.
Determining the changes in a flood hydrograph as it moves downstreamthrough a channel or through a reservoir (called reservoir routing). Graphic ornumerical methods are used.
FloodFrequency
Flood ofRecord
Floodplain
Flow The estimated or measured spatial distribution of the total streamflow.Distribution
Freeboard
The vertical distance between the level of the water surface, usuallycorresponding to design flow and a point of interest such as a low chord of abridge beam or specific location on the roadway grade.
PAGE NUMBER B-6
NMSHTD DRAINAGE MANUAL DECEMBER 1995

Frequency
Groundwater
In analysis of hydrologic data, the recurrence interval is simply calledfrequency.
Subsurface water occupying the saturation zone, from which wells and springsare fed. A source of base flow in streams. In a strict sense the term appliesonly to water below the water table. Also called phreatic water.
Guide Banks Embankments built upstream from one or both abutments of a bridge to guidethe approaching flow through the waterway opening.
Gutter
Headwater
HighwaterElevation
That portion of the roadway section adjacent to the curb which is utilized toconvey storm runoff water.
That depth of water impounded upstream of a culvert due to the influence ofthe culvert constriction, friction, and configuration.
The water surface elevation that results from the passage of flow. It may be"observed highwater elevation" as a result of an event, or "calculated highwaterelevation" as part of a design process.
A past flood event of known or estimated magnitude.
A profile of the piezometric level to which the water would rise in piezometertubes along a pipe run. In open channel flow, it is the water surface.
A graph showing, for a given point on a stream or for a given point in anydrainage system, the discharge, stage, velocity or other property of water withrespect to time.
A combination of a hydrologic soil group and a type of cover.
A group of soils having the same runoff potential under similar storm andcover conditions.
HistoricalFlood
HydraulicGrade Line
Hydrograph
HydrologicSoil—CoverComplex
HydrologicSoil Group
Hydrology The study of the occurrence, circulation, distribution, and properties of thewaters of the earth and its atmosphere.
Hyetograph A graphical representation of average rainfall, rainfall—excess rates or volumesover specified areas during successive units of time during a storm.
Impervious Impermeable to the movement of water.
DECEMBER 1995
NMSHTD DRAINAGE MANUAL PAGE NUMBER B-7

Infiltration That part of the rainfall that enters the soil. The passage of water through the
soil surface into the ground. Used interchangeably herein with the word:percolation.
Land Use
Length
Levee
MajorStructure
Manning's
The rate at which water enters the soil under a given condition. The rate isusually expressed in inches or centimeters per hour, or feet per day.
When considering surface runoff, Ia is all the rainfall before runoff begins.When considering direct runoff, Ia consists of interception, evaporation, andthe soil—water storage that must be exhausted before direct runoff may begin.Sometimes called "initial loss."
The rate of rainfall upon a watershed, usually expressed in inches per hour.
Precipitation retained on plant or plant residue surfaces and finally absorbed,evaporated, or sublimated. That which flows down the plant to the ground iscalled "stemflow" and not counted as true interception.
A line on a map, connecting points of equal rainfall amounts.
The difference in time between the centroid of the excess rainfall (that rainfallproducing runoff) and the peak of the runoff hydrograph. Often estimated as60 percent of the time of concentration (T L = 0.6Te).
A land classification. Cover, such as row crops or pasture, indicates a kind ofland use. Roads may also be classified as a separate land use.
A certain distance within a watershed or along a water course. For Time ofConcentration computation, length is defined as the distance from the drainagedivide to the point of interest, following primary flow paths.
A linear embankment outside a channel for containment of flow.
A drainage conduit which is larger than a minor structure, yet smaller than abridge.
A coefficient of roughness, used in a formula for estimating the capacity of achannel to convey water. Generally, "n" values are determined by inspectionof the channel.
A graph showing the total cumulative volume of stormwater runoff plottedagainst time for a given drainage area.
A drainage conduit which is equal to or greater than a 48" (1.6 M) circularpipe culvert, or equivalent hydraulic capacity.
InfiltrationRate
InitialAbstraction(Ia)
Intensity
Interception
Isohyet
Lag Time, TL
Mass InflowCurve
MinorStructure
PAGE NUMBER B-8
NMSHTD DRAINAGE MANUAL DECEMBER 1995

Partial—DurationSeries
Runoff which makes its way to the watershed outlet without concentrating ingullies and streams (often in the form of sheet flow).
Runoff from within the highway right-of-way, including pavement, medians,and road shoulders. Runoff may be collected by gutters, catch basins, swales,and rundowns.
A list of all events, such as floods, occurring above a selected base, withoutregard to the number, within a given period. In the case of floods, the selectedbase is usually equal to the smallest annual flood, in order to include at leastone flood in each year.
Maximum discharge rate on a runoff hydrograph.
The property of a material that permits appreciable movement of war through itwhen it is saturated and movement is actuated by hydrostatic pressure of themagnitude normally encountered in natural subsurface water.
A stream or reach of a stream that flows continuously for all or most of theyear.
Rainfall at a single rain gage or location.
The process by which water in liquid or solid state falls from the atmosphere.
The water available to runoff after interception, depression storage, andinfiltration have been satisfied.
Amount of rainfall occurring in a unit of time, converted to its equivalent ininches per hour at the same rate.
A graphical plot relating stage to discharge.
The receding portion of a hydrograph, occurring after excess rainfall hasstopped.
A basin excavated in the earth to receive the discharge from streams or stormdrains for the purpose of replenishing groundwater supply.
A regional study of gaged watersheds which produces regression equationsrelating various watershed and climatological parameters to discharge. Use fordesign of ungaged watershed with similar characteristics.
OverlandFlow
OnsiteDrainage
PeakDischarge
Permeability
PerennialStream
PointRainfall
Precipitation
RainfallExcess
RainfallIntensity
Rating Curve
RecessionCurve
RechargeBasin
RegionalAnalysis
DECEMBER 1995
NMSHTD DRAINAGE MANUAL PAGE NUMBER B-9

RegulatoryFlood
RegulatoryFloodway
ReservoirRouting
RetentionBasin
Runoff
RunoffCoefficient
Rural
SaturatedSoil
Sediment-ation
Skewness
Soil Porosity
Soil—Water-Storage
Stage
Usually the 100—year flood, which was adopted by the Federal EmergencyManagement Agency (FEMA), as the base flood for floodplain managementpurposes.
The floodplain area that is reserved in an open manner by Federal, State, orlocal requirements, i.e., unconfined or unobstructed either horizontally orvertically, to provide for the discharge of the base flood so that the cumulativeincrease in water surface elevation is no more than a designated amount.
Flood routing of a hydrograph through a reservoir.
A basin or reservoir wherein water is stored for regulating a flood. It does nothave an uncontrolled outlet. The stored water is disposed by a means such asinfiltration, injection (or dry) wells, or by release to the downstream drainagesystem after the storm event. The release may be through a gate—controlledgravity system or by pumping.
That part of the precipitation which runs off the surface of a drainage area afterall abstractions are accounted for.
A factor representing the portion of runoff resulting from a unit rainfall.Dependent on terrain and topography.
Where the majority of the watershed area is agricultural or lightly used byhuman activity.
Soil that has its interstices or void spaces filled with water to the point atwhich runoff occurs.
The process involving the deposition of soil particles which have been carriedby flood waters.
When data are plotted in a curve on log—normal paper, the curvature isskewness.
The percentage of the soil (or rock) volume that is not occupied by solidparticles, including all pore space filled with air and water.
The amount of water the soils (including geologic formations) of a watershedwill store at a given time. Amounts vary from watershed to watershed. Theamount for a given watershed is continually varying as rainfall orevapotranspiration takes place.
Height of water surface above a specified datum.
PAGE NUMBER B-10
NMSHTD DRAINAGE MANUAL DECEMBER 1995

StormDuration
StreamChannel
StreamReach
SurfaceRunoff
SurfaceStorage
SurfaceWater
The period or length of storm.
The bottom of a topographic area, where runoff collects and flows in aconcentrated manner. May be ephemeral or perennial.
A length of stream channel selected for use in hydraulic or other computations.
Total rainfall minus interception, evaporation, infiltration, and surface storagewhich moves across the ground surface to a stream or depression.
Stormwater that is contained in surface depressions or basins.
Water appearing on the surface in a diffused state, with no permanent source ofsupply or regular course, as distinguished from water appearing in watercourses, lakes, or ponds.
Synthetic A hydrograph determined from empirical rules. Usually based on the physicalHydrograph characteristics of the basin. A graph developed for an ungaged drainage area,
based on known physical characteristics of the watershed basin.
A slight depression in the ground surface where water collects.
The time it takes surface runoff water to travel from the hydraulically mostdistant point to the watershed outlet. T c varies with flood frequency, but isoften used as a watershed constant.
Low embankments constructed to guide flows toward a drainage structureopening, often with erosion control revetments.
The average time for water to flow through a reach or other stream or valleylength.
Branches of the watershed stream system.
Locations at which no systematic records are available regarding actualstreamflows.
Flow of constant cross section and average velocity through a reach of channelduring an interval of time.
A hydrograph of a direct runoff resulting from 1 unit of effective rainfall (inch,centimeter) generated uniformly over the watershed area during a specifiedperiod of time or duration.
Swale
Time ofConcentra-tion, Tc.
TrainerDikes
Travel Time
Tributaries
UngagedStream Sites
UniformFlow
UnitHydrograph
DECEMBER 1995 NMSHTD DRAINAGE MANUAL
PAGE NUMBER B-11

Urban
A development condition within a watershed where large, contiguous areashave a significant quantity of impervious surfaces constructed by man. Runofffrom an urban area is typically concentrated in roads or defined drainagechannels.
Watercourse A channel in which a flow of water occurs, either continuously orintermittently, with some degree of regularity.
Watershed The catchment area for rainfall which is delineated as the drainage areaproducing runoff. Usually it is assumed that base flow in a stream also comesfrom the same area.
Water Table The upper surface of the zone of saturation, except where that surface isformed by an impermeable body (perched water table).
PAGE NUMBER B-12
NMSHTD DRAINAGE MANUAL DECEMBER 1995

APPENDIX C METRIC EQUATIONS AND CONVERSIONFACTORS
DECEMBER 1995
NMSHTD DRAINAGE MANUAL PAGE NUMBER C-1

TABLE C-1
METRIC - U.S. STANDARD CONVERSION FACTORS
From Multiply
by
To obtain
Unit Abbrev. Unit Abbrev.
cubic foot per second cfs 0.02832 cubic meter per second m3/s
foot ft 0.3048 meter m
foot squared ft2 0.0929 meter squared m2
foot cubed ft3 0.0283 meter cubed m3
foot per mile ft/mi 0.189 meter per kilometer m/km
inch in 25.4 millimeter mm
square mile •mil 2.59 square kilometer km2
acre ac 0.4047 hectare ha
foot per second fps 0.3048 meter per second m/s
acre—feet ac—ft 1232.748 meters cubed m3
PAGE NUMBER C-2
NMSHTD DRAINAGE MANUAL DECEMBER 1995

"2 yr, 6-hr2
-r -P = 5 537 + 0.709
P2-yr, 24-hr
(3-1M)
2-yr, 1- hr
P100 yr 1- hr = 12.548 + 0.755-,
2P2-yr, 6-hr
P2-yr, 24-hr
(3-4M)
METRIC EQUATIONS
NOAA Rainfall Depth Duration Frequency Equations
Note: Precipitation depths obtained from the NOAA Atlas (or from APPENDIX E) must beconverted to millimeters for use of these equations.
In Region 1
p 2
P100 yr, 1- hr = 48.184 + 0.439
100-yr, 6-hr 0.00667 Z- P100-yr, 24-hr
where Z is the average project elevation, in meters.
In Region 2p, 2
P = —0.279 + 0.942 2-yr, 6-hr
2-yr, 1- hrP2-yr, 24-hr
(3-2M)
(3-3M)
P 0.770 P2- 1-hr + 0 . 230 (3-5M)5-yr, 1-hr yr, 230 P100-yr 1-hr
Pi 0 _yr, 1 _ hr = 0.609 P2 _,,r, 1-th. + 0.391 Ploo _ig, 1-hr (3-6M)
P = 0.425 P2+ 0.575 P (3-7M)25-yr, 1- hr -yr 1- hr 100-yr, 1-hr
PSO _yr, 1 _ hr = 0.241 P
2-yr, 1-hr + 0.759 P100 -yr, 1-hr (3-8M)
P2-hr = 0.658 P1-hr + 0.342 P6 -hr(3-9M)
In Region 1
P3._ hi. = 0.401 p_ hr + 0.599 /16-hr (3-10M)
DECEMBER 1995
NMSHTD DRAINAGE MANUAL PAGE NUMBER C-3
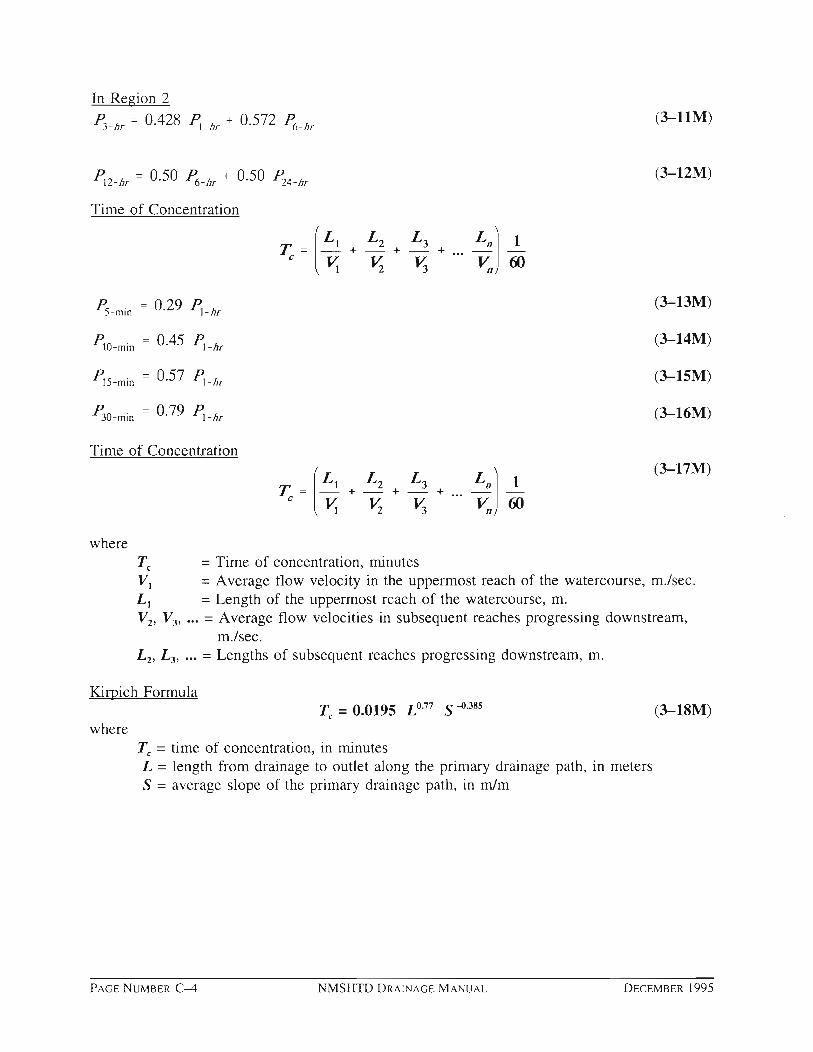
In Region 2 P3 _ hr = 0.428 Pi _hr + 0.572 P6 _ hr
P12- hr 0.50 P6-hr + 0•50 P24- hr
(3-11M)
(3-12M)
Time of Concentration
La\
L1 + L2 + L3 1
vi v2 v3 v 60171
Tc
P5-min = 0.29 P1-hr
P10-min = 0.45 P1-hr
P15-min = 0.57 P1-hr
P30-min = 0.79 P1-hr
Time of Concentration
Li L2 L3 Ln] 1 + + +VI v2 v3 v. 60
(3-13M)
(3-14M)
(3-15M)
(3-16M)
(3-17M)
Tc
whereT, = Time of concentration, minutesVI= Average flow velocity in the uppermost reach of the watercourse, m./sec.L 1 = Length of the uppermost reach of the watercourse, m.V2 , V3 , ... = Average flow velocities in subsequent reaches progressing downstream,
m./sec.L2 , L3 , ... = Lengths of subsequent reaches progressing downstream, m.
Kirpich FormulaTc = 0.0195 L° 77 S -0.385 (3-18M)
whereTc = time of concentration, in minutesL = length from drainage to outlet along the primary drainage path, in metersS = average slope of the primary drainage path, in m/m
PAGE NUMBER C-4
NMSHTD DRAINAGE MANUAL DECEMBER 1995

Manning's Equation1003
R2' S1I2
(3-19M)
II
whereV = average velocity in the channel, m./sec.n= Manning's roughness coefficientR = hydraulic radius of the flow, m.S = average channel slope, m./m.
Rational FormulaQ = 0.0028 C i A (3-20M)
whereQ= the peak rate of runoff, in m3/sC = a dimensionless runoff coefficienti = the rainfall intensity, in millimeters/hour
A= the watershed area, in hectares
E C • A.Weighted C-
A
whereCi = C value for one part of the watershedA. = area, A, in hectares for the corresponding part of the watershed
Unit Peak Discharge Equation
[1 log (T) + 0.31— log (Tc) — 0.3t5
qu = 0.0015 K-o.812 10
wherequ = unit peak discharge from the watershed, m3/s/ha-mm
= time of concentration, in hours
(3-21M)
(3-22M)
DECEMBER 1995
NMSHTD DRAINAGE MANUAL PAGE NUMBER C-5

Runoff Depth Equation
[P2A — (5,080/CN) + 50.81 2d
P2A + (20,320/ CN) — 203.2
whereQd = average runoff depth for the entire watershed, in millimeters
P24 = 24—hour rainfall depth, in millimeters
Peak Rate of Runoff Equation
(3-23M)
QP = A • Qd • qu (3-24M)where
Qp = peak discharge, in m3/sA = drainage area, in hectares
Runoff Volume EquationQ, = 10 • Qd • A
whereQ, = runoff volume from the watershed, in m3
USGS Regional Regression Equations
(3-25M)
A drainage area, in hectaresE mean basin elevation, in meters above sea levelE, average of channel elevations at 10% and 85% of stream length upstream from the
gaging station (use structure location instead of gaging station for NMSHTDprojects), in meters
P24,10 maximum precipitation depths, in millimeters (24—hour storm, 10—year recurrenceinterval). Precipitation depths can be found in APPENDIX E, conversion from inchesto millimeters is necessary.
PAGE NUMBER C-6
NMSHTD DRAINAGE MANUAL DECEMBER 1995

Average Standard Errorof Prediction
Region 1 Log UnitsNortheast Plains
Q2 = 0.170 • 21°- 53 0.346
Q5 = 0.540 • A°.5° 0.301
Q 10 = 0.945 • A° 490.288
Q25 = 1.68 • Ao.48 0.284
Q50 = 2.32 • A0.48 0.285
Q 100 =3.113.11 • Ao480.291
Q500 = 5.51 • A°A80.312
Region 2Northwest Plateau
Q2 = 0.176 • A047 0.390
Q5 = 0.433 • Ao.46 0.311
Q 10 = 0.672 • A0 46 0.282
Q25 = 1.13 • Ac1.45 0.262
Q50 = 1.52 • A° .45 0.255
Q 100 = 1.98 • A° 450.254
Q500 = 3.37 • A°.45 0.265
Table C-2
USGS Rural Flood Frequency Equations for New Mexico
Metric Version
(3-26M)
(3-27M)
(3-28M)
(3-29M)
(3-30M)
(3-31M)
(3-32M)
(3-33M)
(3-34M)
(3-35M)
(3-36M)
(3-37M)
(3-38M)
(3-39M)
DECEMBER 1995
NMSHTD DRAINAGE MANUAL PAGE NUMBER C-7

Table C-2
USGS Rural Flood Frequency Equations for New Mexico
Metric Version
(3-40M)
(3-41M)
(3-42M)
(3-43M)
(3-44M)
(3-45M)
(3-46M)
(3-47M)
(3-48M)
(3-49M)
(3-50M)
(3-51M)
(3-52M)
(3-53M)
Average Standard Errorof Prediction
Region 3Southeast Mountain
02 = 7.25
1.73
010 = 24.3
025 = 28.9 • ("5
Q50 = 31.1 • A°.78
Q100 =31.9•Aosl
0500 = 30.9 • A°.87
E -7.10
1,000)
E )-7.16
1,000 )
E -7.19•
1,000)
E •1,000 )
Log Units
0.150
0.163
0.169
0.178
0.187
0.199
0.236
A°.6°
A(167
A°.7°
•
•
•
E )-5.96
-6.94
1,000)
E r6.69
1,000)
E
1,000)
Region 4Southeast Plains
Q2 = 0.136 • A° 510.538
Q5 = 0.332 • A° 54 0.424
Q 10 = 0.542 • A° 55 0.374
Q25 = 0.860 • A° 57 0.326
Q50 = 1.17 • A° 58 0.300
Q 100 = 1.53 • A° 590.282
Q500 = 2.46 • A° 62 0.262
PAGE NUMBER C-8
NMSHTD D RAINAGE M ANUAL
DECEMBER 1995

/ E6.3 x10 -3 A "3 •
)-2.22 p 0.3124,25
0.3431,000
8.47 x 10 -3 A ° .81 •E )-3.01 p
24,250.63 0.309
1,000 )
8.72 x 10⁻³ A 0.81 • E
( 1,000)• p
24,250.81 0.297
8.45 x10⁻³ A 0.80 • E p24,25
1.03 0.2941,000 )
7.78 x 10⁻³ A 0.80 E -4. 1 3 p24,25
1.18 0.298( 1,000 )
6.76 x10⁻³ A 0.80 •E -4.40)
•
)
p24,25
1.33 0.306( 1,000
-4.95E5.07 x 10-3 • A o so • • p
24,251.64 0.337
1,000
02 =
=
010 =
025 =
qo =
0500 =
Table C-2
USGS Rural Flood Frequency Equations for New Mexico
Metric Version
(3-54M)
(3-55M)
(3-56M)
(3-57M)
(3-58M)
(3-59M)
(3-60M)
Average Standard Errorof Prediction
Region 5
Log UnitsNorthern Mountain
DECEMBER 1995
NMSHTD DRAINAGE MANUAL PAGE NUMBER C-9

Table C-2
USGS Rural Flood Frequency Equations for New Mexico
Metric Version
(3-61M)
(3-62M)
(3-63M)
(3-64M)
(3-65M)
(3-66M)
(3-67M)
Average Standard Errorof Prediction
Region 6Central Mountain—Valley
Log Units
0.366
0.274
0.231
0.193
0.180
0.173
0.185
A0.50(1,000EC —5 .28p 1.18
24,10
4.°9A 0.46 • Ec • P 2.0621,000 24,10
A 0.44 Ec )
24,10p 2.37
1,000 )
—338A 0.43 • Ec • p 2.571,000 24,10
Ec 11°9A 0.42 • ( • p 2.74
(1,000)24,10
A 0.40 • Ec -2.45 • p 3.03
1,000 24,10
Q10 = 3.33 x 10⁻³
025 = 1.31 x 10⁻³
Q50 = 7.01 x 10⁻⁴
0100 = 4.13 x 10-4
= 1.65 x 10⁻⁴
Q2 = 5.45 x 10-2
= 8.68 x 10 -3 • A ° 47 •Ec )4.49 • p 1.76
1,000) 24,10
PAGE NUMBER C-10
NMSHTD DRAINAGE MANUAL DECEMBER 1995

Table C-2
USGS Rural Flood Frequency Equations for New Mexico
Metric Version
Region 7Southwest Desert
Q2 = 0.281 • AO 46
Q5 = 0.484 • A°"
Average Standard Errorof Prediction
Log Units
0.229
0.211
Q 10 = 0.642 • A° 49 0.212
Q25 = 0.864 • A° 5° 0.220
Q50 = 1.02 • A0' 51 0.231
Q 100 = 1.18 • A0.52 0.244
Q500 = 1.49 • A° 55 0.279
Region 8Southwest Mountain
02 = 181 • A 13.19 • Ec )4.10
Average Standard Errorof Prediction
Log Units
0.3481,000 )
05 = 165 A 11123 •Ec)-5'" 0.332
1,000 )
0io =153•Ao.25• Ec -5. 19
0.3211,000 )
025 = 138 A (127 •Ec 4.80
)0.331
1,000
050 = 123 A°.29 • Ec 4.520.344
1,000)
0100 = 117 A°3° • Ec \-4.250.359
1,000,
0500 100 • A o.32 • Ec 3.680.401
1,000)
(3-68M)
(3-69M)
(3-70M)
(3-71M)
(3-72M)
(3-73M)
(3-74M)
(3-75M)
(3-76M)
(3-77M)
(3-78M)
(3-79M)
(3-80M)
(3-81M)
DECEMBER 1995
NMSHTD DRAINAGE MANUAL
PAGE NUMBER C-1 1

Table C-3
USGS Small Rural Basin Flood Frequency Equations for New Mexico
Metric Version
State Wide Application
Q2 = 0.347 • A° 39
Q5 = 0.667 • A'
Average Standard Errorof Prediction
Log Units
0.413
0.326
Q l o = 0.971 • A° 43 0.292
Q25 1.45 • A° 44 0.266
Q50 = 1.84 • A° 45 0.255
Q 100 = 2.26 • A O 46 0.248
Qsoo = 3.60 • A° 47 0.247
Note: These equations were developed for drainage basins less than10 sq. mi. and less than 7500 ft. mean basin elevation. See Section 3.2of this manual for limitations on the use of these equations.
(3-82M)
(3-83M)
(3-84M)
(3-85M)
(3-86M)
(3-87M)
(3-88M)
PAGE NUMBER C- 12
NMSHTD DRAINAGE MANUAL DECEMBER 1995

Three Parameter Estimating Equations
Coefficient ofDetermination (R2)
(13 — BDF) -.43 • 1=?Q73 .91
(13 — BDF)-.39 • R0578 .92
(13 — BDF) -36 • R01079 .92
(13 — BDF) -34 • RQ8° .92
.91(13 — BDF)-32 • RO01
(13 — BDF)-32 • R0.0802 .91
.82 .89(13 — BDF) -3° • RQ500
UO2 = 13.2 • A .21 •
UQ5 = 10.6 • A 17 •
U010 = 9.51 • A '6
UQ25 = 8.68 • A .15
U050 = 8.04 • A 15
U0100 = 7.70 • A .15
Woo = 7.47 • A .16
Table C-4
USGS Urban Peak Discharge
Metric Version
(3-89M)
(3-90M)
(3-91M)
(3-92M)
(3-93M)
(3-94M)
(3-95M)
DECEMBER 1995
NMSHTD DRAINAGE MANUAL PAGE NUMBER C-13

Unit Hydrograph EquationsKp A
4P- T
whereqp = the unit hydrograph peak discharge, in m3/sA = basin area, in hectaresTp = the time to peak of the hydrograph, in hoursKp = an empirical constant
(3-96M)
Note: IS, is an empirically derived constant which varies from (0.0328) in very flat swampyareas to (0.0656) in steep terrain. An average value of Kp = 0.0529 is used unlessotherwise indicated, and approved by the NMSHTD Drainage Section.
and
(3-97M)T —D + TP 2 L
D = 0.133 T, (3-98M)
whereTp = time to peak of the hydrograph, in hoursD = duration of excess rainfall, in hoursTL = basin lag time, time from the centroid of excess rainfall, in hoursTe = time of concentration, in hours
TL = 0.6 T, (3-99M)
Tp = 0.67 T, (3-100M)
Qv = 10 • A • Qd (3-101M)where
Qv = runoff volume, in m3Qd = average depth of runoff, in millimetersA = watershed area, in hectares
The weighted flood frequency estimate is given by the equation:
Op,/ = 0 pg
1 AuA
n g,
x (3-102M)
whereQp.= weighted peak discharge at the ungaged site, in m3/sQpg = peak discharge at the gaged site, in m3/sA u = drainage area at the ungaged site, in hectaresA g = drainage area at the gaged site, in hectaresx = exponent of the drainage area term used in the appropriate equation from Table C-2.
PAGE NUMBER C-14
NMSHTD DRAINAGE MANUAL DECEMBER 1995

where
1\niR = 1 — 1 — — (100)
(3-103M)
R = the risk of the design discharge being exceeded at least once during the designlife, in percent
T1 = the recurrence interval or frequency of the design flood, in yearsm = the design life of the structure, in years
1 (3-104M)1
1 — ( 1 R )°'100
DECEMBER 1995
NMSHTD DRAINAGE MANUAL PAGE NUMBER C-15

APPENDIX D TEXT REFERENCES AND OTHER SELECTEDREFERENCES
DECEMBER 1995
NMSHTD DRAINAGE MANUAL PAGE NUMBER D-1

Akan, A. Osman, Ph.D., P.E. and Paine, John N., P.E., Computer—Aided Hydrology &Hydraulics User's Manual, SCSHYDRO program Copyright (c) 1993, AKAN PAINE,INCORPORATED, All Rights Reserved, September, 1993.
Albuquerque Metropolitan Arroyo Flood Control Authority, AHYMO Computer ProgramUsers Manual, AMAFCA's Version of the A.R.S. HYMO Computer Program, March, 1992.
American Association of State Highway and Transportation Officials, Model DrainageManual, 1991.
Chow, V. T., Maidment, D. R., and Mays, L. W., Applied Hydrology, McGraw—Hill, NewYork: 1988.
City of Albuquerque, New Mexico, Section 22.2, Hydrology of the Development ProcessManual, January, 1993.
Heggen, Richard J., Comparison of NOAA—SCS Rainfall Distribution with SCS Type II—aRainfall Distributions for New Mexico, unpublished, 1995.
Holnbeck, Stephen R. and Parrett, Charles, Estimation of Unit Hydrographs for Large Floodsat Ungaged Sites in Montana, U.S. Geological Survey Open—File Report 93-168, 1993.
Hydrology Subcommittee for the Interagency Advisory Committee on Water Data, Guidelinesfor Determining Flood Flow Frequency, Hydrology Subcommittee Bulletin 17B, 28 p. andappendices, 1982.
Maidment, David R., Editor in Chief, Handbook of Hydrology, McGraw—Hill, Inc.: 1992.
Miller, J. F., Frederick, R. H., and Tracey, R. J., Precipitation—Frequency Atlas of theWestern United States, Volume IV—New Mexico, National Oceanic and AtmosphericAdministration NOAA Atlas 2, 43 p., 1973.
NBS/Lowry Engineers & Planners, Inc. and George V. Sabol Consulting Engineers, Inc.,Highway Drainage Design Manual, Hydrology, Arizona Department of Transportation, March,1993.
Sauer, V. B., Thomas, Jr., W. 0., Stricker, V. A., and Wilson, K. V., Flood Characteristics ofUrban Watersheds in the United States, in cooperation with U.S. Department ofTransportation Federal Highway Administration, U.S. Geological Survey Water—Supply Paper2207, 1983.
Soil Conservation Service, National Engineering Handbook, Section 4, Hydrology, Chapter19, Transmission Losses, 1983.
Soil Conservation Service, National Engineering Handbook, Section 4, Hydrology,Washington, D.C.: 1985.
PAGE NUMBER D-2
NMSHTD DRAINAGE MANUAL DECEMBER 1995

Soil Conservation Service, Peak Rates of Discharge for Small Watersheds, Chapter 2,Engineering Field Manual for Conservation Practices, revised by Luther McDougal, andCalvin Jackson, 1973, updated by Larry Goertz, 1985.
Soil Conservation Service, Urban Hydrology for Small Watersheds, Technical Release 55,Washington, D.C.: June 1986.
Task Force on Hydrology and Hydraulics, AASHTO Highway Subcommittee on Design,Highway Drainage Guidelines, Guidelines for II — Hydrology, 1987.
Thomas, R. P., and Gold, R. L., Techniques for Estimating Flood Discharges for UnregulatedStreams in New Mexico, U.S. Geological Survey Water—Resources Investigations 82-24, 42p., 1982.
U. S. Geological Survey, Guidelines for Determining Flood Flow Frequency, Bulletin #17B,March, 1982.
U.S. Army Corps of Engineers, HEC-1, Flood Hydrograph Package, Users Manual,Hydrologic Engineering Center, 1981.
U.S. Army Corps of Engineers, Hydrologic Frequency Analysis, EM 1110-2-1415, 1993.
U.S. Department of Transportation, Federal Highway Administration, Hydrology, HydraulicEngineering Circular No. 19, October, 1984.
Viessman, Warren Jr., John W. Knapp, Gary L. Lewis, and Terence E. Harbaugh,Introduction to Hydrology, Second Edition, 1977.
Von Eschen, G. F., Climates of the States, New Mexico, U.S. Department of CommerceClimatography of the United States 60-29, 15 p., 1959.
Waltemeyer, Scott D., Analysis of the Magnitude and Frequency of Peak Discharge,Maximum Peak Discharge, and Peak Discharge Gaging Network in New Mexico, U.S.Geological Survey Water—Resources Investigations Report 95—XXXX, in cooperation with theNew Mexico State Highway and Transportation Department, planned for 1995 publication.
Waltemeyer, Scott D., Techniques for Estimating Flood—Flow Frequency for UnregulatedStreams in New Mexico, U.S. Geological Survey Water—Resources Investigations Report86 1104, in cooperation with New Mexico State Highway and Transportation Department,1986.
DECEMBER 1995
NMSHTD DRAINAGE MANUAL PAGE NUMBER D-3

APPENDIX E NOAA ISOPLUVIAL MAPS FOR NEW MEXICO
DECEMBER 1995
NMSHTD DRAINAGE MANUAL PAGE NUMBER E-1