appendices - yearbook.gov.hk · heung yee kuk the hon kenneth lau ip-keung, bbs, mh, jp import and...
TRANSCRIPT
337
Appendices
1 The Executive Council 340
2 The Legislative Council 342
3 The District Councils 344
4 Overseas Representation in Hong Kong 351
5 Hong Kong Representation 352
6 Statistical Tables and Charts 355
Table 1 (a) Gross Domestic Product (GDP) 355 (b) GDP by Expenditure Component 355 (c) GDP by Economic Activity at Current Prices 356 (d) Chain Volume Measures of GDP by Economic Activity 357
Table 2 Gross National Income (GNI) 358
Table 3 Balance of Payments (BoP) 359
Table 4 Year-on-year Rates of Change in Consumer Price Indices 360
Table 5 Business Receipts Indices 361
Table 6 Total Government Revenue and Expenditure and 362 Summary of Financial Position
Table 7 Public Expenditure by Policy Area Group 366
Table 8 Government Expenditure and the Economy 368
Table 9 Deposits, Loans and Advances of Authorised Institutions 369
Table 10 (a) Exchange Rates 370 (b) Effective Exchange Rate Index 370
Table 11 Money Supply 371
Table 12 Exchange Fund Abridged Balance Sheet 372
Table 13 Merchandise Trade by Main Country or Territory 373
Table 14 Exports and Imports of Services by Service Component 374
Table 15 (a) Position and Flow of Inward Direct Investment by Selected 375 Major Investor Country/Territory (b) Position and Flow of Outward Direct Investment by Selected 375 Major Recipient Country/Territory

338
Appendices
Table 16 (a) Regional Headquarters in Hong Kong by Country/Territory where 376 Parent Company was Located (b) Regional Offices in Hong Kong by Country/Territory where 376 Parent Company was Located (c) Local Offices in Hong Kong by Country/Territory where Parent 377 Company was Located
Table 17 Labour Force, Labour Force Participation Rate, Unemployment and 378 Underemployment
Table 18 Number of Establishments and Persons Engaged (other than those 379 in Civil Service) by Industry, and Number of Construction Sites and Manual Workers at Construction Sites
Table 19 Wage Indices for Employees up to Supervisory Level (Excluding 380 Managerial and Professional Employees) by Industry
Table 20 Employed Persons by Monthly Employment Earnings 381
Table 21 (a) Educational and Training Institutions by Level of Education 382 of Courses Offered (b) Student Enrolment by Level of Education 382
Table 22 Distribution of Educational Attainment of Population Aged 383 15 and Over
Table 23 Government Expenditure on Education 383
Table 24 Population and Vital Events 384
Table 25 Registered Deaths and Death Rate by Leading Cause of Death 384
Table 26 Hospital Beds and Selected Types of Registered Healthcare 385 Professionals
Table 27 Social Security 386
Table 28 (a) Stock of Permanent Living Quarters as at Mid-2017 387 (b) Estimated Population by Type of Housing as at Mid-2017 387
Table 29 Land Usage Distribution as at End-2017 388
Table 30 Property Transactions 389
Table 31 Water Consumption 389
Table 32 (a) Inward and Outward Movements of Aircraft and Vessels 390 (b) Inward and Outward Movements of Cargo 390 (c) Port Container Throughput 391 (d) Arrivals and Departures of Passengers by Mode of Transport 391
Table 33 (a) Motor Vehicles Licensed by Type 392 (b) Public Transport: Average Daily Passenger Journeys by 392 Different Modes of Transport
Table 34 (a) Electricity Consumption 393 (b) Gas (Towngas) Consumption 393 (c) Local Sales of Liquefied Petroleum Gas (LPG) 393

339
Appendices
Table 35 Meteorological Observations 394
Table 36 Environmental Statistics 394
Table 37 Traffic Accidents by Area 395
Table 38 (a) Reported Crimes by Type of Offence 396 (b) Persons Arrested for Crime by Type of Offence 396 (c) ICAC Cases 396
Table 39 Access to Information and Communication Technology 397
Table 40 (a) Penetration of Information Technology into Households 398 (b) Usage of Information Technology among Household Members 398
Table 41 Postal Services 398
Table 42 Visitor Arrivals by Country/Region of Residence 399
Chart 1 Major Sources of Revenue (2016-17) 365
Chart 2 Public Expenditure by Policy Area Group 367
Notes:
(1) Figures presented in Appendix 6 refer to those released up to the end of March 2018. Current statistical information on Hong Kong is available in the 'Hong Kong Statistics' section of the Census and Statistics Department’s website (www.censtatd.gov.hk). The section is updated regularly and also provides hyperlinks to relevant government websites to facilitate searches of other official statistics of Hong Kong.
(2) There may be a slight discrepancy between the sum of individual items and the total as shown in the tables due to rounding.

Appendices
340
1
Appendix 1(Chapter 1: Constitution and Administration)
The Executive CouncilMembership on 31 December 2017
Presided over by the Chief Executive the Honourable Mrs Carrie LAM CHENG Yuet-ngor, GBM, GBS
Members (in order of the HKSAR Precedence List)The Chief Secretary for Administration The Honourable Matthew CHEUNG Kin-chung, GBM, GBS, JP
The Financial Secretary The Honourable Paul CHAN Mo-po, GBM, GBS, MH, JP
The Secretary for Justice The Honourable Rimsky YUEN Kwok-keung, GBM, SC, JP
The Convenor of the Non-official Members of the Executive Council The Honourable Bernard Charnwut CHAN, GBS, JP
Member of the Executive Council The Honourable Mrs Laura CHA SHIH May-lung, GBM, GBS, JP
Member of the Executive Council Professor the Honourable Arthur LI Kwok-cheung, GBM, GBS, JP
Member of the Executive Council The Honourable CHOW Chung-kong, GBS, JP
Member of the Executive Council The Honourable Mrs Fanny LAW FAN Chiu-fun, GBM, GBS, JP
Secretary for the Environment The Honourable WONG Kam-sing, GBS, JP
Member of the Executive Council The Honourable Jeffrey LAM Kin-fung, GBS, JP
Secretary for Innovation and Technology The Honourable Nicholas W. YANG, GBS, JP
Secretary for Home Affairs The Honourable LAU Kong-wah, JP
Member of the Executive Council The Honourable IP Kwok-him, GBM, GBS, JP
Member of the Executive Council The Honourable Tommy CHEUNG Yu-yan, GBS, JP
Member of the Executive Council The Honourable Martin LIAO Cheung-kong, SBS, JP
Member of the Executive Council The Honourable Joseph YAM Chi-kwong, GBM, GBS, JP
Secretary for Financial Services and the Treasury The Honourable James Henry LAU Jr, JP
Appendices
341
1
Member of the Executive Council The Honourable Mrs Regina IP LAU Suk-yee, GBS, JP
Member of the Executive Council The Honourable Ronny TONG Ka-wah, SC
Member of the Executive Council The Honourable WONG Kwok-kin, SBS, JP
Secretary for Labour and Welfare Dr the Honourable LAW Chi-kwong, GBS, JP
Secretary for the Civil Service The Honourable Joshua LAW Chi-kong, GBS, JP
Secretary for Security The Honourable John LEE Ka-chiu, SBS, PDSM, JP
Secretary for Transport and Housing The Honourable Frank CHAN Fan, JP
Secretary for Food and Health Professor the Honourable Sophia CHAN Siu-chee, JP
Secretary for Commerce and Economic Development The Honourable Edward YAU Tang-wah, GBS, JP
Member of the Executive Council Dr the Honourable LAM Ching-choi, BBS, JP
Secretary for Development The Honourable Michael WONG Wai-lun, JP
Secretary for Education The Honourable Kevin YEUNG Yun-hung, JP
Secretary for Constitutional and Mainland Affairs The Honourable Patrick NIP Tak-kuen, JP
Member of the Executive Council The Honourable Kenneth LAU Ip-keung, BBS, MH, JP
Member of the Executive Council The Honourable CHEUNG Kwok-kwan, JP
Appendices
342
2
Appendix 2(Chapter 1: Constitution and Administration)
The Legislative CouncilMembership on 31 December 2017
PresidentThe Hon Andrew LEUNG Kwan-yuen, GBS, JP (Industrial – first)
MembersFunctional Constituencies
Accountancy The Hon Kenneth LEUNGAgriculture and Fisheries The Hon Steven HO Chun-yin, BBSCatering The Hon Tommy CHEUNG Yu-yan, GBS, JPCommercial – first The Hon Jeffrey LAM Kin-fung, GBS, JPCommercial – second The Hon Martin LIAO Cheung-kong, SBS, JPDistrict Council – first The Hon LAU Kwok-fan, MHDistrict Council – second The Hon Holden CHOW Ho-dingDistrict Council – second The Hon KWONG Chun-yuDistrict Council – second The Hon Starry LEE Wai-king, SBS, JPDistrict Council – second The Hon LEUNG Yiu-chungDistrict Council – second The Hon James TO Kun-sunEducation The Hon IP Kin-yuenEngineering Ir Dr the Hon LO Wai-kwok, SBS, MH, JPFinance The Hon CHAN Chun-yingFinancial Services The Hon Christopher CHEUNG Wah-fung, SBS, JPHealth Services Prof the Hon Joseph LEE Kok-long, SBS, JPHeung Yee Kuk The Hon Kenneth LAU Ip-keung, BBS, MH, JPImport and Export The Hon WONG Ting-kwong, GBS, JPIndustrial – second The Hon Jimmy NG Wing-ka, JPInformation Technology The Hon Charles Peter MOK, JPInsurance The Hon CHAN Kin-por, GBS, JPLabour The Hon HO Kai-mingLabour The Hon LUK Chung-hungLabour The Hon POON Siu-ping, BBS, MHLegal The Hon Dennis KWOK Wing-hangMedical Dr the Hon Pierre CHANReal Estate and Construction The Hon Abraham SHEK Lai-him, GBS, JPSocial Welfare The Hon SHIU Ka-chunSports, Performing Arts, Culture The Hon MA Fung-kwok, SBS, JP
and Publication Textiles and Garment The Hon CHUNG Kwok-pan

Appendices
343
2
Tourism The Hon YIU Si-wing, BBSTransport The Hon Frankie YICK Chi-ming, SBS, JPWholesale and Retail The Hon SHIU Ka-fai
Geographical Constituencies
Hong Kong Island The Hon Tanya CHANHong Kong Island The Hon CHEUNG Kwok-kwan, JPHong Kong Island The Hon HUI Chi-fungHong Kong Island The Hon Mrs Regina IP LAU Suk-yee, GBS, JPHong Kong Island The Hon KWOK Wai-keung, JPKowloon East The Hon Wilson OR Chong-shing, MHKowloon East The Hon Jeremy TAM Man-hoKowloon East The Hon Paul TSE Wai-chun, JPKowloon East The Hon WONG Kwok-kin, SBS, JPKowloon East The Hon WU Chi-wai, MHKowloon West Dr the Hon CHIANG Lai-wan, JPKowloon West Dr the Hon Priscilla LEUNG Mei-fun, SBS, JPKowloon West The Hon Claudia MOKowloon West Dr the Hon Helena WONG Pik-wanNew Territories East The Hon CHAN Chi-chuenNew Territories East The Hon CHAN Hak-kan, BBS, JPNew Territories East Dr the Hon Fernando CHEUNG Chiu-hungNew Territories East The Hon LAM Cheuk-tingNew Territories East Dr the Hon Elizabeth QUAT, BBS, JPNew Territories East The Hon Alvin YEUNGNew Territories East The Hon YUNG Hoi-yanNew Territories West The Hon CHAN Han-pan, JPNew Territories West Dr the Hon CHENG Chung-taiNew Territories West The Hon CHU Hoi-dickNew Territories West Dr the Hon Junius HO Kwan-yiu, JPNew Territories West Dr the Hon KWOK Ka-kiNew Territories West The Hon LEUNG Che-cheung, SBS, MH, JPNew Territories West The Hon Alice MAK Mei-kuen, BBS, JPNew Territories West The Hon Michael TIEN Puk-sun, BBS, JPNew Territories West The Hon Andrew WAN Siu-kin

Appendices
344
3
Appendix 3(Chapter 1: Constitution and Administration)
The District CouncilsMembership on 31 December 2017
Urban Areas
Central & Western District CouncilChairmanMr YIP Wing-shing, BBS, MH, JP (Elected member)
Vice-ChairmanMr CHAN Hok-fung, MH, JP (Elected member)
Elected MembersMr Stephen CHAN Chit-kwai, BBS, JPMr CHAN Choi-hi, MHMr Joseph CHAN Ho-lim (up to 14 August 2017)Ms CHENG Lai-kingThe Hon CHEUNG Kwok-kwan, JPThe Hon HUI Chi-fungMr KAM Nai-wai, MHMr Sidney LEE Chi-hang, MHMiss LO Yee-hang, MHMs Bonnie NG Hoi-yan (since 27 November 2017)Mr NG Siu-hongMs SIU Ka-yi (up to 31 August 2017)Mr YEUNG Hoi-wingMr YEUNG Hok-mingMr Jeremy YOUNG Chit-on (since 27 November 2017)
Eastern District CouncilChairmanMr WONG Kin-pan, BBS, MH, JP (Elected member)
Vice-ChairmanMr CHIU Chi-keung, BBS (Elected member)
Elected MembersMr CHENG Chi-singMr CHENG Tat-hungMr Howard CHEUNG Kwok-cheongDr Andrew CHIU Ka-yinMs CHOY So-yuk, BBS, JPMr CHUI Chi-kin
Mr Stanley HO Ngai-kamMr HUI Ching-onMr HUI Lam-hingMr HUNG Lin-chamMr KU Kwai-yiuMr KUNG Pak-cheung, MHThe Hon Aron KWOK Wai-keung, JPMr Joseph LAI Chi-keongMs Alice LAM Chui-lin, MH (up to 17 December 2017)Mr George LAM Kei-tungMr LAM Sum-limMr LAU Hing-yeungMr LEE Chun-keungMr David LEUNG Kwok-hungMr Patrick LEUNG Siu-sunMs Bonnie LEUNG Wing-manMs LI Chun-chauMr Frankie LO Wing-kwan, MHMr MAK Tak-chingMr NGAN Chun-lim, MHThe Hon SHIU Ka-faiMr Eddie TING Kong-hoMr Dominic WONG Chi-chungMr Patrick WONG Chun-singMr WONG Kin-hingMr WONG Kwok-hing, BBS, MHMr YEUNG Sze-chun
Kowloon City District CouncilChairmanMr PUN Kwok-wah, JP (Elected member)
Vice-ChairmanMr CHO Wui-hung (Elected member)
Elected MembersIr Dr CHENG Lee-mingIr CHEUNG Yan-hong, MHMr HE HuahanMr HO Hin-ming, BBS, MHMr KWAN Ho-yeungMiss KWONG Po-yin
Appendices
345
3
Mr LAI Kwong-waiMr Jimmy LAM PokMr LAM Tak-shingThe Hon Starry LEE Wai-king, SBS, JPDr the Hon Priscilla LEUNG Mei-fun, SBS, JPMiss LEUNG Yuen-tingMr LO Chiu-kitMr LUK King-kwongMr NG Fan-kamMr NG Po-keungMr SIU Leong-singMr Terence SIU Tin-hungMr TING Kin-waMr YANG Wing-kitMr YEUNG Chun-yuMr Admond YUE Chee-wing
Kwun Tong District CouncilChairmanDr Bunny CHAN Chung-bun, GBS, JP (Elected member)
Vice-ChairmanMr Kin HUNG Kam-in, MH (Elected member)
Elected MembersMr AU YEUNG Kwan-nokMr Sheik Anthony BUXMr CHAN Chun-kitMr Ben CHAN Kok-wah, BBS, MHMr CHAN Man-kinMr Nelson CHAN Wah-yu, MH, JPMr Jimmy CHAN Yiu-hungMr CHENG Keng-ieongMr CHENG Keung-fungMr CHEUNG Ki-tangMr CHEUNG Pui-kongMr CHEUNG Shun-wah, MHMr CHEUNG Yiu-panMr CHOY Chak-hungMs FU Pik-chunThe Hon Jonathan HO Kai-mingMr HSU Hoi-shanMs KAM KinMr KAN Ming-tungMr Patrick LAI Shu-ho, BBS, MH, JPMr LUI Tung-haiMr Marco MA Yat-chiuMr MOK Kin-shingMr NGAN Man-yuThe Hon Wilson OR Chong-shing, MHMrs Winnie POON YAM Wai-chun, MH
Mr Kevin SO Koon-chungMs SO Lai-chun, MH, JPMr TAM Siu-cheukMr TANG Wing-chunMs TSE Suk-chunMr WONG Chi-kenMr WONG Chun-pingMr YIP Hing-kwok, MH, JPMr Perry YIU Pak-leung, MH
Sham Shui Po District CouncilChairmanMr Ambrose CHEUNG Wing-sum, BBS, MH, JP (Elected member)
Vice-ChairmanMr CHAN Wai-ming, MH, JP (Elected member)
Elected MembersMr CHAN Kwok-waiMs Joephy CHAN Wing-yanMr Vincent CHENG Wing-shun, MHMs Zoé CHOW Wing-hengMr CHUM Tak-shingMr Kalvin HO Kai-mingMr KONG Kwai-sangMr LAM Ka-fai, BBS, JPMs LAU Pui-yukMr Dominic LEE Tsz-kingMr LEE Wing-manMr LEUNG Man-kwongMr LEUNG Yau-fongMs Carman NG MeiMs NG Yuet-lanMr TAM Kwok-kiu, MH, JPMr WAI Woon-namMr Dennis WONG Tat-tung, MH, JPMr YAN Kai-wingMr YEUNG YukMr YUEN Hoi-man
Southern District CouncilChairmanDr CHU Ching-hong, JP (Elected member)
Vice-ChairmanMr CHAN Fu-ming, MH (Elected member)
Elected MembersMr AU Lap-sing, MH

Appendices
346
3
Mr AU Nok-hinMr CHAI Man-honMs Judy CHAN KapuiMrs CHAN LEE Pui-yingMs CHEUNG Sik-yung, MHMr CHU Lap-waiMr Fergus FUNG Se-gounMr LAM Kai-fai, MHMs LAM Yuk-chun, MHMr LO Kin-heiDr Ada MAK TSE How-ling, MHMr TSUI Yuen-waMs Pauline YAMMr Paulus Johannes ZIMMERMAN
Wan Chai District CouncilChairmanMr Stephen NG Kam-chun, BBS, MH, JP (Elected member)
Vice-ChairmanDr Jennifer CHOW Kit-bing, BBS, MH (Elected member)
Elected MembersMr CHENG Ki-kinMs Jacqueline CHUNG Ka-manMr Anson LAM Wai-man WindMs Kenny LEE Kwun-yee, MHMr Joey LEE Man-lungMs Peggy LEE Pik-yeeMs Yolanda NG Yuen-ting, MHDr Anna TANG King-yung, BBS, MHThe Hon Paul TSE Wai-chun, JPMr Ivan WONG Wang-tai, MHMiss Clarisse YEUNG Suet-ying
Wong Tai Sin District CouncilChairmanMr LI Tak-hong, BBS, MH, JP (Elected member)
Vice-ChairmanMr Joe LAI Wing-ho, MH (Elected member)
Elected MembersMs Maggie CHAN Man-ki, MH, JPMr CHAN On-taiMr Andie CHAN Wai-kwan, MHMr Joe CHAN Yim-kwongMr Leonard CHAN YingMr Timothy CHOY Tsz-kin
Mr HO Hon-man, MHMr HUI Kam-shingMr KAN Chi-ho, BBS, MH, JPMs KWOK Sau-yingMr LAM Man-fai, JPMr LEE Tung-kongMs Wendy LUI Kai-linMr MOK Kin-wing, MHMr SHUM Wan-waMr SZE Tak-loyMs TAM Heung-manMs TAM Mei-poMr Roy TING Chi-waiMr WONG Yat-yukMr WU Chi-kinThe Hon WU Chi-wai, MHMr YUEN Kwok-keung, MH
Yau Tsim Mong District CouncilChairmanMr Chris IP Ngo-tung, JP (Elected member)
Vice-ChairmanMs WONG Shu-ming, MH (Elected member)
Elected MembersMr CHAN Siu-tong, MH, JPMr Benjamin CHOI Siu-fungMr Francis CHONG Wing-charn, MHMr CHOW Chun-fai, BBS, JPMr CHUNG Chak-faiMr CHUNG Kong-mo, BBS, JPMr HUI Tak-leungMr Derek HUNG Chiu-wahMr Craig JO Chun-wahMs KWAN Sau-lingMr LAM Kin-manMr LAU Pak-keiMs Michelle TANG Ming-sumThe Hon James TO Kun-sunMr WONG Kin-sanMr Benny YEUNG Tsz-hei, MHMr Andy YU Tak-po
New Territories
Islands District CouncilChairmanMr CHOW Yuk-tong, SBS, MH (Ex-officio member)

Appendices
347
3
Vice-ChairmanMr Randy YU Hon-kwan, MH, JP (Elected member)
Elected MembersThe Hon Holden CHOW Ho-dingMs Sammi FU Hiu-lamMr Eric KWOK PingMr KWONG Koon-wanMs LEE Kwai-chun, MHMr Bill TANG Ka-piu, JPMs Josephine TSANG Sau-hoMs YU Lai-fan, MHMs Amy YUNG Wing-sheung
Ex-Officio MembersMr CHAN Lin-wai, MHMr CHEUNG Fu, MHMr FAN Chi-pingMr LOU Cheuk-wing, MHMr Ken WONG Hon-kuenMr WONG Man-honMr YUNG Chi-ming, BBS, MH
Kwai Tsing District CouncilChairmanMr LAW King-shing, BBS, MH (Elected member)
Vice-ChairmanMr CHOW Yick-hay, BBS, JP (Elected member)
Elected MembersMr Simon CHAN Siu-manMs Clarice CHEUNG Wai-chingMr Rayman CHOW Wai-hungMiss CHU Lai-lingMr HUI Kei-cheungMs KWOK Fu-yungMs Nancy LAM Chui-ling, MHMr LAM Siu-faiMs LAU Mei-loMr Alan LEE Chi-keung, MHMr LEUNG Chi-shingMr LEUNG Kam-waiMr Dennis LEUNG Tsz-wingMr LEUNG Wai-man, MHThe Hon LEUNG Yiu-chungMr LI Sai-lungMiss LO Yuen-tingThe Hon Alice MAK Mei-kuen, BBS, JPMr NG Ka-chiuMr NG Kim-sing
Mr PAU Ming-hongMr POON Chi-shing, MHMs TAM Wai-chun, MHMr TSUI Hiu-kitMr WONG Bing-kuenMr WONG Yiu-chung, MHMr WONG Yun-tat
Ex-Officio MemberMr TANG Shui-wah, MH
North District CouncilChairmanMr SO Sai-chi, SBS, MH (Elected member)
Vice-ChairmanMr LI Kwok-fung (Ex-officio member)
Elected MembersMr CHAN Yuk-mingMr CHAN Wai-tatMr Simon HAU Fuk-tatDr Raymond HO Shu-kwongThe Hon LAM Cheuk-tingMr LARM Wai-leungMr LAU Ki-fungThe Hon LAU Kwok-fan, MHMr LIU Hing-hungIr George PANG Chun-sing, MHMr Tony TANG Kun-nin, MHMr TSANG Hing-lungMr Kent TSANG King-chungMr Warwick WAN Wo-tatMr WAN Wo-fai, MHMr WONG Wang-to, MHMr YIU Ming
Ex-Officio MembersMr CHAN Shung-faiMr HAU Chi-keungMr LEE Koon-hung
Sai Kung District CouncilChairmanMr George NG Sze-fuk, GBS, JP (Elected member)
Vice-ChairmanMr SING Hon-keung, BBS, MH (Ex-officio member)

Appendices
348
3
Elected MembersMr Alfred AU Ning-fat, MHMr CHAN Kai-waiMr Jonathan CHAN Pok-chiMr Francis CHAU Yin-ming, BBS, MHMr Edwin CHEUNG Chin-pangMr CHEUNG Mei-hungMr CHONG Yuen-tungMr CHUNG Kam-lunMr Gary FAN Kwok-waiMs Christine FONG Kwok-shanMr HIEW Moo-siewMr Raymond HO Man-kitMr KAN Siu-keiMr LAI Ming-chakMr Frankie LAM Siu-chungMr Peter LAU Wai-cheung, MHMr LEUNG LiMr Philip LI Ka-leungMr LING Man-hoi, BBS, MHMr LUI Man-kwongMr LUK Ping-choiMr Stanley TAM Lanny, MHMr TSE Ching-fungMr WAN Kai-mingMr WAN Yuet-cheung, BBS, MH, JPMr YAU Yuk-lun
Ex-Officio MemberMr WONG Shui-sang
Sha Tin District CouncilChairmanMr HO Hau-cheung, SBS, MH (Elected member)
Vice-ChairmanMr Thomas PANG Cheung-wai, SBS, JP (Elected member)
Elected MembersMr Billy CHAN Shiu-yeungMr James CHAN Kwok-keungMs CHAN Man-kuenMr CHAN Nok-hangMr CHENG Tsuk-manMr CHING Cheung-ying, MHMr Sunny CHIU Chu-pongMr CHIU Man-leongMr Rick HUI Yui-yuMr LAI Tsz-yanMs LAM Chung-yanMr Alvin LEE Chi-wing
Mr Victor LEUNG Ka-faiMr LI Sai-hungMr LI Sai-wingMr Wilson LI Wing-shingMr MAK Yun-puiMr NG Kam-hungMs Scarlett PONG Oi-lan, BBS, JPMr PUN Kwok-shan, MHMr SIU Hin-hongMr TING Tsz-yuenMr TONG Hok-leungMs TSANG So-laiMs TUNG Kin-leiMr WAI Hing-cheungMr Tiger WONG Fu-sangMr WONG Hok-laiMr WONG Ka-wing, MHMs Iris WONG Ping-fanMr WONG Yue-honMr YAU Man-chunMr YIP WingMr YIU Ka-chunMs YUE Shin-manMr Michael YUNG Ming-chau
Ex-Officio MemberMr MOK Kam-kwai, BBS
Tai Po District CouncilChairmanMr CHEUNG Hok-ming, GBS, JP (Ex-officio member)
Vice-ChairmanMs WONG Pik-kiu, BBS, MH, JP (Elected member)
Elected MembersMr AU Chun-wahMr CHAN Cho-leung, MHMr CHAN Siu-kuen, MH, JPMr CHENG Chun-ping, JPMr CHENG Chun-woMr CHOW Yuen-waiMr KWAN Wing-yipDr LAU Chee-singMr LAU Yung-waiMr LI Kwok-ying, BBS, MH, JPMr Rex LI Wah-kwongMr LO Hiu-fungMr Eric TAM Wing-fun, MHMr Patrick TANG Ming-taiMr Clement WOO Kin-man
Appendices
349
3
Mr YAM Kai-bongMr YAM Man-chuenMr YU Chi-wing
Ex-Officio MemberMr LI Yiu-ban, BBS, MH, JP
Tsuen Wan District CouncilChairmanMr CHUNG Wai-ping, SBS, MH (Ex-officio member)
Vice-ChairmanMr WONG Wai-kit (Elected member)
Elected MembersMr Jones CHAN Chun-chungThe Hon Ben CHAN Han-pan, JPMr Sumly CHAN Yuen-sumMr CHENG Chit-punMr CHOW Ping-timMr KOO Yeung-pong, MHMr KOT Siu-yuenMr LAM Faat-kang, MHMs LAM, Lam NixieMs LAM Yuen-punMr LI Hung-porMr LO Siu-kit, MHMr MAN Yu-ming, MHMr NG Hin-lungMr TAM Hoi-pongThe Hon Michael TIEN Puk-sun, BBS, JPMr WONG Ka-wa
Ex-Officio MemberMr CHAN Sung-ip, MH
Tuen Mun District CouncilChairmanMr LEUNG Kin-man, BBS, MH, JP (Elected member)
Vice-ChairmanMr Lothar LEE Hung-sham, BBS, MH (Elected member)
Elected MembersMr AU Chi-yuenMr CHAN Man-wah, MHMr Leo CHAN ManwellMr CHAN Yau-hoi, BBS, MH, JPMr CHEUNG Hang-faiMs CHING Chi-hung
Ms Beatrice CHU Shun-ngaMr CHU Yiu-wahMs HO Hang-muiThe Hon HO Kwan-yiu, JPMr KAM Man-fungMs KONG Fung-yiMr KWU Hon-keungMr LAM Chung-hoiMs LUNG Shui-hing, MHMr MO Shing-fungMr NG Koon-hungMs SO Ka-manMr SO Shiu-shingMr TAM Chun-yinMr TO Sheck-yuen, MHMr TSANG Hin-hongMr TSUI Fan, MHMs Catherine WONG Lai-sheungMr YAN Siu-namMr YEUNG Chi-hangMr YIP Man-pan
Ex-Officio MemberThe Hon Kenneth LAU Ip-keung, BBS, MH, JP
Yuen Long District CouncilChairmanMr SHUM Ho-kit (Elected member)
Vice-ChairmanMr WONG Wai-shun, MH (Elected member)
Elected MembersMr Daniel CHAM Ka-hung, BBS, MH, JPMs CHAN Mei-linMr CHAN Sze-chingMr CHEUNG Muk-lamMr CHING Chan-mingMs CHIU Sau-han, MHMr CHOW Wing-kanMr KWOK Hing-pingMr KWOK Keung, MHThe Hon KWONG Chun-yuMr LAI Wai-hungMs LAU Kwai-yungMr LEE Yuet-man, MHThe Hon LEUNG Che-cheung, SBS, MH, JPMr LEUNG Ming-kinMr LUI Kin, MHThe Hon LUK Chung-hungMs MA Shuk-yin
Appendices
350
3
Mr MAK Ip-singMr MAN Kwong-mingMr SIU Long-mingMr TANG Cheuk-himMr TANG Cheuk-yinMr TANG Hing-ip, BBSMr TANG Ka-leungMr Ronnie TANG Yung-yiuMr TO Ka-lunMr WONG Cheuk-kinMs WONG Wai-lingMr Zachary WONG Wai-yinMr YIU Kwok-waiMr YOUNG Ka-onMs YUEN Man-yee
Ex-Officio MembersMr LEUNG Fuk-yuenMr MAN Ping-nam, MHMr TANG Ho-ninMr TANG Lai-tungMr TANG Sui-manMr TSANG Shu-wo
Appendices
351
4
Appendix 4Overseas Representation in Hong Kong
Country/Organisation Represented byAlbania Honorary ConsulAngola Consul-GeneralArgentina Consul-GeneralAustralia Consul-GeneralAustria Consul-GeneralBahrain Honorary ConsulBangladesh Consul-GeneralBarbados Honorary ConsulBelgium Consul-GeneralBenin Honorary ConsulBhutan Honorary ConsulBotswana Honorary ConsulBrazil Consul-GeneralBrunei Darussalam Consul-GeneralBurundi Honorary ConsulCambodia Consul-GeneralCameroon Honorary ConsulCanada Consul-GeneralChile Consul-GeneralColombia Consul-GeneralCongo, Republic of Honorary ConsulCote d’lvoire Honorary ConsulCroatia Honorary ConsulCyprus Honorary ConsulCzech Republic Consul-GeneralDemocratic People’s Republic of Korea Consul-GeneralDjibouti Honorary ConsulEgypt Consul-GeneralEquatorial Guinea Honorary ConsulEritrea Honorary ConsulEstonia Honorary ConsulEthiopia Honorary ConsulEuropean Union Head of OfficeFiji Honorary ConsulFinland Consul-GeneralFrance Consul-GeneralGermany Consul-GeneralGreece Consul-GeneralGrenada Honorary ConsulGuinea Honorary ConsulHungary Consul-GeneralIceland Honorary ConsulIndia Consul-GeneralIndonesia Consul-GeneralIran Consul-GeneralIreland Consul-GeneralIsrael Consul-GeneralItaly Consul-GeneralJamaica Honorary ConsulJapan Consul-GeneralJordan Honorary ConsulKazakhstan Consul-GeneralKenya Honorary ConsulKorea, Republic of Consul-GeneralKuwait Consul-GeneralLaos Consul-GeneralLatvia Honorary ConsulLesotho Honorary ConsulLiechtenstein Honorary ConsulLithuania Honorary ConsulLuxembourg Honorary ConsulMadagascar Honorary ConsulMalaysia Consul-GeneralMaldives Honorary ConsulMali Honorary ConsulMalta Honorary ConsulMauritius Honorary ConsulMexico Consul-GeneralMicronesia Honorary Consul
Country/Organisation Represented byMonaco Honorary ConsulMongolia Consul-GeneralMorocco Honorary ConsulMozambique Honorary ConsulMyanmar Consul-GeneralNamibia Honorary ConsulNepal Consul-GeneralNetherlands Consul-GeneralNew Zealand Consul-GeneralNiger Honorary ConsulNigeria Consul-GeneralNorway Honorary ConsulOman Honorary ConsulPakistan Consul-GeneralPapua New Guinea Honorary ConsulPeru Consul-GeneralPhilippines Consul-GeneralPoland Consul-GeneralPortugal Consul-GeneralQatar Consul-GeneralRomania Consul-GeneralRussia Consul-GeneralRwanda Honorary ConsulSamoa Honorary ConsulSan Marino Honorary ConsulSaudi Arabia Consul-GeneralSenegal Honorary ConsulSeychelles Honorary ConsulSingapore Consul-GeneralSlovak Republic Honorary ConsulSlovenia Honorary ConsulSouth Africa Consul-GeneralSpain Consul-GeneralSri Lanka Honorary ConsulSudan Honorary ConsulSuriname Honorary ConsulSweden Consul-GeneralSwitzerland Consul-GeneralTanzania Honorary ConsulThailand Consul-GeneralTonga Honorary ConsulTrinidad and Tobago Honorary ConsulTunisia Honorary ConsulTurkey Consul-GeneralUganda Honorary ConsulUnited Arab Emirates Consul-GeneralUnited Kingdom Consul-GeneralUnited States of America Consul-GeneralUruguay Honorary ConsulVanuatu Consul-GeneralVenezuela Consul-in-ChargeVietnam Consul-GeneralYemen Honorary ConsulZimbabwe Consul-GeneralBank for International Settlements,
Representative Office for Asia and the Pacific
Chief Representative
Hague Conference on Private International Law Asia Pacific Regional Office
Representative
International Finance Corporation Regional Office for East Asia and Pacific and the World Bank Private Sector Development Office for East Asia and Pacific
Regional Director
International Monetary Fund HKSAR Sub-Office
Resident Representative
United Nations High Commissioner for Refugees Sub-Office
Head of Sub-Office
Appendices
352
5
Appendix 5
Hong Kong Representation
GOVERNMENT OFFICES
MAINLAND
BeijingOffice of the Government of the HKSAR in BeijingNo. 71, Di’anmen XidajieXicheng DistrictBeijing, ChinaPostal code: 100009Tel: (86)-10-6657-2880Fax: (86)-10-6657-2821E-mail: [email protected]: www.bjo.gov.hk
Liaoning Liaison UnitOffice 3107-1, CR Building286 Qingnian StreetHeping District, ShenyangLiaoning Province, ChinaPostal code: 110004Tel: (86)-24-3125-5575Fax: (86)-24-3125-5545
Tianjin Liaison UnitRm 4126, World Financial Centre2 Dagubei RoadHeping District, Tianjin, ChinaPostal code: 300022Tel: (86)-22-5830-7884Fax: (86)-22-5830-7886
ChengduHong Kong Economic and Trade Office in Chengdu38/F, Tower 1, Plaza Central8 Shuncheng StreetYan Shi KouChengdu, ChinaPostal code: 610016Tel: (86)-28-8676-8301Fax: (86)-28-8676-8300E-mail: [email protected]: www.cdeto.gov.hk
Chongqing Liaison UnitRoom 5302, 53/F Yingli International FinancialCentre, 28 Minquan RoadYuzhong DistrictChongqing, ChinaPostal code: 400012Tel: (86)-23-6262-2995Fax: (86)-23-6262-2990
Shaanxi Liaison UnitRooms 1103-18, Capita Mall64 West Section of South 2nd Ring RoadYanta District, XianShaanxi, ChinaPostal code: 710065Tel: (86)-29-8720-4883Fax: (86)-29-8720-4885
GuangdongHong Kong Economic and Trade Office in GuangdongFlat 7101, 71/F, Citic Plaza233 Tian He North RoadGuangzhou, ChinaPostal code: 510613Tel: (86)-20-3891-1220Fax: (86)-20-3891-1221E-mail: [email protected]: www.gdeto.gov.hk
Shenzhen Liaison UnitRoom 2628, Level 26, Anlian Centre4018 Jin Tian RoadFutian DistrictShenzhen, ChinaPostal code: 518026Tel: (86)-755-3395-5852Fax: (86)-755-3395-5506
Fujian Liaison UnitUnit 802, Sino International Plaza137 Wusi RoadGulou DistrictFuzhou, ChinaPostal code: 350003Tel: (86)-591-8825-5633Fax: (86)-591-8825-5630
Guangxi Liaison UnitRoom 502, Red Forest Hotel (Nanning)129, Minzu Avenue, NanningGuangxi Zhuang Autonomous Region, ChinaPostal code: 530028Tel: (86)-771- 2611-228Fax: (86)-771- 2611- 913
Appendices
353
5
ShanghaiHong Kong Economic and Trade Office in Shanghai21/F, The Headquarters Building168 Xizang Road (M)Huangpu DistrictShanghai, ChinaPostal code: 200001Tel: (86)-21-6351-2233Fax: (86)-21-6351-9368E-mail: [email protected]: www.sheto.gov.hk
Shandong Liaison UnitRoom 1117, 11/F, Block AShimao International Plaza26 Quancheng RoadLixia District, JinanShandong Province, ChinaPostal code: 250014Tel: (86)-531-8880-7137Fax: (86)-531-8880-9129
Zhejiang Liaison UnitRoom 743, 7/F, Tower AChina Resources Building1366 Qianjiang Road, Jianggan DistrictHangzhou, ChinaPostal code: 310016(86)-571-2809-3787(86)-571- 2809-3765
WuhanHong Kong Economic and Trade Office in WuhanUnit 4303, Tower I, New World International Trade Tower568 Jianshe AvenueJianghan District, HankouWuhan, ChinaPostal code: 430022Tel: (86)-27-6560-7300Fax: (86)-27-6560-7301E-mail: [email protected]: www.wheto.gov.hk
Hunan Liaison UnitUnit 3416, Huayuan International Centre36 Xiangjiang Middle Road Section TwoTianxin District, ChangshaHunan Province, ChinaPostal code: 410002Tel: (86)-731-8227-5609Fax: (86)-731-8227-5610
Henan Liaison UnitRoom 1822, 18/F, Block DKineer IFC88 East Jinshui RoadZhengdong New District, ZhengzhouHenan Province, ChinaPostal code: 450046Tel: (86)-371-5361-2524Fax: (86)-371-5361-2525
EUROPE
BerlinHong Kong Economic and Trade OfficeJaegerstrasse 3310117 Berlin, GermanyTel: (49)-30-22-66-77-228Fax: (49)-30-22-66-77-288E-mail: [email protected]: www.hketoberlin.gov.hk
BrusselsHong Kong Economic and Trade OfficeRue d’Arlon 1181040 Brussels, BelgiumTel: (32)-2-775-0088Fax: (32)-2-770-0980E-mail: [email protected]: www.hongkong-eu.org
GenevaHong Kong Economic and Trade OfficeAllée David-Morse, P.O. Box 951211 Geneva 20, SwitzerlandTel: (41)-22-730-1300Fax: (41)-22-730-1304E-mail: [email protected]
LondonHong Kong Economic and Trade Office18 Bedford SquareLondon, WC1B 3JA, UKTel: (44)-207-499-9821Fax: (44)-207-323-2336E-mail: [email protected]: www.hketolondon.gov.hk
NORTH AMERICA
New YorkHong Kong Economic and Trade Office115 East 54th StreetNew York, NY 10022, USATel: (1)-212-752-3320Fax: (1)-212-752-3395E-mail: [email protected]: www.hketony.gov.hk
San FranciscoHong Kong Economic and Trade Office130 Montgomery StreetSan Francisco, CA 94104-4301, USATel: (1)-415-835-9300Fax: (1)-415-421-0646E-mail: [email protected]: www.hketosf.gov.hk
Appendices
354
5
WashingtonHong Kong Economic and Trade Office1520 18th Street, NWWashington, DC 20036, USATel: (1)-202-331-8947Fax: (1)-202-331-8958E-mail: [email protected]: www.hketowashington.gov.hk
TorontoHong Kong Economic and Trade Office174 St. George StreetTorontoOntario M5R 2M7, CanadaTel: (1)-416-924-5544Fax: (1)-416-924-3599E-mail: [email protected]: www.hketotoronto.gov.hk
Liaison office in VancouverSuite 500, Park Place666 Burrard StreetVancouverBritish Columbia V6C 3P6, CanadaTel: (1)-604-331-1300Fax: (1)-604-331-1368E-mail: [email protected]
ASIA-PACIFIC
JakartaHong Kong Economic and Trade Office19th Floor, World Trade Centre 2Jalan Jenderal Sudirman Kav. 29-31Jakarta Selatan 12920IndonesiaTel: (62)-21-8086-9730Fax: (62)-21-2952-2613E-mail: [email protected]: www.hketojakarta.gov.hk
SingaporeHong Kong Economic and Trade Office#34-01, Suntec Tower 29 Temasek BoulevardSingapore 038989Tel: (65)-6338-1771Fax: (65)-6339-2112 (65)-6337-7297E-mail: [email protected]: www.hketosin.gov.hk
SydneyHong Kong Economic and Trade OfficeLevel 1, Hong Kong House80 Druitt StreetSydney, NSW 2000, AustraliaTel: (61)-2-9283-3222Fax: (61)-2-9283-3818E-mail: [email protected]: www.hketosydney.gov.hk
TokyoHong Kong Economic and Trade OfficeHong Kong Economic and Trade Office Building30-1, Sanban-cho, Chiyoda-kuTokyo 102-0075, JapanTel: (81)-3-3556-8980Fax: (81)-3-3556-8968E-mail: [email protected]: www.hketotyo.gov.hk
HONG KONG ECONOMIC, TRADE AND CULTURAL OFFICE (TAIWAN)25/F, President International Tower11 Songgao RoadXinyi DistrictTaipei, TaiwanPostal code: 11073Tel: (886)-2-2720-0858Fax: (886)-2-2720-8658E-mail: [email protected]: www.hketco.hk
HONG KONG TRADE DEVELOPMENT COUNCILThe Hong Kong Trade Development Councilmaintains branch and consultant offices round theworld. The addresses of these offices are providedon the council’s website.
Head Office38/F, Office TowerConvention Plaza1 Harbour RoadWan Chai, Hong KongTel: (852)-2584-4333Fax: (852)-2824-0249E-mail: [email protected]: www.hktdc.com
HONG KONG TOURISM BOARDThe Hong Kong Tourism Board also maintainsoffices or representative offices in various countries.The addresses of these offices are provided onthe board’s website.
Head Office9-11/F, Citicorp Centre18 Whitfield RoadNorth Point, Hong KongTel: (852)-2807-6543Fax: (852)-2806-0303E-mail: [email protected]: www.discoverhongkong.com

Appendices
355
6
Appendix 6Table 1(Chapter 3: The Economy)
(a) Gross Domestic Product (GDP)
2012 2016@ 2017@
GDP (HK$ billion) At current market prices 2,037.1 2,490.7 2,662.6
(+5.3) (+3.9) (+6.9) In chained (2015) dollars 2,210.8 2,449.5 2,543.2
(+1.7) (+2.1) (+3.8)
Per capita GDP (HK$) 284,899 339,490 360,220 At current market prices (+4.1) (+3.2) (+6.1)
309,200 333,879 344,060 In chained (2015) dollars (+0.6) (+1.5) (+3.0)
(b) GDP by Expenditure Component
2012 2016@ 2017@
Expenditure components at current market prices (HK$ billion) Private consumption expenditure 1,315.0 1,649.6 1,783.7 Government consumption expenditure 185.3 247.6 261.9 Gross domestic fixed capital formation 517.4 536.0 584.6 Changes in inventories -3.7 0.4 11.4 Exports of goods (fob) 3,633.0 3,892.9 4,190.2 Exports of services 764.0 764.8 810.3 Less: Imports of goods (fob) 3,779.7 4,022.6 4,377.2 Imports of services 594.3 578.1 602.3 GDP 2,037.1 2,490.7 2,662.6
Ratio of expenditure components to GDP at current market prices (%) Private consumption expenditure 64.6 66.2 67.0 Government consumption expenditure 9.1 9.9 9.8 Gross domestic fixed capital formation 25.4 21.5 22.0 Changes in inventories -0.2 § 0.4 Exports of goods (fob) 178.3 156.3 157.4 Exports of services 37.5 30.7 30.4 Less: Imports of goods (fob) 185.5 161.5 164.4 Imports of services 29.2 23.2 22.6 GDP 100.0 100.0 100.0
Appendices
356
6
2012 2016@ 2017@
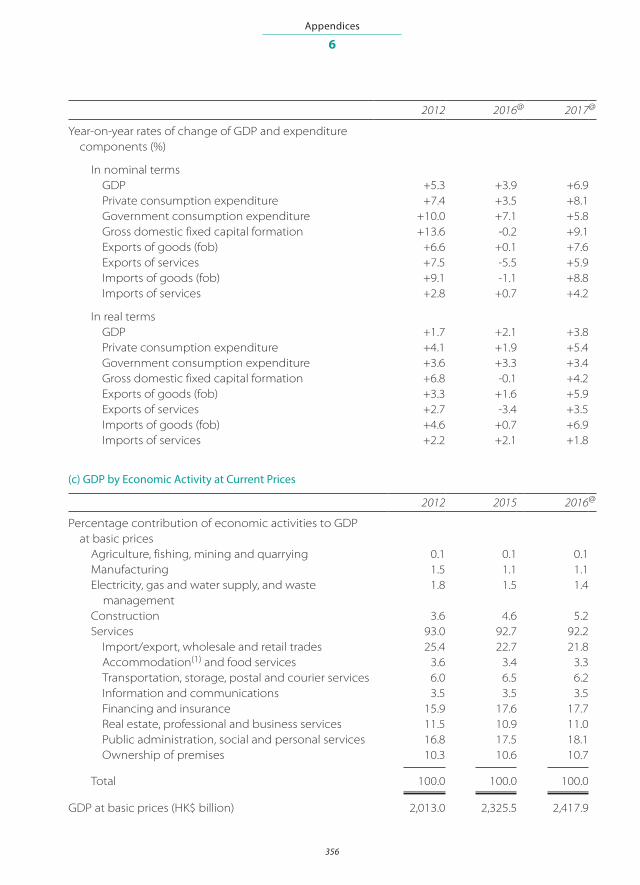
Year-on-year rates of change of GDP and expenditure components (%)
In nominal terms GDP +5.3 +3.9 +6.9 Private consumption expenditure +7.4 +3.5 +8.1 Government consumption expenditure +10.0 +7.1 +5.8 Gross domestic fixed capital formation +13.6 -0.2 +9.1 Exports of goods (fob) +6.6 +0.1 +7.6 Exports of services +7.5 -5.5 +5.9 Imports of goods (fob) +9.1 -1.1 +8.8 Imports of services +2.8 +0.7 +4.2
In real terms GDP +1.7 +2.1 +3.8 Private consumption expenditure +4.1 +1.9 +5.4 Government consumption expenditure +3.6 +3.3 +3.4 Gross domestic fixed capital formation +6.8 -0.1 +4.2 Exports of goods (fob) +3.3 +1.6 +5.9 Exports of services +2.7 -3.4 +3.5 Imports of goods (fob) +4.6 +0.7 +6.9 Imports of services +2.2 +2.1 +1.8
(c) GDP by Economic Activity at Current Prices
2012 2015 2016@
Percentage contribution of economic activities to GDP at basic prices Agriculture, fishing, mining and quarrying 0.1 0.1 0.1 Manufacturing 1.5 1.1 1.1 Electricity, gas and water supply, and waste 1.8 1.5 1.4 management Construction 3.6 4.6 5.2 Services 93.0 92.7 92.2 Import/export, wholesale and retail trades 25.4 22.7 21.8 Accommodation(1) and food services 3.6 3.4 3.3 Transportation, storage, postal and courier services 6.0 6.5 6.2 Information and communications 3.5 3.5 3.5 Financing and insurance 15.9 17.6 17.7 Real estate, professional and business services 11.5 10.9 11.0 Public administration, social and personal services 16.8 17.5 18.1 Ownership of premises 10.3 10.6 10.7
Total 100.0 100.0 100.0
GDP at basic prices (HK$ billion) 2,013.0 2,325.5 2,417.9
Appendices
357
6
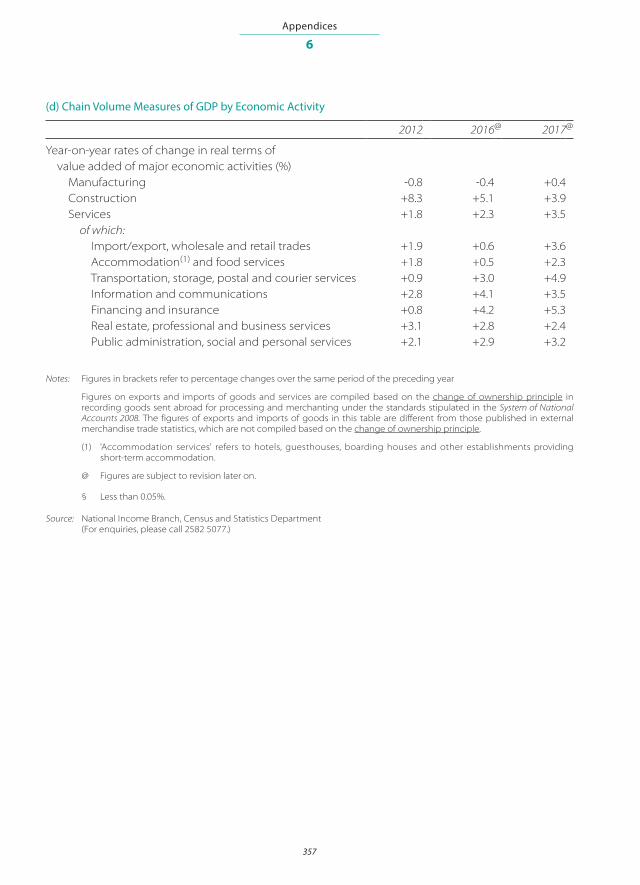
(d) Chain Volume Measures of GDP by Economic Activity
2012 2016@ 2017@
Year-on-year rates of change in real terms of value added of major economic activities (%) Manufacturing -0.8 -0.4 +0.4 Construction +8.3 +5.1 +3.9 Services +1.8 +2.3 +3.5 of which: Import/export, wholesale and retail trades +1.9 +0.6 +3.6 Accommodation(1) and food services +1.8 +0.5 +2.3 Transportation, storage, postal and courier services +0.9 +3.0 +4.9 Information and communications +2.8 +4.1 +3.5 Financing and insurance +0.8 +4.2 +5.3 Real estate, professional and business services +3.1 +2.8 +2.4 Public administration, social and personal services +2.1 +2.9 +3.2
Notes: Figures in brackets refer to percentage changes over the same period of the preceding year
Figures on exports and imports of goods and services are compiled based on the change of ownership principle in recording goods sent abroad for processing and merchanting under the standards stipulated in the System of National Accounts 2008. The figures of exports and imports of goods in this table are different from those published in external merchandise trade statistics, which are not compiled based on the change of ownership principle.
(1) 'Accommodation services' refers to hotels, guesthouses, boarding houses and other establishments providing short-term accommodation.
@ Figures are subject to revision later on.
§ Less than 0.05%.
Source: National Income Branch, Census and Statistics Department (For enquiries, please call 2582 5077.)

Appendices
358
6
Table 2(Chapter 3: The Economy)
Gross National Income (GNI)
HK$ Billion, unless otherwise specified
2012 2016@ 2017@
In chained (2015) dollars GDP 2,210.8 2,449.5 2,543.2 Net external primary income flows 31.5 61.9 106.0 External primary income inflow 1,164.9 1,256.4 1,339.7 External primary income outflow 1,133.4 1,194.5 1,233.7 RGNI(1) 2,204.7 2,520.1 2,653.7
(-0.2) (+3.2) (+5.3)
Per capita GDP (HK$) 309,200 333,879 344,060 Per capita RGNI (HK$) 308,352 343,492 359,015
(-1.3) (+2.5) (+4.5)
At current market prices GDP 2,037.1 2,490.7 2,662.6 Net external primary income flows 29.5 62.6 110.7 External primary income inflow 1,091.2 1,273.5 1,400.7 External primary income outflow 1,061.8 1,210.9 1,289.9 GNI 2,066.5 2,553.3 2,773.4
(+4.0) (+4.5) (+8.6)
Per capita GDP (HK$) 284,899 339,490 360,220 Per capita GNI (HK$) 289,019 348,022 375,201
(+2.8) (+3.9) (+7.8)
Notes: Figures in brackets refer to percentage changes over the same period of the preceding year.
GNI is a measure of the total income earned by residents of an economy from engaging in various economic activities, irrespective of whether the economic activities are carried out within the economic territory of the economy or outside. GNI is obtained by adding net external primary income flows (i.e. external primary income inflow minus external primary income outflow) to GDP of the same year.
(1) Real Gross National Income (RGNI) is obtained by adding the terms of trade adjustment and real net external primary income flows to real GDP.
@ Figures are subject to revision later on.
Source: Balance of Payments Branch, Census and Statistics Department (For enquiries, please call 3903 7017.)

Appendices
359
6
Table 3(Chapter 3: The Economy)
Balance of Payments (BoP)(1)
HK$ Billion
2012 2016@ 2017@
Current account balance(2) 32.2 98.7 111.8 Goods -146.7 -129.7 -187.0 Services 169.8 186.7 208.1 Primary income 29.5 62.6 110.7 Secondary income -20.3 -21.0 -20.0
Capital and financial account balance(2) -67.7 -101.1 -155.0 Capital account -1.4 -0.4 -0.6 Financial non-reserve assets(3) 122.7 -91.9 96.1 Direct investment -102.6 447.8 167.5 Portfolio investment -31.6 -469.6 305.0 Financial derivatives 15.2 36.3 39.6 Other investment 241.7 -106.4 -416.0 Reserve assets(3) -188.9 -8.9 -250.5
Net errors and omissions(4) 35.5 2.4 43.3
Overall Balance of Payments 188.9 8.9 250.5(in surplus) (in surplus) (in surplus)
Notes: (1) The BoP is a statistical statement that systematically summarises, for a specific period (typically a year or a quarter), the economic transactions of an economy with the rest of the world (i.e. between residents and non-residents). A complete BoP account comprises two broad accounts: (a) the current account; and (b) the capital and financial account.
(2) In accordance with accounting rules adopted in compiling the BoP, a positive value for the balance figure in the current account represents a surplus whereas a negative value represents a deficit. In the capital and financial account, a positive value indicates a net financial inflow while a negative value indicates a net outflow. As increases in external assets are debit entries and decreases are credit entries, a negative value for the reserve assets represents a net increase while a positive value represents a net decrease.
(3) The estimates of reserve and non-reserve assets under the BoP framework are transaction figures. Effects of valuation changes (including price changes and exchange rate changes) and reclassifications are not taken into account.
(4) In principle, the net sum of credit entries and debit entries is zero. In practice, discrepancies between the credit and debit entries may occur for various reasons as the relevant data are collected from many sources. Equality between the sum of credit entries and that of debit entries is brought about by the inclusion of a balancing item which reflects net errors and omissions.
@ Figures are subject to revision later on.
Source: Balance of Payments Branch, Census and Statistics Department (For enquiries, please call 3903 6979.)

Appendices
360
6
Table 4(Chapter 3: The Economy)
Year-on-year Rates of Change in Consumer Price Indices
Percentages
2012 2016 2017
Composite Consumer Price Index(1) +4.1 +2.4 +1.5 Food +5.8 +3.4 +2.2 Housing +5.6 +3.7 +2.0
Consumer Price Index (A)(1) +3.6 +2.8 +1.5 Food +6.1 +3.6 +2.0 Housing +4.5 +4.2 +2.2
Consumer Price Index (B)(1) +4.3 +2.3 +1.4 Food +6.0 +3.4 +2.2 Housing +6.3 +3.6 +1.9
Consumer Price Index (C)(1) +4.1 +2.1 +1.5 Food +5.1 +3.0 +2.4 Housing +6.1 +3.2 +1.9
Notes: The year-on-year rate of change in the Consumer Price Index (CPI) is an indicator of inflation affecting consumers.
Figures are derived based on the 2014/15-based CPI series. The year-on-year rates of change before October 2015 were derived using the index series in the base periods at that time (for instance the 2009/10-based index series), compared with the index a year earlier in the same base period.
(1) The CPI(A), CPI(B) and CPI(C) respectively cover some 50%, 30% and 10% of households. The average monthly household expenditure (in HK$) of these groups during the base period (i.e. Oct 2014-Sep 2015) were $5,500-$24,499, $24,500-$44,499 and $44,500-$89,999 respectively. Taking into account the impact of price changes since the base period, the monthly household expenditure ranges of the CPI(A), CPI(B) and CPI(C) adjusted to the price level of 2017 are broadly equivalent to $5,800-$25,700, $25,700-$46,400 and $46,400-$93,800 respectively, and that of the Composite CPI is broadly equivalent to $5,800-$93,800. The Composite CPI is compiled based on the overall expenditure patterns of all these households taken together.
Source: Consumer Price Index Section, Census and Statistics Department (For enquiries, please call 3903 7374.)
Appendices
361
6
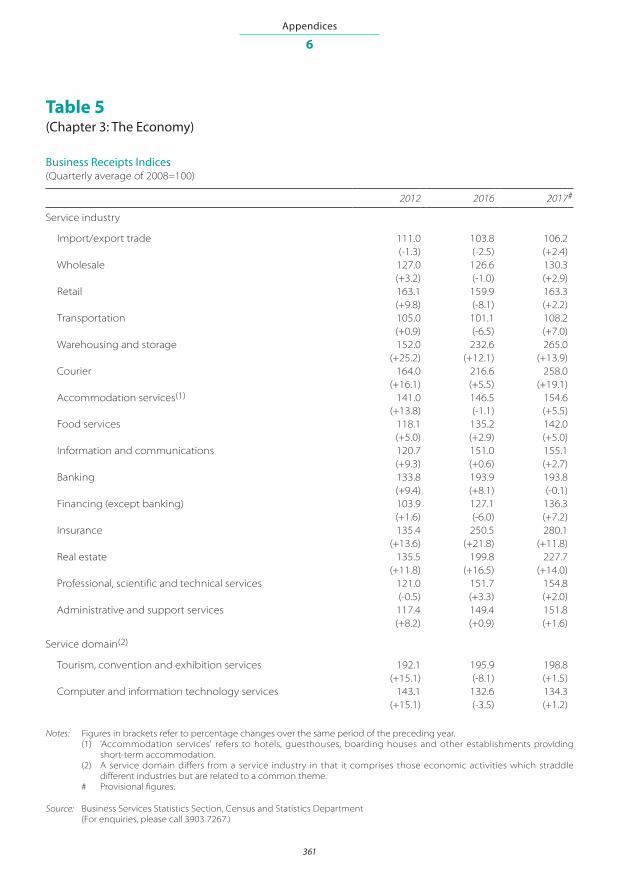
Table 5(Chapter 3: The Economy)
Business Receipts Indices(Quarterly average of 2008=100)
2012 2016 2017#
Service industry
Import/export trade 111.0 103.8 106.2(-1.3) (-2.5) (+2.4)
Wholesale 127.0 126.6 130.3(+3.2) (-1.0) (+2.9)
Retail 163.1 159.9 163.3(+9.8) (-8.1) (+2.2)
Transportation 105.0 101.1 108.2(+0.9) (-6.5) (+7.0)
Warehousing and storage 152.0 232.6 265.0(+25.2) (+12.1) (+13.9)
Courier 164.0 216.6 258.0(+16.1) (+5.5) (+19.1)
Accommodation services(1) 141.0 146.5 154.6(+13.8) (-1.1) (+5.5)
Food services 118.1 135.2 142.0(+5.0) (+2.9) (+5.0)
Information and communications 120.7 151.0 155.1(+9.3) (+0.6) (+2.7)
Banking 133.8 193.9 193.8(+9.4) (+8.1) (-0.1)
Financing (except banking) 103.9 127.1 136.3(+1.6) (-6.0) (+7.2)
Insurance 135.4 250.5 280.1(+13.6) (+21.8) (+11.8)
Real estate 135.5 199.8 227.7(+11.8) (+16.5) (+14.0)
Professional, scientific and technical services 121.0 151.7 154.8(-0.5) (+3.3) (+2.0)
Administrative and support services 117.4 149.4 151.8(+8.2) (+0.9) (+1.6)
Service domain(2)
Tourism, convention and exhibition services 192.1 195.9 198.8 (+15.1) (-8.1) (+1.5) Computer and information technology services 143.1 132.6 134.3
(+15.1) (-3.5) (+1.2)
Notes: Figures in brackets refer to percentage changes over the same period of the preceding year. (1) 'Accommodation services' refers to hotels, guesthouses, boarding houses and other establishments providing
short-term accommodation. (2) A service domain differs from a service industry in that it comprises those economic activities which straddle
different industries but are related to a common theme. # Provisional figures.
Source: Business Services Statistics Section, Census and Statistics Department (For enquiries, please call 3903 7267.)

Appendices
362
6
Table 6(Chapter 3: The Economy)
Total Government Revenue and Expenditure and Summary of Financial PositionHK$ Million
RevenueRevised
Actual Actual estimate2012-13 2016-17 2017-18
Operating Revenue Direct taxes Earnings and profits tax(1) 182,442 206,907 206,055 Indirect taxes Duties 8,977 10,254 10,780 General rates 11,204 21,250 22,282 Internal revenue(2) 61,474 85,616 116,887 Motor vehicle taxes 7,466 7,814 8,746 Royalties and concessions 2,736 10,545 3,206 Fees and charges (tax-loaded fees) 5,127 5,390 8,023 Other revenue Fines, forfeitures and penalties 1,208 1,496 1,870 Properties and investments 19,268 30,112 26,990 Reimbursements and contributions 3,404 3,995 3,985 Utilities Marine ferry terminals 208 194 201 Waterworks 2,548 2,734 2,769 Sewage services 931 1,328 1,456 Fees and charges (excluding tax-loaded fees) 6,463 7,329 8,012 Investment income and interest General Revenue Account 20,024 16,763 15,623 Land Fund 11,126 — —
Total Operating Revenue 344,606 411,727 436,885
Capital Revenue Indirect taxes Estate duty 137 19 15 Taxi concessions — 141 — Other revenue 16,083 24,139 1,375 Funds Capital Works Reserve Fund 74,238 129,997 167,520 Capital Investment Fund 1,482 1,437 897 Civil Service Pension Reserve Fund 1,369 970 930 Disaster Relief Fund 1 4 2 Innovation and Technology Fund 214 207 269 Loan Fund 2,240 2,385 2,690 Lotteries Fund 1,780 2,098 1,802
Total Capital Revenue 97,544 161,397 175,500
Total Government Revenue 442,150 573,124 612,385

Appendices
363
6
Operating Expenditure Recurrent expenditure Personal emoluments 58,218 71,775 74,716 Personnel related expenses 4,292 6,725 7,540 Pensions 21,843 31,948 34,868 Departmental expenses 23,926 30,163 31,499 Other charges 47,934 69,052 70,440 Subventions Education 34,067 41,584 47,261 Health 42,478 53,091 55,995 Social welfare 10,196 14,537 15,086 Universities 13,550 18,495 18,872 Vocational Training Council 2,161 2,563 2,577 Miscellaneous 3,656 4,705 4,838 Non-recurrent 40,621 8,618 9,178
Total Operating Expenditure 302,942 353,256 372,870
Capital Expenditure Plant, equipment and works 1,583 2,215 2,604 Capital subventions 1,562 1,782 1,921 Funds Capital Works Reserve Fund 66,527 87,294 87,815 Capital Investment Fund 779 10,194 1,058 Disaster Relief Fund 54 54 63 Innovation and Technology Fund 692 1,258 1,484 Loan Fund 2,304 4,669 5,148 Lotteries Fund 881 1,330 1,443
Total Capital Expenditure 74,382 108,796 101,536
Total Government Expenditure 377,324 462,052 474,406
HK$ MillionExpenditure
RevisedActual Actual estimate
2012-13 2016-17 2017-18

Appendices
364
6
Total Government Revenue 442,150 573,124 612,385
Less Total Government Expenditure 377,324 462,052 474,406 Repayment of bonds and notes — — —
Consolidated surplus 64,826 111,072 137,979
Reserve balance at 1 April 669,088 842,888 953,960
Reserve balance at 31 March 733,914 953,960 1,091,939
Notes: (1) Including salaries tax, profits tax, property tax and personal assessment. (2) Including bets and sweeps tax, air passenger departure tax and stamp duties.
Source: Financial Services and the Treasury Bureau, Government Secretariat (For enquiries, please call 2810 3658.)
HK$ MillionSummary of financial position
RevisedActual Actual estimate
2012-13 2016-17 2017-18

Appendices
365
6
Land premium 22%
Properties and investments 8%
Stamp duties 11%
General rates 4%
Bets and sweeps tax 4%
Duties 2%
Other revenue† 10%
Profits tax 24%
Utilities, fees and charges 3%
Salaries tax, personal assessment
and property tax 12%
Chart 1(Chapter 3: The Economy)
Major Sources of Revenue (2016-17)
1. Air passenger departure tax
2. Capital Investment Fund
3. Capital Works Reserve Fund (excluding land premium)
4. Civil Service Pension Reserve Fund
5. Disaster Relief Fund
6. Estate duty
7. Fines, forfeitures and penalties
8. Innovation and Technology Fund
9. Land Fund
10. Loan Fund
11. Loans, reimbursements, contributions and other receipts
12. Lotteries Fund
13. Motor vehicle first registration tax
14. Royalties and concessions
†Other revenue includes:

Appendices
366
6
Table 7(Chapter 3: The Economy)
Public Expenditure by Policy Area Group
HK$ Million
Actual 2012-13 Actual 2016-17 Revised estimate 2017-18
Non- Non- Non-recurrent recurrent recurrent
and and and Recurrent capital Total Recurrent capital Total Recurrent capital Total
Community and external affairs
9,192 4,036 13,228 12,227 2,624 14,851 12,692 3,863 16,555
Economic 12,992 20,306 33,298 15,082 14,283 29,365 16,271 5,227 21,498
Education 60,449 16,151 76,600 75,533 6,903 82,436 80,141 8,366 88,507
Environment and food 11,100 7,811 18,911 14,551 6,283 20,834 15,467 6,579 22,046
Health 46,226 13,346 59,572 58,712 7,762 66,474 62,802 8,432 71,234
Housing 10,672 9,829 20,501 13,616 15,259 28,875 14,434 19,239 33,673
Infrastructure 17,177 44,518 61,695 21,045 68,357 89,402 22,267 65,017 87,284
Security 31,377 2,560 33,937 38,933 4,229 43,162 40,741 5,307 46,048
Social welfare 42,813 3,081 45,894 63,548 4,603 68,151 65,832 5,018 70,850
Support 35,176 1,367 36,543 48,872 2,394 51,266 52,050 2,967 55,017
Total 277,174 123,005 400,179 362,119 132,697 494,816 382,697 130,015 512,712
Note: Where appropriate, historical figures have been adjusted to align with the definitions and policy area group classifications adopted in the 2018-19 estimate.
Source: Financial Services and the Treasury Bureau, Government Secretariat (For enquiries, please call 2810 3658.)

Appendices
367
6
Chart 2(Chapter 3: The Economy)
Public Expenditure by Policy Area Group
Actual2016-17
Revised estimate2017-18
Actual2012-13
HK$ Million
66,47413.4%
68,15113.8%
51,26610.4%
43,1628.7%
28,8755.8%
20,8344.2%
29,3655.9%
14,8513.0%
89,40218.1%
82,43616.7%
Infrastructure87,28417.0%
Education88,50717.3%
Health71,23413.9%
Social welfare70,85013.8%
Support55,01710.7%
Security46,0489.0%
Environment and food
22,0464.3%
Economic21,4984.2%
Community and external affairs
16,5553.2%
13,2283.3%
18,9114.7%
33,2988.3%
33,9378.5%
36,5439.2%
20,5015.1%
45,89411.5%
61,69515.4%
76,60019.1%
59,57214.9%
540,000
520,000
500,000
480,000
460,000
440,000
420,000
400,000
380,000
360,000
340,000
320,000
300,000
280,000
260,000
240,000
220,000
200,000
180,000
160,000
140,000
120,000
100,000
80,000
60,000
40,000
20,000
0
Housing33,6736.6%

Appendices
368
6
Table 8(Chapter 3: The Economy)
Government Expenditure and the Economy
HK$ Million
RevisedActual Actual estimate
2012-13 2016-17 2017-18
Government Expenditure (see Table 6) Operating Expenditure 302,942 353,256 372,870 Capital Expenditure 74,382 108,796 101,536
Total Government Expenditure 377,324 462,052 474,406Other public bodies 22,855 32,764 38,306
Total Public Expenditure 400,179 494,816 512,712
Gross Domestic Product (GDP) at 2,037,059 2,490,703@ 2,662,637@
current market prices(1)
Nominal growth in GDP(1) +5.3% +3.9%@ +6.9%@
Growth in Public Expenditure +3.8% +5.7% +3.6%
Public Expenditure as percentage of GDP 19.6% 19.9% 19.3%
Notes: (1) Figures refer to calendar years of 2012, 2016 and 2017. @ Figures are subject to revision later on.
Source: Financial Services and the Treasury Bureau, Government Secretariat (For enquiries, please call 2810 3658.)

Appendices
369
6
Table 9(Chapter 4: Financial and Monetary Affairs)
Deposits, Loans and Advances of Authorised Institutions
2012 2016 2017
Number of authorised institutions in operation Licensed banks 153 153 153 Restricted licence banks 21 22 19 Deposit-taking companies 24 17 17
Total 198 192 189
(+2.1) (-2.5) (-1.6)
Deposits from customers(1) (HK$ billion) Licensed banks 8,276.0 11,689.4 12,709.6 Restricted licence banks 13.3 32.2 37.2 Deposit-taking companies 7.0 5.7 5.7
Total 8,296.4 11,727.3 12,752.5
(+9.3) (+9.1) (+8.7)
Loans and advances for use in Hong Kong(1)(2) (HK$ billion) Licensed banks 3,553.8 5,144.7 5,981.4 Restricted licence banks 21.4 27.9 24.6 Deposit-taking companies 21.8 12.1 12.5
Total 3,597.0 5,184.6 6,018.5
(+7.0) (+8.0) (+16.1)
Total loans and advances to customers(1) (HK$ billion) Licensed banks 5,503.9 7,954.0 9,251.3 Restricted licence banks 35.5 52.4 44.6 Deposit-taking companies 27.5 17.0 17.8
Total 5,566.8 8,023.4 9,313.7
(+9.6) (+6.5) (+16.1)
Notes: Figures are as at the end of the year. Figures in brackets refer to percentage changes over the same period of the preceding year. (1) Figures are subject to revision to take into account any subsequent amendments submitted by authorised
institutions. (2) Excluding loans for trade financing.
Source: Hong Kong Monetary Authority (For enquiries, please call 2878 8222.)
Appendices
370
6
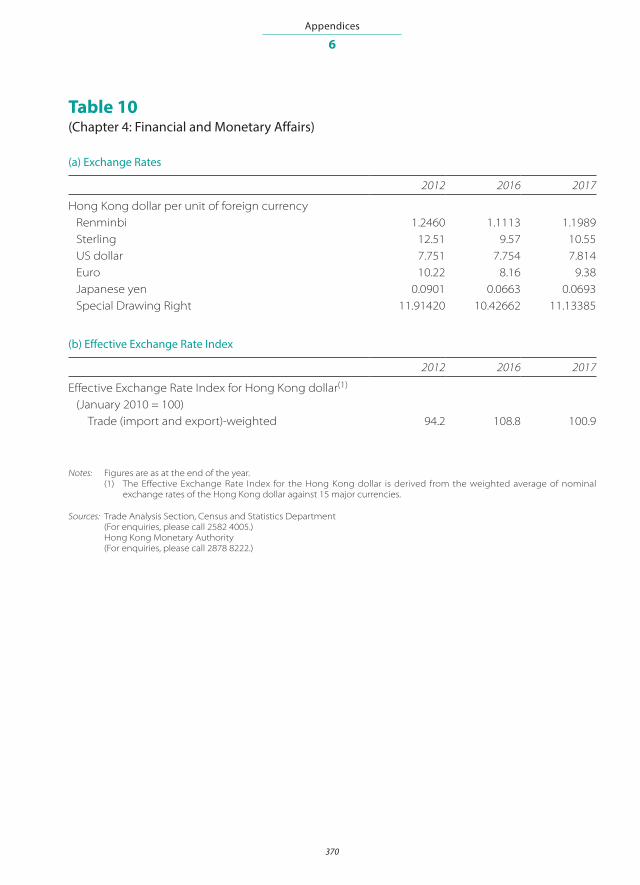
Table 10(Chapter 4: Financial and Monetary Affairs)
(a) Exchange Rates
2012 2016 2017
Hong Kong dollar per unit of foreign currency Renminbi 1.2460 1.1113 1.1989 Sterling 12.51 9.57 10.55 US dollar 7.751 7.754 7.814 Euro 10.22 8.16 9.38 Japanese yen 0.0901 0.0663 0.0693 Special Drawing Right 11.91420 10.42662 11.13385
(b) Effective Exchange Rate Index
2012 2016 2017
Effective Exchange Rate Index for Hong Kong dollar(1)
(January 2010 = 100) Trade (import and export)-weighted 94.2 108.8 100.9
Notes: Figures are as at the end of the year. (1) The Effective Exchange Rate Index for the Hong Kong dollar is derived from the weighted average of nominal
exchange rates of the Hong Kong dollar against 15 major currencies.
Sources: Trade Analysis Section, Census and Statistics Department (For enquiries, please call 2582 4005.) Hong Kong Monetary Authority (For enquiries, please call 2878 8222.)

Appendices
371
6
Table 11(Chapter 4: Financial and Monetary Affairs)
Money Supply
HK$ Billion
2012 2016 2017
M1 Hong Kong dollar 920.9 1,428.8 1,598.0 Foreign currency 456.4 785.2 833.4
Total 1,377.4 2,214.0 2,431.5
(+22.2) (+12.3) (+9.8)
M3
Hong Kong dollar (1) 4,545.6 6,292.7 7,024.5 Foreign currency(2) 4,424.8 6,258.7 6,779.3
Total 8,970.4 12,551.3 13,803.8
(+11.0) (+7.7) (+10.0)
Notes: Figures are as at the end of the year. Figures in brackets refer to percentage changes over the same period of the preceding year. Figures are subject to revision to take into account any subsequent amendments submitted by authorised institutions. (1) Adjusted to include foreign currency swap deposits. (2) Adjusted to exclude foreign currency swap deposits.
Source: Hong Kong Monetary Authority (For enquiries, please call 2878 8222.)
Appendices
372
6
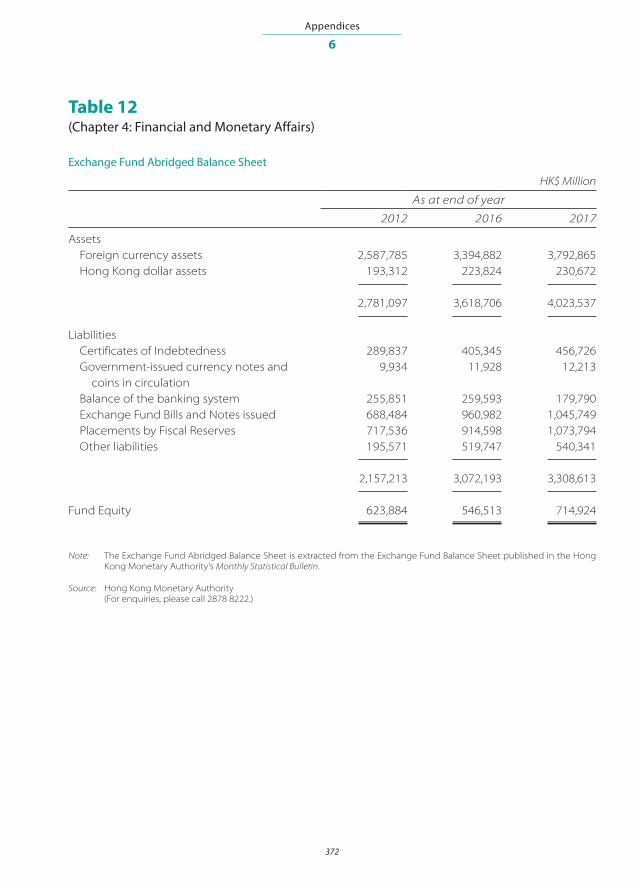
Table 12(Chapter 4: Financial and Monetary Affairs)
Exchange Fund Abridged Balance Sheet
HK$ Million
As at end of year
2012 2016 2017
Assets Foreign currency assets 2,587,785 3,394,882 3,792,865 Hong Kong dollar assets 193,312 223,824 230,672
2,781,097 3,618,706 4,023,537
Liabilities Certificates of Indebtedness 289,837 405,345 456,726 Government-issued currency notes and 9,934 11,928 12,213 coins in circulation Balance of the banking system 255,851 259,593 179,790 Exchange Fund Bills and Notes issued 688,484 960,982 1,045,749 Placements by Fiscal Reserves 717,536 914,598 1,073,794 Other liabilities 195,571 519,747 540,341
2,157,213 3,072,193 3,308,613
Fund Equity 623,884 546,513 714,924
Note: The Exchange Fund Abridged Balance Sheet is extracted from the Exchange Fund Balance Sheet published in the Hong Kong Monetary Authority’s Monthly Statistical Bulletin.
Source: Hong Kong Monetary Authority (For enquiries, please call 2878 8222.)
Appendices
373
6
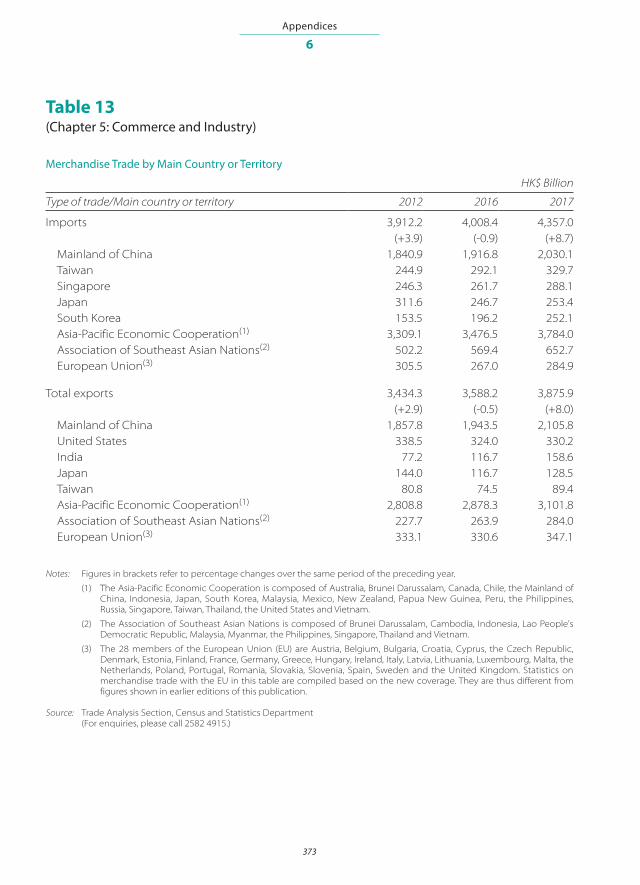
Table 13(Chapter 5: Commerce and Industry)
Merchandise Trade by Main Country or Territory
HK$ Billion
Type of trade/Main country or territory 2012 2016 2017
Imports 3,912.2 4,008.4 4,357.0(+3.9) (-0.9) (+8.7)
Mainland of China 1,840.9 1,916.8 2,030.1 Taiwan 244.9 292.1 329.7 Singapore 246.3 261.7 288.1 Japan 311.6 246.7 253.4 South Korea 153.5 196.2 252.1 Asia-Pacific Economic Cooperation(1) 3,309.1 3,476.5 3,784.0 Association of Southeast Asian Nations(2) 502.2 569.4 652.7 European Union(3) 305.5 267.0 284.9
Total exports 3,434.3 3,588.2 3,875.9(+2.9) (-0.5) (+8.0)
Mainland of China 1,857.8 1,943.5 2,105.8 United States 338.5 324.0 330.2 India 77.2 116.7 158.6 Japan 144.0 116.7 128.5 Taiwan 80.8 74.5 89.4 Asia-Pacific Economic Cooperation(1) 2,808.8 2,878.3 3,101.8 Association of Southeast Asian Nations(2) 227.7 263.9 284.0 European Union(3) 333.1 330.6 347.1
Notes: Figures in brackets refer to percentage changes over the same period of the preceding year.
(1) The Asia-Pacific Economic Cooperation is composed of Australia, Brunei Darussalam, Canada, Chile, the Mainland of China, Indonesia, Japan, South Korea, Malaysia, Mexico, New Zealand, Papua New Guinea, Peru, the Philippines, Russia, Singapore, Taiwan, Thailand, the United States and Vietnam.
(2) The Association of Southeast Asian Nations is composed of Brunei Darussalam, Cambodia, Indonesia, Lao People's Democratic Republic, Malaysia, Myanmar, the Philippines, Singapore, Thailand and Vietnam.
(3) The 28 members of the European Union (EU) are Austria, Belgium, Bulgaria, Croatia, Cyprus, the Czech Republic, Denmark, Estonia, Finland, France, Germany, Greece, Hungary, Ireland, Italy, Latvia, Lithuania, Luxembourg, Malta, the Netherlands, Poland, Portugal, Romania, Slovakia, Slovenia, Spain, Sweden and the United Kingdom. Statistics on merchandise trade with the EU in this table are compiled based on the new coverage. They are thus different from figures shown in earlier editions of this publication.
Source: Trade Analysis Section, Census and Statistics Department (For enquiries, please call 2582 4915.)

Appendices
374
6
Table 14(Chapter 5: Commerce and Industry)
Exports and Imports of Services by Service Component
HK$ Billion
Service component 2012 2016@ 2017@
Exports of services
Transport 248.5 218.7 236.2(-0.6) (-5.3) (+8.0)
Travel 256.5 255.0 259.1(+15.8) (-9.0) (+1.6)
Insurance and pension services 7.2 11.2 11.3(+9.3) (+10.6) (+0.5)
Financial services 120.7 138.5 156.5(+7.8) (-6.8) (+12.9)
Other services 131.1 141.4 147.3(+8.7) (+1.7) (+4.1)
Total 764.0 764.8 810.3(+7.5) (-5.5) (+5.9)
Imports of services
Transport 142.6 131.4 136.7(+2.3) (-2.1) (+4.1)
Travel 155.7 187.4 198.6(+5.2) (+4.8) (+6.0)
Manufacturing services 138.9 88.2 89.0(-0.4) (-2.0) (+0.9)
Insurance and pension services 9.5 11.0 11.1(+1.9) (-1.9) (§)
Financial services 30.5 36.6 39.2(+1.0) (-1.9) (+7.0)
Other services 117.1 123.5 127.7(+4.9) (+0.6) (+3.4)
Total 594.3 578.1 602.3(+2.8) (+0.7) (+4.2)
Net exports of services 169.8 186.7 208.1
Notes: Figures in brackets refer to percentage changes over the same period of the preceding year.
Figures on exports and imports of services are compiled based on the change of ownership principle in recording goods sent abroad for processing and merchanting under the standards stipulated in the System of National Accounts 2008.
@ Figures are subject to revision later on.
§ Change within ±0.05%.
Sources: National Income Branch and Trade in Services Statistics Section, Census and Statistics Department (For enquiries, please call 2582 5077 or 3903 7415.)

Appendices
375
6
Table 15(Chapter 5: Commerce and Industry)
(a) Position and Flow of Inward Direct Investment by Selected Major Investor Country/Territory(1)
HK$ Billion
Inward direct investment at market value
Major investor Position at end of year Inflow in year(3)
country/territory(2) 2012 2015 2016 2012 2015 2016
British Virgin Islands 3,154.8 4,325.5 4,316.0 191.9 437.5 240.7
Mainland of China 3,568.3 3,270.3 3,241.4 232.7 200.8 256.8
Cayman Islands 136.1 861.7 970.0 12.6 404.3 136.0
Netherlands 671.1 778.7 795.3 37.8 34.4 50.4
Bermuda 615.8 569.7 586.5 73.0 59.4 14.9
Others 1,500.6 2,530.0 2,699.0 -3.7 215.2 212.3
Total 9,646.6 12,335.9 12,608.1 544.3 1,351.5 911.2
(b) Position and Flow of Outward Direct Investment by Selected Major Recipient Country/Territory(4)
HK$ Billion
Outward direct investment at market value
Major recipient Position at end of year Outflow in year(6)
country/territory(5) 2012 2015 2016 2012 2015 2016
Mainland of China 3,671.1 4,701.8 4,822.7 296.6 306.6 234.9
British Virgin Islands 3,911.5 4,840.5 4,658.2 275.4 -16.4 156.6
Cayman Islands 178.4 455.2 495.2 -16.1 224.5 38.2
Bermuda 262.5 227.0 225.0 28.1 24.0 28.1
United Kingdom 214.4 248.5 160.5 12.6 17.1 -68.6
Others 772.3 1,396.4 1,631.3 50.4 0.9 74.2
Total 9,010.2 11,869.4 11,992.8 647.0 556.7 463.4
Notes: (1) Selected based on the position of Hong Kong's inward direct investment from individual investor countries and territories in recent years.
(2) 'Country/Territory' refers to the immediate source economy. It does not necessarily reflect the country or territory from which the funds are initially mobilised.
(3) Negative inflow does not necessarily relate to equity withdrawal. It may be the result of repayment of loans owed to non-resident affiliates.
(4) Selected based on the position of Hong Kong's outward direct investment to individual recipient countries and territories in recent years.
(5) 'Country/Territory' refers to the immediate destination economy. It does not necessarily reflect the country or territory in which the funds are ultimately used.
(6) Negative outflow does not necessarily relate to equity withdrawal. It may be the result of repayment of loans by non-resident affiliates.
Source: Balance of Payments Branch, Census and Statistics Department (For enquiries, please call 3903 7024.)
Appendices
376
6
Table 16(Chapter 5: Commerce and Industry)
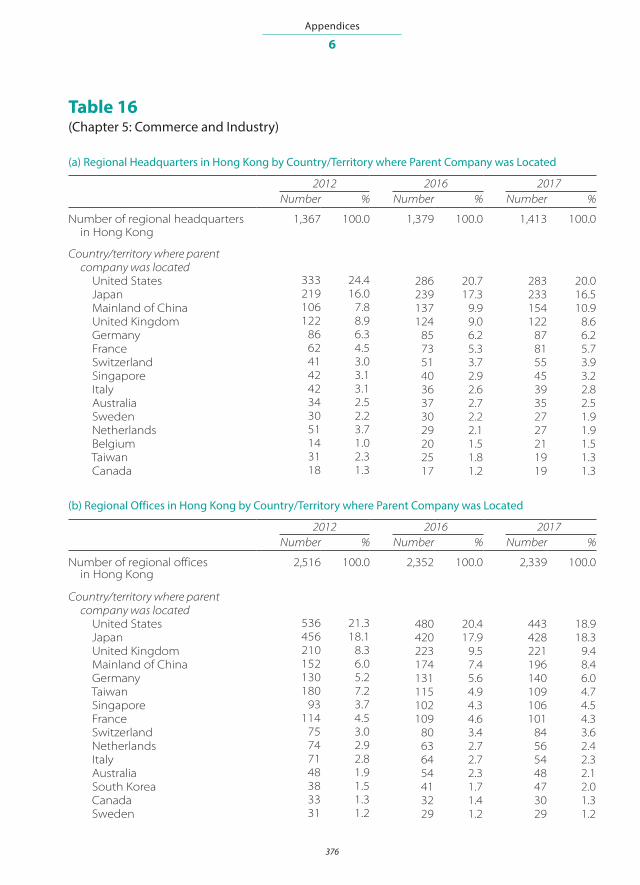
(a) Regional Headquarters in Hong Kong by Country/Territory where Parent Company was Located
2012 2016 2017Number % Number % Number %
Number of regional headquarters 1,367 100.0 1,379 100.0 1,413 100.0 in Hong Kong
Country/territory where parent company was located United States 333 24.4 286 20.7 283 20.0 Japan 219 16.0 239 17.3 233 16.5 Mainland of China 106 7.8 137 9.9 154 10.9 United Kingdom 122 8.9 124 9.0 122 8.6 Germany 86 6.3 85 6.2 87 6.2 France 62 4.5 73 5.3 81 5.7 Switzerland 41 3.0 51 3.7 55 3.9 Singapore 42 3.1 40 2.9 45 3.2 Italy 42 3.1 36 2.6 39 2.8 Australia 34 2.5 37 2.7 35 2.5 Sweden 30 2.2 30 2.2 27 1.9 Netherlands 51 3.7 29 2.1 27 1.9 Belgium 14 1.0 20 1.5 21 1.5 Taiwan 31 2.3 25 1.8 19 1.3 Canada 18 1.3 17 1.2 19 1.3
(b) Regional Offices in Hong Kong by Country/Territory where Parent Company was Located
2012 2016 2017Number % Number % Number %
Number of regional offices in Hong Kong
2,516 100.0 2,352 100.0 2,339 100.0
Country/territory where parent company was located United States 536 21.3 480 20.4 443 18.9 Japan 456 18.1 420 17.9 428 18.3 United Kingdom 210 8.3 223 9.5 221 9.4 Mainland of China 152 6.0 174 7.4 196 8.4 Germany 130 5.2 131 5.6 140 6.0 Taiwan 180 7.2 115 4.9 109 4.7 Singapore 93 3.7 102 4.3 106 4.5 France 114 4.5 109 4.6 101 4.3 Switzerland 75 3.0 80 3.4 84 3.6 Netherlands 74 2.9 63 2.7 56 2.4 Italy 71 2.8 64 2.7 54 2.3 Australia 48 1.9 54 2.3 48 2.1 South Korea 38 1.5 41 1.7 47 2.0 Canada 33 1.3 32 1.4 30 1.3 Sweden 31 1.2 29 1.2 29 1.2

Appendices
377
6
(c) Local Offices in Hong Kong by Country/Territory where Parent Company was Located
2012 2016 2017Number % Number % Number %
Number of local offices in Hong Kong
3,367 100.0 4,255 100.0 4,473 100.0
Country/territory where parent company was located Mainland of China 595 17.7 812 19.1 914 20.4 Japan 543 16.1 717 16.9 717 16.0 United States 519 15.4 587 13.8 587 13.1 United Kingdom 233 6.9 309 7.3 332 7.4 Singapore 192 5.7 240 5.6 257 5.7 Taiwan 239 7.1 247 5.8 253 5.7 France 123 3.7 152 3.6 161 3.6 Germany 116 3.4 141 3.3 155 3.5 Switzerland 101 3.0 113 2.7 99 2.2 Netherlands 78 2.3 98 2.3 95 2.1 South Korea 72 2.1 82 1.9 94 2.1 Australia 80 2.4 88 2.1 91 2.0 Italy 40 1.2 60 1.4 67 1.5 Canada 52 1.5 61 1.4 57 1.3 Malaysia 34 1.0 38 0.9 52 1.2
Notes: Figures refer to the first working day of June of the year.
In the case of a joint-venture regional headquarters, regional office or local office in Hong Kong, there may be more than one country or territory where its parent company was located.
Source: Business Expectation Statistics Section, Census and Statistics Department (For enquiries, please call 3903 7263.)

Appendices
378
6
Table 17(Chapter 7: Employment)
Labour Force, Labour Force Participation Rate, Unemployment and Underemployment
2012 2016 2017
Labour Force(1) (’000) Age Group Under 25 323 319 300 25-44 1,908 1,900 1,913 45-64 1,486 1,593 1,607 65 and over 65 109 127 Total 3,782 3,920 3,947 Sex Male 1,971 1,996 1,994 Female 1,811 1,924 1,952 Total 3,782 3,920 3,947
Labour Force Participation Rate (%) Male 68.7 68.6 68.3 Female 53.5 54.8 55.1 Overall 60.5 61.1 61.1
Unemployment Unemployed persons (’000) 124 133 123 Unemployment rate (%) 3.3 3.4 3.1
Underemployment Underemployed persons (’000) 57 55 46 Underemployment rate (%) 1.5 1.4 1.2
Notes: Figures are compiled based on data collected in the General Household Survey from January to December of the year concerned as well as mid-year population estimates.
(1) 'Labour force' refers to the land-based non-institutional population aged 15 and over who satisfy the criteria for being classified as employed population or unemployed population.
Source: Social Analysis and Research Section, Census and Statistics Department (For enquiries, please call 2887 5508.)

Appendices
379
6
Table 18(Chapter 7: Employment)
Number of Establishments and Persons Engaged (other than those in Civil Service) by Industry, and Number of Construction Sites and Manual Workers at Construction Sites
2012 2016 2017
Number of Number of Number ofNumber of persons Number of persons Number of persons
Industry (1) establishments engaged establishments engaged establishments engaged
Mining and quarrying 2 73 2 61 2 49Manufacturing 11,716 105,308 10,032 94,856 9,553 91,442Electricity and gas supply, and 371 10,275 390 11,190 397 11,228 waste managementImport/export, wholesale 180,019 814,874 177,892 809,144 177,319 807,499 and retail trades Import and export trade 101,342 491,260 100,587 480,963 100,523 477,820 Wholesale 14,768 63,368 13,579 60,647 13,574 60,415 Retail 63,909 260,246 63,726 267,534 63,222 269,264Accommodation(2) and food 16,971 274,195 17,896 282,879 18,159 283,505 services Accommodation services(2) 1,068 38,193 1,234 39,566 1,242 39,884 Food and beverage services 15,903 236,002 16,662 243,313 16,917 243,621Transportation, storage, 9,569 167,241 9,713 178,802 9,833 180,251 postal and courier servicesInformation and 11,368 97,230 13,155 107,342 14,109 107,122 communicationsFinancing and insurance 21,271 207,700 24,379 222,720 25,792 227,156Real estate 14,673 125,938 15,991 130,033 16,486 131,855Professional and business 40,557 337,408 46,632 372,421 47,591 377,659 servicesSocial and personal services 42,732 454,210 49,885 507,952 51,005 517,373
All industries above 349,249 2,594,452 365,967 2,717,400 370,246 2,735,139
Construction sites(3) 1,158 70,578 1,391 112,370 1,439 122,761
Notes: Figures refer to the end of December of the year.
Figures are based on the Quarterly Survey of Employment and Vacancies and the Quarterly Employment Survey of Construction Sites conducted by the Census and Statistics Department.
(1) Figures in this table do not cover establishments and persons engaged in the following activities: (i) Agriculture, forestry and fishing (entire industry section). (ii) Construction (other than construction sites). (iii) Hawkers and retail pitches (other than market stalls). (iv) Taxis, public light buses, and part of goods vehicles and inland freight water transport. (v) Monetary authorities and self-employed insurance agents with no business registration. (vi) Renting and leasing of recreational and sports goods. (vii) Public administration (entire industry section). (viii) Work activities within domestic households; activities of extraterritorial organisations and bodies; and religious organisations, authors
and other independent artists, and some social and personal services.
(2) 'Accommodation services' refers to hotels, guesthouses, boarding houses and other establishments providing short-term accommodation.
(3) For construction sites, 'establishments' refers to the number of sites while 'persons engaged' refers to manual workers only. Manual workers at construction sites include skilled, semi-skilled and general workers.
Source: Employment Statistics and Central Register of Establishments Section, Census and Statistics Department (For enquiries, please call 2582 5076.)

Appendices
380
6
Table 19(Chapter 7: Employment)
Wage Indices for Employees up to Supervisory Level (Excluding Managerial and Professional Employees) by Industry
Wage Index(September 1992=100)
Industry 2012 2016 2017
Nominal Wage Index
Manufacturing 172.8 206.8 214.8(+1.6) (+3.9) (+3.9)
Import/export, wholesale and retail trades 195.1 216.3 222.8 (+3.7) (+2.8) (+3.0) Transportation 166.4 195.3 200.8
(+2.9) (+3.3) (+2.8) Accommodation(1) and food services 163.2 195.1 204.2 (+8.4) (+4.8) (+4.7) Financing and insurance 201.8 230.0 238.2 (+6.1) (+3.2) (+3.6) Real estate leasing and maintenance management 199.8 239.9 250.8 (+7.1) (+3.5) (+4.5) Professional and business services 192.7 247.5 258.8 (+3.7) (+4.5) (+4.6) Personal services 240.7 301.9 313.9
(+8.4) (+4.9) (+4.0) All selected industries(2) 187.5 219.6 227.9
(+5.1) (+3.6) (+3.8)
Real Wage Index
Manufacturing 109.6 113.6 116.1(-2.5) (+2.8) (+2.2)
Import/export, wholesale and retail trades 123.7 118.8 120.4 (-0.5) (+1.7) (+1.3) Transportation 105.5 107.3 108.5
(-1.3) (+2.2) (+1.1) Accommodation(1) and food services 103.5 107.2 110.4 (+4.0) (+3.7) (+3.0) Financing and insurance 128.0 126.3 128.7 (+1.8) (+2.1) (+1.9) Real estate leasing and maintenance management 126.7 131.8 135.6 (+2.7) (+2.4) (+2.8) Professional and business services 122.2 135.9 139.9 (-0.5) (+3.4) (+2.9) Personal services 152.6 165.8 169.6
(+4.0) (+3.8) (+2.3) All selected industries(2) 118.9 120.7 123.2
(+0.9) (+2.5) (+2.1)
Notes: Figures refer to December of the year. Figures in brackets refer to percentage changes over the same period of the preceding year.
Real Wage Index is derived by deflating the corresponding nominal index by the 2014/15-based CPI(A).
(1) 'Accommodation services' refers to hotels, guesthouses, boarding houses and other establishments providing short-term accommodation.
(2) Figures refer to all industries covered by the Wage Enquiry of the Labour Earnings Survey, including the electricity and gas supply industry, sewerage and waste management activities industry and publishing activities industry, the statistics of which are not shown separately.
Source: Wages and Labour Costs Statistics Section, Census and Statistics Department (For enquiries, please call 2887 5550.)

Appendices
381
6
Table 20(Chapter 7: Employment)
Employed Persons by Monthly Employment Earnings
Thousands
Monthly employment earnings (HK$) 2012 2016 2017
<3,000 106.5 101.6 96.63,000-3,999 292.6 45.9 42.94,000-4,999 71.8 327.2 327.45,000-5,999 65.5 63.0 65.66,000-6,999 120.5 59.6 54.67,000-7,999 167.8 69.1 58.68,000-8,999 260.9 125.4 99.19,000-9,999 250.7 151.6 124.910,000-13,999 722.1 735.5 682.514,000-19,999 531.7 702.1 759.420,000-29,999 467.4 596.7 638.330,000-39,999 248.2 314.3 334.9>–40,000 352.2 495.1 538.5
Total 3,658.0 3,787.1 3,823.2
Median monthly employment earnings (HK$) 12,000 15,000 15,500
Note: Figures are compiled based on data collected in the General Household Survey from January to December of the year concerned as well as mid-year population estimates.
Source: Social Analysis and Research Section, Census and Statistics Department (For enquiries, please call 2887 5508.)
Appendices
382
6
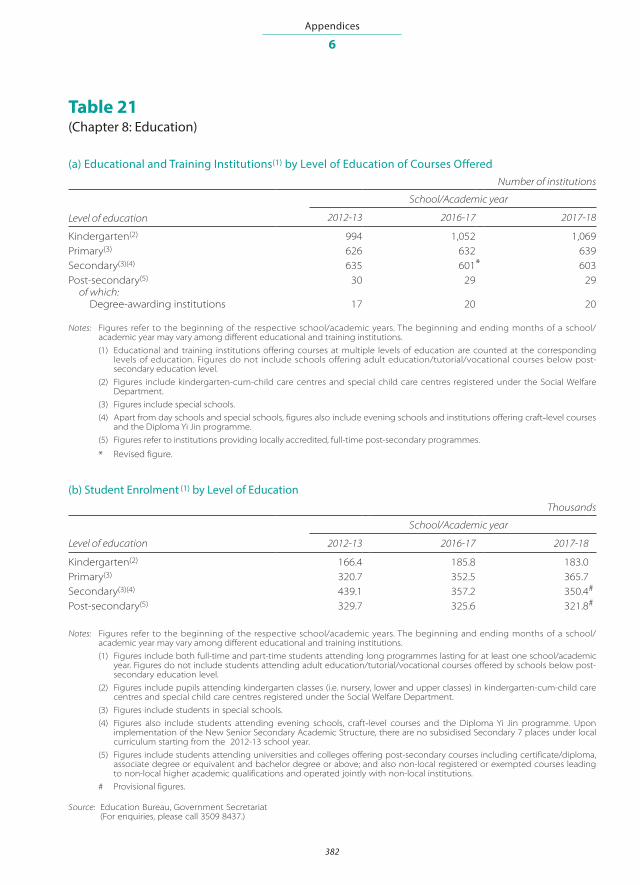
Table 21(Chapter 8: Education)
(a) Educational and Training Institutions(1) by Level of Education of Courses OfferedNumber of institutions
School/Academic year
Level of education 2012-13 2016-17 2017-18
Kindergarten(2) 994 1,052 1,069Primary(3) 626 632 639Secondary(3)(4) 635 601* 603Post-secondary(5) 30 29 29 of which: Degree-awarding institutions 17 20 20
Notes: Figures refer to the beginning of the respective school/academic years. The beginning and ending months of a school/academic year may vary among different educational and training institutions.
(1) Educational and training institutions offering courses at multiple levels of education are counted at the corresponding levels of education. Figures do not include schools offering adult education/tutorial/vocational courses below post-secondary education level.
(2) Figures include kindergarten-cum-child care centres and special child care centres registered under the Social Welfare Department.
(3) Figures include special schools.
(4) Apart from day schools and special schools, figures also include evening schools and institutions offering craft-level courses and the Diploma Yi Jin programme.
(5) Figures refer to institutions providing locally accredited, full-time post-secondary programmes.
* Revised figure.
(b) Student Enrolment (1) by Level of EducationThousands
School/Academic year
Level of education 2012-13 2016-17 2017-18
Kindergarten(2) 166.4 185.8 183.0Primary(3) 320.7 352.5 365.7Secondary(3)(4) 439.1 357.2 350.4#
Post-secondary(5) 329.7 325.6 321.8#
Notes: Figures refer to the beginning of the respective school/academic years. The beginning and ending months of a school/academic year may vary among different educational and training institutions.
(1) Figures include both full-time and part-time students attending long programmes lasting for at least one school/academic year. Figures do not include students attending adult education/tutorial/vocational courses offered by schools below post-secondary education level.
(2) Figures include pupils attending kindergarten classes (i.e. nursery, lower and upper classes) in kindergarten-cum-child care centres and special child care centres registered under the Social Welfare Department.
(3) Figures include students in special schools.
(4) Figures also include students attending evening schools, craft-level courses and the Diploma Yi Jin programme. Upon implementation of the New Senior Secondary Academic Structure, there are no subsidised Secondary 7 places under local curriculum starting from the 2012-13 school year.
(5) Figures include students attending universities and colleges offering post-secondary courses including certificate/diploma, associate degree or equivalent and bachelor degree or above; and also non-local registered or exempted courses leading to non-local higher academic qualifications and operated jointly with non-local institutions.
# Provisional figures.
Source: Education Bureau, Government Secretariat (For enquiries, please call 3509 8437.)

Appendices
383
6
Table 22(Chapter 8: Education)
Distribution of Educational Attainment of Population Aged 15 and OverPercentages
Educational attainment 2012 2016 2017
Primary and below 20.6 18.7 18.2
Secondary 51.6 49.7 49.7
Post-secondary Diploma/Certificate course 3.7 2.6 2.4
Sub-degree course 3.9 5.0 5.0
Degree course 20.2 24.0 24.8
Total 100.0 100.0 100.0
Note: Figures are compiled based on data collected in the General Household Survey from January to December of the year concerned as well as mid-year population estimates.
Source: Social Analysis and Research Section, Census and Statistics Department (For enquiries, please call 2887 5508.)
Table 23(Chapter 8: Education)
Government Expenditure on Education
Financial year (April-March)
2012-13 2016-17
Revised estimates
2017-18
Total expenditure on education (HK$ million) 76,600 82,436 88,507 As percentage of total government expenditure (%) 20.3 17.8 18.7 As percentage of GDP (%) 3.8 3.3@ 3.3@
Recurrent expenditure on education (HK$ million) 60,449 75,533 80,141 Spent on (%) Primary education 21.2 22.6 22.8 Secondary education 37.4 34.3 33.2 Post-secondary education 26.2 27.3 26.8 Others(1) 15.2 15.8 17.2
Notes: (1) Others include government recurrent expenditure on pre-primary education, special education, vocational and professional education and bureau support.
@ Figures are subject to revision later on.
Source: Education Bureau, Government Secretariat (For enquiries, please call 2892 6267.)

Appendices
384
6
Table 24(Chapter 9: Health)
Population and Vital Events
2012 2016 2017
Mid-year population 7,150,100 7,336,600 7,391,700Crude birth rate (per 1,000 population) 12.8 8.3 7.7#
Crude death rate (per 1,000 population) 6.1 6.4 6.3#
Infant mortality rate(1) (per 1,000 registered 1.5 1.7 1.6#
live births)Neonatal (aged under four weeks) mortality 0.9 1.1 1.1#
rate(1) (per 1,000 registered live births)Post-neonatal (aged from four weeks to under 0.6 0.6 0.5#
one year) mortality rate(1) (per 1,000 registered live births)Maternal mortality ratio(1) (per 100,000 2.2 0.0 1.8#
registered live births)Expectation of life at birth (years) Male 80.7 81.3 81.7#
Female 86.4 87.3 87.7#
Notes: (1) Figures are derived based on registered deaths. # Provisional figures.
Sources: Demographic Statistics Section, Census and Statistics Department (For enquiries, please call 3903 6943.) Department of Health (For enquiries, please call 2961 8569.)
Table 25(Chapter 9: Health)
Registered Deaths and Death Rate by Leading Cause of Death
2012 2016 2017#
Cause Number Rate(1) Number Rate(1) Number Rate(1)
Malignant neoplasms 13,336 186.5 14,209 193.7 14,310 193.6Pneumonia 6,960 97.3 8,292 113.0 7,957 107.6Diseases of heart 6,283 87.9 6,201 84.5 6,117 82.8Cerebrovascular diseases 3,276 45.8 3,224 43.9 3,123 42.3External causes of morbidity 1,655 23.1 1,813 24.7 1,063 14.4 and mortality
Notes: The ranking of causes of death is in accordance with the number of registered deaths in 2016. (1) Death rate per 100,000 population. # Provisional figures.
Source: Department of Health (For enquiries, please call 2961 8569.)

Appendices
385
6
Table 26(Chapter 9: Health)
Hospital Beds and Selected Types of Registered Healthcare Professionals
2012 2016 2017
Number Rate(1) Number Rate(1) Number Rate(1)#
Hospital beds Ordinance definition(2) 36,579 5.1 39,090 5.3 39,683 5.4 OECD definition(3) 28,471 4.0 29,553 4.0 30,159 4.1
Doctors(4) 13,006 1.8 14,013 1.9 14,290 1.9
Chinese medicine practitioners Registered Chinese medicine 6,565 0.9 7,262 1.0 7,425 1.0 practitioners(5)
Chinese medicine practitioners with 74 § 47 § 38 § limited registration(6)
Listed Chinese medicine 2,733 0.4 2,647 0.4 2,623 0.4 practitioners(7)
Dentists(4) 2,258 0.3 2,441 0.3 2,500 0.3
Nurses(8) 43,698 6.1 52,389 7.1 54,231 7.3
Midwives 4,504 0.6 4,540 0.6 4,611 0.6
Pharmacists 2,127 0.3 2,659 0.4 2,753 0.4
Chiropractors 172 § 209 § 218 §
Notes: Figures are as at the end of the year. (1) Figures refer to the rates per 1,000 population. (2) Figures include all hospital beds in Hospital Authority hospitals, private hospitals, nursing homes and correctional
institutions, which follow the coverage of the Hospitals, Nursing Homes and Maternity Homes Registration Ordinance.
(3) Figures include only hospital beds in Hospital Authority hospitals and private hospitals excluding accident and emergency observation beds, day beds and nursery beds, which follow the definition of the Organisation for Economic Cooperation and Development (OECD).
(4) Figures refer to the doctors and dentists with full registration on local and overseas lists. (5) After full implementation of the Chinese Medicine Ordinance, all Chinese medicine practitioners (CMPs) should be
registered before they can practise Chinese medicine in Hong Kong. Any person who wishes to be a registered CMP should have satisfactorily completed an approved undergraduate degree course of training in Chinese medicine practice, and taken and passed the Licensing Examination.
(6) CMPs with limited registration are allowed to perform clinical teaching and research in Chinese medicine in the specified educational and scientific research institutions. Their registration period should not exceed one year and they cannot engage in private practice with patients.
(7) Listed CMPs can practise lawfully in Hong Kong under the transitional arrangements for registration of CMPs until a date to be announced by the Secretary for Food and Health in the Gazette. Listed CMPs may become registered CMPs through direct registration, registration assessment or the Licensing Examination during the transitional arrangements.
(8) Figures refer to registered nurses and enrolled nurses. # Provisional figures. § Less than 0.05.
Sources: Department of Health (For enquiries, please call 2961 8582.) Hospital Authority (For enquiries, please call 2300 7458.)

Appendices
386
6
Table 27(Chapter 11: Social Welfare)
Social Security
2012 2016 2017
Comprehensive Social Security Assistance Scheme Number of cases(1) (’000) 269 237 232 Amount of payment(2) (HK$ million) 19,548 22,313 22,308
Social Security Allowance Scheme Disability Allowance(3)
Number of cases(1) (’000) 147 141 146 Amount of payment(2) (HK$ million) 2,850 3,548 3,703
Old Age Allowance(3)
Number of cases(1) (’000) 539 236 246 Amount of payment(2) (HK$ million) 6,894 3,756 3,884
Guangdong Scheme(4)
Number of cases(1) (’000) — 15 16 Amount of payment(2) (HK$ million) — 282 256
Old Age Living Allowance(3)
Number of cases(1) (’000) — 443 474 Amount of payment(2) (HK$ million) — 14,087 14,280
Traffic Accident Victims Assistance Scheme Number of cases authorised for payment 7,579 7,292 6,755 Amount of payment(2) (HK$ million) 170 229 254
Notes: (1) Figures are as at the end of the year. (2) Figures refer to the financial years of 2011-12, 2015-16 and 2016-17. (3) The Old Age Living Allowance (OALA) was launched in 2013. Eligible Old Age Allowance recipients and Normal
Disability Allowance recipients aged 65 or above were gradually converted to receive OALA payment with effect from April 2013.
(4) The Guangdong Scheme was launched in 2013.
Source: Social Welfare Department (For enquiries, please call 2892 5242.)

Appendices
387
6
Table 28(Chapter 12: Housing)
(a) Stock of Permanent Living Quarters(1) (2) as at Mid-2017
Hong Kong NewType of quarters Island Kowloon Territories Total
Public rental housing units 71,500 315,500 419,200 806,200Subsidised sale flats 45,600 94,700 263,100 403,500Private permanent quarters(3) 365,700 442,700 763,200 1,571,700
Total permanent living quarters 482,800 853,000 1,445,600 2,781,400
(b) Estimated Population by Type of Housing as at Mid-2017
Hong Kong NewType of housing Island Kowloon Territories Total
Public rental housing 194,000 833,700 1,137,600 2,165,300Subsidised home ownership housing 131,700 268,200 773,300 1,173,200Private permanent housing 892,300 1,111,000 1,876,400 3,879,700
Sub-total 1,218,000 2,212,800 3,787,300 7,218,200
Others(4) 173,600
Total population 7,391,700
Notes: All figures are rounded off to the nearest hundred.
(1) While the vast majority of permanent living quarters are occupied by domestic households, a small proportion are occupied by non-Hong Kong residents or are not used as usual accommodation. Accordingly, statistics on permanent living quarters should not be compared directly with statistics on domestic households derived from the population censuses/by-censuses or the General Household Survey for the purpose of assessing the vacancy situation of housing units. The main reason is that households comprising only non-Hong Kong residents or Mobile Residents are not classified as domestic households. As regards statistics related to the housing vacancy situation, the Rating and Valuation Department compiles the vacancy rate of private domestic units regularly and publishes the statistics in the Hong Kong Property Review.
(2) Excluding hotels and accommodation used for inmates of institutions.
(3) Including private residential flats, villas/bungalows/modern village houses, simple stone structures/traditional village houses, quarters in purpose-built staff quarters buildings and quarters known to be used for residential purpose in non-residential buildings, such as commercial buildings and industrial buildings.
(4) Including persons living in non-domestic housing, private temporary housing, institutions and hotels, and on board vessels.
Source: Census Planning Section, Census and Statistics Department (For enquiries, please call 3903 6958.)

Appendices
388
6
Table 29(Chapter 13: Planning, Land and Infrastructure)
Land Usage Distribution as at End-2017
ApproximateClass area (km2) % Remarks
Residential Private Residential 26 2.3 Including residential area developed by private
developers (excluding village houses, subsidised housing and temporary housing area).
Public Residential 16 1.4 Including subsidised housing and temporary housing area.
Rural Settlement 35 3.2 Including village housing and temporary structures.
Commercial Commercial/Business and Office 5 0.5
Industrial Industrial Land 7 0.6 Industrial Estates 3 0.3 Warehouse and Open Storage 16 1.4
Institutional/Open Space Government, Institutional and 26 2.3 Community Facilities Open Space 25 2.3 Including parks, stadiums, playgrounds and
recreational facilities.
Transportation Roads 41 3.7 Railways 3 0.3 Airport 13 1.2
Other Urban or Built-up Land Cemeteries and Crematoria 8 0.7 Utilities 8 0.7 Vacant Land/Construction in Progress 17 1.5 Others 22 2.0
Agriculture Agricultural Land 51 4.6 Fish Ponds/Gei Wais 17 1.5
Woodland/Shrubland/Grassland/Wetland Woodland 277 24.9 Shrubland 263 23.7 Grassland 190 17.1 Mangrove/Swamp 5 0.4
Barren Land Badland 2 0.2 Quarries 1 0.1 Rocky Shore 4 0.4
Water Bodies Reservoirs 25 2.3 Streams and Nullahs 5 0.4
Total 1,111 100.0 Including about 4km2 of mangrove and swamp below the High Water Mark.
Note: The land use data was compiled using satellite images dated December 2017 (©AIRBUS DS (2017)), in-house survey information of the Planning Department up to end-2017 and other relevant information from various government departments. As definitions of some land use classes and methodology are updated from time to time, the figures this year may not be comparable directly to those provided in previous years.
Source: Planning Department (For enquiries, please call 2231 5000.)

Appendices
389
6
Table 30(Chapter 13: Planning, Land and Infrastructure)
Property Transactions
2012 2016 2017
Value of registered Agreements for Sale and Purchase of property (HK$ billion) Residential property 452.3 428.0 556.3 Non-residential property 201.7 104.8 170.1
Total 654.0 532.9 726.4
Property price index(1) (Year 1999 = 100) Private domestic units 206.2 286.1 333.9#
Private offices (grades A, B and C) 334.7 426.9 487.0#
Property rental index(1) (Year 1999 = 100) Private domestic units 142.6 168.2 182.6#
Private offices (grades A, B and C) 188.3 232.3 241.8#
Notes: (1) Figures are annual indices. # Provisional figures.
Sources: Land Registry (For enquiries, please call 2867 4838.) Rating and Valuation Department (For enquiries, please call 2150 8901.)
Table 31(Chapter 13: Planning, Land and Infrastructure)
Water Consumption
Million cubic metres
2012 2016 2017
Fresh water 935 987 980Sea water (flushing purposes) 273 260 278
Source: Water Supplies Department (For enquiries, please call 2829 4709.)

Appendices
390
6
Table 32(Chapter 14: Transport)
(a) Inward and Outward Movements of Aircraft and Vessels
2012 2016 2017
Aircraft (’000) 352 412 421Ocean vessels (million net registered tonnage) 832 810 835River vessels (million net registered tonnage) 205 232 246
Note: Including both cargo and passenger aircraft and vessels.
Sources: Civil Aviation Department (For enquiries, please call 2910 6673.) Marine Department (For enquiries, please call 2852 3659.)
(b) Inward and Outward Movements of Cargo
Thousand tonnes
2012 2016 2017
Discharged By air(1) 1,463 1,648 1,724 By water(2) 154,699 150,774 174,578 By ocean 117,448 110,291 118,873 By river 37,251 40,483 55,705 By road 15,978 14,267* 14,555
Total 172,140 166,690* 190,858
Loaded By air(1) 2,562 2,873 3,214 By water(2) 114,583 105,956 106,967 By ocean 71,412 53,794 58,017 By river 43,172 52,163 48,951 By road 10,237 7,637* 7,590
Total 127,383 116,466* 117,771
Notes: (1) Excluding mail. (2) 'Ocean' refers to transport by vessels operating beyond river trade limits, while 'river' refers to transport by vessels
plying within river trade limits. * Revised figures.
Sources: Civil Aviation Department Customs and Excise Department Outward Processing and Shipping Statistics Section, Census and Statistics Department (For enquiries, please call the Census and Statistics Department on 2582 4068.)

Appendices
391
6
(c) Port Container Throughput
Thousand TEUs
2012 2016 2017
Kwai Tsing Container Terminals 17,475 15,203 16,236 Inward 8,814 7,907 8,456 Outward 8,662 7,296 7,780
Other than Kwai Tsing Container Terminals 5,642 4,609 4,534 Inward 2,893 2,399 2,312 Outward 2,749 2,211 2,223
Total 23,117 19,813 20,770 Inward 11,707 10,306 10,768 Outward 11,411 9,507 10,003
Note: TEU refers to a 20-foot equivalent unit.
Sources: Marine Department Outward Processing and Shipping Statistics Section, Census and Statistics Department (For enquiries, please call the Marine Department on 2852 3659.)
(d) Arrivals and Departures of Passengers by Mode of Transport
Thousands
Mode of transport 2012 2016 2017
Arrivals By air(1) 19,383 24,711 25,892 By sea 12,609 12,208 12,002 By land 101,955 111,475 111,861
Total 133,948 148,393 149,755
Departures By air(1) 18,466 23,973 25,090 By sea 14,693 14,482 14,773 By land 100,620 109,848 109,814
Total 133,778 148,303 149,677
Note: (1) Including helicopter passengers to and from Macao.
Source: Immigration Department (For enquiries, please call 2824 6111.)

Appendices
392
6
Table 33(Chapter 14: Transport)
(a) Motor Vehicles Licensed by Type
Thousands
Type 2012 2016 2017
Private cars 455 536 553Motorcycles (including motor tricycles) 40 50 53Taxis 18 18 18Buses, public and private 13 14 14Light buses, public and private 7 7 7Goods vehicles 113 112 113Special purpose vehicles 1 2 2Government vehicles (excluding military vehicles) 6 6 6
Total 653 746 766
Note: Figures are as at the end of the year.
(b) Public Transport: Average Daily Passenger Journeys by Different Modes of Transport
Thousands
2012 2016 2017
Franchised Bus 3,833 3,957 3,967Mass Transit Railway (MTR) 4,255 4,699 4,851MTR Bus (northwest New Territories) 126 138 139Red Minibus and Green Minibus 1,880 1,835 1,821#
Taxi 956 933 897#
Tramway(1) 202 177 172Light Rail 457 488 489Ferry(2) 135 131 128Residents’ Services 234 234 233#
Total 12,079 12,591 12,697#
Notes: (1) These figures do not include the Peak Tram. (2) 'Ferry' includes franchised and licensed services but excludes kaitos. # Provisional figures.
Source: Transport Department (For enquiries, please call 2804 2600.)
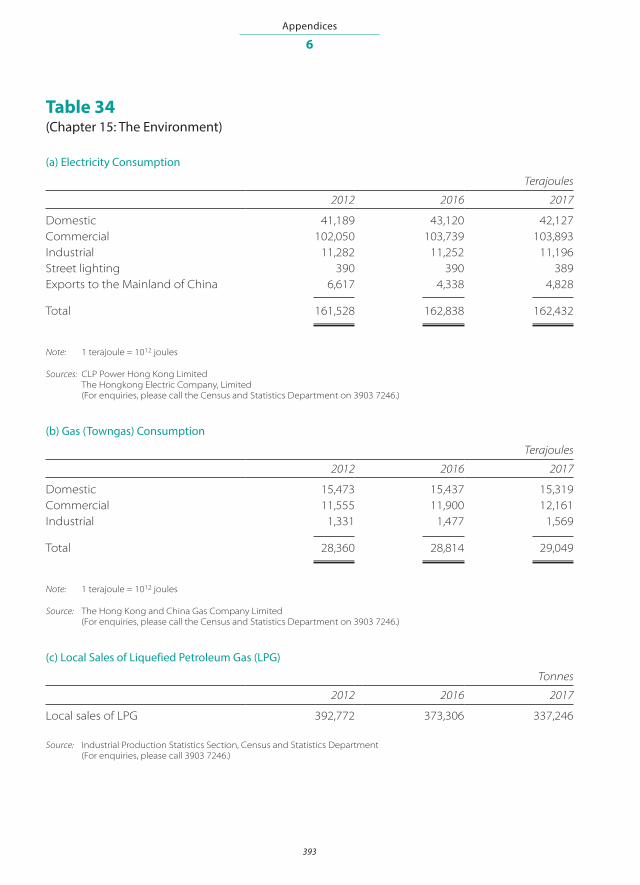
Appendices
393
6
Table 34(Chapter 15: The Environment)
(a) Electricity Consumption
Terajoules
2012 2016 2017
Domestic 41,189 43,120 42,127Commercial 102,050 103,739 103,893Industrial 11,282 11,252 11,196Street lighting 390 390 389Exports to the Mainland of China 6,617 4,338 4,828
Total 161,528 162,838 162,432
Note: 1 terajoule = 1012 joules
Sources: CLP Power Hong Kong Limited The Hongkong Electric Company, Limited (For enquiries, please call the Census and Statistics Department on 3903 7246.)
(b) Gas (Towngas) Consumption
Terajoules
2012 2016 2017
Domestic 15,473 15,437 15,319Commercial 11,555 11,900 12,161Industrial 1,331 1,477 1,569
Total 28,360 28,814 29,049
Note: 1 terajoule = 1012 joules
Source: The Hong Kong and China Gas Company Limited (For enquiries, please call the Census and Statistics Department on 3903 7246.)
(c) Local Sales of Liquefied Petroleum Gas (LPG)
Tonnes
2012 2016 2017
Local sales of LPG 392,772 373,306 337,246
Source: Industrial Production Statistics Section, Census and Statistics Department (For enquiries, please call 3903 7246.)
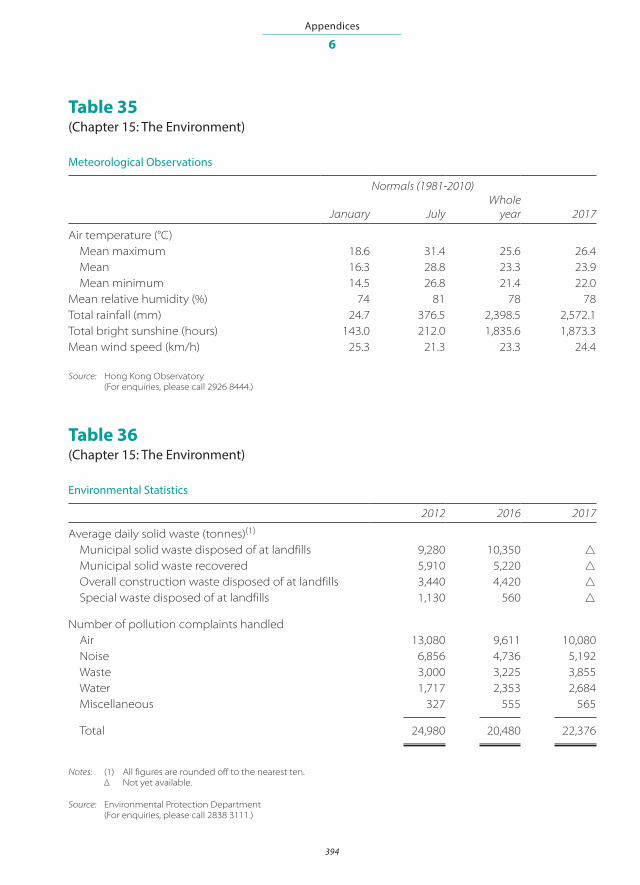
Appendices
394
6
Table 35(Chapter 15: The Environment)
Meteorological Observations
Normals (1981-2010)Whole
January July year 2017
Air temperature (°C) Mean maximum 18.6 31.4 25.6 26.4 Mean 16.3 28.8 23.3 23.9 Mean minimum 14.5 26.8 21.4 22.0Mean relative humidity (%) 74 81 78 78Total rainfall (mm) 24.7 376.5 2,398.5 2,572.1Total bright sunshine (hours) 143.0 212.0 1,835.6 1,873.3Mean wind speed (km/h) 25.3 21.3 23.3 24.4
Source: Hong Kong Observatory (For enquiries, please call 2926 8444.)
Table 36(Chapter 15: The Environment)
Environmental Statistics
2012 2016 2017
Average daily solid waste (tonnes)(1)
Municipal solid waste disposed of at landfills 9,280 10,350 △
Municipal solid waste recovered 5,910 5,220 △
Overall construction waste disposed of at landfills 3,440 4,420 △
Special waste disposed of at landfills 1,130 560 △
Number of pollution complaints handled Air 13,080 9,611 10,080 Noise 6,856 4,736 5,192 Waste 3,000 3,225 3,855 Water 1,717 2,353 2,684 Miscellaneous 327 555 565
Total 24,980 20,480 22,376
Notes: (1) All figures are rounded off to the nearest ten. ∆ Not yet available.
Source: Environmental Protection Department (For enquiries, please call 2838 3111.)
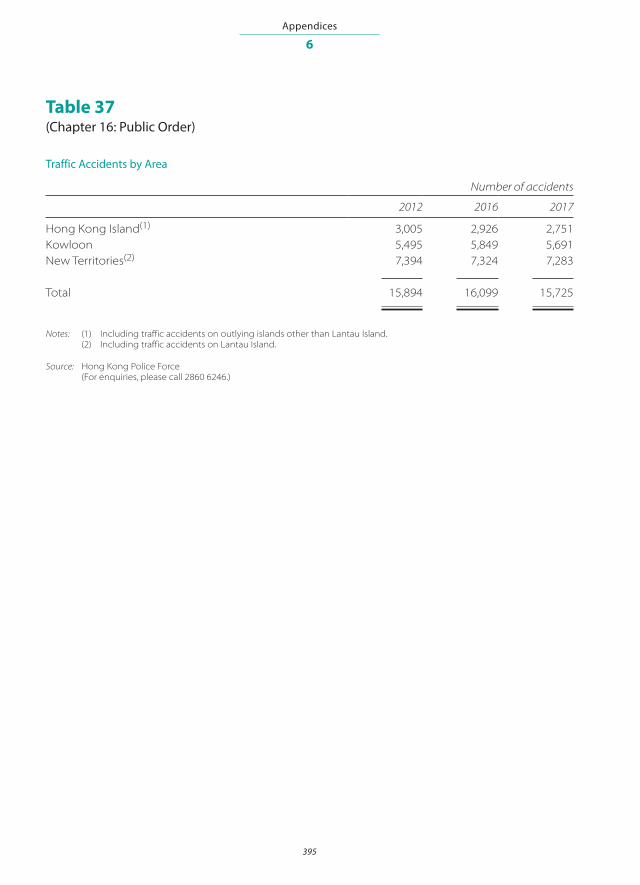
Appendices
395
6
Table 37(Chapter 16: Public Order)
Traffic Accidents by Area
Number of accidents
2012 2016 2017
Hong Kong Island(1) 3,005 2,926 2,751Kowloon 5,495 5,849 5,691New Territories(2) 7,394 7,324 7,283
Total 15,894 16,099 15,725
Notes: (1) Including traffic accidents on outlying islands other than Lantau Island. (2) Including traffic accidents on Lantau Island.
Source: Hong Kong Police Force (For enquiries, please call 2860 6246.)

Appendices
396
6
Table 38(Chapter 16: Public Order)
(a) Reported Crimes by Type of Offence
Cases reported
Type of offence 2012 2016 2017
Violent crime 12,821 10,103 9,086Non-violent crime 63,109 50,543 46,931
Total 75,930 60,646 56,017
Overall crime rate (per 100,000 population) 1,062 827 758Violent crime rate (per 100,000 population) 179 138 123
(b) Persons Arrested for Crime by Type of OffencePersons arrested
Type of offence 2012 2016 2017
Violent crime 9,039 6,474 6,105Non-violent crime 29,576 26,768 24,261
Total 38,615 33,242 30,366
Rate of persons arrested for crime (per 100,000 population aged 10 and over)
581 491 446
Source: Hong Kong Police Force (For enquiries, please call 2860 8448.)
(c) ICAC Cases
Number of persons prosecuted(1)
2012 2016 2017
Pending Convicted Acquitted Others Total
Involving individuals employed in government 11 10 5 7 0 0 12 departments and policy bureaus
Private sector Civilians prosecuted in public-sector cases 19 22 24 10 5 0 39 Civilians prosecuted in private-sector cases 211 163 64 66 7 0 137 Sub-total 230 185 88 76 12 0 176
Public bodies(2) 4 4 4 1 0 0 5
Total 245 199 97 84 12 0 193
Notes: (1) The figures in the above table denote the numbers of prosecutions. If a person is prosecuted in different cases, calculation of the figures will take into account the number of prosecutions made against that person.
(2) As defined in the Prevention of Bribery Ordinance.
Source: Independent Commission Against Corruption (For enquiries, please call 2826 3267.)

Appendices
397
6
Table 39(Chapter 17: Media and Communications)
Access to Information and Communication Technology
2012 2016 2017
Number of telephone lines(1) (thousands) Business 1,846 1,845 1,826 Residential 2,404 2,362 2,325 Total 4,249 4,207 4,151Number of fixed telephone lines per 1,000 population 593 570 560#
Number of facsimile lines (thousands) 214 167 161Number of public mobile subscribers(2) (thousands) 16,393 17,233 18,340
[7,634] [8,161] [8,347]Public mobile subscribers per 1,000 population(2) 2,286 2,336 2,475#
[1,065] [1,106] [1,127]#
Number of 2.5G/3G/4G public mobile subscribers(3) 10,359 15,828 17,053 (thousands)Average volume of mobile data usage 741 1,478 1,787 per 2.5G/3G/4G subscriber per month(4) (megabytes) Number of licensed internet service providers (ISPs)(5) 186 225 233Number of customers of licensed ISPs(6)
Registered customer accounts with dial-up access(7) 794 191 141 (thousands) Registered broadband internet access customer 2,265 2,612 2,646 accounts (thousands)Fixed internet subscribers per 1,000 population 427 380 376#
Fixed broadband internet subscribers 316 354 357#
per 1,000 populationMobile broadband subscribers per 1,000 population 1,352 2,112 2,280#
International internet bandwidth per person 1,315.7 6,110.4 7,821.4#
(kilobits per second)
Notes: Unless otherwise specified, figures are as at the end of the year. (1) Figures include direct dialling in lines, facsimile lines, datel lines and subscribers of Internet Protocol telephony/
voice-over-IP services. (2) Including pre-paid SIM cards. Figures excluding pre-paid SIM cards are presented in square brackets. (3) Figures include subscribers of pre-paid SIM cards. (4) Figures refer to December of the respective years. (5) Including all licensees authorised to provide internet access services. (6) Estimated figures are based on returns from the ISPs and do not include users who are not customers of the
licensed ISPs. (7) Excluding internet pre-paid calling cards. # Provisional figures.
Source: Office of the Communications Authority (For enquiries, please call 2961 6742.)

Appendices
398
6
Table 40(Chapter 17: Media and Communications)
(a) Penetration of Information Technology into Households
Percentages
2012 2016 2017
Households with personal computers at home(1) 80.0 80.6 80.9
Households with personal computers at home connected to 77.9 79.5 80.2the internet(1)
(b) Usage of Information Technology among Household Members
Percentages
2012 2016 2017
Persons aged 10 and over who had used personal computers 72.8 81.5 79.8during the 12 months before enumeration(2)
Persons aged 10 and over who had used the internet 72.9 87.5 89.4during the 12 months before enumeration(2)
Notes: Figures for 2012 refer to June to August, figures for 2016 refer to April to July and figures for 2017 refer to June to September.
(1) As a percentage of all households in Hong Kong. (2) As a percentage of all persons aged 10 and over in Hong Kong.
Source: Social Surveys Section, Census and Statistics Department (For enquiries, please call 2887 5103.)
Table 41(Chapter 17: Media and Communications)
Postal Services
2012 2016 2017
Letter mail (million articles) 1,355 1,217 1,166
Parcels (thousands) 1,468 1,015 890
Source: Hongkong Post (For enquiries, please call 2921 2264.)
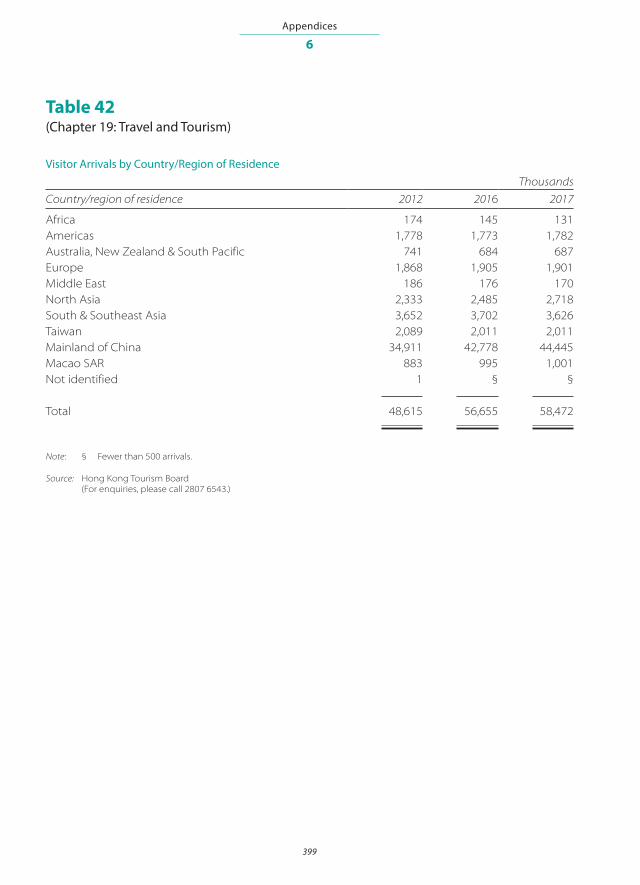
Appendices
399
6
Table 42(Chapter 19: Travel and Tourism)
Visitor Arrivals by Country/Region of ResidenceThousands
Country/region of residence 2012 2016 2017
Africa 174 145 131Americas 1,778 1,773 1,782Australia, New Zealand & South Pacific 741 684 687Europe 1,868 1,905 1,901Middle East 186 176 170North Asia 2,333 2,485 2,718South & Southeast Asia 3,652 3,702 3,626Taiwan 2,089 2,011 2,011Mainland of China 34,911 42,778 44,445Macao SAR 883 995 1,001Not identified 1 § §
Total 48,615 56,655 58,472
Note: § Fewer than 500 arrivals.
Source: Hong Kong Tourism Board (For enquiries, please call 2807 6543.)