appareils mobiles, 2t 2016
TRANSCRIPT

State of Mobile Device Performance and Health
TREND REPORT Q2 2016
August 2016

TABLE OF CONTENTS
INTRODUCTION 3
ABOUT THE DATA POWERING THE REPORT 3
KEY TRENDS & INSIGHTS 4
iOSLosesPerformanceBattletoAndroid,WithiPhone6and 4 iPhone6SPlaguedbyHighFailureRates
LenovoandLeTVBudget-FriendlySmartphonesSurfaceas 5 PoorAndroidPerformers
iOSDevicesFailMoreFrequentlyThanAndroidCounterparts 6 inNorthAmericaandAsia
CrashingApps,WiFiandHeadsetCauseProblemsforiPhoneUsers 7
Camera,BatteryCharging&TouchScreenIssuesAbateon 8 AndroidDevices
iOSAppsCrashatGreaterRateThanAndroidApps 8
Snapchat,InstagramandFacebookTopListofCrashingiOSApps 9
GooglePlayServices,GoogleContactsSyncandAddress 10 BookAndroidAppsCrashMostOften
CONCLUSION 11
ABOUT THE MARKET 11
ABOUT THE TECHNOLOGY POWERING THE REPORT 11
ABOUT BLANCCO TECHNOLOGY GROUP 12
CONTACT US 12
State of Mobile Device Performance and Health | Trend Report: Q2 2016 | August 20162
State of Mobile Device Performance and Health | Trend Report: Q2 2016 | August 20163
AtMobileWorldCongress2016,thethemewassetas‘MobileIsEverything.’Thatstatement,asbroadasitmayseem,isaptlytrueintoday’sdigitallyconnectedworld.Toillustratethis,youonlyhavetolookatthelatestfiguresreleasedbyIDCinitsWorldwideQuarterlyMobilePhoneTrackerreport,whichrevealedthatatotalof343.3millionsmartphoneswereshippedworldwideinthesecondquarterof2016.
Mobileoffersdifferentbenefitsforeachaudienceitserves.Forindividuals,itisadefinitivetoolandextensionoftheireverydaylives–offeringthemaneasy,quickandeffectivewaytocommunicateviaemail,SMS/textandchatapps,takephotos/videosofimportantmoments,browsetheInternet,researchandshoponline,payforgoods/servicesinamatterofsecondswithasingletaporswipeandsomuchmore.
Formobilenetworkoperators/carriersanddevicemanufacturers,itisthebasisfortheirentirebusinessmodel–constitutingproductsalesandplayingakeyroleinimprovingthepost-salescustomerexperience.Forenterprisebusinesses,itisakeytoolinempoweringemployeestostayconnectedevenwhentheyareoutsideoftheofficeperimeters,andintheprocess,stayengaged,meetconstantlychangingprioritiesanddeadlines,increasetheirindividualworkperformanceanddrivegreaterefficienciesandproductivityforthemselves,theirteamsandthebusinessesatlarge.
Foreachoftheseaudiencesthatuseandbenefitfrommobile,poordeviceperformanceistheoneconstantthatcancauseproblems.Inthisreport,wewillsharevariousdatapointsthatindicatekeysourcesofdeviceperformanceissues.
INTRODUCTION
TheState of Mobile Device Performance and Healthreportisanin-depthquarterlyreviewofglobalmobiledevicetrends,including:diagnosticstesting,performanceissuesandfailures.TheinformationcontainedinthisreportisbasedoninternaldatacollectedfromBlanccoTechnologyGroup’sSmartChk platform,thegloballeaderinmobiledevicediagnosticsandbusinessintelligence.Organizationsofalltypescanleveragethisinformationtoensureabettercustomerexperienceandsatisfaction.
Inthisreport,wewillexaminetheroadblockstomobileadoptionbasedondatacollectedfrommillionsofAndroid
andiOSsmartphonesthatunderwentdiagnosticstestinginNorthAmerica,EuropeandAsiaduringthesecondquarterof2016(Q22016).Thereport’sfindingsarebasedonaggregate,anonymizeddataandincludethefollowinginformation:•Devicefailureratesbyoperatingsystems,manufacturers,modelsandregions
•Themostcommontypesofperformanceissues–hardware,softwareandconnectivity–byoperatingsystems
•Thetop10iOSandAndroidappswiththehighestcrashingrates
ABOUTTHEDATAPOWERINGTHEREPORT
343.3MillionIn the second quarter of 2016, a total of 343.3 million smartphones were shipped worldwide.
State of Mobile Device Performance and Health | Trend Report: Q2 2016 | August 20164
iOS Loses Performance Battle to Android, With iPhone 6 and iPhone 6S Plagued by High Failure Rates
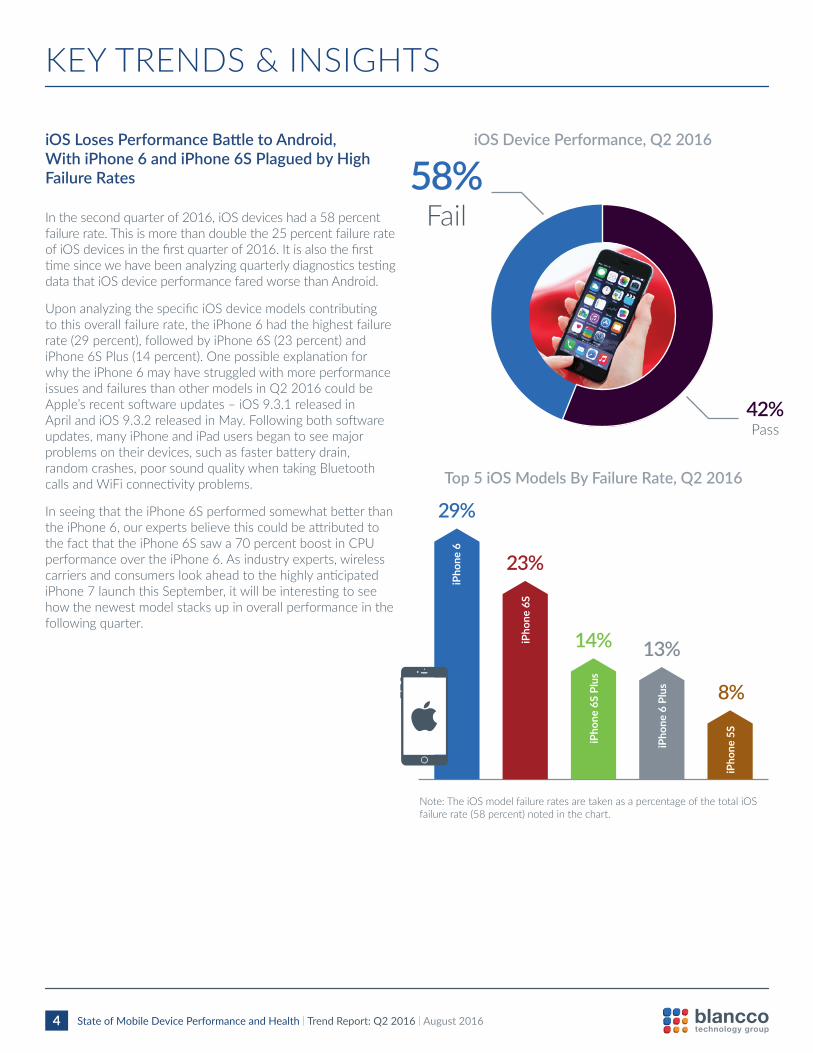
Inthesecondquarterof2016,iOSdeviceshada58percentfailurerate.Thisismorethandoublethe25percentfailurerateofiOSdevicesinthefirstquarterof2016.ItisalsothefirsttimesincewehavebeenanalyzingquarterlydiagnosticstestingdatathatiOSdeviceperformancefaredworsethanAndroid.
UponanalyzingthespecificiOSdevicemodelscontributingtothisoverallfailurerate,theiPhone6hadthehighestfailurerate(29percent),followedbyiPhone6S(23percent)andiPhone6SPlus(14percent).OnepossibleexplanationforwhytheiPhone6mayhavestruggledwithmoreperformanceissuesandfailuresthanothermodelsinQ22016couldbeApple’srecentsoftwareupdates–iOS9.3.1releasedinAprilandiOS9.3.2releasedinMay.Followingbothsoftwareupdates,manyiPhoneandiPadusersbegantoseemajorproblemsontheirdevices,suchasfasterbatterydrain,randomcrashes,poorsoundqualitywhentakingBluetoothcallsandWiFiconnectivityproblems.
InseeingthattheiPhone6SperformedsomewhatbetterthantheiPhone6,ourexpertsbelievethiscouldbeattributedtothefactthattheiPhone6Ssawa70percentboostinCPUperformanceovertheiPhone6.Asindustryexperts,wirelesscarriersandconsumerslookaheadtothehighlyanticipatediPhone7launchthisSeptember,itwillbeinterestingtoseehowthenewestmodelstacksupinoverallperformanceinthefollowingquarter.
KEYTRENDS&INSIGHTS
58%Fail
42%Pass
iOS Device Performance, Q2 2016
29%
23%
14% 13%
8%
iPho
ne 6
iPho
ne 6
S
iPho
ne 6
S Pl
us
iPho
ne 6
Plu
s
iPho
ne 5
S
Top 5 iOS Models By Failure Rate, Q2 2016
Note:TheiOSmodelfailureratesaretakenasapercentageofthetotaliOSfailurerate(58percent)notedinthechart.
State of Mobile Device Performance and Health | Trend Report: Q2 2016 | August 20165
35%Fail
65%Pass
Lenovo and LeTV Budget-Friendly Smartphones Surface as Poor Android Performers
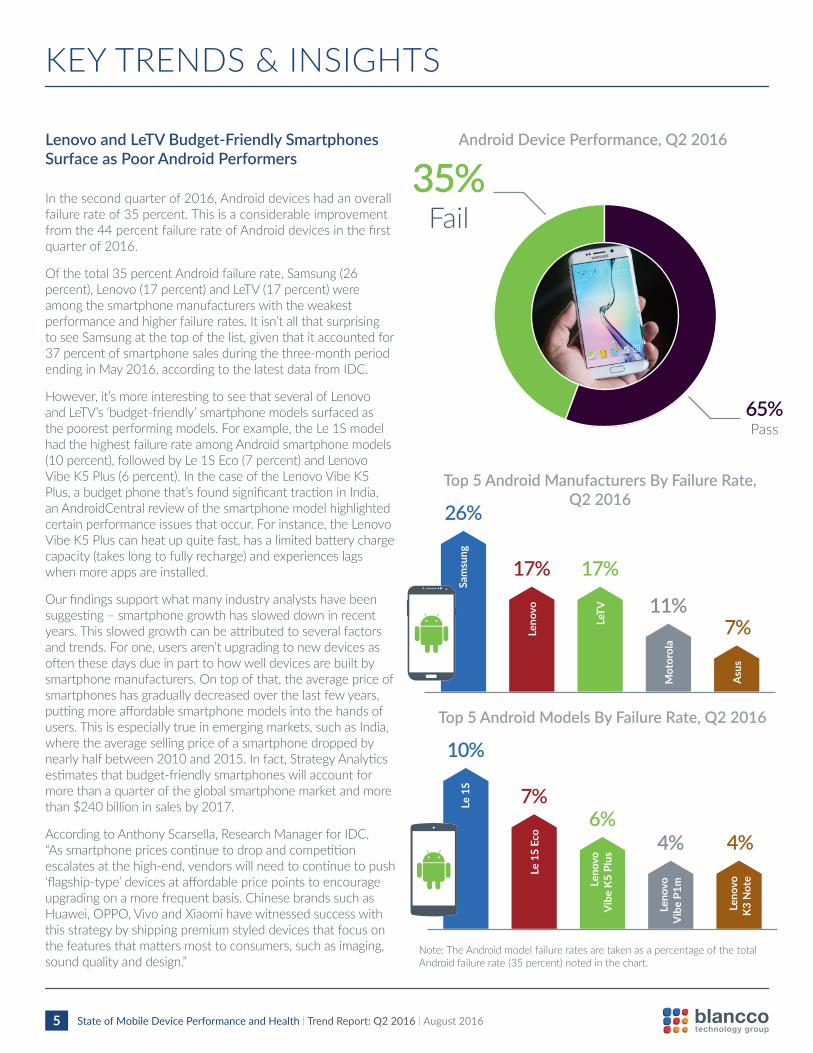
Inthesecondquarterof2016,Androiddeviceshadanoverallfailurerateof35percent.Thisisaconsiderableimprovementfromthe44percentfailurerateofAndroiddevicesinthefirstquarterof2016.
Ofthetotal35percentAndroidfailurerate,Samsung(26percent),Lenovo(17percent)andLeTV(17percent)wereamongthesmartphonemanufacturerswiththeweakestperformanceandhigherfailurerates.Itisn’tallthatsurprisingtoseeSamsungatthetopofthelist,giventhatitaccountedfor37percentofsmartphonesalesduringthethree-monthperiodendinginMay2016,accordingtothelatestdatafromIDC.
However,it’smoreinterestingtoseethatseveralofLenovoandLeTV’s‘budget-friendly’smartphonemodelssurfacedasthepoorestperformingmodels.Forexample,theLe1SmodelhadthehighestfailurerateamongAndroidsmartphonemodels(10percent),followedbyLe1SEco(7percent)andLenovoVibeK5Plus(6percent).InthecaseoftheLenovoVibeK5Plus,abudgetphonethat’sfoundsignificanttractioninIndia,anAndroidCentralreviewofthesmartphonemodelhighlightedcertainperformanceissuesthatoccur.Forinstance,theLenovoVibeK5Pluscanheatupquitefast,hasalimitedbatterychargecapacity(takeslongtofullyrecharge)andexperienceslagswhenmoreappsareinstalled.
Ourfindingssupportwhatmanyindustryanalystshavebeensuggesting–smartphonegrowthhassloweddowninrecentyears.Thisslowedgrowthcanbeattributedtoseveralfactorsandtrends.Forone,usersaren’tupgradingtonewdevicesasoftenthesedaysdueinparttohowwelldevicesarebuiltbysmartphonemanufacturers.Ontopofthat,theaveragepriceofsmartphoneshasgraduallydecreasedoverthelastfewyears,puttingmoreaffordablesmartphonemodelsintothehandsofusers.Thisisespeciallytrueinemergingmarkets,suchasIndia,wheretheaveragesellingpriceofasmartphonedroppedbynearlyhalfbetween2010and2015.Infact,StrategyAnalyticsestimatesthatbudget-friendlysmartphoneswillaccountformorethanaquarteroftheglobalsmartphonemarketandmorethan$240billioninsalesby2017.
AccordingtoAnthonyScarsella,ResearchManagerforIDC,“Assmartphonepricescontinuetodropandcompetitionescalatesatthehigh-end,vendorswillneedtocontinuetopush‘flagship-type’devicesataffordablepricepointstoencourageupgradingonamorefrequentbasis.ChinesebrandssuchasHuawei,OPPO,VivoandXiaomihavewitnessedsuccesswiththisstrategybyshippingpremiumstyleddevicesthatfocusonthefeaturesthatmattersmosttoconsumers,suchasimaging,soundqualityanddesign.”
KEYTRENDS&INSIGHTS
Android Device Performance, Q2 2016
26%
17% 17%
11%7%
Sam
sung
Leno
vo
LeTV
Mot
orol
a
Asu
s
Top 5 Android Manufacturers By Failure Rate, Q2 2016
10%
7%6%
4% 4%
Le 1
S
Le 1
S Ec
o
Leno
vo
Vib
e K5
Plu
s
Leno
vo
Vib
e P1
m
Leno
vo
K3 N
ote
Top 5 Android Models By Failure Rate, Q2 2016
Note:TheAndroidmodelfailureratesaretakenasapercentageofthetotalAndroidfailurerate(35percent)notedinthechart.
State of Mobile Device Performance and Health | Trend Report: Q2 2016 | August 20166
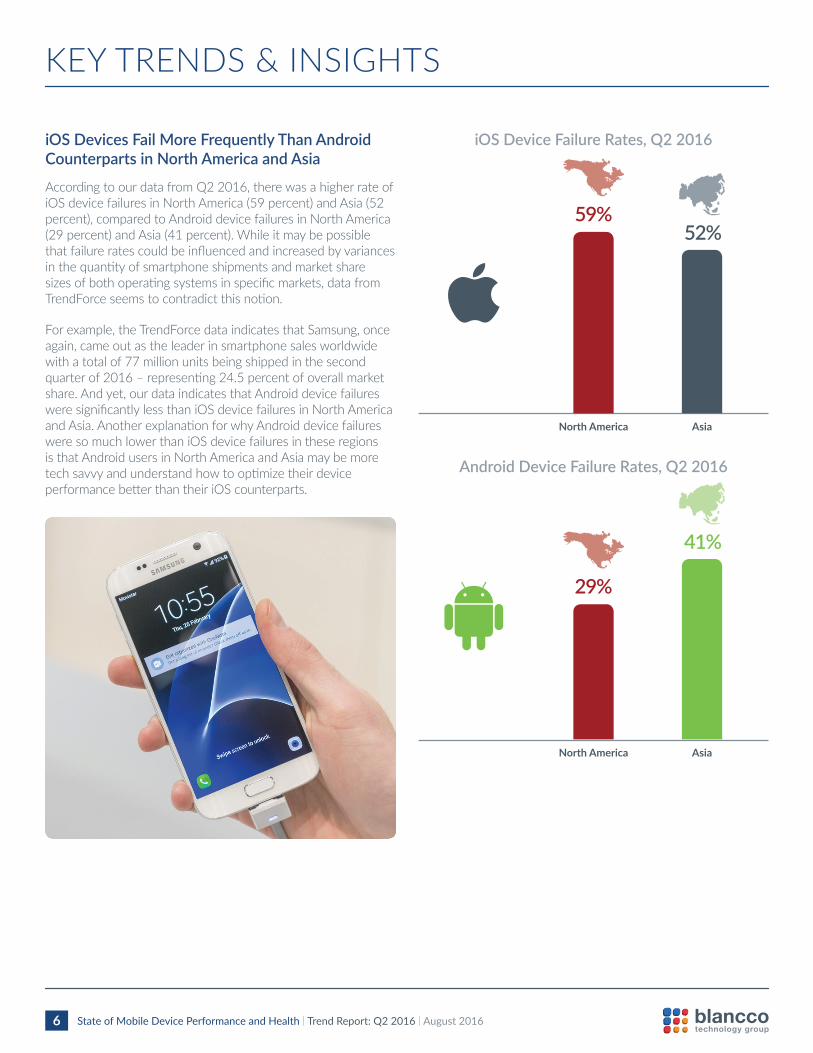
iOS Devices Fail More Frequently Than Android Counterparts in North America and Asia AccordingtoourdatafromQ22016,therewasahigherrateofiOSdevicefailuresinNorthAmerica(59percent)andAsia(52percent),comparedtoAndroiddevicefailuresinNorthAmerica(29percent)andAsia(41percent).Whileitmaybepossiblethatfailureratescouldbeinfluencedandincreasedbyvariancesinthequantityofsmartphoneshipmentsandmarketsharesizesofbothoperatingsystemsinspecificmarkets,datafromTrendForceseemstocontradictthisnotion.
Forexample,theTrendForcedataindicatesthatSamsung,onceagain,cameoutastheleaderinsmartphonesalesworldwidewithatotalof77millionunitsbeingshippedinthesecondquarterof2016–representing24.5percentofoverallmarketshare.Andyet,ourdataindicatesthatAndroiddevicefailuresweresignificantlylessthaniOSdevicefailuresinNorthAmericaandAsia.AnotherexplanationforwhyAndroiddevicefailuresweresomuchlowerthaniOSdevicefailuresintheseregionsisthatAndroidusersinNorthAmericaandAsiamaybemoretechsavvyandunderstandhowtooptimizetheirdeviceperformancebetterthantheiriOScounterparts.
KEYTRENDS&INSIGHTS
North America
iOS Device Failure Rates, Q2 2016
59%
Asia
52%
North America
Android Device Failure Rates, Q2 2016
29%
Asia
41%

State of Mobile Device Performance and Health | Trend Report: Q2 2016 | August 20167
65%
11%
4% 4% 2%
WiFi Headset Mobile Data ReceiverCrashed Apps Test
Top 5 iOS Performance Issues Worldwide, Q2 2016
KEYTRENDS&INSIGHTS
Crashing Apps, WiFi and Headset Cause Problems for iPhone Users UponanalyzingthetopfiveperformanceissuesoccurringoniOSdevicesinthesecondquarterof2016,crashingapps,WiFiandheadsetaroseasthethreemostcommonsourcesoffailures.
Asweexplainedearlier,ApplereleaseditsiOS9.3,iOS9.3.1andiOS9.3.2softwareupdatesinMarch,AprilandMay,respectively,toremedybugsandflawsthatuserswereexperiencing.However,manyuserswhoupdatedtheiriPhonesoriPadswiththeiOS9.3.2softwarereportednotbeingabletoconnecttoaWiFinetwork,havingWiFisettingsgrayedout,droppedconnections,slowspeedsandincorrectpasswordprompts.ThesereportedissuesfallinlinewiththetypesofperformanceissuesourdiagnosticstestsfoundoniOSdevicesinthesecondquarterof2016.
Asourdiagnosticstestingdatareveals,WiFiwasthesecondmostprevalentperformanceissueoniOSdevicesinQ22016.TounderstandwhythiscouldbecausingproblemsforiPhoneusers,welookedatApple’spublishediOS9.3releasenotesandfoundthatWiFiisspecificallylistedasoneofthesoftwareupdate’s‘knownissues.’AsAppledescribesit,whenmultipledevicesareconnectedtoasingleaccesspointinaclassroomenvironment,“devicesmayintermittentlylosedataconnectivitywiththeClassroom,otherdevicesandtheInternet,eventhoughthestatusbarshowsthedevicetobeconnectedtoaWiFiaccesspoint.”Inordertoresolvetheissue,Applesuggestsusersdisableandthenre-enableWiFiconnectivityfromtheirdevice’ssettings.
State of Mobile Device Performance and Health | Trend Report: Q2 2016 | August 20168
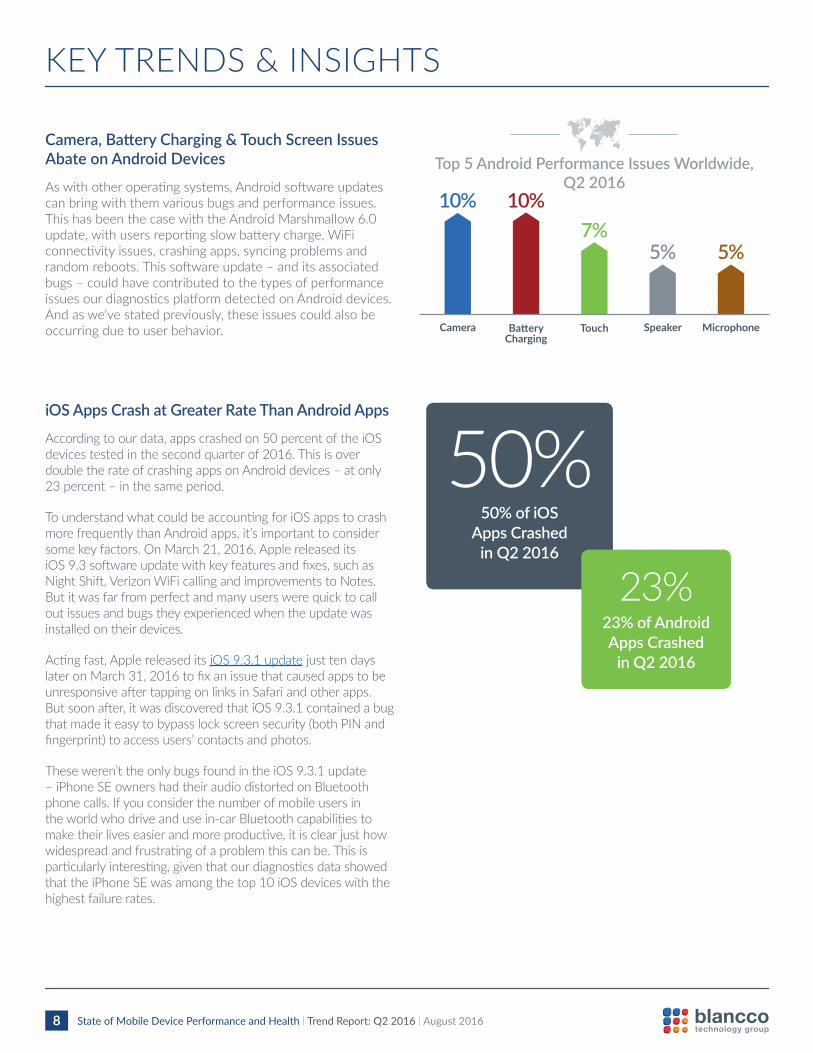
iOS Apps Crash at Greater Rate Than Android AppsAccordingtoourdata,appscrashedon50percentoftheiOSdevicestestedinthesecondquarterof2016.ThisisoverdoubletherateofcrashingappsonAndroiddevices–atonly23percent–inthesameperiod.
TounderstandwhatcouldbeaccountingforiOSappstocrashmorefrequentlythanAndroidapps,it’simportanttoconsidersomekeyfactors.OnMarch21,2016,ApplereleaseditsiOS9.3softwareupdatewithkeyfeaturesandfixes,suchasNightShift,VerizonWiFicallingandimprovementstoNotes.Butitwasfarfromperfectandmanyuserswerequicktocalloutissuesandbugstheyexperiencedwhentheupdatewasinstalledontheirdevices.
Actingfast,ApplereleaseditsiOS9.3.1updatejusttendayslateronMarch31,2016tofixanissuethatcausedappstobeunresponsiveaftertappingonlinksinSafariandotherapps.Butsoonafter,itwasdiscoveredthatiOS9.3.1containedabugthatmadeiteasytobypasslockscreensecurity(bothPINandfingerprint)toaccessusers’contactsandphotos.
Theseweren’ttheonlybugsfoundintheiOS9.3.1update–iPhoneSEownershadtheiraudiodistortedonBluetoothphonecalls.Ifyouconsiderthenumberofmobileusersintheworldwhodriveandusein-carBluetoothcapabilitiestomaketheirliveseasierandmoreproductive,itisclearjusthowwidespreadandfrustratingofaproblemthiscanbe.Thisisparticularlyinteresting,giventhatourdiagnosticsdatashowedthattheiPhoneSEwasamongthetop10iOSdeviceswiththehighestfailurerates.
Camera, Battery Charging & Touch Screen Issues Abate on Android Devices Aswithotheroperatingsystems,Androidsoftwareupdates canbringwiththemvariousbugsandperformanceissues. ThishasbeenthecasewiththeAndroidMarshmallow6.0update,withusersreportingslowbatterycharge,WiFiconnectivityissues,crashingapps,syncingproblemsandrandomreboots.Thissoftwareupdate–anditsassociatedbugs–couldhavecontributedtothetypesofperformanceissuesourdiagnosticsplatformdetectedonAndroiddevices.Andaswe’vestatedpreviously,theseissuescouldalsobeoccurringduetouserbehavior.
KEYTRENDS&INSIGHTS
10% 10%7%
5% 5%
Battery Charging
Touch Speaker MicrophoneCamera
Top 5 Android Performance Issues Worldwide, Q2 2016
50%50% of iOS
Apps Crashed in Q2 2016
23%23% of Android Apps Crashed
in Q2 2016
State of Mobile Device Performance and Health | Trend Report: Q2 2016 | August 20169
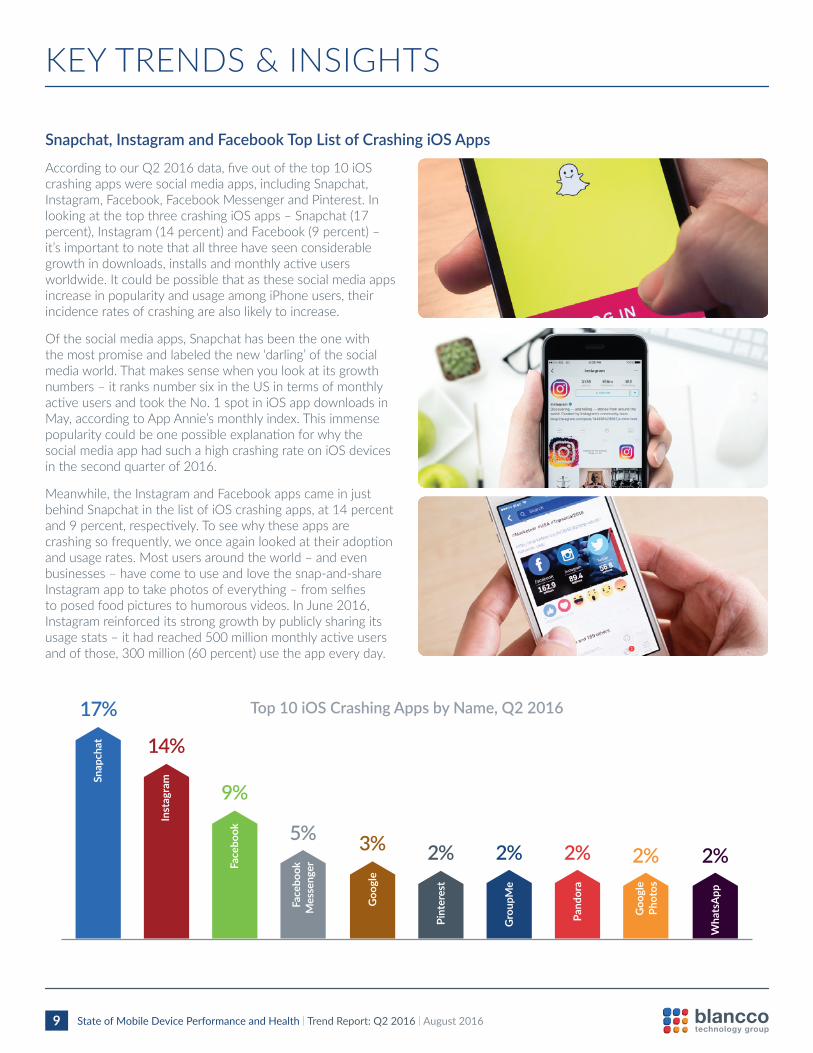
Snapchat, Instagram and Facebook Top List of Crashing iOS Apps AccordingtoourQ22016data,fiveoutofthetop10iOScrashingappsweresocialmediaapps,includingSnapchat,Instagram,Facebook,FacebookMessengerandPinterest.InlookingatthetopthreecrashingiOSapps–Snapchat(17percent),Instagram(14percent)andFacebook(9percent)–it’simportanttonotethatallthreehaveseenconsiderablegrowthindownloads,installsandmonthlyactiveusersworldwide.ItcouldbepossiblethatasthesesocialmediaappsincreaseinpopularityandusageamongiPhoneusers,theirincidenceratesofcrashingarealsolikelytoincrease.
Ofthesocialmediaapps,Snapchathasbeentheonewiththemostpromiseandlabeledthenew‘darling’ofthesocialmediaworld.Thatmakessensewhenyoulookatitsgrowthnumbers–itranksnumbersixintheUSintermsofmonthlyactiveusersandtooktheNo.1spotiniOSappdownloadsinMay,accordingtoAppAnnie’smonthlyindex.ThisimmensepopularitycouldbeonepossibleexplanationforwhythesocialmediaapphadsuchahighcrashingrateoniOSdevicesinthesecondquarterof2016.
Meanwhile,theInstagramandFacebookappscameinjustbehindSnapchatinthelistofiOScrashingapps,at14percentand9percent,respectively.Toseewhytheseappsarecrashingsofrequently,weonceagainlookedattheiradoptionandusagerates.Mostusersaroundtheworld–andevenbusinesses–havecometouseandlovethesnap-and-shareInstagramapptotakephotosofeverything–fromselfiestoposedfoodpicturestohumorousvideos.InJune2016,Instagramreinforceditsstronggrowthbypubliclysharingitsusagestats–ithadreached500millionmonthlyactiveusersandofthose,300million(60percent)usetheappeveryday.
Top 10 iOS Crashing Apps by Name, Q2 2016
14%
2%2% 2%
Pint
eres
t
Gro
upM
e
Pand
ora
Inst
agra
mSnap
chat
17%
5%2% 2%
Face
book
M
esse
nger
Wha
tsA
pp
Goo
gle
Phot
os
9%
3%
Face
book
Goo
gle
KEYTRENDS&INSIGHTS

State of Mobile Device Performance and Health | Trend Report: Q2 2016 | August 201610
Google Play Services, Google Contacts Sync and Address Book Android Apps Crash Most Often IncontrasttowhatourdiagnosticsdatarevealedaboutiOSappperformance,socialmediaappsdidn’ttopthelistofcrashingAndroidapps.Infact,theywerenowheretobeseenontheAndroidappswiththehighestcrashingrates.Instead,GooglePlayServices(12percent),GoogleContactsSync
(5percent)andtheAddressBook(5percent)wereamongthetop3crashingAndroidappsinthesecondquarterof2016.AsmanyAndroiduserforumsandblogshaveindicated,manyAndroidusershavereportedthatGooglePlayServiceshascrashedunexpectedlyandconstantlyontheirdevices.
KEYTRENDS&INSIGHTS
Top 10 Android Crashing Apps by Name, Q2 2016
5%
3%4%
2%La
unch
er
Goo
gle
Play
Sto
re
Mob
ile
Tran
sfer
Goo
gle
Cont
acts
Syn
cGoo
gle
Play
Ser
vice
s
12%
5%
2% 2%Phot
os
Setu
p W
izar
d
Mes
sage
s
5% 5%
Addr
ess B
ook
Touc
hWiz
Hom
e

State of Mobile Device Performance and Health | Trend Report: Q2 2016 | August 201611
CONCLUSION
ThroughdatacollectedfrommillionsofiOSandAndroiddevicesbroughtintowirelesscarriersanddevicemanufacturersfortesting,wehavelearnedthatiOSdevicesstruggledwithperformanceissues,highfailureratesanddoubletherateofcrashingappsthantheirAndroidcounterparts.Additionally,ourQ22016dataindicatesthatsoftwareupdatesmadetoeachoperatingsystemcouldpotentiallyfactorintothetypesofperformanceissuesdetectedbyourdiagnosticsplatform.
For Manufacturers and CarriersIntoday’scompetitivemarketplace,mobilecarriersanddevicemanufacturersmustdelivermaximumvaluefortheircustomersandimprovethecustomercareexperienceacrosseverychannel.Thishasledtogreaterinvestmentsinstafftraining,educationandtechnology–withtheintentofkeepingexistingcustomerssatisfiedandloyal,boostingtheir
NetPromoterScores,reducingsubscriberchurn,increasingfoottrafficanddrivingcontractupsellopportunities.Butthekeytoachievingthesegoalsisbeingabletodiagnoseandrepairdeviceissuesquickly,easilyandaccurately.Toassessthehighcostsneedlesslyincurredfrominaccuratelydiagnosingdeviceperformanceissuesand,asaresult,unnecessarilyprocessingNTFreturns,calculateyourNTFsavingstoday.
For Enterprise OrganizationsMoreemployeesusetheirpersonalmobiledevicesinsideandoutsidetheworkplacethanthosewhodon’t.BecauseofBYOD’sincreasingpopularityandadoptionbyenterprisebusinesses,ITandsupportdeskteamshaveultimatelybecomethego-to‘fixit’sourcewhenemployees’devicesdon’tfunctionproperly.ThiscreatesaburdenonITandsupportdeskworkloadsandmanpower,whichcouldbereducedsignificantlyifemployeesunderstandhowtooptimizetheirowndevices.
ThroughourSmartChkmobilediagnosticssolutions,wehelpsomeoftheworld’sbiggestandmosticonicwirelesscarriersanddevicemanufacturersautomateandscalethediagnosticsprocessacrosstheentiremobilelifecycleandacrosseverychannel.ToseehowourSmartChkdiagnosticssolutionsandbusinessintelligencecanhelpreducethequantityandfrequencyof‘NoTroubleFound’devicereturns,increaseyourNetPromoterScoreandsavemillionsofdollarseachyear,requestademotoday.
ABOUTTHEMARKET ABOUTTHETECHNOLOGYPOWERINGTHEREPORT
TheglobalenterprisemobilityandBYODmarketisexpectedtoreachavalueof$360billionby2020.1InNorthAmerica,therearemorethan250millionuniquemobilesubscribersand360millionconnections,withthree-quartersofconnectionsbeingsmartphones.2Meanwhile,theAsiaPacificregionboastsmorethanonebillionsmartphoneusers,withcountriessuchasChinaandIndiaemergingasthelatestgrowthmarkets.3InEurope,operatorinvestmentsin4Gand5Gnetworkqualityandcoverage,growthinsmartphoneuseandincreaseddatausageareallcontributingfactorstoagrowingsubscriberbaseexpectedtoreach450millionbytheendof2020.4
1 Research and Markets, BYOD and Enterprise Mobility Market by Solution, by Device, by Security, by Vertical, by Region Analysis and Forecasts till 2020 Report, December 2015
2 GSMA, The Mobile Economy – North America 20153 eMarketer, September 20154 GSMA, The Mobile Economy – Europe 2015

State of Mobile Device Performance and Health | Trend Report: Q2 2016 | August 201612
ABOUTBLANCCOTECHNOLOGYGROUP
CONTACTUS
Blancco Technology Groupisaleading,globalproviderofmobiledevicediagnosticsandsecuredataerasuresolutions.Wehelpourclients’customerstest,diagnose,repairandrepurposeITdeviceswiththemostprovenandcertifiedsoftware.Ourclienteleconsistsofequipmentmanufacturers,mobilenetworkoperators,retailers,financialinstitutions,healthcareprovidersandgovernmentorganizationsworldwide.ThecompanyisheadquarteredinAlpharetta,GA,UnitedStates,withadistributedworkforceandcustomerbaseacrosstheglobe.
Formoreinformationvisit: www.blanccotechnologygroup.com
Blancco,adivisionofBlanccoTechnologyGroup,istheglobaldefactostandardincertifieddataerasure.Weprovidethousandsoforganizationswithanabsolutelineofdefenseagainstcostlysecuritybreaches,aswellasverificationofregulatorycompliancethrougha100%tamper-proofaudittrail.
SmartChk,adivisionofBlanccoTechnologyGroup,isaglobalinnovatorinmobileassetdiagnosticsandbusinessintelligence.Wepartnerwithourcustomerstoimprovetheircustomers’experiencebyprovidingseamlesssolutionstotest,diagnoseandrepairmobileassets.SmartChkprovidesworld-classsupport,preandpostimplementation,allowingourcustomerstoderivemeasurablebusinessresults.
For Sales & Marketing, Please Contact: Email:[email protected]
For Corporate Communications & PR, Please Contact: Email:[email protected]