appa institute steam plant modeling€¢ discussion of a model of a simple two pipe system •...
TRANSCRIPT

APPA Institute – Session 323 EU © GLHN Architects & Engineers, Inc.
1
Utilities InfrastructureSteam Plant Modeling
APPA Institute for
Facilities Management
Bill Nelson PE
2
Purpose of Today’s Presentation
• To provide a broad understanding of software for modeling piping systems
• To provide a basis of comparison of some available software
• Review applications of modeling to steam systems
• Discussion of a model of a simple two pipe system
• Investigate effects of modifications to a basic system
3
Agenda
• Software Overview
• Example Software
• Comparison Attributes
• Selected Comparisons
• Unique Aspects of Steam Modeling
• Applications to maintenance/operations
• Simple Two Pipe System Models
• University of Arizona Case Study

APPA Institute – Session 323 EU © GLHN Architects & Engineers, Inc.
4
Software Overview
• Desired Features– Flowsheet w/ Graphic User Interface (GUI)
• Represent schematic piping system
• Drawing tools & component icons
• Text boxes
• Snap to grid capability
– Hyperlinks in Flowsheet• Access to electronic data
• Export to CAD
• Link to spreadsheet calcs
• Access to the WEB
5
Software Overview
Flowsheet
6
Software Overview
Hyperlink

APPA Institute – Session 323 EU © GLHN Architects & Engineers, Inc.
7
Software Overview
• Desired Features– Calculation engine
• Fluid data lookup
• Import pump/valve catalogs
• Display pipeline flow rates/pressure drops
• Display pump curves at selection point
• Multiple scenario capability
– Share Information• Create reports in .pdf, HTML or Word
• Export Flowsheets to CAD
• Export to Excel
8
Software OverviewDesired Features
Pump Curves
9
Software OverviewDesired Features
Print / Export

APPA Institute – Session 323 EU © GLHN Architects & Engineers, Inc.
10
Software Overview
• Life of Plant Application– Design Engineer
• Size/optimize piping/equipment
• Balance flow rates
• Run multiple scenarios
• Develop costs
– Contractor• Evaluate/incorporate effect of field changes
• Determine flushing paths/volumes
• Evaluate startup/commissioning process
11
Software Overview
• Life of Plant Application– Plant Engineer
• Evaluate effect of increased output
• Anticipate system expansion requirements
• Determine effect of piping/equipment failure
– Maintenance/Plant Operations• Troubleshooting
• Determine effect of equipment isolation for repair
• Ensure optimum system operation
• Evaluate valve/controller operation
12
Example Software
Sinda/Fluint www.crtech.comPipe Flo Pro www.eng-software.comFlow Master v7 www.flowmaster.comFluid Flow ^3 www.accutech2000.comSinet Engrs Aid www.epcon.comFlowvent www.flomerics.comPipe Flow www.pipeflow.co.ukFlow of Fluids www.flowoffluids.comFathom 7 www.aft.com

APPA Institute – Session 323 EU © GLHN Architects & Engineers, Inc.
13
Comparison Attributes
• Tutorials/training available
• Heat transfer calculations
• Pipe heat loss calculations
• Liquid/vapor/gas capability
• Flow mixing capability
• Auto phase state determination
• Modular architecture
• Tech support
• Service contract
14
Selected Comparisons
15
Heat Loss Capability
• Allows estimate of energy lost through insulation on piping
• Applications– Estimating the added insulation required to reach a target loss (say 5-10% of total boiler capacity
– Estimating avoided cost of fuel from re-insulating
– Allows comparisons to other steam production methods

APPA Institute – Session 323 EU © GLHN Architects & Engineers, Inc.
16
Condensing Boilers
• Concept– Condensing boilers have greater efficiency
– Requires modular boilers at each building
– Avoids line losses associated with central plants
17
Condensing Boilers
• Disadvantages– Inflexible fuel supply
– Gas supply lines to all campus buildings
– Cannot take advantage of diversity
– Combustion process in each building
– Modular condensing boiler capacities are limited to about 4,000 MBH
– Greater maintenance cost/more maintenance personnel
– Requirement for firm capacity can double boiler cost
18
Line Loss ComparisonStandard vs. Condensing Boilers
• Basis for Comparison– 180,000 MBH campus system
– 5000 heating degree days
– 23 deg F average winter design temp
– 500,000 MMBtu/yr heating load
•Annual Loss Comparison– 100,000 MMBtu for standard boiler in central plant (20% of heating load)
– 25,000 MMBtu for condensing boilers distributed on campus (5% of heating load)
APPA Institute – Session 323 EU © GLHN Architects & Engineers, Inc.
19
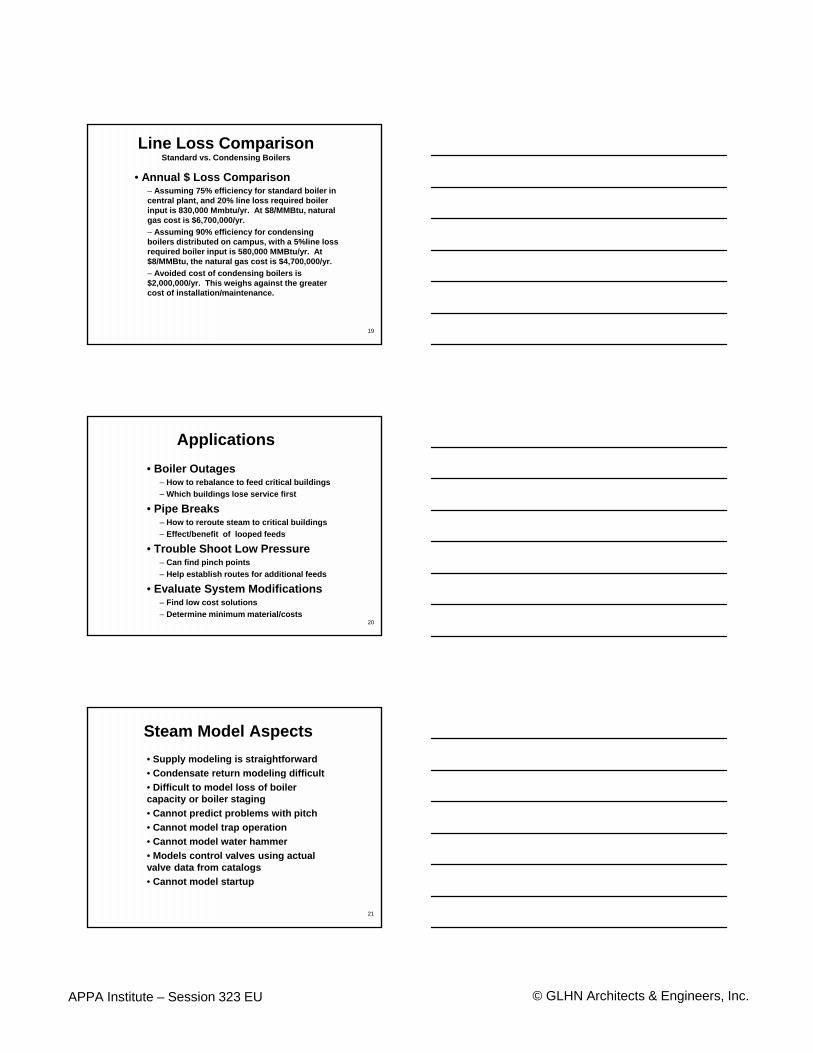
Line Loss ComparisonStandard vs. Condensing Boilers
• Annual $ Loss Comparison– Assuming 75% efficiency for standard boiler in central plant, and 20% line loss required boiler input is 830,000 Mmbtu/yr. At $8/MMBtu, natural gas cost is $6,700,000/yr.
– Assuming 90% efficiency for condensing boilers distributed on campus, with a 5%line loss required boiler input is 580,000 MMBtu/yr. At $8/MMBtu, the natural gas cost is $4,700,000/yr.
– Avoided cost of condensing boilers is $2,000,000/yr. This weighs against the greater cost of installation/maintenance.
20
Applications
• Boiler Outages– How to rebalance to feed critical buildings
– Which buildings lose service first
• Pipe Breaks– How to reroute steam to critical buildings
– Effect/benefit of looped feeds
• Trouble Shoot Low Pressure– Can find pinch points
– Help establish routes for additional feeds
• Evaluate System Modifications– Find low cost solutions
– Determine minimum material/costs
21
Steam Model Aspects
• Supply modeling is straightforward
• Condensate return modeling difficult
• Difficult to model loss of boiler capacity or boiler staging
• Cannot predict problems with pitch
• Cannot model trap operation
• Cannot model water hammer
• Models control valves using actual valve data from catalogs
• Cannot model startup

APPA Institute – Session 323 EU © GLHN Architects & Engineers, Inc.
22
Steam Model Aspects (cont’d)
• Models buildings as a single load with a second order curve
• Static model-does not follow load changes over time
• Load changes can be modeled as discrete load points
• Boilers modeled as infinite source at set pressure
23
Modeling Procedure
• Obtain campus steam piping site diagram, in CAD if possible
• Verify pipe lengths (easy in CAD)
• Verify pipe diameter/material
• List the fittings and valves in each run (good approximations)
• Model each building as a single load
• Insert valve data that best represents existing valve control action
• Select actual boiler plant supply pressure for infinite supply source
24
Steam Pipe Velocity

APPA Institute – Session 323 EU © GLHN Architects & Engineers, Inc.
25
Two Pipe Campus Model
• Small campus
• Six steam heated buildings
• Four buildings on a loop
• Scenarios– Existing system-as operated for years
– Effect of low pressure
– Effect of pipe breakage
– Effect of increased loads
– Effect of resizing some piping
– Effect of pipe breakage on resized system
– Effect of low flow on resized system
26
Example Campus
27
Existing SystemNo Text for Clarity

APPA Institute – Session 323 EU © GLHN Architects & Engineers, Inc.
28
Existing-As Operated
29
Existing SystemLow Pressure
30
Existing SystemBroken Pipe

APPA Institute – Session 323 EU © GLHN Architects & Engineers, Inc.
31
Existing SystemIncreased Load
32
Existing SystemIncreased Loads
33
Existing system Notes
• Significant variability in supply pressure between buildings
• Supply pressure dropped drastically to all buildings under increased load
• Velocity in main to loop increased from 7680 fpm to 8640
• Velocity in loop increased from 7260 fpm to 9720

APPA Institute – Session 323 EU © GLHN Architects & Engineers, Inc.
34
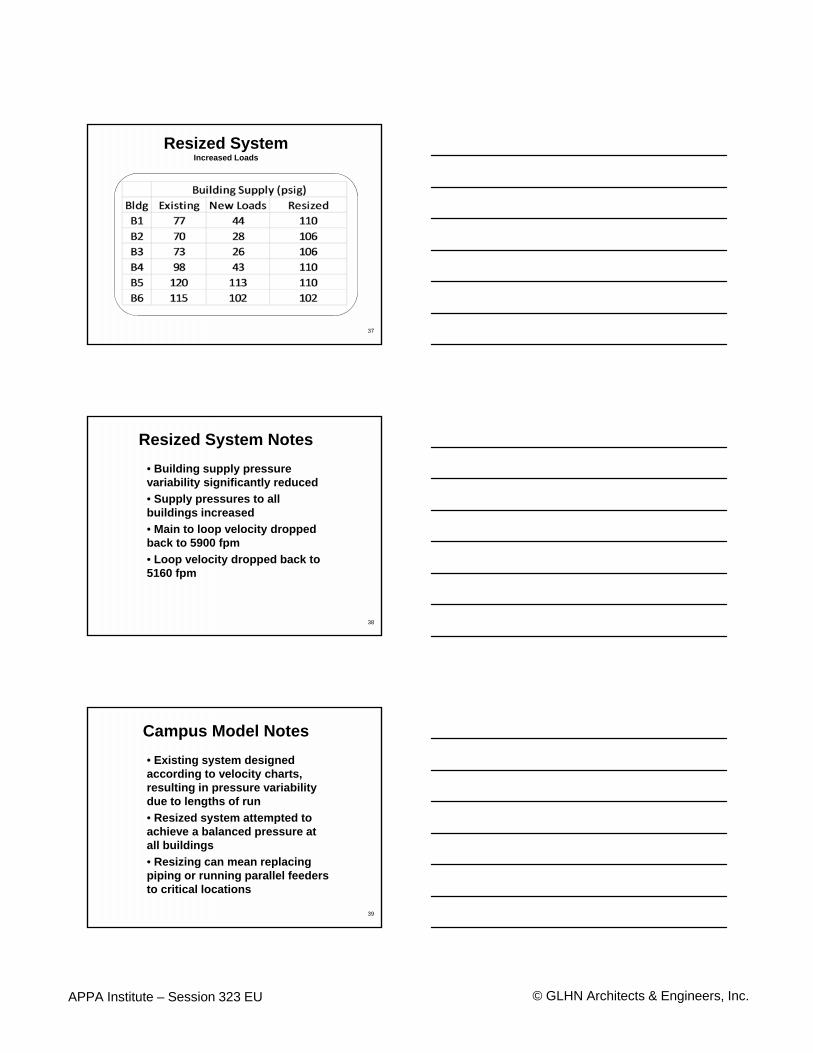
Resized SystemIncreased Load
35
Resized SystemBroken Pipe
36
Resized SystemLow Pressure
APPA Institute – Session 323 EU © GLHN Architects & Engineers, Inc.
37
Resized SystemIncreased Loads
38
Resized System Notes
• Building supply pressure variability significantly reduced
• Supply pressures to all buildings increased
• Main to loop velocity dropped back to 5900 fpm
• Loop velocity dropped back to 5160 fpm
39
Campus Model Notes
• Existing system designed according to velocity charts, resulting in pressure variability due to lengths of run
• Resized system attempted to achieve a balanced pressure at all buildings
• Resizing can mean replacing piping or running parallel feeders to critical locations

APPA Institute – Session 323 EU © GLHN Architects & Engineers, Inc.
40
U of A Case Study
• Campus Overview– Refer to Campus map
– Black lines are unchanged existing tunnels
– Orange lines are recently added interconnects
– Red lines are proposed resizing and interconnects
– Yellow circles are selected buildings for analysis
m
41Bio. Sci. W
Coronado Hall
AnthropologyOld Main
Gila Hall
Elec. & Comp. Engineering
AME
Cancer Ctr.
Drachman Hall
Life Sci. N.
CRP
Ina Gittings
Opt. Sci.
McClelland Hall
42
U of A Case Study
• Steam system description– Two Steam plants: AHSC (north) and CHRP (south)
– Plants are now interconnected and operated cooperatively
– 5 miles of steam piping and tunnels
– 100 psig supply pressure
– Two pipe system (steam supply and condensate return)
– Condensate equalizer system

APPA Institute – Session 323 EU © GLHN Architects & Engineers, Inc.
43
U of A Case Study
• Current operation– Historically, plants and distribution were separate
– Recent interconnect tied plants together
– Plants now operated cooperatively feeding campus together
– As a result, distribution has improved significantly
– Standard deviation of inlet pressures dropped from 23.5 to 5.6
44
U of A Case Study
45
U of A Case Study
• Planned new loads– Refer to campus map
– Total of five new block loads
– Buildings constructed in three phases over 20 years
– Additional 10,000,000 sq ft
– Additional 164,000 lb/hr
– Current piping system unable to handle new loads
– Proposed new interconnect shows some improvement

APPA Institute – Session 323 EU © GLHN Architects & Engineers, Inc.
46
U of A Case Study
47
U of A Case Study
• Final solution– Resize 5th st. tunnel from 6” to 10”
– Resize northwest tunnel from 6” to 8”
– Build new 10” interconnect
– Standard deviation of building inlet pressures drops to 5.9
48
U of A Case Study

APPA Institute – Session 323 EU © GLHN Architects & Engineers, Inc.
49
U of A Case Study
• Cost of upgrades– New proposed 10” interconnecting tunnel…………………..$33,500,000
– Resize Northwest tunnel from 6” to 8”………………………….$3,500,000
– Resize 5th street tunnel from 6” to 10”………………………..$3,100,000
– New boilers…………..$10,600,000
– Total……………………$50,700,000
50
U of A Case Study
• Other lessons learned– Increasing supply pressure to 125 psig had little effect
– Upsizing the new interconnect tunnel to 12” from 10” had little effect
– Upsizing the 5th street and Northwest tunnels to 12” had little effect
– Adding the new interconnect alone was not the final answer