apostolos thomadakis. determinants of credit constrained firms: evidence from central eastern and...
TRANSCRIPT

Determinants of Credit Constrained Firms: Evidencefrom Central Eastern and Europe Region
Apostolos Thomadakis
University of Warwick
21st of July 2016
Apostolos Thomadakis (University of Warwick) (University of Warwick)Determinants of Credit Constrained Firms 21st of July 2016 1 / 44
Outline
Motivation
Literature Review
Data
Empirical Results
Conclusion
Apostolos Thomadakis (University of Warwick) (University of Warwick)Determinants of Credit Constrained Firms 21st of July 2016 2 / 44
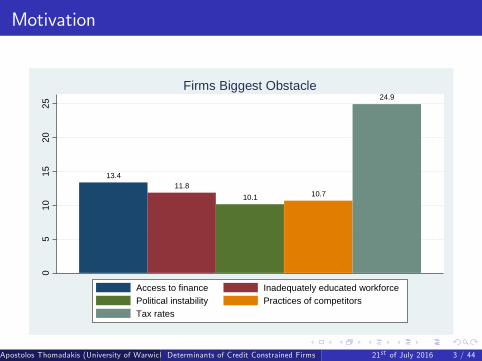
Motivation
13.411.8
10.1 10.7
24.9
05
1015
2025
Firms Biggest Obstacle
Access to finance Inadequately educated workforcePolitical instability Practices of competitorsTax rates
Apostolos Thomadakis (University of Warwick) (University of Warwick)Determinants of Credit Constrained Firms 21st of July 2016 3 / 44
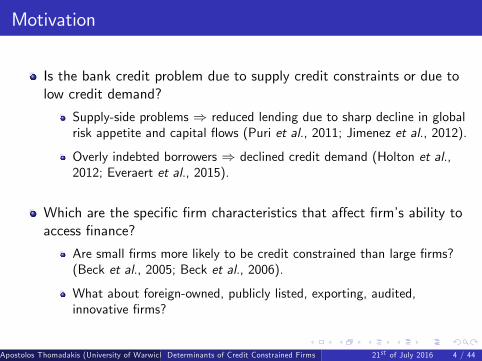
Motivation
Is the bank credit problem due to supply credit constraints or due tolow credit demand?
Supply-side problems ) reduced lending due to sharp decline in globalrisk appetite and capital �ows (Puri et al., 2011; Jimenez et al., 2012).
Overly indebted borrowers ) declined credit demand (Holton et al.,2012; Everaert et al., 2015).
Which are the speci�c �rm characteristics that a¤ect �rm�s ability toaccess �nance?
Are small �rms more likely to be credit constrained than large �rms?(Beck et al., 2005; Beck et al., 2006).
What about foreign-owned, publicly listed, exporting, audited,innovative �rms?
Apostolos Thomadakis (University of Warwick) (University of Warwick)Determinants of Credit Constrained Firms 21st of July 2016 4 / 44
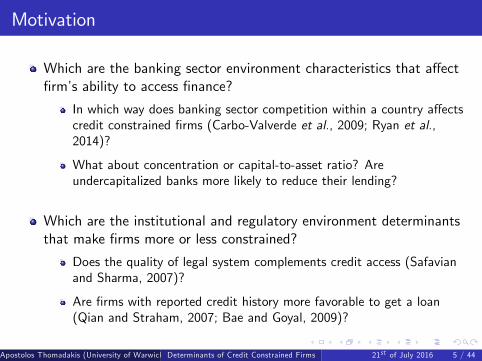
Motivation
Which are the banking sector environment characteristics that a¤ect�rm�s ability to access �nance?
In which way does banking sector competition within a country a¤ectscredit constrained �rms (Carbo-Valverde et al., 2009; Ryan et al.,2014)?
What about concentration or capital-to-asset ratio? Areundercapitalized banks more likely to reduce their lending?
Which are the institutional and regulatory environment determinantsthat make �rms more or less constrained?
Does the quality of legal system complements credit access (Safavianand Sharma, 2007)?
Are �rms with reported credit history more favorable to get a loan(Qian and Straham, 2007; Bae and Goyal, 2009)?
Apostolos Thomadakis (University of Warwick) (University of Warwick)Determinants of Credit Constrained Firms 21st of July 2016 5 / 44
Contribution
Isolate �rm-level credit demand from credit supply.
We don�t equate competition and concentration.
Add to the discussion on the e¤ect of information sharing on bankcredit.
Negative impact of credit information sharing on access to �nance,which can be mitigated by more contestable (competitive) bankingmarket (Pagano and Jappelli).
Negative impact of foreign banks on access to �nance, which can bemitigated by higher availability of credit information history.
Heterogeneity across years: 2 separate rounds of BEEPS (2008-2009and 2012-2014), but also pooling them together.
Apostolos Thomadakis (University of Warwick) (University of Warwick)Determinants of Credit Constrained Firms 21st of July 2016 6 / 44
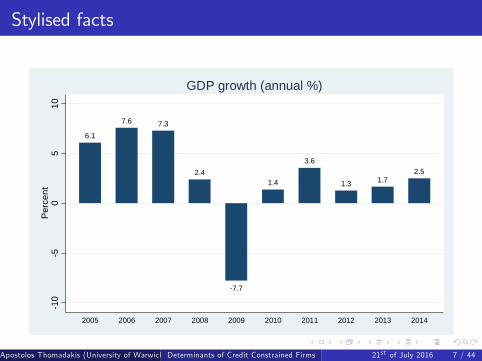
Stylised facts
6.1
7.6 7.3
2.4
7.7
1.4
3.6
1.3 1.72.5
10
50
510
Per
cent
2005 2006 2007 2008 2009 2010 2011 2012 2013 2014
GDP growth (annual %)
Apostolos Thomadakis (University of Warwick) (University of Warwick)Determinants of Credit Constrained Firms 21st of July 2016 7 / 44
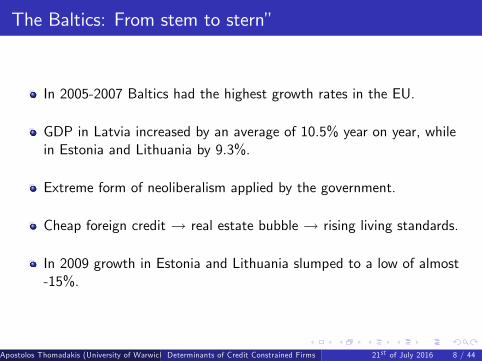
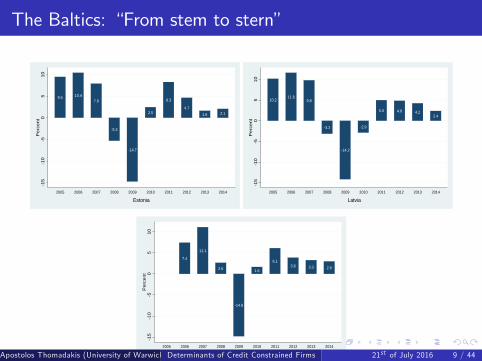
The Baltics: From stem to stern�
In 2005-2007 Baltics had the highest growth rates in the EU.
GDP in Latvia increased by an average of 10.5% year on year, whilein Estonia and Lithuania by 9.3%.
Extreme form of neoliberalism applied by the government.
Cheap foreign credit ! real estate bubble ! rising living standards.
In 2009 growth in Estonia and Lithuania slumped to a low of almost-15%.
Apostolos Thomadakis (University of Warwick) (University of Warwick)Determinants of Credit Constrained Firms 21st of July 2016 8 / 44
The Baltics: �From stem to stern�
9.5 10.47.9
5.3
14.7
2.5
8.3
4.71.6 2.1
15
10
50
510
Per
cent
Estonia2005 2006 2007 2008 2009 2010 2011 2012 2013 2014
10.211.6
9.8
3.2
14.2
2.9
5.0 4.8 4.22.4
15
10
50
510
Per
cent
Latvia2005 2006 2007 2008 2009 2010 2011 2012 2013 2014
7.4
11.1
2.6
14.8
1.6
6.13.8 3.3 2.9
15
10
50
510
Per
cent
Lithuania2005 2006 2007 2008 2009 2010 2011 2012 2013 2014
Apostolos Thomadakis (University of Warwick) (University of Warwick)Determinants of Credit Constrained Firms 21st of July 2016 9 / 44

Hungary: �The basket case�
In 2005-2006 the budget de�cit was 10%.
Austerity packages: increase tax, reduce bene�ts and subsidies
However, when the 2008 crisis hit Hungary was doubly exposed.
First, credit had been taken in foreign currencies by the government,�rms and households.
Second, highly dependent on the demand from Western Europeeconomies for goods, which fell sharply.
Apostolos Thomadakis (University of Warwick) (University of Warwick)Determinants of Credit Constrained Firms 21st of July 2016 10 / 44
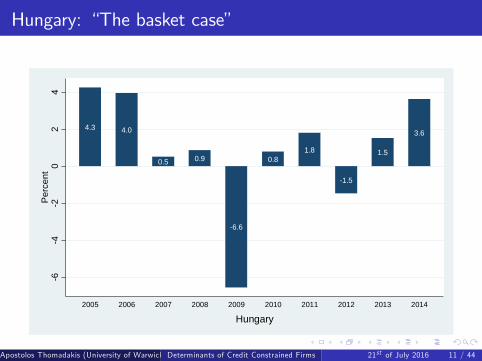
Hungary: �The basket case�
4.3 4.0
0.5 0.9
6.6
0.81.8
1.5
1.5
3.6
64
20
24
Per
cent
Hungary2005 2006 2007 2008 2009 2010 2011 2012 2013 2014
Apostolos Thomadakis (University of Warwick) (University of Warwick)Determinants of Credit Constrained Firms 21st of July 2016 11 / 44

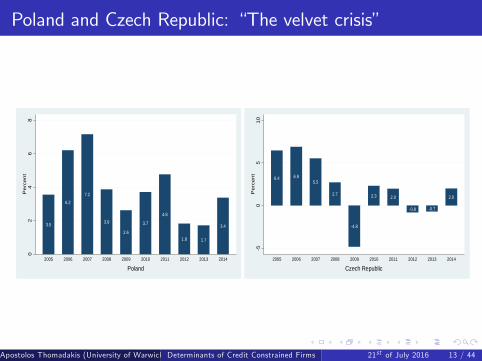
Poland and Czech Republic: �The velvet crisis�
Di¤erentiate themselves from the catastrophes in the rest of CEE.
GDP in Czech Republic fell just below the EU average.
Do not have huge property bubbles fed by foreign banks.
Much lower exposure to foreign currencies (8% in Czech Republic and30% in Poland).
Floating exchange rate in Poland fell against the euro by 30%between 2008-2009.
However, this �success� is masked and should be treated with caution.
Apostolos Thomadakis (University of Warwick) (University of Warwick)Determinants of Credit Constrained Firms 21st of July 2016 12 / 44
Poland and Czech Republic: �The velvet crisis�
3.5
6.2
7.2
3.9
2.6
3.7
4.8
1.8 1.7
3.4
02
46
8P
erc
en
t
Poland2005 2006 2007 2008 2009 2010 2011 2012 2013 2014
6.4 6.95.5
2.7
4.8
2.3 2.0
0.8 0.7
2.0
50
51
0P
erc
en
t
Czech Republic2005 2006 2007 2008 2009 2010 2011 2012 2013 2014
Apostolos Thomadakis (University of Warwick) (University of Warwick)Determinants of Credit Constrained Firms 21st of July 2016 13 / 44
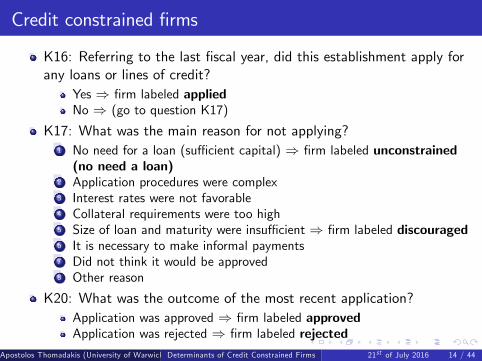
Credit constrained �rms
K16: Referring to the last �scal year, did this establishment apply forany loans or lines of credit?
Yes ) �rm labeled appliedNo ) (go to question K17)
K17: What was the main reason for not applying?1 No need for a loan (su¢ cient capital) ) �rm labeled unconstrained(no need a loan)
2 Application procedures were complex3 Interest rates were not favorable4 Collateral requirements were too high5 Size of loan and maturity were insu¢ cient ) �rm labeled discouraged6 It is necessary to make informal payments7 Did not think it would be approved8 Other reason
K20: What was the outcome of the most recent application?Application was approved ) �rm labeled approvedApplication was rejected ) �rm labeled rejected
Apostolos Thomadakis (University of Warwick) (University of Warwick)Determinants of Credit Constrained Firms 21st of July 2016 14 / 44
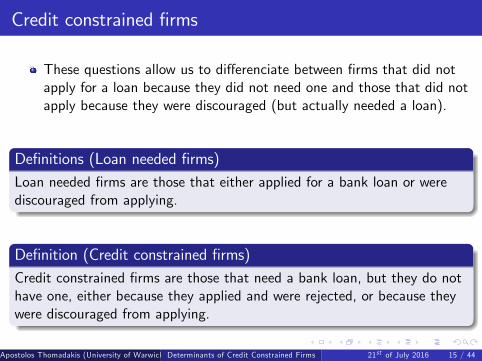
Credit constrained �rms
These questions allow us to di¤erenciate between �rms that did notapply for a loan because they did not need one and those that did notapply because they were discouraged (but actually needed a loan).
De�nitions (Loan needed �rms)Loan needed �rms are those that either applied for a bank loan or werediscouraged from applying.
De�nition (Credit constrained �rms)Credit constrained �rms are those that need a bank loan, but they do nothave one, either because they applied and were rejected, or because theywere discouraged from applying.
Apostolos Thomadakis (University of Warwick) (University of Warwick)Determinants of Credit Constrained Firms 21st of July 2016 15 / 44
Credit constrained �rms
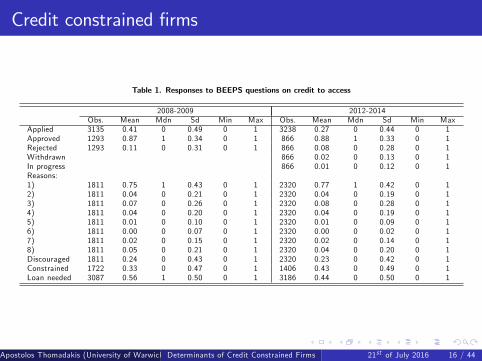
Table 1. Responses to BEEPS questions on credit to access
2008-2009 2012-2014Obs. Mean Mdn Sd Min Max Obs. Mean Mdn Sd Min Max
Applied 3135 0.41 0 0.49 0 1 3238 0.27 0 0.44 0 1Approved 1293 0.87 1 0.34 0 1 866 0.88 1 0.33 0 1Rejected 1293 0.11 0 0.31 0 1 866 0.08 0 0.28 0 1Withdrawn 866 0.02 0 0.13 0 1In progress 866 0.01 0 0.12 0 1Reasons:1) 1811 0.75 1 0.43 0 1 2320 0.77 1 0.42 0 12) 1811 0.04 0 0.21 0 1 2320 0.04 0 0.19 0 13) 1811 0.07 0 0.26 0 1 2320 0.08 0 0.28 0 14) 1811 0.04 0 0.20 0 1 2320 0.04 0 0.19 0 15) 1811 0.01 0 0.10 0 1 2320 0.01 0 0.09 0 16) 1811 0.00 0 0.07 0 1 2320 0.00 0 0.02 0 17) 1811 0.02 0 0.15 0 1 2320 0.02 0 0.14 0 18) 1811 0.05 0 0.21 0 1 2320 0.04 0 0.20 0 1Discouraged 1811 0.24 0 0.43 0 1 2320 0.23 0 0.42 0 1Constrained 1722 0.33 0 0.47 0 1 1406 0.43 0 0.49 0 1Loan needed 3087 0.56 1 0.50 0 1 3186 0.44 0 0.50 0 1
Apostolos Thomadakis (University of Warwick) (University of Warwick)Determinants of Credit Constrained Firms 21st of July 2016 16 / 44
Credit constrained �rms
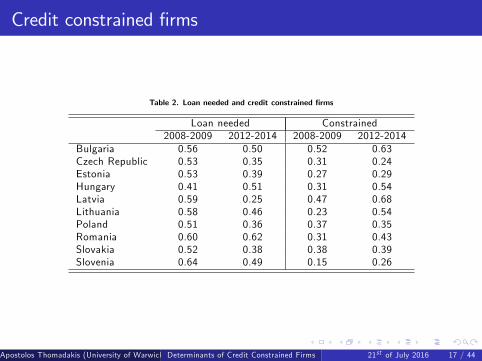
Table 2. Loan needed and credit constrained �rms
Loan needed Constrained2008-2009 2012-2014 2008-2009 2012-2014
Bulgaria 0.56 0.50 0.52 0.63Czech Republic 0.53 0.35 0.31 0.24Estonia 0.53 0.39 0.27 0.29Hungary 0.41 0.51 0.31 0.54Latvia 0.59 0.25 0.47 0.68Lithuania 0.58 0.46 0.23 0.54Poland 0.51 0.36 0.37 0.35Romania 0.60 0.62 0.31 0.43Slovakia 0.52 0.38 0.38 0.39Slovenia 0.64 0.49 0.15 0.26
Apostolos Thomadakis (University of Warwick) (University of Warwick)Determinants of Credit Constrained Firms 21st of July 2016 17 / 44
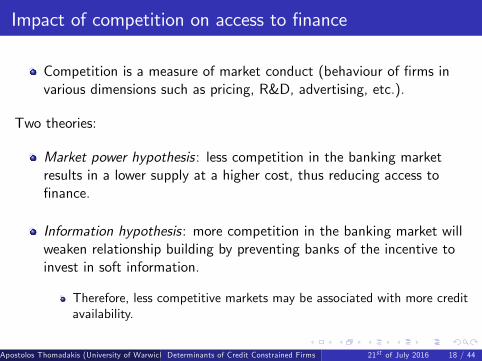
Impact of competition on access to �nance
Competition is a measure of market conduct (behaviour of �rms invarious dimensions such as pricing, R&D, advertising, etc.).
Two theories:
Market power hypothesis: less competition in the banking marketresults in a lower supply at a higher cost, thus reducing access to�nance.
Information hypothesis: more competition in the banking market willweaken relationship building by preventing banks of the incentive toinvest in soft information.
Therefore, less competitive markets may be associated with more creditavailability.
Apostolos Thomadakis (University of Warwick) (University of Warwick)Determinants of Credit Constrained Firms 21st of July 2016 18 / 44
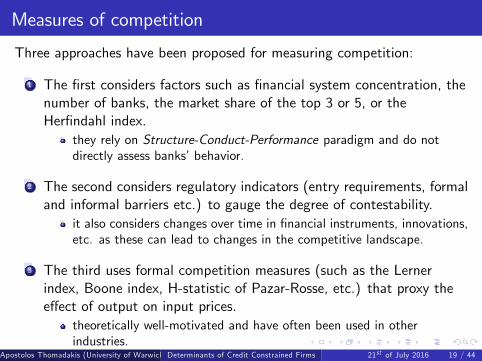
Measures of competition
Three approaches have been proposed for measuring competition:
1 The �rst considers factors such as �nancial system concentration, thenumber of banks, the market share of the top 3 or 5, or theHer�ndahl index.
they rely on Structure-Conduct-Performance paradigm and do notdirectly assess banks�behavior.
2 The second considers regulatory indicators (entry requirements, formaland informal barriers etc.) to gauge the degree of contestability.
it also considers changes over time in �nancial instruments, innovations,etc. as these can lead to changes in the competitive landscape.
3 The third uses formal competition measures (such as the Lernerindex, Boone index, H-statistic of Pazar-Rosse, etc.) that proxy thee¤ect of output on input prices.
theoretically well-motivated and have often been used in otherindustries.
Apostolos Thomadakis (University of Warwick) (University of Warwick)Determinants of Credit Constrained Firms 21st of July 2016 19 / 44
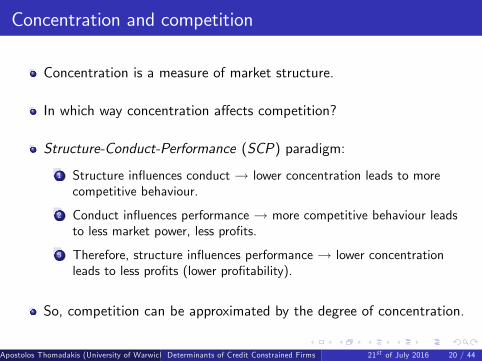
Concentration and competition
Concentration is a measure of market structure.
In which way concentration a¤ects competition?
Structure-Conduct-Performance (SCP) paradigm:
1 Structure in�uences conduct ! lower concentration leads to morecompetitive behaviour.
2 Conduct in�uences performance ! more competitive behaviour leadsto less market power, less pro�ts.
3 Therefore, structure in�uences performance ! lower concentrationleads to less pro�ts (lower pro�tability).
So, competition can be approximated by the degree of concentration.
Apostolos Thomadakis (University of Warwick) (University of Warwick)Determinants of Credit Constrained Firms 21st of July 2016 20 / 44
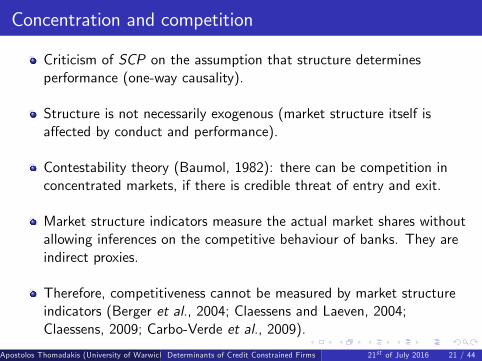
Concentration and competition
Criticism of SCP on the assumption that structure determinesperformance (one-way causality).
Structure is not necessarily exogenous (market structure itself isa¤ected by conduct and performance).
Contestability theory (Baumol, 1982): there can be competition inconcentrated markets, if there is credible threat of entry and exit.
Market structure indicators measure the actual market shares withoutallowing inferences on the competitive behaviour of banks. They areindirect proxies.
Therefore, competitiveness cannot be measured by market structureindicators (Berger et al., 2004; Claessens and Laeven, 2004;Claessens, 2009; Carbo-Verde et al., 2009).
Apostolos Thomadakis (University of Warwick) (University of Warwick)Determinants of Credit Constrained Firms 21st of July 2016 21 / 44
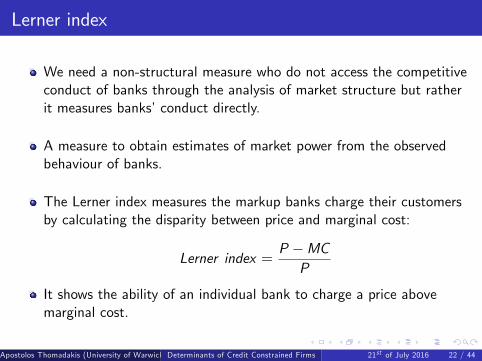
Lerner index
We need a non-structural measure who do not access the competitiveconduct of banks through the analysis of market structure but ratherit measures banks�conduct directly.
A measure to obtain estimates of market power from the observedbehaviour of banks.
The Lerner index measures the markup banks charge their customersby calculating the disparity between price and marginal cost:
Lerner index =P �MCP
It shows the ability of an individual bank to charge a price abovemarginal cost.
Apostolos Thomadakis (University of Warwick) (University of Warwick)Determinants of Credit Constrained Firms 21st of July 2016 22 / 44

Lerner index
Follwoing Fernandez de Guevara et al. (2005); Berger et al. (2008);Love and Peria (2014); Anginer et al. (2014), we estimate the costfunction:
log (Cit ) = a0i + β1 log(Qit ) + β2 [log(Qit )]2 + β3 log(W1,it ) + β4 log(W2,it ) +
+β5 log(W3,it ) + β6 log(Qit )� log(W1,it ) + β7 log(Qit )� log(W2,it ) +
+β8 log(Qit )� log(W3,it ) + β9 [log(W1,it )]2 + β10 [log(W2,it )]
2 +
+β11 [log(W3,it )]2 + β12 log(W1,it )� log(W2,it ) +
+β13 log(W1,it )� log(W3,it ) + β14 log(W2,it )� log(W3,it ) + Yt + εit
Using the estimated coe¢ cients we calculate the marginal cost:
MCit =∂Cit∂Qit
=CitQit
[β1 + β2 log(Qit ) + β6 log(W1,it ) + β7 log(W2,it ) + β8 log(W3,it )]
The index ranges between 0 (perfect competition) and 1 (monopoly).
Apostolos Thomadakis (University of Warwick) (University of Warwick)Determinants of Credit Constrained Firms 21st of July 2016 23 / 44
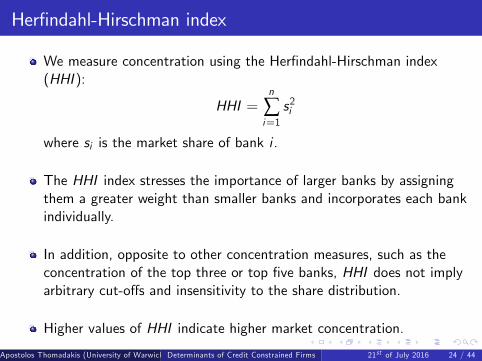
Her�ndahl-Hirschman index
We measure concentration using the Her�ndahl-Hirschman index(HHI ):
HHI =n
∑i=1s2i
where si is the market share of bank i .
The HHI index stresses the importance of larger banks by assigningthem a greater weight than smaller banks and incorporates each bankindividually.
In addition, opposite to other concentration measures, such as theconcentration of the top three or top �ve banks, HHI does not implyarbitrary cut-o¤s and insensitivity to the share distribution.
Higher values of HHI indicate higher market concentration.
Apostolos Thomadakis (University of Warwick) (University of Warwick)Determinants of Credit Constrained Firms 21st of July 2016 24 / 44
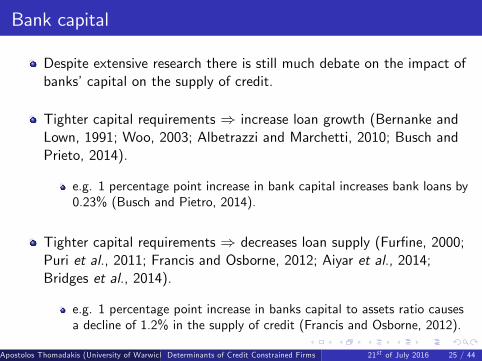
Bank capital
Despite extensive research there is still much debate on the impact ofbanks�capital on the supply of credit.
Tighter capital requirements ) increase loan growth (Bernanke andLown, 1991; Woo, 2003; Albetrazzi and Marchetti, 2010; Busch andPrieto, 2014).
e.g. 1 percentage point increase in bank capital increases bank loans by0.23% (Busch and Pietro, 2014).
Tighter capital requirements ) decreases loan supply (Fur�ne, 2000;Puri et al., 2011; Francis and Osborne, 2012; Aiyar et al., 2014;Bridges et al., 2014).
e.g. 1 percentage point increase in banks capital to assets ratio causesa decline of 1.2% in the supply of credit (Francis and Osborne, 2012).
Apostolos Thomadakis (University of Warwick) (University of Warwick)Determinants of Credit Constrained Firms 21st of July 2016 25 / 44
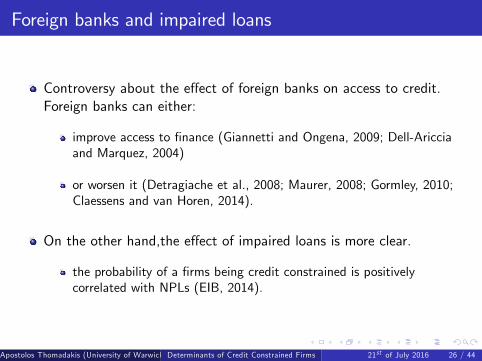
Foreign banks and impaired loans
Controversy about the e¤ect of foreign banks on access to credit.Foreign banks can either:
improve access to �nance (Giannetti and Ongena, 2009; Dell-Aricciaand Marquez, 2004)
or worsen it (Detragiache et al., 2008; Maurer, 2008; Gormley, 2010;Claessens and van Horen, 2014).
On the other hand,the e¤ect of impaired loans is more clear.
the probability of a �rms being credit constrained is positivelycorrelated with NPLs (EIB, 2014).
Apostolos Thomadakis (University of Warwick) (University of Warwick)Determinants of Credit Constrained Firms 21st of July 2016 26 / 44
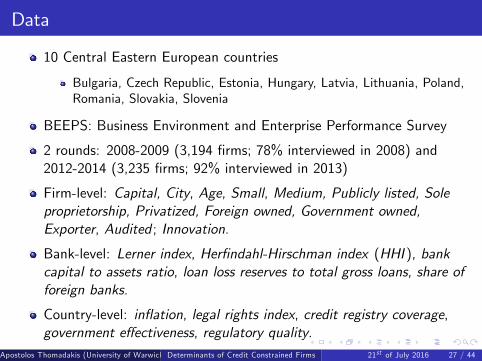
Data
10 Central Eastern European countries
Bulgaria, Czech Republic, Estonia, Hungary, Latvia, Lithuania, Poland,Romania, Slovakia, Slovenia
BEEPS: Business Environment and Enterprise Performance Survey
2 rounds: 2008-2009 (3,194 �rms; 78% interviewed in 2008) and2012-2014 (3,235 �rms; 92% interviewed in 2013)
Firm-level: Capital, City, Age, Small, Medium, Publicly listed, Soleproprietorship, Privatized, Foreign owned, Government owned,Exporter, Audited ; Innovation.
Bank-level: Lerner index, Her�ndahl-Hirschman index (HHI ), bankcapital to assets ratio, loan loss reserves to total gross loans, share offoreign banks.
Country-level: in�ation, legal rights index, credit registry coverage,government e¤ectiveness, regulatory quality.
Apostolos Thomadakis (University of Warwick) (University of Warwick)Determinants of Credit Constrained Firms 21st of July 2016 27 / 44
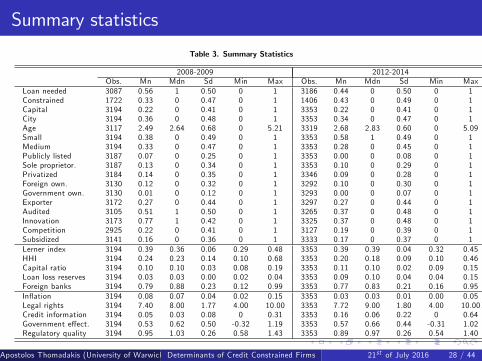
Summary statistics
Table 3. Summary Statistics
2008-2009 2012-2014Obs. Mn Mdn Sd Min Max Obs. Mn Mdn Sd Min Max
Loan needed 3087 0.56 1 0.50 0 1 3186 0.44 0 0.50 0 1Constrained 1722 0.33 0 0.47 0 1 1406 0.43 0 0.49 0 1Capital 3194 0.22 0 0.41 0 1 3353 0.22 0 0.41 0 1City 3194 0.36 0 0.48 0 1 3353 0.34 0 0.47 0 1Age 3117 2.49 2.64 0.68 0 5.21 3319 2.68 2.83 0.60 0 5.09Small 3194 0.38 0 0.49 0 1 3353 0.58 1 0.49 0 1Medium 3194 0.33 0 0.47 0 1 3353 0.28 0 0.45 0 1Publicly listed 3187 0.07 0 0.25 0 1 3353 0.00 0 0.08 0 1Sole proprietor. 3187 0.13 0 0.34 0 1 3353 0.10 0 0.29 0 1Privatized 3184 0.14 0 0.35 0 1 3346 0.09 0 0.28 0 1Foreign own. 3130 0.12 0 0.32 0 1 3292 0.10 0 0.30 0 1Government own. 3130 0.01 0 0.12 0 1 3293 0.00 0 0.07 0 1Exporter 3172 0.27 0 0.44 0 1 3297 0.27 0 0.44 0 1Audited 3105 0.51 1 0.50 0 1 3265 0.37 0 0.48 0 1Innovation 3173 0.77 1 0.42 0 1 3325 0.37 0 0.48 0 1Competition 2925 0.22 0 0.41 0 1 3127 0.19 0 0.39 0 1Subsidized 3141 0.16 0 0.36 0 1 3333 0.17 0 0.37 0 1Lerner index 3194 0.39 0.36 0.06 0.29 0.48 3353 0.39 0.39 0.04 0.32 0.45HHI 3194 0.24 0.23 0.14 0.10 0.68 3353 0.20 0.18 0.09 0.10 0.46Capital ratio 3194 0.10 0.10 0.03 0.08 0.19 3353 0.11 0.10 0.02 0.09 0.15Loan loss reserves 3194 0.03 0.03 0.00 0.02 0.04 3353 0.09 0.10 0.04 0.04 0.15Foreign banks 3194 0.79 0.88 0.23 0.12 0.99 3353 0.77 0.83 0.21 0.16 0.95In�ation 3194 0.08 0.07 0.04 0.02 0.15 3353 0.03 0.03 0.01 0.00 0.05Legal rights 3194 7.40 8.00 1.77 4.00 10.00 3353 7.72 9.00 1.80 4.00 10.00Credit information 3194 0.05 0.03 0.08 0 0.31 3353 0.16 0.06 0.22 0 0.64Government e¤ect. 3194 0.53 0.62 0.50 -0.32 1.19 3353 0.57 0.66 0.44 -0.31 1.02Regulatory quality 3194 0.95 1.03 0.26 0.58 1.43 3353 0.89 0.97 0.26 0.54 1.40
Apostolos Thomadakis (University of Warwick) (University of Warwick)Determinants of Credit Constrained Firms 21st of July 2016 28 / 44
Summary statistics
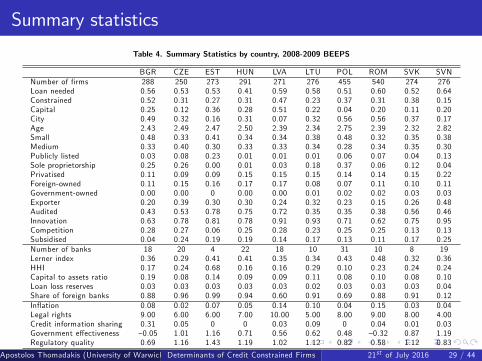
Table 4. Summary Statistics by country, 2008-2009 BEEPS
BGR CZE EST HUN LVA LTU POL ROM SVK SVNNumber of �rms 288 250 273 291 271 276 455 540 274 276Loan needed 0.56 0.53 0.53 0.41 0.59 0.58 0.51 0.60 0.52 0.64Constrained 0.52 0.31 0.27 0.31 0.47 0.23 0.37 0.31 0.38 0.15Capital 0.25 0.12 0.36 0.28 0.51 0.22 0.04 0.20 0.11 0.20City 0.49 0.32 0.16 0.31 0.07 0.32 0.56 0.56 0.37 0.17Age 2.43 2.49 2.47 2.50 2.39 2.34 2.75 2.39 2.32 2.82Small 0.48 0.33 0.41 0.34 0.34 0.38 0.48 0.32 0.35 0.38Medium 0.33 0.40 0.30 0.33 0.33 0.34 0.28 0.34 0.35 0.30Publicly listed 0.03 0.08 0.23 0.01 0.01 0.01 0.06 0.07 0.04 0.13Sole proprietorship 0.25 0.26 0.00 0.01 0.03 0.18 0.37 0.06 0.12 0.04Privatised 0.11 0.09 0.09 0.15 0.15 0.15 0.14 0.14 0.15 0.22Foreign-owned 0.11 0.15 0.16 0.17 0.17 0.08 0.07 0.11 0.10 0.11Government-owned 0.00 0.00 0 0.00 0.00 0.01 0.02 0.02 0.03 0.03Exporter 0.20 0.39 0.30 0.30 0.24 0.32 0.23 0.15 0.26 0.48Audited 0.43 0.53 0.78 0.75 0.72 0.35 0.35 0.38 0.56 0.46Innovation 0.63 0.78 0.81 0.78 0.91 0.93 0.71 0.62 0.75 0.95Competition 0.28 0.27 0.06 0.25 0.28 0.23 0.25 0.25 0.13 0.13Subsidised 0.04 0.24 0.19 0.19 0.14 0.17 0.13 0.11 0.17 0.25Number of banks 18 20 4 22 18 10 31 10 8 19Lerner index 0.36 0.29 0.41 0.41 0.35 0.34 0.43 0.48 0.32 0.36HHI 0.17 0.24 0.68 0.16 0.16 0.29 0.10 0.23 0.24 0.24Capital to assets ratio 0.19 0.08 0.14 0.09 0.09 0.11 0.08 0.10 0.08 0.10Loan loss reserves 0.03 0.03 0.03 0.03 0.03 0.02 0.03 0.03 0.03 0.04Share of foreign banks 0.88 0.96 0.99 0.94 0.60 0.91 0.69 0.88 0.91 0.12In�ation 0.08 0.02 0.07 0.05 0.14 0.10 0.04 0.15 0.03 0.04Legal rights 9.00 6.00 6.00 7.00 10.00 5.00 8.00 9.00 8.00 4.00Credit information sharing 0.31 0.05 0 0 0.03 0.09 0 0.04 0.01 0.03Government e¤ectiveness �0.05 1.01 1.16 0.71 0.56 0.62 0.48 �0.32 0.87 1.19Regulatory quality 0.69 1.16 1.43 1.19 1.02 1.12 0.82 0.58 1.12 0.83
Apostolos Thomadakis (University of Warwick) (University of Warwick)Determinants of Credit Constrained Firms 21st of July 2016 29 / 44
Summary statistics
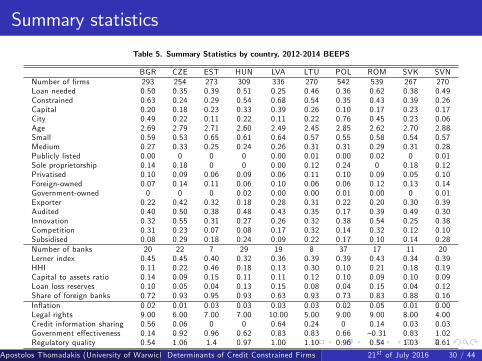
Table 5. Summary Statistics by country, 2012-2014 BEEPS
BGR CZE EST HUN LVA LTU POL ROM SVK SVNNumber of �rms 293 254 273 309 336 270 542 539 267 270Loan needed 0.50 0.35 0.39 0.51 0.25 0.46 0.36 0.62 0.38 0.49Constrained 0.63 0.24 0.29 0.54 0.68 0.54 0.35 0.43 0.39 0.26Capital 0.20 0.18 0.23 0.33 0.39 0.26 0.10 0.17 0.23 0.17City 0.49 0.22 0.11 0.22 0.11 0.22 0.76 0.45 0.23 0.06Age 2.69 2.79 2.71 2.60 2.49 2.45 2.85 2.62 2.70 2.88Small 0.59 0.53 0.65 0.61 0.64 0.57 0.55 0.58 0.54 0.57Medium 0.27 0.33 0.25 0.24 0.26 0.31 0.31 0.29 0.31 0.28Publicly listed 0.00 0 0 0 0.00 0.01 0.00 0.02 0 0.01Sole proprietorship 0.14 0.18 0 0 0.00 0.12 0.24 0 0.18 0.12Privatised 0.10 0.09 0.06 0.09 0.06 0.11 0.10 0.09 0.05 0.10Foreign-owned 0.07 0.14 0.11 0.06 0.10 0.06 0.06 0.12 0.13 0.14Government-owned 0 0 0 0.02 0.00 0.00 0.01 0.00 0 0.01Exporter 0.22 0.42 0.32 0.18 0.28 0.31 0.22 0.20 0.30 0.39Audited 0.40 0.50 0.38 0.48 0.43 0.35 0.17 0.39 0.49 0.30Innovation 0.32 0.55 0.31 0.27 0.26 0.32 0.38 0.54 0.25 0.38Competition 0.31 0.23 0.07 0.08 0.17 0.32 0.14 0.32 0.12 0.10Subsidised 0.08 0.29 0.18 0.24 0.09 0.22 0.17 0.10 0.14 0.28Number of banks 20 22 7 29 19 8 37 17 11 20Lerner index 0.45 0.45 0.40 0.32 0.36 0.39 0.39 0.43 0.34 0.39HHI 0.11 0.22 0.46 0.18 0.13 0.30 0.10 0.21 0.18 0.19Capital to assets ratio 0.14 0.09 0.15 0.11 0.11 0.12 0.10 0.09 0.10 0.09Loan loss reserves 0.10 0.05 0.04 0.13 0.15 0.08 0.04 0.15 0.04 0.12Share of foreign banks 0.72 0.93 0.95 0.93 0.63 0.93 0.73 0.83 0.88 0.16In�ation 0.02 0.01 0.03 0.03 0.03 0.03 0.02 0.05 0.01 0.00Legal rights 9.00 6.00 7.00 7.00 10.00 5.00 9.00 9.00 8.00 4.00Credit information sharing 0.56 0.06 0 0 0.64 0.24 0 0.14 0.03 0.03Government e¤ectiveness 0.14 0.92 0.96 0.62 0.83 0.83 0.66 �0.31 0.83 1.02Regulatory quality 0.54 1.06 1.4 0.97 1.00 1.10 0.96 0.54 1.03 0.61
Apostolos Thomadakis (University of Warwick) (University of Warwick)Determinants of Credit Constrained Firms 21st of July 2016 30 / 44
Summary statistics
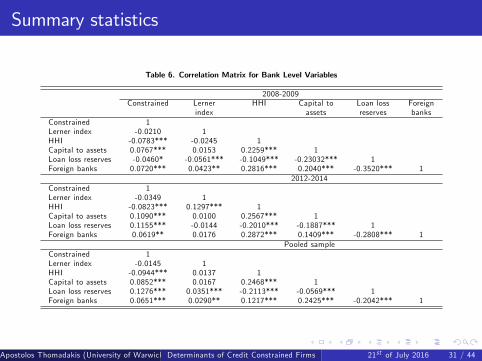
Table 6. Correlation Matrix for Bank Level Variables
2008-2009Constrained Lerner HHI Capital to Loan loss Foreign
index assets reserves banksConstrained 1Lerner index -0.0210 1HHI -0.0783*** -0.0245 1Capital to assets 0.0767*** 0.0153 0.2259*** 1Loan loss reserves -0.0460* -0.0561*** -0.1049*** -0.23032*** 1Foreign banks 0.0720*** 0.0423** 0.2816*** 0.2040*** -0.3520*** 1
2012-2014Constrained 1Lerner index -0.0349 1HHI -0.0823*** 0.1297*** 1Capital to assets 0.1090*** 0.0100 0.2567*** 1Loan loss reserves 0.1155*** -0.0144 -0.2010*** -0.1887*** 1Foreign banks 0.0619** 0.0176 0.2872*** 0.1409*** -0.2808*** 1
Pooled sampleConstrained 1Lerner index -0.0145 1HHI -0.0944*** 0.0137 1Capital to assets 0.0852*** 0.0167 0.2468*** 1Loan loss reserves 0.1276*** 0.0351*** -0.2113*** -0.0569*** 1Foreign banks 0.0651*** 0.0290** 0.1217*** 0.2425*** -0.2042*** 1
Apostolos Thomadakis (University of Warwick) (University of Warwick)Determinants of Credit Constrained Firms 21st of July 2016 31 / 44
Summary statistics
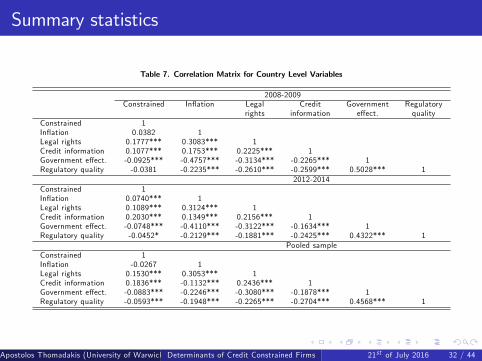
Table 7. Correlation Matrix for Country Level Variables
2008-2009Constrained In�ation Legal Credit Government Regulatory
rights information e¤ect. qualityConstrained 1In�ation 0.0382 1Legal rights 0.1777*** 0.3083*** 1Credit information 0.1077*** 0.1753*** 0.2225*** 1Government e¤ect. -0.0925*** -0.4757*** -0.3134*** -0.2265*** 1Regulatory quality -0.0381 -0.2235*** -0.2610*** -0.2599*** 0.5028*** 1
2012-2014Constrained 1In�ation 0.0740*** 1Legal rights 0.1089*** 0.3124*** 1Credit information 0.2030*** 0.1349*** 0.2156*** 1Government e¤ect. -0.0748*** -0.4110*** -0.3122*** -0.1634*** 1Regulatory quality -0.0452* -0.2129*** -0.1881*** -0.2425*** 0.4322*** 1
Pooled sampleConstrained 1In�ation -0.0267 1Legal rights 0.1530*** 0.3053*** 1Credit information 0.1836*** -0.1132*** 0.2436*** 1Government e¤ect. -0.0883*** -0.2246*** -0.3080*** -0.1878*** 1Regulatory quality -0.0593*** -0.1948*** -0.2265*** -0.2704*** 0.4568*** 1
Apostolos Thomadakis (University of Warwick) (University of Warwick)Determinants of Credit Constrained Firms 21st of July 2016 32 / 44
Model
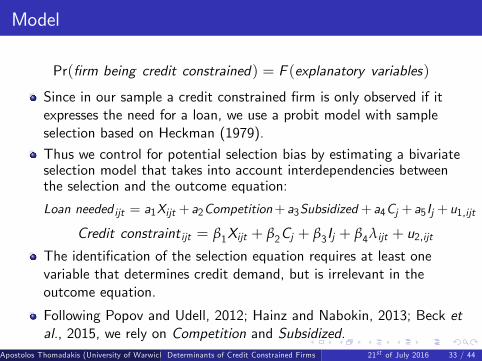
Pr(�rm being credit constrained) = F (explanatory variables)
Since in our sample a credit constrained �rm is only observed if itexpresses the need for a loan, we use a probit model with sampleselection based on Heckman (1979).
Thus we control for potential selection bias by estimating a bivariateselection model that takes into account interdependencies betweenthe selection and the outcome equation:
Loan needed ijt = a1Xijt + a2Competition+ a3Subsidized + a4Cj + a5Ij +u1,ijt
Credit constraint ijt = β1Xijt + β2Cj + β3Ij + β4λijt + u2,ijtThe identi�cation of the selection equation requires at least onevariable that determines credit demand, but is irrelevant in theoutcome equation.
Following Popov and Udell, 2012; Hainz and Nabokin, 2013; Beck etal., 2015, we rely on Competition and Subsidized.
Apostolos Thomadakis (University of Warwick) (University of Warwick)Determinants of Credit Constrained Firms 21st of July 2016 33 / 44
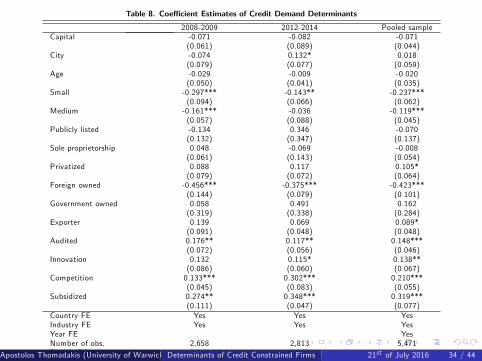
Table 8. Coe¢ cient Estimates of Credit Demand Determinants
2008-2009 2012-2014 Pooled sampleCapital -0.071 -0.082 -0.071
(0.061) (0.089) (0.044)City -0.074 0.132* 0.018
(0.079) (0.077) (0.059)Age -0.029 -0.009 -0.020
(0.050) (0.041) (0.035)Small -0.297*** -0.143** -0.237***
(0.094) (0.066) (0.062)Medium -0.161*** -0.036 -0.119***
(0.057) (0.088) (0.045)Publicly listed -0.134 0.346 -0.070
(0.132) (0.347) (0.137)Sole proprietorship 0.048 -0.069 -0.008
(0.061) (0.143) (0.054)Privatized 0.088 0.117 0.105*
(0.079) (0.072) (0.064)Foreign owned -0.456*** -0.375*** -0.423***
(0.144) (0.079) (0.101)Government owned 0.058 0.491 0.162
(0.319) (0.338) (0.284)Exporter 0.139 0.069 0.089*
(0.091) (0.048) (0.048)Audited 0.176** 0.117** 0.148***
(0.072) (0.056) (0.046)Innovation 0.132 0.115* 0.138**
(0.086) (0.060) (0.067)Competition 0.133*** 0.302*** 0.210***
(0.045) (0.083) (0.055)Subsidized 0.274** 0.348*** 0.319***
(0.111) (0.047) (0.077)Country FE Yes Yes YesIndustry FE Yes Yes YesYear FE YesNumber of obs. 2,658 2,813 5,471Pseudo R2 0.047 0.069 0.056Apostolos Thomadakis (University of Warwick) (University of Warwick)Determinants of Credit Constrained Firms 21st of July 2016 34 / 44
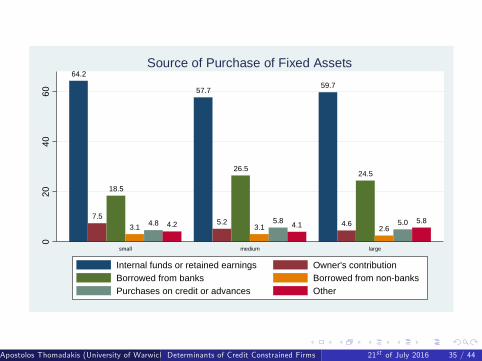
64.2
7.5
18.5
3.1 4.8 4.2
57.7
5.2
26.5
3.15.8 4.1
59.7
4.6
24.5
2.65.0 5.8
020
4060
small medium large
Source of Purchase of Fixed Assets
Internal funds or retained earnings Owner's contributionBorrowed from banks Borrowed from nonbanksPurchases on credit or advances Other
Apostolos Thomadakis (University of Warwick) (University of Warwick)Determinants of Credit Constrained Firms 21st of July 2016 35 / 44
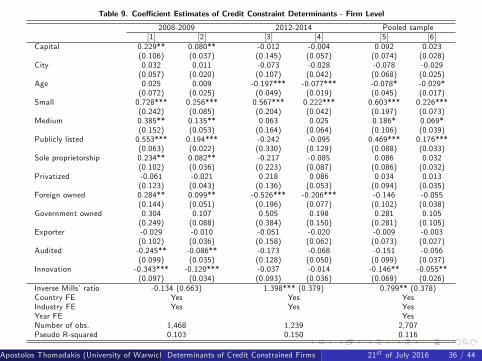
Table 9. Coe¢ cient Estimates of Credit Constraint Determinants - Firm Level
2008-2009 2012-2014 Pooled sample[1] [2] [3] [4] [5] [6]
Capital 0.229** 0.080** -0.012 -0.004 0.092 0.023(0.106) (0.037) (0.145) (0.057) (0.074) (0.028)
City 0.032 0.011 -0.073 -0.028 -0.078 -0.029(0.057) (0.020) (0.107) (0.042) (0.068) (0.025)
Age 0.025 0.009 -0.197*** -0.077*** -0.078* -0.029*(0.072) (0.025) (0.049) (0.019) (0.045) (0.017)
Small 0.728*** 0.256*** 0.567*** 0.222*** 0.603*** 0.226***(0.242) (0.085) (0.204) (0.042) (0.197) (0.073)
Medium 0.385** 0.135** 0.063 0.025 0.186* 0.069*(0.152) (0.053) (0.164) (0.064) (0.106) (0.039)
Publicly listed 0.553*** 0.194*** -0.242 -0.095 0.469*** 0.176***(0.063) (0.022) (0.330) (0.129) (0.088) (0.033)
Sole proprietorship 0.234** 0.082** -0.217 -0.085 0.086 0.032(0.102) (0.036) (0.223) (0.087) (0.086) (0.032)
Privatized -0.061 -0.021 0.218 0.086 0.034 0.013(0.123) (0.043) (0.136) (0.053) (0.094) (0.035)
Foreign owned 0.284** 0.099** -0.526*** -0.206*** -0.146 -0.055(0.144) (0.051) (0.196) (0.077) (0.102) (0.038)
Government owned 0.304 0.107 0.505 0.198 0.281 0.105(0.249) (0.088) (0.384) (0.150) (0.281) (0.105)
Exporter -0.029 -0.010 -0.051 -0.020 -0.009 -0.003(0.102) (0.036) (0.158) (0.062) (0.073) (0.027)
Audited -0.245** -0.086** -0.173 -0.068 -0.151 -0.056(0.099) (0.035) (0.128) (0.050) (0.099) (0.037)
Innovation -0.343*** -0.120*** -0.037 -0.014 -0.146** -0.055**(0.097) (0.034) (0.093) (0.036) (0.069) (0.026)
Inverse Mills�ratio -0.134 (0.663) 1.398*** (0.379) 0.799** (0.378)Country FE Yes Yes YesIndustry FE Yes Yes YesYear FE YesNumber of obs. 1,468 1,239 2,707Pseudo R-squared 0.103 0.150 0.116
Apostolos Thomadakis (University of Warwick) (University of Warwick)Determinants of Credit Constrained Firms 21st of July 2016 36 / 44
Results
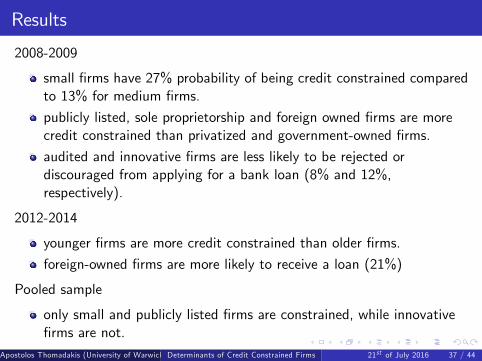
2008-2009
small �rms have 27% probability of being credit constrained comparedto 13% for medium �rms.
publicly listed, sole proprietorship and foreign owned �rms are morecredit constrained than privatized and government-owned �rms.
audited and innovative �rms are less likely to be rejected ordiscouraged from applying for a bank loan (8% and 12%,respectively).
2012-2014
younger �rms are more credit constrained than older �rms.
foreign-owned �rms are more likely to receive a loan (21%)
Pooled sample
only small and publicly listed �rms are constrained, while innovative�rms are not.
Apostolos Thomadakis (University of Warwick) (University of Warwick)Determinants of Credit Constrained Firms 21st of July 2016 37 / 44
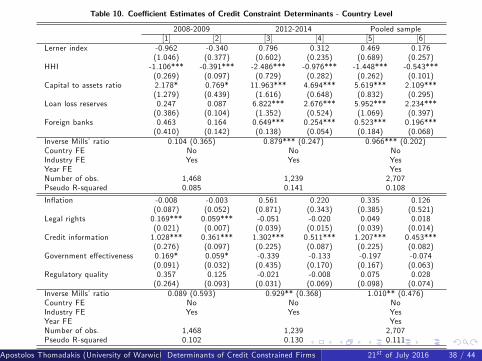
Table 10. Coe¢ cient Estimates of Credit Constraint Determinants - Country Level
2008-2009 2012-2014 Pooled sample[1] [2] [3] [4] [5] [6]
Lerner index -0.962 -0.340 0.796 0.312 0.469 0.176(1.046) (0.377) (0.602) (0.235) (0.689) (0.257)
HHI -1.106*** -0.391*** -2.486*** -0.976*** -1.448*** -0.543***(0.269) (0.097) (0.729) (0.282) (0.262) (0.101)
Capital to assets ratio 2.178* 0.769* 11.963*** 4.694*** 5.619*** 2.109***(1.279) (0.439) (1.616) (0.648) (0.832) (0.295)
Loan loss reserves 0.247 0.087 6.822*** 2.676*** 5.952*** 2.234***(0.386) (0.104) (1.352) (0.524) (1.069) (0.397)
Foreign banks 0.463 0.164 0.649*** 0.254*** 0.523*** 0.196***(0.410) (0.142) (0.138) (0.054) (0.184) (0.068)
Inverse Mills�ratio 0.104 (0.365) 0.879*** (0.247) 0.966*** (0.202)Country FE No No NoIndustry FE Yes Yes YesYear FE YesNumber of obs. 1,468 1,239 2,707Pseudo R-squared 0.085 0.141 0.108
In�ation -0.008 -0.003 0.561 0.220 0.335 0.126(0.087) (0.052) (0.871) (0.343) (0.385) (0.521)
Legal rights 0.169*** 0.059*** -0.051 -0.020 0.049 0.018(0.021) (0.007) (0.039) (0.015) (0.039) (0.014)
Credit information 1.028*** 0.361*** 1.302*** 0.511*** 1.207*** 0.453***(0.276) (0.097) (0.225) (0.087) (0.225) (0.082)
Government e¤ectiveness 0.169* 0.059* -0.339 -0.133 -0.197 -0.074(0.091) (0.032) (0.435) (0.170) (0.167) (0.063)
Regulatory quality 0.357 0.125 -0.021 -0.008 0.075 0.028(0.264) (0.093) (0.031) (0.069) (0.098) (0.074)
Inverse Mills�ratio 0.089 (0.593) 0.929** (0.368) 1.010** (0.476)Country FE No No NoIndustry FE Yes Yes YesYear FE YesNumber of obs. 1,468 1,239 2,707Pseudo R-squared 0.102 0.130 0.111
Apostolos Thomadakis (University of Warwick) (University of Warwick)Determinants of Credit Constrained Firms 21st of July 2016 38 / 44
Results - Banking sector environment
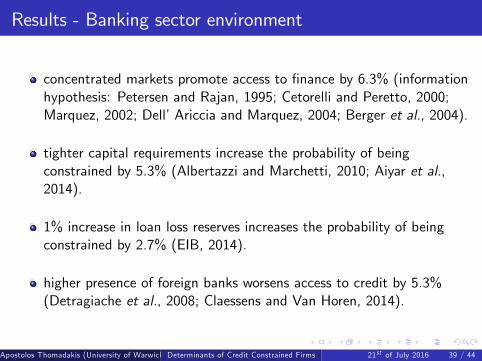
concentrated markets promote access to �nance by 6.3% (informationhypothesis: Petersen and Rajan, 1995; Cetorelli and Peretto, 2000;Marquez, 2002; Dell�Ariccia and Marquez, 2004; Berger et al., 2004).
tighter capital requirements increase the probability of beingconstrained by 5.3% (Albertazzi and Marchetti, 2010; Aiyar et al.,2014).
1% increase in loan loss reserves increases the probability of beingconstrained by 2.7% (EIB, 2014).
higher presence of foreign banks worsens access to credit by 5.3%(Detragiache et al., 2008; Claessens and Van Horen, 2014).
Apostolos Thomadakis (University of Warwick) (University of Warwick)Determinants of Credit Constrained Firms 21st of July 2016 39 / 44
Results - Institutional and regulatory environment
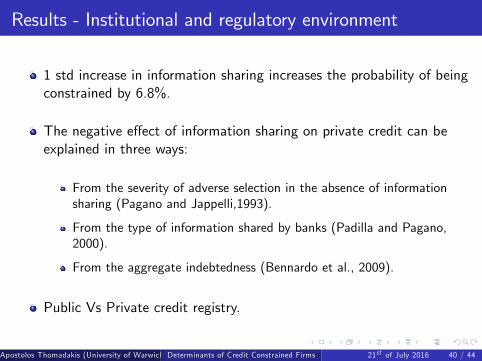
1 std increase in information sharing increases the probability of beingconstrained by 6.8%.
The negative e¤ect of information sharing on private credit can beexplained in three ways:
From the severity of adverse selection in the absence of informationsharing (Pagano and Jappelli,1993).
From the type of information shared by banks (Padilla and Pagano,2000).
From the aggregate indebtedness (Bennardo et al., 2009).
Public Vs Private credit registry.
Apostolos Thomadakis (University of Warwick) (University of Warwick)Determinants of Credit Constrained Firms 21st of July 2016 40 / 44
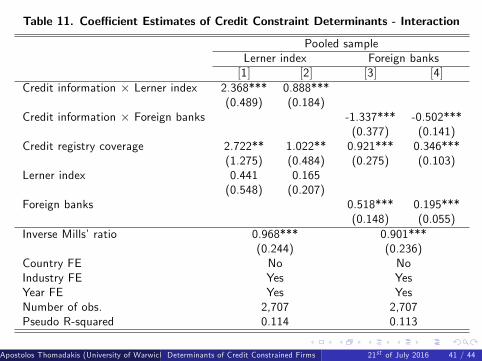
Table 11. Coe¢ cient Estimates of Credit Constraint Determinants - Interaction
Pooled sampleLerner index Foreign banks[1] [2] [3] [4]
Credit information � Lerner index 2.368*** 0.888***(0.489) (0.184)
Credit information � Foreign banks -1.337*** -0.502***(0.377) (0.141)
Credit registry coverage 2.722** 1.022** 0.921*** 0.346***(1.275) (0.484) (0.275) (0.103)
Lerner index 0.441 0.165(0.548) (0.207)
Foreign banks 0.518*** 0.195***(0.148) (0.055)
Inverse Mills�ratio 0.968*** 0.901***(0.244) (0.236)
Country FE No NoIndustry FE Yes YesYear FE Yes YesNumber of obs. 2,707 2,707Pseudo R-squared 0.114 0.113
Apostolos Thomadakis (University of Warwick) (University of Warwick)Determinants of Credit Constrained Firms 21st of July 2016 41 / 44
Results - Interaction
more competition signi�cantly mitigates the negative impact ofinformation sharing and increases access to �nance.
a 1 std decrease in Lerner index will reduce the probability of beingconstrained by 4%.
higher presence of foreign banks also mitigates the negative impact ofinformation sharing and increases access to �nance.
a 1 std increase in share of foreign banks will reduce the probability ofbeing constrained by 5.6%.
Apostolos Thomadakis (University of Warwick) (University of Warwick)Determinants of Credit Constrained Firms 21st of July 2016 42 / 44
Conclusion
Demand side analysis: small and foreign-owned �rms are less likely toneed a loan.
Audited and innovative �rms have higher credit demand.
Supply side: small, medium, publicly listed, sole proprietorship andforeign-onwed �rms were more likely to be constrained in 2008-2009than in 2012-2014.
Audited and innovative �rms are lees likely to be constrained.
Country side: more concentrated markets promote access to �nance.
tighter capital requirements, high levels of Loan Loss Reserves andhigher presence of foreign banks make �rms more constrained.higher level of information sharing worsens access to �nance.
However, more competition and higher presence of foreign banks canmitigate the negative impact of information sharing on bank credit.
Apostolos Thomadakis (University of Warwick) (University of Warwick)Determinants of Credit Constrained Firms 21st of July 2016 43 / 44
The road ahead
Focus at the needs of SMEs
Diversity on the sources of �nance and lending techniques
Wider and more accurate coverage of public credit bureaus
Better and common legal and regulatory framework across Europe
Not only to support banking supervision, but also to improve thequality and quantity of data
Apostolos Thomadakis (University of Warwick) (University of Warwick)Determinants of Credit Constrained Firms 21st of July 2016 44 / 44