apoorva deshpande
TRANSCRIPT
A PROJECT REPORT
ON
“Matching the residential growth patterns with buyer preference (Pune).”
AT
JONES LANG LASALLE.
SUBMITTED TO
MAEER’s MIT SCHOOL OF BUSINESS
BY
APOORVA DESHPANDE
2804442
28TH PGDM
Under the esteemed guidance of
Prof. N.J. CHAVAN
MIT- SOB, PUNE
IN PARTIAL FULFILLMENT OF
POST GRADUATE DIPLOMA IN MANAGEMENT (PGDM)
2010-2012
1
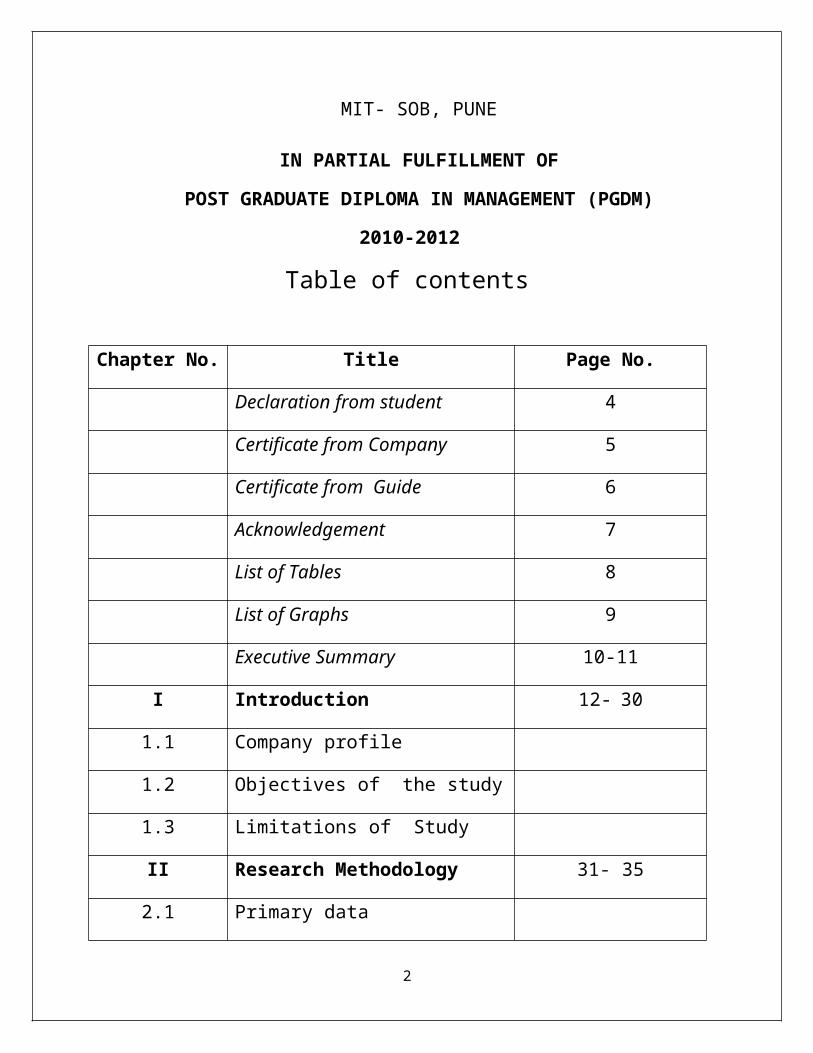
Table of contents
Chapter No. Title Page No.
Declaration from student 4
Certificate from Company 5
Certificate from Guide 6
Acknowledgement 7
List of Tables 8
List of Graphs 9
Executive Summary 10-11
I Introduction 12- 30
1.1 Company profile
1.2 Objectives of the study
1.3 Limitations of Study
II Research Methodology 31- 35
2.1 Primary data
2.2 Secondary data
2.3 Sample design
2.4 Population
2.5 Sample size
2.6 Sampling method
2
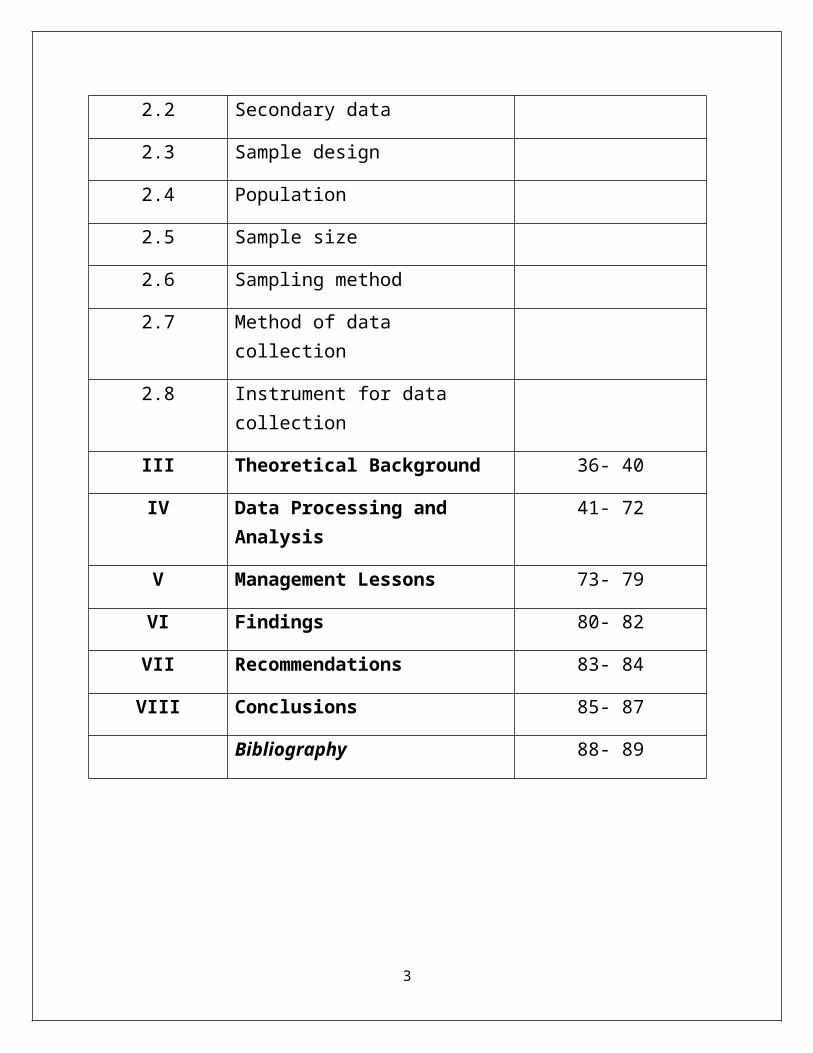
2.7 Method of data collection
2.8 Instrument for data collection
III Theoretical Background 36- 40
IV Data Processing and Analysis 41- 72
V Management Lessons 73- 79
VI Findings 80- 82
VII Recommendations 83- 84
VIII Conclusions 85- 87
Bibliography 88- 89
3

DECLARATION
I, Ms. APOORVA M. DESHPANDE hereby declare that this project report is the record of
authentic work carried out by me during the period from 12 th May 2011 to 2nd July 2011 and has
not been submitted to any other University or Institute for the award of any degree / diploma etc.
Signature:
(APOORVA DESHPANDE)
Date:
4

5

6

ACKNOWLEDGEMENT
Completion of research and writing of the report is a satisfying event and the pleasant part is the
opportunity to thank those who inspired, contributed and cooperated to it.
I am thankful to Mr. Jai Singh, Residential head, Mr. Adhishesh Mitra, Capital markets
head and Mr. Sameer Gholve for their constant guidance and support throughout the duration
of the project. I would also like to thank all the staff at JLL for their cooperation.
I take the opportunity to offer my deep sense gratitude and reverence to Mr. N.J. Chavan, my
internal project guide for his beneficial co-operative help. His immense support has been a real
force behind completion of this project.
Last but not the least, I would like to thank all the respondents who spent their precious time to
answer the questions, without their support this project would not have been successfully
completed.
Apoorva Deshpande.
7

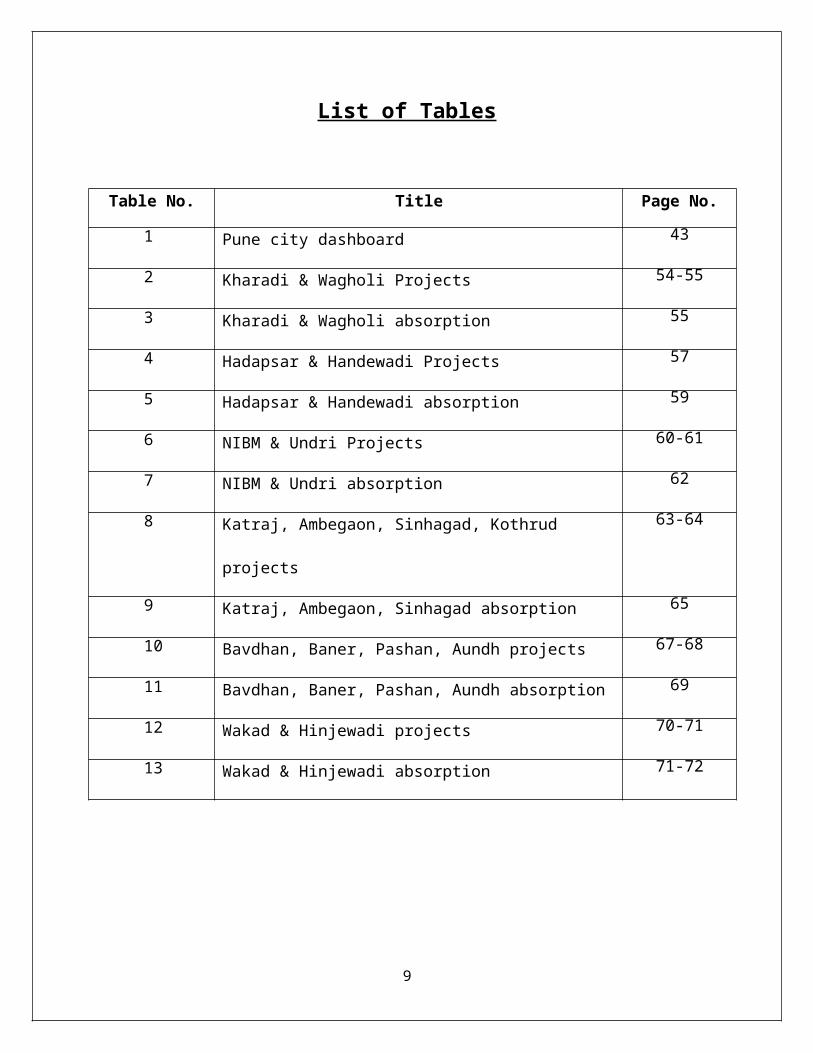
List of Tables
Table No. Title Page No.
1 Pune city dashboard 43
2 Kharadi & Wagholi Projects 54-55
3 Kharadi & Wagholi absorption 55
4 Hadapsar & Handewadi Projects 57
5 Hadapsar & Handewadi absorption 59
6 NIBM & Undri Projects 60-61
7 NIBM & Undri absorption 62
8 Katraj, Ambegaon, Sinhagad, Kothrud projects 63-64
9 Katraj, Ambegaon, Sinhagad absorption 65
10 Bavdhan, Baner, Pashan, Aundh projects 67-68
11 Bavdhan, Baner, Pashan, Aundh absorption 69
12 Wakad & Hinjewadi projects 70-71
13 Wakad & Hinjewadi absorption 71-72
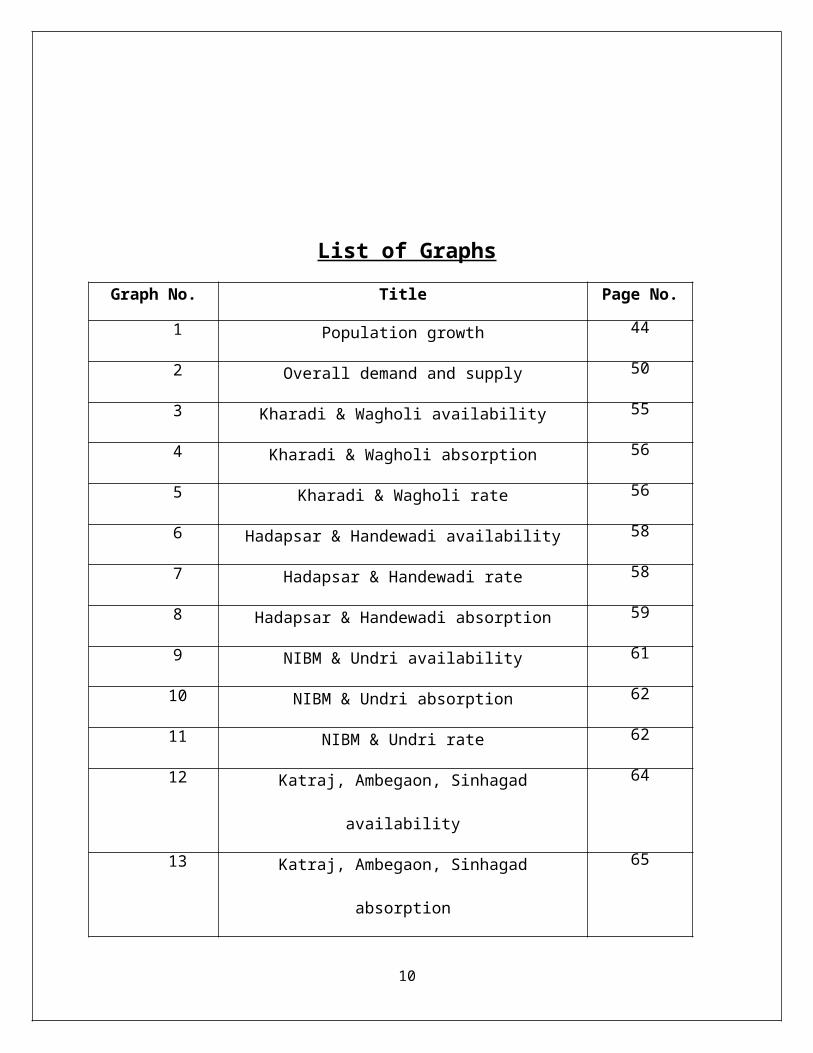
List of Graphs
8
Graph No. Title Page No.
1 Population growth 44
2 Overall demand and supply 50
3 Kharadi & Wagholi availability 55
4 Kharadi & Wagholi absorption 56
5 Kharadi & Wagholi rate 56
6 Hadapsar & Handewadi availability 58
7 Hadapsar & Handewadi rate 58
8 Hadapsar & Handewadi absorption 59
9 NIBM & Undri availability 61
10 NIBM & Undri absorption 62
11 NIBM & Undri rate 62
12 Katraj, Ambegaon, Sinhagad availability 64
13 Katraj, Ambegaon, Sinhagad absorption 65
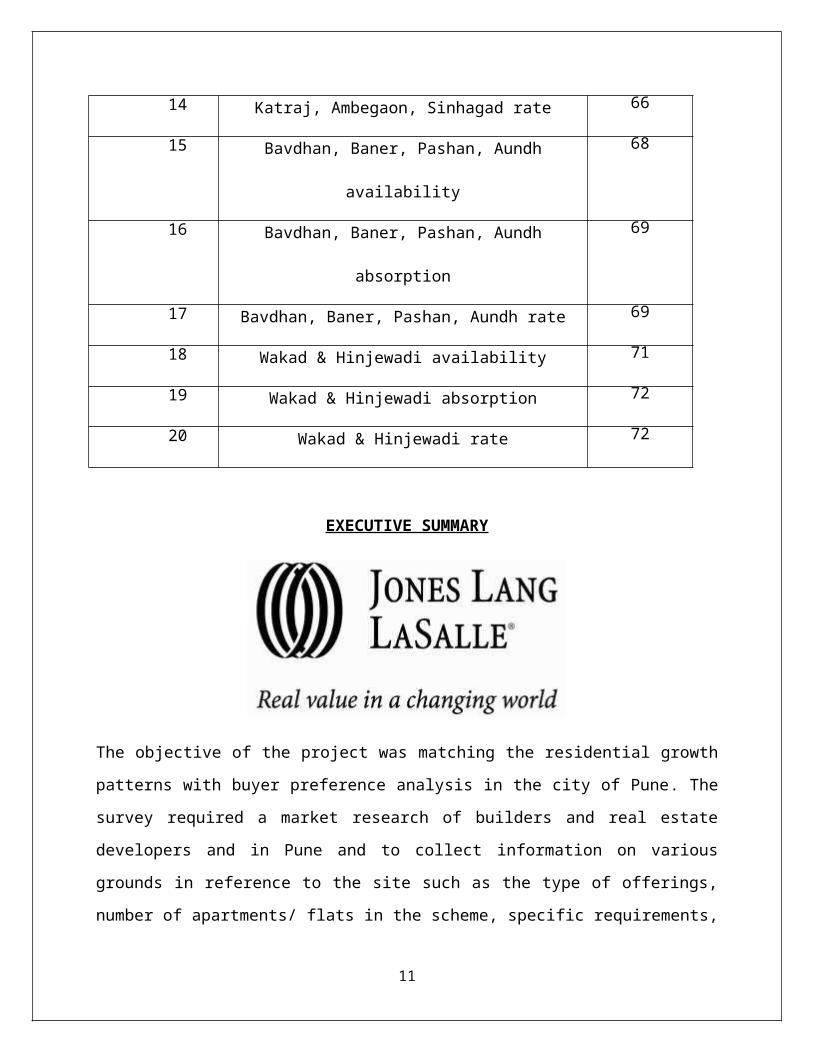
14 Katraj, Ambegaon, Sinhagad rate 66
15 Bavdhan, Baner, Pashan, Aundh availability 68
16 Bavdhan, Baner, Pashan, Aundh absorption 69
17 Bavdhan, Baner, Pashan, Aundh rate 69
18 Wakad & Hinjewadi availability 71
19 Wakad & Hinjewadi absorption 72
20 Wakad & Hinjewadi rate 72
EXECUTIVE SUMMARY
9
The objective of the project was matching the residential growth patterns with buyer preference
analysis in the city of Pune. The survey required a market research of builders and real estate
developers and in Pune and to collect information on various grounds in reference to the site
such as the type of offerings, number of apartments/ flats in the scheme, specific requirements,
the total ticket size, absorption rate, prevailing price per sq.ft, loading factor, location of the site,
etc.
The data collected was compiled in a proper format for the analysis of the most potential
upcoming zone in comparison to other zones in Pune.
The real estate sector is one of the unorganized sectors in India. In the recent past it has been
observed that the residential aspect of the real estate industry in India is highly potential, but
rather lacks a channelized manner of working. Thus the project title suggested by the company
was to capture the core demand and supply analysis in the residential sector for further research
analysis.
Due to limitations of geographical boundaries the research was limited to the city of Pune
including the suburbs. For the convenience of data collection and sampling process, the city was
divided into seven (7) zones; north, north east, east, south, south west, west and the central
business district.
Market research was done through the mode of survey.
The task at market research involved travelling across the city of Pune and interacting with the
developers, promoters and builders in regards to the upcoming residential projects by them in
various parts of the specified zones. Details of the residential projects were collected and
tabulated in a MS Excel sheet under various categories for the ease of segregation of the data.
10
The data consisted of the residential patterns in the city, pertaining to the size of the apartment,
row house and pent house, the cost, amenities provided and other aspects in regards to
construction development.
The total number of projects visited amounted to 107. A procedure of segmentation was done so
as to concentrate only on large projects that consisted of 50 apartments minimum.
In contrast to the market research carried out for the demand aspect, a questionnaire in form of
an enquiry form was distributed to potential customers (who are in search of an apartment, row
house or penthouse). The details were taken on the basis of the any particular area of residence
the customer would like to opt for, the budget, any pre- visited or finalized builder or project etc.
Further the data helped in analyzing the overall sales in the residential sector along with the
upcoming zone and the area in specific which was in demand. It also gave a clear picture of the
expenditure patterns of the consumer while purchasing or re- purchasing a house.
Both the demand and supply aspects have helped in analyzing the overall aspect of the
residential trends that has been observed in the city of Pune in the last one year (2010- 2011).
11
INTRODUCTION
1.1 COMPANY PROFILE
12
HISTORY AND EVOLUTION:
A Tale of Two Cities and Global Expansion52…
Jones Lang LaSalle’s history spans more than 200 years, but we’ll just give you the highlights:
1783: Richard Winstanley sets up shop as an auctioneer in London and is succeeded by his son
James in 1806.
1939: Through partnerships and mergers too numerous to mention, the Winstanley firm is now
known by the last names of its three principal members: Jones Lang Wootton (JLW) & Sons.
1945: In a London devastated by World War II bombings that destroyed property records, JLW
takes on the enormous job of documenting boundaries and ownerships of thousands of land
parcels. JLW secures licenses for development and agency appointments, which places it in an
enviable position as the city begins to rebuild in 1954.
1957: JLW begins its global expansion by opening offices in Australia, overcoming an initial
prognosis of "outlook favorable but problems formidable." Working from this base, the company
expands into New Zealand, Singapore, Kuala Lumpur, Hong Kong and Tokyo. Meanwhile, back
in Europe, JLW extends its activities into Scotland, Ireland and continental Europe.
1968: Across the Atlantic, in El Paso, Texas, a small group of professionals forms IDC Real
Estate with the goal of bringing much-needed professionalism to the marketplace. IDC quickly
outgrows its local market, moves to Chicago, eventually changes its name to LaSalle Partners
and becomes one of America’s leading real estate service firms. The firm becomes known for its
longstanding client relationships.
13

1975: JLW opens its first U.S. office in New York. Throughout the 1970s and 80s, both JLW
and LaSalle Partners extend their presence in new markets throughout Asia Pacific, Europe and
the Americas.
1997: LaSalle Partners completes its initial public offering of the company’s common stock.
1999: In the largest international real estate industry merger to date, JLW and LaSalle Partners
join forces and form Jones Lang LaSalle. The resulting company was—and still is—the leading
global commercial real estate services and investment management firm.
2006: The firm begins a period of strong growth both organically and through acquisitions.
Among four new firms joining the fold in 2006 is Spaulding and Slye, a major real estate player
on America’s east coast, plus other strong firms in England, Spain and markets in the Middle
East.
2007: Another busy expansion year sees 15 mergers and acquisitions including the transaction
that created Jones Lang LaSalle India, the largest real estate firm in India. We also acquire
Upstream, the leading sustainability consultancy in the UK, and a leading property advisor in the
Netherlands. The awards continue as well, highlighted by a top honor for our energy and
sustainability work from the U.S. Environmental Protection Agency.
2008: Acquisitions increase our presence in China, make us the largest retail advisor in
Germany, and allow us to expand our presence in Australia and Scotland. We are now the
leading real estate firm in Germany and the Netherlands, the two largest real estate markets in
Continental Europe. In the United States, we acquire The Staubach Company, a leader in tenant
representation. This acquisition significantly enhances our presence in key markets around the
United States, establishes us as the market leader in public sector services and adds scale to
many of our core businesses.
2011: We establish ourselves as the clear leader in the UK and continental Europe with the
acquisition of London-based King Sturge. The transaction gives us scale and depth of expertise
that greatly enhance our service delivery capabilities. This string of acquisitions supports our
strategy of being a consolidator within a consolidating industry. And we’re still winning awards,
including Fortune World’s Most Admired Companies in 2011.
14

ABOUT JONES LANG LASALLE:
Real Value
We are in business to create and deliver real value for clients, shareholders and our own people
in a complex world that is constantly changing.
Jones Lang LaSalle is a financial and professional services firm specializing in real estate
services. The firm offers integrated services delivered by expert teams worldwide to clients
seeking increased value by owning, occupying or investing in real estate. With 2010 global
revenue of more than USD 2.9 billion, Jones Lang LaSalle serves clients in 70 countries from
more than 1,000 locations worldwide, including 200 corporate offices. The firm is an industry
leader in property and corporate facility management services, with a portfolio of approximately
1.8 billion square feet worldwide. LaSalle Investment Management, the company’s investment
management business, is one of the worlds largest and most diverse in real estate with USD 45.3
billion of assets under management.
Jones Lang LaSalle has over 50 years of experience in Asia Pacific, with over 19,700 employees
operating in 78 offices in 13 countries across the region. The firm was named the Best Property
Consultancy in Asia Pacific at 'The Asia Pacific Property Awards 2011 in association with
Bloomberg Television'.
Jones Lang LaSalle is proud of the recognition we receive. These distinctions underscore our
position as the chosen real estate expert and strategic advisor for leading owners, occupiers and
investors worldwide.
15

SERVICES OFFERED:
Agency Leasing:
A strategic, proactive agency leasing approach for commercial property assets.
Commercial property leasing focused on forging long-term tenant relationships. Earning
successful returns on leased commercial property means more than filling space. It begins with a
firm grasp of what kind of space the most desirable tenants want and what they will pay for it.
And it’s followed by a marketing and agency leasing strategy that we’ll execute to mix the best
tenants at the best lease terms – and retain them for lasting value. Whether you’re an investor,
developer, property company or public entity, that’s the way we’ll go to work for you, in every
major market in the world. We’ll bring a strategic, proactive leasing approach to your
commercial real estate assets so that you can focus on continuous financial growth.
Capital Markets:
Uncovering value in your portfolio with real estate corporate finance.
Given the percentage of corporate budgets devoted to offices and other facilities, nothing
dominates a balance sheet more than real estate. Profitability equals your firm’s success in
16
aligning occupancy needs with financial objectives. The value is clear, but the path is complex.
Let Jones Lang LaSalle’s real estate corporate finance experts craft advanced strategies to get the
most out of your property. As the largest global professional services firm that is rooted firmly in
both real estate and the capital markets, we’ll work with you to uncover value in every facet of
your portfolio. There’s no need to shoot from the hip at emerging financial challenges. We’ll
develop corporate real estate finance strategies to align financing and occupancy decisions with
tax, financial reporting and treasury objectives.
Whether your charge involves a single property or a complex set of worldwide decisions, we’ll
assemble a collaborative corporate finance team that has delivered results in initiatives
comparable to yours.
Corporate Finance:
Let Jones Lang LaSalle’s real estate corporate finance experts craft advanced strategies to get the
most out of your portfolio or a single property.
Given the percentage of corporate budgets devoted to owning and managing offices and other
real estate assets, nothing dominates a balance sheet more. Profitability equals your firm’s
success in aligning occupancy needs with financial objectives and shareholder value enhanced by
sweating each asset optimally including real estate. The value is clear, but the path is complex.
Let Jones Lang LaSalle’s real estate corporate finance experts craft advanced strategies to get the
most out of your portfolio or a single property. These strategies are tailored to suit corporate
looking to monetize or optimize their portfolios. As the largest global professional services firm
that is rooted firmly in both real estate and the corporate finance, we’ll work with you to uncover
value in every facet of your portfolio. Our corporate finance team can help evaluate real estate
and business objectives through various lenses to determine the most effective solutions and
implement them. We’ll develop and apply corporate real estate finance methods to align
financing and occupancy decisions with tax, financial reporting and treasury objectives.
Whether your portfolio involves a single location property or a complex set of worldwide
decisions, we’ll assemble a collaborative team that has delivered results. Our broad range of
offerings for various set of corporate includes:
17

• Sales lease back structuring & execution
• Transaction Structuring
• Fund raising (Equity or Debt)
• Mergers & Acquisitions
• Joint Ventures
• Portfolio / Single Asset Strategy
• Alternative Ownership Structures
• Accommodation Strategy
Corporate Solutions:
We know what it takes to make real estate outsourcing successful.
Jones Lang LaSalle pioneered the corporate real estate offering in Asia Pacific. Today, our
platform provides unmatched services across a single project, country or regional portfolio. Our
commitment to shaping our business around the needs of our clients and delivering on our
promises keeps us at the forefront of our industry. With real estate being one of the top three
costs in a company, having the right partner is critical in finding operational efficiencies. At the
heart of our clients’ success lays the collective expertise of our Corporate Solutions professionals
from around the world. Through our collaborative approach in understanding their needs, we
help bridge their goals and challenges. No single solution can address different circumstances.
By harnessing the power of an individual or integrated suite of our specialized services, we offer
clients winning strategies that help them maximize the performance of their real estate portfolio.
18
Facility Management:
Facility management providing maximum efficiency, safety and employee comfort.
Efficiency, cost savings and continuous improvement from facility management experts. In an
ideal world, real estate executives manage facilities that operate flawlessly, freeing them to focus
on real estate strategies that contribute to broader business and financial goals. In reality, many
spend much of their work day managing routine facility management and maintenance tasks. As
the world’s largest facilities management company, we know that the ideal can be real. We’ve
shown hundreds of the world’s best-known companies and institutions how to operate facilities
with maximum efficiency, safety and employee comfort—and dramatically reduce costs in the
process. Our facility management services typically show clients a 20 percent or more drop in
their overall facility operating expenses. What’s more, we expose our clients to all the best
practices we’ve honed while managing office, industrial, technical, manufacturing, critical
environments and one-of-a-kind facilities on five continents—often for the same company. Our
facility management professionals will apply their hands-on experience to drive maximum value
and efficiency in your commercial property portfolio.
Hotels:
19

Whether you’re a hotel owner, operator, investor, developer or financier, you strive to enhance
your operations and investments in an industry that gets more competitive every day. And real
estate is at the heart of it all. Jones Lang LaSalle Hotels can be your single check-in for building
profit with comprehensive hotel asset management and investment services. We are the first—
and largest—global hotel investment services firm to set up operations in India. . Our clients
look to us for advice and execution on everything from investment sales, capital raising and
valuation advice to asset management, operator selection and project development.
Land & Industrial Services:
Transactions related to land, being the pre-requisite for any real estate development, require
specialist advisory services that stem from a background of knowledge that provides critical
insights into the potential of projects that may be positioned on land at various locations and the
in-depth knowledge of local planning norms. Our land agency division leverages on the
knowledge gained from our internal consulting services, wherein there is a high degree of
exposure to various types of real estate markets in various locations across India, along with
identification of development opportunities right from their concept stage all across India. This
synergistic approach has benefited our clients, who range from land owners, developers,
corporates, and various funds seeking to invest in projects, including FII. This group seeks to
align expectations of various potential partners in the development of projects with the objective
of enabling high level of returns on investments for all partners along with an equitable
distribution of risks and project costs. Typically, our range of services include assisting
prospective purchasers in identification, evaluation, and purchase of land; assisting land owners
in disposal of their land holdings; facilitating investments for developers in various projects;
organizing opportunities for various investors seeking to invest in remunerative projects;
structuring joint ventures between landowners and developers/investors/end users; assisting
20

developers/corporate in divesting or investing in land portfolios; and assisting clients in
sourcing/disposal of ‘Transferable Development Rights’, among others.
Lease Administration:
Make informed decisions with our comprehensive lease administration and auditing solutions.
If your organization has a diverse and geographically dispersed real estate portfolio, it is critical
for you to have accurate, up-to-date portfolio information for strategic planning and mitigate the
risks and cost of missing a critical lease date. We can offer you a comprehensive lease
administration and auditing solution that facilitates quicker decision making and reduces risk.
We have experienced professionals with strong industry expertise that can deliver solutions that
meet your business needs. This is further supported by our award winning IT platform, One
View Lease Admin, which provides you with easy storage, retrieval and real-time access to
every detail of your portfolio. It also gives you a consolidated view of your total real estate
portfolio.
Project & Development Services:
Whether your organisation is relocating or expanding, you need the assurance of a service
provider that has the right experience and knowledge to overcome your unique challenges. No
21

other service provider has a stronger combination of global experience, local knowledge, best
practices and professional expertise to address your real estate project management needs.
Across the Asia Pacific, we have over 600 professionals in 26 offices that managed and advised
on over US$6.8 billion worth of capital expenditure in 2009, making us a leader in managing
projects that create real value for our clients. In India, we delivered our expertise on over 100
projects with sizes ranging from 1,000 to 2.1 million sq ft in the past year. You gain an
unparallel advantage of having greater control of outcomes through our suite of specialized
industry solutions – Hotel, Commercial, Education, Health, Infrastructure, Industrial, Residential
and Retail. Delivered through a specially selected team, we’ll work with you to set measurable
goals and achieve them throughout your project’s advisory, planning, design, and construction
phases.
Property and Asset Management:
Real Estate Intelligence Service:
In a dynamically growing market, your business needs to have a comprehensive view of the
machinations behind India’s fast paced real estate growth. REIS India is a subscription-based
research service designed to provide you with timely, accurate, insightful real estate intelligence
across India to enable you to make informed decisions. REIS India combines international
expertise with local knowledge and is backed by Jones Lang LaSalle’s award-winning research
platform. Real estate professionals across the globe have been relying on REIS in their decision-
making process for over two decades in Australia and New Zealand, and over a decade in Asia.
This service consists of comprehensive real estate data, analyses and forecasts for institutional
property players. The wide spectrum of outputs is prepared by a dedicated team of researchers
located across 10 offices in India. REIS would give your business access to accurate and timely
real estate market intelligence to help you make smart business decisions in a semi-transparent
22

and emerging market. In a competitive environment where information is power, REIS India
provides you with cutting-edge insights into India’s diverse and challenging real estate markets
through collation, analysis and forecasts of property market indicators and trends across all major
markets. Carefully prepared and constantly updated by Jones Lang LaSalle’s highly qualified
research professionals, REIS India enables you to identify opportunities and risks first-hand. We
gather on ground intelligence via regular collaboration with our colleagues working in areas such
as capital markets, leasing, consulting and valuation. REIS empower you with consistent and
complete data and analyses. It is supplemented by value-added services including client
briefings, presentations and rapid market updates.
Research:
Insight, interpretation and analysis tailored to your needs from our real estate research services.
Timely and informed research and analysis is an accepted prerequisite to successful decision
making. At Jones Lang LaSalle, our extensive market coverage, innovative analysis and
prescient forecasting is backed by the market knowledge and commercial acumen of real estate’s
most experienced research team. Our local, regional and global researchers are dedicated to
providing a seamless research service from local data sourcing and single assignment analysis
through to the construction of global investment, development and locational strategies. Our
research services are flexible, practical and backed by best in class proprietary data and
analytical models. Projects can be customized to address questions on sectors, geographies or
individual assets and we work with you in a manner that best fits with your organization. Please
contact the Jones Lang LaSalle commercial real estate market research services group for more
information.
23
Residential:
Experience and expertise gained through the various residential transactions on behalf of some of
the most active developers, corporate and individuals make us the unchallenged market leaders
in the residential domain. At Jones Lang LaSalle, our team of professionals dedicated to
residential real estate continuously keeps abreast of the ever-changing consumer needs. In
addition, we leverage our industry relationships to help developers achieving their sales goals,
maximize returns and speed up cash recovery.
Retail:
Shoppers change preferences and retailers change strategies. But we never waver in our
commitment to providing industry-leading real estate services for retail assets. As a recognized
leader in the global retail industry, Jones Lang LaSalle offers unparalleled knowledge and
experience. Our specialists provide comprehensive retail services built on a platform to exceed
the expectations of our owner, investor and occupier clients. With retail offices in 40 countries
around the globe, we manage nearly 250 million square feet of retail with more than 600
properties worldwide. We know that retail offerings and clients’ needs are constantly changing.
That’s why we offer a flexible, customized plan that will ensure that together, we’ll maximize
the highest potential of your asset or portfolio.
24
Strategic Consulting:
Many real estate initiatives are designed to get the immediate job done. But our commercial
property consultants deliver strategies that take a longer view. When real estate decisions align
with your organization’s broader business and financial objectives, it’s only natural that
expectations are soon exceeded. Our smart, innovative advice helps you gain a competitive
advantage and win senior management support for your real estate activities. Successful
strategies typically pay for their development costs many times over, and real estate savings of
10 percent to 15 percent are not unusual. Our professionals partner with you to create—and
execute—solutions that not only look good on paper, but work in practice. You’ll benefit from
our extensive commercial real estate experience helping companies from a broad range of
industries meet the challenges of mergers and acquisitions, identify innovative workplace
solutions, drive organizational change and engineer the financial optimization of their
commercial property.
Tenant Representation:
An effective and cost-efficient tenant representation services in New York, Newcastle, New
Delhi or anywhere in between. Whether your organization is relocating a single major office or
seeking a consistent strategy to acquire space and accommodate global expansion, you need a
commercial tenant representation firm that knows the territory. We serve as your strategic
advisor, lowering your real estate costs and occupancy risks while maximizing workplace
flexibility and productivity. We’ll analyze your business drivers and occupancy needs, identify
and evaluate appropriate options, and manage lease negotiations. In fact, we’ll be your on-call
expert for all your leasing and lease administration needs.
25

Transaction Management:
In recognition of this, Jones Lang LaSalle has a dedicated Transaction Management discipline
within its Tenant representation group. The primary function of the Transaction Management
team is to develop and implement processes and tools which support workflow management;
promoting cross training, skill sharing and continuous adoption of best practices into local
delivery teams. Our transaction management approach provides our corporate clients with:
• Deal Support – Working closely with local Tenant Representation teams, the Transaction
Manager initiates each project, sharing account protocols and processes and imparting captured
key learning’s which results in increased speed to market and internal efficiencies.
• Best Practices - Leveraging from the regional and global platforms, the Transaction
Manager is able to cascade best practice tools, policies and processes to drive continuous process
improvement and an innovative approach to your account.
• Market Trends Analysis – Through analysis of Lang LaSalle’s research offerings and
local market expertise, the Transaction Manager is able to identify market trends and create a
proactive portfolio strategy that allows you to minimize risk and focus more time on addressing
the needs of your internal stakeholders.
• Tailored Deliverables – Working with you, the Transaction Manager will develop
structured and specific portfolio reporting including; benchmark reporting against market,
competitor or industry and an operating report that identifies key market trends and themes and
the potential impact on your portfolio.
• Performance Measurement – Measuring performance on both individual assignments as
well as overall satisfaction ensures our clients receive services that consistently meet or exceed
26
defined metrics and expectations. These results are shared with the delivery teams to drive
training and development to ensure continuous improvement and enhance performance across
your account. Consistent performance and high levels of client satisfaction have resulted in over
90 strategic alliance partnerships. Across Asia Pacific, we provide exclusive transaction
management services for over 150 million square feet of office, retail and industrial space for
leading banking, technology, industrial and government organizations.
Warehousing and Logistics Solutions:
With new warehousing and logistics frontiers opening throughout India, local and multinational
companies are facing more challenges in selecting and managing the best locations. At Jones
Lang LaSalle, we understand the unique requirements of the supply chain industry. We have a
dedicated team of warehousing and logistics property experts who help clients achieve flexibility
and cost-efficiencies through quality advice. With over 49 years of experience in working with
high-profile logistics organisations across Asia Pacific, you can rely on us to deliver
sophisticated real estate solutions for your businesses.
CORPORATE SOCIAL RESPONSIBILITY:
As part of our commitment to create real value in a world that is constantly changing, we are
determined to be a good corporate citizen in every corner of our global community. We hold
ourselves accountable for the social, environmental and economic impact of our operations. We
design our policies and business practices to reflect the highest standards of corporate
governance, transparency and ethics. We support all aspects of the corporate social responsibility
agenda, but one area is particularly relevant for us. We have the skills and opportunity to help
minimize the significant impacts that real estate has on the environment. Our goal is to be the
27

unquestioned leader in the real estate industry in environmental sustainability and energy
management.
Environment: We are committed to being the real estate industry leader in environmental
sustainability and energy management, both for our clients and ourselves. Our capabilities give
us the opportunity to drive change that minimizes the impact of commercial real estate on the
environment.
Workplace: We focus on creating and maintaining a rewarding and welcoming workplace for
our people around the world. We strive to attract and retain the most talented individuals,
encouraging and enabling them to succeed.
Diversity: We foster an inclusive environment that values the richness of our differences and
reflects the diverse world in which we work. By cultivating a dynamic mix of people and ideas,
we enrich our service capabilities and the communities in which we operate.
Community and Society: We endeavor to be good citizens wherever we live and work.
ETHICS AND CORPORATE GOVERNANCE:
We are proud of our global reputation for uncompromising integrity, ethical conduct and
corporate governance. Our Code of Business Ethics and Vendor Code of Conduct are followed
by our own employees and everyone who does business on behalf of our firm. We are also
proud of the rigor and quality of the firm’s corporate governance and the benefits these policies
produce for our stakeholders.
• Code of Business Ethics:
Our Code of Business Ethics helps our people better understand the duties and responsibilities
associated with conducting business on behalf of Jones Lang LaSalle. The Code contains
sections that address our responsibilities to clients, business partners, shareholders, and the
communities and governments in the countries in which we do business. Members of our Board
of Directors fully support and mandate our compliance with the Code. Reports of possible
violations can be made to our global Ethics Hotline 24 hours a day, seven days a week.
28
• Vendor Code of Conduct:
We trust that our vendors, including firms and individuals who provide direct service to or
directly to our clients, will honor our commitment to integrity. While vendors are viewed as
independent entities, their business practices can reflect upon our brand and reputation. We
expect all vendors to embrace and adhere to our Vendor Code of Conduct.
1.2 OBJECTIVE OF THE STUDY
Real estate sector is one of the most unorganized sectors in India. The presence of small property
agents and real estate brokers poses a great challenge for the established institutions and MNC’s
to make their presence felt in the market. Thus, creating awareness among the masses is a tough
task posed in front of international property consultants.
There are two objectives of the study; primary and secondary. The primary objective
concentrates on the prime focus of the research carried out, while the secondary objective is a
supporting element.
Primary objective:
Studying the residential market in Pune – Development of the growth corridors.
1. Division of the city into zones.i.e, North, South, East and West.
2. Concentration on the development of the suburbs in the respective zones.
3. Research on the upcoming projects.
4. Feedback from the sales team.
29

Secondary objective:
Customer behavior and preferences
1. Customer feedback on the basis of absorption level.
1.3 LIMITATIONS OF THE STUDY:
The survey was divided in two categories Developers/ builders and customers. The method
adopted was a personal interaction with the developers and questionnaire (feedback form) for the
customers.
The entire survey was completely carried out according to the flow as per decided plan. There
were a few hurdles in the process of my survey.
1. It was difficult to obtain appointments and availability with the developers/ builders.
2. The marketing and sales personnel lacked the basic knowledge.
3. Some people were not able to give complete information due to professional constraints.
4. Repeat visits were required at some sites, due to unavailability of the staff.
30

2. RESEARCH METHODOLOGY
31
2.1 PRIMARY DATA:
In the research process primary data was used on a large extent. Personal Survey and telephonic
Survey method through certain mandated questions were done, in reference to the supply
analysis. A feedback was used to get the response of buyers/ customers, in reference to the
demand analysis. For this purpose I have contacted respondents personally to get the feedback
forms filled.
2.2 SECONDARY DATA:
The secondary data source used in the form of overall industry details and the ongoing sites in
the respective zones through newspaper and internet sites, etc.
32
2.3 SAMPLE DESIGN:
Sample design covers the method of selection, the sample structure and plans for analyzing and
interpreting the results. Sample designs can vary from simple to complex and depend on the type
of information required and the way the sample is selected.
2.4 POPULATION:
The population selected was of all the ongoing residential projects in the segregated respective
zones. There was no such biased behavior done in the selection of all the projects targeted in any
particular zone.
33
2.5 SAMPLE SIZE:
I have used the statistical approach of sample size determination, which is based on well-defined
principles. A sample size of one hundred and five (105) was taken into account. All the 105
sample data was gathered and arranged in a manner where the entire information was accessible.
2.6 SAMPLING METHOD:
The Quota Sampling method was used by me for the project analysis. Aim is to obtain a sample
that is "representative" of the overall population; the population is divided ("stratified") by the
most important variables (e.g. income,. age, location) and a required quota sample is drawn from
each stratum.
This is the reason only residential projects with a total unit size of minimum 50 were considered.
34
2.7 METHOD OF DATA COLLECTION:
Structured interview
- The interviewer has a standard set / sequence of questions that are asked of all
candidates.‡
- Interviewers read the questions exactly as they appear on the survey questionnaire.
Personal survey was done to obtain response from respondents conveniently available. I have
prepared a structured, non-disguised set of questionnaires. The questionnaire prepared collected
different types of questions.
2.8 INSTRUMENT FOR DATA COLLECTION:
A questionnaire with a set of well defined questions was the instrument of data collection that
was used so as to facilitate the research process.
35
3. THEORETICAL BACKGROUND
36
Market Research
According to Philip Kotler, “Research is the systematic design, collection, analysis and reporting
of data and findings relevant to a specific marketing situation facing the company.
We can say that research is both problem solving and problem oriented. The research process
involves a number of inter related activities which overlap and each step has some influence over
the following steps followed by me in the research of this project. The steps are as followed:
1. Formulating the research problem.
2. Choice of research design.
3. Determining sources of data.
4. Designing data collection forms.
5. Determining sampling decisions.
6. Organizing and conducting the field survey.
7. Processing and analyzing the collected data.
8. Preparing the research report.
1. Formulating Research Problem:
The first step in research process is formulating a research problem. It is important stage in
applied research. It is rightly said, “A problem well defined is half solved”.
Once two or more problems are identified the question should be concerned with is- which of the
problem is to be selected? This is necessary because I am not in a position to take up all the
problems on account of limited time. So I have selected a problem, which gives maximum net
worth of research.
2. Research Design:
According to Green and Tull, “Research design in the specification of methods and procedures
for acquiring the information needed. It is the overall operational patterns or framework of the
37

project that stipulates what information is to be collected from which sources by what
procedures”
Research design is a plan, structure and strategy of investigation conceived so as to obtain
answers to research question and to control variance. A research design specifies the methods
and procedures for conducting a particular study. Broadly speaking, research design can be
grouped in three different categories:
Exploratory research
Descriptive research
Casual research
As my research is based on survey of the ongoing residential sites, I have used DESCRIPTIVE
RESEARCH design. I have used Personal Survey Method and telephonic Survey Method of
Descriptive Research Design. Respondents are contacted personally and through telephone
interviewed through questionnaire. I have selected descriptive research design because,
exploratory research design helps in exploring a problem or situation to provide insights and
understanding; and causal research design helps to obtain evidence of cause and effect
relationship, and hence, the use of the descriptive research design in the project is appropriate.
3. Determining Source of Data:
This step includes specifying the various sources of data used by the researcher in collecting the
factors that affect antivirus buyers.
Basically the sources of data are divided into two main categories:
(i) Primary Sources of Data.
(ii) Secondary Sources of Data.
Primary data is the data collected by the researcher at the time of research; its main purpose is to
serve the findings of the research and is collected for the first time. Secondary data is the data
already collected by someone for his/her purpose of study.
38
4. Designing Data Collection Form:
For the study survey method was employed as majority of details, which were collected, were
primary in nature. Personal survey was done to obtain response from respondents conveniently
available, with the help of well-structured questionnaire. I have prepared a structured, non-
disguised type of questionnaire.
5. Determining Sampling Design and Sampling Size:
Once the researcher has decided to carry out a field survey he has to decide whether it is to be a
census survey or sample survey. When decision is in favor of a sample survey has been taken, it
is necessary to have a clear definition of the population for which the sample is to be drawn, and
before deciding on the type of sample design is to be used. First, a broad choice is to be made
between probability and non-probability sampling. There are two approaches for sample size i.e.
practical approach and statistical approach.
6. Organizing and Conducting Field Survey:
Having prepared the questionnaire and selecting sample design and size of sample, the next step
is to organize and conduct the field survey. Two important aspects should be looked into:
interviewing and supervision of fieldwork. The task of interviewing seems to be simple but, in
reality, it is one of the most difficult tasks in research. Supervision of fieldwork is equally
important to ensure timely and proper completion of field survey. Neglecting these aspects
would result in interviewing errors, which, in turn, would undermine the utility of survey.
The researcher then has to organize and conducted the survey by interviewing and supervision of
fieldwork. It is one of the most difficult tasks in marketing research because respondents are
many times busy with their work and some respondents are unwilling to give response due to
various constraints. Thus personal survey takes more time.
39

7. Processing and Analyzing the Collected Data:
In order to derive meaningful results from the statistical tables, the researcher may use one or
more techniques to analyze the collected data and to tabulate it in a proper way. Such analyses
use a variety of techniques to determine important relationship among several variables. The data
primarily collected by questionnaire are represented by questionnaire in tabulation forms and the
findings are represented as the Graphics.
8. Preparing the Research Report:
After the data had been analyzed and conclusion reached, the researcher has to report his
findings to the management. The reporting has to be done in a clear manner so that the chances
of any misunderstandings can be managed. The essence of a good research report is that it
effectively communicates its research findings. The researcher has to exercise the entire course
to make the report useful and worthwhile document for management.
40
4. DATA PROCESSING AND ANALYSIS
41
Pune
PUNE CITY OVERVIEW
Snapshot
Pune (180 31' N, 730 51' E), a leading city within the state of Maharashtra, is located
approximately 170 kilometres southeast of Mumbai. Rising 560m above sea lea, Pune is situated
on the Deccan Plateau where it is surrounded by hills, leading to its moderate climate. The city
is positioned near the confluence of the Mula and Mutha rivers with two additional rivers, the
Pavna and Indrayani, transversing its north-western outskirts.
Regional Settings of Pune
The twin cities of Pimpri-Chinchwad, located 15 km from Pune, form a continuous urban stretch
adding to Pune’s urban agglomeration. This region has a thriving industrial belt, primarily
consisting of units from the engineering and automobile industries. Together, Pimpri-Chinchwad
and Pune region combine to make one of India’s largest industrial areas, and the second largest
industrial centre in the state of Maharashtra, behind only Mumbai.
42

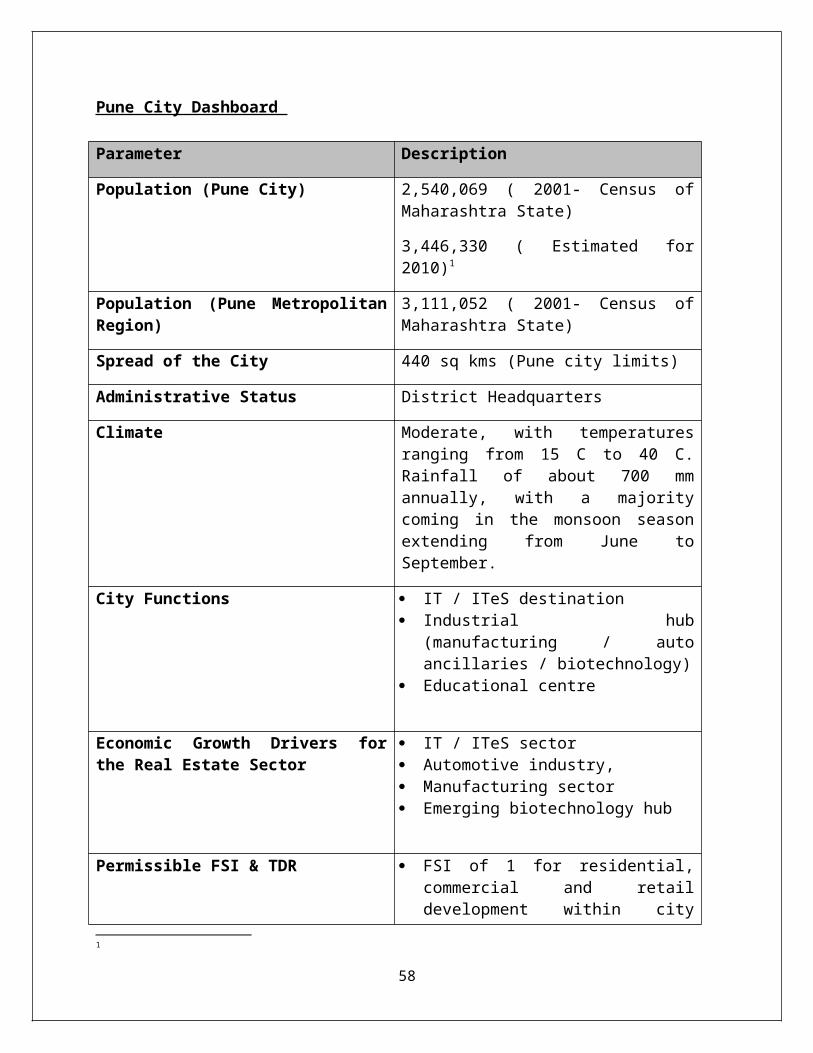
Pune City Dashboard
Parameter Description
Population (Pune City) 2,540,069 ( 2001- Census of Maharashtra State)
3,446,330 ( Estimated for 2010)1
Population (Pune Metropolitan Region) 3,111,052 ( 2001- Census of Maharashtra State)
Spread of the City 440 sq kms (Pune city limits)
Administrative Status District Headquarters
Climate Moderate, with temperatures ranging from 15 C to 40 C. Rainfall of about 700 mm annually, with a majority coming in the monsoon season extending from June to September.
City Functions IT / ITeS destination Industrial hub (manufacturing / auto
ancillaries / biotechnology) Educational centre
Economic Growth Drivers for the Real Estate Sector
IT / ITeS sector Automotive industry, Manufacturing sector Emerging biotechnology hub
Permissible FSI & TDR FSI of 1 for residential, commercial and retail development within city limits (outside core – gaothan areas)
FSI of 2 is granted for IT / ITeS buildings (STPI sanctioned buildings)
TDR of 0.4 is allowed in certain zones Additional TDR of 0.2 could be allowed
(over and above of the 0.4 TDR – as mentioned above) for slum redevelopment
City’s Demographic Profile
1
43

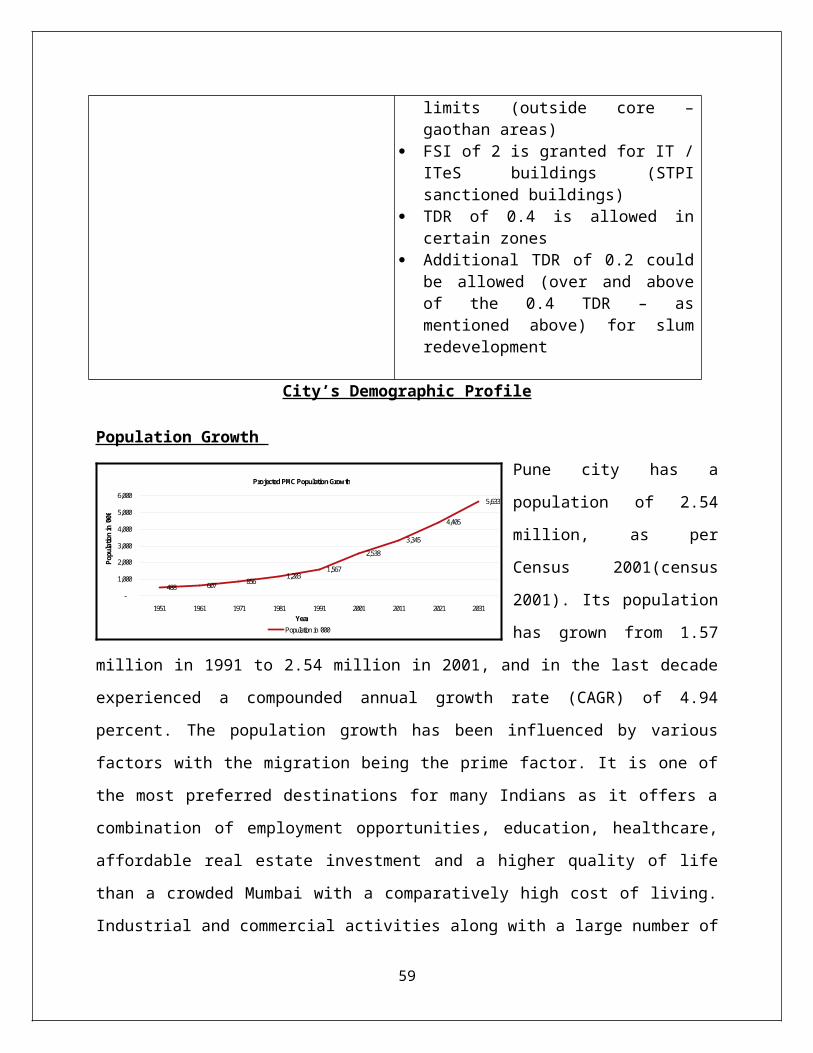
Population Growth
Pune city has a population of
2.54 million, as per Census
2001(census 2001). Its
population has grown from 1.57
million in 1991 to 2.54 million
in 2001, and in the last decade
experienced a compounded
annual growth rate (CAGR) of 4.94 percent. The population growth has been influenced by
various factors with the migration being the prime factor. It is one of the most preferred
destinations for many Indians as it offers a combination of employment opportunities, education,
healthcare, affordable real estate investment and a higher quality of life than a crowded Mumbai
with a comparatively high cost of living. Industrial and commercial activities along with a large
number of educational centres in Thus, Pune attracts a large floating population from all over
India into the city. Rapid growth of the city can mainly be attributed to industrialization of Pune
Municipal Corporation (PMC)/ Pimpri-Chinchwad Municipal Corporation (PCMC) after 1960
and expansion of the information technology (IT) industry in the last decade.
According to the population census 2001, Pune’s population is estimated at around 5.6 million
by end 2031 (fig 1.2a). The average population density for PMC, in 2007 was recorded to be
12,173 persons/sq km, in 2011 it is projected to be approx. 13,718 persons/sq km , in 2021,
approx. 18,064 persons/sq km, and in 2031, it is projected to be approx. 23,102 persons/sq km.
Linkages and Connectivity
Pune has excellent road, rail and air connectivity with most major cities in India. It is well
connected by three national highways (NH-4, NH-50 & NH-9) and one expressway (Mumbai –
Pune) to major urban centers in the western, central and southern parts of the country. Express
and long-distance rail connectivity is already established to Mumbai, Delhi, Hyderabad,
Chennai, Miraj- Kolhapur, and Goa. Pune International Airport, located in the northeastern
quadrant of the city, is located on an Indian Air Force base and is presently used for civil
purposes catering to both international and domestic flights.
Road Connectivity
44
Projected PMC Population Growth
488 607 8561,203
1,567
2,538
3,345
4,405
5,633
-
1,000
2,000
3,000
4,000
5,000
6,000
1951 1961 1971 1981 1991 2001 2011 2021 2031Year
Pop
ulat
ion
in '0
00
Population in '000
The city of Pune is situated on the confluence of National Highways (NH), which includes NH-4
connecting Mumbai in the north and Bangalore to the south, NH-50 leading to Nashik and NH-9
connecting to Sholapur and Hyderabad. As the names of these transportation corridors suggest,
Pune is well connected through a network of national highways to major cities including
Mumbai (163 km), Nashik (202 km), Nagpur (880 km), Bangalore (835 km), Chennai (1,166
km) and Hyderabad (548 km). State Highways connect Pune to smaller prominent centers in
vicinity. Key State Highways are SH-60 (Pune–Ahmednagar), SH-64 (Pune–Saswad) and SH-57
(Pune–Pirangut).
Rail Connectivity
The city of Pune has four major train stations: Pune Junction, Shivajinagar Station, Pimpri and
Chinchwad. Pune Junction is a major rail node where a majority of trains halt to connect
passengers by broad gauge line to Mumbai, Bangalore, Chennai, Hyderabad and Delhi. In
addition, Pune suburban trains also run from Pune Junction to the industrial towns of Khadki,
Pimpri and Chinchwad.
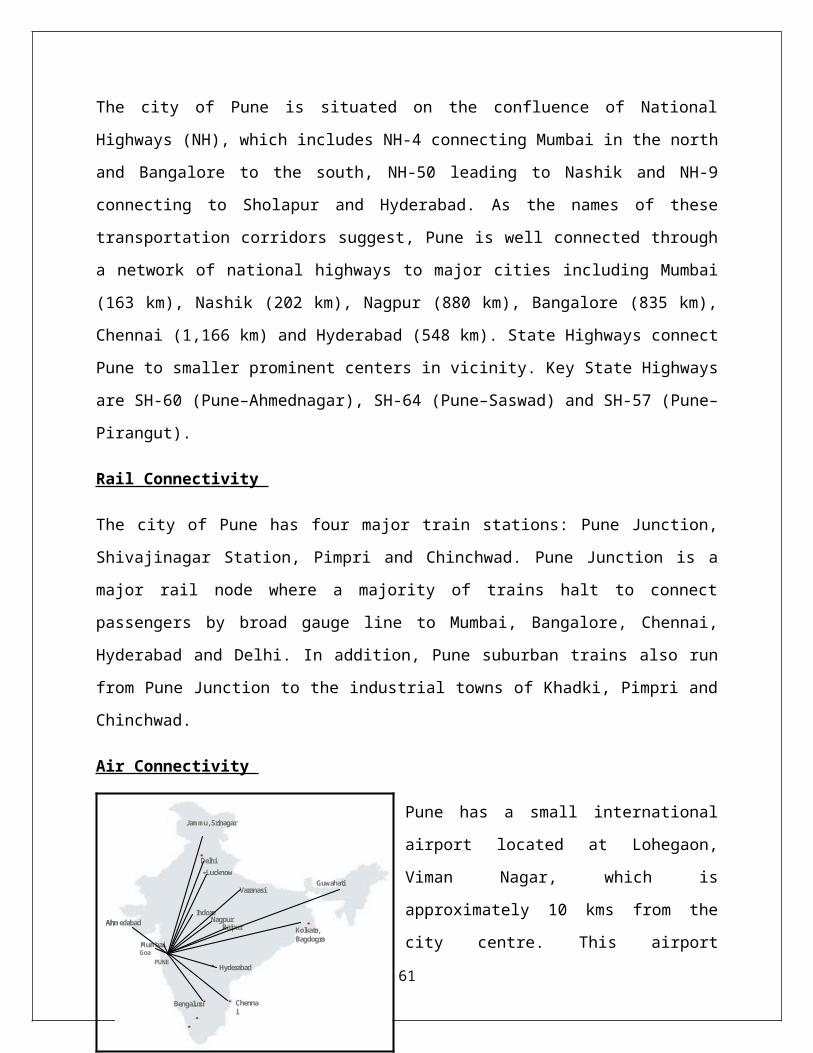
Air Connectivity
Pune has a small international airport located at
Lohegaon, Viman Nagar, which is
approximately 10 kms from the city centre. This
airport provides domestic connectivity to major
metros including New Delhi, Mumbai,
Bangalore, Kolkata, Chennai and Hyderabad, as
well as to other cities within India. More than 50
daily flights connect Pune to the rest of the
country. In addition to this, Pune International
Airport also provides air connectivity to foreign
destinations including Dubai and Frankfurt.
Economic Base and Economic Activities
While the city is reputed for its educational institutions, Pune’s economic base has traditionally
been anchored by the strong presence of the engineering and automobile sectors. Economic
45
Jammu, Srinagar
Delhi
Kolkata, Bagdogra
Mumbai
PUNEHyderabad
Chennai
Bengaluru
Nagpur
Goa
Indore
RaipurAhmedabad
Lucknow
VaranasiGuwahati
Jammu, Srinagar
Delhi
Kolkata, Bagdogra
Mumbai
PUNEHyderabad
Chennai
Bengaluru
Nagpur
Goa
Indore
RaipurAhmedabad
Lucknow
VaranasiGuwahati

activity in the city is rooted by the presence of corporate giants like Bajaj, TELCO, Fiat, General
Motors and Bharat Forge. Over the years, this has helped consolidate Pune's position as the
'Detroit of India'.
In recent times, Pune has emerged as a preferred IT destination in India. Major IT domestic and
international players including Infosys, Wipro, TCS and Syntel have set up operations in Pune
and are increasing business at a significant pace.
Prominent IT/ITeS Destination
Pune was one of the prominent cities in India to capitalize on the IT / ITeS boom that started in
late 1990s, and it has continued to remain on the forefront of this industry. Progressive state
government policies and efforts by the Maharashtra Industrial Corporation (MIDC) in creating
enclaves at Hinjewadi, Kharadi and Talawade have been successful in making land and other
required infrastructure available to domestic and multi-national companies for setting up their
office campuses in Pune.
Today Pune has a large and thriving IT/ITeS industry with major domestic software players such
as TCS, Wipro, Infosys, Mahindra British Telecom, Mastek and PCS having established their
base in the city. Major global players such as HSBC Global Technology, Sakaen, Avayay, T-
Systems, Syntel, Cognizant, IBM and EDS also have also a significant presence in the city.
The IT / ITeS industry has established itself in Pune along two broad locations:
North-Western Corridor comprising primarily the Hinjewadi region. This region
primarily houses the campus style development of major IT players like Infosys, Wipro,
TCS, Cognizant, KPIT, Persistent Systems. Also it houses a majority of Pune’s existing
and upcoming IT SEZ by major developers including DLF, Paranjape, Embassy Group,
Kumar Builders and Ascendas.
Eastern Corridor comprising areas such as Kalyani Nagar, Yerwada, Viman Nagar,
Kharadi, Hadapsar and Fursungi. This region houses some of the most prominent existing
and upcoming IT parks in the city with the likes of Magarpatta Cybercity, K Raheja’s
46

Commerzone, Vascon’s Weikfield IT Park, Kumar Builder’s Cerebrum IT Park and
Panchsil’s Tech Park.
Automotive hub
The growth story of Pune as a major automobile hub can be dated back to 1965 with the
establishment of commercial motor vehicle units of Telco in Pimpri-Chinchwad. Later the city
also witnessed the entry of auto majors such as Tata Motors and Bajaj Auto. This resulted in
setting up of numerous auto ancillary industries that catered to the outsourcing requirements of
these automobile manufacturers. Today, Pune is home to major automotive companies ranging
from two-wheelers and auto rickshaws (Bajaj Auto, Kinetic Motor Company) to cars
(Volkswagen, General Motors, Tata Motors, Mercedes-Benz), tractors (John Deere), tempos,
excavators (JCB) and trucks (Force Motors). Most of these industries are located in the suburban
areas of Pimpri-Chinchwad, Chakan and Talegaon.
Engineering industry
One of the first major industries to be set up in Pune was Kirloskar Oil Engines Limited during
the 1960’s in Pimpri Chinchwad. MIDC set up a large industrial estate on 4,000 acres of land at
Bhosari. This development led to a spate of engineering ancillary industries being set up in
Pimpri-Chinchwad which further spurred the economic and physical development of this region.
The major engineering goods manufactured in Pune essentially include forges (Bharat Forge),
truck transmissions systems, clutches & hydraulic components (Eaton Corporation) and engines
(Kirloskar Oil Engines, Cummins). Other major notable engineering goods manufacturers in
Pune are Alfa Laval, Thyssen Krupp, Black & Veatch and Saint-Gobain Sekurit (automotive
safety glass). In addition to these large players, many small and medium-sized companies are
also active in Pune, producing components for larger companies and creating unique components
for the Indian marketplace. Electronic goods and consumer durables are also manufactured in
and around Pune. Key companies from this segment which have operations in Pune include
National Panasonic, Whirlpool Corporation and the LG Group, located in the Ranjangaon
industrial area in Eastern Pune. Food giants like Frito Lay and Coca Cola also have food
processing plants located in Pune.
Pune Residential Sector Overview
47

Prime Central
North West
South West
North East
South East
North
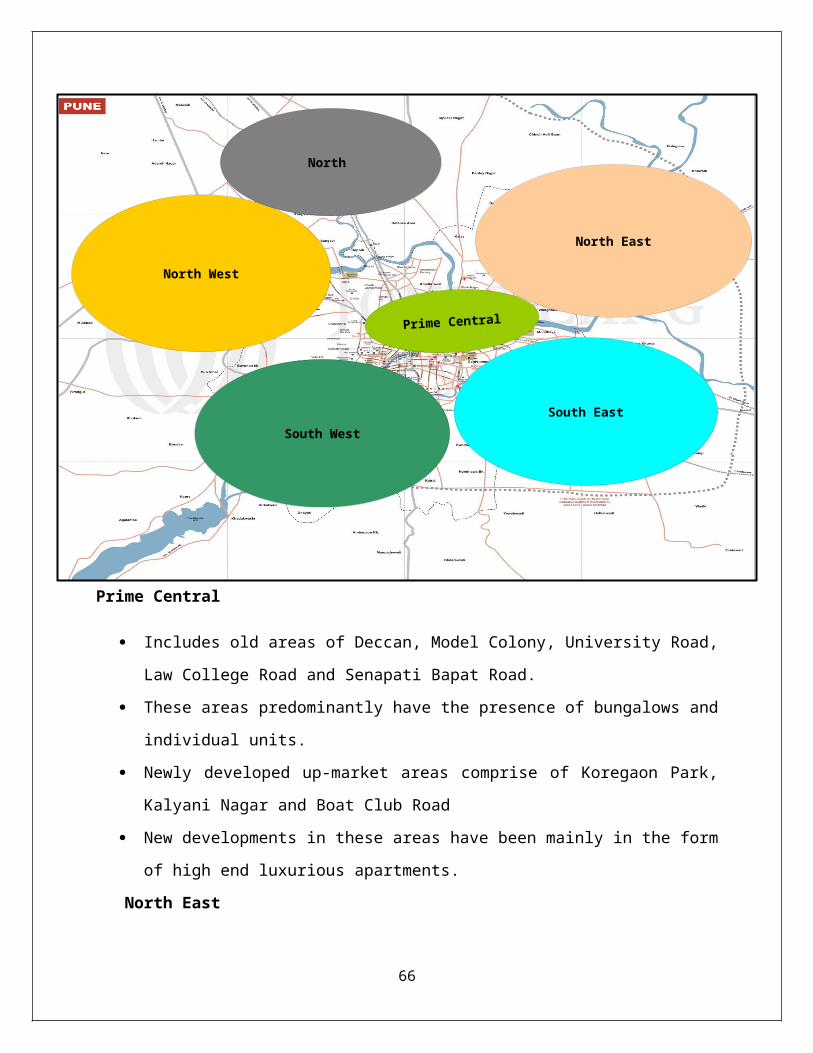
Residential Micro Market description
Prime Central
Includes old areas of Deccan, Model Colony, University Road, Law College Road and
Senapati Bapat Road.
These areas predominantly have the presence of bungalows and individual units.
Newly developed up-market areas comprise of Koregaon Park, Kalyani Nagar and Boat
Club Road
New developments in these areas have been mainly in the form of high end luxurious
apartments.
North East
48

Includes areas of Viman Nagar, Wadgaon Sheri, Nagar Road, Kharadi, Vishrantwadi,
Mundhwa and Wagholi
One of recently developed residential areas in Pune.
Development in this area can be primarily attributed to massive growth in IT/ITeS sector
on Nagar Road stretch including areas of Kharadi, Viman Nagar, Yerwada and Kalyani
Nagar.
Moreover proximity of this region to the Pune’s Airport at Lohegaon and central areas
has also contributed to the growth of this region.
Today it is one of the most vibrant regions in the city in terms of real estate development,
primarily in commercial (IT/ITES), retail and hospitality.
South East
This micro-market comprises two major residential catchments: the entire Magarpatta
Road along with Hadapsar, Manjri and Fursungi and other one including Wanowrie,
Salunke Vihar, NIBM Road along with Undri, Kondwa and Mohammedwadi.
The IT development within Magarpatta Township, together with the industrial units in
Hadapsar, primarily drives the residential demand along Magarpatta Road and Hadapsar.
With Wanowrie, Salunke Vihar Road and NIBM Road almost saturated, the focus has
shifted to Undri, Kondwa and Mohammedwadi. The working population in the CBD and
Magarpatta generally resides in this residential pocket within this micro-market.
North West
Includes the areas of Aundh, Baner, Balewadi, Bavdhan, Wakad, Pimple Saudagar,
Pimple Nilkah and Pimple Gaurav and Hinjewadi.
Initially better connectivity of certain areas like Aundh, Baner and Balewadi with the
Mumbai-Pune Expressway and presence of industrial units in Northern Pune led to
residential developments in early 1990’s.
Over the last decade, particularly in the later half of 2000, areas such as Wakad, Pimple
Saudagar, Pimple Nilakh and Pimple Gaurav have emerged as hub of affordable housing
category due to large availability of land parcels and their proximity to Hinjewadi IT
Park.
South West
49
Fig 2.2a New Launches & Absorption
0
5,000
10,000
15,000
20,000
25,000
30,000
2005 2006 2007 1H 08 3Q08-1Q09 2Q09-4Q09 1Q10-3Q10Year
Uni
ts
New Launches Absorption
Includes the areas of Kothrud, Warje, Karve Road, Katraj, Sinhagad Road.
This region in Pune as predominantly been a residential area with negligible commercial
developments.
The region also comprises shopping centers, restaurants and high-density residential
housing complexes.
This area houses some of the major educational institutes in the city and its proximity to
the city centre with good connectivity also adds to its advantage.
North
The North micro-market comprises Pimpri, Chinchwad, Akrudi, Bhosari and Chakan,
Ravet, Alandi and Nigdi. It is one of the cheapest micro-markets in the city.
This region has a thriving industrial belt comprising mainly of engineering and
automobile industries. As land pressure in the city has risen, this industrial hub is
gradually being transformed into a residential area.
Its proximity to Hinjewadi IT Park and to establishments of industrial units in Chakan
and Bhosari drives the residential demand in this precinct.
Overall Demand and Supply
Slump in number of
new residential
launches between
3Q08-1Q09
Residential market
activity slowed down
considerably 4Q08
onwards. With the slowdown in the IT sector during this period, impacted by the global
financial crisis in 2008, created a lot of uncertainty in the job market and kept the buyers
at bay. Source: Real Estate Intelligence Service (REIS), 3Q10. With very minimal
absorption levels in the market, developers had to delay the launch of their projects. As a
result only 2,355 new residential units were launched in 2H08 out of the total 6,900 units
50

launched during 2008 and only 1,142 units got launched in 1Q09 out of the total 11,214
units launched in 2009.
Developers focus on the affordable category housing led to gradual revival of
residential sector in 2009.
Developers primarily focused on affordable housing launches in 2009, both in terms of
specifications and capital values, which played a pivotal role in improving the overall
demand for housing sector in the city. Capitalizing on lower capital values and improved
demand in first few quarters of 2009, Pune witnessed a huge supply of 11,214 units during
the year compared to just 6,900 units in year 2008.
Steady recovery of the residential sector since 2H09. Residential affordability increased in
2009, primarily due to rational mortgage rates and reduced residential prices. Several banks
lowered the home loan rates from 12-13% in 2008 to 8.5-9% in 2009. Moreover the average
capital values in the city fell about 10-25% from their peak values of 2Q08. The confluence
of price correction and lowered mortgage rates led to a rise in affordability of buyers. Also
developers’ focus primarily on the affordable housing segment throughout the year 2009
played a pivotal role in improving the overall demand for housing sector in the city. The
average quarterly absorption which was recorded at approximately 2,000 units between the
period 2Q08-2Q09 had almost doubled and stood at approximately 4,000 units over the last
one year since 3Q09, clearly indicating the improved sentiments among the buyer as well as
the investor communities. With the improving economic conditions as evident from the
increased absorption of office space in the year 2010, the employment security has also
strengthened resulting in increased absorption levels in year 2010. As compared to 10,187
units absorbed in 2009, the first three quarters of 2010 alone has witnessed absorption of
approximately 13,900 units.
Residential micro market description:
Pune has a vast land bank.
It can be divided into 6(Six) micro markets, such as:
51
1. Kharadi and Wagholi
2. Hadapsar and Handewadi
3. Undri, NIBM and Kondhwa
4. Katarj, Ambegaon, Sinhagad road, kothrud and Warje
5. Bhavdhan, Pashan, Baner, Balewadi and Aundh
6. Wakad and Hinjewadi.
Pune residential sector overview:
52
About Kharadi and Wagholi:
The area of Kharadi and Wagholi lie in the North eastern part of Pune.
53
The driving factors include:
- Proximity to Nagar road
- Location of Eon SEZ and Zensar IT Park.
- Connectivity to Magarpatta city.
Kharadi and Wagholi contribute to 4.97% of residential space available in the city of
Pune.
The average area in of 1 BHK is 740sq/ft, 2 BHK is 1232sq/ft and of 3 BHK is 1532sq/ft.
PROJECT
NAME
AREA DEVELOPER NO.
OF
UNITS
ABSORPTION
Forest
county
Karadi/Wagoli Vascon/Clover
384 244
Aura
county
Karadi/Wagoli Jalan maple
shelter 200 109
Mio
Palazzo
Karadi/Wagoli Shubh
developer 88 28
Mount and
glory
Karadi/Wagoli Sancheti
developer 240 190
Renaissant Karadi/Wagoli Alcon 264 162
Ozone Karadi/Wagoli Raviraj Group 120 68
Tuscan
Estate
Karadi/Wagoli Kolte Patil
group 48 36
Availability:
54

6%
62%
32%
1 BHK 2 BHK 3 BHK
As per the survey conducted in the micro market of Kharadi for a sample size of 1344 flats, it
was observed that the total segregation of type of flats were:
1BHK- 112150 sq feet
2 BHK- 1092645 sq feet
3 BHK- 569990 sq feet
Thus, it can be concluded that the approximate overall percentage availability of flats in Kharadi
are: 1 BHK- 6%, 2 BHK- 62% and 3 BHK- 32%.
Absorption:
Type Of Flat
Launched Sold
2 BHK 814 516
3 BHK 370 222
1 BHK 160 99
55

2 bhk 3 bhk 1 bhk 0
100
200
300
400
500
600
700
800
900
Launched Sold
As per the survey the total absorption of flats in Kharadi area is 60% as per 2Q11.
Rate:
2008 2009 2010 2011 20120
1000
2000
3000
4000
5000
6000
Rate
Average rate of residential space at Kharadi in 2009 was Rs. 2900 per sq feet
Present rate is 3680 per sq feet
Thus a rise of Rs 780 has been observed in the time span of two years, which shows a
growth of26.89% in the residential belt of Kharadi and wagholi.
56

About Hadapsar and Handewadi:
The area of Hadapsar and Handewadi lie in the South eastern part of Pune.
The driving factors include:
- Central location of Magarpatta and Amanora city
- New I.T office setup.
- Connectivity to Sholapur Highway
- Heavy infrastructure and Entertainment development
Hadapsar and Handewadi contribute to 16.38% of residential space available in the city
of Pune.
The average area in of 1 BHK is 720sq/ft, 2 BHK is 990sq/ft and of 3 BHK is 1418sq/ft.
PROJECT
NAMEAREA DEVELOPER
NO. OF
UNITS ABSORPTION
The Orchard Hadapsar/Handewadi Shiv parvati developer 330 266
Green City Hadapsar/Handewadi Arihant Venkateshwara 1584 1350
Dreams Elina Hadapsar/Handewadi Dreams realities 240 174
Dreams
AakrutiHadapsar/Handewadi Dreams realities 986 852
Pebble park Hadapsar/Handewadi Kumar properties 320 256
Valay Hadapsar/Handewadi Bhujbal brother 44 36
Celebria Hadapsar/Handewadi Bhosale patil 150 114
Seagull Hadapsar/Handewadi Runwal 576 490
Availability:
57
18%
75%
6%
1 bhk 2 bhk 3 bhk
As per the survey conducted in the micro market of Kharadi for a sample size of 5106 flats, it
was observed that the total segregation of type of flats was:
1BHK- 706364 sq feet
2 BHK- 2903010 sq feet
3 BHK- 247000 sq feet
Thus, it can be concluded that the approximate overall percentage availability of flats in Kharadi
are: 1 BHK- 18%, 2 BHK- 75% and 3 BHK- 7%.
Rate:
2006 2008 2010 2012 20140
500
1000
1500
2000
2500
3000
3500
4000
Rate
58
Average rate of residential space at Hadapsar/Handewadi in 2008 was Rs. 2200 per sq
feet
Present rate is 3100 per sq feet
Thus a rise of Rs 900 has been observed in the time span of three years, which shows a
growth of 40.90% in the residential belt of Hadapsar and Handewadi.
Absorption:
Type of flat Launched Sold
1 BHK 1147 984
2 BHK 3004 2560
3 BHK 226 190
1 bhk 2bhk 3 bhk0
1000
2000
3000
4000
5000
6000
SoldLaunched
As per the survey the total absorption of flats in Hadapsar/Handewadi area is 84.32% as per
2Q11.
59
About Undri and NIBM:
The area of Undri, NIBM lie in the South eastern part of Pune.
The driving factors include:
- Proximity to Mahatma Gandhi (Camp) road
- Connectivity to Bengaluru Highway.
Undri and NIBM contribute to 7.48% of residential space available in the city of Pune.
The average area in of 1 BHK is 720sq/ft, 2 BHK is 1200sq/ft and of 3 BHK is 1750sq/ft
and 4 BHK is 3500.
PROJECT
NAMEAREA DEVELOPER
NO. OF
UNITS ABSORPTION
Aasamant NIBM/Undri Nirmaan Group 256 79
La Ventana NIBM/Undri Siddhivinayak 60 22
Signare NIBM/Undri Alcon 144 41
Sparsh NIBM/Undri Ganga 120 63
Estoria NIBM/Undri Ganga 88 20
Sublime NIBM/Undri Kumar properties 176 39
Nine hills NIBM/Undri Purple and Acropolies 288 230
Ivory NIBM/Undri Shobha 192 53
Urban space NIBM/Undri GRM group 144 25
Ethos NIBM/Undri Nyati builder 676 99
Iris NIBM/Undri Nyati builder 132 90
Ebony NIBM/Undri Nyati builder 176 80
60
Windchimes NIBM/Undri Nyati builder 192 121
Colori NIBM/Undri Amit Construction 432 60
Astria NIBM/Undri Raviraj Group 60 42
Sangria NIBM/Undri Marvel and ganga 668 420
Availability:
1%
35%
45%
20%I BHK2BHK3 BHK4 BHK
As per the survey conducted in the micro market of NIBM/Undri for a sample size of 4564 flats,
it was observed that the total segregation of type of flats was:
1BHK- 35100 sq feet
2 BHK- 1658390 sq feet
3 BHK- 2144641 sq feet
4 BHK-954931 sq feet
Thus, it can be concluded that the approximate overall percentage availability of flats in Kharadi
are: 1 BHK- 1%, 2 BHK- 34% and 3 BHK- 45% and 4 BHK- 20%.
Absorption:
61
Type of flat Launched Sold
1 BHK 1147 984
2 BHK 1106 605
3 BHK 929 430
4 BHK 264 224
1 bhk 2bhk 3 bhk 4 Bhk
0
500
1000
1500
2000
2500
SoldLaunched
As per the survey the total absorption of flats in NIBM/Undri area is 84.32% as per 2Q11.
Rate:
20062007
20082009
20102011
20122013
0500
100015002000250030003500400045005000
Rate
Average rate of residential space at NIBM/Undri in 2008 was Rs 2600 per sq feet
Present average rate is 3840 per sq feet
Thus a rise of Rs 1240 has been observed in the time span of three years, which shows a
growth of 47.96% in the residential belt of NIBM/Undri.
62
About Katarj, Ambegaon, Sinhagad road, Kothrud and Warje:
The area of Katraj, Ambegoan, Sinhagad and kothrud lie in the South western part of
Pune.
The driving factors include:
- Proximity to Jangali Maharaj road Fergussen College road and MG road
- Connectivity to Mumbai Pune Highway.
- Excellent road connectivity due to the mega township Nanded city coming up
This area contributes to 36.11% of residential space available in the city of Pune.
The average area in of 1 BHK is 660sq/ft, 2 BHK is 1150sq/ft and of 3 BHK is 1550sq/ft
and 4 BHK is 2750.
PROJECT
NAME
AREA DEVELOPER NO. OF
UNITS
Absorption
Akruti city Kataraj/Ambegaon Akruti 1380 1298
Olive Kataraj/Ambegaon Mind space reality 216 196
Lake Vista Kataraj/Ambegaon
shree Venkatesh
buildcon 200 76
Garden View Kataraj/Ambegaon Tyagi/mittals/trimurti 704 690
Eros Kataraj/Ambegaon Paramount 264 262
Bloomfield Kataraj/Ambegaon Amit Construction 466 319
Kalpataru Sihagard/Warje Rajlaxmi 162 95
Samarth Puram Sihagard/Warje Shree Saarth builders 60 27
63
Vasant vihar Sihagard/Warje Savitri developer 116 46
Oakwood County Sihagard/Warje Darode Jog 168 162
Amrutvel Sihagard/Warje Laxmi builders 152
Arcdia Sihagard/Warje Balark developers 188 30
Miami Sihagard/Warje Majestique 224 31
Amrut Ganga Sihagard/Warje Goelganga 168 142
Ganga Bhagyoday Sihagard/Warje Goel ganga 132 68
Nanded City Sihagard/Warje Magarpatta City 5160 2874
Availability:
16%
64%
20%
1 BHK2 BHK3 BHK
As per the survey conducted in the micro market of Katraj/ Sinhagad/ Warje/ Ambegaon
For a sample size of 9760 flats, it was observed that the total segregation of type of flats was:
1BHK- 1979496 sq feet
64
2BHK- 7707155 sq feet
3BHK- 2444494 sq feet.
Thus, it can be concluded that the approximate overall percentage availability of flats in Kharadi
are: 1 BHK- 16%, 2 BHK- 64% and 3 BHK- 20%.
Absorption:
Type of flat Launched Sold
1 BHK 7251 4046
2 BHK 3045 1650
3 BHK 1482 672
0
2000
4000
6000
8000
10000
12000
1 bhk 2bhk 3 bhk
Sold
Launched
As per the survey the total absorption of flats in Katraj/ Sinhagad/ Warje/Ambegaon area is
54.36% as per 2Q11.
Rate:
65
Rate
0
500
1000
1500
2000
2500
3000
3500
4000
4500
2007 2008 2009 2010 2011
Rate
Average rate of residential space at Katraj/Sinhagad/Warje/Ambegoan in 2008 was Rs
2200 per sq feet
Present average rate is 3600 per sq feet
Thus a rise of Rs 1400 has been observed in the time span of three years, which shows a
growth of 63.63 in the residential belt of Katraj/Sinhagad/Warje/Ambegaon.
About Bhavdhan, Pashan, Baner, Balewadi and Aundh:
66
The area of Bhavdhan, Pashan, Baner and Aundh lie in the North western part of Pune.
The driving factors include:
- Proximity to Hinjewadi IT park road
- Connectivity to Mumbai-Pune Highway.
- Good planned area
- Centrally located between Pune central and Hinjewadi
It contributes to 73.45% of residential space available in the city of Pune.
The average area in of 1 BHK is 620sq/ft, 2 BHK is 1250sq/ft and of 3 BHK is 1650sq/ft
and 4 BHK is 2500.
PROJECT NAME
AREA DEVELOPER NO. OF UNITS ABSORPTION
Skyi Irish Bhavdhan Skyi developer 86 30
Zinnea Bhavdhan Surana Associates 129 114
Pebbles Bhavdhan Rainbow group 188 94
Rohan Ishan Bhavdhan Rohan Builder 63 59
Eva Bhavdhan Anshul Realties 60 51
Dreams Belle Vue Bhavdhan Dreams realities 96 98
Esplanade Bhavdhan Nyati builder 253 210
Viva hallmark BhavdhanVivaswaraj developers 330 192
Orvi Balewadi Sai Samruddhi 96 82
Crest Avenu Balewadi Kiriti developer 96 38
Vatika Balewadi Bhujbal brother 180 132
Kool homes Balewadi kool home 176 132
Aura Balewadi Bhandari Associates 176 143
43 Balewadi 192 0
Stop Balewadi 60 51
Amit Balewadi Amit Construction 140 138
Eiffel greens Balewadi Eiffel builders 192 160
Alcon county Aundh Pride purple group 192 88
Jarvari Aundh G.K Fortune 180 40
Comfort Zone Banner Shagun 108 82
67
Green Zone Banner Kundan mehta 132 90
Sulochana city Banner Nandgude patil 168 67
Papillon Pashan/sus Kumar properties 120 93
vinyanari Pashan/sus DSK 176 117
Peninsula Pashan/sus Kumar properties 192 32
Orange County Pashan/sus Orange group 88 42
Park Ridge Pashan/sus Jk group 240 165
Tierra viva Pashan/sus Achalare 96 62
Meadow Pashan/sus Nagpal group 192 105
Availability:
59%
41%
2bhk3 bhk
As per the survey conducted in the micro market of Bhavdhan/Pashan/Balewadi/Aundh/ Sus for
a sample size of 4205 flats, it was observed that the total segregation of type of flats was:
2 BHK- 2252388 sq feet
3 BHK- 1574462 sq feet
Thus, it can be concluded that the approximate overall percentage availability of flats in Kharadi
are: 2 BHK- 59% and 3 BHK- 41%.
Absorption:
68
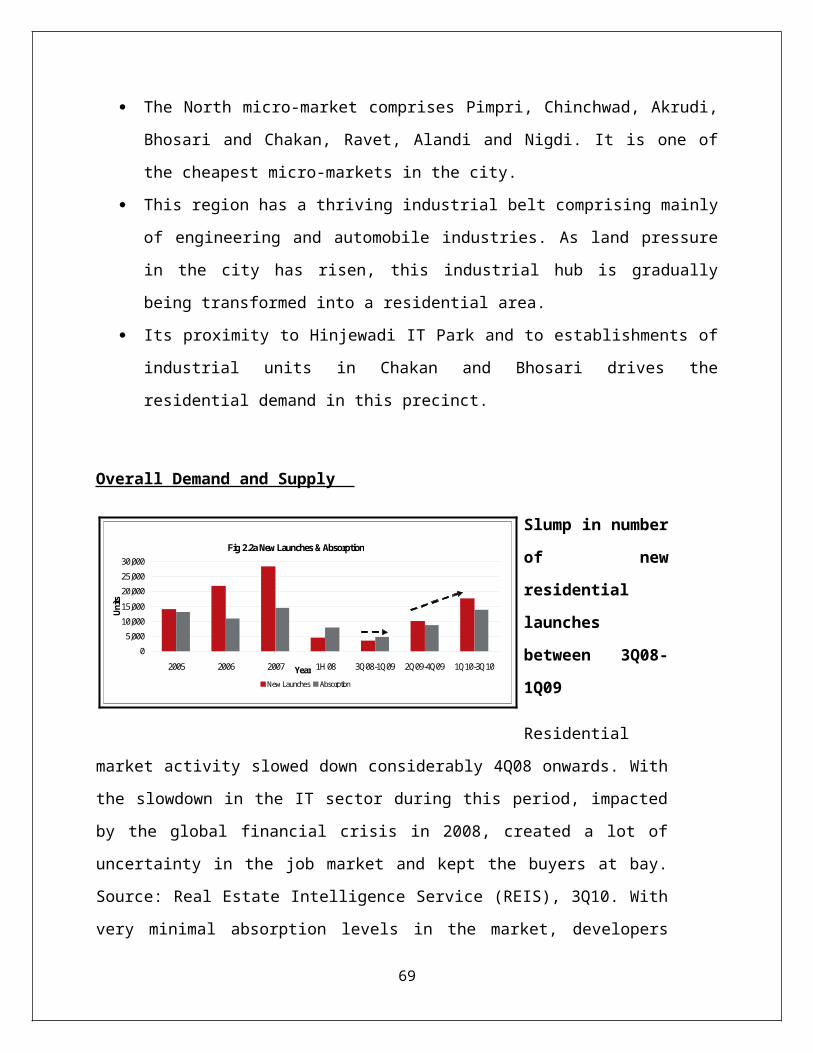
Type of flat Launched Sold
2 BHK 1465 1126
3 BHK 674 367
2 BHk 3 Bhk0
200400600800
1000120014001600
Launchedsold
As per the survey the total absorption of flats in Bhavdhan/Pashan/Balewadi/Aundh/Susarea is
63.56% as per 2Q11.
Rate:
2006 2007 2008 2009 2010 2011 2012 20130
50010001500200025003000350040004500
Rate
Average rate of residential space at Bhavdhan/Pashan/Balewadi/Aundh/Sus in 2008 was
Rs2500 per sq feet
Present average rate is 3100 per sq feet
Thus a rise of Rs600 has been observed in the time span of three years, which shows a
growth of 24% in the residential belt of Bhavdhan/ Pashan/Balewadi/Aundh and Sus.
About Wakad and Hinjewadi:
69
The area of Wakad and Hinjewadi lie in the South East part of Pune.
The driving factors include:
- Hinjewadi is the biggest it park in Pune with 2 lakh people working
- Connectivity to Mumbai-Pune Highway.
- Very well connected to Mumbai and lonavala MIDC
It contributes to 75.57% of residential space available in the city of Pune.
PROJECT NAME
AREA DEVELOPER NO. OF UNITS
ABSORPTION
Madhupushpa Wakad Tejraj construction 108 120
Navdeep Wakad Navdeep developer 80 74
Dynasty Wakad Sukhwani Chawla 216 245
Florencia Wakad Aswini associates 288
Harmony Wakad Kalpataru Developer 124 113
Petals Wakad Sai Mittal Associates 68 66
Lattitude Wakad B.U Bhandari 150 140
Casa Imperia Wakad Sanskruti Group 120 108
Apostrophe Wakad Kasturi 150 160
Splendour Wakad Kalpataru Developer 78 22
Park Titanium Wakad Pride purple group 192 155
Signor Hinjewadi Saarrthi Group 176 80
Beverly hills Hinjewadi Sheth Realty 112 92
Xotech Hinjewadi Vascon 96 22
70

Green Olive Hinjewadi KoltePatil group 192 105
Availability:
57%35%
8%
2 Bhk3 Bhk4 BHK
As per the survey conducted in the micro market of Wakad and Hinjewadi for a sample size of
2105 flats, it was observed that the total segregation of type of flats were:
2 BHK- 1782338 sq feet
3 BHK- 1109224 sq feet
4 BHK- 241920 sq feet.
Thus, it can be concluded that the approximate overall percentage availability of flats in Kharadi
are: 2 BHK- 57%, 3 BHK- 35% and 4 BHK- 8%.
Absorption:
Type of flat Launched Sold
2 BHK 1352 1112
3 BHK 274 176
4 BHK 324 260
71

2 Bhk 3 Bhk 4 BHK0
500
1000
1500
2000
2500
SoldLaunched
As per the survey the total absorption of flats in Wakad and Hinjewadi area is 79.38% as per
2Q11.
Rate:
200620072008200920102011201220130
500100015002000250030003500400045005000
Rate
Average rate of residential space at Wakad and Hinjewadiin2008 was Rs. 2800 per sq
feet.
Present average rate is 3500 per sq feet
Thus a rise of Rs 700 has been observed in the time span of three years, which shows a
growth of 25% in the residential belt of Wakad and Hinjewadi
72

5. MANAGEMENT LESSONS
The success of any business depends upon proper and efficient management. Management plays
very important and pivotal role in all business concerns. In this era of competition the success of
any business greatly depends upon the management skills of high quality.
Management is a developing science. It has now involved certain basic principles and elements
in the form of process of management which has universal application in each branch of human
73
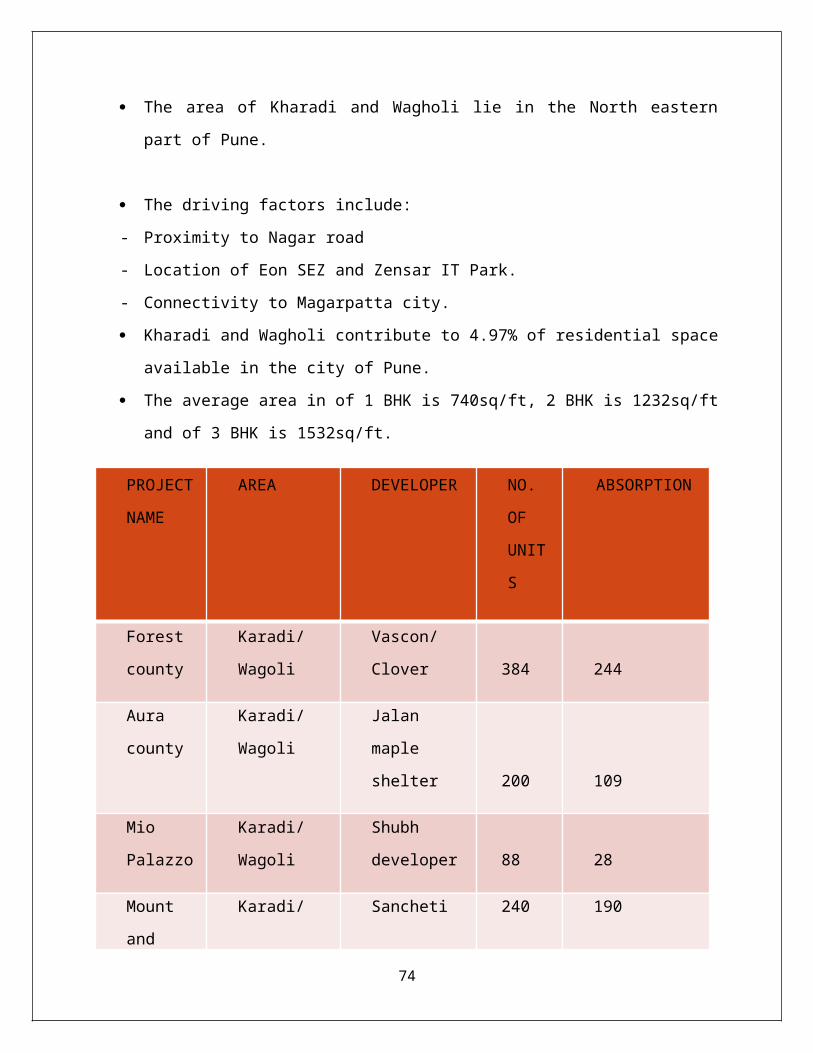
activity that is profit making as well as non-profit making organization. Management is the
development of people. It is an economic organ of the industrial society. Management is a must
for the setting up, proper running and success of collective enterprise. It organizes the available
human and physical resources and directs them towards better performance and higher
productivity, at the minimum of costs. So studying management is must.
1. EFFECTIVE COMMUNICATION SKIILS, CONFIDENCE, GOOD BODY
LANGUAGE AND PROCESS OF SCREENING AND PERSONAL INTERVIEW.
The first day of mine on which I faced screening and personal interview taught me
whatever is asked, even if you don’t know the answer you must answer it confidently and
with a positive body language, your communication skills play a very vital role in the
process of recruitment.
2. UNITY OF COMMAND AND UNITY OF DIRECTION.
To get proper work done at the lowest cost and in the best manner, the worker should not
be put under two bosses. There should be only one supervisor over him. This will enable
the management to get the best possible services within the time limit given to each
worker. Under this system, there cannot be conflicts of orders and hence, the system
ensures the smooth working of the enterprise. It has been experienced that dual command
creates chaos as it undermines authority, puts discipline in jeopardy and disturbs the order
and stability of any concern.
3. EMPLOYEE RELATIONS, PROPER RECOGNITION AND GRIEVANCE
HANDLING SYSTEM
The organization should make efforts for proper recognition, appreciation, and
encouragement of special skills and capabilities of workers. Similarly, opportunities to
participate in managerial decisions should be provided to them.
4. EXTERNAL PUBLIC RELATION
74
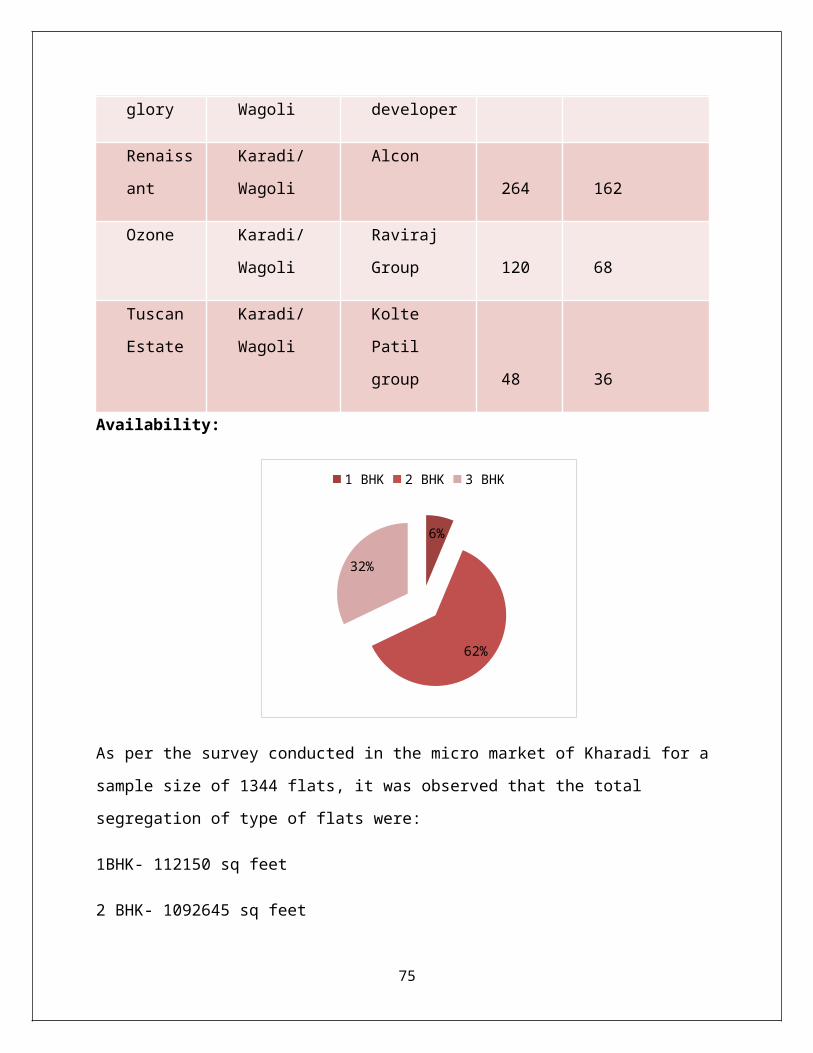
It is very important for any organization to acquire customers but before this you need to
attract them by showing them some impressive things that is creating a goodwill in the
minds of suspects.
5. MANAGEMENT IS GETTING THINGS DONE
6. MANAGEMENT IS AN INTEGRATED PROCESS AND A SYSTEM OF
AUTHORITY
Any organization whether small or big has so many legalities to be done and verified so
that it doesn’t face any problem in future.
7. COMPANY KNOWLEDGE, PRODUCT KNOWLEDGE, CUSTOMER
KNOWLEDGE AND COMPETITOR KNOWLEDGE AWARENESS.
Working in an organization is not an easy job. When you tackle your customers you must
be absolutely efficient in handling their queries and this can be only done when you have
complete knowledge of the company, product, customers and competitors.
8. CONFIDENCE IN FIELD WORK, BOLDNESS AND COMMUNICATION SKILLS.
One must have self-belief in oneself and must know how to interact with different
personality types. So boldness, confidence, being extrovert are some of the things which
must be considered while communicating with others.
9. EFECTIVE COMMUNICATION SKILLS AND NO AGGRESSIVENESS
Communication skills play a very important role in an organization. Besides this one
must communicate politely and without aggressiveness.
10. AMPLE PATIENCE.
11. DECISION MAKING, PLANNING AND SOURCE OF INFLUENCE.
Staff officers are experts or specialists in their own field. They plan jobs, take decisions
and implement them in their respective fields.
75
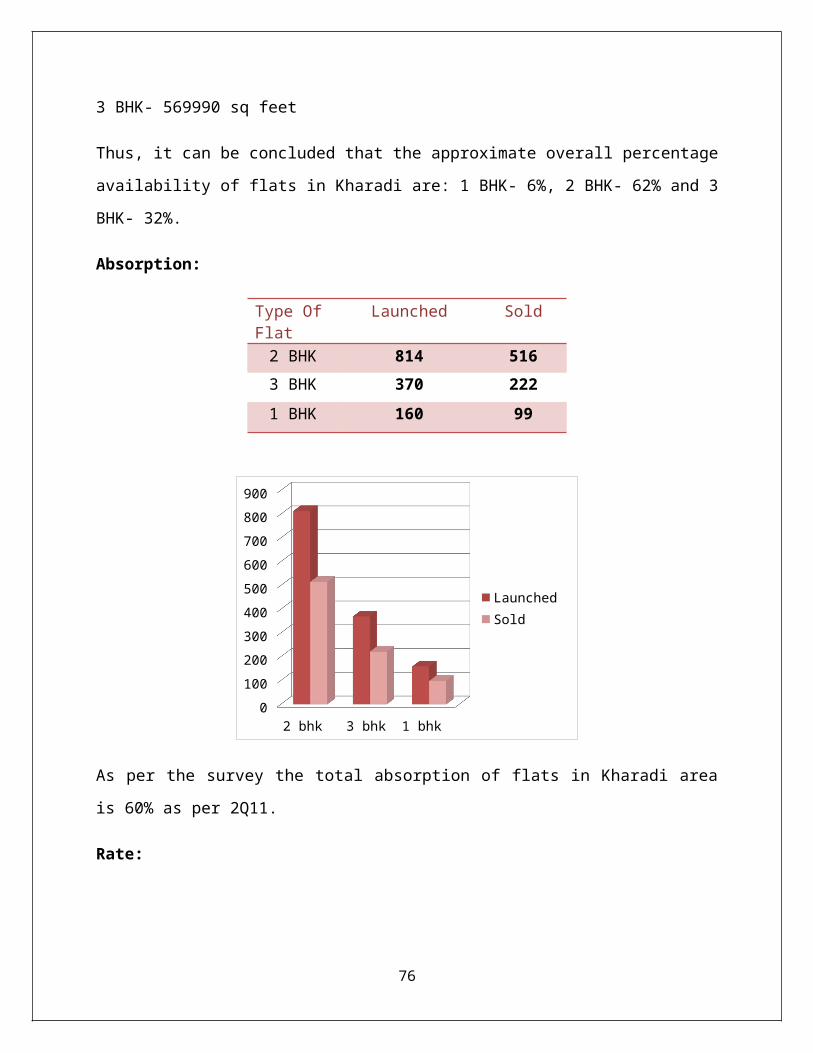
12. HOW TO MOTIVATE OTHERS AND SELF- BELIEF.
Nothing is impossible in this world. The thing one must keep in mind is that you must not
lose your will power and you must be confident enough to do any kind of work.
13. PROFESSIONALISM.
14. INTERNAL PUBLIC RELATION AND LEADERSHIP.
This is actually done to build up a good image in the minds of employees that the
company cares for them and actually takes initiative if required.
15. PROMPT AND ADEQUATE SERVICE AND CONSUMER AND PRODUCT
RESEARCH.
The management has to produce goods that meet the requirements of the consumers of
different classes, tastes, and with varying purchasing powers. It has to ensure continuous
supply of goods and services at fair prices.
16. PUNTUALITY, DISCIPLINE AND ORDER.
Time is very valuable. Everything in life can be recovered, but once the time is gone, it
can’t be recovered. So always consider time as the most precious thing in life.
17. TRAINING AND DEVELOPMENT
As the company is concerned with sale of policies it is very important to train a person
who will be involved in this particular work. Sales training process consists of three
broad phases – assessing sales training needs, designing and executing sales training
programme, and evaluating and reinforcing sales training programme.
18. SUPERVISION AND MAINTAINENCE.
It is always good to keep a record or keep a record or keep an eye on the visitors of the
company. It always helps in finding out the names of the persons who actually leaves the
76
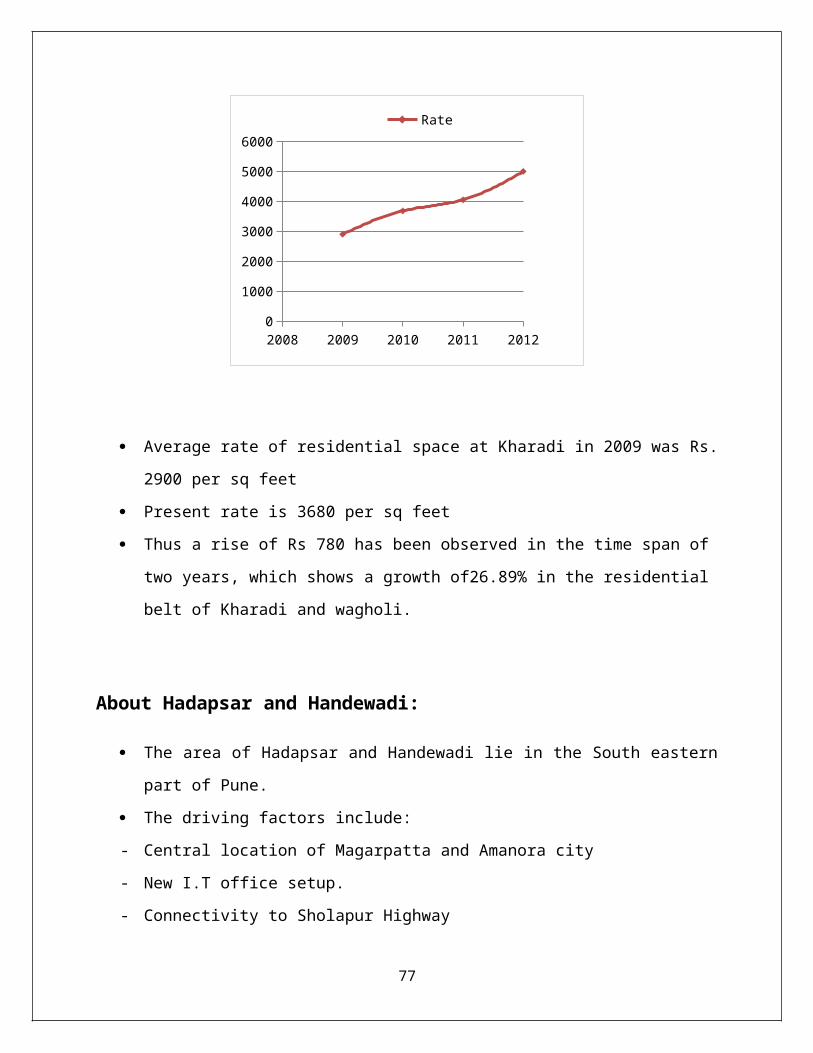
office before time or it is also helpful to find out a person who comes late and moreover
if any illegal thing happens it will be easier to find out a person.
19. MANAGEMENT IS CONCERNED WITH DIRECTION AND CONTROL.Management has got set of rules and regulations to follow. As in any organisation a
scalar chain exists, the subordinates are liable to take permission from his boss for any
action to be taken.
20. CODE OF CONDUCT
21. MANAGEMENT COORDINATES ALL ACTIVITIES AND RESOURCES
Management is concerned with the coordination of all activities and resources through its
various functions to attain the stated objective.
22. TECHNOLOGY ADAPTATIONAND TASK ADAPTATION.
Due to ever increasing growth and importance of modern technology, an organization has
to introduce the changes in the organization to cope up with the changing environment.
Task is required to be changed. Technological changes include changes in plant and
equipment, techniques of job performance, methods of production, etc.
23. ARBRITRATION.
Disputes and conflicts are the part of the firms. People with different mentalities work
together under one roof; so fight is a very common thing in an organization. But the main
fact to be considered is that how to tackle it.
24. MUTUAL UNDERSTANDING, CO-OPERATION AND INITIATIVE
In an organization employees must cooperate with each other whenever needed. Good
management, for the common benefit, shall encourage every employee of the concern in
his individual of work and thereby the principle of initiative to work more and better will
develop.
77
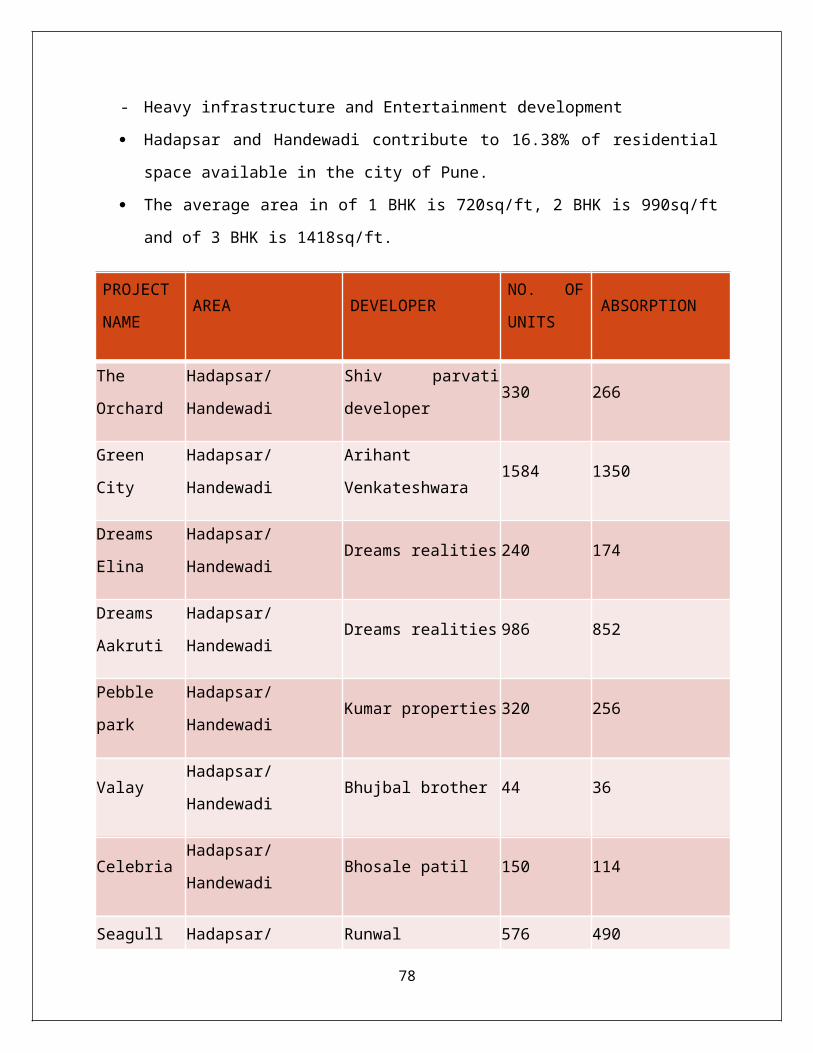
25. SOCIAL AND CULTURAL INFLUENCES
The social and group norms exert considerable influence on the style of the decision
maker. A social form is an evaluating scale designating acceptable latitude and an
objectionable latitude for behaviour activity, events, beliefs, or any object of concern to
members of a social unit.
26. PROPER WORKING CONDITIONS AND WORKERS WELFARE.
27. WORK FOR THE INTEREST OF ALL ENTERPRISE, IMPROVING PUBLIC IMAGE
AND SOCIAL POWER.
A socially responsible organization does not operate to benefit a narrow segment of
society like shareholders alone. It seeks to pursue the wider public interest. The
organization has a sincere concern for public interest and social good which legitimizes
the pursuit of private profit.
28. OFFICE MANAGEMENT
It is very important for an organization to look after official matters properly. Little
problems can create very big problems in the future. So taking a good decision at the
right time is very important.
29. NEGATIVE MOTIVATION AND SOUND MOTIVATIONAL SYSTEM.
There are two types of motivation. This part tells us about negative motivation,
punishments, reprimands, fear of loss of job are the methods, where people work in fear.
They will tend to produce minimum enough production to remain safe.
30. CUSTOMER EXPECTATION, USTOMER PERCEPTIONAND CUSTOMER
SATISFACTION
The customer’s service expectation acts as a benchmark for final satisfaction of the
customer. It is a belief about services delivery that functions as a standard or reference
point with which performance is judged .While analyzing the customer’s expectations,
company needs to explore and understand:
78
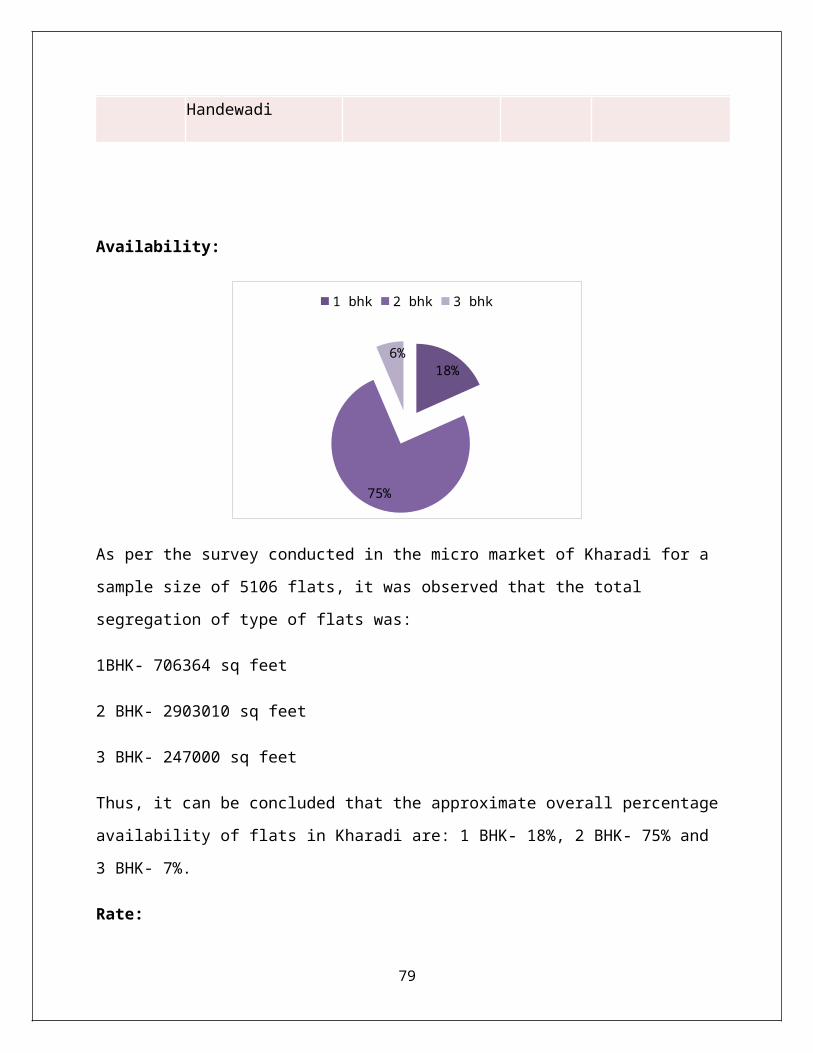
WHAT THE CUSTOMERS EXPECT OF THE SERVICES
WHAT FACTORS INFLUENCE IN THE FORMATION OF CUSTOMERS
EXPECTATION
HOW THESE EXPECTATIONS CAN BE CHANGED
WHAT A COMPANY SHOULD DO TO OVERDO CUSTOMERS EXPECTATION.
31. NO MATTER WHAT NEVER BE ARROGANT TO ANYONE.
32. ALWAYS REMEMBER THAT YOUR BOSS IS RIGHT
33. DO NOT GET INVOLVED INTO ANY CONTROVERSY
34. TIME MANAGEMENT
35. FOLLOW THE CODE OF CONDUCT
36. ADHERE TO THE COMPANY ETHICS.
79
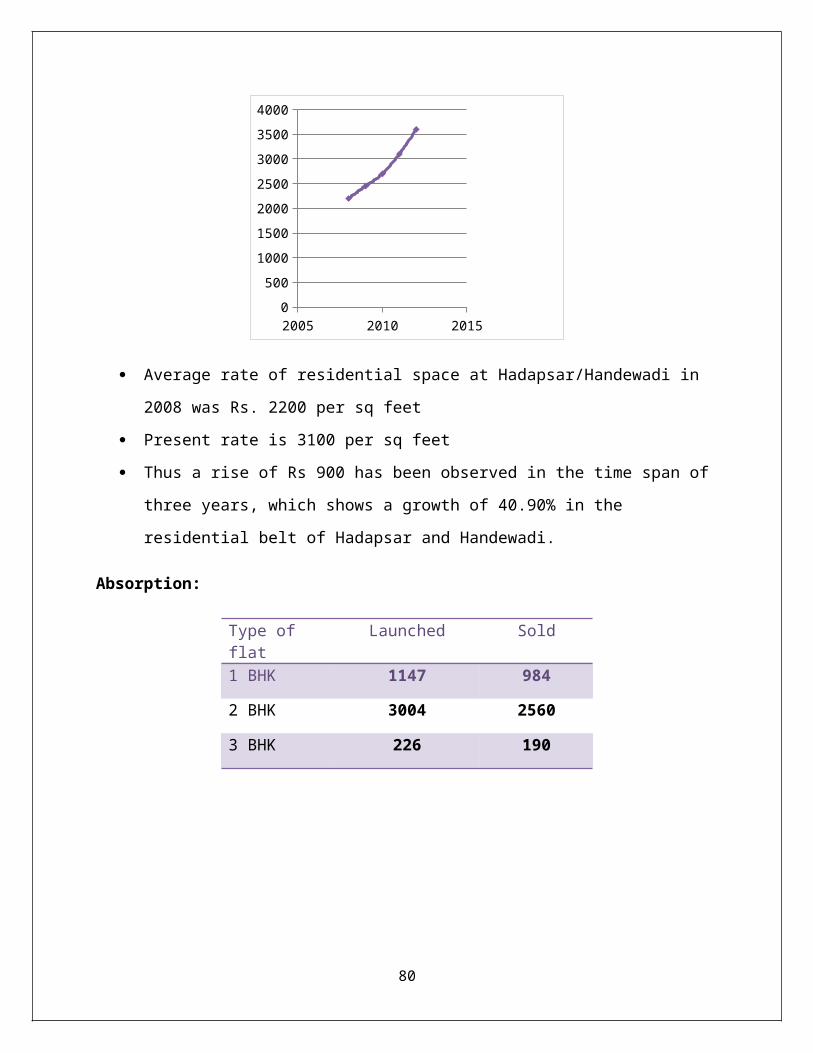
6. FINDINGS
For the ease of research process and segregation of data in a format, the city was divided into
various zones. All the residential projects that fall into the respective zones were visited and
gathering of data was done.
The supply side data was generated by understanding the on- going and upcoming projects;
while that on the demand aspect was considered by the absorption rate in the respective zones.
80
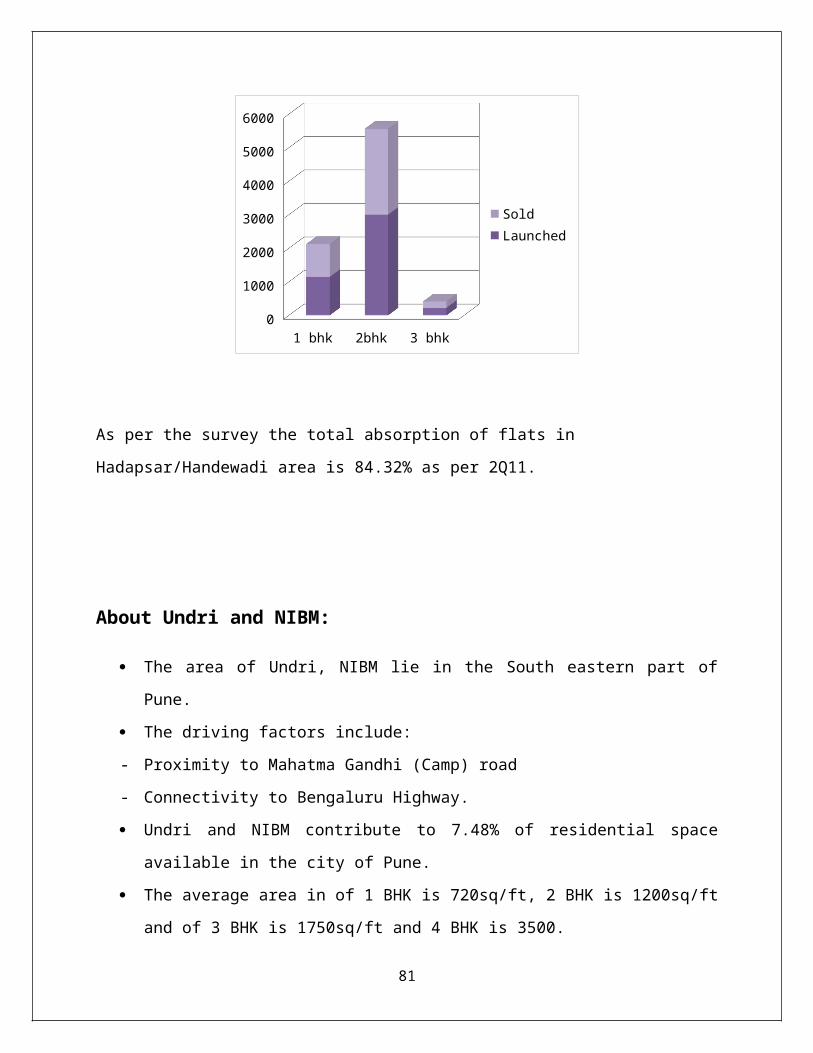
It was found that there has been ample supply from the developers and builders side of
residential offerings in the city. Most of these offerings are concentrated in the areas
surrounding the Pune central business district.
There have been vast land banks undertaken by the developers, builders and realtors for upcoming huge residential townships that will comprise of various offerings as per the demand of the population.
Concentrations of most of the residential projects have been near the IT and ITES zones around the city of Pune in the segregated zones.
It has also been found through the research carried out that the supply and demand
equation has a huge difference. The number of residential project offerings is much more
that what is demanded in the city of Pune.
One of the supporting reasons for this is the lack of demand that was seen during the
recessionary period of 2009 and 1Q10, due to which most of the on- going projects then
were halted and re-launched in the 3Q10, which are still under construction and some
nearing the possession tenure.
From the demand perspective, it was seen that most of the customer base preferred a
house, either for residential or investment purpose at a location to nearest proximity of
work place.
Along with work place proximity, customers looked at the infrastructure development in
the zone with proper connectivity to the central business district and highways.
Demand for residential space by customers also depended upon the proximity to
educational aspect such as kindergarten, schools and colleges.
The total ticket size of various offerings such as 1BHK, 2BHK, 3BHK and 4BHK were
determined on the basis of:
- the standard of the developer/ builder/ realtor
81
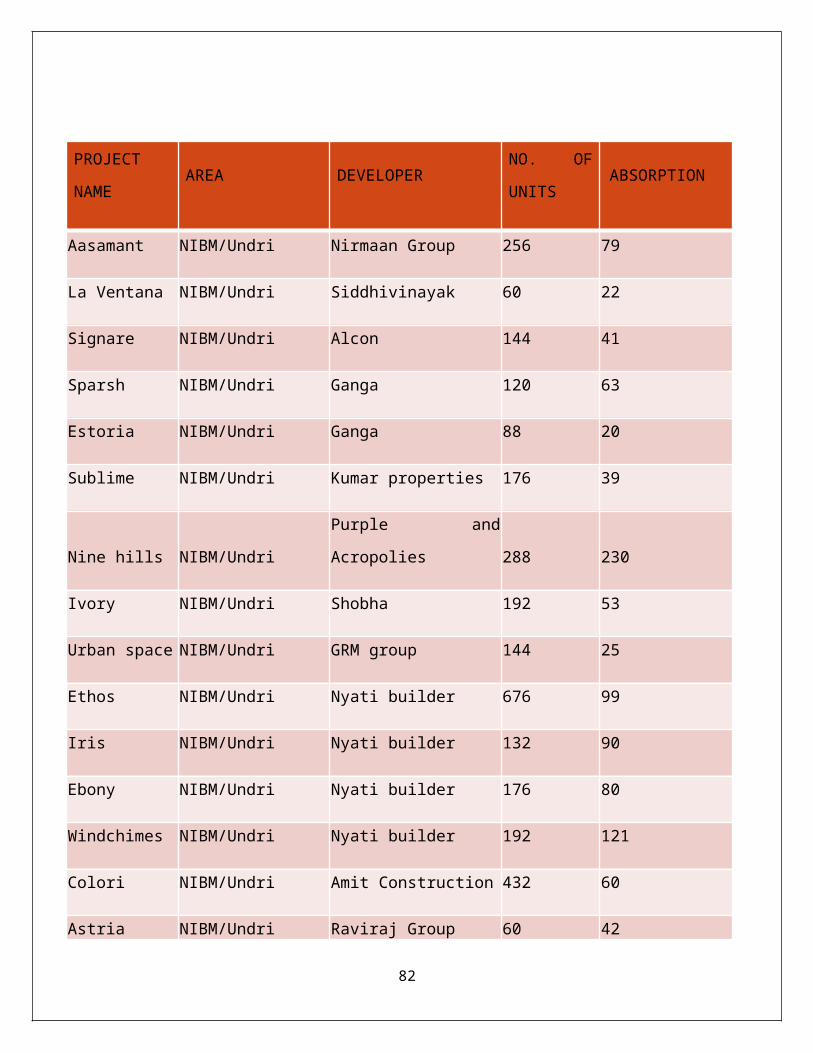
- the quality of construction
- the sq.feet area of the apartment
- the amenities provided along with the apartment
- the infrastructure of the locality and
- prevailing sq.feet area rate in the locality/ vicinity.
Projects which were launched and then halted during the recessionary period .i.e., 1Q09
to 2Q10, were priced at a rate prevailing in the area then. But after the relaunch of those
half completed projects in the 3Q10, the rates slashed down to a large extent.
This was due to a decrease in the purchasing power of the customer base; especially the
IT and ITeS working class. And so the residential offerings were leveraged at a rate
which was affordable by the customer base.
82
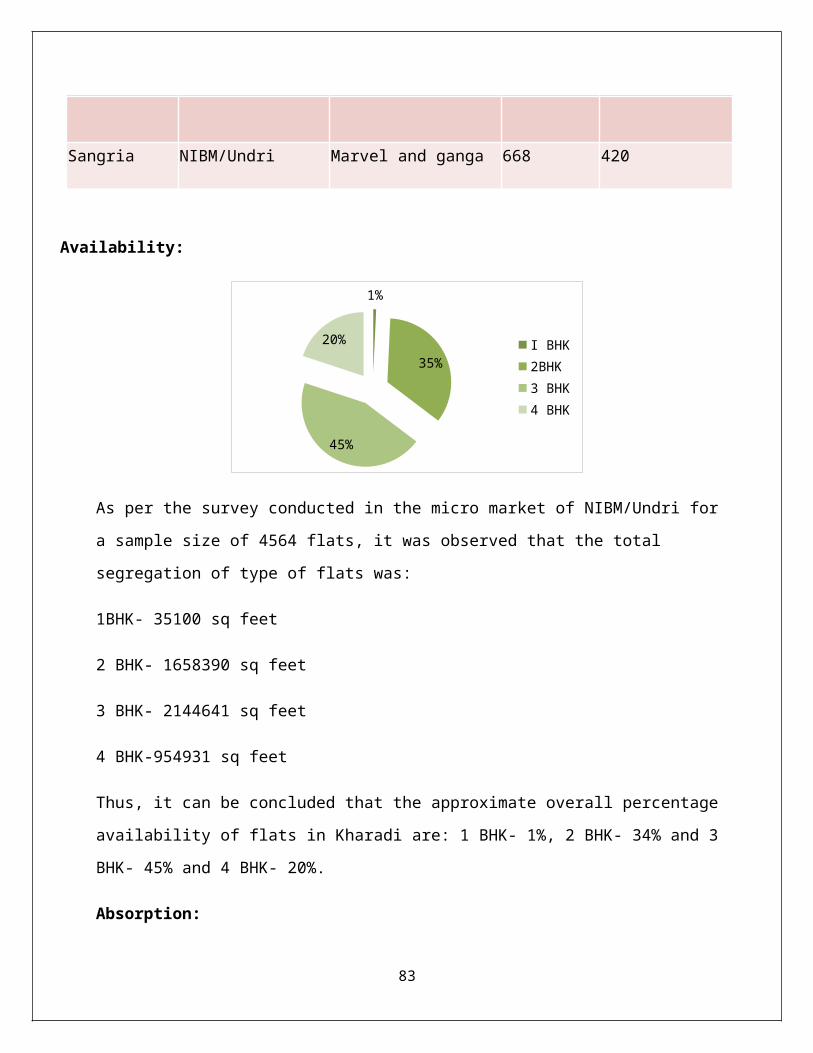
7. RECOMMENDATIONS
The entire aspect of an international level property consultant is not known to most of the
people. This is due to the unorganized structure of real estate consulting in Indian
economy.
Lack of awareness at the customer base is the most important aspect that hinders the
growth and expansion of well established property consulting in India.
83
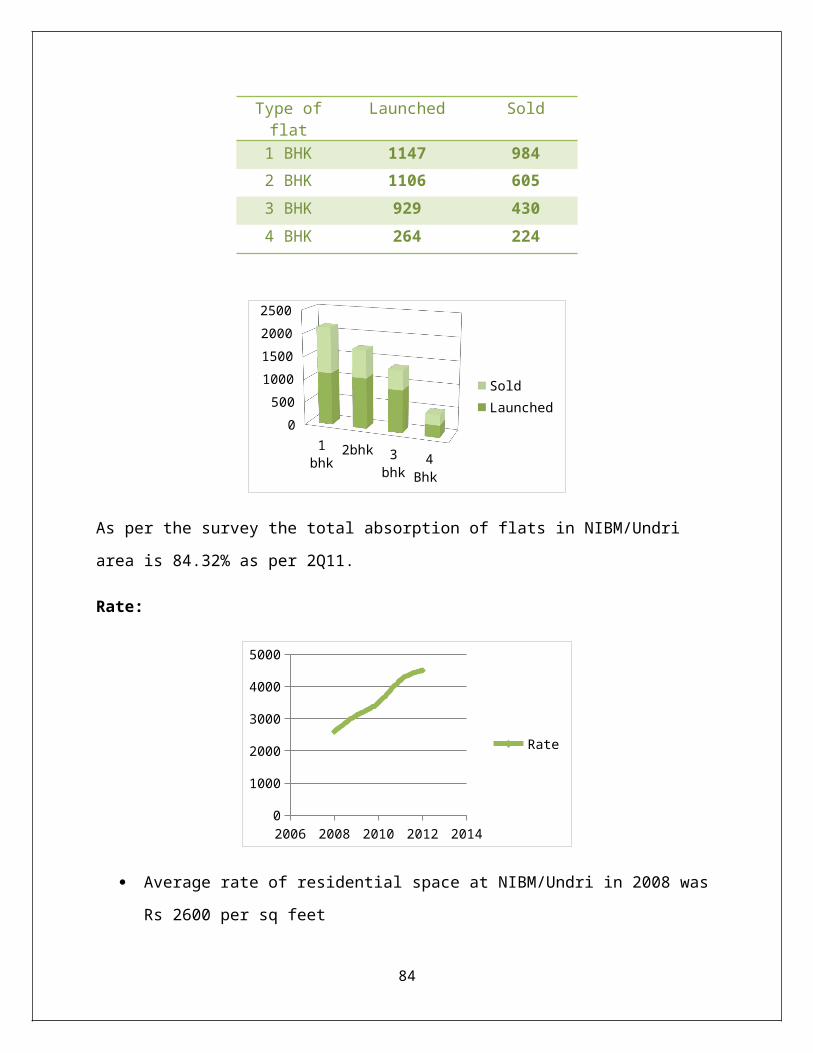
Thus there arises a need for first creating awareness within the customers and developers/
realtors of the availability of these property consultants to ease when it comes to dealing
with the residential offerings in the respective city.
The developers should offer the customers of what is demanded by them. These will in-
turn level the proportionate difference between the demand and supply of residential
offerings in the city of Pune.
Also, the customer looks for quality of construction first and its life in the long run; rather
than the quantity (rooms) offered.
Along with this the infrastructure development in the vicinity is what the customer will
look for and hence the developers should make it a point to look at the aspect in the long
run and the scope of development in the vicinity.
84
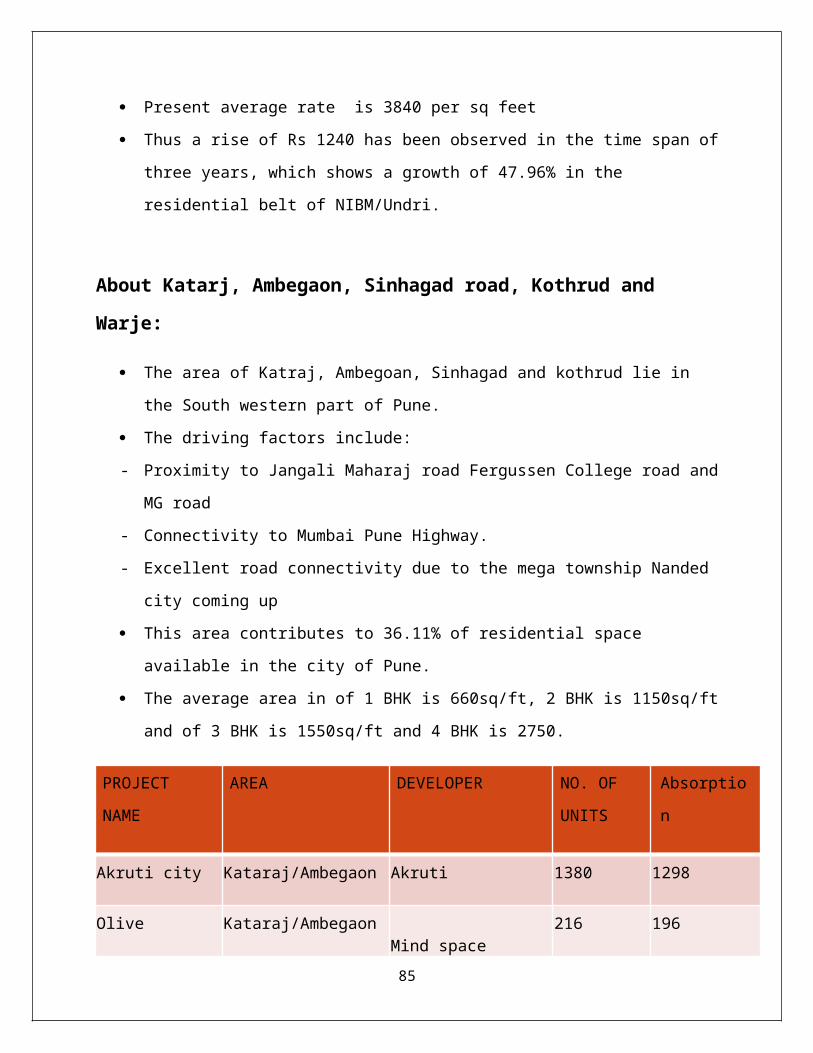
8. CONCLUSIONS
Kharadi and Wagholi: Location
• Wagholi has emerged as preferred residential destination in past 1.5-2 years primarily due to
the competitive price that it offers compared to other residential catchments along Nagar Road
like Kharadi, Viman Nagar & Kalyani Nagar.
85
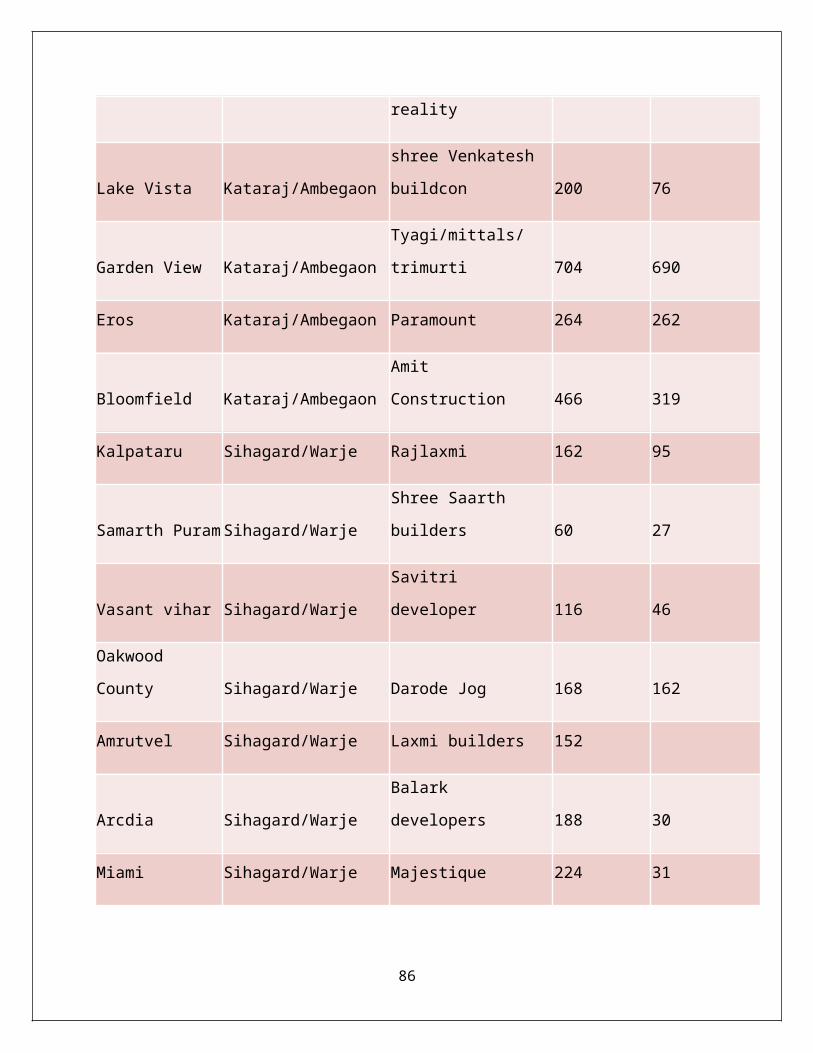
• Apart from affordability, Wagholi is the most convenient location to stay for people working in
Ranjangaon & Sanaswadi Industrial areas as well as Kharadi-Magarpatta belt and the emergence
of EON IT park.
• Lastly Wagholi has direct link road to Pune Airport and Ahmednagar which further adds to its
advantage.
Aspects influencing residential sales/absorption and its significance in current scenario
Aspect 1) Timing
- Currently market condition has improved and is much better than the sluggish period of last
year as per the sales and absorption instances
86
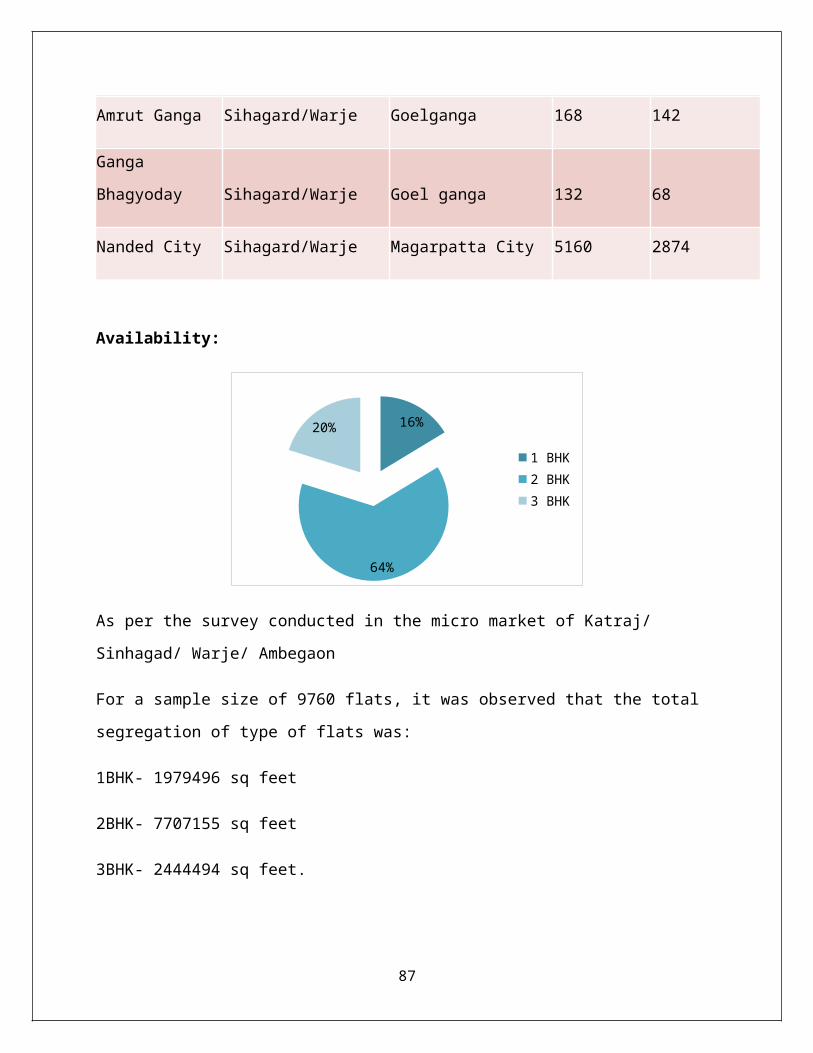
- Therefore launching right product at right price in current market can make the project resist in
future downside.
Aspect 2) Product
- Product should be a mix of both low rise and high rise.
- Variation in the sizes and specifications of high rise and uniqueness in terms of experience
through planning and space flow in low rise should keep sales steady in all markets scenario
Aspect 3) Pricing
- Pricing largely depends upon project location i.e. weather it’s before Wagholi village or after
and access.
- So depending on these factors the pricing for high rise should range from INR 3000-4500 per
sq.feet and for low rise in the range of INR 2500-3000 per sq.feet
87
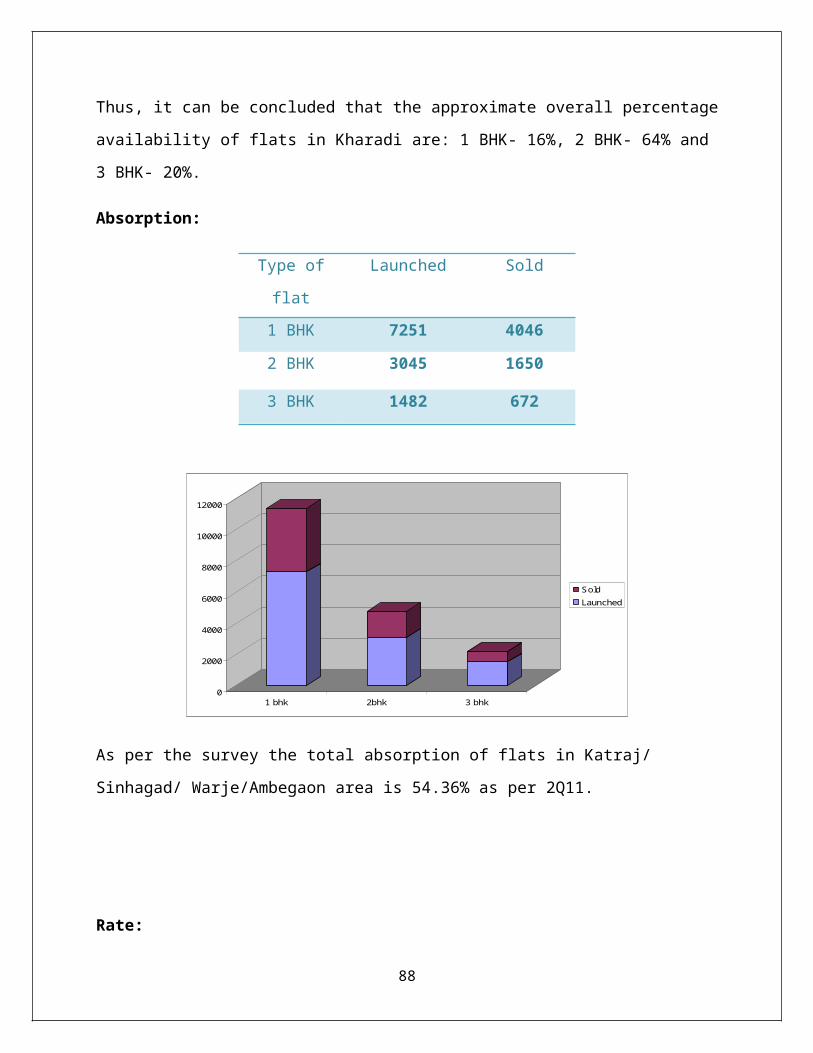
9. BIBLIOGRAPHY
Electronic reference:
www.joneslanglasalle.com
www.google.com
88
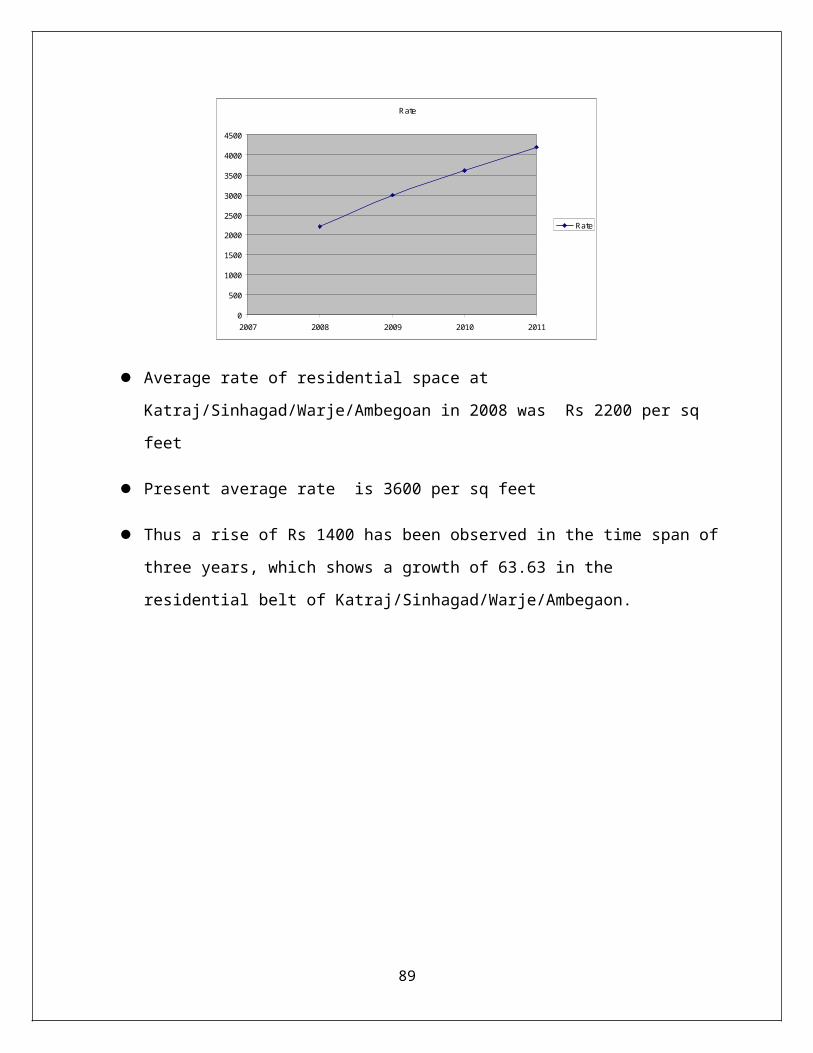
www.timesproperty.com
www.marvelrealtors.com
Print media reference:
Jones Lang LaSalle research documents
Jones Lang LaSalle yearly magazine
Jones Lang LaSalle Homebay journal
Book reference:
Marketing Management by Philip Kotler, tenth edition, Prentice- Hall India, ISBN-81-
203-1609-6, forty- forth printing in February 2001.
Marketing Research by Rajendra Nargundkar, third edition, TATA McGraw Hill, ISBN-
13: 978-0-07-022087-4 tenth reprint 2011.
89