apjor.comapjor.com/files/1423219482.docx · web viewdr. parneet kaur (assistant professor) school...
TRANSCRIPT

1
Modelling Dynamic Volatility Spillovers from the US to the BRIC countries'
Stock markets during the Subprime Crisis
Amanjot Singh (Doctoral Research Fellow)
University School Of Applied Management
Punjabi University, Patiala, Punjab, India 147002
And
Dr. Parneet Kaur (Assistant Professor)
School Of Management Studies
Punjabi University, Patiala, Punjab, India 147002
Correspondence concerning this paper requested to be addressed to
Amanjot Singh, 303-C Rajguru Nagar, Ludhiana, Punjab 141012
Contact-+919815745727
Email: [email protected] and [email protected]

2
Author note:
The material is not published, copyrighted, accepted or under review elsewhere. The paper is a
part of doctoral thesis.
Abstract
The term 'BRIC' is a collection of Brazil, Russia, India and China: the most promising emerging
markets. The global investors at the time of making investments and building portfolios across
different countries should consider the interlinkages that exists between the countries or the
assets concerned. The interlinkages make the stock markets in the different countries to comove
in the short as well as long run, thereby leading to the spillover of the returns and volatility. The
present study attempts to model the dynamic volatility spillover from the US market to the BRIC
(Brazil, Russia, India and China) countries' stock markets during the subprime crisis by
employing ARMA E-GARCH (1,1) model. The results from the E-GARCH (1,1) model support
spillover of the US volatility in stock markets to the Brazilian market only. The volatility in the
US market did not have a direct impact on the Russian, Indian and Chinese market.
Keywords: Asymmetric; BRIC; Contagion; EGARCH Model; Leverage
1. INTRODUCTION
The volatility in the stock market and even in the other markets like commodity market,
debt market and currency market, cannot be defined in one single phase. It's a different thing for
the different investors. But in a layman term, volatility can be defined as the fluctuations in an
asset price arising due to the indecisive nature of the investors. The term 'indecisive' has been
used as volatility causes wide swings in an asset price in a particular time frame. Actually the

3
investors, who are willing to gallop some heavy or even medium amount of risk surmise for
some amount of volatility because with the wide swings in an asset price, the investors can reap a
good chunk of profit. On the other hand, the investors who are very risk averse like a retired
person, keep themselves away from the ups and downs in the equity market and invest in some
debt based products, which are lesser volatile in comparison to the equity markets.
The growing globalization and the trade relations between the countries have made the
stock markets of these countries interlinked with each other thereby increasing the comovement
among the market indices. The events taking place in one market, of one country get transferred
to the other market of a different country. The WTO, IMF and the world bank are playing an
important role in the growth and the development of trade relations as well as the financial flows
from one country to another. The countries and companies in them are having an increasing
exposure to the assets as well the liabilities of other companies situated in another countries.
These linkages have made the countries more sensitive to the events taking place not only in
their own economies but also in any other country. Apart from the fundamental events, the
listing of domestic securities to the foreign bourses and the opening up of the financial markets
for the Foreign Institutional investors has made the markets more driven by the herding behavior
of the investors, as studied in Rannou (2010).
The term 'BRIC' is a collection of Brazil, Russia, India and China, the most promising
Emerging Markets. Wilson and Purushothaman (2003) in their study titled "Dreaming with
BRICs: The path to 2050" examined and forecasted that by 2025 BRIC countries could account
for over half the size of the G6 countries. The contribution of the BRIC countries to the GDP
would increase over a period of time and the growing middle class population would act as a

4
hedge to the demanding requirements. A large number of authors have emphasised on the
increasing trade relations between the BRIC countries and the rest of the world.
The review of literature supports the evidence of the contagion impact on the Emerging
market economies and raise doubts over the theory of decoupling. A large number of studies
have tried to capture the returns and the volatility spillovers from one market to the other. But the
present study attempts to estimate the dynamic volatility spillover from the US to the BRIC
(Brazil, Russia, India and China) countries during the subprime crisis. The study has not been
restricted only to the volatility spillover impacts from the US to other BRIC countries' stock
markets yet an asymmetric response of the volatility to the falling market returns have also been
captured in the BRIC countries' markets. The subprime crisis or in a broader sense global
financial crisis, triggered in the US due to the subprime lending policies of the banks. The
mortgaged backed securities created as a result of the subprime loans added fuel to the fire when
the housing prices started decreasing and the crisis started threrof. The period which has been
considered for the purpose of study comprises the time period from the year 2007 to 2009,
during which the recovery in the markets started taking place, making the study first of its kind.
The global investors and especially the portfolio managers at the time of making
investments in foreign markets should consider the interlinkages that exists between the
countries or the assets concerned. Solnik et al. (1996) studied the correlation between the
international stock and bond markets. The authors came out with the findings that the correlation
between the markets fluctuate over a period of time and moreover the correlation increases in the
event of increased volatility in the markets and thus making the case of contagion impact on the
other economy.

5
The whole of the paper has been divided into five sections. Section II and III relates to
the Literature review and Research Methodology respectively. Section IV highlight the results
and discussions and Section V conclude the study.
2. MODELLING VOLATILITY SPILLOVER - A REVIEW
Different approaches have been used by the researchers over a period of time to model spillover
effects. Most of the studies which have been conducted in the past, used correlation among the
market volatilities and the returns to account for the linkages and the contagion impact.
Bollerslev (1986) introduced the GARCH (Generalised Autoregressive Conditional
Hetroskedastic) type models to account for the time varying volatility. A GARCH model is more
robust compared to the correlation coefficients. The univariate GARCH models have further
been extended to multivariate GARCH model to capture the volatility spillovers. The present
study has used Univariate Exponential GARCH (E-GARCH) model where the US stock market
volatility has been taken as an exogenous variable. King and Wadhwani (1990) used cross-
market correlations between the U.S., U.K. and Japan and found out that correlation increased
significantly after the U.S. crash. The ARCH or GARCH framework has also been employed to
estimate the variance-covariance transmission mechanism across countries.
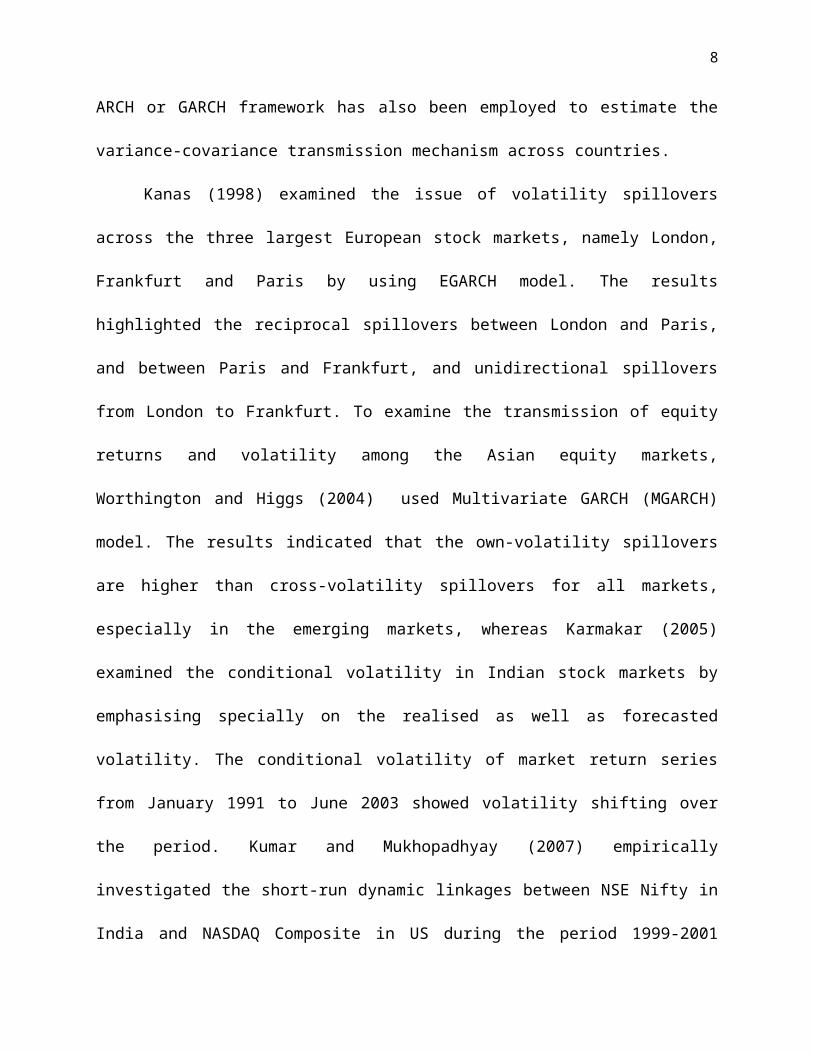
Kanas (1998) examined the issue of volatility spillovers across the three largest European
stock markets, namely London, Frankfurt and Paris by using EGARCH model. The results
highlighted the reciprocal spillovers between London and Paris, and between Paris and
Frankfurt, and unidirectional spillovers from London to Frankfurt. To examine the transmission
of equity returns and volatility among the Asian equity markets, Worthington and Higgs (2004)
used Multivariate GARCH (MGARCH) model. The results indicated that the own-volatility
spillovers are higher than cross-volatility spillovers for all markets, especially in the emerging

6
markets, whereas Karmakar (2005) examined the conditional volatility in Indian stock markets
by emphasising specially on the realised as well as forecasted volatility. The conditional
volatility of market return series from January 1991 to June 2003 showed volatility shifting over
the period. Kumar and Mukhopadhyay (2007) empirically investigated the short-run dynamic
linkages between NSE Nifty in India and NASDAQ Composite in US during the period 1999-
2001 using intra-daily data focusing on the daytime returns and the overnight returns. The
volatility of the nifty overnight returns was caused by the US daytime returns.
Kenourgios et al. (2007) used multivariate copula regime-switching model to capture
non-linear relationships in four emerging stock markets, namely Brazil, Russia, India, China
(BRIC) and two developed markets (U.S. and U.K.) during five recent financial crises (the Asian
crisis, the Russian crisis, the tech bust and the two episodes in Brazil). The results provided an
evidence of an increase in dependence among the markets during the crisis period. Mukherjee
and Mishra (2008) spotlighted that the contemporaneous Intraday return spillover among India
and almost all the sample countries was found to be positively significant and bi-directional.
Beirne et al. (2009) explained the volatility spillovers from the mature to the emerging stock
markets and tested for the transmission mechanism during turbulences in mature markets. The
Tri-variate GARCH-BEKK model was used to track the returns in mature, regional emerging,
and local emerging markets. The conditional volatilities between local and mature markets
increased during these episodes.
Mulyadi (2009) explored the volatility spillover in Indonesia, USA, and Japan capital
market by employing econometric model GARCH (1,1). The result exhibited that there is one
way volatility spillover between Indonesia and USA (USA effecting Indonesia). Meanwhile,
there is bidirectional volatility spillover between Indonesia and Japan, whereas Dufrenot et al.

7
(2010) provided an evidence of spillover effects from the Indian to the US financial markets by
using VAR and Kalman filter analysis. The results pointed to a significant contagion effect after
the period following the Lehman Brothers collapse. Yonis (2011) examined the co-movement of
the US and South African stock markets and volatility spillover between them by means of
unrestricted bivariate GARCH-BEKK. The study revealed return spillover from NYSE to JSE by
analyzing VAR. The results of Garch Model depicted that the volatility between the US and SA
is persistence and the direction is from USA to SA. Kharchenko and Tzvetkov (2013) captured
the volatility spillover effects between the developed and emerging markets (USA, France,
Germany, Russia, India and China) by employing a CGARCH (1,1) model using the data
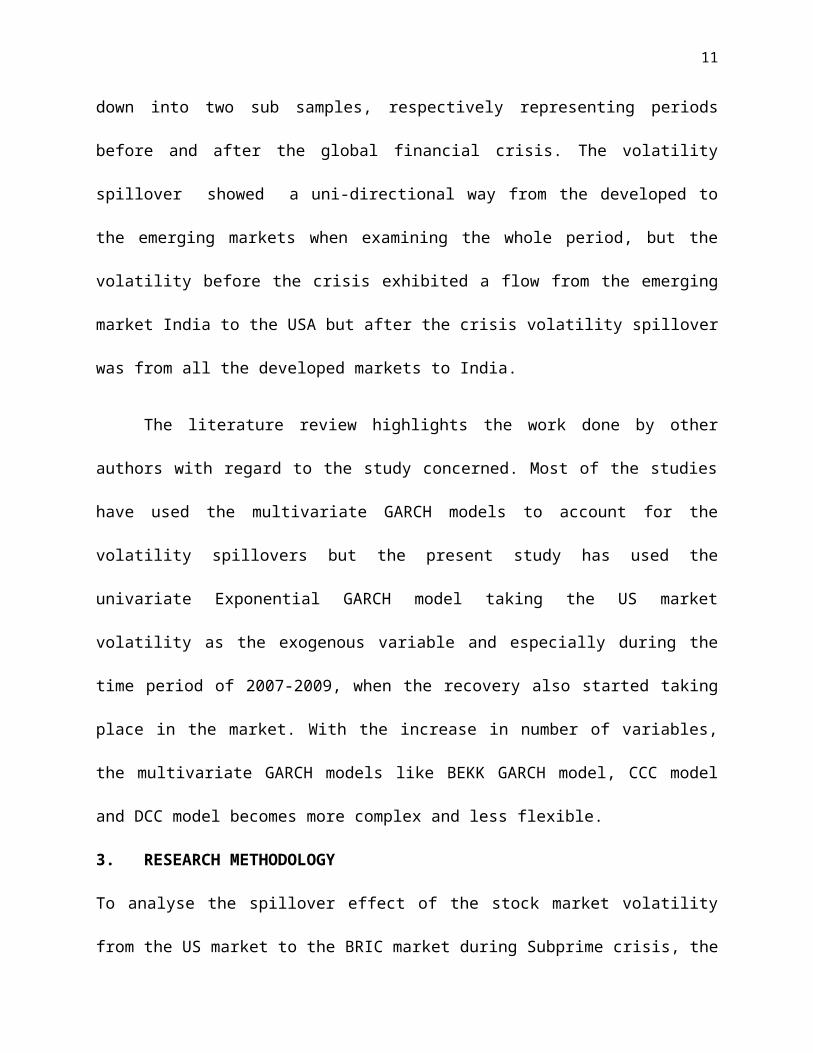
ranging from January 1995 to April 2013, which further broken down into two sub samples,
respectively representing periods before and after the global financial crisis. The volatility
spillover showed a uni-directional way from the developed to the emerging markets when
examining the whole period, but the volatility before the crisis exhibited a flow from the
emerging market India to the USA but after the crisis volatility spillover was from all the
developed markets to India.
The literature review highlights the work done by other authors with regard to the study
concerned. Most of the studies have used the multivariate GARCH models to account for the
volatility spillovers but the present study has used the univariate Exponential GARCH model
taking the US market volatility as the exogenous variable and especially during the time period
of 2007-2009, when the recovery also started taking place in the market. With the increase in
number of variables, the multivariate GARCH models like BEKK GARCH model, CCC model
and DCC model becomes more complex and less flexible.
3. RESEARCH METHODOLOGY
8
To analyse the spillover effect of the stock market volatility from the US market to the BRIC
market during Subprime crisis, the major stock market indices have been taken into
consideration. The indices used in the study are IBOVESPA (Brazil), RTS (Russia), NIFTY
(INDIA), Shanghai Composite Index, SSE (CHINA) and S&P500 (US) ranging from January
2007 to December 2009. The period which has been taken into consideration include the time
period when the markets started reverting from their lows. Figure I explains the movement of the
stock indices during the period 2007-2009 per se. The recovery has been started from the year
2009, so how the spillovers from the US worked out during this period has been our motive to
find out.
Figure I Indices' values at logged price levels
6
7
8
9
10
11
12
I II III IV I II III IV I II III IV
2007 2008 2009
LOGIBOVESPA LOGNIFTY LOGRTSLOGSANDP LOGSSE
As per the Business Cycle Dating Committee of the National Bureau of Economic
Research (2010), the recovery from the US crisis started from June 2009. The daily data have
been collected from the website of respective stock exchanges, Yahoo Finance and Wall Street
Journal. The indices which have taken into view to account for the volatility contagion impact,
comprises good quality stocks from the respective nations. The stocks which are liquid and have
above par fundamentals make way for their entrance in the equity index. The missing figures
have been filled by taking mean of nearby two points.

9
The daily continuously compounding return series (ribovespa, rrts, rnifty, rsse and
rsandp) have been calculated by taking the log of the return series for Brazil, Russia, India,
China and the US respectively in local currency.
R = Log (Pt / Pt-1)*100
where R is the daily return, Pt is the current price and Pt-1 is the previous day price. An
attempt has been made to study the dynamic volatility spillovers. The dynamic spillovers take
place when there are no overlapping trading hours of the stock markets of the respective
countries and the volatility transfers on the next day. As we try to model the volatility spillover
from the US to the BRIC countries and there are timing differences that exist between the US
stock markets and BRIC stock markets, we focussed entirely on the one day lagged spillover
effect from the US to BRIC countries.
The technique of ARMA E-GARCH (1,1) has been employed so as to analyse the
impact. The data collected is a time series data which requires a specific attention to be given to
stationary of the series as well. The analysis has been done with the help of MS EXCEL and
EVIEWS.
3.1 ARMA E-GARCH (1,1)
The financial time series data generally contain a unit root or in other words, we can say
that the financial time series data is non-stationary in nature, as in Gujarati et al. (2013). The
data should be made stationary before factoring into any model as the non-stationary data would
entail to spurious results. The Augmented Dickey Fuller test has been used to check the
stationarity of the return series. The Augmented Dickey Fuller test augments the lagged values of
the dependent variable in the series:

10
∆ Yt=β 1+ β 2 t+δYt−1+∑i=1
m
αi ∆ Yt−i+εt ………eq (1)
Where εt is a pure white noise error term. The null hypothesis is δ=0 and the alternate
hypothesis isδ <0. The null hypothesis states the presence of a unit root in the series thus stating
the series non-stationary in nature, whereas the alternate hypothesis supports the non-existence
of a unit root in the series thereby stating the series as stationary in nature. After checking the
stationary of the series, ARMA E-GARCH (1,1) model has been used to account for the spillover
of the volatility and the leverage effects. Under ARMA, a dependent variable is a function of its
own lagged values (p) as well as its error terms (q). The (p) and (q) lagged values have been
decided on the basis of correlograms.
Y t=a0+α1 Y t−i+β εt−i+ε t ........... eq(2)
Wheret Y t is stock market return, Y t−i is lagged value of Y t , ε t−i is the lagged value of the
error term and εt is the error term or residual from the equation. In order to employ the GARCH
type models, the ARCH effects or the heteroskedasticity in the residuals (variances), extracted
from the equation 2, should be there. The heteroskedastic variances mean that the variances are
not homoskedastic, rather they are varying with the passage of time.
Under E-GARCH, the logged conditional variance is a function of its own lagged values
as well as of the error terms. The EGARCH model has been developed by Nelson (1991) to
capture the leverage effects in the volatility. By leveraging effects we mean that the falling
returns adds to the volatility in the market in comparison to the positive returns. The decreasing
11
returns reduces the equity value which further increases the volatility in the equity markets, as
studied by Black (1976).
log ht=α 0+α 1(|εt−1|h t−1
−√ 2π )+δ
εt−1
ht−1+β1 ht−1+λ ε t−1
2 …………eq(3)
Where δ is an asymmetry coefficient and the presence of leverage effect will be there
when δ <0 and found to be significant. The α 1∧β1are the ARCH terms and the GARCH terms
respectively, where the ARCH term exhibits the impact of the news or information on the
conditional volatility and the GARCH term exhibits the persistency level in the volatility. To
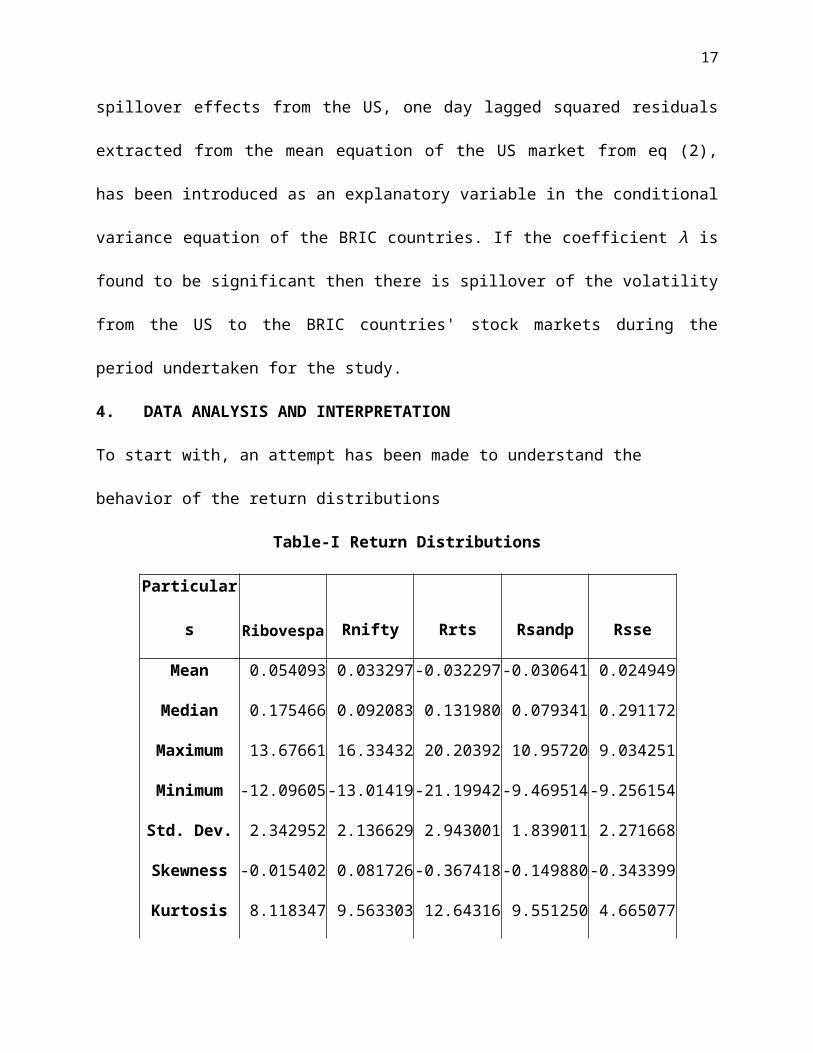
study the spillover effects from the US, one day lagged squared residuals extracted from the
mean equation of the US market from eq (2), has been introduced as an explanatory variable in
the conditional variance equation of the BRIC countries. If the coefficient λ is found to be
significant then there is spillover of the volatility from the US to the BRIC countries' stock
markets during the period undertaken for the study.
4. DATA ANALYSIS AND INTERPRETATION
To start with, an attempt has been made to understand the behavior of the return distributions
Table-I Return Distributions
Particulars Ribovespa Rnifty Rrts Rsandp Rsse
Mean 0.054093 0.033297 -0.032297 -0.030641 0.024949
Median 0.175466 0.092083 0.131980 0.079341 0.291172
Maximum 13.67661 16.33432 20.20392 10.95720 9.034251
Minimum -12.09605 -13.01419 -21.19942 -9.469514 -9.256154
Std. Dev. 2.342952 2.136629 2.943001 1.839011 2.271668
Skewness -0.015402 0.081726 -0.367418 -0.149880 -0.343399
Kurtosis 8.118347 9.563303 12.64316 9.551250 4.665077

12
Jarque-Bera 854.7235 1406.257 3051.436 1403.160 105.8411
Probability 0.000000 0.000000 0.000000 0.000000 0.000000
Source: Computed by the Authors
On an average, returns have been higher of the Brazilian market, followed by Indian market
during the crisis period, whereas the returns have been negative for the Russian and the US
markets (table-I). The Russian economy witnessed higher standard deviation in the stock market
returns as compared to the other countries. The Kurtosis values have been reasonably high in all
the countries, thereby highlighting the presence of clustering in the financial data. Jarque-Bera
test exhibits that the series are not normally distributed. Barring India, the skewness values are
negative for other countries, which shows that the probability of negative returns is higher as
compared to positive returns.
It has been observed that the financial time series data suffers from the clustering
phenomenon as well as from the leptokurtic distributions. This has also been observed in our
return series during the crisis period. The p-values extracted from the Augmented Dickey Fuller
test support the acceptance of the alternate hypotheses of stationary time series, thereby stating
that the return series are stationary in nature.
Figure-II exhibits the thirty days rolling correlation of the BRIC countries' market returns
with the US one day lagged return. A rolling correlation is a better way to comprehend the
behavior and the comovement among the markets during the period which has been taken into
consideration for the purpose of study. The fluctuations in the correlation coefficients during the
period highlight the existence of a crisis during that period. The correlation coefficients are
positive and comparatively very high in the context of the Russian, Indian and Chinese stock

13
markets during the third quarter of the year 2008, because of the Lehman Brothers crisis that
took place.
Figure-II shows thirty days rolling correlation of BRIC countries' returns
with the US one day lagged return.
-0.6
-0.4
-0.2
00.2
0.4
0.6
0.8
corrniftycorrrtscorrssecorribovespa
The correlation coefficient between the stock market returns of the US and the Brazilian
market remains more or less negative throughout the period concerned. During the third quarter
of the year 2008, the coefficient fell drastically becoming negative in nature, stating that the
return spillovers that took place between the Brazilian and the US markets had a negative
relation and correlation with each other, whereby the increased returns in one market led to the
decreased returns in the other market.
4.1 VOLATILITY SPILLOVER FROM THE US TO THE BRIC COUNTRIES
There are timing differences in the trading hours between the countries concerned. The time
difference between the US (New York) and Brazil is one hour only, as in Bhar and Nikolova
(2007), in comparison to the other countries in the BRIC block, so contemporaneous volatility
spillover impacts do exists. But in the present study we are focusing only on the dynamic impact
of the US market on the BRIC countries and thus relying only on the one day lagged US market

14
effect. Due to the increased level of integration among the markets all over the world, the crisis
which started in the US gets spillovered from the domestic market to the other foreign markets
directly as well as indirectly. The indirect spillovers took place in the sense that even though a

15
Table-II E-GARCH (1,1) Results
Brazil Russia India China
Coeff z-stat. p-value Coeff z-stat. p-value Coeff z-stat. p-value Coeff z-stat. p-value
α 1 0.121 3.599 0.000* 0.157 7.350 0.000* 0.234 7.944 0.000* 0.101 3.904 0.000*
β1 0.937 59.555 0.000* 0.968 131.614 0.000* 0.938 80.575 0.000* 0.886 36.833 0.000*
δ -0.141 -5.729 0.000* -0.097 -6.279 0.000* -0.104 -4.628 0.000* -0.133 -5.228 0.000*
λ 0.004 2.172 0.029* 0.003 1.683 0.0924 0.003 1.634 0.102 0.002 1.283 0.199
α 1+ β1 1.059 1.125 1.172 0.987
AIC 4.16 4.40 4.12 4.41
Arch test (1) 0.1397** 0.226** 0.548** 0.590**
Source: Computed by the Authors
* Reject Null Hypothesis of no relation at 5% significance level
** Accept Null Hypothesis of homoskedasticity at 5% significance level

16
country does not have a direct exposure to the US market, but having linkages with the countries
who further have an exposure to the US market spillovered the crisis to that country as well.
The ARCH effects have been found in the return series of the BRIC countries. The
presence of the ARCH effects further exhorts the use of E-GARCH model to capture the
spillover impact as well as the leverage impact of the negative returns. The E-GARCH results
(table-II) of the Brazilian, Russian, Indian and Chinese markets are being reported as under. In
case of the Brazilian stock markets, both the ARCH and the GARCH terms are found to be
significant. The z-statistic is higher in case of the GARCH effect stating that the past volatility
had a larger impact on the current conditional volatility. There is persistency in the conditional
volatility. The asymmetric coefficient is also found to be significant exhibiting that the falling
returns had an increased impact on the conditional volatility. The one day lagged volatility in the
US stock market also had a statistically significant impact on the current conditional variance of
the Brazilian market, thereby reporting the spillover of the US stock market volatility to the
Brazilian market volatility. The total of the ARCH and the GARCH terms needs to be less than
one so that the volatility gets reduced and revert back to the unconditional level over a period of
time. But in case of the Brazilian market, the total is greater than one making the case of an
explosive and infinite volatility in the Brazilian market. The results are compatible with the other
researchers. After applying the GARCH model, there are no ARCH effects left in the residuals
and the residuals derived from the conditional variance equation are idiosyncratic errors.
The one day lagged volatility in the US stock market does not have a statistically
significant impact on the Russian stock market during the period undertaken for the study. The
ARCH and the GARCH terms are found to be significant. The impact of a news or any
information is lesser in comparison to the past volatility. The asymmetric coefficient is found to
17
be statistically significant showing the leverage effects. The crisis started in the US does not have
an impact on the conditional variance of the Russian market directly yet the falling returns
increased the volatility and had an impact on the Russian market indirectly. The total of the
ARCH and the GARCH terms is more than one highlighting explosiveness in the conditional
variance. The ARCH effects are not in existence after employing the GARCH model.
In case of the Indian stock markets, the results are similar to the Russian stock market
where the impact of the past volatility is greater in comparison to the news impact on the
conditional volatility. The coefficient of the one day lagged US stock market volatility to account
for the impact on the Indian stock market volatility is not found to be statistically significant, but
the asymmetric coefficient is found to be significant showing that the leverage effects are present
in the Indian stock markets. During a crisis period, the behavior of the investors does get
changed due to the riskiness present in the Emerging markets compared to the Advanced
economies. This leads to the flow back of funds to the Advanced economies in the event of any
crisis, as studied by Frank and Hesse (2009). The flow back of the funds entail to the negative
returns in the Emerging markets. Again the total of the ARCH and GARCH term is greater than
one highlighting the explosive volatility during this period. The residuals are homogenous after
applying the GARCH model. The results of the Chinese market are similar to the Indian and the
Russian market. The asymmetric coefficient and the ARCH and GARCH terms are found to be
statistically significant at the 5 % level. But the coefficient of the one day lagged US volatility is
not statistically significant. The residuals are found to be homogenous after applying the
GARCH model. In case of the Chinese market, the total of the ARCH and GARCH term is less
than one, stating that the volatility dies out over a period of time.

18
In case of the Brazilian, Russian and Indian markets, the volatility is very explosive as
depicted by the total of ARCH and GARCH terms making the conditional volatility in the
markets non-stationary. The non-stationarity of the conditional variance makes the model unfit
for forecasting, but as the study covers the period during the subprime crisis, an explosive
volatility is evident. The main motive of the study is to model the volatility during the crisis
period and not to forecast the conditional volatility.
5. CONCLUSION
To model the dynamic spillover of the volatility of the US market to the BRIC countries' market,
during Subprime crisis, the major stock market indices have been taken into consideration. The
stock market indices discounts the future information well in advance. So to analyse the impact
of one economy on the other during the crisis period, stock indices acts as a robust instrument.
The technique of ARMA E-GARCH (1,1) has been employed to capture the spillover effects.
The trade relations among the countries comes to a standstill in the event of a crisis. All this has
an impact on the stock markets as well. The volatility of one market spillover to the other market
directly as well as indirectly during a crisis period.
The results from the E-GARCH (1,1) model supports spillover of the US stock market
volatility to the Brazilian stock market only. The coefficient of the one day lagged US market
volatility is not found to be significant at the 5 % level in the context of the Russian, Indian and
Chinese markets. The results derived from the E-GARCH model are different considering the
findings of the other researchers. But the period, which we have taken, is full of the adverse
events that took place in the US markets due to the subprime crisis. The results reported by the
model bring into being a new fact that the volatility in the Russian, Indian and the Chinese
markets did not get affected by the volatility in the US market directly during this period, yet the

19
indirect impact has been observed in the sense that the falling returns in these markets further
increased the conditional variance. The falling returns make the investors to expect a risk
premium, which further discounts the stock prices and increase the volatility.
With the information and communication technology, markets all over the world are
integrated with each other. The increasing cross country transaction of securities has made the
stock markets vulnerable to a crisis. The global investors should understand the linkages that
exist between the countries concerned. If a crisis and the volatility of one market have an impact
on the volatility of another country's market, then the diversification benefits will be reduced for
an investor. A high standard deviation or a highly volatile market incorporates various risks in
the portfolio of an asset class and the problem increases further when the volatility of one market
transferred to the other market having an impact on the portfolio returns.
REFERENCES
Beirne, J., Caporale, G. M., Schulze-Ghattas, M. & Spagnolo, N. (2009) 'Volatility spillovers
and contagion from mature to emerging stock markets', European Central Bank, Working Paper
Series No 1113.
Bhar, R. & Nikolova, B. (2007) 'Analysis of Mean and Volatility Spillovers Using BRIC
Countries, Regional and World Equity Index Returns', Journal of Economic Integration, Vol. 22,
No. 2, pp. 369-381.
Black, F. (1976) 'Studies in stock price volatility changes', In: Proceedings of the 1976 Meetings
of the American Statistical Association, pp. 171–181.
Bollerslev, T. (1986) 'Generalized Autoregressive Conditional Heteroskedasticity', Journal of
Econometrics, pp. 307-327.

20
Business Cycle Dating Committee, N. B. o. E. R., 2010. [Online]
Available at :http://www.nber.org/cycles/sept2010.html
[Accessed 15 April 2013].
Dufrénot, G., Keddad, B. & Sand-Zantman, A. (2010) 'Financial spillovers from the US financial
markets to the emerging markets during the subprime crisis: The example of Indian equity
markets', OFCE - Centre de recherche en économie de Sciences Po.
Frank, N. & Hesse, H. (2009) 'Financial Spillovers to Emerging Markets During the Global
Financial Crisis', IMF Working Paper, May, pp. 3-17.
Gujarati, D., Porter, D. & Gunasekar, S. (2013) 'Basic Econometrics', New Delhi: McGraw Hill
Education (India) Private Limited.
Kanas, A. (1998) 'Volatility spillovers across equity markets: European evidence', Applied
Financial Economics, Vol. 8, No. 3, pp. 245-256.
Karmakar, M. (2005) 'Modeling Conditional Volatility of the Indian Stock Markets' Vikalpa,
Vol. 30, pp. 21-37.
Kenourgios, D., Samitas, A. & Paltalidis, N. (2007) 'Financial Crises and Contagion: Evidence
for BRIC Stock Markets', EFMA Vienna Meetings.
Kharchenko, I. & Tzvetkov, P. (2013) 'Estimation of Volatilities and Spillover Effects Between
Developed and Emerging Market Economies', Lunds University, Department of Economics.
King, M. & Wadhwani, S. (1990) 'Transmission of Volatiltiy between Stock Markets', The
Review of Financial Studies, Vol. 3, pp. 5-33.

21
Kumar, K. K. & Mukhopadhyay, C. (2007) 'Volatility Spillovers from the US to Indian Stock
Market: A Comparison of GARCH Models', The IUP Journal of Financial Economics, Vol. 30,
No. 4, pp. 1-27.
Mukherjee, K. N. & Mishra, R. (2008) 'Stock Market Integration and Volatility Spillover:India
and its Major Asian Counterparts', Munich Personal RePEc Archive.
Mulyadi, M. S. (2009) 'Volatility spillover in Indonesia, USA and Japan capital market', Munich
Personal RePEc Archive.
Nelson, D. B. (1991) 'Conditional Heteroskedasticity in asset returns: A new approach',
Econometrica, Vol. 59, No. 2, pp. 347-370.
Rannou, Y. (2010) 'Banking Regulation, Behavioral Finance, and the Financial Crisis in Europe:
Looking to the Kindleberger-Minsky Paradigm', Journal Of Risk Management in Financial
Institutions, Vol. 3, pp. 278-295.
Solnik, B., Boucrelle, C. & Le Fur, Y. (1996) 'International Market Correlation and Volatility',
Financial Analysts Journal, pp. 17-34.
Wilson, D. & Purushothaman, R. (2003) 'Dreaming With BRICs: The Path to 2050', Economic
Research from the GS Financial Workbench: Goldman Sachs, pp. 1-24.
Worthington, A. & Higgs, H. (2004) 'Transmission of equity returns and volatility in Asian
Developed and Emerging markets: A Multivariate GARCH analysis', International journal of
finance and economics, pp.71-80.
Yonis, M. (2011) 'Stock Market Co-Movement and Volatility Spillover between USA and South
Africa', UMEA Universitet.