apexph summary assessment protocol for excellence in public health community health planner...
TRANSCRIPT

APEXPH SummaryAssessment Protocol for Excellence
inPublic Health
Community Health PlannerPanayiota Agamemnonos
Pendleton County Health Department
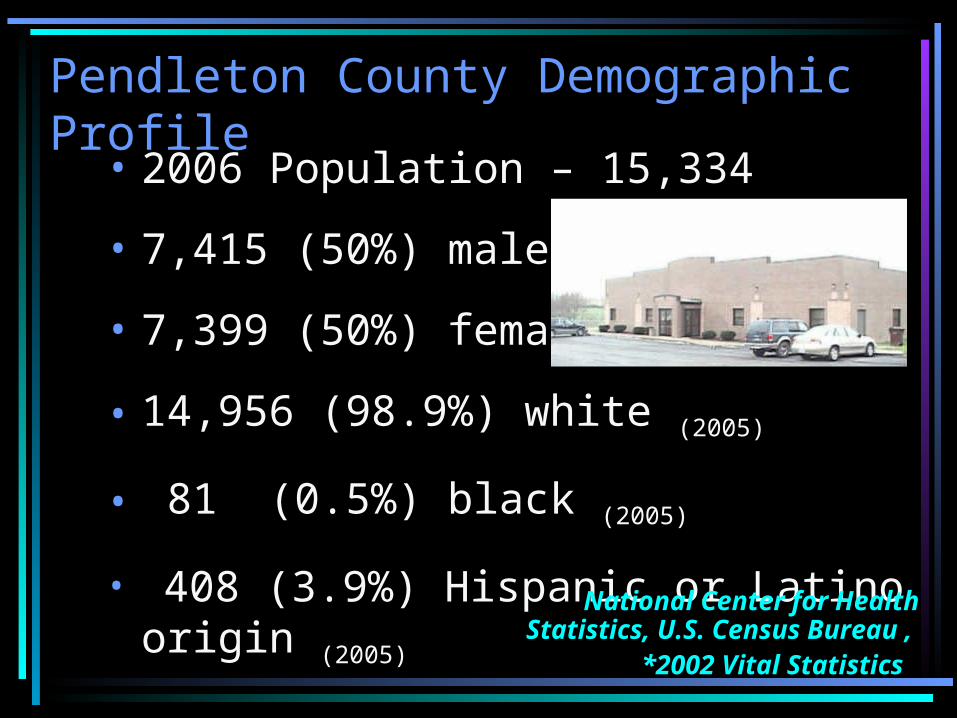
Pendleton County Demographic Profile
• 2006 Population – 15,334
• 7,415 (50%) males*
• 7,399 (50%) female*
• 14,956 (98.9%) white (2005)
• 81 (0.5%) black (2005)
• 408 (3.9%) Hispanic or Latino origin (2005)
National Center for Health Statistics, U.S. Census Bureau , *2002 Vital Statistics
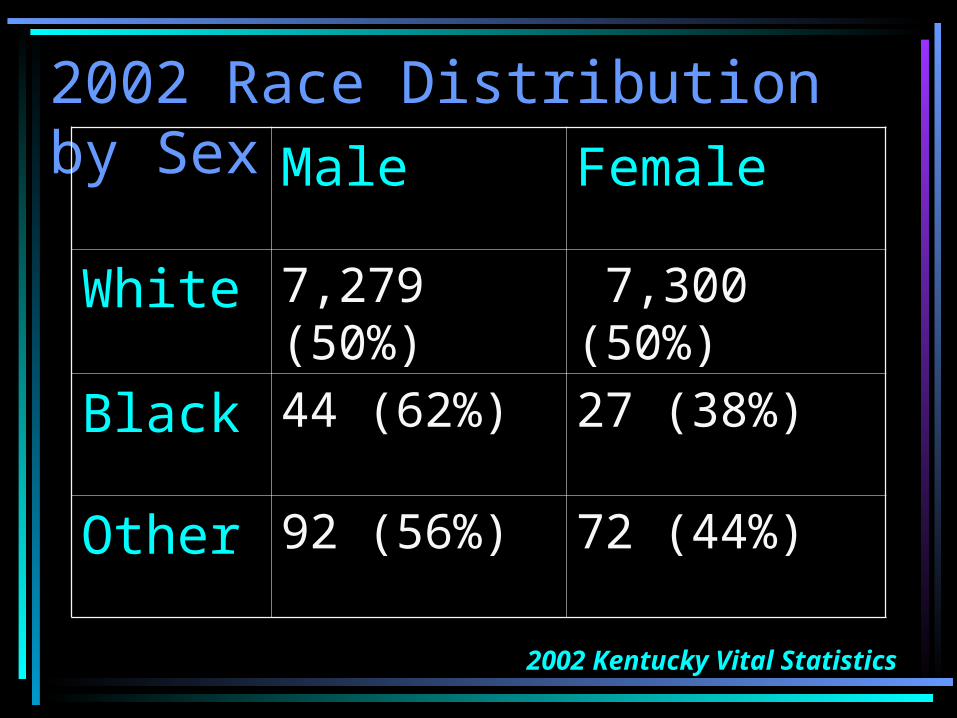
2002 Race Distribution by Sex Male Female
White 7,279 (50%)
7,300 (50%)
Black 44 (62%) 27 (38%)
Other 92 (56%) 72 (44%)
2002 Kentucky Vital Statistics

Population Distribution by Age in 2002Pendleton Kentucky
Under 1 year 226 (1.5%) 54,312 (1.3%)
1 – 4 years 841 (5.7%) 216,039 (5.3%)
5 – 14 years 2,410 (16.3%)
558,077 (13.6%)
15 – 24 years 2,015 (13.6%)
584,864 (14.3%)
25 – 34 years 1,979 (13.4%)
554,891 (13.6%)
35 – 44 years 2,470 (16.7%)
631,173 (15.4%)
45 – 54 years 1,911 (12.9%)
582,643 (14.2%)
55 – 64 years 1,423 (9.6%) 402,450 (9.8%)
65 – 74 years 852 (5.7%) 273,875 (6.7%)
75 – 84 years 510 (3.4%) 176,282 (4.3%)
85 + years 177 (1.2%) 58,402 (1.5%)
Total 14,814 4,093,008
2002 Kentucky Vital Statistics
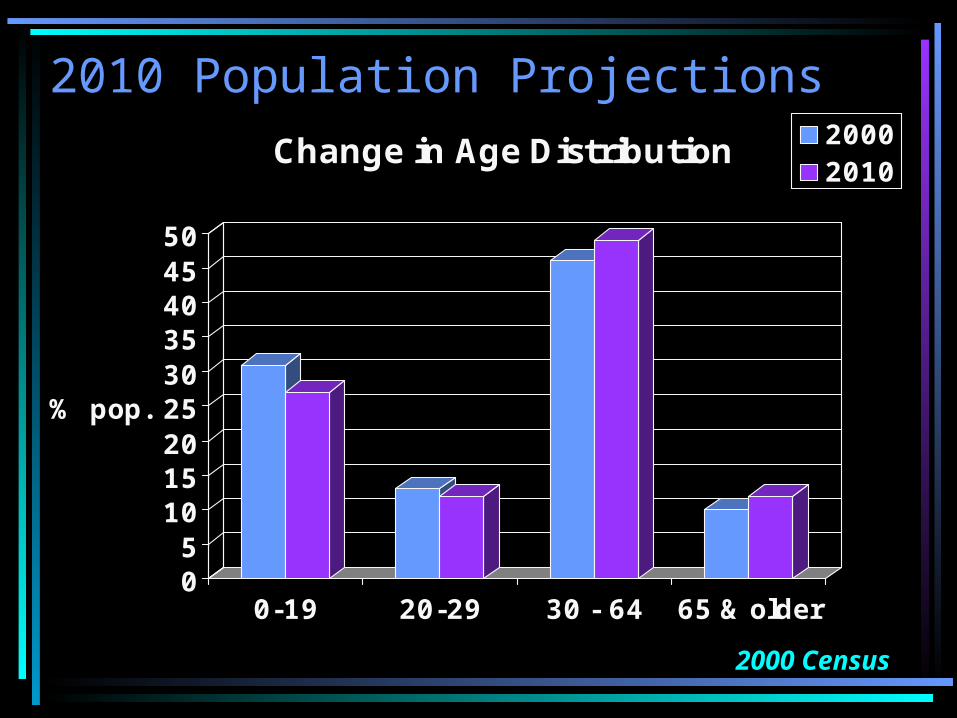
2010 Population Projections
05
101520253035404550
% pop.
0-19 20-29 30 - 64 65 & older
Change in Age Distribution 20002010
2000 Census

Socioeconomic Profile• Only 13.6% of Pendleton County’s
population is below the poverty level compared to 16.3% statewide in 2004.
• Per capita income in 2004 was $21,234 compared to the state average of $27,265.
• Median family income in 2004 was $39,295 compared to Kentucky’s $37,046.
• 5.7% unemployment rate compared to 6.1% statewide in 2005.
National Center for Health Statistics, U.S. Census Bureau
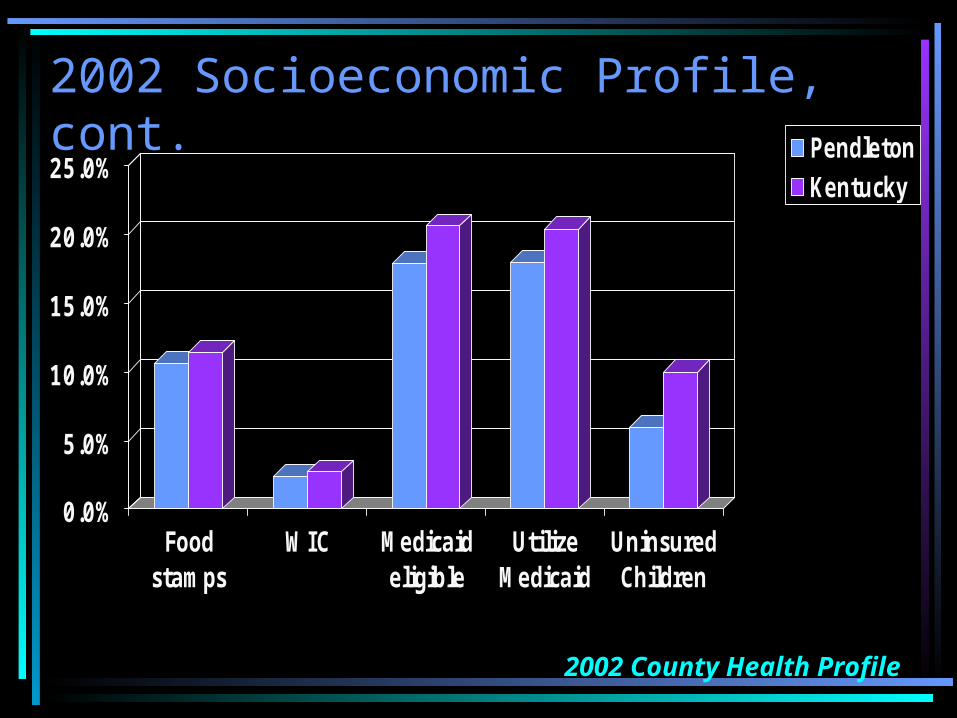
2002 Socioeconomic Profile, cont.
0.0%
5.0%
10.0%
15.0%
20.0%
25.0%
Foodstamps
WIC Medicaideligible
UtilizeMedicaid
UninsuredChildren
PendletonKentucky
2002 County Health Profile

Birth IndicatorsPendleton Kentucky
Birth rate 10.0 per 1000 pop.
13.4 per 1000 pop.
Infant death rate
13.3 per 1000 births
6.8 per 1000 births
Mothers Under 15
0.0 per 1000 births
0.8 per 1000 births
Mothers 15-17 14.4 per 1000 females
24.8 per 1000 females
Birthweights < 2500 grams
7.3 per 100 births 8.8 per 100 births
No care in first trimester
8.0% 13.0%
Maternal Smoking
45%* 26%*2003 Kentucky Vital Statistics, *2006 KIDS COUNT
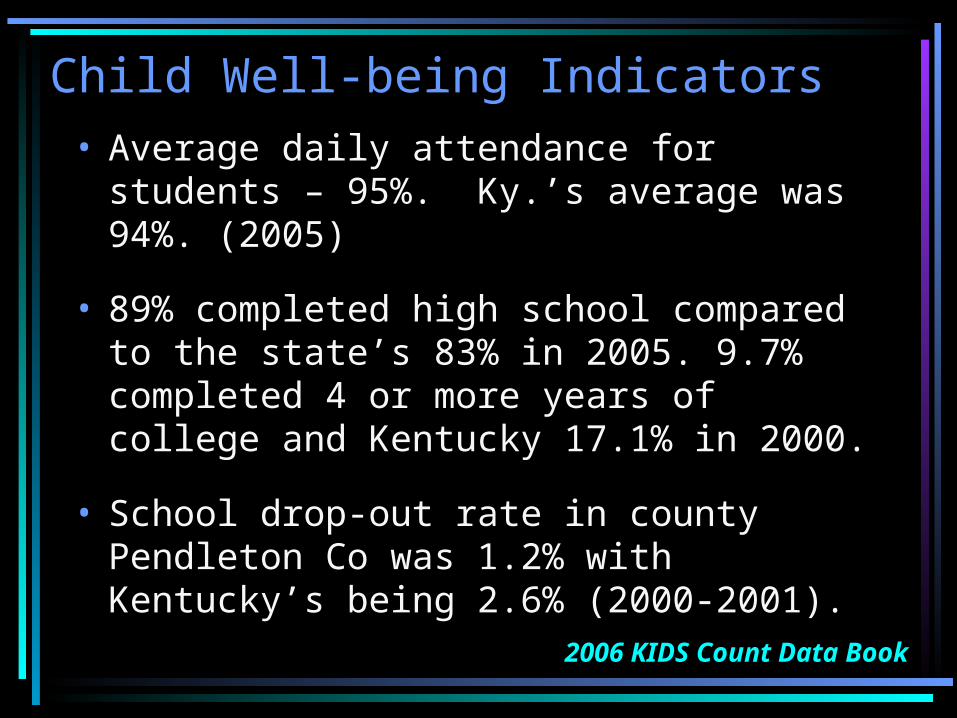
Child Well-being Indicators• Average daily attendance for students –
95%. Ky.’s average was 94%. (2005)
• 89% completed high school compared to the state’s 83% in 2005. 9.7% completed 4 or more years of college and Kentucky 17.1% in 2000.
• School drop-out rate in county Pendleton Co was 1.2% with Kentucky’s being 2.6% (2000-2001).
2006 KIDS Count Data Book

Pendleton County High School2004-2005
KCCT Test Proficient/Distinguished Academic Index
District State District StateReading 10th 27% 39% 68.5 77.5
PL/VS 10th 47% 54% 71.5 79.1
Mathematics 11th 25% 34% 59.8 66.3
Science 11th 29% 37% 65.5 69.4
Social Studies 11th 32% 41% 71.6 78.1
Arts & Humanities 11th 34% 39% 67.2 70.7
Writing 12th 30% 33% 62.1 68.4KY Department of Education

Pendleton County High School2004-2005
National Norm Referenced Test (CTBS/5) District State Nation
9th Grade Reading 54%ile 56%ile 50%ile
9th Grade Language Arts 45%ile 51%ile 50%ile
9th Grade Mathematics 48%ile 52%ile 50%ileKY Department of Education

Pendleton County Middle School2004-2005
KCCT Test Proficient/Distinguished Academic Index
District State District StateReading 7th 63% 62% 86.2 87
Science 7th 45% 41% 78.5 74
Writing 7th 19% 21% 53.5 57.3
Mathematics 8th 44% 36% 77.2 71
Social Studies 8th 46% 39% 83.6 73.5
Arts & Humanities 8th 52% 53% 78.6 76.5
PL/VS 8th 44% 43% 76.3 74.3KY Department of Education

Pendleton County Middle School2004-2005
National Norm Referenced Test (CTBS/5) District State Nation
6th Grade Reading 54%ile 58%ile 50%ile
6th Grade Language Arts 48%ile 54%ile 50%ile
6th Grade Mathematics 55%ile 57%ile 50%ileKY Department of Education

Pendleton County Primary/Elementary School
2004-2005KCCT Test Proficient/Distinguished Academic Index
District State District StateReading 4th 68% 68% 85.8 87.1
Science 4th 60% 54% 89.3 87.6
Writing 4th 35% 43% 71.1 74.9
Mathematics 5th 36% 45% 67.2 74.4
Social Studies 5th 44% 53% 72.4 79.3
Arts & Humanities 5th 35% 32% 65.2 62.8
PL/VS 5th 58% 63% 79.9 84.9KY Department of Education

Pendleton County Primary/Elementary School
2004-2005National Norm Referenced Test (CTBS/5) District State Nation
End of Primary (EOP) Reading 61%ile 65%ile 50%ile
EOP Language Arts 62%ile 62%ile 50%ile
EOP Mathematics 72%ile 67%ile 50%ile
KY Department of Education
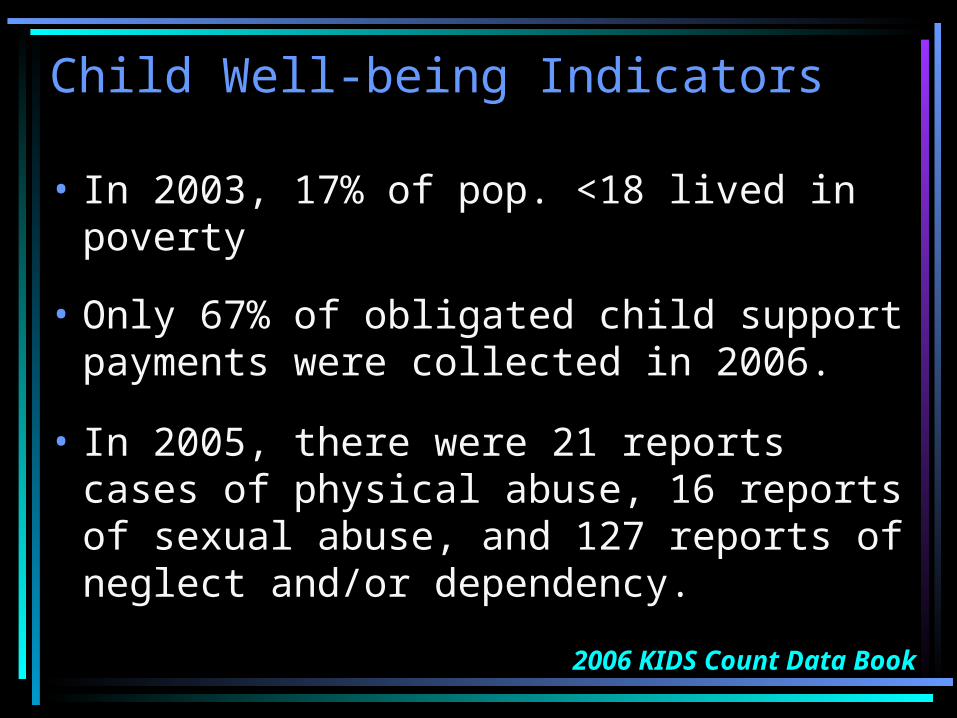
Child Well-being Indicators
• In 2003, 17% of pop. <18 lived in poverty
• Only 67% of obligated child support payments were collected in 2006.
• In 2005, there were 21 reports cases of physical abuse, 16 reports of sexual abuse, and 127 reports of neglect and/or dependency.
2006 KIDS Count Data Book

2005 Traffic Collisions
• 2005 saw a total of 354 collisions of those 7 involved fatalities, 83 non-fatal injuries, and 264 property damage.– 7 people were killed and 116 people
were injured.
• Of the 354 collisions, 22 involved drinking drivers and 1 involved drivers under influence of drugs
2005 Traffic Collision Facts

2005 Driving under the Influence
• 3 of the 22 collisions with drinking drivers involved fatal collisions, 8 non-fatal injury, and 11 property damage.– 3 people were killed and 18 people
were injured.
• 1 person was killed in the collision involving drugs
2005 Traffic Collision Facts
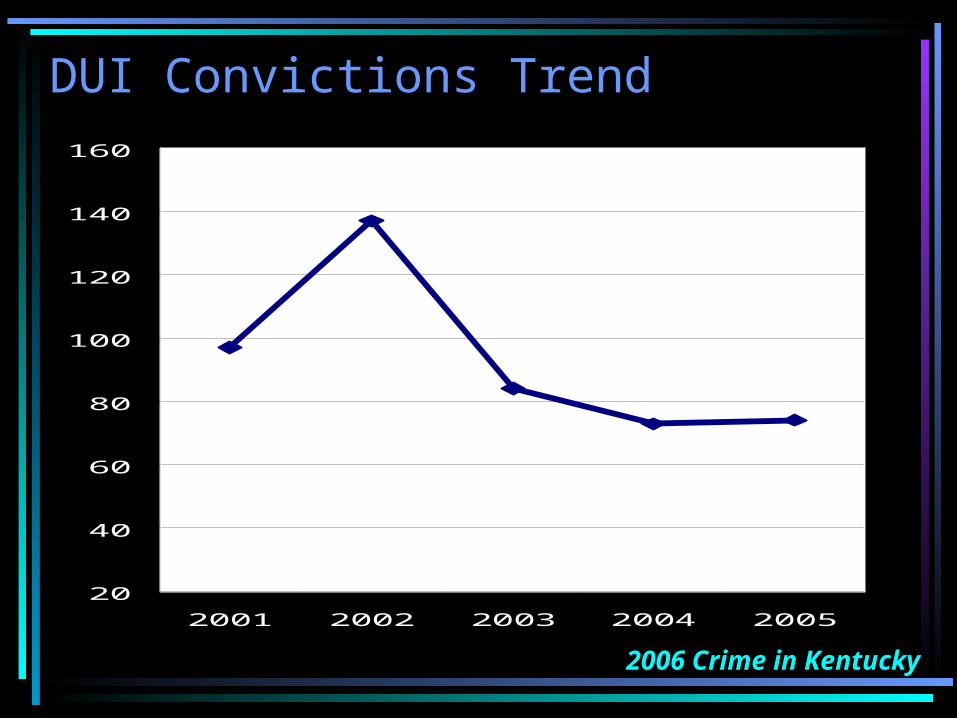
DUI Convictions Trend
20
40
60
80
100
120
140
160
2001 2002 2003 2004 2005
2006 Crime in Kentucky

2006 Crime
• In 2005, 64 DUI arrests with 63 adults and 1 juveniles.
• There was a total of 492 arrest in 2005 with 34 arrests for narcotic drug laws.
• Another 33 of the arrests were for drunkenness.
• There were 52 arrests for larceny-thefts
2006 Crime in Kentucky

Access to Primary Health Care Profile
• Primary care provider ratio is the population of a given area divided by the number of full-time primary care providers serving that area.
• The Federal Government estimates that 1 primary care provider can provide care to 1500 individuals.
• In 2005, Pendleton County’s ratio is 1 to 5936, Kentucky’s ratio is 1917.KY Department of Public Health,
Health Care Access Branch
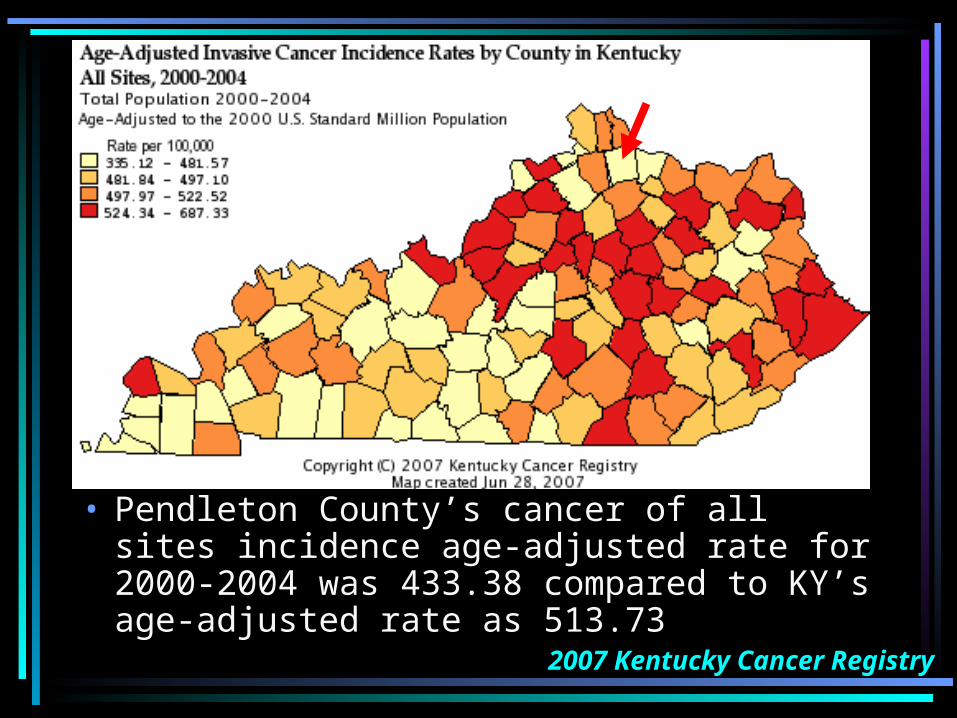
• Pendleton County’s cancer of all sites incidence age-adjusted rate for 2000-2004 was 433.38 compared to KY’s age-adjusted rate as 513.73
2007 Kentucky Cancer Registry
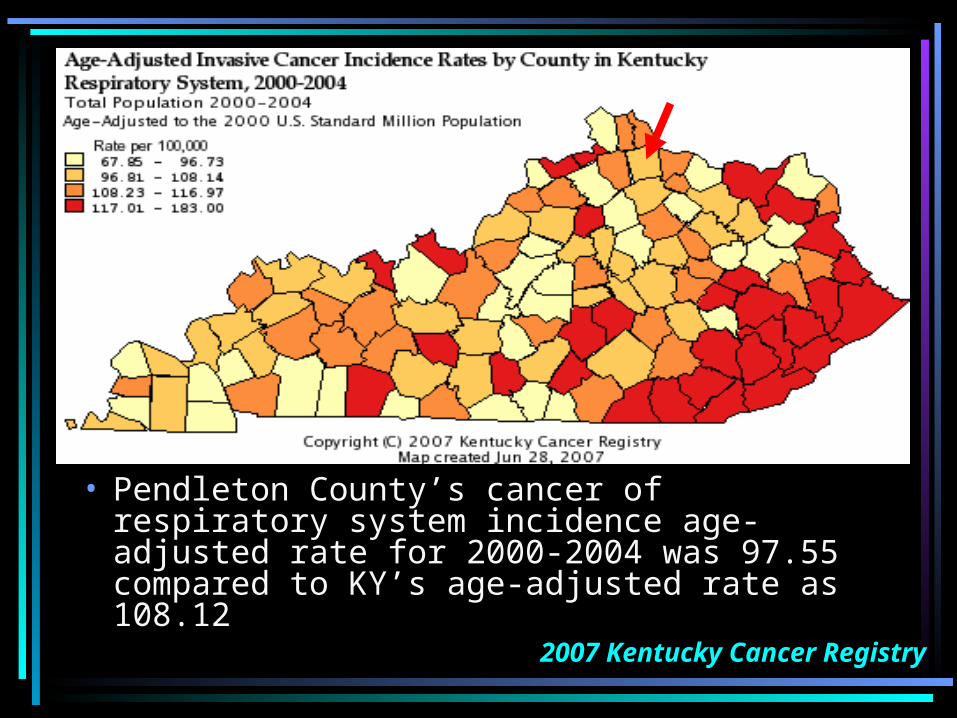
• Pendleton County’s cancer of respiratory system incidence age-adjusted rate for 2000-2004 was 97.55 compared to KY’s age-adjusted rate as 108.12
2007 Kentucky Cancer Registry

• Pendleton County’s cancer of breast incidence age-adjusted rate for 2000-2004 was 59.59 compared to KY’s age-adjusted rate as 66.90
2007 Kentucky Cancer Registry
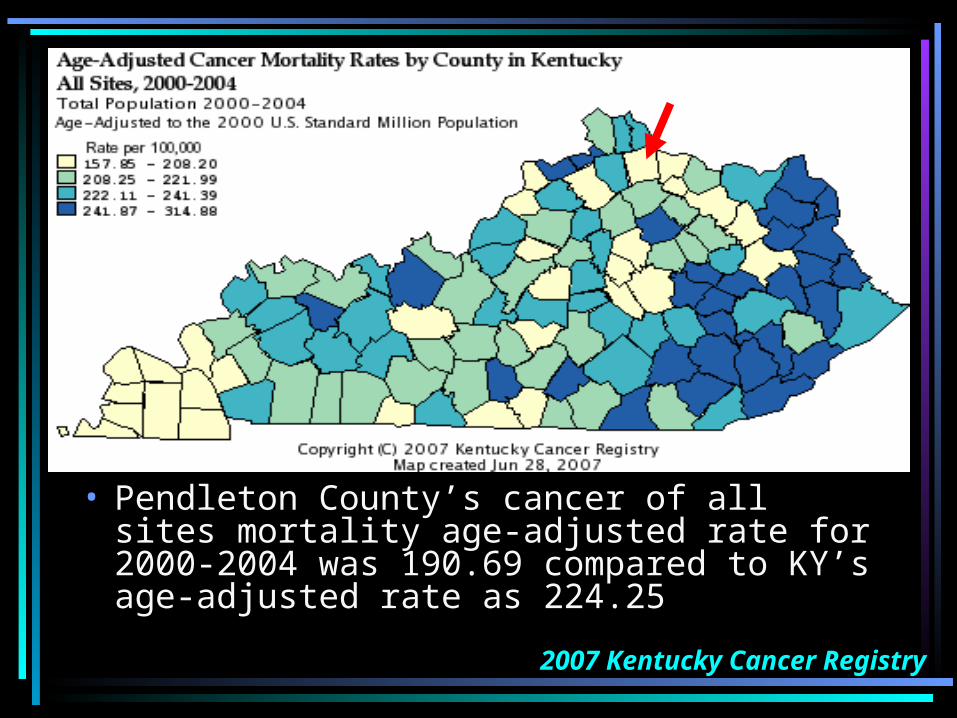
• Pendleton County’s cancer of all sites mortality age-adjusted rate for 2000-2004 was 190.69 compared to KY’s age-adjusted rate as 224.25
2007 Kentucky Cancer Registry

• Pendleton County’s cancer of respiratory system mortality age-adjusted rate for 2000-2004 was 64.55 compared to KY’s age-adjusted rate as 81.85
2007 Kentucky Cancer Registry
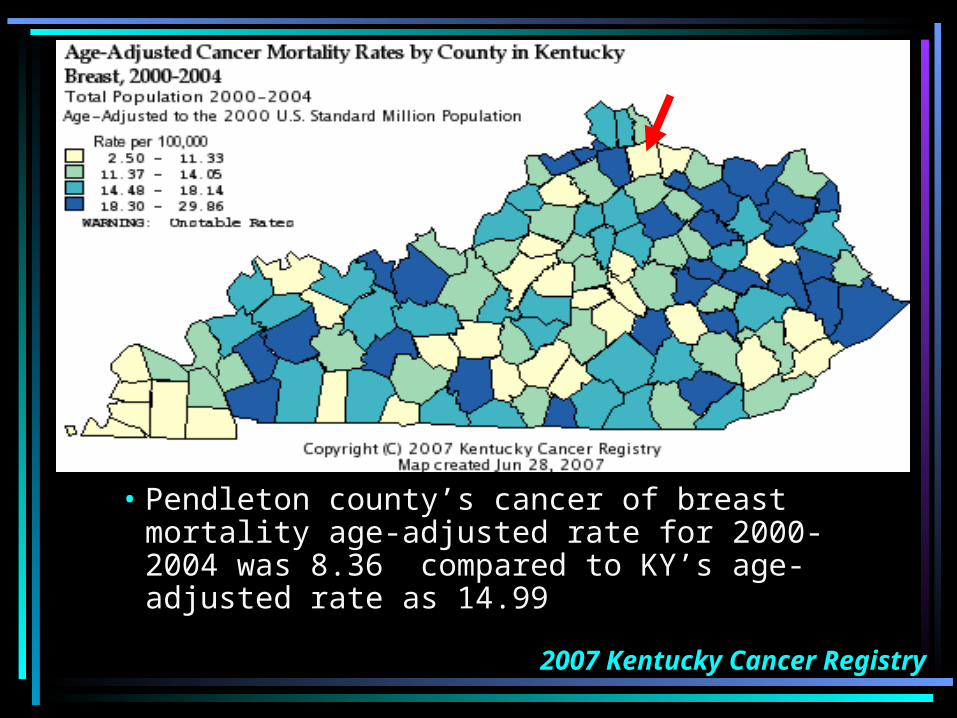
• Pendleton county’s cancer of breast mortality age-adjusted rate for 2000-2004 was 8.36 compared to KY’s age-adjusted rate as 14.99
2007 Kentucky Cancer Registry
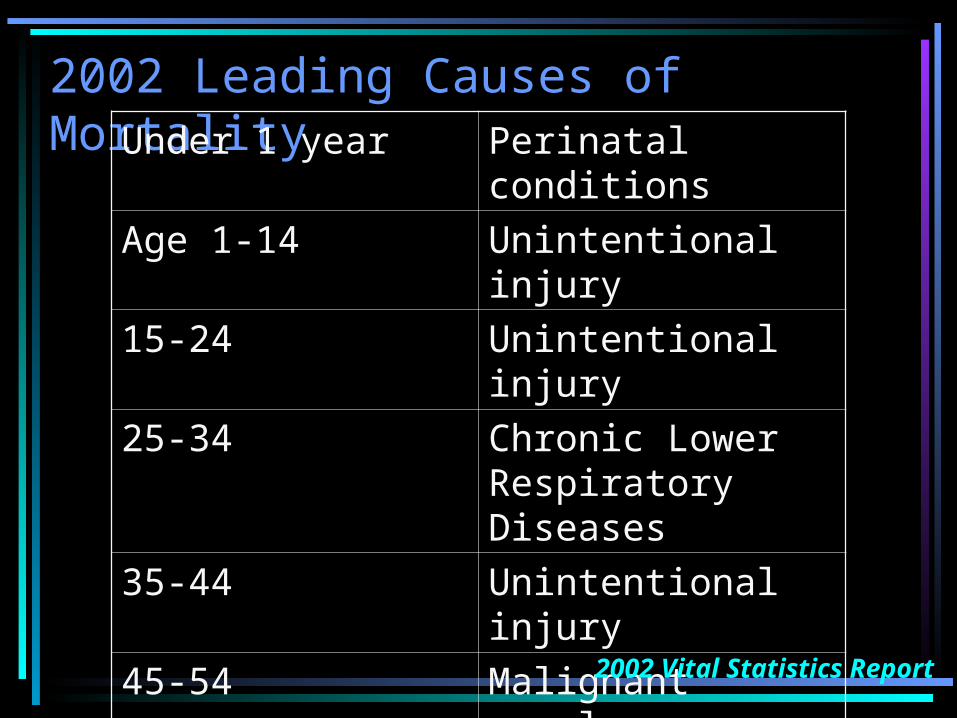
2002 Leading Causes of MortalityUnder 1 year Perinatal
conditions
Age 1-14 Unintentional injury
15-24 Unintentional injury
25-34 Chronic Lower Respiratory Diseases
35-44 Unintentional injury
45-54 Malignant neoplasm
55-64 Malignant neoplasm
65 and over Heart disease
2002 Vital Statistics Report

Years of Potential Life Lost (YPLL)
• Years of Potential Life Lost is a measure of causes of mortality that are responsible for taking the highest number of years of life based on life expectancy.
• Years of potential life lost are calculated by multiplying the number of deaths per age group by years of life lost as determined by the difference in age at the time of death and life expectancy.

Age # of Deaths
Mean Age at Death
75 – Mean Age at Death
YPLL
< 1 1 .5 74.5 74.51-14 years 1 8 67 6715-24 years
3 20 55 165
25-34 years
1 30 45 45
35-44 years
5 40 35 175
45-54 years
6 50 25 150
55-64
years 17 60 15 255
65+ years 68 70 5 340Total 102 - - 1,271.5
Deaths From All Causes /YPLL
2002 Vital Statistics Report

Age # of Deaths
Mean Age at Death
75 – Mean Age at Death
YPLL
< 1 0 0 0 01-14 years 1 8 67 6715-24 years
3 20 55 165
25-34 years
0 0 0 0
35-44 years
0 0 0 0
45-54 years
1 50 25 25
55-64
years 0 0 0 0
65+ years 0 0 0 0Total 5 - - 247
Deaths From Unintentional Injuries /YPLL
2002 Vital Statistics Report
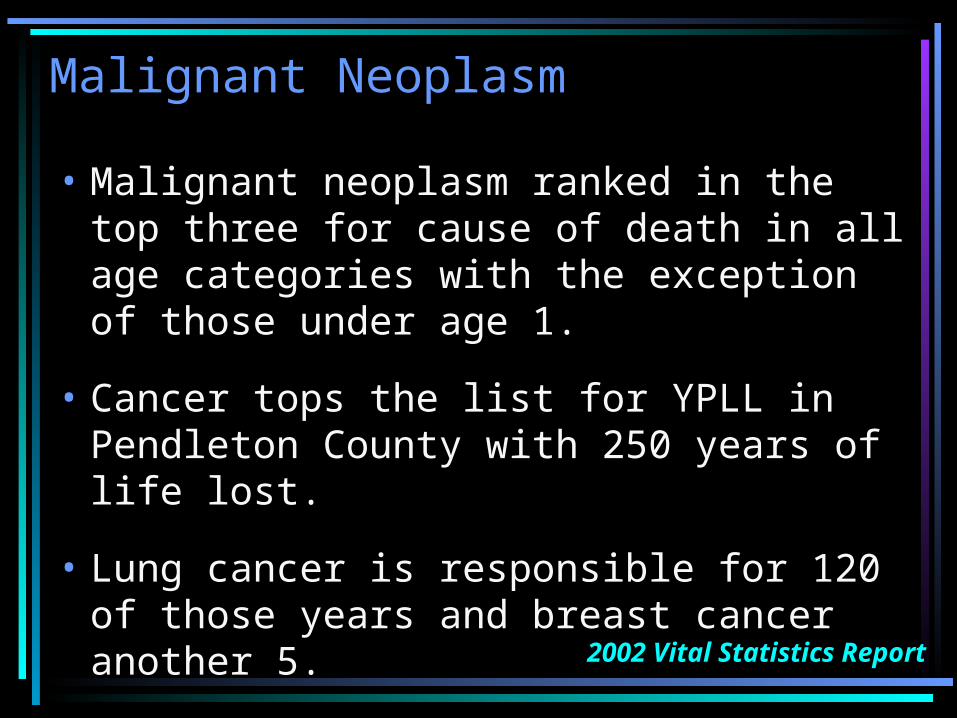
Malignant Neoplasm
• Malignant neoplasm ranked in the top three for cause of death in all age categories with the exception of those under age 1.
• Cancer tops the list for YPLL in Pendleton County with 250 years of life lost.
• Lung cancer is responsible for 120 of those years and breast cancer another 5.
2002 Vital Statistics Report
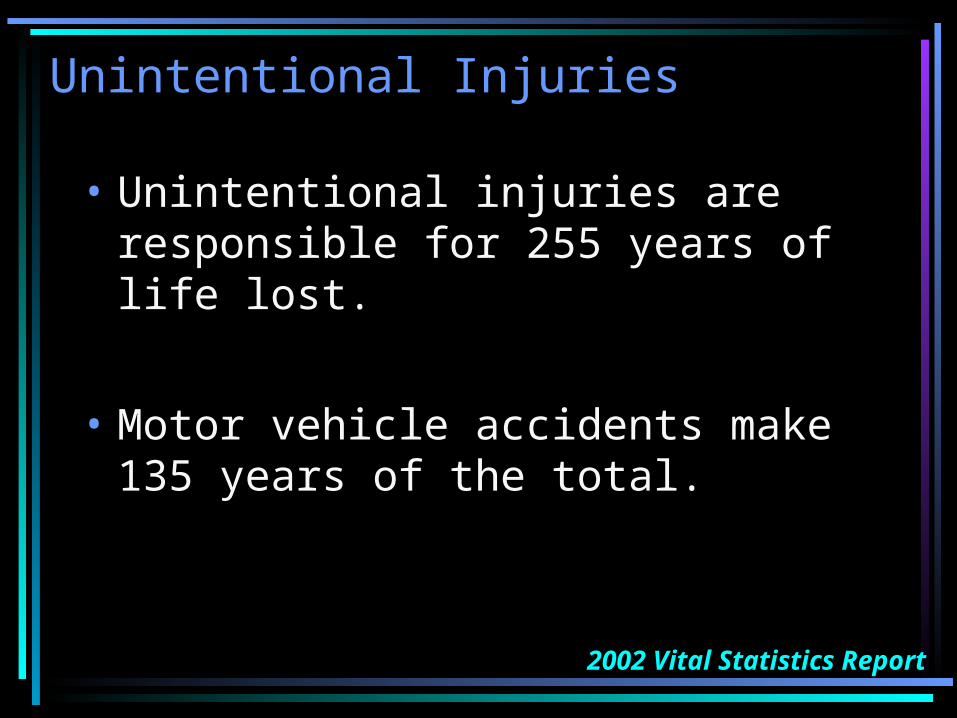
Unintentional Injuries
• Unintentional injuries are responsible for 255 years of life lost.
• Motor vehicle accidents make 135 years of the total.
2002 Vital Statistics Report
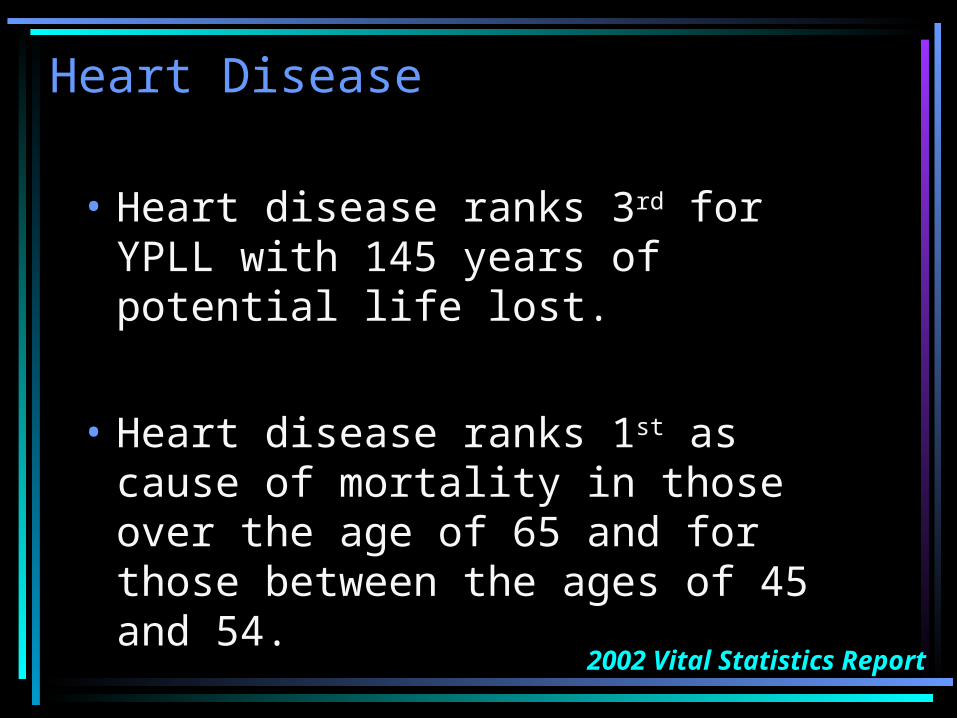
Heart Disease
• Heart disease ranks 3rd for YPLL with 145 years of potential life lost.
• Heart disease ranks 1st as cause of mortality in those over the age of 65 and for those between the ages of 45 and 54.
2002 Vital Statistics Report

Other contributors to YPLL
• Chronic lower respiratory disease takes 95 years.
• Diabetes takes another 30 years
• Septicemia takes another 15 years.
2002 Vital Statistics Report

Next Steps
• The next step in the APEXPH process is to gather input from community leaders regarding actions to be taken to address the preceding statistics.
Sources1. National Center for Health Statistics; U.S. Census Bureau
(2007) Fedstats. From http://www.fedstats.gov/qf/states/21000.html
2. Cabinet for Health and Family Services; Kentucky Department for Public Health (2002) Kentucky Vital Statistics. From http://chfs.ky.gov/dph/vital/2002vitalreports.htm
3. Cabinet for Health and Family Services; Kentucky Department for Public Health (2002) KY County Health Profile. From http://chfs.ky.gov/dph/epi/cohealthprofiles.htm
4. Kentucky Youth Advocates (2006) KIDS COUNT. From http://www.kyyouth.org/Publications/KIDS_COUNT_2006/2006+County+Data+Book+v3.pdf
5. KY Department of Education; School Report Card 2000-2005 (2004-2005) School Report Card. From http://apps.kde.state.ky.us/report_card/index.cfm?action=display_cards
6. Kentucky State Police (2005) Traffic Collision Facts, From http://www.kentuckystatepolice.ky.gov/pdf/KY_Traffic_Collision_Facts_2005.pdf
7. Kentucky State Police (2006) Crime in Kentucky, From http://www.kentuckystatepolice.ky.gov/pdf/cik_2006.pdf
8. Kentucky Cancer Registry (2003) From http://cancer-rates.info/ky/index.html
9. Cabinet for Health and Family Services; Kentucky Department for Public Health (2003) Kentucky Vital Statistics. From http://chfs.ky.gov/dph/vital/2003vitalreports.htm