(aperçu 2018-03 vam) · fleet development in france planned fleet on the ptn 950 mw installed...
TRANSCRIPT

March 2018

March was marked by a sharp fall in average temperatures (-3.1°C compared
to last year), which led to an increase in electricity demand. Electricity
production continued to increase in all sectors, with the exception of
conventional thermal production.
Gross power demand increased by 11.6% compared to March 2017.
Corrected for climate factors, demand decreased.
Monthly generation reached 52 TWh i.e. an increase of 4.8% compared to
March 2017. The increase in hydraulic generation slowed.
Wind power generation exceeded 3 TWh. Solar generation remained higher
with an increase of 5.6% compared to March 2017.
The overall monthly balance remained in favour of exports this month. The
instantaneous balance switched in favour of imports on ten occasions and
reached 4,572 MW on 22 March.
16 facilities went into service in March: 4 substations, 8 overhead lines, 1
overhead/underground line, 1 underground line, 1 transformer, 1
compensator.
2Monthly Overview - March 2018
Monthly Electrical Energy Overview
March 2018
The development of renewable energies intensified with 624 new renewable
energy parks in France since March 2017.
French prices remained stable compared to the previous month, at
€48.26/MWh on average in March.

GENERATIONFor the third consecutive time this year, the hydraulic sector increased. It increased by 11.7% to reach 6.99 TWh.
Renewable generation (excluding hydraulic) was also up by 12% compared with March 2017. Nuclear production was up
by 4.1%. Therefore fossil-fuel thermal generation was down despite an increase in heating needs.
WIND AND SOLARWind generation was up by 17.5% compared with March and reached 3.12 TWh. The coverage rate of demand by wind
generation reached 17.3%. As for solar generation, it reached 0.74 TWh, i.e. an increase of 5.6% compared to March 2017.
INTERNATIONAL TRADEThe export balance totalled 3.1 TWh. The import balance of trade with the CWE area was up and reached 0.84 TWh. The
export balance of trade to Italy, Switzerland, and Great Britain was lower compared to March 2017. The balance of trade
was in favour of imports with Spain and totalled 0.73 TWh.
3Monthly Overview - March 2018
Monthly Electrical Energy Overview
March 2018
NEW INSTALLATIONS16 new facilities went into service in March. They were part of three projects for strengthening the security of electricity
supply, two projects of the “2Loires” programme, a customer connection and two infrastructure renewal projects.
DEMANDGross demand reached 47.69 TWh, up 11.6% compared to March 2017, due to an average monthly temperature that was
lower by 3.1°C. Corrected for climate factors, overall demand was down (-0.4%). Demand by large industry continued its
upward trend (+3.4%).
TERRITORIES AND REGIONSTo meet the targets of the energy transition law, 624 new renewable energy parks (313 photovoltaic parks, 153 wind
farms, 80 dams, 78 bioenergy centres) have been installed in various French regions since March 2017. Three regions:
Hauts-De-France, Nouvelle-Aquitaine, Grand-Est have created more than 50% of the new facilities overall, i.e. 1.3 GW.
ELECTRICITY MARKETSThe cold snap at the end of February continued during the first days of March, with a daily average French price of
€84/MWh on Thursday 1 and Friday 2. Conversely, abundant wind turbine generation led to very low prices in some
countries on non-working days: the German price became negative for 21 hours on the weekend of 17 and 18, and the
Spanish price was less than €8/MWh as a daily average on Sunday 11 and on Friday 30, a public holiday in Spain (the
wind sector covered nearly half of demand on these two days).

*without energy sector
* Perimeter France excl. Corsica, losses included
Monthly energy consumption
Peak consumption*March 2018
47 688
0
10 000
20 000
30 000
40 000
50 000
60 000
70 000
Ap
r-1
7
Ma
y-1
7
Jun
-17
Jul-
17
Au
g-1
7
Sep
-17
Oct
-17
No
v-1
7
De
c-1
7
Jan
-18
Feb
-18
Ma
r-1
8
Monthly gross consumption
Period 2016-17
Period 2017-18
GWh
-0,4%
3,4%
-0,3%
-1%
-1%
0%
1%
1%
2%
2%
3%
3%
4%
4%
Ap
r-1
7
Ma
y-1
7
Jun
-17
Jul-
17
Au
g-1
7
Sep
-17
Oct
-17
No
v-1
7
De
c-1
7
Jan
-18
Feb
-18
Ma
r-1
8
Trend by sector in sliding year
adjusted from the climate effect
Adjusted national consumption
Direct RTE customers *
Adjusted consumption on PDN
91,0 GW
-10
-5
0
5
10
15
20
25
ma 1 je 3 sa 5 lu 7 me 9 ve 11 di 13 ma 15 je 17 sa 19 lu 21 me 23 ve 25 di 27 ma 29
50
55
60
65
70
75
80
85
90
95
Gross monthly consumption at the peak and actual temperature
Deviation from norm (°C) Gross consumption : daily peak (GW) Actual temperature
°CGW
102,1 GW
91,0 GW
29,5 GW
45,2 GW
20
30
40
50
60
70
80
90
100
110GW Evolution of monthly power extrema
Max power Min Power Absolute max Absolute min
4Monthly Overview - March 2018
Monthly electrical energy overview
March 2018

March 2018March 2018Installed capacity (MW) Energy generated (GWh)
Focus on generation sectors
Nuclear
63 130
Wind
13 624
Solar
7 806
Other RES
1 962
Conventional
Thermal
18 994
Hydro-
electric
25 533
Nuclear
35 677
Wind
3122
Solar
744
Other RES
719
Conventional
Thermal
4 961
Hydro-electric
6 989
0
5000
10000
15000
20000
25000
30000
35000
40000
45000
Ap
r
Ma
y
Jun
Jul
Au
g
Sep
Oct
No
v
De
c
Jan
Feb
Ma
r
Nuclear generation
Period 2016-17 Period 2017-18
GWh
GWh
5Monthly Overview - March 2018
Monthly electricical energy overview
March 2018
0
1000
2000
3000
4000
5000
6000
7000
8000
Ap
r
Ma
y
Jun
Jul
Au
g
Sep
Oct
No
v
De
c
Jan
Feb
Ma
r
Hydro-electric generation
Period 2016-17 Period 2017-18
GWh
0
1000
2000
3000
4000
5000
6000
7000
8000
9000
Ap
r
Ma
y
Jun
Jul
Au
g
Sep
Oct
No
v
De
c
Jan
Feb
Ma
r
Fossil-fuel thermal generation
Period 2016-17 Period 2017-18
GWh
0
1000
2000
3000
4000
5000
6000
Ap
r
Ma
y
Jun
Jul
Au
g
Sep
Oct
No
v
De
c
Jan
Feb
Ma
r
RES generation excl. hydro-electric
Period 2016-17 Period 2017-18
GWh
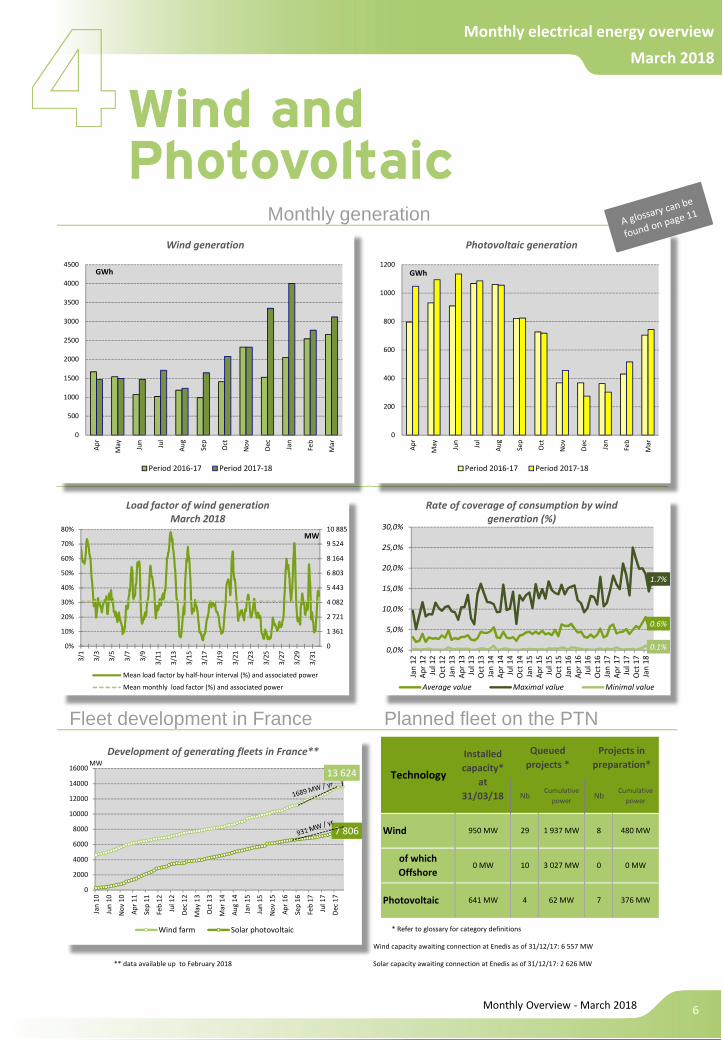
* Refer to glossary for category definitions
Wind capacity awaiting connection at Enedis as of 31/12/17: 6 557 MW
** data available up to February 2018 Solar capacity awaiting connection at Enedis as of 31/12/17: 2 626 MW
62 MW 7
29
641 MW 4
0 MW 10
8
3 027 MW 0 0 MW
Wind
Monthly generation
Planned fleet on the PTNFleet development in France
950 MW
Installed
capacity*
at
31/03/18
Technology
Cumulative
powerNb
Cumulative
powerNb
Projects in
preparation*
Queued
projects *
376 MW
of which
Offshore
Photovoltaic
1 937 MW 480 MW
0
1 361
2 721
4 082
5 443
6 803
8 164
9 524
10 885
0%
10%
20%
30%
40%
50%
60%
70%
80%
3/1
3/3
3/5
3/7
3/9
3/1
1
3/1
3
3/1
5
3/1
7
3/1
9
3/2
1
3/2
3
3/2
5
3/2
7
3/2
9
3/3
1
MW
Load factor of wind generation
March 2018
Mean load factor by half-hour interval (%) and associated power
Mean monthly load factor (%) and associated power
13 624
7 806
0
2000
4000
6000
8000
10000
12000
14000
16000
Jan
10
Jun
10
No
v 1
0
Ap
r 1
1
Sep
11
Feb
12
Jul
12
De
c 1
2
Ma
y 1
3
Oct
13
Ma
r 1
4
Au
g 1
4
Jan
15
Jun
15
No
v 1
5
Ap
r 1
6
Sep
16
Feb
17
Jul
17
De
c 1
7
Development of generating fleets in France**
Wind farm Solar photovoltaic
MW
6Monthly Overview - March 2018
Monthly electrical energy overview
March 2018
0
500
1000
1500
2000
2500
3000
3500
4000
4500
Ap
r
Ma
y
Jun
Jul
Au
g
Sep
Oct
No
v
De
c
Jan
Feb
Ma
r
Wind generation
Period 2016-17 Period 2017-18
GWh
0
200
400
600
800
1000
1200
Ap
r
Ma
y
Jun
Jul
Au
g
Sep
Oct
No
v
De
c
Jan
Feb
Ma
r
Photovoltaic generation
Period 2016-17 Period 2017-18
GWh
0.6%
1.7%
0.1%0,0%
5,0%
10,0%
15,0%
20,0%
25,0%
30,0%
Jan
12
Ap
r 1
2
Jul
12
Oct
12
Jan
13
Ap
r 1
3
Jul
13
Oct
13
Jan
14
Ap
r 1
4
Jul
14
Oct
14
Jan
15
Ap
r 1
5
Jul
15
Oct
15
Jan
16
Ap
r 1
6
Jul
16
Oct
16
Jan
17
Ap
r 1
7
Jul
17
Oct
17
Jan
18
Rate of coverage of consumption by wind
generation (%)
Average value Maximal value Minimal value
Monthly electrical energy overview
March 2018

Distribution of regional generationDistribution of regional
consumption
Renewable energy production of metropolitan France in March 2018
8
Aperçu mensuel sur l'énergie électrique
Septembre 2015
7Monthly Overview - March 2018
Monthly electrical energy overview
March 2018
GWh
5 000
4 000
3 000
2 000
GWh
6 000
3 000
1500
500
87
The regions are on track to meet the targets of the
energy transition law
624 new renewable energy parks have been
installed in various French regions since March 2017.
That was an increase of 6% to reache 48.93 GW of
total renewable installed capacity. Three regions –
Hauts-De-France, Nouvelle-Aquitaine and Grans-Est
– have created more than 50% of the new facilities
overall, i.e. 1.3 GW.
313 new solar parks (640 MW), of which 72 new
parks in Auvergne-Rhône-Alpes i.e. 62 MW, 87new
parks in Nouvelle-Aquitaine i.e. 278 MW and 51 new
parks in Occitanie, generating 63 MW.
153 new wind turbine farms (1.6 GW) have been
connected, including 47 wind farms in Hauts-de-
France i.e. 544 MW, and 29 farms in Grand-Est,
generating 279 MW.
The hydraulic and bioenergy sectors are also
expanding with 80 new hydraulic parks and 78 new
bioenergy power plants in France.
Data from GRT is updated to March 31,2018
Data from GRD is updated to February 28,2018

Daily average value evolution of the spot prices during the month
Moyenne sur le mois
Spot prices in Europe Actuality ofMonthly average value Market mechanisms
0
20
40
60
80
100
120
1-Mar 4-Mar 7-Mar 10-Mar 13-Mar 16-Mar 19-Mar 22-Mar 25-Mar 28-Mar 31-Mar
€/MWh
Belgium Netherland France Germany/Austrich Great Britain Spain Italia (north)
8Monthly Overview - March 2018
Monthly electrical energy overview
March 2018
48,26
50,74
51,8237,36
64,56
40,1839,75
55,72
53,92
52,6055,72
56,97
58,0842,40
48,70
37,96
42,93
44,96
44,84
41,89
42,3844,36
prix < prix FR
0
Sens du spread
48,26
prix > prix FR
A new capacity auction was organised on 8 March
for the 2019 delivery year.
12,350 capacity certificates of 0.1 MW were traded
at the price of €1,850 per certificate.
At the first auction for 2019 (last 14 December)
12,200 certificates were traded at the price of
€1,299.98 each.
Five other auctions will be organised in 2018 for the
2019 delivery year.
New auction on the French capacity mechanism
Prix (€/MWh)
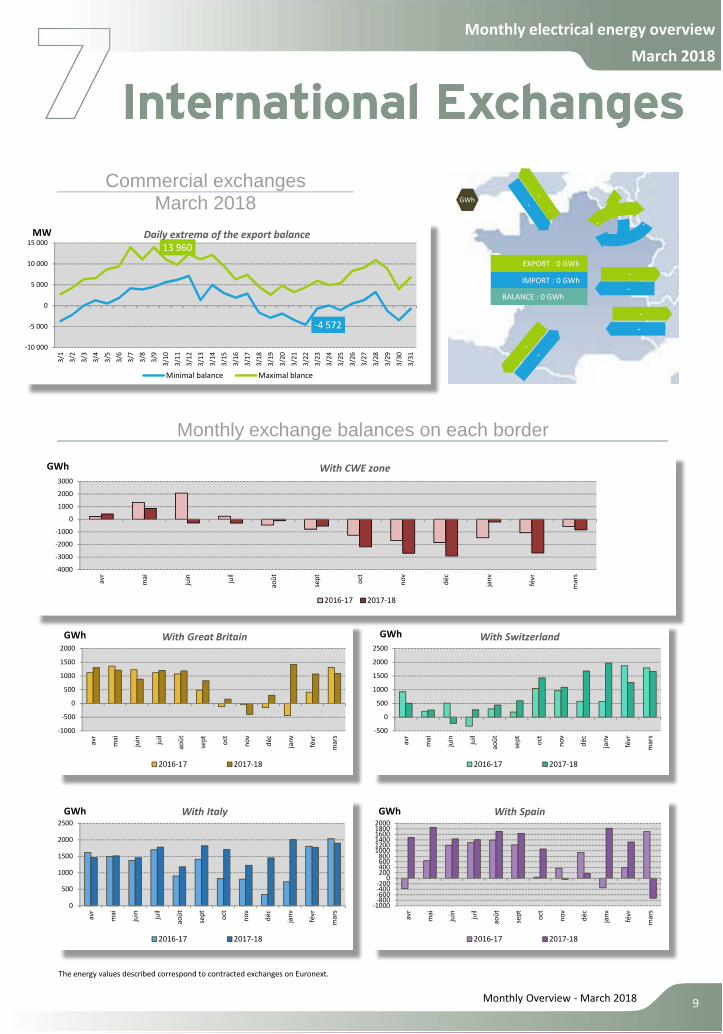
The energy values described correspond to contracted exchanges on Euronext.
Commercial exchangesMarch 2018
Monthly exchange balances on each border
-1000
-500
0
500
1000
1500
2000
avr
ma
i
juin
juil
ao
ût
sep
t
oct
no
v
dé
c
jan
v
fév
r
ma
rs
GWh With Great Britain
2016-17 2017-18
-500
0
500
1000
1500
2000
2500
avr
ma
i
juin
juil
ao
ût
sep
t
oct
no
v
dé
c
jan
v
fév
r
ma
rs
GWh With Switzerland
2016-17 2017-18
0
500
1000
1500
2000
2500
avr
ma
i
juin
juil
ao
ût
sep
t
oct
no
v
dé
c
jan
v
fév
r
ma
rs
GWh With Italy
2016-17 2017-18
-1000-800-600-400-200
0200400600800
100012001400160018002000
avr
ma
i
juin
juil
ao
ût
sep
t
oct
no
v
dé
c
jan
v
fév
r
ma
rs
GWh With Spain
2016-17 2017-18
9Monthly Overview - March 2018
Monthly electrical energy overview
March 2018
-
-
-
-
EXPORT : 0 GWh
IMPORT : 0 GWh
GWh
BALANCE : 0 GWh
-4000
-3000
-2000
-1000
0
1000
2000
3000
avr
ma
i
juin
juil
ao
ût
sep
t
oct
no
v
dé
c
jan
v
fév
r
ma
rs
GWh With CWE zone
2016-17 2017-18
-4 572
13 960
-10 000
-5 000
0
5 000
10 000
15 000
3/1
3/2
3/3
3/4
3/5
3/6
3/7
3/8
3/9
3/1
0
3/1
1
3/1
2
3/1
3
3/1
4
3/1
5
3/1
6
3/1
7
3/1
8
3/1
9
3/2
0
3/2
1
3/2
2
3/2
3
3/2
4
3/2
5
3/2
6
3/2
7
3/2
8
3/2
9
3/3
0
3/3
1
MW Daily extrema of the export balance
Minimal balance Maximal blance

10Monthly Overview - March 2018
Monthly electrical energy overview
March 2018
Overhead line Underground line Substation
63 to 150 kV
225 kV substation
Le Castellet
225 kV overhead line
Castellet - Enco-De-Botte
Castellet - Escaillon
Var (83)
As part of the creation of a 225/63 kV
step to strengthen the area’s power
supply
200MVA compensator
Mur - De-Bretagne
Cotes d'Amour (22)
As part of the project to secure the
power supply of the Brittany region
225kV substation
100 MVA transformer
Saone
225 kV overhead line
Mambelin - Saone
Pontarlier - Saone
Doubs (25)
To strengthen the power supply to
the urban area of Besançon
63kV substation
Saone
Doubs (25)
To strengthen the power supply to
the urban area of Besançon
225kV overhead line
Pratclaux - Trevas
225kV overhead/underground line
Riviere - Sanssac
Haute-Loire (43)
As part of the “2Loires” project
225 kV substation
Duvigneau
225kV overhead line
Duvigneau - Piquage à Duvigneau
Lille (59)
The connection of a consumer-customer
site
63kV overhead line
Bouleternere- Ille-sur-Tet
Bouleternere -Villefranche - De- Conflent
Pyrénées orientales (66)
Following the renewal of its conductors
90 kV underground line
Laitier - Rom
Deux Sèvre (79)
To satisfy the diffuse growth of the
load and alleviate the transmission
constraints observed on the 90 kV
network to the south of Poitiers
11Monthly Overview - March 2018
Monthly electrical energy overview
March 2018
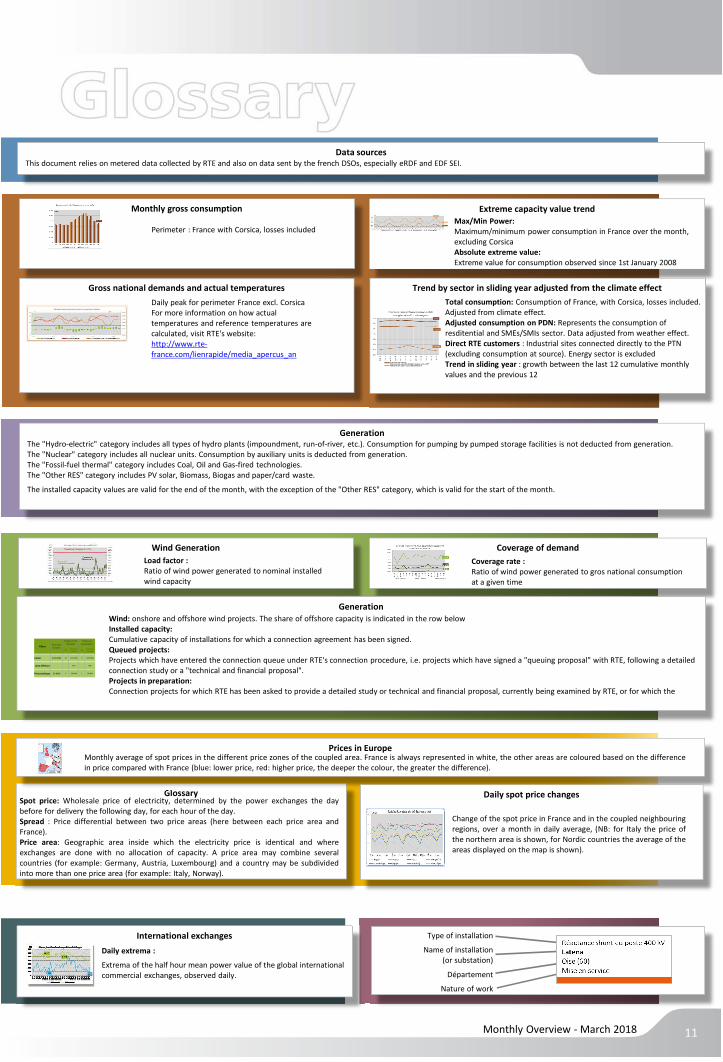
Data sourcesThis document relies on metered data collected by RTE and also on data sent by the french DSOs, especially eRDF and EDF SEI.
Gross national demands and actual temperatures
Daily peak for perimeter France excl. Corsica
For more information on how actual
temperatures and reference temperatures are
calculated, visit RTE's website:
http://www.rte-
france.com/lienrapide/media_apercus_an
Extreme capacity value trend
Max/Min Power:
Maximum/minimum power consumption in France over the month,
excluding Corsica
Absolute extreme value:
Extreme value for consumption observed since 1st January 2008
GenerationThe "Hydro-electric" category includes all types of hydro plants (impoundment, run-of-river, etc.). Consumption for pumping by pumped storage facilities is not deducted from generation.
The "Nuclear" category includes all nuclear units. Consumption by auxiliary units is deducted from generation.
The "Fossil-fuel thermal" category includes Coal, Oil and Gas-fired technologies.
The "Other RES" category includes PV solar, Biomass, Biogas and paper/card waste.
The installed capacity values are valid for the end of the month, with the exception of the "Other RES" category, which is valid for the start of the month.
Monthly gross consumption
Perimeter : France with Corsica, losses included
Wind Generation Coverage of demand
Load factor :
Ratio of wind power generated to nominal installed
wind capacity
Coverage rate :
Ratio of wind power generated to gros national consumption
at a given time
Generation
Nb
Puissance
installéePuissance
cumulée
Projets en file
d'attente
Projets en
préparation
NbPuissance
cumulée
Filière
Eolien
dont Offshore
Photovoltaïque
361 MW 22
24 MW 9
42% 80%
238 MW 1 30 MW
2131 MW 9 2559 MW
Wind: onshore and offshore wind projects. The share of offshore capacity is indicated in the row below
Installed capacity:
Cumulative capacity of installations for which a connection agreement has been signed.
Queued projects:
Projects which have entered the connection queue under RTE's connection procedure, i.e. projects which have signed a "queuing proposal" with RTE, following a detailed
connection study or a "technical and financial proposal".
Projects in preparation:
Connection projects for which RTE has been asked to provide a detailed study or technical and financial proposal, currently being examined by RTE, or for which the
Trend by sector in sliding year adjusted from the climate effect
Total consumption: Consumption of France, with Corsica, losses included.
Adjusted from climate effect.
Adjusted consumption on PDN: Represents the consumption of
resditential and SMEs/SMIs sector. Data adjusted from weather effect.
Direct RTE customers : Industrial sites connected directly to the PTN
(excluding consumption at source). Energy sector is excluded
Trend in sliding year : growth between the last 12 cumulative monthly
values and the previous 12
International exchanges
Glossary
Prices in EuropeMonthly average of spot prices in the different price zones of the coupled area. France is always represented in white, the other areas are coloured based on the difference
in price compared with France (blue: lower price, red: higher price, the deeper the colour, the greater the difference).
Daily spot price changes
Change of the spot price in France and in the coupled neighbouring
regions, over a month in daily average, (NB: for Italy the price of
the northern area is shown, for Nordic countries the average of the
areas displayed on the map is shown).
Spot price: Wholesale price of electricity, determined by the power exchanges the day
before for delivery the following day, for each hour of the day.
Spread : Price differential between two price areas (here between each price area and
France).
Price area: Geographic area inside which the electricity price is identical and where
exchanges are done with no allocation of capacity. A price area may combine several
countries (for example: Germany, Austria, Luxembourg) and a country may be subdivided
into more than one price area (for example: Italy, Norway).
Daily extrema :
Extrema of the half hour mean power value of the global international
commercial exchanges, observed daily.
Type of installation
Name of installation
(or substation)
Département
Nature of work
