apec secretariat, 35 heng mui keng terrace … 1994 bogor declaration stated that trade facilitation...
TRANSCRIPT


Published By
APEC Secretariat, 35 Heng Mui Keng Terrace Singapore 119616Tel: (65) 6775 6012 Fax: (65) 6775 6013 Email: [email protected] Website: www.apec.org
© 2004 APEC Secretariat
APEC Secretariat has held ISO 9001:2000 Quality Management Certification since 2002.
ISBN981-05-2266-5 APEC#204-EC01.3

i
TABLE OF CONTENTS FOREWORD INTRODUCTION 1 ACHIEVING THE APEC SHANGHAI OBJECTIVE: A METHODOLOGY TO BENCHMARK AND QUANTIFY TRADE FACILITATION EFFORTS IN FINANCIAL TERMS
Executive Summary 7 1. Introduction 8 2. The Scope of the Research Effort to Support the Shanghai Goal 8
2.1 Defining in-scope trade Facilitation for Assessment of New Indicators 8 2.2 Taking Stock of APEC members’ Actions and Measures 9
3. Developing Proxies for Trade Facilitation: Ideals and a Realistic Approach 10
3.1 Customs Proxies 10 3.2 Standards and Conformance Proxies 13 3.3 Business Mobility Proxies 16 3.4 E-commerce Proxies 16 3.5 Ports Infrastructure Proxies 16
4. Generating Trade Facilitation Indicators 17 4.1 Building Trade Facilitation Indicators 17 4.2 Using the Constructed Trade Facilitation Indicators 19
5. From Trade Facilitation Indicators to Trade Transactions Costs 21
5.1 Literature Review on Bridging Trade Facilitation and Trade Costs 21 5.2 Using Gravity and CGE models to Link Trade Facilitation to Transaction Costs 22 5.3 An Example of the Methodology 24 5.4 Prioritizing Trade Facilitation Effort 25
6. Examples for a Specific APEC Member and Stylized APEC Members 25
Defining a ‘unit’ of improvement 25 The Case of a Low-income APEC Economy 26 The Case of a Middle-income APEC Economy 28 The Case of a high-income APEC Economy 28
7. Conclusion 29
Appendix: Worksheets on Sources for Trade Facilitation Indicators 31
Appendix I: Business Mobility Matrix 33 Appendix II: Customs Matrix 47 Appendix III: Standards and Conformance Matrix 51

ii
MEASURING THE IMPACT OF APEC TRADE FACILITATION: A GRAVITY ANALYSIS
Executive Summary 53 1. Introduction 55 2. Trade Facilitation: Theory and Practice 56
2.1 Trade Facilitation and International Trade: Theoretical Linkage 56 2.2 Trade Facilitation: Empirical Evidences Found 57
3. Gravity Regression Analysis of Trade Facilitation 59
3.1 Quantifying Trade Facilitation Indices 59 3.2 Gravity Model 61 3.3 Gravity Regression Analysis: Effect of Trade Facilitation 62
4. Case Study: A Northeast Asian Free Trade Area between Korea, China and Japan 63
4.1 Measuring the Impact of Trade Facilitation in Northeast Asia: Gravity Analysis 63 4.2 Partial Equilibrium Analysis of Trade Facilitation 64
5. Concluding Remarks 68 References 85
ACRONYMS 87

FOREWORD
Trade facilitation has long been an objective of APEC. The 1994 Bogor declaration stated that trade facilitation was needed to complement trade liberalization. The 2003 Shanghai declaration stated the objective of reducing transactions costs by 5 percent by 2006 through trade facilitation measures. This creates the issue of the quantification of a wide variety of disparate trade facilitation measures that range from expediting customs procedures to ensuring adequate port facilities. The Shanghai goal involves this quantification to be done in terms of transactions costs. The Economic Committee has been asked to develop a methodology to conduct this quantification. The two papers appearing in this volume represent independent attempts by Canada and Korea to achieve this quantification, and happily the results are quite similar. My special thanks go to Dr. Surendra Gera, who led the Canadian effort, and to Dr. Catherine Mann, who was the chief researcher for Canada, and the Korean research team that consisted of Dr. Sang-Kyom Kim, Dr. Hongshik Lee and Dr. Innwon Park. I also thank Dr. Gera for editing this volume and Dr. Mann for writing the introductory chapter.
Dr. Choong Yong Ahn Chair, APEC Economic Committee Seoul, October 2004

INTRODUCTION

1
INTRODUCTION Trade facilitation has been an important part of APEC’s agenda since the beginning of the regional forum in 1989. Since then, all APEC Leaders’ statements have emphasized the importance of trade facilitation and this agenda has evolved, matured, and extended to other areas. The 1994 Bogor Declaration emphasized that trade facilitation was needed to complement trade liberalization in order that businesses and consumers could enjoy the benefits of trade. Thus, Bogor’s objective of ‘free trade in 2010/2020’, and principle of ‘open regionalism’, inextricably linked trade facilitation and trade liberalization. In 1995, APEC Economic Leaders identified trade and investment facilitation as one of three pillars for APEC’s future work program, and the Osaka Action Agenda established Collective Action Plans (CAPs) and Individual Action Plans (IAPs) in 15 areas, including three that still stand as “core” trade facilitation areas: Customs Procedures, Standards and Conformance, and Mobility of Business People. Subsequent Leaders meetings and declarations highlighted various APEC achievements and set new principles for the membership.1 Financial Goal for Trade Facilitation Efforts in APEC In contrast to these ‘acknowledgement of achievements’ and ‘setting of principles’ on trade facilitation, the Shanghai Leaders’ Declaration of 2001 set a specific numerical financial goal for trade facilitation efforts in APEC. The Shanghai Declaration states:
“Leaders instruct Ministers to identify…concrete actions and measures to implement the APEC Trade Facilitation Principles by 2006… The objective [is] to realize a significant reduction in the transaction costs … [of ] 5% across the APEC region over the next 5 years.”
1 The Trade Facilitation Principles are: transparency; communication and consultation; simplification, practicability, efficiency; non-discrimination; consistency and predictability; harmonization, standardization, recognition; modernization and use of new technology; due process; cooperation.
In addition, the Leaders had in mind to set in train a specific and objective process of determining progress:
“Leaders also instruct Ministers to explore the possibility of setting objective criteria on trade facilitation … as well as progress achieved in respective economies so far….” (italics added).
In the subsequent three years, the APEC membership has progressed toward the Shanghai goal. In 2002, research estimated potential gains from trade facilitation efforts, broadly defined as port efficiency, customs environment, regulatory environment, and e-business usage. The figure for potential gains was substantial, putting greater impetus behind further and more specific achievements. Thus, also in 2002, Leaders agreed to a list of ‘concrete actions and measures’ to document the state of affairs in each APEC economy. This menu outlined the range of actions members could take and potentially offered a set of specific member experiences that would detail the approach, cost, and benefit of undertaking specific trade facilitation efforts. By 2003, all APEC members prepared lists of which of these actions and measures they either already had taken or intended to take. In the course of 2004, the membership has followed through on the APEC Trade Facilitation Action Plan and initiated the Expanded Dialogue on Trade Facilitation. Progress Required to Achieve the Shanghai Goal There are three key areas for progress to achieve the Shanghai goal: benchmarking of trade facilitation status in an economy, quantification of trade facilitation effort by an economy, and translation into financial terms of those efforts. Economy-specific quantification of trade facilitation effort is necessary in order to translate these efforts into financial terms so as to match the goal of reducing transactions costs of trade by 5 percent. But also, benchmarking of the current state of trade facilitation in each member is key; otherwise, come 2006, members and the forum will not know whether they have achieved the Shanghai goal or not. Methodology both to help economies to benchmark their current situation and to track
2
their progress in quantifiable terms toward the Shanghai goal is the principal contribution of this research project. In the background of this progress on trade facilitation, there has always been the Bogor goals. APEC’s trade facilitation efforts have emerged as an important engine for expanding regional trade to achieve the Bogor Goals, as well as acting as a brake against proliferating discriminatory regional trade arrangements. Benchmarking Trade Facilitation This publication presents two papers that address both trade facilitation and trade liberalization. The first paper, Achieving the APEC Shanghai Objective: A Methodology to Benchmark and Quantify Trade Facilitation Efforts in Financial Terms, addresses several aspects of trade facilitation. First, it defines trade facilitation for the scope of benchmarking, quantifying, and translating into financial terms the efforts of trade facilitation in APEC. In this context, it addresses the challenge of matching available data to the complexity of what trade facilitation really means in practice and ‘takes stock’ of available proxies for trade facilitation effort. Then, it briefly discusses the path-breaking methodology of Wilson, Mann and Otsuki (2002) of how to create indicators of the different types of trade facilitation effort that are consistent and comparable among the APEC economies. The most important contribution of this paper is to develop a new methodology that translates the trade facilitation indicators into financial terms. APEC members can construct indicators for a benchmark year, calculate by how much those indicators have changed, and calculate by how much that might have reduced trade transactions costs. This methodology is then implemented using trade facilitation indicators representative of three types of APEC economies (high per capita income, middle per capita income, and lower per capital income) to show the viability of the methodology as a tool to gauge progress toward the Shanghai goal. On balance, it appears that APEC economies have made much progress already toward the Shanghai goal. But, differential progress, and some backsliding, has occurred within the four disaggregated areas of trade facilitation for the three representative economies considered.
Comparing Trade Facilitation with Tariff Reduction The second paper, Measuring the Impact of APEC Trade Facilitation: A Gravity Analysis quantifies the benefits of trade facilitation against tariff reduction. For the first step, to estimate the effect of trade facilitation on trade costs in APEC economies, the authors use the methodology of Wilson, Mann and Otsuki, but implement this methodology using data taken from survey results in APEC (2002) and the KBE indicators contained in the 2003 APEC Economic Outlook Report. Using these data, the chapter measures the net trade creation effect of trade facilitation among APEC economies using a gravity-model-based regression analysis. It is notable that similar results to the Wilson, Mann and Otsuki data are obtained, despite very different sources of raw inputs to the constructed trade facilitations indicators. A key contribution of the chapter is to evaluate trade facilitation against tariff reductions. The findings indicate that the trade creation effect of tariff reduction is stronger than that of any one single approach to trade facilitation. When APEC economies reduce import tariffs by 10 percent, intra-APEC imports increase from the minimum 2.1 percent to the maximum 2.2 percent. Improved trade facilitation by 10 percent boosts intra-APEC imports by 0.5 percent, 0.6 percent, 1.1 percent, and 1.5 percent in the area of customs procedures, information and communication technology, business mobility, and standard and conformance, respectively. In conclusion, improvements across the board in trade facilitation in the four areas at the same time surpasses the impact of tariff-reduction on intra-regional APEC imports. The results also emphasize the additional gains to trade facilitation, even after trade liberalization has been obtained.

3
BACKGROUND A. Previous Research on Trade Facilitation in APEC APEC’s trade facilitation agenda has generated both early research and more recent innovations on estimating potential benefits of trade facilitation efforts. The two main approaches to this effort have been the computable-general-equilibrium (CGE) model method and the gravity-model method. Several CGE projects have advanced the understanding of the nature and benefits of trade facilitation; 2 one comes close to be related to the terms of the Shanghai Declaration. 3 Most CGE models treat trade facilitation as a reduction in trade costs, which can be equivalently viewed as an improvement in the productivity of the international transportation sector. The problem with this modeling approach is that there is only one ‘type’ of trade facilitation effort (in contrast to the several embodied in the IAP/CAP and the many in the ‘menu of actions and measures’). A second issue is how to measure the potential benefit of trade facilitation – that is, in a simulation context by how much should the trade cost parameter be changed? Surveys have been important inputs to this decision. In 1999, based on surveys from specific economies, two different figures were used as a proxy for potential improvements in transportation cost: a 1 percent of import prices for the direct cost savings from trade facilitation for the industrial economies and the newly industrializing economies of Korea, Chinese Taipei and Singapore, and 2 percent for the other developing economies. In the Korean project from 2002, survey evidence suggested that the potential for change through trade facilitation differed across three different income groups (industrialized APEC, 2 The APEC CGE analyses include: Economic Committee (1999) “Assessing APEC Trade Liberalization and Facilitation: 1999 Update”, Economic Committee (1997) “The Impact of Trade Liberalization in APEC”), Economic Committee presentation by Korea (August 2002) “Measuring the Impact of APEC Trade Facilitation on APEC Economies: A CGE Analysis”, and Commonwealth of Australia (2002) “APEC Economies: Realizing the Benefits of Trade Facilitation.” 3 OECD, “Quantitative Assessment of the Benefits of Trade Facilitation,” TD/TC/WP(2003) 31, Final, 13 November 2003.
Newly industrialized APEC, and industrializing APEC) and differed across the scope of the trade facilitation effort (regional or global). The range for trade facilitation efforts to reduce trade costs was 2.9 percent to 7.7 percent depending on the group and scope of effort. Finally, in the Australian paper, information based on three case studies were used to derive potential gains from trade facilitation, but only for the specific economy in question. In sum, although the CGE analysis is excellent for many purposes, it has the draw-back in this case that it focuses on a single type of trade cost rather than the more detailed notions of trade facilitation as embodied in the Shanghai goal and generally does not employ APEC-member-specific measures of trade facilitation effort. The gravity-model approach to estimating the potential gain from trade facilitation is used in several papers by Wilson et al (2002), and addresses several of these short-comings. 4 The key innovations to these papers are first, to use survey as well as quantitative data to derive specific measures of the current state of trade facilitation efforts by each APEC member across multiple fronts – port logistics, customs environment, regulatory environment, and e-business usage.5 Second, the approach in simulation design allows a different improvement for each economy in each of the trade facilitation measures, rather than a common percentage improvement for all the economies, or all the economies in a region or level of development. A recent effort by the OECD is worthy of special mention because it brings the innovations from the Wilson-Mann-Otsuki (WMO) approach to the CGE model. The
4 Wilson et.al, (2002) “Trade Facilitation: A Development Perspective in the Asia Pacific, APEC Secretariat and World Bank, October; Wilson, J.S., C.L. Mann, T. Otsuki, (2004a) “Trade Facilitation and Economic Development: A New Approach to Measuring the Impact,” World Bank Economic Review; Wilson, J.S., C.L. Mann, T. Otsuki (2004b) “Trade Facilitation and Capacity Building: A Global Perspective,” World Bank Working Paper, February. 5 The various papers have somewhat different trade facilitation indicators. Wilson et.al. derive measures drawing on the IAP and CAP assessments. The other papers by Wilson, Mann, and Otsuki use primarily survey and quantitative data, and address not only APEC but also extend the analysis to the global economy.

4
OECD approach decomposes trade-transactions-costs (TTC) into direct costs (expenses associated with supplying information and documents to authorities, which is developed on a economy-by-economy basis using proxies also employed by WMO) and indirect costs (procedural delays, which is developed using customs-clearance times from World Bank surveys). Like the WMO method, the OECD develops proxies for each economy in each of the two areas. Moreover, the OECD recognizes that TTCs vary by product category, with surveys suggesting that TTCs are much higher for food and agricultural products. Hence, OECD also incorporates differences in TTC by type of product traded by an economy. Finally, like the WMO method, the OECD simulations allow for differential improvement in an economy’s TTCs. B. Singapore Issues: Trade facilitation in the WTO Context6 Trade facilitation is a relatively new issue at the multilateral trade negotiating table. It was added to the WTO agenda as one of the “new” issues in December 1996 at the Singapore Ministerial meeting.7 The WTO defines trade facilitation as “the simplification and harmonization of international trade procedures, with trade procedures being the activities, practices and formalities involved in collecting, presenting, communicating and processing data required for the movement of goods in international trade.” 8 According to this definition, trade facilitation involves activities such as import and export administration procedures like customs or licensing procedures; transport formalities; payments, insurance, and other trade-related financial requirements. So far, the work of the WTO on trade facilitation has focused mainly
6 A much more extensive discussion of trade facilitation in the WTO context is in Wilson, et.al op cit. and also is discussed in Chapter 4 “Is There a Case for Further Multilateral Rules on Trade Facilitation” by Krista Lucenti, in The Singapore Issues and the World Trading System: The Road to Cancun and Beyond, (2003) edited by State Secretariat of Economic Affairs (Switzerland) and Simon J. Evenett, World Trade Institute, Berne. June. 7 The new basket of trade issues introduced at the Singapore Ministerial meeting in 1996, labeled accordingly as “Singapore Issues”, includes investment, competition policy, transparency in government procurement, and trade facilitation. 8 WTO website: www.wto.org.
on customs and border-crossing procedures.
At the Doha Ministerial meeting, trade facilitation was proposed for inclusion in the agenda as one of the “new issues” of a new round of multilateral trade negotiations. Many members considered the topic of trade facilitation ripe for negotiations in the WTO. Supporters argued that after more than four years of exploring and analyzing the scope for WTO rules on this issue, it was about time to advance to the next stage and enter into negotiations. A group of members advocating the negotiation of trade facilitation rules proposed a two track approach, centered around commitments on border and border-related procedures to expedite the movement, release and clearance of goods and accompanied by a comprehensive technical assistance program in parallel to negotiations. Existing WTO provisions, in particular GATT Articles V (freedom of transit), VIII (fees and formalities connected with importation and exportation) and X (publication and administration of trade regulations) would be the starting point for trade facilitation rules. Among the examples given by the proponents of what could be covered by such rules were the simplification/minimization of data and documentation requirements, the streamlining of data entry and exchange (e.g. electronic transmissions), or the use of international standards where appropriate and possible. Some developing economies members, while supportive of the basic goals of trade facilitation, did not want to commit to new legal obligations in the WTO. Additional rules might exceed implementation capacities and there was uncertainty regarding dispute settlement in these areas. Some delegations also expressed preferences for trade facilitation work to be undertaken at the national, bilateral or regional level (such as is being done in APEC, and in the context of the run-up to the FTAA). This is despite the fact that spillover effects of trade facilitation efforts would yield benefits outside the regional negotiations.9 Ministers in Doha ultimately agreed on language that focused on movement of goods, thereby unfortunately and explicitly divorcing trade facilitation from many of the services 9 But, a caveat is that spillovers outside the region could involve costs. See the Korean presentation to the EC. (2002) op. cit.

5
infrastructures necessary to carry it out. Moreover, Doha left open the question of modalities of negotiation, which became a stumbling block in the Mexico Ministerial Meeting in Cancun in September 2003. C. Secure Trade: a New Context for Trade Facilitation10 Historically, the primary role of customs authorities was to monitor and control imports, and so national customs authorities operated in isolation from and to some extent without regard for the international supply chain. Increasingly, however, private sector firms have called for harmonizing, streamlining and automation of import procedures. It is increasingly clear that a reliable, transparent and efficient customs regime has become a critical factor in private direct investment decisions. Hence the focus on trade facilitation makes sense in the development context. The import dimension of customs, however, was changed forever with the destruction of the World Trade Towers on 11 September 2001. The emphasis, especially in the United States, has understandably shifted from trade facilitation to trade security. The implications of this shift are both global and economy-specific.
10 Brian R. Staples, Principal, Trade Facilitation Services provided input to this section.
In global terms, the system is likely to move from one where individual customs authorities monitor and control imports to a system of international and cooperative customs assessment of exports. Various international organizations envisage a global customs network wherein customs authorities share information and databases about the nature and origin of goods including their final destination. For individual economies, a customs authority now must be perceived as competent suppliers of accurate export information, else the ability for their shipments to participate in the export markets, especially the US market will be compromised. This new pressure simply heightens the emphasis already in place from the private sector for improved trade facilitation, All told, trade facilitation and trade security are complementary goals. The higher information content of many trade security efforts have, as their complement, improved trade facilitation outcomes. Moreover, it is clear that since many economies are well inside the frontier of global best practice in the area of customs and port logistics, improvement will ‘kill two birds with one stone’ yielding both better trade facilitation and trade security.
ACHIEVING THE APEC SHANGHAI OBJECTIVE:
A METHODOLOGY TO BENCHMARK AND QUANTIFY
TRADE FACILITATION EFFORTS IN FINANCIAL TERMS

7
ACHIEVING THE APEC SHANGHAI OBJECTIVE: A METHODOLOGY TO BENCHMARK AND QUANTIFY TRADE FACILITATION EFFORTS IN FINANCIAL TERMS*
EXECUTIVE SUMMARY There are three key areas for progress to achieve the Shanghai goal: benchmarking of trade facilitation status in an economy, quantification of trade facilitation effort by an economy, and translation into financial terms of those efforts. Economy-specific quantification of trade facilitation effort is necessary in order to translate these efforts into financial terms so as to match the goal of reducing transactions costs of trade by 5 percent. But also, benchmarking of the current state of trade facilitation in each member is key; otherwise, by 2006, members and the forum will not know whether they have achieved the Shanghai goal or not. First, it defines trade facilitation for the scope of benchmarking, quantifying, and translating into financial terms the efforts of trade facilitation in APEC. In this context, it addresses the challenge of matching available data to the complexity of what trade facilitation really means in practice and ‘takes stock’ of available proxies for trade facilitation effort. The paper describes sources of data and a method to generate trade facilitation indicators for each of the APEC economies. For this section, it draws on the methodology of Wilson, Mann and Otsuki (2002) of how to create indicators of the different types of trade facilitation effort that are consistent and comparable among the APEC economies. This method then uses gravity-model analysis to determine the relationship between these measures of trade facilitation and trade volumes. The paper then presents a method to use the trade facilitation indicators to bridge from the trade facilitation indictors to measures of trade costs. Using the previously estimated parameters, along with others that relate distance to cost, a change in a trade facilitation indicator can be mapped into a change in trade transactions costs – which is the Shanghai objective. The paper implements the methodology for three APEC members: low-income, middle-income, and high-income. The low-income economy is Peru; only Peru offered to have its data used to evaluate the methodology. The other two economies are representative APEC members. The examples show the viability of the methodology. On balance, it appears that APEC economies have already made much progress toward the Shanghai goal. But, differential progress, and some backsliding, has occurred within the four disaggregated areas of trade facilitation for the three representative economies considered.
* This paper was written by Dr. Catherine L. Mann, Senior Fellow, Institute for International Economics

8
1. INTRODUCTION
Trade facilitation has been an important part of the APEC agenda since the beginning of the regional forum in 1989, and the Leaders’ statements have emphasized the importance of trade facilitation. Over time, the commitment to trade facilitation has extended beyond transportation costs to include customs, standards and conformance, business mobility, and more recently, e-commerce. At their Meeting in Shanghai in October 2001, Leaders agreed to a concrete goal: To reduce transactions costs of trade by 5 percent by 2006.
In the subsequent three years the APEC membership has progressed toward the Shanghai goal. In 2002, research estimated potential gains from trade facilitation efforts, broadly defined as port efficiency, customs environment, regulatory environment, and e-business usage. The figure for potential gains was substantial, putting greater impetus behind further and more specific achievements. Thus, also in 2002, Leaders agreed to a list of ‘concrete actions and measures’ to document the state of affairs in each APEC economy. This menu outlined the range of actions members could take and potentially offered a set of specific member experiences that would detail the approach, cost, and benefit of undertaking specific trade facilitation efforts. By 2003, all APEC members prepared lists of which of these actions and measures they either already had taken or intended to take. In the course of 2004, the membership has followed through on the APEC Trade Facilitation Action Plan and initiated the Expanded Dialogue on Trade Facilitation.
There are three key areas for progress: benchmarking of trade facilitation status in an economy, quantification of trade facilitation efforts by an economy, and translation into financial terms of those efforts. Economy-specific quantification of trade facilitation effort is necessary in order to translate these efforts into financial terms so as to match the goal of reducing transactions costs of trade by 5 percent. But also, benchmarking of the current state of trade facilitation in each member is key; otherwise, come 2006, members and the forum will not know whether they have achieved the Shanghai goal or not. Methodology both to help economies to benchmark their current situation and to track their progress in quantifiable terms toward the Shanghai goal is the principal contribution of this research project.
This chapter addresses the stages required to benchmarking, quantifying, and translating into financial terms the efforts of trade facilitation in APEC. It starts by defining trade facilitation for the scope of the overall research project and addresses the challenge of matching available data to the complexity of what is trade facilitation. It also takes stock of available proxies for trade facilitation efforts and uses an existing method to create indicators of the different types of trade facilitation efforts that are consistent and comparable among the APEC economies. Then it develops a new methodology that will take these trade facilitation indicators and translate them into financial terms. It takes this methodology and implements it using trade facilitation indicators representative of three types of APEC economies (high per capita income, middle per capita income, and lower per capital income) to determine the viability of the methodology for APEC and its membership as a tool to gauge current situation as well as progress toward the Shanghai goal. 2. THE SCOPE OF THE RESEARCH EFFORT TO SUPPORT THE SHANGHAI GOAL 2.1 Defining In-Scope Trade Facilitation for Assessment of New Indicators There is no standard definition of trade facilitation in public policy discourse. As noted above, earlier work under the auspices of APEC has taken, on the one hand, a narrow tack (transportation costs) and, on the other hand, a broader tack (ports logistics, customs environment, regulatory environment, e-business usage, business mobility). Definitions of trade facilitation can extend even further, to include capacity-building efforts.1
1 The evolution of definition is discussed in more detail in Wilson, et.al .(2002).

9
For the purposes of a new assessment to quantify and benchmark trade facilitation for this research project, we return to the ‘core’ trade facilitation areas embodied in the 1995 Osaka Action Agenda. • Customs: this area of trade facilitation is actually quite broad, and includes addressing the
issues of movement of goods, transparency of forms, use of e-commerce (paperless trading), adherence to international data nomenclature, temporary entry of products, and professionalism of personnel
• Standards and conformance: this area of trade facilitation includes addressing mutual recognition agreements, adherence to international standards (such as ISO or environmental), burden of regulation, transparency of requirements, and professionalism of regulators
• Business mobility: this trade facilitation area has, thus far, been unique to APEC and includes addressing visa regulations, length of stay regulations, and identity cards for business travelers.
Infrastructure both physical in terms of ports and that related to e-commerce will be considered in-scope for the portion of the research project on testing the methodology, but not for determining whether there are any new available data on trade facilitation beyond that found in the context of previous work by Wilson, Mann and Otsuki (2002) noted already.2 It is worth noting that the core trade facilitation categories match particular GATT articles and appear in the list of ‘Singapore’ issues in the Doha Development Agenda, and therefore have salience for WTO negotiations, whereas the infrastructure elements do not. 2.2 Taking Stock of APEC Members’ ‘Actions and Measures’ 3 Over the course of 2002 and 2003, APEC members submitted ‘menus of concrete actions and measures’ as part of the APEC Trade Facilitation Action Plan. This section compiles and assesses the information contained in these ‘menus’. The objective is to see whether this stocktaking exercise reveals a common set of activities.4 Most economies submitted material very roughly based on a spreadsheet made available by APEC for this purpose. The spreadsheet identifies 96 different actions, and an economy identifies which actions it is taking, as well as specifies the stage of implementation. The 96 actions are grouped into four main categories: Movement of Goods (59 individual actions); Standards (20 individual actions); Business Mobility (6 individual actions) and E-Commerce (11 individual actions). In principle, three stages of implementation are possible: In Place; In Progress; and Under Consideration. A fourth is implied, e.g. “No Action”, which is given to a measure where an economy has not provided any information about implementation. The individual APEC economy submissions for actions and measures for trade facilitation have been coded into one database. Even when the individual economy submissions used the spreadsheet (and some instead used an essay format), it was often not possible to distinguish between the stages of implementation. The four stages of implementation were reduced to two: (1) Actions that have been enacted, i.e. that either are already in place, in progress or described in such terms by the APEC member; and (2) Actions that have not been enacted, i.e. that either are only under consideration, regarding which no action has been taken, or where no information is available.
2 Wilson, et al (2002), Wilson, Mann and Otsuki (2004a) and Wilson, Mann, and Otsuki (2004b), as well as OECD (2003), Venables and Limao, and UNCTAD, E-commerce and Development (2001) all find very large estimated benefits from trade facilitation come from improvements in ports and e-commerce infrastructures. 3 Prepared with the assistance of Jacob Kirkegaard, Research Assistant, Institute for International Economics. 4 During the period that this Report was being conducted, the Asia-Pacific Foundation of Canada was undertaking a comprehensive assessment of the Implementation of the Trade Facilitation Action Plan using the TFIAP 2004 Part II Mid-Term Review – Status of Implementation.

10
The simple dichotomization of the data loses some informational detail and reduces the precision of this snap-shot of progress. However, self-assessment of progress into the three specified stages of implementation is not without problems, either. Moreover, as it turns out, the simple enacted/not-enacted dichotomization yields an APEC-wide picture that shows great divergence in progress between individual economies and across specific actions. This simple coding should alert policy-makers and APEC to areas in need of more attention, as well as to a broad questioning of the method of obtaining information from the membership. The 21 members of APEC that have submitted information for this summary, range from three members of the G-7 to economies with a real GDP per person of less than $500 in 2002. Large differences in individual progress should be expected simply based on disparities in APEC economies’ general governance institution capabilities, which in general tend to be positively associated with the level of income per person. Moreover, this positive relationship was observed in the survey and quantitative data on various trade facilitation indicators presented in Wilson, Mann and Otsuki (2004a and b). However, the self-assessment of actions and measures enacted vs. not-enacted does not show this expected relationship between GDP per person and the extent to which trade facilitation measures are enacted. Rich economies are at both extremes and poorer economies score both very high and very low. This would seem to indicate that there is a marked difference in political prioritization of trade facilitation measures among APEC economies, that policy staff give quite different levels of attention to participating in APEC reporting exercises, that self-assessment of trade facilitation actions and measures varies substantially, or some combination of the above. This same conclusion was reached with regard to the usefulness of the CAP and IAP as indicator of trade facilitation in the context of the Wilson, et al. 3. DEVELOPING PROXIES FOR TRADE FACILITATION: IDEALS AND A REALISTIC
APPROACH Wilson et al, and Wilson, Mann and Otsuki (WMO, 2004a and 2004b) pushed outward the frontier for measuring trade facilitation efforts across different categories and on an economy-specific basis. Specifically, they pioneered the use of business surveys and other survey analyses as inputs to the measurement of trade facilitations. Their method for combining various pieces of information into indicators of different types of trade facilitation effort will be discussed below. The objective of this section is to step back from what WMO did and address in more detail the challenges of finding appropriate trade facilitation proxies, to see what additional data might have come to light in the three years from that initial research approach, and to propose Internet-intensive strategies for generating trade facilitation indicators for APEC economies.5 Accompanying worksheets show the detail on sources for proxies for the core trade facilitation indicators for each of the APEC economies. It remains the task of another project to determine which of the proxies in these worksheets or from other sources, such as those reviewed in WMO (2004a and 2004b) or other studies should be the ones to use to assess whether trade facilitation efforts have gone far enough to reach the Shanghai goal. 3.1 Customs Proxies6 Ideally, a methodology to quantify customs related trade facilitation efforts would include a single, universally accepted, standardized and transferable measure of all “customs” transaction costs.
5 By Internet-intensive methods is meant using web-crawlers to find government or company sites with certain characteristics that might be useful for a trade facilitation proxy. Using a web-crawler to find the company sites with ISO certification in a particular economy is a specific example. 6 Background material for this section is due to Brian R. Staples, Principal, Trade Facilitation Services, a Canadian consultancy.

11
But, “…there is no evidence that meaningful performance measures that span the supply chain actually exist.” Supply Chain Metrics-The International Journal of Logistics Management, Vol.12, Number 1, 2001 There are already a series of competing and complementary methodologies for measuring trade facilitation (i.e. clearance times/delays, documentation costs, fees paid to third parties for customs related services, measuring internal transaction costs by interviewing manufacturers-importers-exporters). There may well be competing interests, so that the ideal of a single measure for customs related transactions costs might not be realizable. But, it is not unreasonable to strive for a system of measures that encompasses various indicators. This is especially true if the individual indicators within a quantification regime or system could be translated into a series of common values. The expression ‘customs’ is very broad and covers a wide variety of activities including but not limited to documentation, movement of goods, compliance with international trade obligations, post-entry audits-verifications and pre-audit regimes wherein traders voluntarily disclose their operations to customs authorities in order to secure a range of trade facilitation and clearance benefits. Upon review it appears that the issue of what to measure and how to measure customs-related trade facilitation are often intimately intertwined. Moreover, any consequent relationship to transactions costs is not clear. The following is a partial list of some of the definitional and related issues and questions that must be addressed: Where Does Customs Begin and End? There is considerably more to customs issues than simply presenting documents to the authorities. What are the valid customs-related activities to be quantified? Viewed from an end-to-end perspective, an international (cross border) trade transaction envisages the whole order-to-cash cycle including payment, transportation and the related exchange of goods and information. Although this is clearly too broad a definition for identifying “customs” issues, it is important to keep in mind that “customs” considerations can and do appear throughout this entire process. Public vs. Private: Does transaction cost only include the cost of importing goods through customs by the private sector or does it also include any reduction in costs achieved by customs? If so, it must be kept in mind that increased customs efficiency usually, but does not necessarily, translate into improved trade facilitation for the private sector. Measuring Public Sector Costs: Public sector costs, and their impact on traders, are non-trivial. In Canada, for example, periodic verification of importers was designed to assess how well importers were following the rules. In sum, “Periodic verification achieved little at great cost… After six years and a lot of effort, it has made little headway in assessing how well importers are following the rules. Furthermore, the initiative has left verification officers and some importers frustrated”.7 The Canadian effort showed on the basis of 53 verifications completed, high error rates in classification (29 percent), origin (18 percent), and valuation (15 percent). In some sectors the error rates were over 50 percent and 48 of 53 companies verified had made errors in classification. Trade Complexity: Unless actually involved in the day-to-day movement of goods, it can be very easy to underestimate trade complexity. For example, consider the rules of origin (ROO) under the North American Free Trade Agreement (NAFTA). It is not unusual for it to take several weeks, and sometimes months, to prepare a NAFTA certificate of origin. Related activities might include re-aligning purchasing and other software systems to capture the information required in order to claim origin and supplier management-education for the same objective. Furthermore, it is not uncommon for NAFTA origin audits to involve the periodic participation of at least five to 10 parties (importer’s customs staff and/or customs broker, exporter’s customs staff including warehouse and software personal, legal and/or consulting advisors and the customs auditors 7 Office of the Auditor General of Canada 2001 Report: Managing the Risks of Non-Compliance for Commercial Shipments Entering Canada.

12
themselves) over a time frame that can easily range between 3 to 18 months: “Administrative costs are important even in regimes operating on self-certification: in a recent study, Cadot et al. (2002) disentangle NAFTA’s non-ROO and ROO-related administrative costs, finding the latter to approximate 2 percent of the value of Mexican exports to the US market. 8 Trade Basics: Sometimes something as apparently simple a classifying a product under the Harmonized Commodity Description and Coding System can take several days, weeks and even months. Delays can be caused in the course of securing product specifications from the supplier, requests for advance rulings and /or classification appeals. Furthermore, the Canadian Auditor General reported that classification errors occur 30 percent to 50 percent of the time (depending on the sector) and that it is estimated that classification errors occur in 90 percent of the companies surveyed. Naturally, these types of errors can lead to mistaken or misleading landed cost calculations. Classification difficulties could contribute to the four-day average required to calculate landed costs as reported in the Aberdeen Group’s Global Trade Management Benchmark Report. Defining the Role of E-Commerce: Some of the more exhaustive and reliable studies on the cost of trade and customs procedures were undertaken before the onset of e-commerce and the increasingly wide-spread use of web-based trade management systems. Without question, the effective use of technology has reduced, often dramatically, the customs-related transaction costs. However, it must be kept in mind that many customs procedures are still paper based and that several forms of e-logistics (i.e. e-mail with trade documents attached) might in fact merely represent the more expeditious movement of more paperwork. Product Variability: Trade Facilitation quantification and benchmarking measures must take into account the fact that in many cases customs-related transactions costs may differ for different types of internationally traded goods. For example, it would be problematic if the transaction costs for manufactured goods were used to calculate the transaction costs of bulk goods. Other variability factors include whether or not the subject goods are being traded under preferential or non-preferential conditions and the relative size of the companies under review. As previously outlined, the administrative cost of rules of origin can be very significant. In addition, it is generally accepted that compliance costs are higher for small and medium sized enterprises (SMEs) than they are for larger corporations and that it is more difficult to accurately identify transaction costs in SMEs. In the context of a developed economy, an SME may overcome the inherent complexity of trade transactions by hiring a customs broker as opposed to relying on internal resources. Under this scenario, measuring compliance costs can be achieved by recording the related service fees paid by the SME. This is less likely to occur in a developing economy where such specialized services are not as prevalent, and compliance costs can actually prevent entry into the market. National and Regional Variations: Another challenge or difficulty in accurately measuring trade facilitation activities is that, given domestic and regional differences in customs administrations, transaction costs gathered from one jurisdiction cannot be automatically applied to other jurisdictions. For instance, some jurisdictions such as Mexico, practice a doctrine sometimes referred to as strict broker liability. In this scenario, the customs broker or agent is liable for all errors and omissions including simple and obvious accounting-mathematical mistakes. The resulting penalties can be severe and might even involve a loss of one brokers license. In this sense the doctrine of strict customs broker liability might be creating unnecessary delays. Although the customs broker can legally rely upon properly completed declarations of value and origin, they still carry significant exposure to penalties and/or the suspension of their licenses regarding matters of quantity and tariff classification. While it is true that a customs broker can limit his tariff classification liability by requesting a ruling from customs and/or forwarding samples for laboratory analysis: these exceptions do not cover the majority of imports. In this environment, it is only rational for the broker to inspect goods prior to final their importation, temporary or otherwise, into the market. Under these conditions it has been conservatively estimated that 8 Antoni Estevadeordal and Kati Suominen, (2004) “Rules of Origin in the World Trading System,” Prepared for the Seminar on Regional Trade Agreements and the WTO.
13
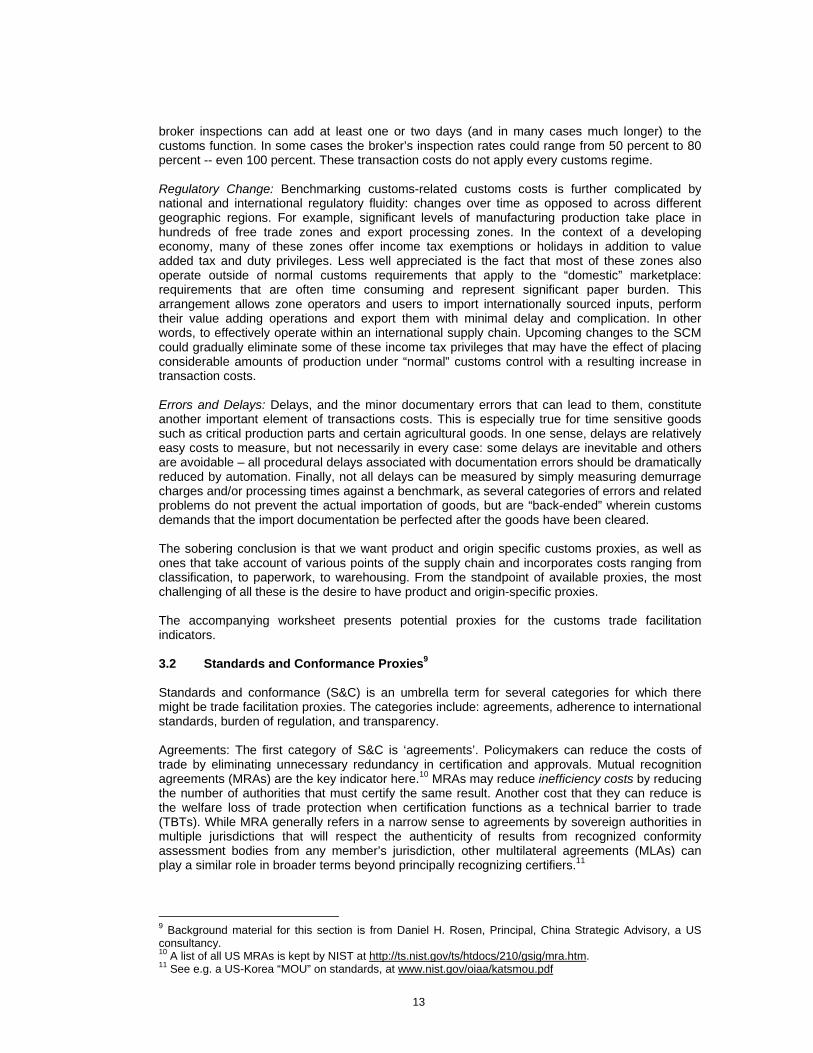
broker inspections can add at least one or two days (and in many cases much longer) to the customs function. In some cases the broker’s inspection rates could range from 50 percent to 80 percent -- even 100 percent. These transaction costs do not apply every customs regime. Regulatory Change: Benchmarking customs-related customs costs is further complicated by national and international regulatory fluidity: changes over time as opposed to across different geographic regions. For example, significant levels of manufacturing production take place in hundreds of free trade zones and export processing zones. In the context of a developing economy, many of these zones offer income tax exemptions or holidays in addition to value added tax and duty privileges. Less well appreciated is the fact that most of these zones also operate outside of normal customs requirements that apply to the “domestic” marketplace: requirements that are often time consuming and represent significant paper burden. This arrangement allows zone operators and users to import internationally sourced inputs, perform their value adding operations and export them with minimal delay and complication. In other words, to effectively operate within an international supply chain. Upcoming changes to the SCM could gradually eliminate some of these income tax privileges that may have the effect of placing considerable amounts of production under “normal” customs control with a resulting increase in transaction costs. Errors and Delays: Delays, and the minor documentary errors that can lead to them, constitute another important element of transactions costs. This is especially true for time sensitive goods such as critical production parts and certain agricultural goods. In one sense, delays are relatively easy costs to measure, but not necessarily in every case: some delays are inevitable and others are avoidable – all procedural delays associated with documentation errors should be dramatically reduced by automation. Finally, not all delays can be measured by simply measuring demurrage charges and/or processing times against a benchmark, as several categories of errors and related problems do not prevent the actual importation of goods, but are “back-ended” wherein customs demands that the import documentation be perfected after the goods have been cleared. The sobering conclusion is that we want product and origin specific customs proxies, as well as ones that take account of various points of the supply chain and incorporates costs ranging from classification, to paperwork, to warehousing. From the standpoint of available proxies, the most challenging of all these is the desire to have product and origin-specific proxies. The accompanying worksheet presents potential proxies for the customs trade facilitation indicators. 3.2 Standards and Conformance Proxies9 Standards and conformance (S&C) is an umbrella term for several categories for which there might be trade facilitation proxies. The categories include: agreements, adherence to international standards, burden of regulation, and transparency. Agreements: The first category of S&C is ‘agreements’. Policymakers can reduce the costs of trade by eliminating unnecessary redundancy in certification and approvals. Mutual recognition agreements (MRAs) are the key indicator here.10 MRAs may reduce inefficiency costs by reducing the number of authorities that must certify the same result. Another cost that they can reduce is the welfare loss of trade protection when certification functions as a technical barrier to trade (TBTs). While MRA generally refers in a narrow sense to agreements by sovereign authorities in multiple jurisdictions that will respect the authenticity of results from recognized conformity assessment bodies from any member’s jurisdiction, other multilateral agreements (MLAs) can play a similar role in broader terms beyond principally recognizing certifiers.11
9 Background material for this section is from Daniel H. Rosen, Principal, China Strategic Advisory, a US consultancy. 10 A list of all US MRAs is kept by NIST at http://ts.nist.gov/ts/htdocs/210/gsig/mra.htm. 11 See e.g. a US-Korea “MOU” on standards, at www.nist.gov/oiaa/katsmou.pdf

14
Because MRAs/MLAs can reduce both inefficiency costs and TBT costs incurred by traders, they can play an important role in trade facilitation. To quantify the benefits possible in APEC through MRAs, it is first necessary to establish what gains to trade were achieved in previously phasing in MRAs in the APEC area or elsewhere. The second is to gauge what portion of trade in the APEC region that is amenable to management under an MRA is not currently under MRA. The US National Institute of Standards and Technology (NIST) maintains a web resource on US MRAs in force, which includes resources on Asian MRAs (especially in telecom) by economy/economy. This resource provides a starting part for “guestimating” what share of APEC trade still stands to benefit from MRA creation. The difficulties of working with MRAs are that the inefficiency or TBT reduction-premium will vary greatly by industry (depending, say, on how entrenched the use of TBTs as a trade barrier is); that different types of agreements exist between economies – not all comparable; and that identifying differences still does not tell us whether they are even being observed or not. In addition, MRAs sometimes deal at a level of principle and generality that leaves specific indicators and quantifiable metrics to be determined in practice by correspondent authorities in individual economies. While an MRA may be in force in principle, it is not a given that signatories have validated “conformity assessment bodies” in each economy for MRA-accepted status. In some economies, it may not be possible to identify such credible bodies. Adherence to International Standards: The second sub-category of S&C metric is adherence to international standards. International standards regimes can be commercial instead of sovereign, generally concern specifications for measurement or manufacture rather than agreed procedures for validating certifiers, and address specific products and engineering details and numbers rather than principals. Standards regimes are multilateral rather than bilateral, and driven from the bottom up by firms and industries. Examples include acceptance of the Harmonized System (HS) of tariff data collection managed by the World Customs Organization, or the use of standards set forth by the International Standards Organization (ISO), an NGO organization. Many industries play a leading role in setting their own standards, and then having governments apply standards accordingly through participation in international standard setting regimes. Standards regimes are far more numerous than MRAs. They tend to be more product and industry specific, and more business driven. Not surprisingly, standards regimes therefore offer a wider array of separate metrics that can be used to gauge cost savings in trade facilitation. At the same time, data associated with standards regimes can be spotty and issue-specific (i.e. ISO, environmental, etc.) and a high degree of variation in costs and benefits of regime maintenance will be found depending on the regime at hand. More product specific regimes are less likely to have attracted the interest of economists or others in quantifying the cost reductions achieved. Membership is often firms, not governments; so if an industry does not exist in a economy, cannot afford to join a standards organization, or does not trade significantly, then there is unlikely to be much evidence of the value of costs to be reduced. A number of specific indicators are candidates for measurement both in the Agreements and the International Standards sub-categories. The first is simply whether the economy is a member/participant in the regime. This is arduous to confirm but could be done by going through economy websites, which generally list such participation, or by going through the website for a standard-setting group or type of agreement (where one exists), where generally membership is listed. A second indicator is whether the economy lives up to its obligations within the regime. This is more difficult to assess. Where regimes have arbitration bodies that review compliance, it may be possible to add up the number of “problem cases” relative to other members. It is possible to find anecdotal “scores” for whether specific economies live up to their agreements. Membership in standards regimes is that much more difficult in this regard as it may be hard to correlate poor industry performance to an economy’s behavior. (That is, it is important to make sure the industry is represented in an economy before concluding that non-participation is an indication of failure to take advantage of an opportunity to lower trade costs.)

15
Burden of Regulation: Regulatory burden exists in innumerable forms and can have a debilitating effect on trade. Of course, it can stymie domestic commerce just as easily—sometimes more easily—as large foreign firms have deeper pockets with which to “manage” regulatory burden. But regulatory burden often works in a manner more hostile to trade. This area overlaps with the topic of customs management and trade facilitation more than others under the S&C umbrella. For example, the recent use of delays in issuing soybean safety certificates forced customs officials to prevent the unloading of vessels in one APEC economy. Non-customs related examples of trade-defeating regulatory burdens are plentiful as well. For example, inability to obtain the right to use approval or certification marks due to an onerous application processes might not prevent import, but might disincline consumers to purchase products [Underwriters Laboratories (UL), certification is a voluntary undertaking in the US, not required by law; but without it, many retailers would refuse to carry a product]. There exists a good selection of attempts to quantify various aspects of regulatory burden. Policymakers keen to improve competitiveness have initiated de-regulation campaigns in a variety of economies and industries. In the United States, for example, all government paperwork is required to estimate time required for completion by the submitter. Another approach is more qualitative questions about the regulatory process that can be organized into qualitative comparisons, such as conducted by the World Bank’s World Business Environment Survey, (WBES). At the end of the spectrum are purely quantitative metrics on matters such as the number of days and approximate cost needed to apply for the China Compulsory Certification (CCC) mark.12 At the same time, the scope of regulation is expanding rapidly in many economies as more regimes are elaborated to manage global trade, and existing regimes become more complex. For example in China and Viet Nam many regulatory processes simply did not exist until recently, and so the time (and cost) of complying with regulation is necessarily rising even though the quality of the marketplace is largely improving. There are too many specific aspects of regulation to permit comprehensive measurement; a sample is needed. While detailed industry regulatory process metrics like application response times provide accurate data, there is variance among industries (often reflecting the cultural differences of regulators in different industries), and hence a comprehensive measure is difficult. Broad spectrum reports on the business environment, like the Global Competitiveness Report (GCR) from the World Economic Forum, include sub-components estimating regulatory burden (“extent of bureaucratic red tape” in the case of the GCR) and other factors affecting the ability of governments to service the S&C needs of potential exporters and importers. Transparency Requirements: A basic but important and potentially costly S&C issue is the transparency of requirements, governance and enforcement in a marketplace. Transparency can be lacking for many reasons, ranging from intention murkiness contrived to create rent seeking opportunities for regulators, to rapid commercialization that proceeds faster than the ability of legislators or regulators to promulgate rules and regimes. On the one hand, transparency problems rooted in rent seeking are very difficult to quantify due to criminal implications, entrenched interests and political sensitivities. On the other hand, when an effort to quantify transparency can be made, it is generally easier to come up with metrics than for other areas because regulations are usually either transparent or not – there is not a lot of gray. Therefore, there is a low degree of difficulty in finding metrics on transparency in the sense of access to rules, laws and regulations. The World Bank WBES includes a number of questions relating to this sort of regulatory transparency that included survey samples in a number of the pathfinder economies. These surveys tend to be at a high level of generality, which is probably necessary to get responses from across the pathfinder economy group. The WTO requires trade related laws and regulations to be public, notified and available, and hence WTO member review mechanism reports should be an additional source of comparison on this dimension. 12 Estimates of the time and expense for US firms are maintained by the US Department of Commerce. Elsewhere studies on “days required” have been compiled for more economies.

16
Transparency in the sense of access to the process of trade regulation decision-making is a different case. Openness in regulatory review is closely related to questions of corruption, and as noted, this is a more difficult area. However, it is also probably more costly than access to documents nowadays in terms of trade facilitation costs. Aptly, metrics compiled by Transparency International provide extraordinary detail on this subject, using extensive well-documented sources, and the coverage includes many, although not all, APEC members. As in the case of customs, a stumbling bloc inherent in trade facilitation proxies for standards and conformance is that ideally, product specific proxies would be desirable. The accompanying worksheet details sources for proxies for the trade facilitation indicator for standards and conformance. 3.3 Business Mobility Proxies Building proxies for business mobility is a particular challenge, as APEC is somewhat unique in having a focus on this area. However, as the movement of skilled labor is increasingly of interest to many economies, the APEC interest is prescient. The accompanying worksheet13 details information about business mobility in APEC. How this detail can be developed into a business mobility trade facilitation indicator remains to be worked out. A further difficulty with this trade facilitation indicator is that the estimated relationship between business mobility and trade flows has the wrong sign, in that we would expect greater business mobility to enhance trade flows. Yet, in estimation in Wilson et al, the sign was opposite. Since this estimated relationship is a key input to the methodology, an incorrect sign is a significant stumbling block to further assessment of the value of business mobility in trade facilitation. 3.4 E-commerce Proxies An e-commerce trade facilitation indicator is designed to measure the extent to which an economy has the necessary domestic infrastructure (telecommunications, financial intermediaries, logistics firms) and is using networked information to improve efficiency and transform activities to enhance economic activity.14 But, most indicators of e-business usage are summary indicators and so do not have as their counterpart any of these specific policy areas. That is, an improvement in e-business usage probably implies better telecommunications systems, financial intermediation, and distribution logistics, but the individual relationships are not clear, and are hard to estimate individually. Therefore, in our ideal development of a proxy for e-commerce, we would wish to include measures of each of the key services infrastructures as well as business environment indicators. To come up with data for each of these areas, however, goes beyond the scope of this paper. It is mainly because there is little relationship between indicators and underlying policies that e-commerce is not specifically addressed further in this section. 3.5 Ports Infrastructure Proxies A trade facilitation indicator for port infrastructure is designed to measure the extent to which an economy has the necessary and appropriate infrastructure to promote trade. This would include rail, road, air, and sea ports, with different importance to each depending on the type of traded products, the pattern of trade, and the geographical location of an economy. In our ideal development of a proxy for port infrastructure we would like to consider the different modes in the trading relationship. However to come up with data for each of these areas for all APEC members
13 Worksheet prepared by Jacob Kirkegaard. 14 For further discussion of the relationship between domestic infrastructure and e-commerce, see Mann, C.L., S. E. Eckert, and S. C. Knight, (2000) Global Electronic Commerce: A Policy Primer, Institute for International Economics, Washington.

17
is beyond the scope of this paper. Moreover, because improvements in port infrastructure are necessary, but not the focus of the APEC trade facilitation effort, the issue is not discussed further in this section. 4. GENERATING TRADE FACILITATION INDICATORS This section develops the methodology to benchmark and quantify progress toward the Shanghai goal. It discusses how to utilize raw information (as for example from the sources in the appendix worksheets) and combine it into trade facilitation indicators that can be used in the next step of the analysis. 4.1 Building Trade Facilitation Indicators The greatest challenge to new research on trade facilitation is to find conceptually distinct measures of trade facilitation to meet policymakers’ needs for specificity. The methodology for taking many different proxies for trade facilitation and using them to quantify and benchmark current trade facilitation status is outlined in detail in WMO (2004a and 2004b) and is summarized here. As discussed, this analysis will focus on building consistent and economy-specific trade facilitation indicators that measure three dimensions of trade facilitation effort: Customs, standards and conformance, and business mobility. But trade facilitation indicators for port logistics and for e-commerce will also be discussed.
Each trade facilitation indicator is generated from quantitative and survey data specific to each APEC economy. Survey data comprise the bulk of the resources and are emphasized here because, generally, no other empirical data are available on a consistent basis over time for all the APEC members. While some APEC members have carried out empirical studies of, for example, improvements in customs costs or release-times from customs warehouses, the gains obtained by one economy, for example Singapore, cannot be assumed to apply equally to another economy.15 While survey data must be used with caution and checked across alternative sources for consistency, these data offer the best chance for cross-country qualitative and quantitative analysis to inform policy discussion and debate.
Trade facilitation indicators are created by over-sampling, indexing, and aggregating specific data. First, each trade facilitation indicator (for Customs, Standards and Conformance, Business Mobility, Port Logistics or E-commerce) is constructed with multiple economy-specific data inputs (thus the term used here, over-sampling). Using multiple sources for the same trade facilitation concept reduces the dependence on any one survey source or one data series. Moreover, each of the individual inputs used as inputs to the trade facilitation indicator can be analyzed to gain more insight into the composition of trade facilitation measures for individual economies and in comparison across APEC.
15 The OECD paper referenced earlier has an excellent summary of economy and product specific analyses, which emphasizes the range of trade transactions costs, which should make researchers wary of applying results obtained in one bilateral trading relationship to another such relationship.

18
Since some of the data are actual values, and some come from surveys with different response ranges (1 to 7, 1 to 10, and so on), the raw data need to be put on a comparable basis, by indexing. The main difference between WMO (2004a) and WMO (2004b) is whether to index individual series to the average of the economies in the sample (WMO 2004a) or to the highest value observed for any economy in the sample, so-called ‘global best practice’ (WMO 2004b). The reason for choosing one index base vs. another is mostly a matter of presentation of the data and does not affect estimation, simulation, or other results. In WMO (2004a), each APEC-specific observation of a raw series is indexed to the average of all the APEC members’ value for the raw series, yielding what is, in that article, called an indexed input.16
Next, indexed inputs must be aggregated into the specific trade facilitation indicators. For greater transparency – and because there is no specific argument (theoretical or statistical) for choosing a different aggregation method – a simple average is used to aggregate the indexed inputs into each of the trade facilitation indicators. In the case of WMO (2004a and 2004b), the trade facilitation indicators were somewhat different, so the inputs to each are somewhat different. In WMO (2004a), which focused on APEC, the trade facilitation indicators were constructed using the following series as inputs: • Port efficiency for each APEC member J is the average of three indexed inputs:
- Port Efficiency Index (1 = worst and 7 = best; Clark, Dollar and Micco 2002) - “Port facilities and inland waterways are extensive and efficient” (1 = strongly disagree
and 7 = strongly agree; World Economic Forum 2000) - “Air transport is extensive and efficient” (1 = strongly disagree and 7 = strongly agree;
World Economic Forum 2000) • Customs environment for each APEC member J is the average of five indexed inputs
- “Irregular, additional payments connected with import and export permits, business licenses, exchange controls, tax assessments, police protection, or loan applications are very rare” (1 = strongly disagree and 7 = strongly agree; World Economic Forum 2000)
- “Import fees are high” (1 = strongly disagree and 7 = strongly agree; World Economic Forum 2000)
- “Hidden import barriers other than published tariffs and quotas are: 1 = an important problem and 7 = not an important problem” (World Economic Forum 2000)
- “Bribery and corruption exist in the economy” (1 = agree and 10 = disagree; IMD Lausanne 2000)
- Corruption Perceptions Index (Transparency International) • Regulatory environment for each APEC member J is constructed as the average of four
indexed inputs (World Economic Forum 2000): - “Environmental regulations in your economy are 1 = confusing and frequently changing
and 7 = transparent and stable” - “Regulatory standards (product, energy, safety, environmental standards) are among the
world’s most stringent” (1 = strongly disagree and 7 = strongly agree) - “Compliance with international environmental agreements is a high priority in your
economy’s government” (1 = strongly agree and 7 = strongly disagree) 17 - “Environmental regulation in your economy is: 1 = not enforced or enforced erratically and
7 = enforced consistently and fairly” • E-business for each APEC member J (World Economic Forum 2000):
- “Percentage of companies that use the Internet for e-commerce”
16 So an indexed input for APEC member J (J = 1,2, .. , 19)16 is constructed as:
JII = IIJ / ( 19/19
1∑=J
JII ) where IIJ denotes the raw data for APEC member J.
17 For indexing, this index value is reversed to make it consistent with the other indexes.
19
In WMO (2004b), which considered the whole world, the trade facilitation indicators were constructed as follows: • “Port efficiency” for each economy J is the average of two indexed inputs from GCR:
- Port facilities and inland waterways (sourced as before) - Air transport (sourced as before)
• “Customs environment” for each economy J is the average of two indexed inputs from GCR:
- Hidden import barriers (sourced as before) - Irregular extra payments and bribes (sourced as before)
• “Regulatory environment” for each economy J is constructed as the average of indexed inputs
from World Competitiveness Yearbook (IMD Lausanne 2000) and KKZ(18): - Transparency of government policy is satisfactory (IMD Lausanne 2000) - Control of Corruption (KKZ)
• “Service-sector infrastructures” for each economy J is from World Economic Forum:
- Speed and cost of internet access - Effect of internet on business
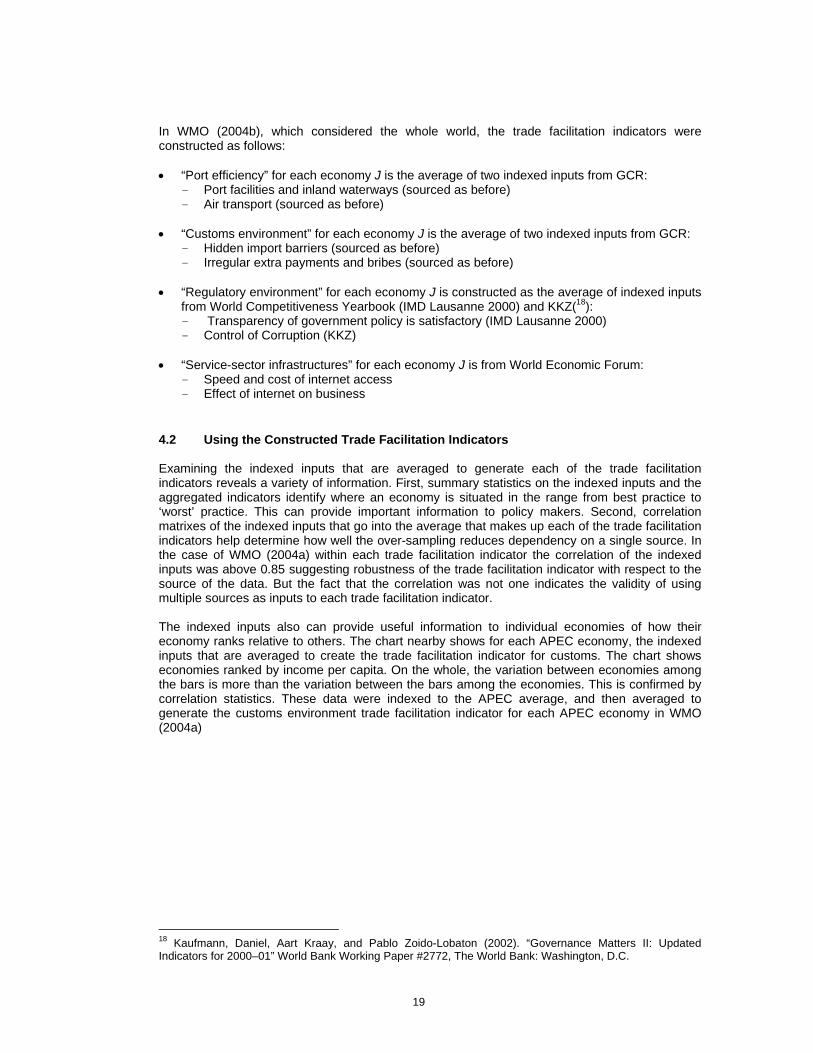
4.2 Using the Constructed Trade Facilitation Indicators Examining the indexed inputs that are averaged to generate each of the trade facilitation indicators reveals a variety of information. First, summary statistics on the indexed inputs and the aggregated indicators identify where an economy is situated in the range from best practice to ‘worst’ practice. This can provide important information to policy makers. Second, correlation matrixes of the indexed inputs that go into the average that makes up each of the trade facilitation indicators help determine how well the over-sampling reduces dependency on a single source. In the case of WMO (2004a) within each trade facilitation indicator the correlation of the indexed inputs was above 0.85 suggesting robustness of the trade facilitation indicator with respect to the source of the data. But the fact that the correlation was not one indicates the validity of using multiple sources as inputs to each trade facilitation indicator. The indexed inputs also can provide useful information to individual economies of how their economy ranks relative to others. The chart nearby shows for each APEC economy, the indexed inputs that are averaged to create the trade facilitation indicator for customs. The chart shows economies ranked by income per capita. On the whole, the variation between economies among the bars is more than the variation between the bars among the economies. This is confirmed by correlation statistics. These data were indexed to the APEC average, and then averaged to generate the customs environment trade facilitation indicator for each APEC economy in WMO (2004a)
18 Kaufmann, Daniel, Aart Kraay, and Pablo Zoido-Lobaton (2002). “Governance Matters II: Updated Indicators for 2000–01” World Bank Working Paper #2772, The World Bank: Washington, D.C.
20
Customs Environment
0.00 0.20 0.40 0.60 0.80 1.00 1.20 1.40 1.60 1.80 2.00
United StatesCanada
Hong KongSingapore
JapanAustralia
Chinese TaipeiNew Zealand
Korea
ChileMexico
ThailandMalaysia
RussiaChinaPeru
PhilippinesIndonesia
Vietnam IrregularPayments (higher is fewer )Corruption Perceptions Index (higher is lesscorruption) Trans Intl ImproperPractices (higher is better Adm) WCYHidden ImportBarriers (higher is fewer barriers) GCRImportFees (higher is fewer fees) GCR
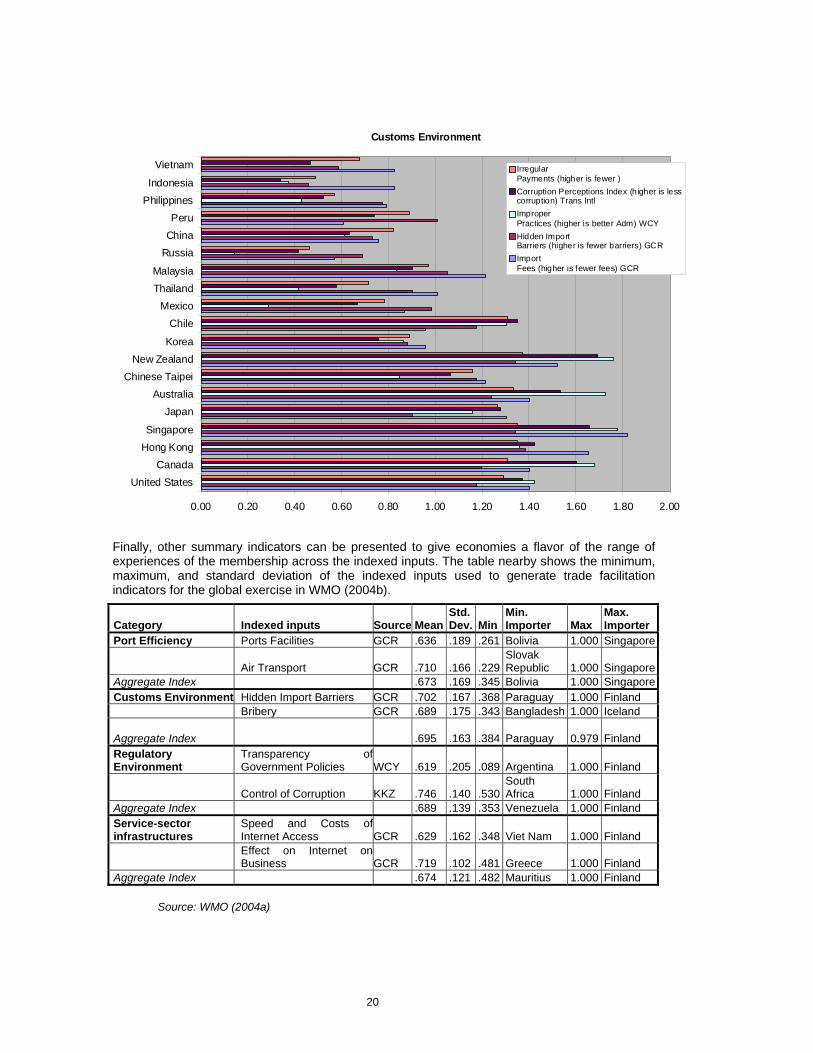
Finally, other summary indicators can be presented to give economies a flavor of the range of experiences of the membership across the indexed inputs. The table nearby shows the minimum, maximum, and standard deviation of the indexed inputs used to generate trade facilitation indicators for the global exercise in WMO (2004b).
Source: WMO (2004a)
Category Indexed inputs Source MeanStd. Dev. Min
Min. Importer Max
Max. Importer
Port Efficiency Ports Facilities GCR .636 .189 .261 Bolivia 1.000 Singapore
Air Transport GCR .710 .166 .229Slovak Republic 1.000 Singapore
Aggregate Index .673 .169 .345 Bolivia 1.000 SingaporeCustoms Environment Hidden Import Barriers GCR .702 .167 .368 Paraguay 1.000 Finland Bribery GCR .689 .175 .343 Bangladesh 1.000 Iceland
Aggregate Index .695 .163 .384 Paraguay 0.979 Finland
Regulatory Environment
Transparency ofGovernment Policies WCY .619 .205 .089 Argentina 1.000 Finland
Control of Corruption KKZ .746 .140 .530South Africa 1.000 Finland
Aggregate Index .689 .139 .353 Venezuela 1.000 Finland Service-sector infrastructures
Speed and Costs ofInternet Access GCR .629 .162 .348 Viet Nam 1.000 Finland
Effect on Internet onBusiness GCR .719 .102 .481 Greece 1.000 Finland
Aggregate Index .674 .121 .482 Mauritius 1.000 Finland
21
Once the set of indicators to be used to assess trade facilitation effort has been chosen from the various sources identified in the worksheets, and once the set of APEC members to be assessed as representative economies as been determined, specific trade facilitation indicators can be constructed. However, the objective of this report is not the construction of trade facilitation indicators but rather the use of those indicators in an assessment of transactions costs of trade. This is where we turn now. 5. FROM TRADE FACILITATION INDICATORS TO TRADE TRANSACTIONS COSTS A major challenge for the research project is to generate trade facilitation indicators that match the context of the Shanghai Accord, which is stated in terms of ‘transactions costs’. Thus, it is not enough to find inputs and create proxies for concepts of trade facilitation to benchmark an economy’s actions. Rather, the inputs that are not in financial terms (days in port or survey of how transparent regulations are, or numbers of plants with ISO certification, for example) must be translated into the financial measure of the Shanghai goal (e.g., transactions costs of trade). There is little literature or guidance on how to approach this challenge. Accordingly, the next section is a short literature review on possible directions. The literature focuses on relating distance to relative prices between economies, geography and trade, and time to transport vs. cost to transport. 5.1 Literature Review on Bridging Trade Facilitation and Trade Costs19 The first strand of the literature relates economy borders and distance to trade prices. Rogers and Engel (1996) use differences in consumer price data as a proxy for deviations from the law of one price and then use these deviations to estimate the how ‘wide is the border’ between the US and Canada. Distance between cities can account for much of the variation in prices of similar goods within the US and Canada, but crossing the US-Canadian border is estimated to add an additional 2500 (most conservative estimate) in distance between cities. Expanding on this work, McCallum shows that trade between Canadian provinces is 2200 percent larger than between Canadian provinces and US states of similar distance (and sizes). Wei (1996) and Helliwell (1998) both show that the tendency to consume goods produced at home is similarly large between and within OECD economies. Crucini, Telmer, and Zachariadis (1999) examine these issues in the context of the EU and find that EU markets may be more integrated, and borders may matter less than studies examining the variability of price differences would suggest. Wei and Parsley (1999) examine the “border effect” for the US and Japan, finding that it narrows over time, and that the evolution of the border effect can be partly explained by the unit cost of international transportation, exchange rates and wage variability.20 A second strand of the literature discusses the impact of geography on transportation costs. Among a variety of papers, Venables and Limao (2001) estimate that infrastructure (both own infrastructure and that landlocked economies’ transit routes) is a significant and quantitatively important determinant of transport costs and of bilateral trade flows.21 Improving destination infrastructure by one standard deviation reduces transport costs by an amount equivalent to a 19 For further discussion, see J. Anderson and E. van Wincoop “Trade Costs” (September 10, 2003) in draft for the Journal of Economic Literature. 20 Engel, Charles, and John Rogers (1996) “How Wide is the Border?” NBER Working Paper 4829, 1994; McCallum, John (1995) “National Borders Matter: Canada-U.S. Regional Trade Patterns,” American Economic Review, 85(June,3): 615-23; Wei, Shang-jin (1996) “Intranational versus International Trade: How Stubborn Are Nations in Global Integration?” NBER Working Paper 5531, April; Helliwell, John (1998) How Much Do National Borders Matter? DC: Brookings Institution Press; Crucini, Mario, Chris Telmer, and Marios Zachariadis (1999) “Dispersion in International Prices,” University of Pennsylvania working paper David C. Parsley, Shang-Jin Wei (1999) “Border, Border, Wide and Far, How We Wonder What You Are”, World Bank. 21 Nuno Limão and Anthony J. Venables (2001) “Infrastructure, Geographical Disadvantage and Transport Costs” World Bank.
22
reduction of 6,500-sea km or 1,000km of overland travel. However, the geography of being landlocked raises transport costs by around 50 percent (for the median landlocked economy compared to the median coastal economy). Improving the infrastructure of the landlocked economy from the median for landlocked economies to the 25th percentile reduces this disadvantage by 12 percentage points, and improving the infrastructure of the transit economy by the same amount reduces the disadvantage by a further 7 percentage points. Combining estimates from transport cost data with the trade data yields the conclusion that the elasticity of trade with respect to transport costs; it is high, at around –2.5. Consequently, the median landlocked economy only has 30 percent of the trade volume of the median coastal economy, and even improving infrastructure to the 25th percentiles raises this to only over 40 percent. The third strand of the literature relates distance to transportation time to costs and product value. Hummels (2001a) uses a large dataset for prices, distance and different types of transportation costs (sea/air/land), but only for the US as a destination. Estimates indicate that each additional day spent in transport reduces the probability that the US will source from that economy by 1 – 1.5 percent. Each day saved in shipping time is worth 0.8 percent ad-valorem for manufactured goods. The advent of fast and relatively cheaper transport (both air shipping and faster ocean vessels) is equivalent to reducing tariffs on manufactured goods from 32 percent to 9 percent between 1950-1998 – so time is money. Hummels (2001b) also reports on the elasticity of trade costs with respect to distance finding a range of 0.22 to about 0.46. Finally, Evans and Harrington (2003), using a dataset on sources of US apparel and quotas find that products where timeliness matters are sourced from locations nearer to the US. The coefficient of trade volume with respect to distance ranges from 1.0 to 1.5. The importance of this distance variable is accentuated when the product being sourced is needed frequently and is of higher value (a high-fashion item for example). 22 5.2 Using Gravity and CGE Models to Link Trade Facilitation to Transactions Costs This section details the methodology to move from indicators of trade facilitation to costs of transacting trade. The method uses parameters that are estimated by a gravity model of trade and by computable-general-equilibrium models of trade, as well as estimated parameters that relate distance, time, and costs. All the parameters used here come from references reported earlier. Combining these estimates utilizing a ‘back-of-the-envelope’ strategy allows for easy robustness checks and use of alternative estimated parameters. The basic strategy is the following: Step 1: Research for estimated parameters of the relationship between trade facilitation variables and trade flows. For example, trade flows between economy I (the exporter) and J (the importer) is a function of various estimated trade facilitation parameters: • Parameter (a) which is the estimated parameter on the trade facilitation indicators for customs
in economy J, • Parameter (b) and parameter (c) which are the estimated parameters on the trade facilitation
indicator for standards and conformance for economy J and for economy I (since standards and conformance matter not just for the exporting economy but also for the importing economy),
• Parameter (d) which is the estimated parameter on the trade facilitation indicator for business mobility for economy J.
• Parameter (e) and parameter (f) which are the estimated parameters on the trade facilitation indicator of port infrastructures in economy J and economy I
22 Hummels, David (2001a), “Time as a Trade Barrier” mimeo, Purdue University, July; Hummels, David (2001b), “Toward a Geography of Trade Costs” mimeo, Purdue University, September; Evans, Carolyn and James Harrigan (2003), “Distance, Time, and Specialization” International Finance Discussion Papers no.766 Federal Reserve Board of Governors, May.

23
• Parameter (g) and (h) which are the estimated parameters on the trade facilitation indicator for e-commerce/service sector infrastructures in economy J and economy I.
Step 2: Research for estimated parameters of the relationship between trade flows and distance. • Parameter (q) is the estimated parameter on the variable measuring distance between
economy I and J. Step 3: Research for estimates of the relationship between distance and transactions costs. • Parameter (w) is the estimated relationship between trade costs and distance between
economy I and J.
Step 4: Back-of-the-envelope strategy. Using all the estimated parameters and substituting out the relationship between trade costs and distance yields comparable measures of how trade costs would change with different changes in trade facilitation while yielding the same increase in trade volume. • An improvement in customs TF in economy J would reduce the ‘cost’ of trade by (a/q)*(w) and
yield an increase in trade of X; • An improvement in standards and conformance in economy I would reduce the ‘cost’ of trade
by (b/q) * (w) and yield the same increase in trade volume of X; • An improvement in standards and conformance in economy J would reduce the ‘cost’ of trade
by (c/q) * (w) and yield the same increase in trade volume of X; • An improvement in business mobility in economy J would reduce the ‘cost’ of trade (d/q) * (w),
and yield the same increase in trade volume of X. • An improvement in port infrastructure in economy I would reduce the ‘cost’ of trade by (e/q) *
(w) and yield the same increase in trade volume of X; • An improvement in port infrastructure in economy J would reduce the ‘cost’ of trade by (f/q) *
(w) and yield the same increase in trade volume of X; • An improvement in e-business infrastructures in economy I would reduce the ‘cost’ of trade by
(g/q) * (w) and yield the same increase in trade volume of X; • An improvement in e-business infrastructures in economy J would reduce the ‘cost’ of trade
by (h/q) * (w) and yield the same increase in trade volume of X; The Table nearby reports parameter estimates from the WMO series of papers and Hummels (2001b) for each of the parameters discussed above. Parameter estimate: elasticity of
trade with respect to: Economy J (importer) County I (exporter)
(a) Customs TF 0.47 Not estimated (b) Importer standards and conformance TF
0.28
(c) Exporter standards and conformance
-- 0.62
(d) Importer port infrastructure 0.31 -- (d) Exporter port infrastructure -- 0.92 (e) Importer e-business infrastructure and use
0.73 --
(f) Exporter e-business infrastructure and use
-- 1.94
(d) Business mobility -.41 (wrong sign) Not estimated (q) Distance -1.26 Parameter estimate elasticity of:
(w) Cost with respect to distance 0.2 (costs rise 0.2 percent with distance)

24
5.3 An Example of the Methodology Using the parameters from the table and the equations from the previous section shows what a ‘unit’ of improvement in the various trade facilitation indicators would yield in terms of a reduction in trade costs while yielding the same increase in trade volume. Core Trade Facilitation Indicators
Customs improvements
A ‘unit’ improvement in custom TF (of the importer) = 0.47/(-1.26)*0.2
equals a reduction in costs of 0.075, or 7.5 percent
Standards and Conformance Improvements A ‘unit’ improvement in S&C TF economy I (exporter)
= 0.28/(-1.26)*0.2 equals a reduction in costs of 0.044, or 4.4 percent
A ‘unit’ improvement in S&C TF economy J (importer) = 0.62/(-1/26)*0.2 equals a reduction in costs of 0.098, or 9.8 percent
Business Mobility Improvements
A ‘unit’ improvement in business mobility in economy J
= -0.41/(-1.26)*0.2 equals an increase in costs of 0.065, or 6.5 percent
Infrastructure improvements
Port infrastructure
A ‘unit’ improvement in port infrastructure of economy J (importer)
= 0.31/(-1.26)*0.2 equals a reduction in costs of 0.049, or 4.9 percent
A ‘unit’ improvement in port infrastructure of economy I (exporter) = 0.92/(-1.26)*0.2
equals a reduction in costs of 0.145, or 14.5 percent
E-business infrastructure improvements A ‘unit’ improvement in e-business infrastructure and use in economy J (importer)
= 0.73/(-1/26)*0.2 equals a reduction in costs of 0.116, or 11.6 percent
A ‘unit’ improvement in e-business infrastructure and use in economy I (exporter) = 1.94/(-1/26)*0.2 equals a reduction in costs of 0.306, or 30.6 percent
25
5. 4 Prioritizing Trade Facilitation Effort By construction, all of the calculations for trade facilitation effort yield the same increase in trade volume. This is so as to enable comparison of different trade facilitation efforts standardized across trade facilitation outcome. However, policymakers must consider many more issues than just the figures for reductions in trade transactions costs calculated above. Prioritizing among alternative trade facilitation efforts depends first on how highly ranked an economy’s current standing is with regard to the trade facilitation concept as measured by the trade facilitation indicators. That is, for a particular economy, an already highly ranked indicator for a particular concept (say customs) may suggest that money and effort is better spent in some other area of trade facilitation. The benchmarking and bar graph in Section V of this Report is valuable for making this assessment. Second, it is important to measure a ‘unit’ improvement in the index and then consider how costly it might be to gain a ‘unit’ of improvement. It may cost much more to get a ‘unit of improvement’ in port infrastructure than in standards and conformance. On the other hand, it may be more difficult to change the culture of standards and conformance, so ‘cost’ should not just be considered in financial terms. Clearly, these generic calculations expressed above have to be brought to the economy-specific data since both the calculation of ‘unit’ of improvement and the cost of obtaining such an improvement is specific to an economy. 6. EXAMPLES FOR A SPECIFIC APEC MEMBER AND STYLIZED APEC MEMBERS The last step of the process and how to use the methodology for specific economics in APEC is the content of this section. The first issue is to define a ‘unit’ of improvement in each trade facilitation indicator and associated that with policy choices that are specific to an economy. This is the final step in getting to the Shanghai objective of relating policy measures to reductions in trade costs. This requires returning to the economy-specific trade facilitation indicators from section V. The value of constructing the trade facilitation indicators using data specific to each economy now becomes clear in that there is a economy-specific relationship between the inputs to the indicators and concrete policy direction and measures. Defining a ‘unit’ of improvement There are three approaches to defining a ‘unit’ of improvement for a particular trade facilitation indicator for an individual economy: (1) Assumed improvement in a particular trade facilitation indicator over time relative to the average for the sample of economies; (2) Assumed improvement in a particular trade facilitation indicator over time relative to best global practice; (3) Improvement in a particular trade facilitation indicator from the benchmark year to the next observation (usually annual observations), either in level terms or in comparison to average improvements by related economies. The first two approaches indicate the potential value of particular directions for trade facilitation improvement over a future time path which gives policymakers an idea of how valuable, in terms of reduced trade transactions costs, a particular policy path might be. To the extent that policy programs have long gestation times to reach fruition, the first two forward-looking measures could have important value to policy markers as they prioritize effort. However, because they are forward-looking, the potential improvements and results are hypothetical. These forward-looking simulations are employed in the WMO series of papers. The third definition references the benchmark year of data for each APEC economy (1998 or 1999 using the WMO 2004a dataset). Comparing current-dated survey observations (2001 or 2002) against matched survey questions and data from the benchmark year allows policymakers to quantify how the indexed inputs to the trade facilitation indicator have changed over time. Since

26
all the data are indexed to the average of all APEC economies, the change in the indexed input for any economy is one way to measure a ‘unit’ of improvement in that trade facilitation indicator. This actual-change in indexed input to the trade facilitation indicator does not hold the increase in trade flows constant across all the different approaches to trade facilitation. But, it is a more reasonable measure of how much trade costs might have fallen given the changes in trade facilitation indicators that did occur between the benchmark year and the current-dated survey. This latter approach is the one that best matches the objective of the Shanghai goal and is the one that is employed for the examples in this section. The case of a low-income APEC economy Peru was the only APEC member that expressed interest in applying survey data for Peru to this methodology. Peru’s income per capita puts it at the low end of the APEC membership. Accordingly, survey data for Peru were used to measure changes in transaction costs of trade between the benchmark survey year and the most recent observation for matched survey questions and data. The two survey years represent two to three year’s time difference depending on the specific question. Not all the same questions were asked the survey respondents in the two years, so responses for those with matched survey questions were used. The survey questions and data were presented in Section V.1 Core trade facilitation indicators
Customs improvements
Consistent survey questions for customs improvements include questions about hidden trade barriers, irregular payments, and perceptions of corruption. Peru improved about a half a unit (where a unit is a one point change in the 1 to 7 survey value) according to the trade facilitation indicator between the benchmark year and current survey year. So the reduction in trade transactions costs associated with this 0.5 unit improvement is about
= 0.5 * 0.47/(-1.26)*0.2 = .00373 or about 4 percent lower transactions costs
Standards and Conformance Improvements Consistent survey questions for standards and conformance improvements include questions about burden of regulations, clarity and stability of regulations, consistency of application of regulations, and conformance with international agreements. As an importer, Peru improved about 0.5 unit in its conformance with international agreements, but lapsed somewhat more than a unit in its other areas of regulatory environment. Considering the improvement in conformance with international agreements, Peru may have reduced transactions costs of trade on the export side
= 0.5 * 0.28/(-1.26)*0.2 = 0.022 or about 2 percent lower export costs
Standards and conformance are also important to facilitate imports, which reduces the costs of imported intermediates and through this channel enhances economic activity and productivity in an economy. In this regard, the improvement in Peru’s conformance with international agreements may have reduced transactions costs of trade by some
= 0.5 * 0.62/(-1/26)*0.2 = .0492 or about 5 percent lower import costs
On the other hand, as noted, the survey indicates that Peru may have lapsed on the order of one unit in its other measures of regulatory climate. Accordingly, the reductions in trade transactions

27
costs associated with higher conformance with international agreements may have been fully eroded by more costly regulatory burdens inside the economy. However, it is important to note that the average for all APEC economies also showed higher regulatory burdens between the benchmark and the current survey year. Peru had a lower than average increase in regulatory burden. Hence relative to other APEC members, Peru in fact improved over the time period in question, even if relative to its own benchmark year it did not improve. Infrastructure Improvements
Port infrastructure By the metric of seaport infrastructures, Peru did not improve between the benchmark and the survey year. But by the metric of airport infrastructures, it did improve about a 1/10 unit. Between being an importer and exporter, the improvement in airport infrastructure might have reduced Peru’s transactions costs by some
= 1/10 * 0.31/(-1.26)*0.2 = .0049 or about 0.5 percent (on import costs)
= 1/10 * 0.92/(-1.26)*0.2 = .0145 or about 1.5 percent (on export costs) However, the worsened state of other infrastructure could have more than offset this reduction in transactions costs of trade. Unlike the situation with regulatory environment, Peru’s port infrastructures did not improve relative to the APEC average.
E-business/service sector infrastructure improvements
The set of survey questions changed significantly between the benchmark survey year and the current-dated survey year. Accordingly, new data for both years were constructed to evaluate progress on e-business/service sector infrastructure as a part of the trade facilitation effort. The data used include Internet hosts per 10,000 and PCs per 1000. Based on these measures, Peru improved some 0.5 to 1 unit, and substantially more than APEC economies in its income group. So, these improvements to information technology connectivity might have reduced transaction costs of trade some = 0.5 to 1* 0.73/(-1/26)*0.2 = 0.0058 to 0.116 or about 6 to 12 percent (on import costs)
= 0.5 to 1 * 1.94/(-1/26)*0.2 = 0.153 to 0.306 or about 15 to 30 percent (on export costs)
Summary For Peru, improvements in core trade facilitation indicators that have taken place since the benchmark year in the areas of customs and conformity with international agreements might have reduced transactions costs of trade some 11 percent, with benefits coming through both customs and standards and conformance, on both the export and import side. Lapses in domestic regulatory environment may well have eroded some of these benefits, however. With respect to infrastructure improvements, improvements to airport infrastructure are small, and have probably been eroded by deterioration in port infrastructure. Improvements to measures of information technology as a proxy for e-commerce and services have been dramatic and may have reduced transactions costs of trade by a very large amount. The fact that the matched survey questions are very limited should make one wary of the results for e-commerce.

28
The conclusion for Peru is that improvements in trade facilitation indicators may well have yielded substantially lower trade costs. There remain important policy improvements in the area of domestic regulatory environment to cement those gains. Future improvements to port infrastructures could reduce trade costs even more. The Case of a Middle Income APEC Economy This is a case of a middle-income APEC economy with improvements in many aspects of trade facilitation. In the area of customs, this economy improved in the area of transparency, but did not improve in other areas of customs environment (hidden barriers and irregular payments). It is notable that the rest of the APEC members did improve in these last two areas. On balance, the customs environment may have deteriorated by about 1/3 of a unit. The increase in trade transactions costs associated with this 1/3 unit deterioration could be 2 percent.
With respect to standards and conformation, this middle-income economy on balance improved both the domestic regulatory environment and conformance to international agreements on the order of 0.75 of a unit. With respect to transactions costs of export trade, this middle-income economy may have reduced costs some 3 percent. On the import side, the superior standards and conformance may have reduced transactions costs of trade some 7 percent for a total of 10 percent reduction in transactions costs of trade. This middle-income economy improved both air and sea port infrastructure by perhaps 0.5 unit, according to the surveys. The improvement in port infrastructure might have reduced this economy’s transactions costs of trade some 2 percent via lower import costs, and 7 percent via lower export costs. This middle-income economy improved some 0.5 to 1 unit on the metrics of information technology. These improvements might have reduced transaction costs of trade some 6-12 on the import side and 15-30 percent on the export side. All told for this middle income economy, improvements in core trade facilitation indicators that have taken place since the benchmark year in the areas of standards and conformance might have reduced transactions costs of trade some 10 percent, with the bulk of the benefits occurring through lower priced imports. Lapses in certain components of the customs environment might have eroded some of these benefits. With respect to infrastructure improvements, dramatic improvements to port infrastructure further reduce transactions costs, with, once again, major gains on lower costs imports. Improvements to measures of information technology as a proxy for e-commerce and services have been dramatic and may have reduced transactions costs of trade by a very large amount. The conclusion for this middle-income economy is that, improvements in trade facilitation indicators, especially standards and conformance and port infrastructure, may well have yielded substantially lower trade costs. There remain important policy improvements in the area of customs environment to cement those gains. The Case of a High-Income APEC Economy This is a case of a high-income APEC economy with some areas of improvement and other areas where high survey scores limit ‘improvement,’ at least as scored this way. In the area of customs, this economy had very small changes in the customs environment.
With respect to standards and conformation, trade facilitation in this area deteriorated modestly in the case of the domestic regulatory environment and moderately in the area of conformance to international agreements. All told, with respect to standards and conformance, the deterioration might be on the order of 0.5 of a unit. With respect to transactions costs of export trade, this high-

29
income economy may have increased its transactions costs some 2 percent on the export side, and some 5 percent on the import side for a total of some 7 percent increase in transactions costs of trade. This high-income economy improved both air and sea port infrastructure by perhaps 1/3 unit, according to the surveys. The improvement in port infrastructure might have reduced this economy’s transactions costs of trade some 2 percent via lower import costs, and 5 percent via lower export costs. This high-income economy improved at least 1 unit on the metrics of information technology. These improvements might have reduced transaction costs of trade some 12 percent on the import side and 30 percent on the export side. All told for this high-income economy, deterioration in core trade facilitation indicators in the area of standards and conformance that have taken place since the benchmark year may well have offset reductions in trade transactions costs coming from improved port infrastructures. 7. CONCLUSION This paper has outlined issues and a methodology for benchmarking of trade facilitation status in an economy, quantification of trade facilitation effort by an economy, and translation of such effort into financial terms. The research project addresses issues relating to the construction of trade facilitation indicators, and presents new sources of data for these indicators. The report shows how to use data to construct trade facilitation indicators that are consistent and comparable among the APEC economies, which allows members to benchmark and quantify their trade facilitation efforts. The project then develops a new methodology that takes trade facilitation indicators and estimated parameters from other sources to yield a relationship between a ‘unit’ of improvement in a specific trade facilitation indicator and a reduction in trade costs. Finally, the report discusses how to use the economy-specific inputs to the trade facilitation indicators to relate the reduction in trade costs to specific policy measures. This shows the viability of the methodology for APEC and its membership as a tool to gauge progress toward the Shanghai goal.
31
APPENDIX: WORKSHEETS ON SOURCES FOR TRADE FACILITATION INDICATORS See accompanying three files on sources for proxies for inputs for the three core trade facilitation indicators—customs, standards and conformance, and business mobility. For proxies as inputs to indicators of port infrastructure and of e-business infrastructure, see the sources detailed in WMO (2004a and 2004b).

33
APPENDIX I: BUSINESS MOBILITY MATRIX
Economy Visa Category Coverage Duration Process Time Fee Required Documents, in addition to relevant forms
Eligible Economies
Australia BUSINESS ETA (ELECTRONIC TRAVEL AUTHORITY)
Bona fide business persons to visit Australia to conduct business such as a conference, negotiation or an exploratory business visit.
Up to three months ETA is available from any travel agent or your airline reservation desk. The agent will simply type your passport details into their computer reservation system and will obtain your authority to enter Australia within seconds.
None Passport Andorra, EU, EEA, Brunei, Hong Kong, China; Japan; Malaysia; Singapore; Korea; Chinese Taipei; USA
SHORT STAY BUSINESS VISA (SUBCLASS 456)
Bona fide business persons to visit Australia to conduct business such as attend a conference, meetings or negotiations, or explore business opportunities. A single-entry or multiple-entry visa may be issued.
For up to three months
An average of 4 weeks for processing
Fee of US$45 (as of 1 July 2003) payable by cashiers cheque, money order or credit card. Personal cheques are not accepted.
Valid and signed passport for each person included on the application. Evidence of onward travel bookings from Australia, i.e. travel itinerary from a travel agent or airline. A letter from your employer (on business letterhead) providing details of your business trip: the nature of the business, length of stay, business contact names, address and contact telephone number. A statement from your company guaranteeing full financial responsibility for your stay in Australia. While the above items are not required documents, they do help us to quickly and fairly evaluate your application and we therefore recommend that they are included with your application. Failure to do so, may delay the processing of your application.
All
LONG STAY BUSINESS VISA (SUBCLASS 457)
Primarily intended for persons and their families who have been sponsored by an Australian organisation to work in Australia on a temporary basis (i.e. up to 4 years).
4 years An average of 4 weeks for processing
Fee of US$113 (as of 1 July 2003) payable by cashiers cheque, money order or credit card. Personal
Valid and signed passport for each person included on the application. Please be sure to include your original passport.• Completed Form 160 - Radiological Report with attached passport-sized photo for each person included on the application aged 16
All

34
Economy Visa Category Coverage Duration Process Time Fee Required Documents, in addition to relevant forms
Eligible Economies
The visa also provides for the temporary entry of people wishing to establish or operate a business in Australia and for certain other employment-related purposes.
cheques are not accepted
years or older for any applicant who intends a twelve month to four year stay. Adults who plan to work in a classroom, healthcare, or hospitality setting will need to complete both Forms 160 and 26, regardless of their length of stay.• A copy of the business nomination approval letter provided to your prospective employer from the Department of Immigration and Multicultural and Indigenous Affairs office in Australia.• Original or notarised copies of the Birth Certificate for all members of the family less than 18 years of age included on the application.• Original or notarised copy of Marriage Certificate.• Original or notarised copy of final divorce decree or legal separation agreement, and any child custody documents. Where there are visitation rights, a court order or notarised permission from the non-travelling parent is required.• Completed Form 26 - Medical Examination with attached passport-sized photo for each person under 16 who will be attending school or childcare.
Brunei Darussalam
General Class - no particular business visa
Unknown 14-30days Unknown, or upon arrival
Varies Persons entering Brunei Darussalam to take up employment must arrange with their employers to obtain employment passes prior to their arrival. Details unclear
German, Malaysian, The Sultanate of Oman, Singapore, Korea, British nationals with the right of abode in the U.K. and New Zealand nationals are exempted from the requirement to obtain a visa for visits not exceeding 30 days. Visas are also waived for visits of not more than 14 days for nationals of Belgium,
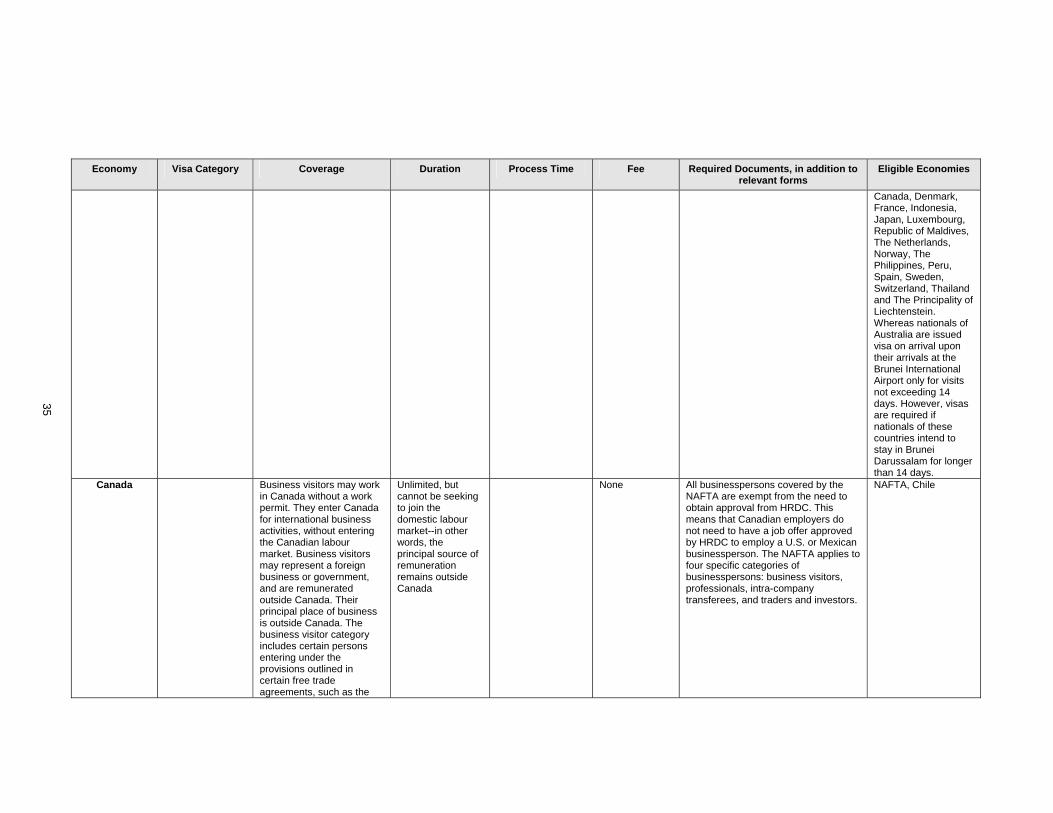
35
Economy Visa Category Coverage Duration Process Time Fee Required Documents, in addition to relevant forms
Eligible Economies
Canada, Denmark, France, Indonesia, Japan, Luxembourg, Republic of Maldives, The Netherlands, Norway, The Philippines, Peru, Spain, Sweden, Switzerland, Thailand and The Principality of Liechtenstein. Whereas nationals of Australia are issued visa on arrival upon their arrivals at the Brunei International Airport only for visits not exceeding 14 days. However, visas are required if nationals of these countries intend to stay in Brunei Darussalam for longer than 14 days.
Canada Business visitors may work in Canada without a work permit. They enter Canada for international business activities, without entering the Canadian labour market. Business visitors may represent a foreign business or government, and are remunerated outside Canada. Their principal place of business is outside Canada. The business visitor category includes certain persons entering under the provisions outlined in certain free trade agreements, such as the
Unlimited, but cannot be seeking to join the domestic labour market--in other words, the principal source of remuneration remains outside Canada
None All businesspersons covered by the NAFTA are exempt from the need to obtain approval from HRDC. This means that Canadian employers do not need to have a job offer approved by HRDC to employ a U.S. or Mexican businessperson. The NAFTA applies to four specific categories of businesspersons: business visitors, professionals, intra-company transferees, and traders and investors.
NAFTA, Chile

36
Economy Visa Category Coverage Duration Process Time Fee Required Documents, in addition to relevant forms
Eligible Economies
North American Free Trade Agreement (NAFTA), the Canada-Chile Free Trade Agreement (CCFTA) and the General Agreement on Trade in Services (GATS).
Chile NA USA citizens traveling on tourism or on business trips are allowed to enter Chile without a visa
90 days, renewable in Chile
None S100 US Passport US
Working Visa Work 2 years Unknown $100 Proof of financial security, a contract approved by the Consular Division, Chilean Ministry of Foreign Affairs, signed by both, the employer -or his representative in Chile- and the applicant, and certified by a Chilean Notary. In addition, a certified true copy of college degree or letter of previous employers in the same field of work is needed.
All
China Business Visit (F) Visa
An alien who is invited to China for a visit, an investigation, a lecture, to do business, scientific-technological and culture exchanges, short-term advanced studies or intern practice
6months/12months The regular processing time is 4 working days. For express service, additional fees of $30 for 1 working day processing, and $20 for 2-3 working days processing will be charged.
Single Entry: $30 (US citizens $50); double entry: $45, ($75); Multiple Entry for 6months $60 ($100); Multiple Entry for 12months $90 ($120)
Passport, an invitation letter from the host company or unit in China. To apply for a Multiple Entry (L) Visa, the applicant shall meet the following requirements: (1) The applicant shall submit a visa notification issued by the authorized Chinese unit, which specifies the validity, number of entries and duration of stay for the visa application; or (2) The applicant has made an investment in China and shall submit the original and photocopy of the Chinese business license carrying the name of the applicant (The original one will be returned after checking); or (3) The applicant is in a position of management in an American company which has a subsidiary in China. H(4) The applicant has visited China at least twice with the (F) visa within the past 12 months and shall submit a copy of the visa and an invitation letter from China; ore/she shall submit an application letter from the American
All

37
Economy Visa Category Coverage Duration Process Time Fee Required Documents, in addition to relevant forms
Eligible Economies
company and an invitation letter from the Chinese subsidiary company; or(5) The applicant need to visit China frequently in order to execute contracts signed with a Chinese company, and shall submit the original and photocopy of the contract (The original one will be returned after checking).
Employment/Work (Z) Visa
An alien who comes to China for a post or employment
( Z ) visa is valid for one entry, three months.
The regular processing time is 4 working days. For express service, additional fees of $30 for 1 working day processing, and $20 for 2-3 working days processing will be charged.
$50 for American, and $30 for Citizens of other countries.
Passport, A visa notification issued by the authorized Chinese unit, and a Work Permit for Aliens issued by the Chinese Labor Ministry/ Foreign Expert's License issued by the Chinese Foreign Expert Bureau.
All
Hong Kong, China
Work any person coming to Hong Kong for the purpose of education, taking up employment, training, investment or residence.
Varies It normally takes 4 to 6 weeks to process an entry visa application
$135 Various information and supporting documents are required for different types of visa application (i.e. for employment, training, investment, education or residence).
All
Indonesia Single Visit Visa This visa is valid for the purposes of doing business activities in Indonesia, which do not involve taking up employment or acquiring money for payments of services. It is valid for conducting a temporary business assignment, i.e. inspecting company subsidiaries and carrying out emergency/urgent works. It is also valid for attending international conferences and seminars and carrying out journalistic visits.
60 days Varies None Letter of recommendation from the sponsor in the country of origin or the sponsor in Indonesia; Guarantee of the availability of funds to cover living expenses while in Indonesia;Proof of availability of a return ticket or ticket for forward journey.
49 countries - assumed to cover all APEC
Limited Stay Visa To invest in Indonesia, to work as an expert at a government or private
1 year Varies None Letters of recommendation from the technical department, the Department of Manpower, and the Investment
All
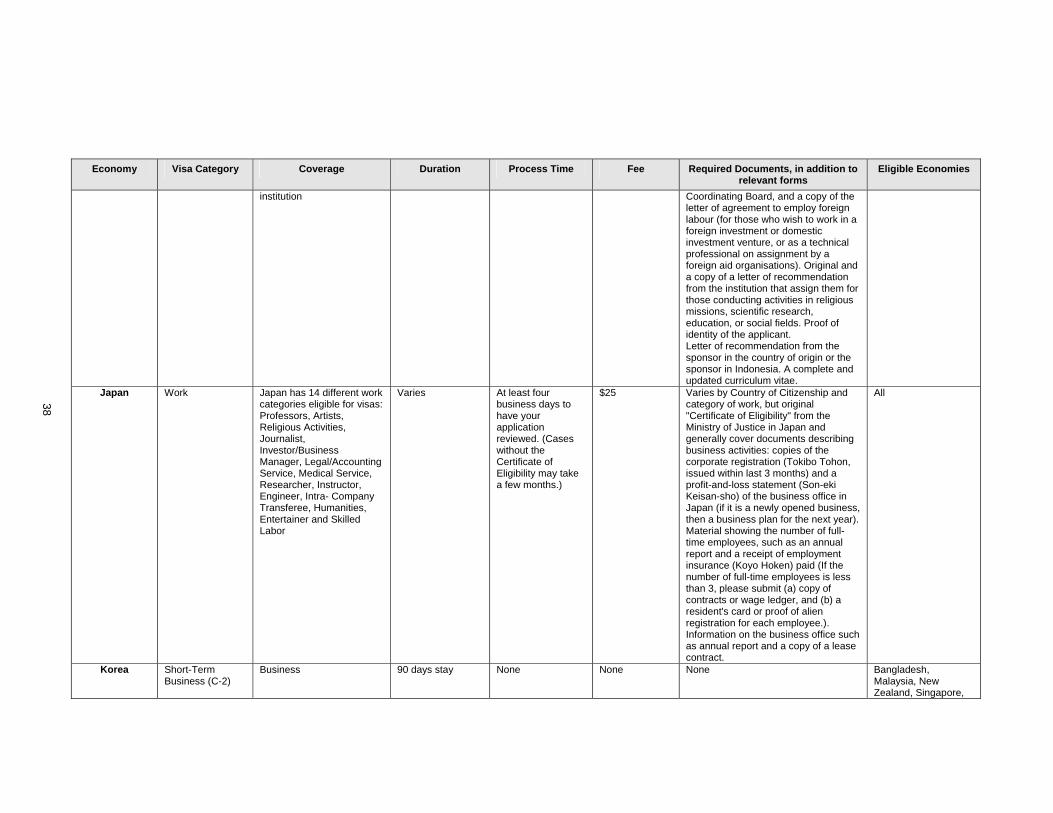
38
Economy Visa Category Coverage Duration Process Time Fee Required Documents, in addition to relevant forms
Eligible Economies
institution Coordinating Board, and a copy of the letter of agreement to employ foreign labour (for those who wish to work in a foreign investment or domestic investment venture, or as a technical professional on assignment by a foreign aid organisations). Original and a copy of a letter of recommendation from the institution that assign them for those conducting activities in religious missions, scientific research, education, or social fields. Proof of identity of the applicant. Letter of recommendation from the sponsor in the country of origin or the sponsor in Indonesia. A complete and updated curriculum vitae.
Japan Work Japan has 14 different work categories eligible for visas: Professors, Artists, Religious Activities, Journalist, Investor/Business Manager, Legal/Accounting Service, Medical Service, Researcher, Instructor, Engineer, Intra- Company Transferee, Humanities, Entertainer and Skilled Labor
Varies At least four business days to have your application reviewed. (Cases without the Certificate of Eligibility may take a few months.)
$25 Varies by Country of Citizenship and category of work, but original "Certificate of Eligibility" from the Ministry of Justice in Japan and generally cover documents describing business activities: copies of the corporate registration (Tokibo Tohon, issued within last 3 months) and a profit-and-loss statement (Son-eki Keisan-sho) of the business office in Japan (if it is a newly opened business, then a business plan for the next year). Material showing the number of full-time employees, such as an annual report and a receipt of employment insurance (Koyo Hoken) paid (If the number of full-time employees is less than 3, please submit (a) copy of contracts or wage ledger, and (b) a resident's card or proof of alien registration for each employee.). Information on the business office such as annual report and a copy of a lease contract.
All
Korea Short-Term Business (C-2)
Business 90 days stay None None None Bangladesh, Malaysia, New Zealand, Singapore,

39
Economy Visa Category Coverage Duration Process Time Fee Required Documents, in addition to relevant forms
Eligible Economies
Thailand, Israel, Antigua & Barbuda, Bahamas, Barbados, Colombia, Commonwealth of Dominica, Costa Rica, Dominican Republic, Grenada, Haiti, Jamaica, Mexico, Nicaragua, Peru, Panama, Brazil, El Salvador, St. Lucia, St. Kitts-Nevis, St. Vincent & the Grenadines, Surinam, Trinided & Tobago, Lesotho, Liberia, Morocco, Tunisia, Austria, Belgium, Bulgaria, Czech Republic, Denmark, Estonia, Finland, France, Germany, Greece, Hungary, Iceland, Ireland, Italy, Liechtenstein, Luxembourg, Malta, Norway, Poland, Portugal, Rumania, Spain, Slovakia, Sweden, Switzerland, The Netherlands, United Kingdom, Turkey
Short-Term Employment (C-4)
Business multiple entry, 90 days stay
Processing time for a visa (for us citizens only) is 24 hours, with no exceptions.
$45 visa-processing fee for U.S. citizens, otherwise Single entry visa for a stay of no more than 90 days : $30, Single entry visa for a stay of
Letter of employment contract. Letter of employment recommendation issued by the head of the relevant central government agency (an entertainer needs a letter of performance recommendation issued by the Image Stuff Classification Committee), an official letter from the relevant government agency or documents proving the necessity of
US Citizens, Australia, Philippines, Peru, Britain, Sweden, Spain, Italy, Thailand, Japan, Chinese Taipei

40
Economy Visa Category Coverage Duration Process Time Fee Required Documents, in addition to relevant forms
Eligible Economies
more than 90 days : $50, Multiple entry visa : $80
employment
Intracompany Transferees (D-7)
Business Multiple entry, up to 5 years
Temporary duty order or statement of employment, Copy of certificate of setting up branch office or liason office, Documents proving achievement of business fund borrowing or copy of business project, Certificate of annual tax
US Citizens, Australia, Philippines, Peru, Britain, Sweden, Spain, Italy, Thailand, Japan, Chinese Taipei
Treaty Investors (D-8)
Business Multiple entry, up to 5 years
Temporary duty order or statement of employment, Certificate of foreigner's investment report, including copy of register book or certificate business registration, Certificate of registered investment company
US Citizens, Australia, Philippines, Peru, Britain, Sweden, Spain, Italy, Thailand, Japan, Chinese Taipei
Treaty Traders (D-9)
Business Multiple entry, up to 5 years
Statement of employment, Copy of register book or certificate of business registration, Document regarding business fund borrowing or copy of business project, Receipt of annual tax-payment
US Citizens, Australia, Philippines, Peru, Britain, Sweden, Spain, Italy, Thailand, Japan, Chinese Taipei
Malaysia Business Entry Business Australia 3months, Canada 3 months, Brunei 1month, Chile 1month, Indinesia 1month, Japan 3months, Mexico 1month, New Zealand 3months, Peru 3months, Philippines 1month, Russia 1 month, Singapore 1month, Korea 3months, Thailand 1month, US 3months, PNG 1month, Hong Kong 1month
None None Passport Selected economies
VWTR - Visa Without
business China 14days On Arrival On Arrival Posses confirm air ticket back to country of origin or current residing
Almost all economies
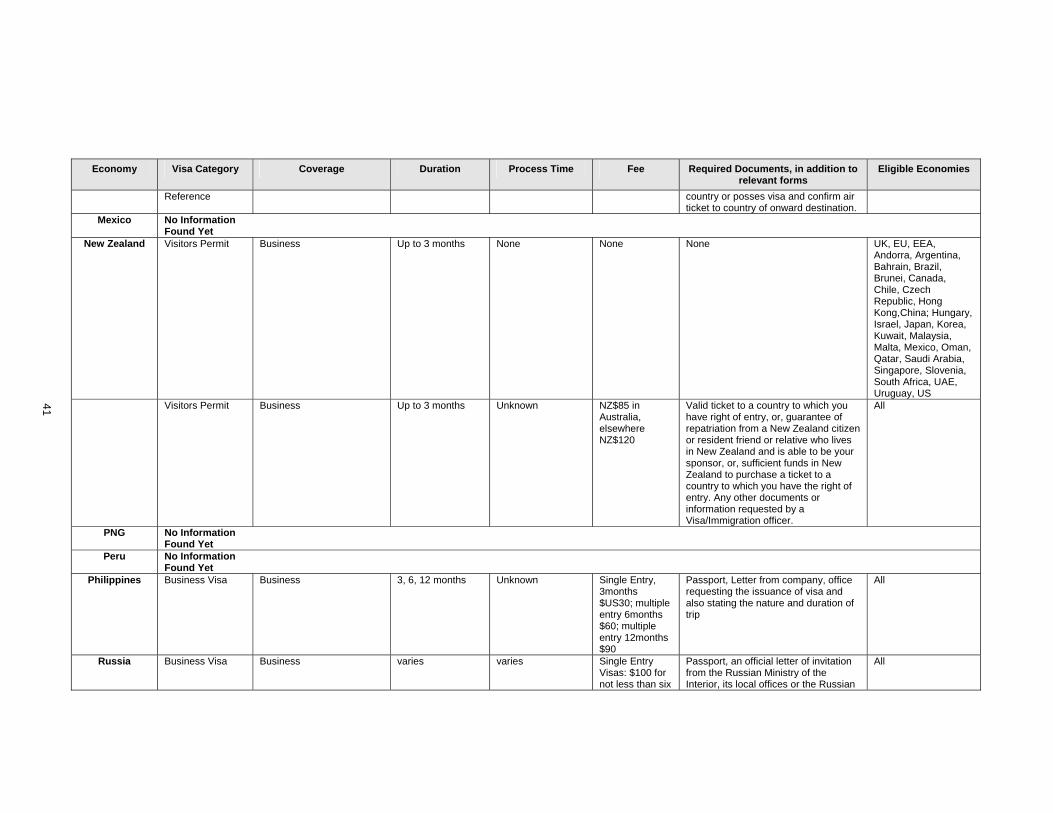
41
Economy Visa Category Coverage Duration Process Time Fee Required Documents, in addition to relevant forms
Eligible Economies
Reference country or posses visa and confirm air ticket to country of onward destination.
Mexico No Information Found Yet
New Zealand Visitors Permit Business Up to 3 months None None None UK, EU, EEA, Andorra, Argentina, Bahrain, Brazil, Brunei, Canada, Chile, Czech Republic, Hong Kong,China; Hungary, Israel, Japan, Korea, Kuwait, Malaysia, Malta, Mexico, Oman, Qatar, Saudi Arabia, Singapore, Slovenia, South Africa, UAE, Uruguay, US
Visitors Permit Business Up to 3 months Unknown NZ$85 in Australia, elsewhere NZ$120
Valid ticket to a country to which you have right of entry, or, guarantee of repatriation from a New Zealand citizen or resident friend or relative who lives in New Zealand and is able to be your sponsor, or, sufficient funds in New Zealand to purchase a ticket to a country to which you have the right of entry. Any other documents or information requested by a Visa/Immigration officer.
All
PNG No Information Found Yet
Peru No Information Found Yet
Philippines Business Visa Business 3, 6, 12 months Unknown Single Entry, 3months $US30; multiple entry 6months $60; multiple entry 12months $90
Passport, Letter from company, office requesting the issuance of visa and also stating the nature and duration of trip
All
Russia Business Visa Business varies varies Single Entry Visas: $100 for not less than six
Passport, an official letter of invitation from the Russian Ministry of the Interior, its local offices or the Russian
All

42
Economy Visa Category Coverage Duration Process Time Fee Required Documents, in addition to relevant forms
Eligible Economies
business days processing; $150 for not less than three business days processing; $200 for next/two business days processing; $300 for same day processing. Double Entry Visas: $100 for not less than six business days processing; $200 for not less than three business days processing; $250 for next/two business days processing; $350 for same day processing. Multiple Entry Visas: $100 for not less than six business days processing; $300 for not less than three business days processing; $350 for next/two business days processing; $450 for same day processing.
Foreign Ministry, its regional representatives, or any other authorized Russian agency. The letter must contain: official seal and legal address of the agency, document registration number, date of registration, signature and name of an authorized official, travel itinerary, dates of stay, names of persons invited. If you apply for a visa valid for more than 3 months you must submit HIV Test (AIDS) Certificate. A cover letter from your company (or from yourself if you are traveling individually) with information about the traveler, destination, terms and purpose of the trip. Any visa applicant may be interviewed by a consular officer if necessary. All US male citizens age 16-45 are required to fill out a supplement (form 95) to the standard application form.
Singapore PROFESSIONAL VISIT PASS
To conduct or participate in conferences, seminars,
Six weeks or longer.
Unknown Applicants must provide the name, designation/title, address and
All
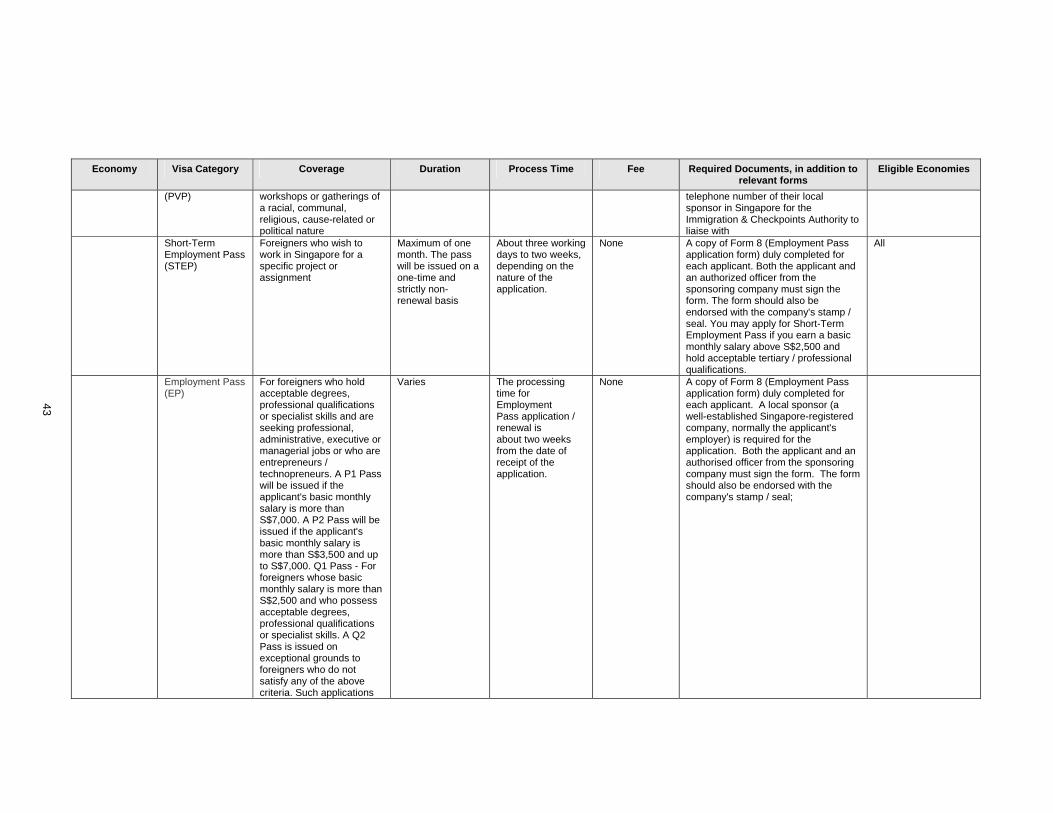
43
Economy Visa Category Coverage Duration Process Time Fee Required Documents, in addition to relevant forms
Eligible Economies
(PVP) workshops or gatherings of a racial, communal, religious, cause-related or political nature
telephone number of their local sponsor in Singapore for the Immigration & Checkpoints Authority to liaise with
Short-Term Employment Pass (STEP)
Foreigners who wish to work in Singapore for a specific project or assignment
Maximum of one month. The pass will be issued on a one-time and strictly non-renewal basis
About three working days to two weeks, depending on the nature of the application.
None A copy of Form 8 (Employment Pass application form) duly completed for each applicant. Both the applicant and an authorized officer from the sponsoring company must sign the form. The form should also be endorsed with the company's stamp / seal. You may apply for Short-Term Employment Pass if you earn a basic monthly salary above S$2,500 and hold acceptable tertiary / professional qualifications.
All
Employment Pass (EP)
For foreigners who hold acceptable degrees, professional qualifications or specialist skills and are seeking professional, administrative, executive or managerial jobs or who are entrepreneurs / technopreneurs. A P1 Pass will be issued if the applicant's basic monthly salary is more than S$7,000. A P2 Pass will be issued if the applicant's basic monthly salary is more than S$3,500 and up to S$7,000. Q1 Pass - For foreigners whose basic monthly salary is more than S$2,500 and who possess acceptable degrees, professional qualifications or specialist skills. A Q2 Pass is issued on exceptional grounds to foreigners who do not satisfy any of the above criteria. Such applications
Varies The processing time for Employment Pass application / renewal is about two weeks from the date of receipt of the application.
None A copy of Form 8 (Employment Pass application form) duly completed for each applicant. A local sponsor (a well-established Singapore-registered company, normally the applicant's employer) is required for the application. Both the applicant and an authorised officer from the sponsoring company must sign the form. The form should also be endorsed with the company's stamp / seal;

44
Economy Visa Category Coverage Duration Process Time Fee Required Documents, in addition to relevant forms
Eligible Economies
will be considered on the merits of each case.
Business Visit Business Up to 30 days Upon Arrival in Singapore
None US Passport, possession of a confirm onward or return air ticket, sufficient funds and entry facilities to the visitor’s ultimate destination.
US Citizens
Chinese Taipei Short-term business visit
All business persons from APEC member economies require a visa to enter Chinese Taipei, except those from Australia, Canada, Japan, New Zealand and the United States, who may enter Chinese Taipei under the visa-exemption program or landing visa scheme.The visa regulations and other relevant information listed here do not apply to business persons from Hong Kong, Macao and the People's Republic of China.
Business persons entering Chinese Taipei under the vis-exemption program are eligible to stay up to 14 days, or under the landing visa program are eligible to stay up to 30 days but no extensions are granted.
Normally 1 to 3 working days except when the application needs further verification.
Single entry visitor visa - NT$1,200 Multiple entry visitor visa -NT$2,400 Landing visa fee - NT$2,000 (For U.S. citizens is NT$3100)
Sponsorship letters from associated companies or other references in Chinese Taipei Certificates verifying the applicant's occupation or job title Other documents verifying the purpose of visit If the applicant meets the requirements listed above, health or finance statements are normally not necessary. Chinese Taipei, however, reserves the right to request documentation or procedures that may not be listed above.
All APEC
Business Residency Permit
Citizens from all APEC economies must obtain a visa to take up temporary residence for business in Chinese Taipei. Foreigners who want to engage in business for a period of less than six months may apply for a visitor visa. Foreigners who want to conduct business in Chinese Taipei for more than six months or to take employment or make investment shall apply for a resident visa. After arrival in Chinese Taipei, the resident visa holders shall apply for Alien Resident Certificates (ARC). Foreign nationals who are
Varies 7 working days or 14 working days for applicants of Chinese origin
The fee for a resident visa is US$66 payable in cash
Official letters of approval of employment or investment from Chinese Taipei authorities concerned, for example, the Ministry of Economic Affairs. A personal interview is not usually required. Within 15 days after arrival in Chinese Taipei, resident visa holders have to report to local police headquarters closest to their place of residence and apply for Alien Resident Certificates.
All APEC
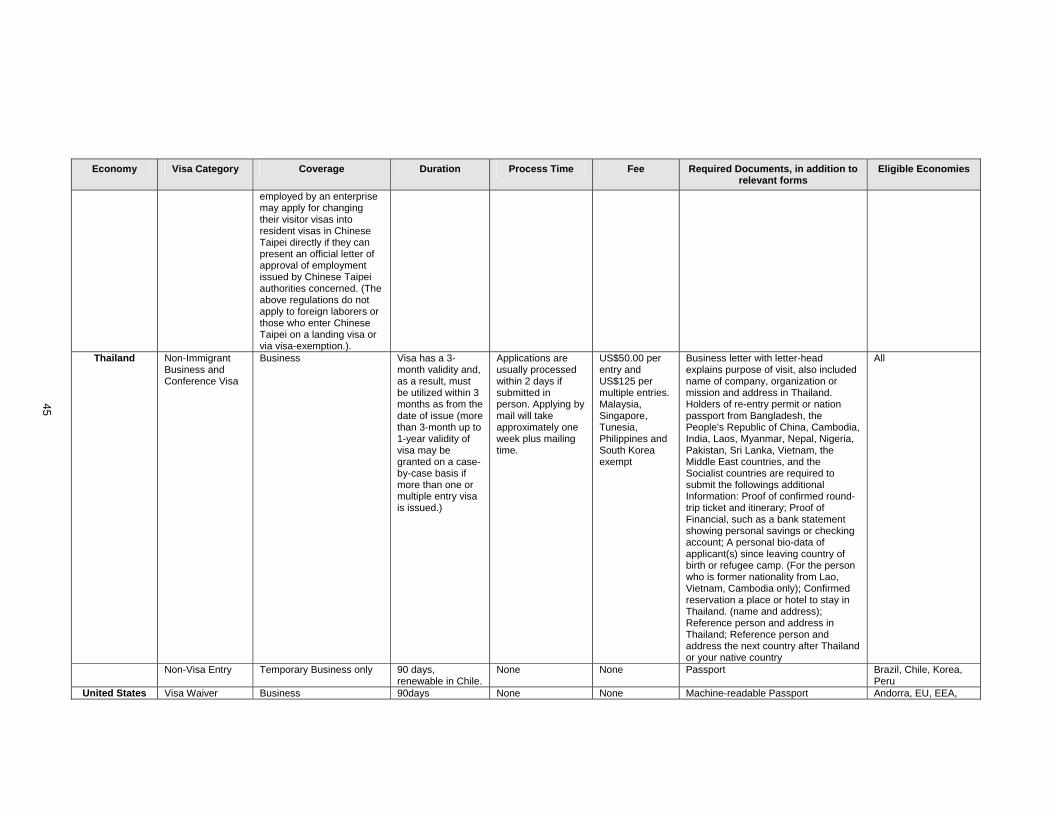
45
Economy Visa Category Coverage Duration Process Time Fee Required Documents, in addition to relevant forms
Eligible Economies
employed by an enterprise may apply for changing their visitor visas into resident visas in Chinese Taipei directly if they can present an official letter of approval of employment issued by Chinese Taipei authorities concerned. (The above regulations do not apply to foreign laborers or those who enter Chinese Taipei on a landing visa or via visa-exemption.).
Thailand Non-Immigrant Business and Conference Visa
Business Visa has a 3-month validity and, as a result, must be utilized within 3 months as from the date of issue (more than 3-month up to 1-year validity of visa may be granted on a case-by-case basis if more than one or multiple entry visa is issued.)
Applications are usually processed within 2 days if submitted in person. Applying by mail will take approximately one week plus mailing time.
US$50.00 per entry and US$125 per multiple entries. Malaysia, Singapore, Tunesia, Philippines and South Korea exempt
Business letter with letter-head explains purpose of visit, also included name of company, organization or mission and address in Thailand. Holders of re-entry permit or nation passport from Bangladesh, the People's Republic of China, Cambodia, India, Laos, Myanmar, Nepal, Nigeria, Pakistan, Sri Lanka, Vietnam, the Middle East countries, and the Socialist countries are required to submit the followings additional Information: Proof of confirmed round-trip ticket and itinerary; Proof of Financial, such as a bank statement showing personal savings or checking account; A personal bio-data of applicant(s) since leaving country of birth or refugee camp. (For the person who is former nationality from Lao, Vietnam, Cambodia only); Confirmed reservation a place or hotel to stay in Thailand. (name and address); Reference person and address in Thailand; Reference person and address the next country after Thailand or your native country
All
Non-Visa Entry Temporary Business only 90 days, renewable in Chile.
None None Passport Brazil, Chile, Korea, Peru
United States Visa Waiver Business 90days None None Machine-readable Passport Andorra, EU, EEA,
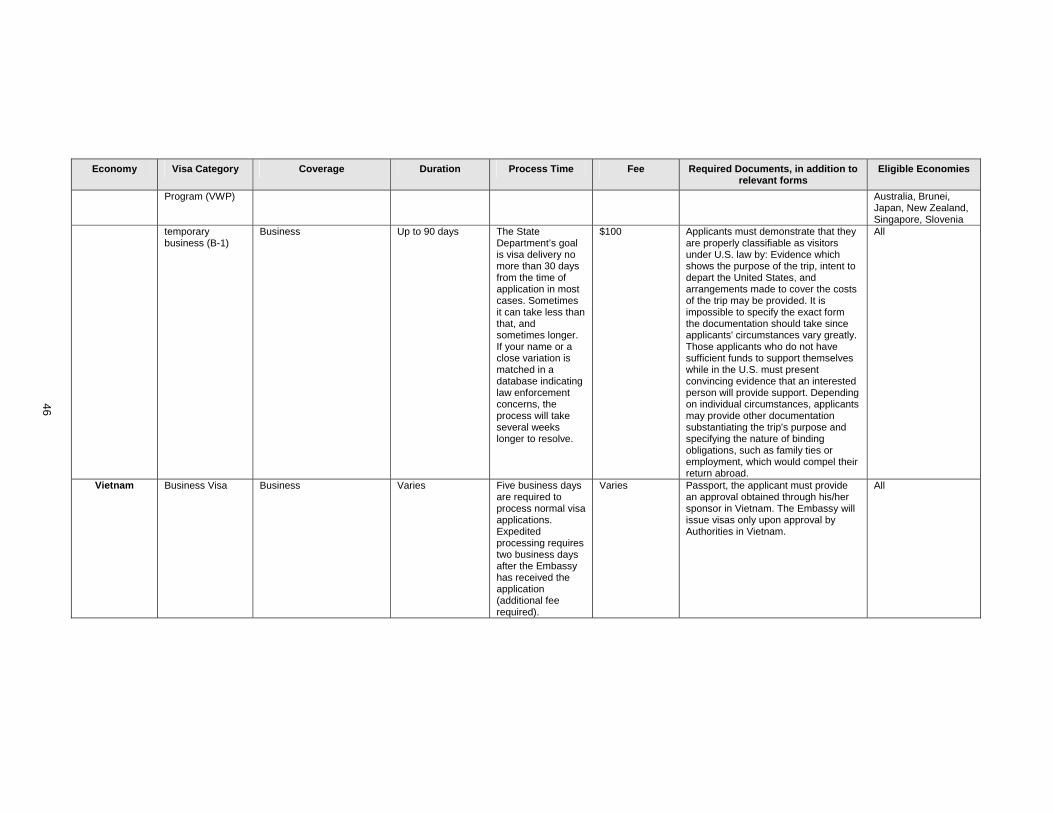
46
Economy Visa Category Coverage Duration Process Time Fee Required Documents, in addition to relevant forms
Eligible Economies
Program (VWP) Australia, Brunei, Japan, New Zealand, Singapore, Slovenia
temporary business (B-1)
Business Up to 90 days The State Department’s goal is visa delivery no more than 30 days from the time of application in most cases. Sometimes it can take less than that, and sometimes longer. If your name or a close variation is matched in a database indicating law enforcement concerns, the process will take several weeks longer to resolve.
$100 Applicants must demonstrate that they are properly classifiable as visitors under U.S. law by: Evidence which shows the purpose of the trip, intent to depart the United States, and arrangements made to cover the costs of the trip may be provided. It is impossible to specify the exact form the documentation should take since applicants' circumstances vary greatly. Those applicants who do not have sufficient funds to support themselves while in the U.S. must present convincing evidence that an interested person will provide support. Depending on individual circumstances, applicants may provide other documentation substantiating the trip's purpose and specifying the nature of binding obligations, such as family ties or employment, which would compel their return abroad.
All
Vietnam Business Visa Business Varies Five business days are required to process normal visa applications. Expedited processing requires two business days after the Embassy has received the application (additional fee required).
Varies Passport, the applicant must provide an approval obtained through his/her sponsor in Vietnam. The Embassy will issue visas only upon approval by Authorities in Vietnam.
All

47
APPENDIX II: CUSTOMS MATRIX
CATEGORY SUB-CATEGORY INDICATORS NOTES/SOURCES DIFFICULTY IN QUANTIFYING
(Low, Med, High) Total clearance time from entry to release (Port, Airport, Road)
Import waiting time (days) Export waiting time (days) Customs clearing time (days)
UNCTAD - Avg clearance transaction in developing countries involves 27-30 parties, 40 documents, 200 data elements, and re-keying of 60-70% of data at least once.
Parties involved Single Electronic Window available?
(Y/N) If not, number of parties involved
and/or number of stops required
Overall indicators “Border process quality indicator” Port efficiency indicator
Wilson, Mann, Otsuki Port – Global Competitiveness Report of the World Economic Forum
Costs and fees Pre-arrival – 1) Preparation time
including documentary credit checks, certificates of origin, etc; 2) Number of documents required in advance; 3) Deadline for documentation – number of days prior to arrival
Import fees ($) Agent fees or “unofficial charges”
(i.e. bribery) ($) Dispute and delay costs (in $ and
days)
GFPTT: Trade and Transportation Facilitation
CU
STO
MS
Use of risk assessment techniques and audit-based controls
Physical inspections (percent of all containers inspected)
Average fee per declaration
Gov’t of India, MOF (Warning signals include high import duty, imports from a country other than country of manufacture, related party transactions)
CU
STO
MS
(Con
t’d)
Border procedures
Valuation procedures Follows WTO Valuation Agreement or
some form of transaction-based valuation (Y/N)
WCO

48
CATEGORY SUB-CATEGORY INDICATORS NOTES/SOURCES DIFFICULTY IN QUANTIFYING
(Low, Med, High) Physical infrastructure
Recent Economic Developments in Infrastructure (REDI) Assessment
World Bank Priority Performance Indicators on road condition and infrastructure
World Bank Transport World Bank Port Reform Toolkit World Bank Railways Database
Delay (days) Transit time Border crossing delay Transfer time
Costs ($/ton) Transit time Border crossing delay Transfer time
Total loss in value
Up to 6% of transport time in some European countries
Monopoly of service providers (insurance, handling, etc.)
Number of providers available Percent privatized Cost per ton of handling a container Mandatory port restrictions (0-1
index) describing extent to which services are mandatory for incoming ships
Cargo handling restrictions (0-1 index) describing restrictions on foreign providers of cargo handling services
Patrick Messerlin and Jamel Zarrouk Port and cargo index – Fink, Mattoo, Neagu 2000
Movement of goods
Other hurdles Limited transit access (e.g.borders
with no transit access to trucks, causing multiple unloading and reloading of goods)
Payment options available – cash, credit card, bank check, transfers
Uma Subramanian: “South Asia Transport: Issues and Options”

49
CATEGORY SUB-CATEGORY INDICATORS NOTES/SOURCES DIFFICULTY IN QUANTIFYING
(Low, Med, High)
Forms: Transparency and ease of completion
Requirements: Number of forms to be filled or time
required Copies required Documentation requirements (e.g
other paperwork, stamps, licenses) Number of signatures required
Use of E-commerce/Automation
Amount of time spent re-keying information
Degree of connectivity and interchange between government agencies
Use of selectivity filters for further examination (random, profile)
Automation of the following: Data entry – use of WCO codes for
commodity types, product types, etc. Approval, excise-tariff allocation, and
payment
World Bank: Information Technology and World Trade Facilitation
Adherence to International Data Nomenclature
Percent of Harmonized System used
Temporary Entry of Products
Temporary Import Bond (TIB) accepted? (Y/N)
Validity of period in days Extension possible? (Y/N) Length of extension in days
International Exhibition Logistics Associates (IELA)
CU
STO
MS
(Con
t’d)
Professionalism and Efficiency of Personnel
Efficiency: Trade volume/staff Declarations/staff Cost/declaration Tax revenue collected/declaration
Competency: Number of hours in training Error rate (error per hundred
applications)
GFP TTFSE Indicators
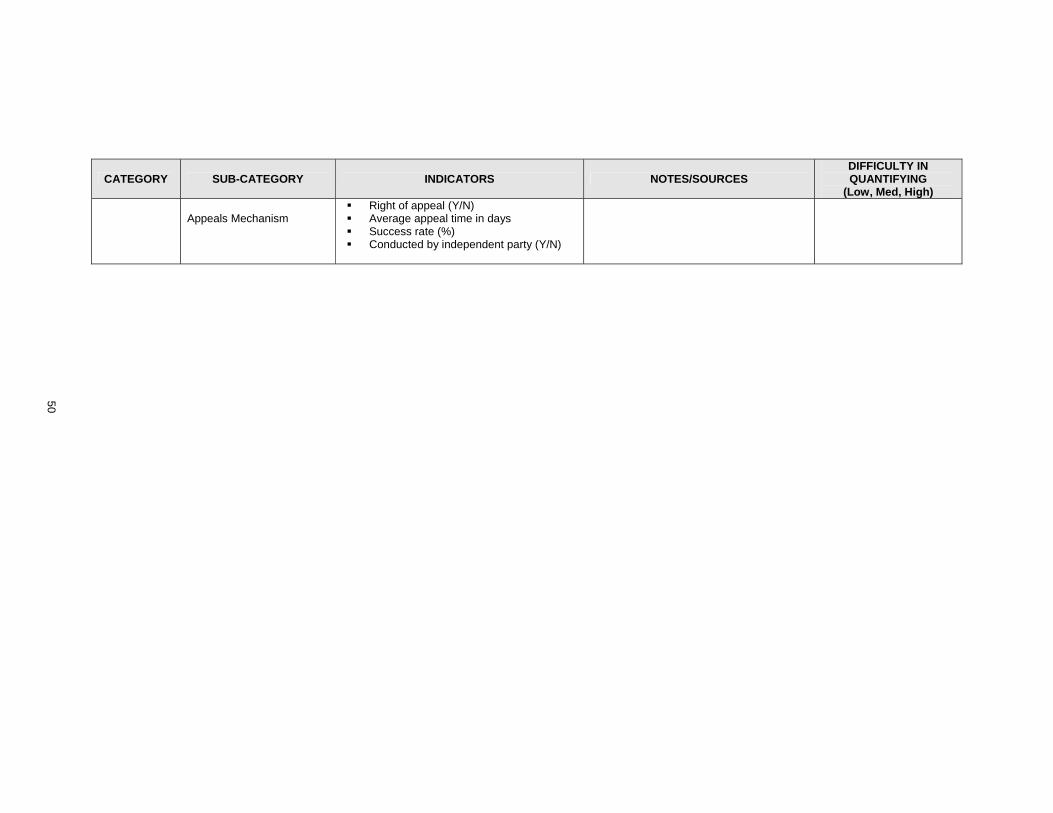
50
CATEGORY SUB-CATEGORY INDICATORS NOTES/SOURCES DIFFICULTY IN QUANTIFYING
(Low, Med, High)
Appeals Mechanism Right of appeal (Y/N) Average appeal time in days Success rate (%) Conducted by independent party (Y/N)
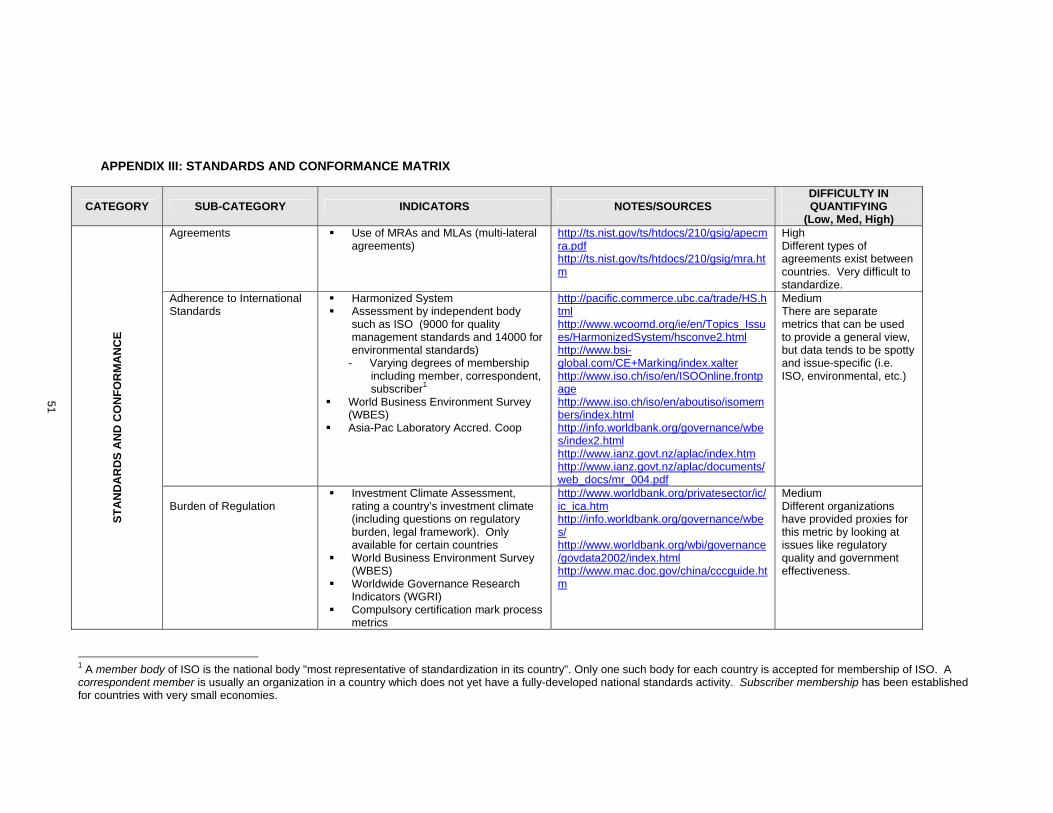
51
APPENDIX III: STANDARDS AND CONFORMANCE MATRIX
CATEGORY SUB-CATEGORY INDICATORS NOTES/SOURCES DIFFICULTY IN QUANTIFYING
(Low, Med, High) Agreements Use of MRAs and MLAs (multi-lateral
agreements)
http://ts.nist.gov/ts/htdocs/210/gsig/apecmra.pdf http://ts.nist.gov/ts/htdocs/210/gsig/mra.htm
High Different types of agreements exist between countries. Very difficult to standardize.
Adherence to International Standards
Harmonized System Assessment by independent body
such as ISO (9000 for quality management standards and 14000 for environmental standards)
- Varying degrees of membership including member, correspondent, subscriber1
World Business Environment Survey (WBES)
Asia-Pac Laboratory Accred. Coop
http://pacific.commerce.ubc.ca/trade/HS.html http://www.wcoomd.org/ie/en/Topics_Issues/HarmonizedSystem/hsconve2.html http://www.bsi-global.com/CE+Marking/index.xalter http://www.iso.ch/iso/en/ISOOnline.frontpage http://www.iso.ch/iso/en/aboutiso/isomembers/index.html http://info.worldbank.org/governance/wbes/index2.html http://www.ianz.govt.nz/aplac/index.htm http://www.ianz.govt.nz/aplac/documents/web_docs/mr_004.pdf
Medium There are separate metrics that can be used to provide a general view, but data tends to be spotty and issue-specific (i.e. ISO, environmental, etc.)
STA
ND
AR
DS
AN
D C
ON
FOR
MA
NC
E
Burden of Regulation
Investment Climate Assessment, rating a country’s investment climate (including questions on regulatory burden, legal framework). Only available for certain countries
World Business Environment Survey (WBES)
Worldwide Governance Research Indicators (WGRI)
Compulsory certification mark process metrics
http://www.worldbank.org/privatesector/ic/ic_ica.htm http://info.worldbank.org/governance/wbes/ http://www.worldbank.org/wbi/governance/govdata2002/index.html http://www.mac.doc.gov/china/cccguide.htm
Medium Different organizations have provided proxies for this metric by looking at issues like regulatory quality and government effectiveness.
1 A member body of ISO is the national body "most representative of standardization in its country". Only one such body for each country is accepted for membership of ISO. A correspondent member is usually an organization in a country which does not yet have a fully-developed national standards activity. Subscriber membership has been established for countries with very small economies.
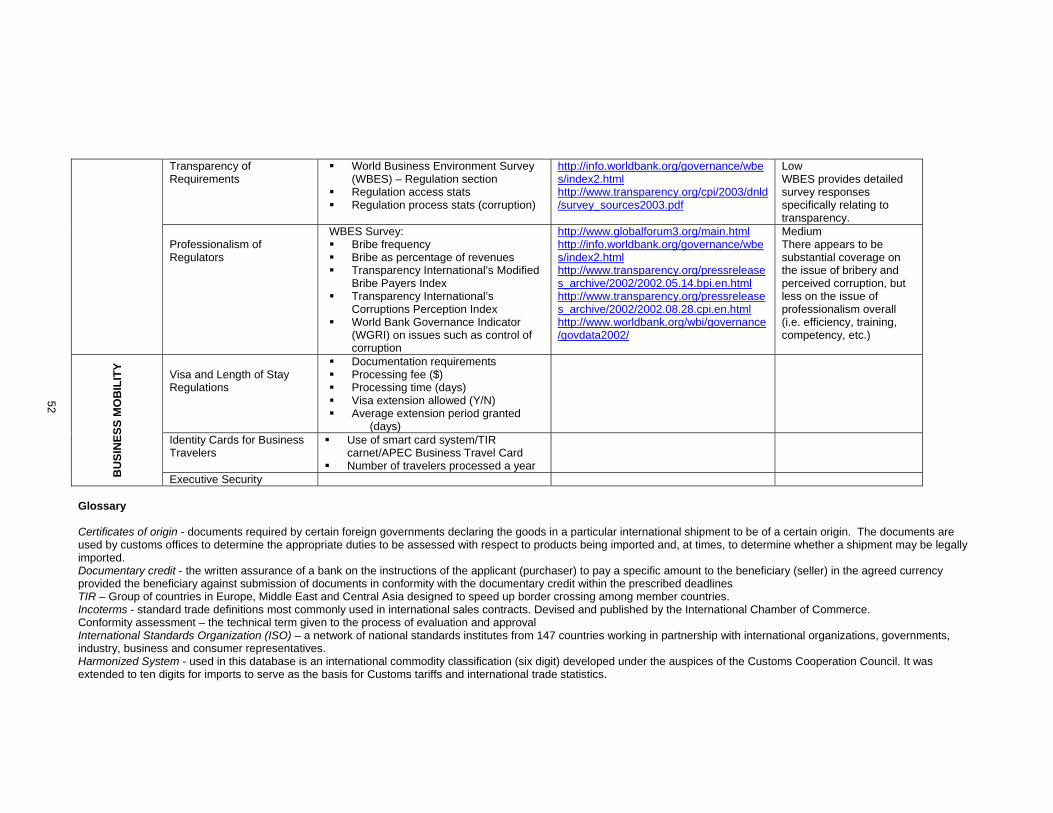
52
Transparency of Requirements
World Business Environment Survey (WBES) – Regulation section
Regulation access stats Regulation process stats (corruption)
http://info.worldbank.org/governance/wbes/index2.html http://www.transparency.org/cpi/2003/dnld/survey_sources2003.pdf
Low WBES provides detailed survey responses specifically relating to transparency.
Professionalism of Regulators
WBES Survey: Bribe frequency Bribe as percentage of revenues Transparency International’s Modified
Bribe Payers Index Transparency International’s
Corruptions Perception Index World Bank Governance Indicator
(WGRI) on issues such as control of corruption
http://www.globalforum3.org/main.html http://info.worldbank.org/governance/wbes/index2.html http://www.transparency.org/pressreleases_archive/2002/2002.05.14.bpi.en.html http://www.transparency.org/pressreleases_archive/2002/2002.08.28.cpi.en.html http://www.worldbank.org/wbi/governance/govdata2002/
Medium There appears to be substantial coverage on the issue of bribery and perceived corruption, but less on the issue of professionalism overall (i.e. efficiency, training, competency, etc.)
Visa and Length of Stay Regulations
Documentation requirements Processing fee ($) Processing time (days) Visa extension allowed (Y/N) Average extension period granted
(days)
Identity Cards for Business Travelers
Use of smart card system/TIR carnet/APEC Business Travel Card
Number of travelers processed a year
BU
SIN
ESS
MO
BIL
ITY
Executive Security Glossary Certificates of origin - documents required by certain foreign governments declaring the goods in a particular international shipment to be of a certain origin. The documents are used by customs offices to determine the appropriate duties to be assessed with respect to products being imported and, at times, to determine whether a shipment may be legally imported. Documentary credit - the written assurance of a bank on the instructions of the applicant (purchaser) to pay a specific amount to the beneficiary (seller) in the agreed currency provided the beneficiary against submission of documents in conformity with the documentary credit within the prescribed deadlines TIR – Group of countries in Europe, Middle East and Central Asia designed to speed up border crossing among member countries. Incoterms - standard trade definitions most commonly used in international sales contracts. Devised and published by the International Chamber of Commerce. Conformity assessment – the technical term given to the process of evaluation and approval International Standards Organization (ISO) – a network of national standards institutes from 147 countries working in partnership with international organizations, governments, industry, business and consumer representatives. Harmonized System - used in this database is an international commodity classification (six digit) developed under the auspices of the Customs Cooperation Council. It was extended to ten digits for imports to serve as the basis for Customs tariffs and international trade statistics.
MEASURING THE IMPACT OF APEC TRADE FACILITATION:
A GRAVITY ANALYSIS

53
MEASURING THE IMPACT OF APEC TRADE FACILITATION: A GRAVITY ANALYSIS∗ EXECUTIVE SUMMARY A further development in worldwide trade cooperation was seen by the significantly lowered tariff barriers, which resulted from the successful conclusion of the Uruguay Round and reinforced by regional trade arrangements. As a complementary policy measure, the WTO, World Bank and APEC, among others, are actively discussing trade liberalization in order to minimize trade costs between economies and improve social welfare internationally through a reduction in non-tariff trade barriers. In this regard, trade facilitation can be considered a way to achieve economic prosperity along with increases in welfare by continuously liberalizing trade. Furthermore, compared to tariff reduction among trade bloc members, trade facilitation reduces the problem caused by the “spaghetti bowl phenomenon.” It also makes it easier for members to open toward nonmembers thereby satisfying APEC’s commitment to “open regionalism.” When we take into account imported intermediate goods and specific sectors such as agriculture, we believe that trade facilitation can be an important engine of trade liberalization among participating economies. Relatively greater ease, to include “substantially all trade”, in the case of trade facilitation also satisfies Article XXIV of GATT. Recognizing potential gains from improved trade facilitation at the institutional level, APEC Leaders gathered in Shanghai in 2001 and reaffirmed the importance of trade facilitation by setting goals to reduce transaction costs by 5 percent across the APEC region by 2006. Since then, APEC’s efforts to enhance trade facilitation have emerged as an important engine for expanding regional trade to achieve the Bogor Goals. At the same time, this policy coincides with the WTO’s movement toward globalization against proliferating discriminatory regional trade arrangements. As a follow-up activity to the leaders’ instruction, we undertook a quantitative analysis of the economic effects produced by improvements in trade facilitation between APEC member economies as an alternative policy proposal to tariff reduction. Adopting the methodology introduced by Wilson, Mann, and Otsuki (2003) and developed by Kim and Park (2004), we attempted to estimate the effect of trade facilitation on trade costs in APEC economies by quantifying the degree of trade facilitation in each of the APEC economies by using survey results in APEC (2002) and KBE indicators contained in the 2003 APEC Economic Outlook Report. Then we measured the net trade creation effect of trade facilitation among APEC economies with a Gravity regression analysis. Furthermore, as an experimental case study, we applied the methodology developed here to a hypothetical Northeast Asian free trade area (FTA between China, Korea, and Japan). In addition to a Gravity regression analysis for the hypothetical Northeast Asian FTA, we estimated the effect of trade facilitation between the three Northeast Asian economies on its intra-regional trade volume by using import price elasticities between the three economies. This case study endeavours to provide an example of utilizing the methodology developed and suggest ways for each of the APEC economies to utilize for its own policy analysis. Our findings show that the trade creation effect of tariff reduction is stronger than that of trade facilitation. However, we also found that the trade creation effect of improvements in trade facilitation measures can be an effective policy alternative to supplement tariff reduction policy. Trade facilitation and the lowering of import tariffs by the same percentage have a different effect. When APEC economies reduce import tariffs by 10 percent, the intra-APEC imports will increase from the minimum 2.1 percent to the maximum 2.2 percent whereas improved trade facilitation by
∗ Paper presented at the APEC EC Committee Meeting on 1 October 2004 at Santiago in Chile. This paper was written by Drs. Sangkyom Kim, Hongshik Lee, and Innwon Park. Sangkyom Kim and Hongshik Lee are Research Fellows at Korea Institute for International Economic Policy (KIEP) and Innwon Park is a Professor at Korea University.

54
10 percent will boost the intra-APEC imports by 0.5 percent, 0.6 percent, 1.1 percent, and 1.5 percent in the area of customs procedures (CP), information and communication technology (ICT), business mobility (BM), and standard and conformity (SC), respectively. Moreover, if we improve trade facilitation in the four areas at the same time, the impact on intra-regional APEC imports will overpass that of tariff reduction. For the case of the sub-regional trade liberalization in APEC through enhanced trade facilitation in the Northeast Asian region, we found that the trade creation effect of tariff reduction is much stronger than that of trade facilitation similar to the case of APEC as a whole. That is, when a economy in the region reduces import tariffs by 10 percent, imports from the neighboring economies increase between the minimum 2.6 percent and the maximum 8.6 percent, whereas improved trade facilitation by 10 percent boosts intra-regional imports by a minimum 1.1 percent in the case of BM, and maximum 5.9 percent in the case of ICT. Another interesting finding is that the average trade creation effect of trade liberalization through either tariff reduction or trade facilitation between Northeast Asian economies are much stronger than those for APEC economies as a whole. Of course, it does not mean that the overall trade creation effect of trade liberalization in the Northeast Asian regional level is much higher than that of the APEC level. In conclusion, our findings indicate that a significantly positive trade creation effect of improvements in trade facilitation measures, make APEC’s effort for better trade facilitation an effective policy alternative to a complement tariff reduction policy.
55
1. INTRODUCTION Evaluating the worldwide effort for trade cooperation, the emergence and expansion of North American Free Trade Agreement (NAFTA) and ASEAN Free Trade Area (AFTA) and the creation of the Economic and Monetary Union of Europe (EMU), have led to a widespread lowering of tariff barriers. Tariffs were partially abolished after the conclusion of the Uruguay Round, however, the effectiveness of the Uruguay Round has been exhausted. As a complementary policy measure, the WTO, World Bank and APEC, among others, are actively discussing trade liberalization to minimize costs between economies, and to improve social welfare internationally through a reduction in non-tariff trade barriers. That is, while complementing the successful completion of the Uruguay Round, trade facilitation, as one of important measures to reduce non-tariff trade barriers, is considered a way to achieve economic prosperity along with increases in welfare, by continuously liberalizing trade. Furthermore, compared to tariff reduction among trade bloc members, trade facilitation reduces the problem caused by the “spaghetti bowl phenomenon”1, and makes it easier for members to be open toward nonmembers, thereby satisfying APEC’s commitment to open regionalism. When we take into account imported intermediate goods and specific sectors such as agriculture, we believe that trade facilitation can serve as an alternative policy instrument. While some argue that the difficulties in accessing agricultural products arise from health—not cost—considerations, such views need not detract from the case for trade facilitation. By creating a climate of relatively greater ease to include “substantially all trade” in the case of trade facilitation, also satisfies Article XXIV of GATT.2 Recognizing the potential gains from improved trade facilitation at the institutional level, APEC Leaders gathered in Shanghai in 2001 and reaffirmed the importance of trade facilitation by setting goals to reduce transaction costs by 5 percent across the APEC region by 2006. Since then, APEC’s efforts to enhance trade facilitation have emerged as an important engine for expanding regional trade to achieve the Bogor Goals. At the same time, this policy coincides with the WTO’s movement toward globalization against proliferating discriminatory regional trade arrangements (RTA). Responding to the leaders’ agreement, Kim and Park (2001), APEC (2002), Wilson, Mann, and Otsuki (2003), and Kim and Park (2004) undertook studies to estimate the possible impact of trade facilitation either on APEC economies or on Northeast Asian economies. From their empirical findings, they emphasize that trade facilitation could be an alternative or complementary policy measure to eliminating tariff barriers for maximizing gains from trade liberalization. They strongly suggest that regional efforts for trade liberalization should stress trade facilitation, as well as following common guidelines on tariff reduction. Trade facilitation measures such as enhanced customs procedures, standardization, free mobility of business people, and implementing information and communication technology can be used to promote trade among economies in the region, as well as between regions, by drastically reducing the transaction costs incurred in the process of international trade. In particular, Kim and Park (2004) argue that this method is more effective for integrating Northeast Asian regional economies including Korea, China, and Japan in a freer trade area. This study is an extension of Kim and Park’s (2004) study at the APEC level in order to: Highlight the importance of trade facilitation compared to trade liberalization through tariff
reduction, Introduce a methodology that APEC member economies could use to assess the trade
creation effect of APEC trade facilitation Help APEC assess the implications of the reduced transaction costs through trade facilitation
on their economic growth and trade There have been quite a few studies elaborating the importance of trade facilitation. However, the existing empirical analyses of trade facilitation at the aggregate macroeconomic level are still 1 See Bhagwati, Greenaway, and Panagariya (1998). 2 For more detailed information, see Lee and Park (2003).

56
limited because of the difficulty in measuring the quantitative relationship between trade facilitation and trade costs. Adopting the methodology introduced by Wilson, Mann, and Otsuki (2003) and developed by Kim and Park (2004), we will attempt to estimate the effect of trade facilitation on trade costs in APEC economies by quantifying the degree of trade facilitation in each of the APEC economies. We will then measure the possible impact of trade facilitation on those economies with a Gravity regression analysis. By doing so, we will attempt to analyze the net trade creation effect of trade facilitation among APEC economies. Following this introductory section, Section II briefly explains the theoretical relationship between trade facilitation, trade costs, and gains or losses from freer trade through trade facilitation. Section II also summarizes existing empirical studies on the impacts of trade facilitation. Section III specifies the methodology we adopt to quantify the impact of enhancing trade facilitation and the Gravity equation used in this study, and evaluates the empirical results from the Gravity analysis. In Section IV, we undertake a case study on a possible Northeast Asian free trade area (FTA between Korea, China, and Japan) by emphasizing the important role of trade facilitation. In addition to the Gravity analysis for the Northeast Asian case, a partial equilibrium analysis is experimented with in order to estimate the effect of trade facilitation between the three Northeast Asian economies on its intra-regional trade volume by using import price elasticities between the three economies. Section IV can be viewed as an example of utilizing the methodology developed in this research, and suggests ways for each of the APEC economies to utilize the research for its own policy analysis. We summarize our findings in Section V. 2. TRADE FACILITATION: THEORY AND PRACTICE3 In this section, we attempt to formalize the concept of trade facilitation, which strongly complements trade liberalization, and examine the linkage between trade facilitation, trade costs, and gains from freer and easier trade. 2.1 Trade Facilitation and International Trade: Theoretical Linkage A. Concept of Trade Facilitation Trade facilitation can be defined as an effort to pursue greater ‘convenience’ in international trade through the simplification of economic activities, such as the movement of goods and services across borders.4 In a broad sense, it can be defined as the lowering or elimination of non-tariff barriers. More specifically, it is an attempt to lower the costs of administration, standardization, technology, information, transaction, labor, communication, insurance and financing, as well as reducing the time costs related to these procedures.5 The administration costs arise during customs procedures. The technology costs are involved during standards procedure, and information costs arise while importing or exporting goods and services. All these costs result in the loss of economic efficiency and reduce gains from trade. B. Trade Costs and Trade Facilitation Assuming that total costs related to international trade are equivalent to the price differences between world market prices of imported goods and domestic consumer prices, we can define these as trade costs. In this context trade costs can be divided into three categories. First, there are transaction costs that consist of transport costs and insurance costs. Second, there are policy costs that are mainly incurred by protection policies such as tariff and non-tariff trade barriers.6 Finally, there is a trade cost due to the lack of trade facilitation. Therefore, trade facilitation improves importing economies’ welfare by narrowing the gap between the world market price and the domestic price of the imported goods, which leads to an increase in the volume of world trade.
3 Summarized and updated from APEC (2002) and Kim and Park (2004). 4 See WTO (2001). 5 We focus on four main areas of trade facilitation in this study: customs procedures, standards and conformity, mobility of business people, and information and communication technology. 6 We treat the trade costs incurred by the lack of trade facilitation separately from the non-tariff barriers.

57
C. Gains from Trade Facilitation The development of information and communication technology (ICT), along with great efforts to liberalize trade, has brought about a considerable reduction in transaction and policy costs. At the same time, due to developments in information and communication technology and increases in e-commerce as well as efforts7 to increase efficiency in customs procedures have caused facilitation costs to fall. However, this reduction in facilitation costs has been highlighted recently and is only a small fraction of the reduction in transaction and policy costs. It is believed that there is still plenty of room for additional reductions in facilitation costs that can lead to a remarkable improvement in the world trade environment. The expected gains from trade facilitation are as follows. First, similar to tariff reductions, trade facilitation induces a fall in trade costs. It will create trade and increase gains from freer and easier trade. Second, trade facilitation will reduce the opportunity costs of international specialization. This will increase outsourcing opportunities and expand the fragmentation of production activities across borders. Welfare will improve through this process. In particular, the expansion of outsourcing and transfer of technology across borders will assist in the industrialization of developing economies. Third, trade facilitation may improve the government’s efficiency in administration and may enhance transparency. In addition to these anticipated benefits, the government revenue may increase from customs procedure-related activities. Fourth, trade facilitation will reduce the possibility of international disputes between developed and developing economies arising from differences in customs procedures and operating systems. This will reduce the costs of resolving disputes and lead to an increase in world trade. Fifth, trade facilitation will help small and medium enterprises (SMEs), especially in developing economies, to become more quickly exposed to the global market. This will, in turn, produce greater gains from trade, promising economic growth in developing economies. In addition, trade facilitation can be easily pushed forward since it has the characteristics of a public good, and if applied non-exclusively, it satisfies the fundamental ideas of the WTO and is consistent with APEC open regionalism. On the other hand, there are some costs incurred through trade facilitation. Higher implementing costs are expected. Legal and structural infrastructures must be set up prior to carrying out trade facilitation, and the amount of skilled labor must be enlarged through continuous education and training. There is also a huge amount of fixed cost involved in obtaining capital and facilities, which are required for improving the system. A discrepancy in standards among the participating economies is also expected. In reality, it will be very difficult to harmonize the differences in customs procedures, systems, infrastructure, labor standards, and safety and technology when each economy is in a different phase of development. In addition, there is a difficulty in measuring effectiveness. Unlike trade liberalization, there are limitations8 on obtaining statistical evidence for trade facilitation with trade costs. This makes it difficult to carry out a cost-benefit analysis, thus creating a political burden for policymakers to push any trade facilitation-related policy forward without a quantitative estimation of the expected effect. 2.2 Trade Facilitation: Empirical Evidences Found Trade facilitation leads to a reduction in trade costs, which leads to an increase in the volume of world trade. This results in an increase in real GDP and welfare. The most important factor in determining the relationship between trade facilitation and macro aggregate variables such as GDP is trade cost. APEC (2002) concisely summarized the existing empirical studies on the relationship, and Kim and Park (2004) updated the information. There have been several studies elaborating the importance of trade facilitation. However, the quantitative analyses of the economic effects at the aggregate macroeconomic level are still limited. In general, four different methods have been introduced to analyze the effect of trade facilitation: survey analysis, Gravity regression analysis, partial equilibrium analysis, and computable general equilibrium (CGE) analysis. 7 See Ministry of Foreign Affairs and Trade (2000). 8 See Wilson (2000).

58
The most widely used method is investigative analysis based on surveys such as Cecchini (1988), Schiavo-Campo (1999), OECD (2000), APFC (2000), Woo and Wilson (2000), Kim and Park (2001), and APEC (2002). Until now, the survey results by Cecchini (1988) and UNCTAD (1992) were used as a reference value to represent the relationship between trade facilitation and trade costs. They found that about 5 percent to 10 percent of total trade value would be saved with better trade facilitation. However, the results obtained in these studies failed to take into account rapid developments in information and communication technology in recent years, and the movement towards globalization after the establishment of the WTO. Addressing such weaknesses in existing studies, Kim and Park (2001) and APEC (2002) attempted to investigate the quantitative relationship between trade costs and trade facilitation in the case of the Korean economy, and in the case of APEC economies respectively. Kim and Park (2001) found that upon an improvement of 50 percent in trade facilitation, transaction costs are reduced from 11.3 percent to 26.5 percent and import price falls between 3.9 percent and 9.6 percent in the case of Korea. For the APEC economies in APEC (2002), the reduced trade costs incurred by 50 percent improvement of trade facilitation will range from 5.8 percent in the case of industrialized APEC economies, 6.2 percent in the case of newly industrialized APEC economies, and 7.7 percent in the case of industrializing APEC economies. Apart from this, there are empirical analyses, which use the gravity model analysis. Baier and Bergstrand (2001) is a corroborated research on the theoretical basis of the use of a gravity model for analyzing the effect of transaction costs. Moenius (1999), Maskus, Wilson, and Otsuki (2001), Wilson, Mann and Otsuki (2003), and Kim and Park’s (2004) studies are specifically for the cases of trade facilitation. In particular, Wilson, Mann and Otsuki (2003) analyzed the relationship between trade facilitation, trade flows and GDP per capita in the Asia-Pacific region by using a Gravity analysis. They found that: enhanced port efficiency has a large and positive effect on trade; regulatory barriers deter trade; and improvements in customs and greater e-business use significantly expands trade, but to a lesser degree than the effects of ports or regulations. They also found that if below-average efficient APEC members improve capacity to half the average level of trade facilitation in APEC, intra-APEC trade volume could increase by US$254 billion, representing approximately a 21 percent increase in intra-APEC trade flows. These improvements in trade facilitation suggest an increase in the APEC average per capita GDP of 4.3 percent by using Dollar and Kraay’s estimate of the effect of trade on per capita GDP. Kim and Park (2004) applied a Gravity analysis to measure the impact of trade facilitation on intra-regional trade between Korea, China, and Japan. They evaluated the coefficients of explanatory variables representing trade costs, and tariff and trade facilitation indices, and found that when a economy reduces import tariffs by 10 percent, imports increase from the neighboring economy between a minimum of 5.4 percent and a maximum 9.6 percent. In contrast, whereas improved trade facilitation by 10 percent boosts the intra-regional import by a minimum of 2.2 percent in the case of information and communication technology, 2.8 percent in the case of customs procedures, 7.2 percent in the case of standards and conformity, and a maximum of 7.4 percent in the case of business mobility. Kim and Park (2001) performed a partial equilibrium model analysis. They found that the 50 percent improvement in trade facilitation expands Korea’s total trade volume by a maximum US$17.9 billion. In APEC (1997 & 1999) and Dee (1998), the effects on macro-aggregate variables based on the CGE model are estimated based on the assumption of a fall in import prices and imports of 2-3 percent and 5 percent, respectively. Recently, APEC (2002) measured the macroeconomic effect of APEC’s trade facilitation effort by combining the survey approach and CGE analysis. According to its findings, the effect of the Shanghai Accord on APEC’s GDP growth will be 0.98 percent (US$154 billion); on average, with Singapore enjoying the biggest gain of 7.65 percent and the United States receiving the smallest gain of 0.32 percent. Moreover, the optimistic case of APEC’s regional trade facilitation multiplies the beneficial effect on APEC’s GDP by 1.3 percent (US$204 billion). Kim and Park (2004) also measured the macroeconomic effect of a possible Northeast Asian FTA between Korea, China, and Japan by using a CGE analysis. They

59
estimated that enhanced trade facilitation by 5 percent would increase real GDP by 0.5 percent, 1.5 percent, and 1.6 percent in Japan, China, and Korea, respectively. 3. GRAVITY REGRESSION ANALYSIS OF TRADE FACILITATION This section attempts to measure the effect of reduced trade costs arising from trade facilitation on intra-regional trade between 15 APEC economies9 by using a gravity regression analysis. As we mentioned earlier, trade costs can be divided into transaction, policy and facilitation costs. In this research, the transaction costs of trade are assumed to be measured by distance and adjacency between trading partners, and policy costs of trade is represented by import tariffs and membership of regional trading arrangements (RTA) between trading partners. The facilitation costs of trade are measured by four indicators of trade facilitation – customs procedures (CP), standards and conformity (SC), business mobility (BM), and information and communication technology (ICT) – that represent the degree of impediment to international trade. For the transaction costs and policy costs of trade, we will follow the traditional Gravity regression analysis. For the quantification of trade facilitation, we adopt the following methods of indexation. 3.1 Quantifying Trade Facilitation Indices For the indexation of trade facilitation costs of trade, we adopt the methodology introduced in Kim and Park (2004). As Kim and Park (2004) did, we also include the above-mentioned four indicators of trade facilitation. A. Indexation of CP, SC, and BM In order to generate the first three trade facilitation indicators, Kim and Park (2004) used survey results from Kim and Park (2001) and APEC (2002). More specifically, for the quantification of the first three trade facilitation indices (CP, SC and BM) for Korea, China, and Japan, they used survey results conducted in Korea, in industrializing APEC economies, and in Japan, respectively. They calculated a separate average expected effect of trade facilitation on transaction cost, import price, and import demand for Korea, China, and Japan10. In this research, for the purpose of overcoming data insufficiency and enhancing statistical significance, the survey outcome of the representing economy or economies in each group is utilized to produce the effects of the trade facilitation in the three groups of APEC. That is, survey results from Japan, Korea, and developing economies11 in APEC are assumed to indicate the degree of trade facilitation for industrialized economies, newly industrialized economies, and industrializing economies in APEC, respectively. For the quantification of the trade facilitation index for each economy in APEC, we divide the 15 APEC member economies into three groups: Industrialized Economies (Australia, Canada, Japan, New Zealand, and the US), Newly Industrialized Economies (Hong Kong, China; Korea; Mexico; and Singapore) and Industrializing Economies (Chile, China, Malaysia, Peru, the Philippines, and Thailand). Table 1 reports the minimum, maximum and median change in transaction cost, import price, and import demand that are caused by the three trade facilitation areas for the three APEC economic
9 Brunei Darussalam, Chinese Taipei, Indonesia, Papua New Guinea, Russia, and Vietnam could not be included due to insufficient data. 10 Kim and Park (2001) and APEC (2002) asked the following three questions: (i) What percent of the total transaction cost of your commodities moving from production site to market place will be saved if APEC economies enhance trade facilitation by 50 percent in each of the following areas – Customs Procedures, Standards and Conformity, and Business Mobility? (ii) Suppose that you are an importer in an APEC economy and your government improves trade facilitation by 50% in each of the following areas – Customs Procedures, Standards and Conformity, and Business Mobility. For example, the custom procedure can be shortened from 2 days to 1 day. What percent of the consumer price of the importable can be reduced? (iii) Suppose that you are an importer in an APEC economy and your government improves trade facilitation by 50% in each of the following areas – Customs Procedures, Standards and Conformity, and Business Mobility. What will be the likely impact of the reduced cost on the demand for the importable? What percent of the consumers’ demand for the importable will rise in terms of volume? 11 Survey conducted in Chile, Indonesia, Malaysia, PNG, Peru, the Philippines, and Thailand.

60
groups. For example, from the survey, we found that importing companies in newly industrialized economies like Korea expect a minimum 2.0 percent increase in import demand if Korea’s customs procedures were improved by 50 percent. Kim and Park (2004) used this figure to represent the degree to which the customs procedures impede trade with their trading partners. That is, a higher expectation of import demand increase reveals larger impediments for importing companies passing through. The trade facilitation indices for the three APEC economic groups are figured in Table 2. The higher the value of the index indicates better trade facilitation incurring cheaper facilitation costs to be paid by importing companies. In order to quantify the index, Kim and Park (2004) calculated the average effect of trade facilitation by taking a simple average of the three different effects on transaction cost, import price, and import demand in each group as shown in Table 2. That is, for each of the three groups (represented by the subscript j), the average effect of the improvement in an area of trade facilitation (represented by the subscript f) is calculated. They also calculate an average effect of trade facilitation by taking an average of the three groups as a base. Then they calculate the relative ratio of each group to the base value. The Equation (1) measures the three trade facilitation indices (TFIfj).
Equation (1) }/)/{(]/)}([{ nIDIPTCmIDIPTCTFI fjfjfjfjfjj
fjfj ++++∑=
where subscripts f and j denote the three areas of trade facilitation (CP, SC, and BM) and the three groups of the APEC economies (Industrialized APEC economies, Newly Industrialized APEC economies, and Industrializing APEC economies), respectively and the variables are defined as: m is number of groups (j), n is number of areas (f), TFI is the trade facilitation index, TC is the effect on transaction costs, IP is the effect on import prices, and ID is the effect on import demands.
B. Indexation of ICT For the quantification of the ICT index, Kim and Park (2004) took KBE (knowledge based economies) indicators for information and communication technology from APEC (2003). Table 3 reports on the KBE indicators in APEC (2003) and the ICT index calculated by Kim and Park (2004). As the first step to quantify the index, they calculated the average level of ICT by taking a simple average of the five different areas of ICT – numbers of mobile telephones, phone lines, and computers per 100 people, and shares of Internet and e-commerce users – in each group, and in APEC as a whole; then they calculated the relative ratio of each group to the APEC average. Higher index values indicate better ICT, which incur lower information costs to be paid by importing companies. C. Economy-specific and Time-variant Indexation of Trade Facilitation Since the trade facilitation indices from the survey results and KBE indicators measure the average effect of each area of trade facilitation among all the APEC economies, the indices may not correctly represent the bilateral trade relationship between each pair of economies in APEC. Therefore, for the bilateral trade facilitation indices over time, CP, SC, BM, and ICT, Kim and Park (2004) calculated a relative ratio of each pair of economies at time t by multiplying the relative trade volume of each importing economy to its average trade volume with all the APEC economies at time t, as shown in Equation (2) below. The same methodology is applied for the calculation of ICT. That is, for the economy-specific and time-variant trade facilitation indices (TFIfijt), they applied the following intra-regional trade concentration weight relative to intra-APEC trade. We apply the same methodology for each of the 15 APEC economies.
Equation (2) fjitijtfijt TFIATVBTVTFI ⋅= )/(
where subscripts t and i (j) denote time and the 15 APEC economies, respectively and the variables are

61
defined as: TFI is the trade facilitation index in Equation (1), BTV is the bilateral trade volume between i and j, and ATV is i’s average trade volume with all the APEC economies.
3.2 Gravity Model We set up a conventional gravity model of international trade in order to analyze the effects of trade liberalization and facilitation on bilateral trade in APEC. We adopted the methods of Glick and Rose (2002) for the empirical specification, and extended the model with a number of extra variables representing the trade costs we mentioned earlier for the analysis stated below. We apply the generalized least squares (GLS) estimation technique for random effects estimation. The random effects estimation assumes that the individual economy-pair effect is a random variable. Equation (3):
ijttijtijtijtijt
ijtijitij
tjijitjiijt
YEARICTBMSCCP
RTABorderTariffDist
PopPopGDPGDPGDPGDPIM
εδββββ
ββββ
βββ
++++++
++++
++=
lnlnlnln
lnln
)/ln()ln()ln(
10987
6543
210
where i and j denote economies, t denotes time, and the variables are defined as: IMijt denotes the average value of import value from j to i at time t, GDPi is real GDP, Popi is population, Distij is the distance between i and j, Tariffit is the tariff rate imposed on import by i at time t, Borderij is a binary variable, which is unity if i and j share a land border, RTAij is a binary variable, which is unity if i and j belong to the same, CPijt is a trade facilitation index of customs procedures from j to i at time t, SCijt is a trade facilitation index of standards and conformity from j to i at time t, BMijt is a trade facilitation index of business mobility from j to i at time t, ICTijt is an index to represent the level of information technology from j to i at time t, YEAR is a set of binary variables, which are unity in the specific year t.
The panel data covers 15 APEC economies from 1988 to 1999, including Australia; Canada; Chile; China; Hong Kong, China; Japan; Korea; Malaysia; Mexico; New Zealand; Peru; Philippines; Singapore; Thailand; and the USA. The estimations use annual data consisting of 2,324 economy pairs in total. Summary statistics for the data used in the estimation are presented in Table 4. The RTA dummy includes the ASEAN FTA (AFTA, including Malaysia, the Philippines, Singapore, and Thailand), the North American Free Trade Agreement (NAFTA), Closer Economic Relations Trade Agreement between Australia and New Zealand (CER), Latin American Integration Association (LAIA, including Chile and Peru), Japan-Singapore New Age Economic Partnership, Korea-Chile FTA, Australia-Singapore FTA (SAFTA), China-Hong Kong Closer Economic Partnership Arrangement (CEPA), Singapore-USA FTA, Singapore-New Zealand Closer Economic Partnership, and NAFTA-Chile FTA. We control for year effects by adding year dummy variables. The distance variable (Dist), tariffs (Tariff), common land border dummy, RTA dummy, and trade facilitation indices (CP, SC, BM, and ICT) represent transaction cost, policy cost and facilitation cost of trade costs in the equation (3). We will analyze the characteristics and relevance of each parameter. First, GDP in pairs, per capita GDP in pairs represent the increase in income in both economies and the parameters β1 and β2 tend to be positive. Second, the bilateral distance and adjacency represent the transaction costs where the coefficient β3 tends to have a negative value and the coefficient β5 tends to have a positive value. Third, the coefficient representing tariff barriers, β4, theoretically tends to be negative. Fourth, we expect positive values of β6 - β10 induced from lower trade costs through enhanced trade liberalization and facilitation.
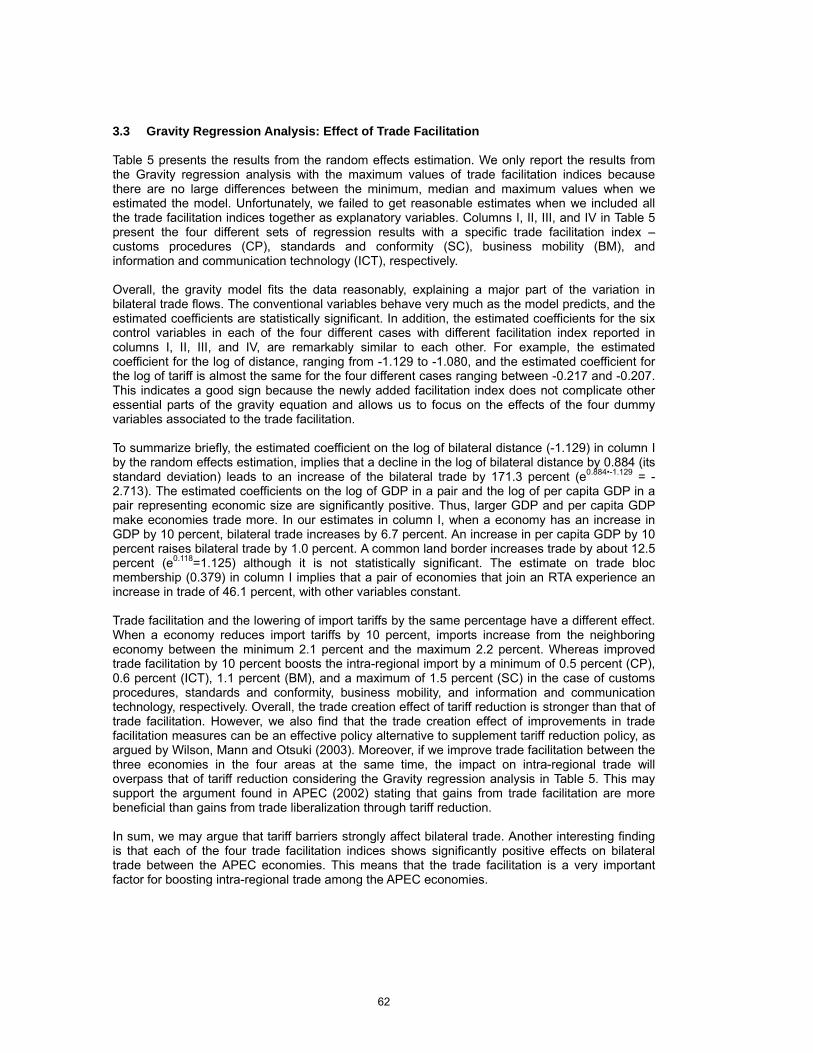
62
3.3 Gravity Regression Analysis: Effect of Trade Facilitation Table 5 presents the results from the random effects estimation. We only report the results from the Gravity regression analysis with the maximum values of trade facilitation indices because there are no large differences between the minimum, median and maximum values when we estimated the model. Unfortunately, we failed to get reasonable estimates when we included all the trade facilitation indices together as explanatory variables. Columns I, II, III, and IV in Table 5 present the four different sets of regression results with a specific trade facilitation index – customs procedures (CP), standards and conformity (SC), business mobility (BM), and information and communication technology (ICT), respectively. Overall, the gravity model fits the data reasonably, explaining a major part of the variation in bilateral trade flows. The conventional variables behave very much as the model predicts, and the estimated coefficients are statistically significant. In addition, the estimated coefficients for the six control variables in each of the four different cases with different facilitation index reported in columns I, II, III, and IV, are remarkably similar to each other. For example, the estimated coefficient for the log of distance, ranging from -1.129 to -1.080, and the estimated coefficient for the log of tariff is almost the same for the four different cases ranging between -0.217 and -0.207. This indicates a good sign because the newly added facilitation index does not complicate other essential parts of the gravity equation and allows us to focus on the effects of the four dummy variables associated to the trade facilitation. To summarize briefly, the estimated coefficient on the log of bilateral distance (-1.129) in column I by the random effects estimation, implies that a decline in the log of bilateral distance by 0.884 (its standard deviation) leads to an increase of the bilateral trade by 171.3 percent (e0.884•-1.129 = - 2.713). The estimated coefficients on the log of GDP in a pair and the log of per capita GDP in a pair representing economic size are significantly positive. Thus, larger GDP and per capita GDP make economies trade more. In our estimates in column I, when a economy has an increase in GDP by 10 percent, bilateral trade increases by 6.7 percent. An increase in per capita GDP by 10 percent raises bilateral trade by 1.0 percent. A common land border increases trade by about 12.5 percent (e0.118=1.125) although it is not statistically significant. The estimate on trade bloc membership (0.379) in column I implies that a pair of economies that join an RTA experience an increase in trade of 46.1 percent, with other variables constant. Trade facilitation and the lowering of import tariffs by the same percentage have a different effect. When a economy reduces import tariffs by 10 percent, imports increase from the neighboring economy between the minimum 2.1 percent and the maximum 2.2 percent. Whereas improved trade facilitation by 10 percent boosts the intra-regional import by a minimum of 0.5 percent (CP), 0.6 percent (ICT), 1.1 percent (BM), and a maximum of 1.5 percent (SC) in the case of customs procedures, standards and conformity, business mobility, and information and communication technology, respectively. Overall, the trade creation effect of tariff reduction is stronger than that of trade facilitation. However, we also find that the trade creation effect of improvements in trade facilitation measures can be an effective policy alternative to supplement tariff reduction policy, as argued by Wilson, Mann and Otsuki (2003). Moreover, if we improve trade facilitation between the three economies in the four areas at the same time, the impact on intra-regional trade will overpass that of tariff reduction considering the Gravity regression analysis in Table 5. This may support the argument found in APEC (2002) stating that gains from trade facilitation are more beneficial than gains from trade liberalization through tariff reduction. In sum, we may argue that tariff barriers strongly affect bilateral trade. Another interesting finding is that each of the four trade facilitation indices shows significantly positive effects on bilateral trade between the APEC economies. This means that the trade facilitation is a very important factor for boosting intra-regional trade among the APEC economies.

63
4. CASE STUDY: A NORTHEAST ASIAN FREE TRADE AREA BETWEEN KOREA, CHINA, AND JAPAN
This section attempts to measure the effect of reduced trade costs arising from trade facilitation on intra-regional trade between the three Northeast Asian economies—Korea, China, and Japan—as an application of the methodology we developed in earlier sections. Following Kim and Park (2004), and modifying the Gravity equation used in Kim and Park (2004), we undertook a case study on the possible Northeast Asian FTA between Korea, China, and Japan by emphasizing the important role of trade facilitation. The three Northeast Asian economies have achieved remarkable economic growth with their export-oriented economic policies. Their experience of economic development is considered to be a model case for many developing and transitional economies. However, this model of economic development has exhibited its share of vulnerability with the 1997 East Asian financial crisis, and is now facing potential disadvantages posed by growing tendencies towards regionalization and globalization in the international trade environment. As a viable solution to how the three Northeast Asian economies might cope with these challenges, we strongly suggest a regional economic cooperation between the economies through improvements in trade facilitation. This case study may be helpfully utilized in each of the APEC economies for its own policy analysis. We used the trade facilitation indices measured by Kim and Park (2004).12 Then we estimated the gravity model in equation (3) in order to analyze the effects of trade liberalization and facilitation on bilateral trade between the three Northeast Asian economies. We modified the model by deleting the common land border dummy and RTA dummy because those variables are not relevant for the three Northeast Asian economies. In addition to the Gravity regression analysis, we experimented with a partial equilibrium analysis to estimate the effect of trade facilitation between the three Northeast Asian economies on its intra-regional trade volume by using import price elasticities between the three economies. By doing so, we may test the validity of the Gravity analysis. 4.1 Measuring the Impact of Trade facilitation in Northeast Asia: Gravity Analysis Same as in the case of APEC in Section III, we applied the GLS estimation technique for random effects estimation. The panel data covers the three East Asian economies for 23 years from 1980 to 2002. The estimations used annual data consisting of 137 economy pairs in total. Table 6 presents the results from the random effects estimation. Similar to the estimation for APEC in Section III, the Gravity model reasonably fits the data, and explains a major part of the variation in bilateral trade flows. The conventional variables behave very much as the model predicted, and the estimated coefficients are statistically significant. To summarize briefly, the estimated coefficients on the economic size are positive, those on the bilateral distance and tariffs are negative, and those on each of the trade facilitation indexes are also positive, as expected. For the estimated coefficients on import tariffs, most of the four different cases show large negative numbers that are statistically significant. Therefore, we may argue that tariff barriers strongly affect the bilateral trade. Each of the four trade facilitation indices also shows significantly positive effects on bilateral trade between the three East Asian economies. This means that trade facilitation is a very important factor for boosting intra-regional trade among the three economies. In evaluating the coefficients of explanatory variables representing trade costs, tariff and trade facilitation indices, we can see that when a economy reduces import tariffs by 10 percent, imports increase from the neighboring economy between the minimum 2.6 percent and the maximum 8.6 percent, whereas improved trade facilitation by 10 percent boosts the intra-regional import by a minimum 1.1 percent in the case of BM, and a maximum 5.9 percent in the case of ICT. Overall, the trade creation effect of a tariff reduction is much stronger than that of trade facilitation in the three Northeast Asian economies cases similar to the case for APEC. 12 As we explained earlier, trade facilitation indices for industrialized and newly industrialized economies came from the survey results conducted in Japan and Korea. Those indices for China are adopted from surveys conducted in industrializing APEC economies.

64
Another interesting finding is that the average trade creation effect of trade liberalization through either tariff reduction or trade facilitation between the Northeast Asian economies, are much stronger than those for APEC economies as a whole when you compare Table 6 with Table 5. Of course, it does not mean that the overall trade creation effect of trade liberalization in the Northeast Asian regional level is much higher than that of the APEC level. For example, an increase in Korea’s bilateral trade with 14 other APEC economies incurred by tariff reduction and/or enhanced trade facilitation may be larger than those created by Korea’s regional free trade with China and Japan. It depends on initial bilateral trade volume with each member of the APEC economies and the size of the coefficients estimated. However, this finding may give us an important policy implication, which is closely related to the ‘natural trading partnership’ argument in international economics.13 If global trade liberalization at the APEC level is not feasible, what would be the best alternative for each of the APEC member economies? One option would be trade liberalization with a limited number of economies in APEC and then a gradual extension of membership. In this case, who will be the likely partners to form the subset of global trade liberalization in APEC? The three Northeast Asian economies can be treated as natural trading partners to each other considering their geographical distance and interdependence in trade and investment. Moreover, the possible FTA between the three Northeast Asian economies may create larger gains from freer trade than in the case that does not consider the characteristics of forming FTA based on evidence we found from this case study. 4.2 Partial Equilibrium Analysis of Trade Facilitation In this section, we quantitatively estimate the effect of trade facilitation on bilateral trade between Korea, Japan, and China with a partial equilibrium analysis. The partial equilibrium analysis uses two different approaches. First, we quantify the relationship between trade facilitation and import price by using a survey analysis reported in Table 1. Second, we estimate the relationship between import price and import volume by using a regression analysis. Then, we combine these two empirical findings to estimate the likely impact of trade facilitation on trade between the three economies in Northeast Asia. (1) Trade Facilitation and Import Price: Survey Analysis As the first step towards measuring the effect of trade facilitation on trade between the three Northeast Asian economies, the effect of trade facilitation on import price will be quantified from the survey results in Kim and Park (2001) and APEC (2002). We took the survey results for the cases of Korea and Japan without any problem. However, since we do not have a survey response from China, we took survey results for industrializing economies of APEC in APEC (2002) as a proxy for China. For the trade facilitation in this section, we only consider the following three areas of trade facilitation – customs procedures, standards and conformity, and mobility of business people. Table 1 reports the minimum, median and maximum percentage change in consumer prices of imports that are caused by trade facilitation in each of the three areas and overall effect if trade facilitation is carried out together in the three areas for each economy at the same time. According to the outcome of the survey, upon improvement of 50 percent in trade facilitation in each of the three areas, the resulting reduction of import prices ranged from the lowest at 0.9 percent in business mobility for Korea, to the highest at 9.0 percent in customs procedures for China. Overall, Korea’s gain from trade facilitation is expected to be about 6.5 percent when we take the median value. For Japan and China, it is expected to be 8.6 percent and 10.7 percent, respectively. (2) Import Price and Import Volume: Regression Analysis For the regression analysis of measuring the import price elasticity between the three economies, the trade matrix is completed in order to observe the trade pattern for the last thirty years, combining the trade data, extracted from the Direction of Trade Statistics by IMF, of those three
13 Wonnacott and Lutz (1989), Summers (1991), Krugman (1993), and Frankel, Stein and Wei (1995) introduced the concept of “natural trading partner” arguing that some characteristics of RTA members can maximize the positive welfare gains from RTAs. On the other hand, Bhagwati and Panagariya (1996) and Krueger (1999) criticized the positive role of natural trading partners for creating welfare gains from RTAs.

65
economies from 1971 to 2002. The export data of the three economies is converted into the real price, based on 1995 to correct the difference between the export price and the import price of the partner economy. This difference is caused from the different methods of calculating the prices and processing the statistical data. The export of one economy is set as the same as the import of another economy in bilateral trade. Therefore, the export of economy A to economy B is the same as the import of economy B from economy A, and the import demand function of economy B can be deduced as follow.14 Equation (4) PBMBA = f (PEXA, PB, YB)
where PB is the domestic price of economy B, MBA is the import volume of economy B coming from economy A, PEXA is the export price of economy A, and YB is the income of economy B.
When we assume there is no monetary illusion, equation (4) can be rewritten as follow: Equation (5) MBA = f (PEXA/PB, YB/PB) Equation (5) explains the simple relation that the import amount of one economy is decided by the relative price of exportable to domestic price, and the real income of an importing economy. In order to analyze the price and income elasticity it is converted into a log linear function as follow: Equation (6) log MBA = log ß0 + ß1 log PB’ + ß2 log YB’ + log u
where ß0, PB’, YB’, and u are constant, real import price, real income, and error term, respectively. In equation (6), MBA is a dependent variable and PB’ and YB’ are explanatory variables. Since the equation is written as a log linear function, ß1, the coefficient of relative export price and ß2, the marginal propensity to imports, respectively mean price elasticity and income elasticity to import demand. On the one hand, with the assumption that the domestic inputs and imported inputs are perfectly substitutable, the rise in income would increase import demand, while the increase in the import price (the export price of economy A) would contract the import demand. Therefore, ß1, the price elasticity to import demand will have a negative sign and ß2, the income elasticity to import demand will have a positive sign. Therefore, if we carry out OLS regression using the model in equation (6), we can estimate the price and the income elasticity between two economies. By applying this method, we can examine the effect that trade facilitation brings. Table 7 reports the price and income elasticity between the three Northeast Asian economies. Although the sample time period between 1971 and 2002 is defined as the maximum period in the estimation for each economy, some adjustments are set, aiming to improve the absence of appropriate data. Trend variable and time lag are added as needed. For most cases of import demands for Korea and Japan (rows indicated as <1>, <3>, <5>, <6> and <7>), the estimated signs of the price and income elasticity are theoretically and statistically acceptable but for China’s import demands (rows indicated as <2> and <4>), the estimates for the price and income elasticity are not statistically significant. As an alternative to improving the statistical significance, we reran China’s import demand for goods coming from all the APEC economies rather than imports from Korea or Japan (row indicated as <7>). (3) Trade Facilitation and Bilateral Trade Trade facilitation between the three Northeast Asian economies reduces the import price of each economy and results in increases in the import volume between the economies. The change in bilateral trade between the three economies is estimated based on the following equation (7). Equation (7) (∆ MBA / MBA) = ß1 • (∆PB’ / PB’) from the equation (6)
14 See Stern, Francis, and Schumacher (1976).

66
The MBA, import to economy B from economy A, is equivalent to EAB, export from economy A to economy B. The ß1 is estimated from the regression analysis in Table 7, the (∆PB’/PB’) is estimated from the survey analysis in Table 1, and the MBA (or EAB) in 1999 are figured in Table 8.15 Table 8 summarizes the trade relationship between the three Northeast Asian economies to help our understanding about trade structure by economy before and after the trade facilitation activated through economic cooperation among the three economies. (4) Effect of Trade Facilitation on Bilateral Trade by Economy Tables 9, 10, and 11 show the effects that improvement in trade facilitation brings on bilateral trade between Korea, Japan, and China when the three economies reduce the non-tariff barriers against each other by 50 percent in each of the three trade facilitation areas (customs procedures, standards and conformity, and business mobility), and in the three areas together at the same time (overall).16 A. Export, Import and Trade Balance between Korea, Japan and China Table 9 shows that Korea’s export to neighboring economies is expected to increase and the additional export amount ranges from the minimum US$1.2 billion (0.82 percent increase in total export) to the maximum US$2.4 billion (1.68 percent increase in total export) if the three economies improve all three trade facilitation areas at the same time. Korea’s import expansion is expected to range from the minimum US$0.9 billion (0.72 percent increase in total import) to the maximum US$2.1 billion (1.72 percent increase in total import). In particular, the overall improvement of trade facilitation among the three economies widens Korea’s trade deficit with Japan (US$7.2 billion in 1999) by a minimum of US$8 million and a maximum of US$352 million, and Korea’s trade surplus (US$5.9 billion in 1999) with China by a minimum of US$320 million and a maximum of US$704 million. Overall, Korea’s trade balance is expected to improve by approximately a minimum of US$0.3 billion and a maximum of US$0.4 billion. The effects of trade facilitation by each of the three areas are also reported in Table 9. Table 10 indicates that Japan’s export to neighboring economies is expected to increase by a minimum of US$1.6 billion (1.11 percent increase in total export) and a maximum of US$3.7 billion (2.59 percent increase in total export) if the three economies improve all three trade facilitation areas at the same time. Japan’s import expansion is expected to range from a minimum of US$2.0 billion (0.64 percent increase in total import) to a maximum of US$3.7 billion (1.18 percent increase in total import). In particular, the overall improvement of trade facilitation among the three economies widens Japan’s trade surplus with Korea (US$7.2 billion in 1999) by a minimum of US$8 million and a maximum of US$352 million, and Japan’s trade deficit (US$8.9 billion in 1999) with China by a minimum of US$284 million and a maximum of US$403 million. Overall, Japan’s trade balance is expected to deteriorate by approximately a minimum of US$0.2 billion and a maximum of US$0.4 billion. However, if we apply the maximum value of the survey result, Japan’s trade surplus is expected to increase by US$0.07 billion. The effects of trade facilitation by each of the three areas are also reported in Table 10. Table 11 indicates that China’s export to the neighboring economies is expected to increase by a minimum of US$1.6 billion (1.16 percent increase in total export) to a maximum of US$3.2 billion (2.23 percent increase in total export) if the three economies improve all three trade facilitation areas at the same time. China’s import expansion is expected to range from a minimum of US$1.6 billion (0.95 percent increase in total import) to a maximum of US$3.6 billion (2.19 percent increase in total import). In particular, the overall improvement of trade facilitation among the three economies widens China’s trade deficit with Korea (US$5.9 billion in 1999) by a minimum of US$320 million and a maximum of US$704 million and China’s trade surplus (US$8.9 billion in 1999) with Japan by a minimum of US$284 million and a maximum of US$403 million. Overall, China’s trade balance is expected to deteriorate by approximately a minimum of US$0.2 billion
15 We use trade data for year 1999 as a base to measure the change in the bilateral trade between the three economies. 16 For the estimated price elasticity in the case of China, we use China’s import demand for APEC’s export goods in Table 7 because of the statistical insignificance mentioned earlier. The effects of trade facilitation by using China’s import demand for the Korean and Japanese export goods are summarized in Appendix Tables 1, 2, and 3 as a reference.

67
and a maximum of US$0.4 billion. However, if we apply the minimum value of the survey result, China’s trade surplus is expected to increase by US$0.08 billion. The effects of trade facilitation by each of the three areas are also reported in Table 11. B. Trade Expansion by Each of the Trade Facilitation Areas Figures 1 and 2 illustrate the relative importance of each of the three trade facilitation areas on the trade expansion effect between the three economies when the median value of the survey results in Table 1 are applied. For Korea and Japan, almost half of the export expansion (48 percent and 53 percent, respectively) is induced from an improvement in customs procedures as their exportable cross borders of neighboring economies. Korea and Japan’s imports from neighboring economies increase almost evenly by improvements in customs procedures (38 percent and 34 percent, respectively), and standards and conformity (34 percent and 38 percent respectively). For China, the 60 percent of additional import is induced by an improvement in customs procedures, and China’s exports to Japan and Korea increase almost evenly by improvement in customs procedures (35 percent) and standards and conformity (37 percent). C. Overall Evaluation by Economy and by Trade Facilitation Area Figures 3, 4, 5, and 6 summarize the positive effects of trade facilitation by economy and by each trade facilitation area. From the overall effect of trade facilitation on trade surplus and export promotion of each economy in Figure 3, we find that Korea would gain the biggest benefit. For Japan and China, the Northeast Asian economic cooperation, through better facilities for transactions of goods and services, may expand their exports their trade account with neighboring economies would deteriorate. In the area of customs procedures illustrated in Figure 4, Japan is the biggest beneficiary, Korea is another winner, but China may be a loser. In the area of standards and conformity and business mobility, China is the biggest winner, while the effect on Korea is minimal, and Japan’s trade balance is expected to deteriorate. Overall, trade facilitation among the three Northeast Asian economies promotes more trade between Korea, Japan, and China. It will also improve Korea and China’s trade accounts with neighboring economies but Japan’s trade account will deteriorate. In addition, considering the effect on bilateral trade with neighboring economies and the resulting effect on trade balance, improvements in customs procedures among the three economies is the most important area of trade facilitation for Korea and Japan. In addition, an improvement in standards and conformity, and business mobility among the three economies represent the most important areas of trade facilitation for China. (5) Policy Implications From the Gravity analysis, we found that: (i) each of the four trade facilitation indices we considered (customs procedures, standards and conformity, business mobility, information and communication technology) shows a significantly positive effect on bilateral trade between the three Northeast Asian economies; (ii) tariff barriers strongly affect the intra-regional trade; (iii) the trade creation effect of improvements in trade facilitation measures can be an effective policy alternative to complement a tariff reduction policy, even though the trade creation effect of an overall tariff reduction is stronger than that of independent improvement in each area of trade facilitation; (iv) if we improve all four areas of trade facilitation at the same time, we expect that gains from trade facilitation are more beneficial than gains from tariff reduction; and (v) the trade creation effect of trade liberalization through either tariff reduction or trade facilitation between the Northeast Asian economies are much stronger than those for APEC economies as a whole on average. From the partial equilibrium analysis, we found that trade facilitation among the three Northeast Asian economies promotes more trade between Korea, Japan, and China. It will also improve Korea and China’s trade accounts with neighboring economies, but Japan’s trade account will deteriorate. In addition, considering the effect on bilateral trade with neighboring economies and the resulting effect on trade balance, improvements in customs procedures among the three economies is the most important area of trade facilitation for Korea and Japan. An improvement in standards and conformity and business mobility among the three economies is the most important areas of trade facilitation for China.
68
5. CONCLUDING REMARKS In contrast to the empirical analyses for trade liberalization through tariff reduction, empirical research on the impact of trade liberalization through trade facilitation is very limited because of difficulties in the quantification of trade facilitation related data. This research provides a quantitative analysis of the economic effects produced by improvements in trade facilitation between APEC member economies as an alternative commercial policy to tariff reduction. We attempted to analyze the net trade creation effect of trade facilitation among the 15 APEC member economies. In order to quantify the economic impact of trade facilitation more accurately, we quantified the relationship between trade costs and trade facilitation by using survey analysis. Then we applied those findings to measure the possible impact of trade facilitation on those economies by using a Gravity regression analysis. In this research, we introduced a methodology, which APEC member economies can use to assess the trade creation effect of APEC trade facilitation by combining a survey analysis with a Gravity analysis. We believe that this methodology can help APEC assess the implications of reduced transaction costs through enhanced trade facilitation on their economic growth and trade. Moreover, from our empirical results, we strongly suggest that the significant positive trade creation effect of improvements in trade facilitation measures make APEC’s effort for better trade facilitation an effective policy alternative to complement tariff reduction policy. We also found that the bilateral trade creation effect of trade liberalization through tariff reduction or improved trade facilitation between highly interdependent economies like Korea, China, and Japan in APEC is much stronger than the average effect covering all the APEC economies. There are some weaknesses in this experiment. This research is an experimental attempt to estimate the trade creation effect of trade facilitation in APEC by quantifying the relationship between trade costs and trade facilitation measures. We aimed at providing a theoretical basis and methodology for conducting the quantitative analysis. However, much fine-tuning is necessary at the individual economic level. For example, the survey analysis to find a functional relationship between trade costs and trade facilitation in the APEC region was incomplete in terms of depth and width. This problem could be corrected by deeper cooperation among the APEC economies.
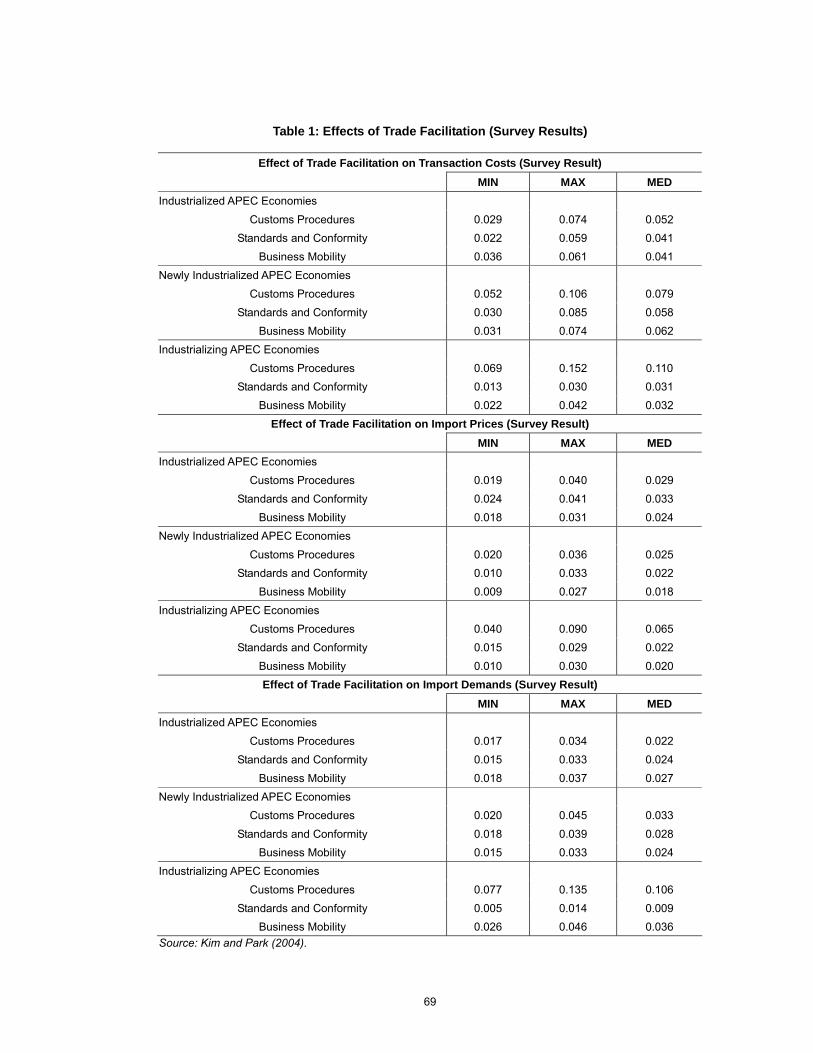
69
Table 1: Effects of Trade Facilitation (Survey Results)
Effect of Trade Facilitation on Transaction Costs (Survey Result) MIN MAX MED
Industrialized APEC Economies Customs Procedures 0.029 0.074 0.052
Standards and Conformity 0.022 0.059 0.041 Business Mobility 0.036 0.061 0.041
Newly Industrialized APEC Economies Customs Procedures 0.052 0.106 0.079
Standards and Conformity 0.030 0.085 0.058 Business Mobility 0.031 0.074 0.062
Industrializing APEC Economies Customs Procedures 0.069 0.152 0.110
Standards and Conformity 0.013 0.030 0.031 Business Mobility 0.022 0.042 0.032
Effect of Trade Facilitation on Import Prices (Survey Result) MIN MAX MED
Industrialized APEC Economies Customs Procedures 0.019 0.040 0.029
Standards and Conformity 0.024 0.041 0.033 Business Mobility 0.018 0.031 0.024
Newly Industrialized APEC Economies Customs Procedures 0.020 0.036 0.025
Standards and Conformity 0.010 0.033 0.022 Business Mobility 0.009 0.027 0.018
Industrializing APEC Economies Customs Procedures 0.040 0.090 0.065
Standards and Conformity 0.015 0.029 0.022 Business Mobility 0.010 0.030 0.020 Effect of Trade Facilitation on Import Demands (Survey Result)
MIN MAX MED Industrialized APEC Economies
Customs Procedures 0.017 0.034 0.022 Standards and Conformity 0.015 0.033 0.024
Business Mobility 0.018 0.037 0.027 Newly Industrialized APEC Economies
Customs Procedures 0.020 0.045 0.033 Standards and Conformity 0.018 0.039 0.028
Business Mobility 0.015 0.033 0.024 Industrializing APEC Economies
Customs Procedures 0.077 0.135 0.106 Standards and Conformity 0.005 0.014 0.009
Business Mobility 0.026 0.046 0.036 Source: Kim and Park (2004).

70
Table 2: Trade Facilitation Index
Average Effect of Trade Facilitation MIN MAX MED
Industrialized APEC Economies Customs Procedures 0.022 0.049 0.034
Standards and Conformity 0.020 0.044 0.033 Business Mobility 0.024 0.043 0.031
Newly Industrialized APEC Economies Customs Procedures 0.031 0.062 0.046
Standards and Conformity 0.019 0.052 0.036 Business Mobility 0.018 0.045 0.035
Industrializing APEC Economies Customs Procedures 0.062 0.126 0.094
Standards and Conformity 0.011 0.024 0.021 Business Mobility 0.019 0.039 0.029
AVERAGE Customs Procedures 0.038 0.079 0.058
Standards and Conformity 0.017 0.040 0.030 Business Mobility 0.021 0.042 0.032
Indexation MIN MAX MED
Industrialized APEC Economies Customs Procedures 1.759 1.604 1.686
Standards and Conformity 0.831 0.910 0.912 Business Mobility 0.856 0.984 1.029
Newly Industrialized APEC Economies Customs Procedures 1.243 1.269 1.268
Standards and Conformity 0.874 0.771 0.827 Business Mobility 1.121 0.948 0.910
Industrializing APEC Economies Customs Procedures 0.615 0.630 0.618
Standards and Conformity 1.535 1.658 1.441 Business Mobility 1.063 1.076 1.076
AVERAGE Customs Procedures 1.000 1.000 1.000
Standards and Conformity 1.000 1.000 1.000 Business Mobility 1.000 1.000 1.000
Source: Kim and Park (2004).

71
Table 3: ICT Index
Newly Industrialized
APEC Economies
IndustrializedAPEC
Economies
Industrializing APEC
Economies APEC
Mobile Telephones per 100 people 67.89 57.71 16.11 43.40
Phone Lines per 100 people 45.70 60.40 13.80 37.23
Computers per 100 people 34.20 47.70 2.70 31.06
Internet Users (%) 55.73 50.92 4.21 32.24
E-Commerce (%) 0.56 0.68 0.14 0.46
Average 40.82 (I) 43.48 (II) 7.39 (III) 28.88 (A)
ICT Index 1.413 (I/A) 1.506 (II/A) 0.256 (III/A) 1.000 Source: Kim and Park (2004).
Table 4: Summary Statistics
Variable Mean Std. Dev.
Log of GDP in pair 10.74327 2.17310
Log of per capita GDP in pair 17.45919 1.79017
Log of distance 8.39277 0.88398
Log of tariff 2.30213 1.00403
Common land border dummy 0.07140 0.25754
Regional Trade Arrangements (RTA) dummy 0.20032 0.40032
Log of Custom procedures (CP) 2.04218 3.99539
Log of Standards and conformity (SC) 1.05198 1.90375
Log of Business mobility (BM) 1.07644 2.03060
Log of Information and communication technology (ICT) 1.44683 3.23025
Note: N= 2,324 and 1988 - 1999 panel data

72
Table 5: Gravity Regression Analysis (GLS with random effect) For APEC
I II III IV
Log of GDP in pair 0.668 0.643 0.660 0.670
(0.038)*** (0.037)*** (0.038)*** (0.038)***
Log of per capita GDP in pair 0.100 0.112 0.101 0.100
(0.043)** (0.042)*** (0.043)** (0.043)**
Log of Distance -1.129 -1.080 -1.112 -1.128
(0.105)*** (0.102)*** (0.104)*** (0.105)***
Log of Tariff -0.217 -0.207 -0.217 -0.217
(0.038)*** (0.038)*** (0.038)*** (0.038)***
Common Land Border dummy 0.118 0.273 0.176 0.115
(0.357) (0.349) (0.355) (0.357)
RTA dummy 0.379 0.351 0.367 0.378
(0.194)* (0.190)* (0.193)* (0.194)*
Log of Customs Procedures (CP) 0.045
(0.008)***
Log of Standards and 0.154
Conformity (SC) (0.017)***
Log of Business Mobility (BM) 0.107
(0.015)***
Log of Information and 0.056
Communication Technology (ICT) (0.010)***
Number of Observation 2324 2324 2324 2324
R-squared 0.77 0.78 0.78 0.77 Note: “*”, “**”, and “***” denote statistical significance at the 10%, 5%, and 1% levels, respectively. Figures in parenthesis are standard errors.

73
Table 6: Gravity Regression Analysis For Korea, China, and Japan
I II III IV
Log of GDP in pair 0.921 0.992 0.949 0.880
(0.228)*** (0.171)*** (0.245)*** (0.315)***
Log of Per capita GDP in pair 0.284 0.253 0.200 0.456
(0.056)*** (0.082)*** (0.056)*** (0.017)***
Log of Distance -0.366 -0.533 -0.471 -0.524
(0.766) (0.235)** (0.202) ** (0.227)***
Log of Tariff -0.264 -0.861 -0.735 -0.669
(0.119)** (0.587)** (0.327)*** (0.208)***
Log of Customs Procedures (CP) 0.116
(0.100)**
Log of Standards (SC) 0.263
(0.065)***
Log of Business Mobility (BM) 0.112
(0.097)**
Log of Information and 0.592
Communication Technology (ICT) (0.257)**
Number of Observations 137 137 137 137
R-squared 0.78 0.76 0.77 0.78 Note: “**” and “***” denote statistical significance at the 5% and 1% levels, respectively. Figures in parenthesis are robust standard errors.

74
Table 7: Regression Analysis
Price Elasticity Income Elasticity Adjusted R2 Sample Period Import Demand for Korean Exportables
Japan -0.609 (-2.025)
1.775 (3.230) 0.843 ‘71~’02 <1>
China -0.660 (-0.46)
1.129 (0.79) 0.303 ‘91~’99 <2>
Import Demand for Japanese Exportables
Korea -0.647 (-2.647)
3.726 (7.196) 0.964 ‘71~’02 <3>
China -0.104 (-0.260)
2.850 (1.513) 0.909 ‘79~’02 <4>
Import Demand for Chinese Exportables
Korea -0.842 (-2.475)
2.748 (8.876) 0.947 ‘79~’02 <5>
Japan -0.709 (-3.001)
0.890 (1.344) 0.961 ‘71~’02 <6>
Import Demand for APEC Exportables
China -0.655 (-2.121)
0.638 (1.297) 0.959 ‘79~’02 <7>
Note: Figures in parenthesis are t-statistics.
Table 8: Intra-Northeast Asian Trade Structure in 1999
Trade Volume (Million US Dollars)
Export from Korea Japan China Northeast Others World Import to Asian 3 Korea 23,089 7,808 30,897 88,843 119,740 Japan 15,863 32,399 48,262 262,471 310,733 China 13,685 23,450 37,135 128,583 165,718 Northeast Asian 3 29,548 46,539 40,207 116,294 479,897 596,191 Others 114,099 372,668 154,724 World 143,647 419,207 194,931 Export Share (%)
Korea Japan China Northeast Asian 3
Korea 5.5 4.0 4.1 Japan 11.0 16.6 6.4 China 9.5 5.6 4.9 Northeast Asian 3 20.6 11.1 20.6 15.3 Others 79.4 88.9 79.4 84.7 World 100.0 100.0 100.0 100.0 Import Share (%)
Korea Japan China Northeast Asian 3 Others World
Korea 19.3 6.5 25.8 74.2 100.0 Japan 5.1 10.4 15.5 84.5 100.0 China 8.3 14.2 22.4 77.6 100.0 Northeast Asian 3 5.0 7.8 6.7 19.5 80.5 100.0 Trade Balance (Million US Dollars)
Korea Japan China Northeast Asian 3
Korea 7,226 -5,877 1,349 Japan -7,226 8,949 1,723 China 5,877 -8,949 -3,072 Northeast Asian 3 -1,349 -1,723 3,072 Others 25,256 110,197 26,141 World 23,907 108,474 29,213 Source: IMF, Direction of Trade Statistics.

75
Table 9: Effect of Trade Facilitation on Korea’s Trade with Japan and China
Overall Effect (Million US Dollars)
Minimum Median Maximum
Export Import Trade Balance Export Import Trade Balance Export Import Trade Balance
Japan 589 598 -8 831 971 -140 1,082 1,434 -352
China 583 263 320 959 427 532 1,336 631 704
Northeast Asian 3 1,172 861 311 1,790 1,398 392 2,418 2,065 352
Share over World 0.82% 0.72% 1.30% 1.25% 1.17% 1.64% 1.68% 1.72% 1.47%
Effect of Improved Customs Procedures (Million US Dollars)
Japan 184 299 -115 280 374 -93 386 538 -151
China 359 132 227 583 164 418 807 237 570
Northeast Asian 3 542 430 112 863 538 325 1,193 775 419
Share over World 0.38% 0.36% 0.47% 0.60% 0.45% 1.36% 0.83% 0.65% 1.75%
Effect of Improved Standards and Conformity (Million US Dollars)
Japan 232 164 68 319 329 -10 396 493 -97
China 134 72 62 197 145 53 260 217 43
Northeast Asian 3 366 237 130 516 473 43 656 710 -54
Share over World 0.26% 0.20% 0.54% 0.36% 0.40% 0.18% 0.46% 0.59% -0.23%
Effect of Improved Business Mobility (Million US Dollars)
Japan 174 134 39 232 269 -37 299 403 -104
China 90 59 30 179 118 61 269 178 91
Northeast Asian 3 264 194 70 411 387 24 568 581 -12
Share over World 0.18% 0.16% 0.29% 0.29% 0.32% 0.10% 0.40% 0.49% -0.05%
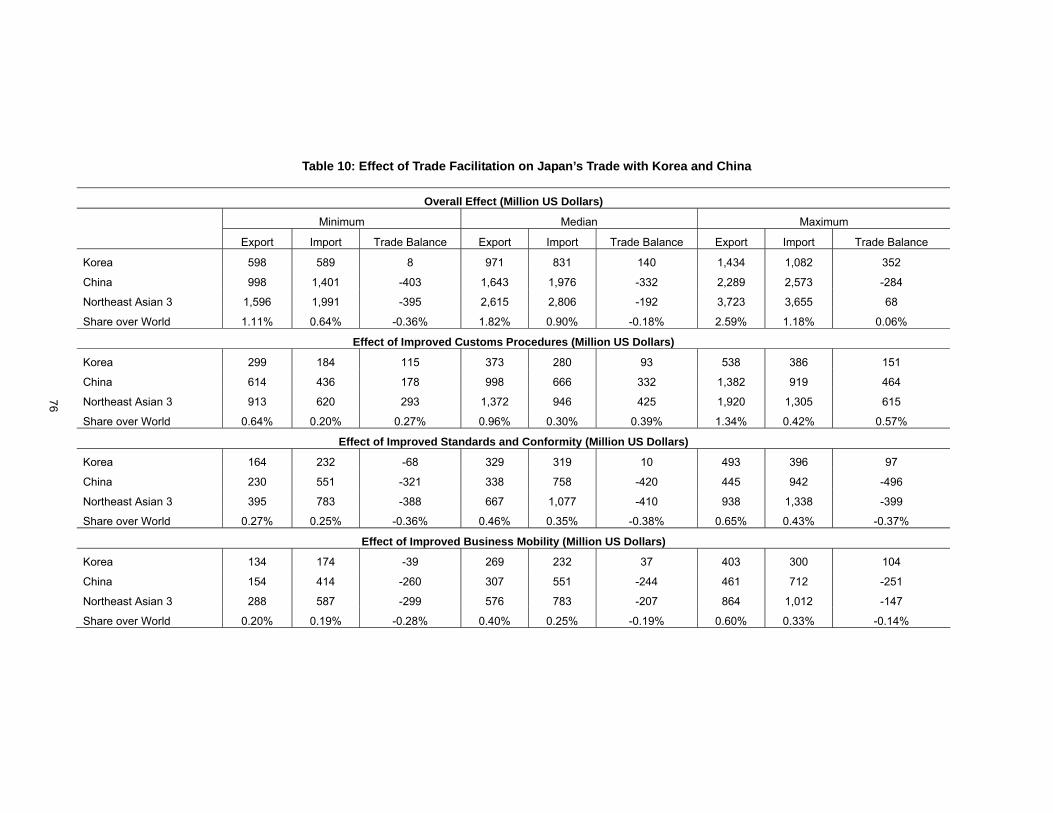
76
Table 10: Effect of Trade Facilitation on Japan’s Trade with Korea and China
Overall Effect (Million US Dollars)
Minimum Median Maximum
Export Import Trade Balance Export Import Trade Balance Export Import Trade Balance
Korea 598 589 8 971 831 140 1,434 1,082 352
China 998 1,401 -403 1,643 1,976 -332 2,289 2,573 -284
Northeast Asian 3 1,596 1,991 -395 2,615 2,806 -192 3,723 3,655 68
Share over World 1.11% 0.64% -0.36% 1.82% 0.90% -0.18% 2.59% 1.18% 0.06%
Effect of Improved Customs Procedures (Million US Dollars)
Korea 299 184 115 373 280 93 538 386 151
China 614 436 178 998 666 332 1,382 919 464
Northeast Asian 3 913 620 293 1,372 946 425 1,920 1,305 615
Share over World 0.64% 0.20% 0.27% 0.96% 0.30% 0.39% 1.34% 0.42% 0.57%
Effect of Improved Standards and Conformity (Million US Dollars)
Korea 164 232 -68 329 319 10 493 396 97
China 230 551 -321 338 758 -420 445 942 -496
Northeast Asian 3 395 783 -388 667 1,077 -410 938 1,338 -399
Share over World 0.27% 0.25% -0.36% 0.46% 0.35% -0.38% 0.65% 0.43% -0.37%
Effect of Improved Business Mobility (Million US Dollars)
Korea 134 174 -39 269 232 37 403 300 104
China 154 414 -260 307 551 -244 461 712 -251
Northeast Asian 3 288 587 -299 576 783 -207 864 1,012 -147
Share over World 0.20% 0.19% -0.28% 0.40% 0.25% -0.19% 0.60% 0.33% -0.14%

77
Table 11: Effect of Trade Facilitation on China’s Trade with Korea and Japan
Overall Effect (Million US Dollars)
Minimum Median Maximum
Export Import Trade Balance Export Import Trade Balance Export Import Trade Balance
Korea 263 583 -320 427 959 -532 631 1,336 -704
Japan 1,401 998 403 1,975 1,644 332 2,573 2,289 284
Northeast Asian 3 1,664 1,581 83 2,403 2,603 -200 3,204 3,624 -420
Share over World 1.16% 0.95% 0.28% 1.67% 1.57% -0.68% 2.23% 2.19% -1.44%
Effect of Improved Customs Procedures (Million US Dollars)
Korea 131 359 -227 164 583 -418 237 807 -570
Japan 436 614 -178 666 998 -332 919 1,382 -464
Northeast Asian 3 568 973 -405 831 1,581 -750 1,156 2,189 -1,034
Share over World 0.40% 0.59% -1.39% 0.58% 0.95% -2.57% 0.80% 1.32% -3.54%
Effect of Improved Standards and Conformity (Million US Dollars)
Korea 72 135 -62 145 197 -53 217 260 -43
Japan 551 230 321 758 338 420 942 445 496
Northeast Asian 3 624 365 259 903 535 368 1,159 705 453
Share over World 0.43% 0.22% 0.89% 0.63% 0.32% 1.26% 0.81% 0.43% 1.55%
Effect of Improved Business Mobility (Million US Dollars)
Korea 59 90 -30 118 179 -61 178 269 -91
Japan 413 154 260 551 307 244 712 461 251
Northeast Asian 3 473 243 229 670 487 183 890 730 160
Share over World 0.33% 0.15% 0.79% 0.47% 0.29% 0.63% 0.62% 0.44% 0.55%

78
Figure 1: Decomposition of Trade Facilitation Effect on Exports
Korea
CustomProcedures
48%
Standard29%
BusinessMobility
23%
Japan
CustomProcedures
53%Standard25%
Business Mobility22%
China
CustomProcedures
35%
Standard37%
BusinessMobility
28%
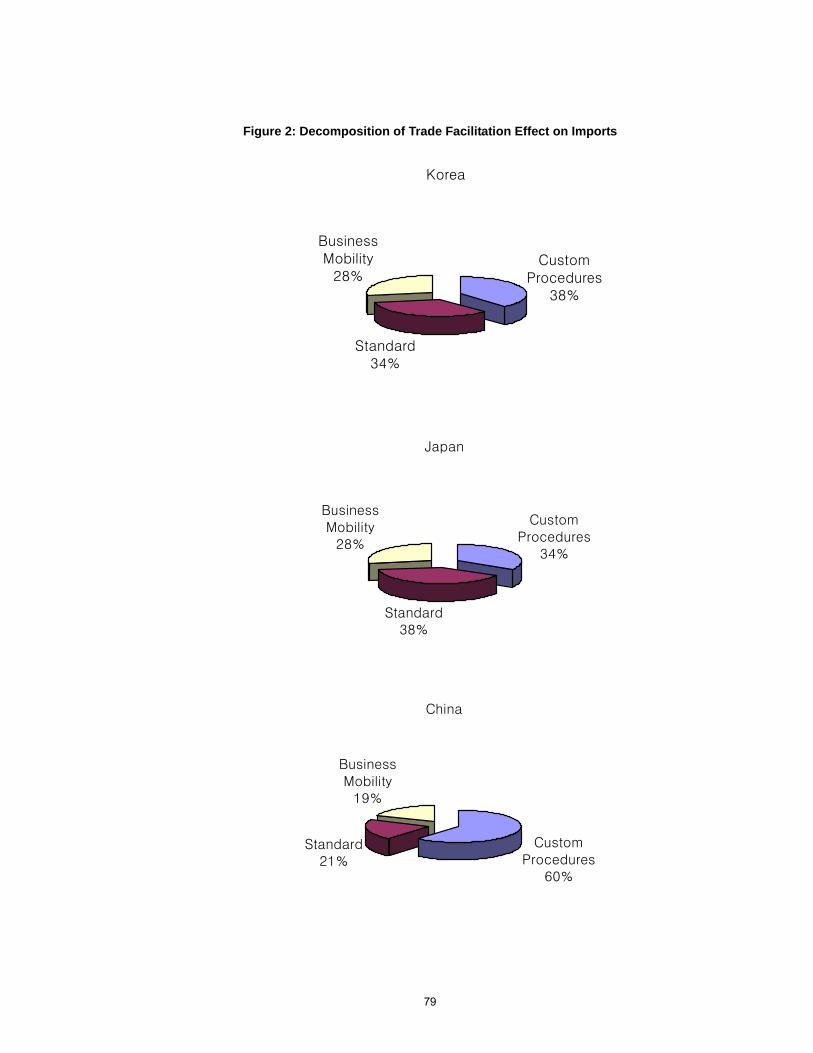
79
Figure 2: Decomposition of Trade Facilitation Effect on Imports
Korea
CustomProcedures
38%
Standard34%
BusinessMobility
28%
Japan
CustomProcedures
34%
Standard38%
BusinessMobility
28%
China
CustomProcedures
60%
Standard21%
BusinessMobility
19%
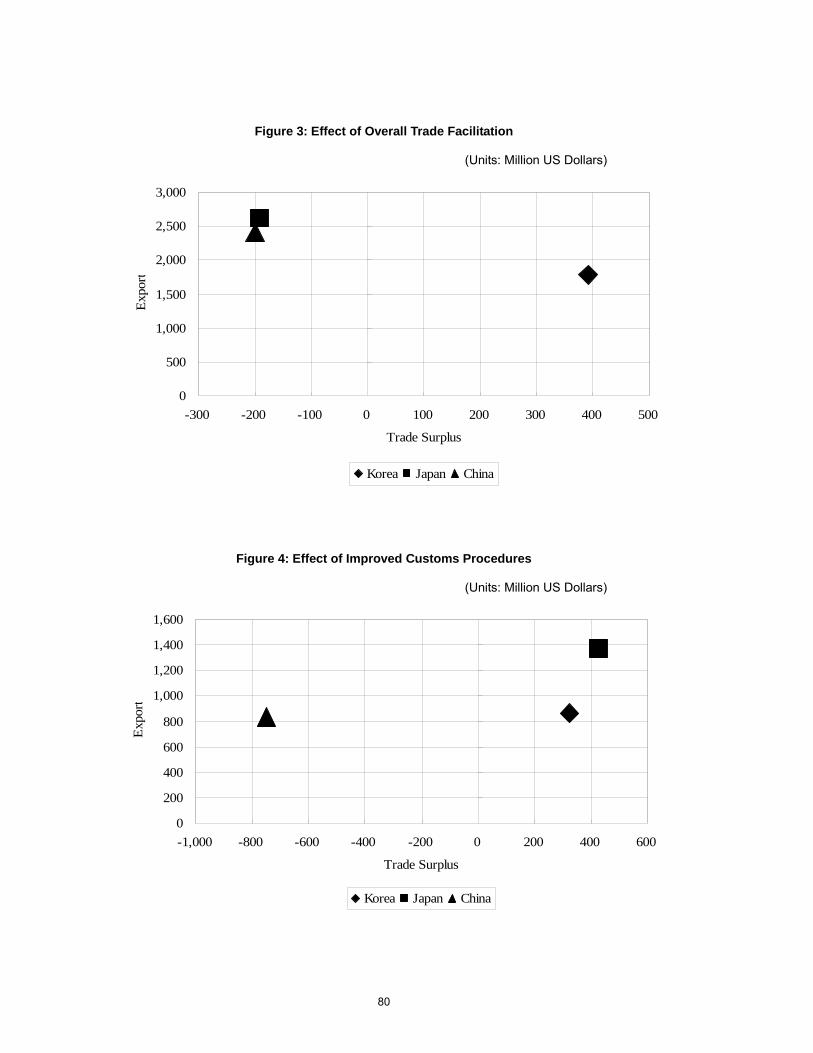
80
Figure 3: Effect of Overall Trade Facilitation
(Units: Million US Dollars)
0
500
1,000
1,500
2,000
2,500
3,000
-300 -200 -100 0 100 200 300 400 500
Trade Surplus
Expo
rt
Korea Japan China
Figure 4: Effect of Improved Customs Procedures
(Units: Million US Dollars)
0
200
400
600
800
1,000
1,200
1,400
1,600
-1,000 -800 -600 -400 -200 0 200 400 600
Trade Surplus
Expo
rt
Korea Japan China

81
Figure 5: Effect of Improved Standards and Conformity
(Units: Million US Dollars)
0100200300400500600700800900
1,000
-500 -400 -300 -200 -100 0 100 200 300 400 500
Trade Surplus
Expo
rt
Korea Japan China
Figure 6. Effect of Improved Business Mobility (Units: Million US Dollars)
0
100
200
300
400
500
600
700
800
-250 -200 -150 -100 -50 0 50 100 150 200 250
Trade Surplus
Expo
rt
Korea Japan China

82
Appendix Table 1: Effect of Trade Facilitation on Korea’s Trade with Japan and China
Overall Effect (Million US Dollars)
Minimum Median Maximum
Export Import Trade Balance Export Import Trade Balance Export Import Trade Balance
Japan 589 598 -8 831 971 -140 1,082 1,434 -352
China 587 263 324 966 427 539 1,346 631 715
Northeast Asian 3 1,176 861 316 1,797 1,398 399 2,428 2,065 363
Share over World 0.82% 0.72% 1.32% 1.25% 1.17% 1.67% 1.69% 1.72% 1.52%
Effect of Improved Customs Procedures (Million US Dollars)
Japan 184 299 -115 280 374 -93 386 538 -151
China 361 132 230 587 164 423 813 237 576
Northeast Asian 3 545 430 115 867 538 329 1,199 775 425
Share over World 0.38% 0.36% 0.48% 0.60% 0.45% 1.38% 0.83% 0.65% 1.78%
Effect of Improved Standards and Conformity (Million US Dollars)
Japan 232 164 68 319 329 -10 396 493 -97
China 135 72 63 199 145 54 262 217 45
Northeast Asian 3 367 237 131 518 473 44 658 710 -52
Share over World 0.26% 0.20% 0.55% 0.36% 0.40% 0.19% 0.46% 0.59% -0.22%
Effect of Improved Business Mobility (Million US Dollars)
Japan 174 134 39 232 269 -37 299 403 -104
China 90 59 31 181 118 62 271 178 93
Northeast Asian 3 264 194 71 412 387 25 570 581 -10
Share over World 0.18% 0.16% 0.30% 0.29% 0.32% 0.11% 0.40% 0.49% -0.04%

83
Appendix
Table 2: Effect of Trade Facilitation on Japan’s Trade with Korea and China
Overall Effect (Million US Dollars)
Minimum Median Maximum
Export Import Trade Balance Export Import Trade Balance Export Import Trade Balance
Korea 598 589 8 971 831 140 1,434 1,082 352
China 159 1,401 -1,243 261 1,976 -1,715 363 2,573 -2,209
Northeast Asian 3 756 1,991 -1,234 1,232 2,806 -1,574 1,797 3,655 -1,857
Share over World 0.53% 0.64% -1.14% 0.86% 0.90% -1.45% 1.25% 1.18% -1.71%
Effect of Improved Customs Procedures (Million US Dollars)
Korea 299 184 115 373 280 93 538 386 151
China 98 436 -339 159 666 -508 219 919 -699
Northeast Asian 3 396 620 -224 532 946 -414 757 1,305 -548
Share over World 0.28% 0.20% -0.21% 0.37% 0.30% -0.38% 0.53% 0.42% -0.51%
Effect of Improved Standards and Conformity (Million US Dollars)
Korea 164 232 -68 329 319 10 493 396 97
China 37 551 -515 54 758 -704 71 942 -871
Northeast Asian 3 201 783 -582 382 1,077 -694 564 1,338 -774
Share over World 0.14% 0.25% -0.54% 0.27% 0.35% -0.64% 0.39% 0.43% -0.71%
Effect of Improved Business Mobility (Million US Dollars)
Korea 134 174 -39 269 232 37 403 300 104
China 24 414 -389 49 551 -503 73 712 -639
Northeast Asian 3 159 587 -429 318 783 -466 477 1,012 -535
Share over World 0.11% 0.19% -0.40% 0.22% 0.25% -0.43% 0.33% 0.33% -0.49%

84
Appendix Table 3: Effect of Trade Facilitation on China’s Trade with Korea and Japan
Overall Effect (Million US Dollars)
Minimum Median Maximum
Export Import Trade Balance Export Import Trade Balance Export Import Trade Balance
Korea 263 587 -324 427 966 -539 631 1,346 -715
Japan 1,401 159 1,243 1,975 261 1,714 2,573 363 2,209
Northeast Asian 3 1,664 746 919 2,403 1,227 1,175 3,204 1,709 1,495
Share over World 1.16% 0.45% 3.14% 1.67% 0.74% 4.02% 2.23% 1.03% 5.12%
Effect of Improved Customs Procedures (Million US Dollars)
Korea 131 361 -230 164 587 -423 237 813 -576
Japan 436 98 339 666 159 508 919 220 699
Northeast Asian 3 568 459 109 831 746 85 1,156 1,032 123
Share over World 0.40% 0.28% 0.37% 0.58% 0.45% 0.29% 0.80% 0.62% 0.42%
Effect of Improved Standards and Conformity (Million US Dollars)
Korea 72 136 -63 145 199 -54 217 262 -45
Japan 551 37 515 758 54 704 942 71 871
Northeast Asian 3 624 172 452 903 252 650 1,159 333 826
Share over World 0.43% 0.10% 1.55% 0.63% 0.15% 2.23% 0.81% 0.20% 2.83%
Effect of Improved Business Mobility (Million US Dollars)
Korea 59 90 -31 118 181 -62 178 271 -93
Japan 413 24 389 551 49 503 712 73 639
Northeast Asian 3 473 115 358 670 229 440 890 344 545
Share over World 0.33% 0.07% 1.23% 0.47% 0.14% 1.51% 0.62% 0.21% 1.87%

85
REFERENCES
APEC. (1997), The Impact of Trade Liberalization in APEC. November.
. (1999), “Assessing APEC Trade Liberalization and Facilitation – 1999 Update,” September.
. (2002), The Benefits of Trade and Investment Liberalization and Facilitation in APEC. October.
. (2003), KBE Indicators. Economic Committee Meeting, SOM III, February.
APFC. (2000), “Survey on Customs, Standards, and Business Mobility in the APEC Region,” A Report by the Asia Pacific Foundation of Canada (APFC) for the APEC Business Advisory Council (ABAC), APFC, July.
Baier, S.L. and J.H. Bergstrand (2001), “The Growth of World Trade: Tariffs, Transport Costs, and Income Similarity,” Journal of International Economics, 53, pp. 1-27.
Bhagwati, Jagdish and Arvind Panagariya (1996), “Preferential Trading Areas and Multilateralism-Strangers, Friends, or Foes?” Chapter 1 in The Economics of Preferential Trade Agreements, Jagdish Bhagwati and Arvind Panagariya (eds.), The AEI Press and Center for International Economics, University of Maryland, pp. 1-78.
Bhagwati, Jagdish; David Greenaway and Arvind Panagariya (1998), “Trading Preferentially: Theory and Policy,” The Economic Journal, 108, pp. 1128-1148.
Cecchini, Paolo (1998), The European Challenge 1992 The Benefits of a Single Market, Gower
Dee, Philippa. (1998), “The Comprehensiveness of APEC’s Free Trade Commitment,” in The Economic Implications of Liberalizing APEC Tariff and Nontariff Barriers to Trade, Investigation No. 332-372, USITC, April, pp. 827-86.
Frankel, Jeffrey; Ernesto Stein and Shang-jin Wei (1995), “Trading Blocs and the Americas: The natural, the unnatural, and the super-natural,” Journal of Development Economics 47: 61-95.
Glick, R. and A.K. Ross (2002), "Does a Currency Union Affect Trade? The Time Series Evidence", European Economic Review 46: 963 - 1151.
Kim, Sangkyo and Innwon Park (2001), “The Benefits of Trade Facilitation in APEC,” Policy Analysis I 01-05, KIEP, December (in Korean).
Kim, Sangkyom and Innwon Park (2004), “Trade Facilitation and A Northeast Asian Free Trade Arrangement,” paper presented at the International Seminar on Economic Aid, FDI and Trade in East Asia, organized by BK21 Research Group of Korea University at Korea University, Seoul, Korea, May 12.
Krueger, Anne O. (1999), “Are Preferential Trading Arrangements Trade-Liberalizing or Protectionist?” Journal of Economic Perspectives 13: 105-124.
Krugman, Paul (1993), Regionalism versus Multilateralism: analytical notes,” Chapter 3 in New Dimensions in Regional Integration Jaime De Melo and Arvind Panagariya (eds.), Centre for Economic Policy Research (CEPR), Cambridge University Press, pp. 58-79.
Lee, Jong-Wha and Innwon Park (2003), “Free Trade Areas in East Asia: Discriminatory or Nondiscriminatory?” paper presented at International Conference on Economic Cooperation and Integration in Northeast Asia, The Institute of Northeast Asian Business and Economics, September 19.
Maskus, Keith E.; John S. Wilson and Tsunehiro Otsuki (2001), Quantifying the Impact of Technical Barriers to Trade: A Framework for Analysis, World Bank.
Ministry of Foreign Affairs and Trade (2000), Readings on WTO’s Effort for Trade Facilitation (November 1996- October 2000), November (in Korean).
Moenius, Johannes (1999), Information versus Product Adaptation: The Role of Standards in Trade, Unpublished Manuscript, November.
Organization for Economic Co-operation Development (2000), An Assessment of the Costs for

86
International Trade in Meeting Regulatory Requirements, Working Party of the Trade Committee, OECD.
Schiavo-Campo, Salvatore (1999), Simplification of Customs Procedures: Reducing Transaction Costs for Efficiency, Integrity, and Trade Facilitation. Asian Development Bank, November.
Stern, Robert M.; Jonathan Francis and Bruces Schumacher (1976), Prices Elasticities in International Trade, The Macmillan Press.
Summers, Lawrence (1991), Regionalism and the World Trading System, Federal Reserve Bank of Kansas City.
UNCTAD. (1994) Columbus Ministerial Declaration on Trade Efficiency.
Wilson, John S. (2000), “Can We Measure the Costs of Regulation and Technical Barriers to Trade in Goods?” Chapter 2, World Bank Research in Progress on Standards, World Bank, October.
Wilson, John S.; Catherine L. Mann and Tsunehiro Otsuki (2003), “Trade Facilitation and Economic Development: Measuring the Impact,” World Bank Policy Research Paper 2988, The World Bank.
Wonnacott, Paul and Mark Lutz (1989), “Is There a Case for Free Trade Areas?” Chapter 2 in Free Trade Areas and U.S. Trade Policy, Jeffrey J. Schott (ed.), Institute for International Economics, pp. 59-84.
Woo, Yuen Pau and John Wilson (2000), New Directions for APEC’s Trade Facilitation Agenda, Asia Pacific Foundation of Canada.
WTO. (2001), MA: Trade Facilitation. WTO Website at www.wto.org

ACRONYMS

87
ACRONYMS NAFTA North American Free Trade
Agreement
ASEAN Association of Southeast Asian Nations
AFTA ASEAN Free Trade Area
RTA Regional Trade Arrangements
ICT Information and Communication Technology
SMEs Small and Medium Enterprises
CGE Computable General Equilibrium
CP Customs Procedures
SC Standards and Conformity
BM Business Mobility
CER Closer Economic Relations
CEPA Closer Economic Partnership Arrangement
CAPs Collective Action Plans
IAPs Individual Action Plans
CGE Computable-General-Equilibrium
WMO Wilson-Mann-Otsuki
TTC Trade-Transactions-Costs
GATT General Agreement On Tariffs and Trade
ROO Rules Of Origin
NAFTA North American Free Trade Agreement
S&C Standards and Conformance
MRA Mutual Recognition Agreement
TBT Technical Barrier to Trade
MLAs Multilateral Agreements
NIST National Institute Of Standards and Technology
ISO International Standards Organization
HS Harmonized System
UL Underwriters Laboratories
CCC China Compulsory Certification
GCR Global Competitiveness Report
WBES World Business Environment Survey— (By World Bank)
REDI Recent Economic Developments In Infrastructure
TIB Temporary Import Bond
IELA International Exhibition Logistics Associates
EMU Economic and Monetary Union Of Europe
ICT Information and Communication Technology
LAIA Latin American Integration Association
CEPA Closer Economic Partnership Arrangement
