ap stats – chapters 26 and 27 (the end!) comparing · pdf fileap stats – chapters...
TRANSCRIPT

AP Stats – Chapters 26 and 27 (The End!) Comparing Counts
Long ago, we looked at the statistics for a sample. Lately, we’ve taken a sample and tried to generalize results from that sample to the entire population – that’s called inference. Now we look at an entire set of categorical data and ask if the way the data is distributed is consistent with what we expect. Are there differences between distributions (the categories) that are large enough to be significant? A new model (a new family of curves) is needed.
The 2
χ distribution!
• they do not measure distance in SDs • they cannot have negative values • the graphs are always one-sided • the graphs are always skewed to the right
• the 2
χ result is always dependent on the df. It
takes a much larger 2
χ value to surprise us when
there are more degrees of freedom.

Three 2χ Tests
- A goodness-of-fit test compares how the data is distributed for a single variable to what the expected outcomes were. One variable, one sample. - A test of homogeneity compares observed distributions for several groups to each other to see if there is evidence of differences among the groups. Several groups, one variable. - A test of independence cross-categorizes one group on two variables to see if there is an association between them. One sample, two variables.

Goodness-of-Fit Test
Hypothesis: back to words and sentences! No more symbols. The null is that the probability model (the probabilities that you expect to happen) is correct. Our test will assess whether the observed results are consistent with that model.
Model:
• Counted Data Condition – make sure the data are counts for categorical data
• Independence – make sure the individuals are sampled independently from the population
• Randomization – if we intend to generalize to a large population
• Sample Size (Expected Cell Frequency) – we need to expect to see at least 5 individuals in each cell
• “With the conditions met, we’ll use a 2
χ model and
a chi-square goodness-of-fit test.”

Mechanics:
• draw and label the 2
χ model
o
o the curve changes shape AND center as the number of df grows
o df = n – 1 (where n = number of categories) o expected value (mean) = df
• state the p-value Conclusion: reject or fail to reject the null. Since
there is no single parameter we’re testing, a confidence interval would not make sense.

The M&M ClaimThe M&M ClaimThe M&M ClaimThe M&M Claim The manufacturer of M&Ms candies claims the following
proportions in their bags of milk chocolate candies: 13% brown, 14% yellow, 13% red, 24% blue, 20% orange, and 16% green.
Perform a goodness-of-fit test to see if your bag measures up to the reported proportions.

AP Stats TI TipsTI TipsTI TipsTI Tips Chapter 26
Chi-Squared Test – Goodness of Fit (on the TI-84 only)
Under STAT , 1:Edit, create a new column named CNTRB.
Enter the observed values in L1, and the expected values
in L2.
If you have the expected percentages instead of values,
enter them into L2. Then, to replace the expected
percentages with their values, enter
( )1 2 2sum L L L∗ → . (The sum function is found
under 2ND
, LIST , MATH , option 5.)
If you already have the expected values, enter them into L2,
and avoid the box above! ☺
STAT
TESTS
D: 2χ GOF-Test…
Observed: L1
Expected: L2
Enter the degrees of freedom as one fewer than the number of
categories.
Calculate
There’s the p-value you’re looking for!
Also listed are the CNTRB values. (They’re also in the new
list you earlier created.) These are known as components, or
standardized residuals. They are the “individual” pieces that
sum to give the chi-squared value. The items with the largest
component impacts the chi-squared value the most.

VendingVendingVendingVending In a local school, vending machines offer a range of drinks from juices to
sports drinks. The purchasing agent thinks each type of drink is equally favored among the students buying
drinks from the machine. The recent purchasing choices from the vending machines are shown in the table.
Test an appropriate hypothesis to decide if the purchasing agent is correct. Which type of drink impacted your decision the most? Explain what this means in the context of the problem.
The numbers calculated in the CNTRB list are known as components or standardized residual. They are the “individual” pieces that sum to give the chi-square value. The item with the largest component impacts the chi-squared value the most.

Test for Homogeneity Hypothesis: words and sentences as before. Our
test will assess whether the differences we found in the two groups is consistent with the belief that they are.
Model:
• Counted Data Condition – same • Independence – same • Randomization – same • Sample Size (Expected Cell Frequency) – same
• “With the conditions met, we’ll use a 2
χ model and
a chi-square test for homogeneity.” Mechanics:
• draw and label the 2
χ model
• the df = (# rows – 1)(# columns – 1) • state the p-value
Conclusion: reject or fail to reject the null. Since
there is no single parameter we’re testing, a confidence interval would not make sense.
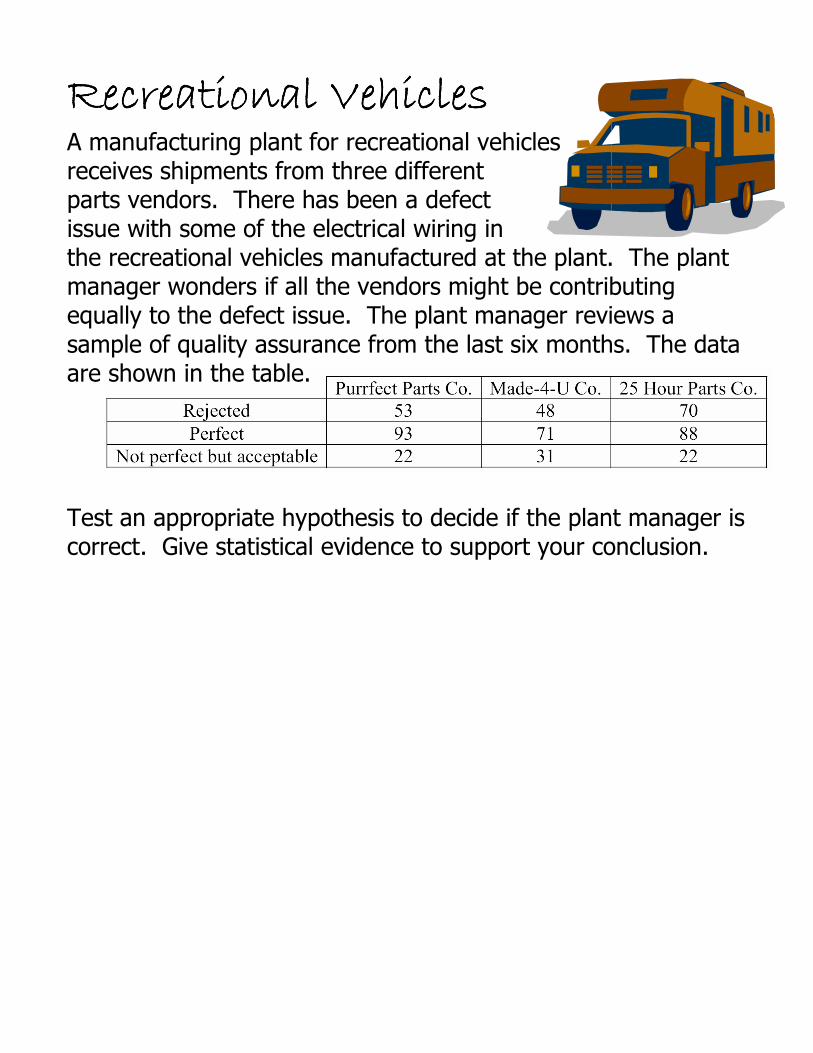
Recreational VehiclesRecreational VehiclesRecreational VehiclesRecreational Vehicles A manufacturing plant for recreational vehicles receives shipments from three different parts vendors. There has been a defect issue with some of the electrical wiring in the recreational vehicles manufactured at the plant. The plant manager wonders if all the vendors might be contributing equally to the defect issue. The plant manager reviews a
sample of quality assurance from the last six months. The data are shown in the table. Test an appropriate hypothesis to decide if the plant manager is correct. Give statistical evidence to support your conclusion.

Chi-Squared Tests – Homogeneity and Independence
Enter the given data in matrix A.
2nd
MATRIX
EDIT
[A]
The top row of the screen is where you specify the dimensions
of the matrix…rows first, then columns.
STAT
TESTS
C: 2χ -Test…
Confirm that your observed data is in matrix A, and that the
calculator will put the expected values in matrix B.
Calculate
The chi-squared value, p-value, and degrees of freedom are
shown.
To see the expected values in matrix B…
2nd
MATRIX
2:[B]
ENTER
ENTER
Do not forget to scroll over to see all the expected values to
make sure each one is at least 5!

Test for Independence Hypothesis: words and sentences as before. Our
test will assess whether the differences we found in the conditional distributions are greater than natural selection would reasonably allow.
Model:
• Counted Data Condition – same • Independence – same • Randomization – same • Sample Size (Expected Cell Frequency) – same
• “With the conditions met, we’ll use a 2
χ model and
a chi-square test for independence.” Mechanics:
• draw and label the 2
χ model
• the df = (# rows – 1)(# columns – 1) • state the p-value
Conclusion: reject or fail to reject the null. Since
there is no single parameter we’re testing, a confidence interval would not make sense.

Eye Color and Eye Color and Eye Color and Eye Color and Hearing LossHearing LossHearing LossHearing Loss Could eye color be a warning signal for hearing loss in patients suffering from meningitis? British researcher Helen Cullington recorded the eye color of 130 deaf patients, and noted whether the patient’s deafness had developed following treatment for meningitis. Her data are summarized in the table. Test an
appropriate hypothesis and state your conclusion.