ap lesson 1 hw 2017 -...
TRANSCRIPT

1
AP Physics Lesson 1 Homework Outcomes Quiz 1 Preparation
Name Date Period
Answer
Item #
Question
1.
The graph below represents the motion of a body that is moving with
a) decreasing acceleration b) constant speed c) increasing speed d) increasing acceleration
2.
According to the graph, which quantity related to the motion of the body is constant? a) displacement b) speed c) acceleration d) velocity
3.
The diagram below shows a graph of distance as a function of time for an object in straight-line motion.
According to the graph, the object most likely has a) a decreasing acceleration b) an increasing speed c) a decreasing speed d) no acceleration
4. Which graph best represents the relations between velocity and time for an object which accelerates uniformly for 2 seconds, then moves with a constant velocity for one second, and finally slows down for 3 seconds?

2
5. The displacement-time graph below represents the motion of a cart along a straight line.
During which interval was the velocity of the cart = 0? a) AB b) BC c) CD d) DE
6. A jet accelerates from rest at a rate of 6.00 m/s2 over the length of a 500. m runway. What is the take off speed of the jet at the end of the runway, and how much time did it take the jet to achieve this speed? a) 77.5 m/s, 12.9 s b) 6000 m/s, 1000 s c) 1.2 m/s, 1.2 s d) 300 m/s, 50 s
7.
A ball is thrown vertically upward from a height of 1.00 m above the ground with an initial velocity of 2.00 m/s. What ill be the position of the ball with respect to the ground after 0.50 seconds from the time the ball is released? (assume acceleration due to gravity is -10m/s2) a) 0.50 m b) 5.00 m c) 0.75 m d) 1.00 m
8.
An object is released from rest on a planet that has no atmosphere. The object falls freely for 3.0 meters in the first second. What is the magnitude of the acceleration due to gravity on the planet?
(A) 1.5 m s2 (B) 3.0 m/s2 (C) 6.0 m/s2 (D) 10.0 m/s2 (E) 12.0 m/s2
AP 9.
The graph above represents position x versus time t for an object under uniform acceleration. The average speed during the interval between 1 s and 2 s is most nearly
(A) 2 m/s (B) 4 m/s (C) 5 m/s (D) 6 m/s (E) 8 m/s AP
10.
Which ticker tape dot set(s) could be produced when the tape is pulled to the right with a uniform speed? (you may select more than one)
a) d)
b) e)
c)

3
11.
The graph above shows the velocity versus time for an object moving in a straight line. At what time after time = 0 does the abject again pass through its initial position? a) Between 0 and 1 s b) 1 s c) Between 1 and 2 s d) 2 s e) Between 2 and 3 s
AP
12.
A blinking light of constant period is placed on a lab cart. Which diagram best represents a photograph of the light as the cart moves with constant velocity.
13.
Which object is farthest from the origin at t = 2 seconds. (A) A (B) B (C) they are in the same location at t = 2
seconds (D) They are the same distance from the
origin, but in opposite directions
14. Which graph represents an object moving at a constant speed for the entire time interval?
15.
A baseball pitcher throws a fastball at 42 meters per second. If the batter is 18 meters from the pitcher, approximately how much time does it take for the ball to reach the batter?
a) 1.9 s b) 0.86 s c) 0.43 s d) 2.3 s
16.
A group of bike riders took a 4.0 hour trip. During the first 3.0 hours, they traveled a total of 50. kilometers, but during the last hour they traveled only 10. kilometers. What was the average speed for the entire trip?
a) 60. km/hr b) 30.km/hr c) 30. km/hr d) 15 km/hr
17.
A rock hits the ground at a speed of 10. m/s and leaves a hole 25 cm deep. What is the magnitude of the average deceleration of the rock?
a) 250 m/s2 b) 10. m/s2
c) 2.0 x 10² m/s2 d) 12. m/s2
4
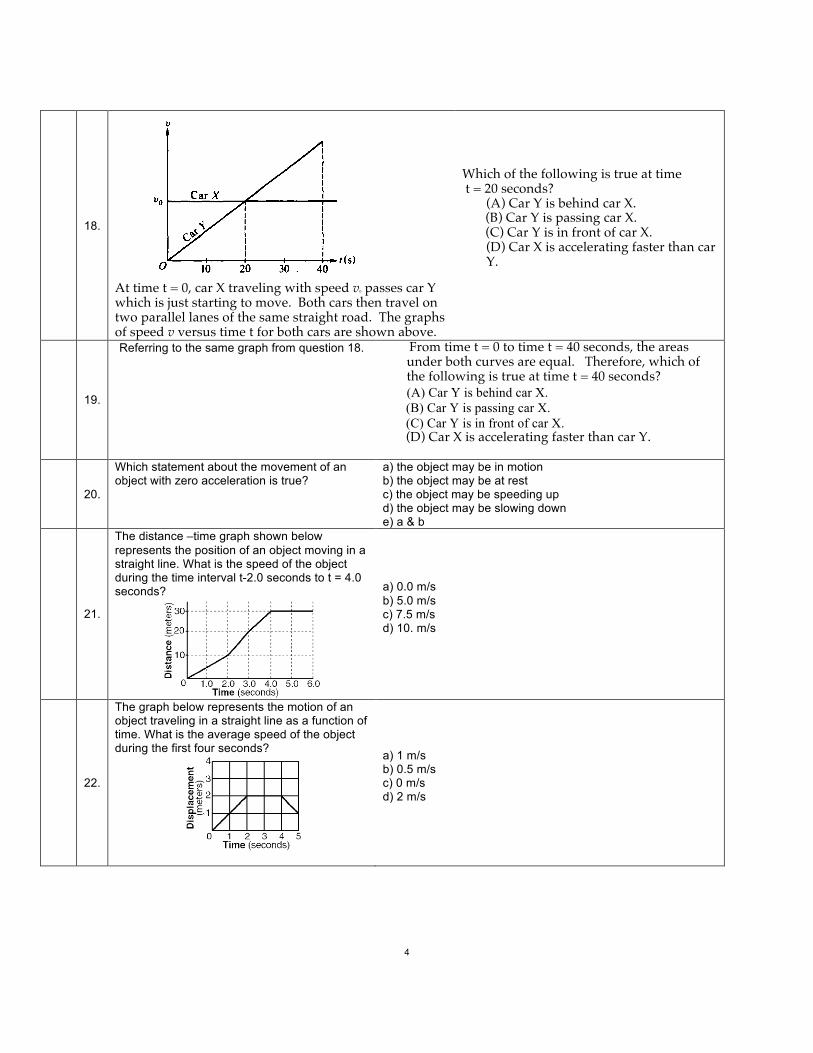
18.
At time t = 0, car X traveling with speed v0 passes car Y which is just starting to move. Both cars then travel on two parallel lanes of the same straight road. The graphs of speed v versus time t for both cars are shown above.
Which of the following is true at time t = 20 seconds? (A) Car Y is behind car X. (B) Car Y is passing car X. (C) Car Y is in front of car X. (D) Car X is accelerating faster than car
Y.
19.
Referring to the same graph from question 18. From time t = 0 to time t = 40 seconds, the areas under both curves are equal. Therefore, which of the following is true at time t = 40 seconds?
(A) Car Y is behind car X. (B) Car Y is passing car X. (C) Car Y is in front of car X. (D) Car X is accelerating faster than car Y.
20.
Which statement about the movement of an object with zero acceleration is true?
a) the object may be in motion b) the object may be at rest c) the object may be speeding up d) the object may be slowing down e) a & b
21.
The distance –time graph shown below represents the position of an object moving in a straight line. What is the speed of the object during the time interval t-2.0 seconds to t = 4.0 seconds?
a) 0.0 m/s b) 5.0 m/s c) 7.5 m/s d) 10. m/s
22.
The graph below represents the motion of an object traveling in a straight line as a function of time. What is the average speed of the object during the first four seconds?
a) 1 m/s b) 0.5 m/s c) 0 m/s d) 2 m/s
5
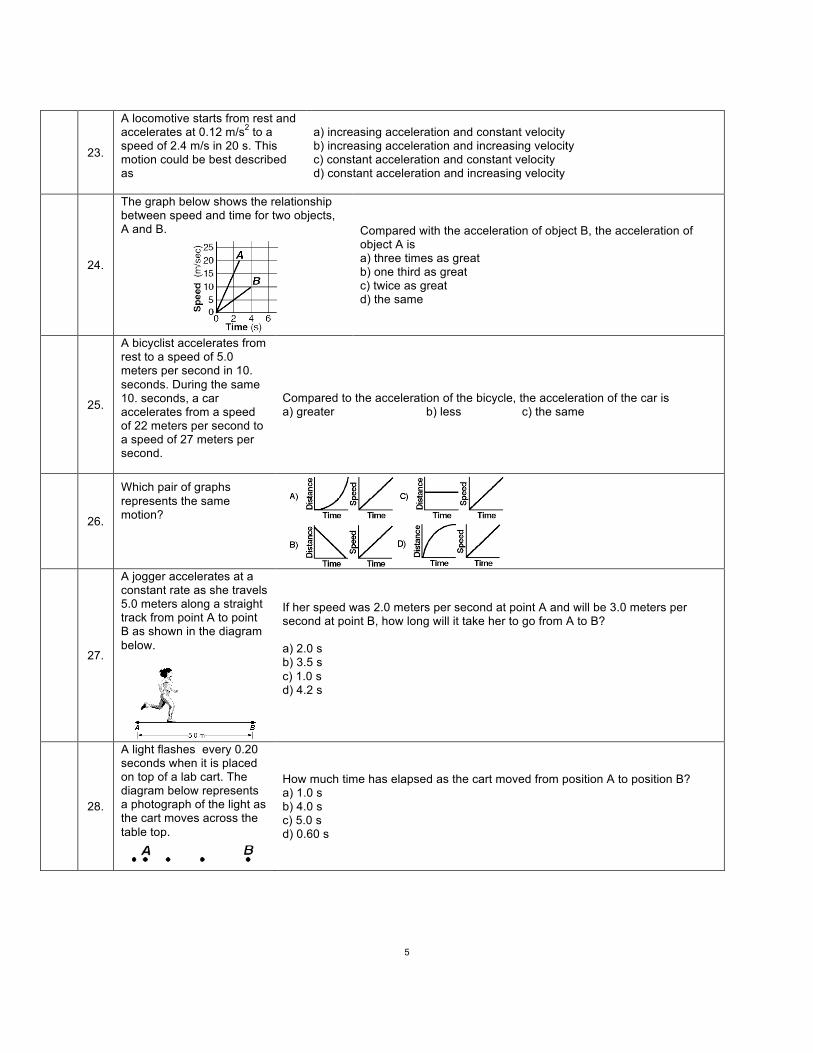
23.
A locomotive starts from rest and accelerates at 0.12 m/s2 to a speed of 2.4 m/s in 20 s. This motion could be best described as
a) increasing acceleration and constant velocity b) increasing acceleration and increasing velocity c) constant acceleration and constant velocity d) constant acceleration and increasing velocity
24.
The graph below shows the relationship between speed and time for two objects, A and B.
Compared with the acceleration of object B, the acceleration of object A is a) three times as great b) one third as great c) twice as great d) the same
25.
A bicyclist accelerates from rest to a speed of 5.0 meters per second in 10. seconds. During the same 10. seconds, a car accelerates from a speed of 22 meters per second to a speed of 27 meters per second.
Compared to the acceleration of the bicycle, the acceleration of the car is a) greater b) less c) the same
26.
Which pair of graphs represents the same motion?
27.
A jogger accelerates at a constant rate as she travels 5.0 meters along a straight track from point A to point B as shown in the diagram below.
If her speed was 2.0 meters per second at point A and will be 3.0 meters per second at point B, how long will it take her to go from A to B? a) 2.0 s b) 3.5 s c) 1.0 s d) 4.2 s
28.
A light flashes every 0.20 seconds when it is placed on top of a lab cart. The diagram below represents a photograph of the light as the cart moves across the table top.
How much time has elapsed as the cart moved from position A to position B? a) 1.0 s b) 4.0 s c) 5.0 s d) 0.60 s

6
29.
The graph above shows velocity v versus time t for an object in linear motion. Which of the following is a possible graph of position x versus time t for this object?
(A) (B)
(C) (D)
30.
The graph above shows the velocity v as a function of time t for an object moving in a straight line. Which of the following graphs shows the corresponding displacement x as a function of time t for the same time interval?
31.
At what time would the car be moving with the greatest velocity?
(A) 2 seconds (B) 4 seconds (C) 6 seconds (D) 8 seconds
32.
Referring to the graph from question 31.
At what time would the car be farthest from its original starting position?
(A) 2 seconds (B) 4 seconds (C) 6 seconds (D) 8 seconds

7
33.
During which time interval would cars #2 and #3 be moving at the same average speed?
(A) t0 to t1 (B) t1 to t2 (C) t2 to t3 (D) t3 to t4
The following questions 35. – 37. refer to the following information. At t0, two cars moving along a highway are side-by-side as they pass a third car stopped on the side of the road. At this moment the driver of the first car steps on the brakes while the driver of the stopped car begins to accelerate. The diagrams below show the positions of each car for the next 5 seconds.
34.
Which of the three cars had the greatest average speed during these 5 seconds?
(A) car #2 and car #3 had the same average speed
(B) car #2 (C) all three cars had the same average speed
(D) car #3
35.
If car #3 continues to constantly accelerate at the same rate what will be its position at the end of 6 seconds?
(A) 24 m (B) 68 m (C) 72 m (D) 78 m

8
36.
37.

9
38.
39.

10
Free Response
I. A helicopter holding a package suspended from a rope 5.0 meters long accelerates upward at a rate of 4 m/s2. Neglect air resistance on the package. When the upward velocity of the helicopter is 20 m/s, the rope is cut. The helicopter continues to accelerate upward at 4 m/s2 after the rope is cut. The package is subject to the force of gravity after the rope is cut.
A. Sketch the appearance of displacement vs. time, velocity vs. time and acceleration vs. time graphs for the helicopter after the rope is cut.
B. Sketch the appearance of displacement vs. time, velocity vs. time and acceleration vs. time graphs for the package after the rope is cut.
C. Follow the steps below to determine the distance between the helicopter and package 2.0 seconds after the rope is cut. i) Which kinematic equation will you use to determine the displacement of the helicopter after 2 seconds? ii) Substitute the values from the problem into the selected equation. iii) Solve and record the correct answer. Box the correct answer. iv) Which kinematic equation will you use to determine the displacement of the package after 2 seconds? v) Substitute the values from the problem into the selected equation. vi) Solve and record the correct answer. Box the correct answer. vii) Determine the distance between the package and the helicopter after 2.0 seconds. Box the answer.

11
II.

12

13
III. A cart moves on a straight horizontal track. The graph of velocity v versus time t for the cart is given below.
a. Indicate every time t for which the cart is at rest. b. Indicate every time interval for which the speed (magnitude of velocity) of the cart is increasing. c. Determine the horizontal position x of the cart at t = 9.0 s if the cart is located at x = 2.0 m at t = 0. d. On the axes below, sketch the acceleration a versus time t graph for the motion of the cart from t = 0 to t = 25 s.