aon risk maturity index · 2018-07-19 · developed by aon plc and the wharton school of the...
TRANSCRIPT

Aon Risk Maturity IndexInsight Report, October 2017
Aon Risk Solutions

Executive Summary . . . . . . . . . . . . . . . . . . . . . . . . . . . . . . . . . . . . .1
Managing Risk in a Volatile Environment . . . . . . . . . . . . . . . . . . . .2
Links to Risk Maturity . . . . . . . . . . . . . . . . . . . . . . . . . . . . . . . . . . .3
Stock Price Volatility . . . . . . . . . . . . . . . . . . . . . . . . . . . . . . . . . . . . . . . . . . 4
Market Valuations . . . . . . . . . . . . . . . . . . . . . . . . . . . . . . . . . . . . . . . . . . . . 5
Risk Management and Organizational Resiliency— Brexit Scenarios . . . . . . . . . . . . . . . . . . . . . . . . . . . . . . . . . . . . . . . .6
Risk Maturity and DIrectors and Officers Insurance Premiums . . .8
Concluding Remarks . . . . . . . . . . . . . . . . . . . . . . . . . . . . . . . . . .15
Authors and Contributors . . . . . . . . . . . . . . . . . . . . . . . . . . . . . .17
Table of Contents

Executive Summary
Developed by Aon plc and the Wharton School of the
University of Pennsylvania, the Aon Risk Maturity Index
(RMI) was developed in 2011 as a tool to assist senior
finance, risk and legal professionals in identifying and
addressing critical areas of concern in their risk management
programs . The “Index” is an innovative platform that
assists organizations in understanding the value of risk
management in strengthening operating performance and/
or reducing volatility by empowering them with insights and
guidance on best practices tools and techniques to enhance
their risk governance and risk management practices .
Over the past six years, analysts from the Aon Risk Maturity
Index team, the Wharton School and the Aon Centre for
Innovation & Analytics have aggregated and analyzed Risk
Maturity Index participant data and publically accessible
financial performance data to develop annual Aon Risk
Maturity Insight Reports which present findings on the
interplay of organizational risk management and the
relative maturity of their enterprise risk management
approaches . Now in its fourth edition, we are pleased to
present the 2017 Aon Risk Maturity Index Insight Report
as a new installment to drive marketplace insights on the
importance of advanced risk management practices with
the proper tools and techniques to empower results .
Respectfully submitted,
Kieran Stack
Chief Commercial Officer
Aon Risk Solutions | Aon Global Risk Consulting
Aon Risk Solutions 1
Managing Risk in a Volatile EnvironmentIn today’s era of volatility, the evolving environment across three major dimensions of economics, demographics and geopolitics, along with the continuing pace of technology change, are converging to create an increasingly new and complex risk landscape for organizations .
As evidenced by various bodies of research
published by Aon, we continue to witness
how the interconnectivity of risks potentially
impact organizations . Never before has it been
so critical for organizations to consider the
interrelationship between building sustainable
competitive advantage and adopting effective
risk management best practices . At Aon we feel
it is incumbent upon organizational executives
and key stakeholders to take proactive steps to
increase their understanding of the risks they
face—both new and emerging—in order to
adapt to the changing environment . Technology
offers tremendous growth opportunities in the
form of operational performance, automation,
new products and services, new and enhanced
distribution channels and business intelligence .
However, new technology brings tremendous
exposure in the form of cyber risk which has
continued to emerge as key concern, as evidenced
by Aon’s 2017 Global Risk Management Survey .
The impact of the interconnected nature of
these risks has been felt by many organizations .
Increasingly Boards of Directors are obligated,
in the case of regulated entities, or challenged
to be acutely aware of and understand the key
risks their organizations face and how these risks
are being managed . The ability of organizations
to understand and manage the increasingly
interconnected nature of risks and develop
effective organizational governance and processes
that encourage improved risk-based decision
making is imperative to their financial and
operational well-being . Insurers providing directors
and officers (D&O) insurance*, a type of liability
insurance covering directors and officers for claims
made against them while serving on a board of
directors, also increasingly consider the maturity
of organizations’ approach to risk management
as part of their underwriting process . In this
report we present new findings that showcase
a correlation between higher risk maturity and
lower D&O insurance premium rates over time .
In this edition of the Aon Risk Maturity Index Insight
Report, we present the latest results of our research
and analysis of the positive effects of enhanced
organizational risk management practices .
In this Insight Report, we endeavor to:
1 . Re-examine the relationship between Risk
Maturity and Financial Performance:
a . Confirm past analysis from the Aon Centre
of Innovation & Analytics (ACIA) and
the Wharton School on the relationship
between a higher Risk Maturity Rating
and superior stock price performance
b . Confirm prior analysis on the inverse
relationship between a higher Risk
Maturity Rating and stock price volatility
c . Expand our analysis to look at how
higher Risk Maturity Ratings can lead
to higher market valuations
d . Examine the ability of organizations to
respond to political risk, through the lens
of Brexit and the uncertainty surrounding
the UK’s preparations to leave the EU,
and demonstrate the relative resilience of
organizations with higher risk maturity
2 . Examine the relationship between risk maturity
and Directors and Officers (D&O) insurance .
* Such policies cover the personal liability of company directors and officers as individuals (Side A cover), but also the reimbursement of the insured company in case it has paid the claim of a third party on behalf of its managers in order to protect them (Side B or Company Reimbursement Cover).
2 Aon Risk Maturity Index
1 1.5 2
Risk Maturity Score
2.5 3 3.5 4 4.5 5
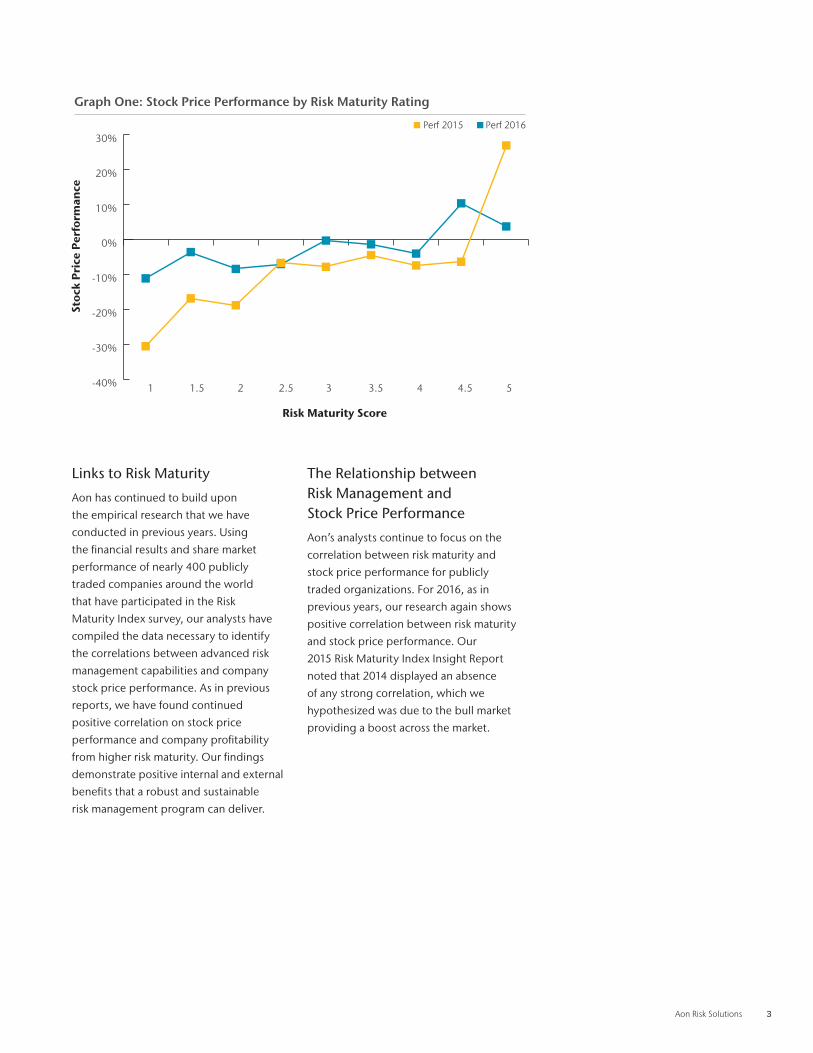
Graph One: Stock Price Performance by Risk Maturity Rating
Perf 2015 Perf 2016
Return on Stock Price: Yearly return as of JuneAll references to Bloomberg as a source relate to market data only. All Risk Maturity data are presented by Aon plc.
-40%
-30%
-20%
-10%
0%
10%
20%
30%
Stoc
k P
rice
Per
form
ance
Links to Risk Maturity
Aon has continued to build upon
the empirical research that we have
conducted in previous years . Using
the financial results and share market
performance of nearly 400 publicly
traded companies around the world
that have participated in the Risk
Maturity Index survey, our analysts have
compiled the data necessary to identify
the correlations between advanced risk
management capabilities and company
stock price performance . As in previous
reports, we have found continued
positive correlation on stock price
performance and company profitability
from higher risk maturity . Our findings
demonstrate positive internal and external
benefits that a robust and sustainable
risk management program can deliver .
The Relationship between Risk Management and Stock Price Performance
Aon’s analysts continue to focus on the
correlation between risk maturity and
stock price performance for publicly
traded organizations . For 2016, as in
previous years, our research again shows
positive correlation between risk maturity
and stock price performance . Our
2015 Risk Maturity Index Insight Report
noted that 2014 displayed an absence
of any strong correlation, which we
hypothesized was due to the bull market
providing a boost across the market .
Aon Risk Solutions 3

Stock Price Volatility
Our analysts noted that 2016 was a year of increased equity market volatility, across all risk
maturity scores . In this environment, the correlation between risk maturity and market
volatility has strengthened, with materially higher volatility for organizations that have less
sophisticated practices for managing risk in their organizations . 2016 saw equity markets
responding strongly to surprise political decisions by electorates around the world .
Graph Two: Share Price Volatility 2016
1 1.5 2
Risk Maturity Score
2.5 3 3.5 4 4.5 5
Stoc
k P
rice
Vol
atili
ty
Vol 2014 Vol 2015 Vol 2016
Volatility: A measure of the risk of price moves for a security calculated from the standard deviation of the day to day logarithmic historical price changes. The 260-day price volatility equals the annualized standard deviation of the relative price change for the 260 most recent trading days closing price, expressed as a percentage.
All references to Bloomberg as a source relate to market data only. All Risk Maturity data are presented by Aon plc.
Vol 2013
0%
10%
20%
30%
40%
50%
60%
4 Aon Risk Maturity Index

1 1.5 2
Risk Maturity Score
2.5 3 3.5 4 4.5 5
P/E
Rat
io
Graph Three: Market Valuation 2016
2016
Return on Equity: Yearly return as of March
All references to Bloomberg as a source relate to market data only. All Risk Maturity data are presented by Aon plc.
0%
5%
10%
15%
20%
25%
30%
35%
Market Valuations for 2016
An additional view we researched for 2016
is the relationship between the price to
earnings multiple applied to our survey
group of public entities . This research helps
us separate out the market perception of an
organization from general market trends and
changes in an organization’s profitability .
Here, our analysts have noted that the
correlation between higher risk maturity
and a higher valuation multiple is clear,
particularly between significantly low risk
maturity organizations and significantly
high risk maturity organizations . This
indicates that investors are able to identify
those organizations that have invested in
strengthening their risk practices, and are
willing to reward those companies with a
higher valuation . This supports our view
that companies with more mature risk
practices should experience higher rates
of growth and future profitability through
their ability to identify and respond to
changes in their external environments .
Aon Risk Solutions 5

Risk Management and Organizational Resiliency—Brexit Scenarios
As in past years, researchers from Aon examined
the relationship between organizations exhibiting
higher levels of risk maturity and organizational
resiliency in response to key market events . For
this report, our researchers subjected the data to a
new series of stress tests based on the Bloomberg
Scenario Function to determine the effect of market
volatility associated with the political and economic
uncertainty surrounding the UK’s preparations to
leave the European Union (Brexit) . Our researchers
analyzed the stock price impact on the sample set
of securities for a new set of scenarios involving a
-3% shock to the FTSE 100, a -10% swing against
the British Pound (GBD) versus the US Dollar (USD)
and -25 basis points shock to the 2 Year UK Gilds .
For all tested market events, our research confirms
findings that indicate a direct relationship between
Risk Maturity and organizational resiliency as
judged by the relative resilience of an organization’s
stock price in the immediate aftermath of the
simulated market event . Graphs Four through
Six present these exciting new scenarios .
In our first scenario, a shock of -3% is applied to the
FTSE 100, which then propagates through to the
rest of the model . This is shown in Graph 4 below .
1 1.5 2
Risk Maturity Score
2.5 3 3.5 4 4.5 5
Stoc
k P
rice
Ch
ang
e (%
)
Graph Four: Financial Market Shock Scenario 1 - FTSE 100 -3% downturn
Source: Bloomberg
-2.3
-2.2
-2.1
-2.0
-1.9
-1.8
-1.7
-1.6
-1.5
6 Aon Risk Maturity Index
1 1.5 2
Risk Maturity Score
2.5 3 3.5 4 4.5 5
Stoc
k P
rice
Ch
ang
e (%
)
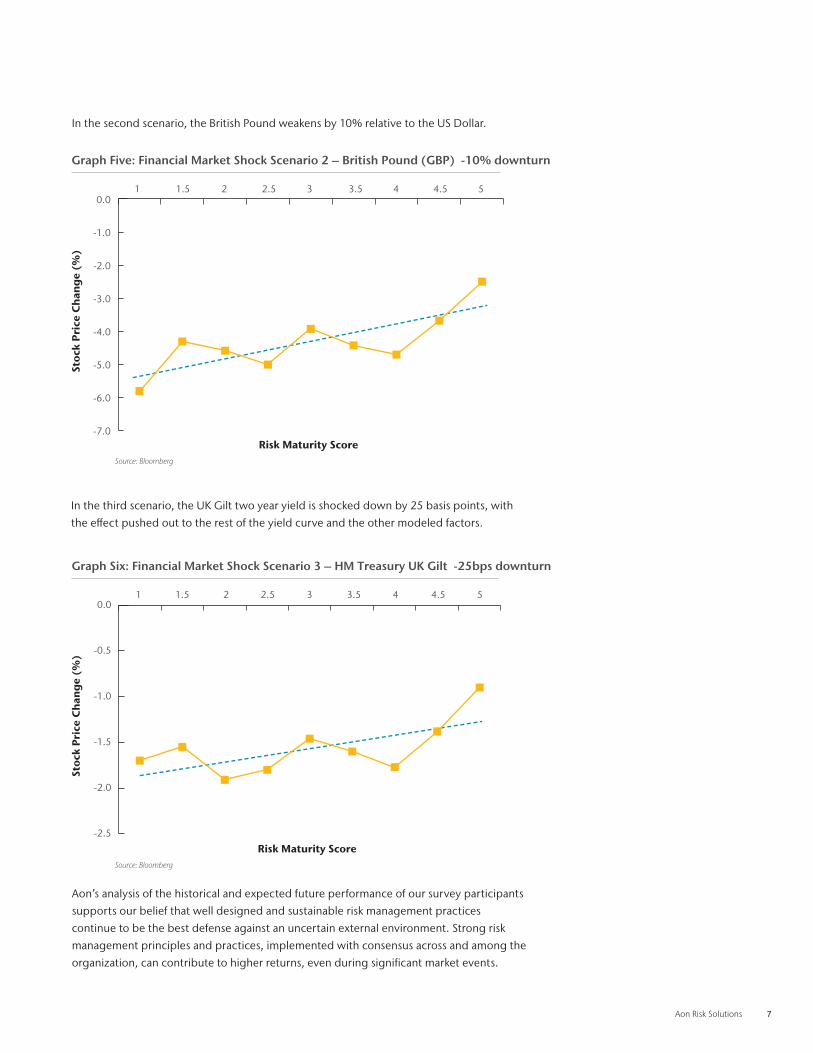
Graph Five: Financial Market Shock Scenario 2 – British Pound (GBP) -10% downturn
Source: Bloomberg
-7.0
-6.0
-5.0
-4.0
-3.0
-2.0
-1.0
0.0
1 1.5 2
Risk Maturity Score
2.5 3 3.5 4 4.5 5
Stoc
k P
rice
Ch
ang
e (%
)
Graph Six: Financial Market Shock Scenario 3 – HM Treasury UK Gilt -25bps downturn
In the second scenario, the British Pound weakens by 10% relative to the US Dollar.
Source: Bloomberg
-2.5
-2.0
-1.5
-1.0
-0.5
0.0
Aon’s analysis of the historical and expected future performance of our survey participants
supports our belief that well designed and sustainable risk management practices
continue to be the best defense against an uncertain external environment . Strong risk
management principles and practices, implemented with consensus across and among the
organization, can contribute to higher returns, even during significant market events .
In the third scenario, the UK Gilt two year yield is shocked down by 25 basis points, with
the effect pushed out to the rest of the yield curve and the other modeled factors .
In the second scenario, the British Pound weakens by 10% relative to the US Dollar .
Aon Risk Solutions 7
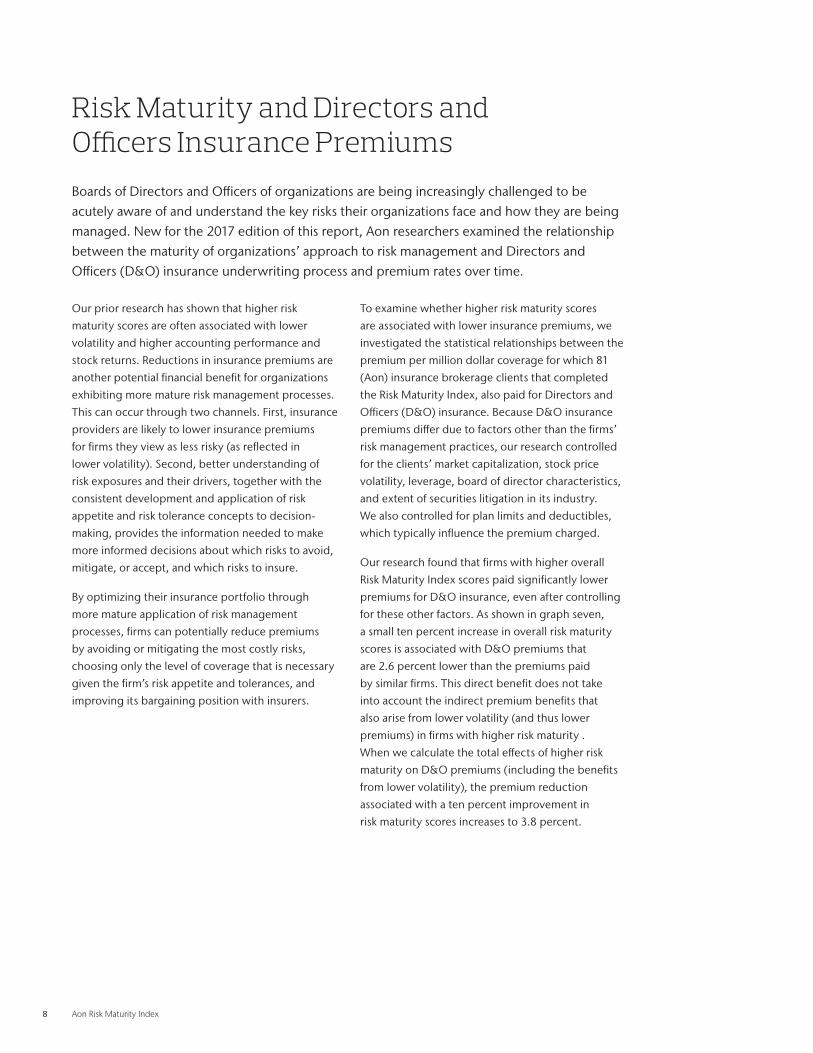
Risk Maturity and Directors and Officers Insurance PremiumsBoards of Directors and Officers of organizations are being increasingly challenged to be acutely aware of and understand the key risks their organizations face and how they are being managed . New for the 2017 edition of this report, Aon researchers examined the relationship between the maturity of organizations’ approach to risk management and Directors and Officers (D&O) insurance underwriting process and premium rates over time .
Our prior research has shown that higher risk
maturity scores are often associated with lower
volatility and higher accounting performance and
stock returns . Reductions in insurance premiums are
another potential financial benefit for organizations
exhibiting more mature risk management processes .
This can occur through two channels . First, insurance
providers are likely to lower insurance premiums
for firms they view as less risky (as reflected in
lower volatility) . Second, better understanding of
risk exposures and their drivers, together with the
consistent development and application of risk
appetite and risk tolerance concepts to decision-
making, provides the information needed to make
more informed decisions about which risks to avoid,
mitigate, or accept, and which risks to insure .
By optimizing their insurance portfolio through
more mature application of risk management
processes, firms can potentially reduce premiums
by avoiding or mitigating the most costly risks,
choosing only the level of coverage that is necessary
given the firm’s risk appetite and tolerances, and
improving its bargaining position with insurers .
To examine whether higher risk maturity scores
are associated with lower insurance premiums, we
investigated the statistical relationships between the
premium per million dollar coverage for which 81
(Aon) insurance brokerage clients that completed
the Risk Maturity Index, also paid for Directors and
Officers (D&O) insurance . Because D&O insurance
premiums differ due to factors other than the firms’
risk management practices, our research controlled
for the clients’ market capitalization, stock price
volatility, leverage, board of director characteristics,
and extent of securities litigation in its industry .
We also controlled for plan limits and deductibles,
which typically influence the premium charged .
Our research found that firms with higher overall
Risk Maturity Index scores paid significantly lower
premiums for D&O insurance, even after controlling
for these other factors . As shown in graph seven,
a small ten percent increase in overall risk maturity
scores is associated with D&O premiums that
are 2 .6 percent lower than the premiums paid
by similar firms . This direct benefit does not take
into account the indirect premium benefits that
also arise from lower volatility (and thus lower
premiums) in firms with higher risk maturity .
When we calculate the total effects of higher risk
maturity on D&O premiums (including the benefits
from lower volatility), the premium reduction
associated with a ten percent improvement in
risk maturity scores increases to 3 .8 percent .
8 Aon Risk Maturity Index

Overall RMI Direct is the estimated influence of a ten percent increase in the firm’s overall RMI scores on D&O insurance premiums after controlling for differ-ences in plan limits and deductibles and firm and industry characteristics, but excluding any insurance premium benefits related to lower volatility. Overall RMI Total is the estimated influence of a ten percent increase in the firm’s overall RMI scores on D&O insur-ance premiums, taking into account the lower volatil-ity observed in firms with higher RMI scores.
Graph Seven: Relationship between Risk Maturity and D&O Insurance
-4.0
-3.5
-3.0
-2.5
-2.0
-1.5
-1.0
-0.5
0.0
Per
cen
tag
e D
ecre
ase
-3.8
-2.6
Overall RMI Direct Overall RMI Total
To better understand the specific risk
management practices that drive these
results, we investigated the associations
between D&O insurance premiums and
each of the ten individual characteristics
(see below) that underpin the Risk
Maturity Index . Higher scores on four
of these characteristics are significantly
related to lower premiums . All four of
these characteristics reflect the extent
to which the firms consistently apply
quantitative methods and the concepts
of risk appetite and risk management
to the analysis of risk exposures . Risk
Communication incorporates the nature
of risk communications, including its
consistency, focus (reactive vs . proactive),
and quantitative-orientation . Risk
Identification captures the identification
of existing and emerging risks through
internal and external data and
information . Risk Information includes
the formal collection and identification of
operational and financial risk information
into decision-making and governance
processes . Risk Analysis assesses the use
of sophisticated methods to understand
risk and demonstrate value added
through risk management . As shown in
Graph Eight, ten percent improvements
in these scores are associated with
premium reductions ranging from
2 .29 to 3 .24 percent, excluding any
benefits from reduced volatility .
Aon Risk Solutions 9

Graph Eight: Distinguishing Risk Maturity Characteristics and D&O Insurance
-3.5
-3.0
-2.5
-2.0
-1.5
-1.0
-0.5
0.0
Per
cen
tag
e D
ecre
ase
Risk Identification
-2.29 Risk Information
-2.64
Risk Analysis-3.24
Risk Communication
-2.63
Insurance Optimization, Casualty/Liability Risk Management and D&O Insurance
The estimated insurance premium
benefits from more mature risk
management processes are even
larger when we examine insurance-
related practices . The Risk Maturity
Index contains two sets of questions
that directly relate to insurance risk
management strategy . One set of
questions relates to insurance portfolio
optimization through the use of robust
analyses of risk exposures and tolerances
for insurable risks that take into account
their impact on financial performance .
A second set of questions covers casualty/
liability risk control and compliance,
including consistent analysis of claims
and incidence data and comparison to
external benchmarks and best practices,
the performance of exposure reviews that
go beyond those required by insurers,
and the development and tracking of
quantitative performance standards
for casualty/liability risk control . Scores
for these practices have significant
and substantial associations with D&O
insurance premiums, with a ten percent
increase in insurance optimization scores
associated with premium reductions of
4 .84 percent and a ten percent increase
in casualty/liability risk management
associated with a 5 .77 percent reduction
(excluding any benefits from volatility
reduction) . See Graph Nine .
10 Aon Risk Maturity Index

Graph Nine: Relationship between Risk Maturity and Casualty/Liability Risk Control and Compliance
-6.0
-5.8
-5.6
-5.4
-5.2
-5.0
-4.8
-4.6
-4.4
-4.2
Per
cen
tag
e D
ecre
ase
Casualty/Liability Risk Management
-5.77
Insurance PortfolioOptimization
-4.84
Aon Risk Solutions 11

The Ten Characteristics of Advanced Risk Maturity The Aon Risk Maturity Index examines specific practices and structures related to ten characteristics of Risk Maturity . These ten characteristics are further broken down into 40 specific components that are scored on a 1 (Basic) to 5 (Advanced) scale similar to the overall Index .
1 Board-level understanding of and commitment to risk management as a critical factor for decision making and for driving value
1 A senior-level executive who drives and facilitates key risk management processes and development
1 Transparency of risk communication
1 A risk culture that encourages full engagement and accountability at all levels of the organization
1 Identification of existing and emerging risks using internal and external data and information
1 Participation of key stakeholders in risk management strategy development and policy setting
1 Formal collection and incorporation of operational and financial risk information into decision making
1 Integration of risk management insights into human capital processes to drive sustainable business performance
1 Use of sophisticated quantification methods to understand risk and demonstrate added value through risk management
1 A move from focusing on risk avoidance and mitigation to leveraging risk and risk management options that extract value
1
2
3
4
5
6
7
8
9
10
12 Aon Risk Maturity Index
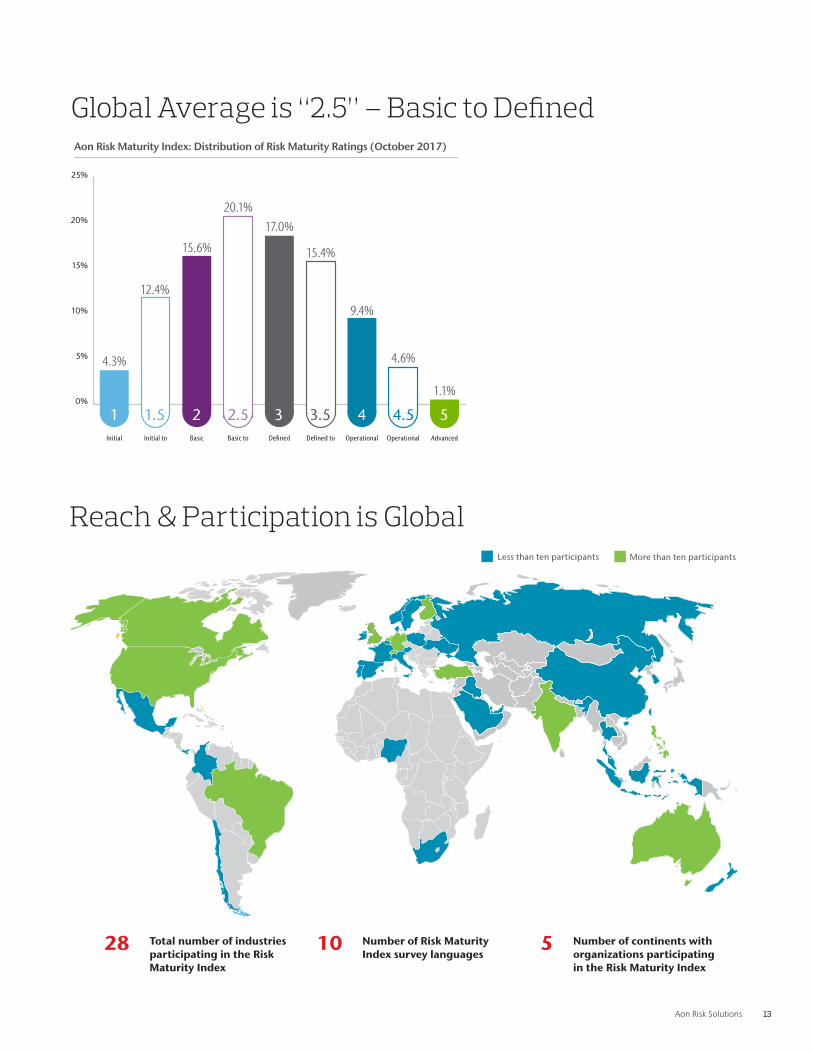
Global Average is “2.5” – Basic to Defined
AdvancedOperationalto Advanced
OperationalDefined toOperational
DefinedBasic toDefined
BasicInitial toBasic
Initial
Aon Risk Maturity Index: Distribution of Risk Maturity Ratings (October 2017)
0%
5%
10%
15%
20%
25%
1 1.5 2 2.5 3 3.5 4 4.5 5
1.1%
4.6%
9.4%
15.4%
17.0%20.1%
15.6%
12.4%
4.3%
Reach & Participation is GlobalMore than ten participants Less than ten participants
28 Total number of industries participating in the Risk Maturity Index
10 Number of Risk Maturity Index survey languages
5 Number of continents with organizations participating in the Risk Maturity Index
Aon Risk Solutions 13

Risk Maturity RatingsThe data captured will support analysis of the relationship between specific business practices and financial performance . Risk Maturity Rating levels are defined in the table below .
Advanced
5
Operational
4
Defined
3
Basic
2
Initial
1
The organization has a well-developed ability to identify, measure, manage and monitor risks; risk management processes are dynamic and adapt to changing risks and business cycles
• Formal statements of risk appetite and tolerance exist and guide decision making
• Risk and risk management information is explicitly considered in decision processes
• Analysis is consistently applied, incorporating qualitative & quantitative techniques
• Risk management is viewed as providing a competitive advantage with a focus on optimizing risk-reward trade-offs
There is a clear understanding of the organization’s key risks and also a consistent execution of activities to address these risks; some functional areas may employ more sophisticated techniques
• The set of loss and tolerance guidelines are predetermined or developing
• Explicit consideration of risk and risk management information is taken in key decisions
• Analysis is consistently applied, incorporating both qualitative and quantitative techniques
The organization understands and is addressing its key risks; capabilities to measure, manage and monitor risks are in place but may be inconsistent across the organization
• Guidelines for loss and risk tolerance are less developed
• Risk and risk management information is considered informally / implicitly in decision making
• Analysis is consistently applied, with a focus on qualitative approaches
There is inconsistent understanding, management and monitoring of key risks across the organization; capabilities to consistently identify, assess, manage and monitor risks are limited
• Risk management activities occur at the functional level rather than the enterprise level
• Risk management activities emphasize compliance
• Risk management information is considered informally or implicitly in decision making, often on ad hoc basis
If the organization identifies and addresses risks it is done within silos only; components and activities of the risk management process are limited in scope and implemented in an ad-hoc manner
14 Aon Risk Maturity Index

Concluding RemarksHow should your organization align itself around risk? What strategies should your organization implement to integrate risk and strategy? The award-winning Aon Risk Maturity Index has evolved into an industry-leading tool that helps organizations answer these questions . Analysis of Risk Maturity Index results continue to provide valuable and practical risk management insights in support of sustainable, stable financial results .
Aon will continue its research with The Wharton School of the University of Pennsylvania to identify key risk management practices and processes that contribute to improved financial performance, as well as a deeper understanding of industry-specific best practices in regards to risk management .
The Aon Risk Maturity Index is a free, confidential and online tool. For more information or to participate, please visit aon.com/rmi or email [email protected].
Aon Risk Solutions 15
54
3.531
2 2.5 4.51.5

16 Aon Risk Maturity Index
Authors and ContributorsChristopher IttnerEY Professor of AccountingThe Wharton School,University of Pennsylvaniaittner@wharton .upenn .edu
Kieran StackChief Commercial Officer USAon Global Risk Consultingkieran .stack@aon .com
Derrick OrackiDirectorAon Global Risk Consultingderrick .oracki@aon .com
Jenna CavanaughSenior Consultant Aon Global Risk Consultingjenna .cavanaugh@aon .com
Rudolph KoenigAGRC Marketing Leader – USAon Global Risk Consultingrudolph .koenig@aon .com
Siobhan RappleSenior Reporting & Analytics ManagerThe Aon Centre for Innovation and Analytics siobhan .rapple@aon .ie
In today’s challenging global environment, business risks
are no longer isolated by industry, geography or country .
Economic slowdown, regulatory changes, cyber risk,
terrorism, increased competition, damage to reputation, and
other critical risks are complex, interrelated and global in
consequence . Aon Global Risk Consulting (AGRC) is the world’s
leading risk consulting organization . With nearly 1,300 risk
professionals in 50 countries worldwide, AGRC consultants
have the expertise and experience to recognize and address
the unique challenges and opportunities that face our clients .
In close partnership with Aon’s broking team, AGRC
provides comprehensive and tailored solutions through
a consistent global approach backed by a panel of
industry experts . Our Risk Control and Claims unit is
comprised of 400 professionals who support clients
globally in the property and casualty risk control arena .
Our Risk Consulting business unit includes leading disciplines
that include actuarial, business continuity management (BCM),
enterprise risk management (ERM), financial / operational risk
and risk management outsourcing . Our Actuarial & Analytics
(A&A) practice consists of more than 100 consultants including
47 actuaries having Property & Casualty credentials .
Aon’s Captive & Insurance Management practice is widely
recognized as the leading captive manager, managing nearly
1,200 captives globally with local capabilities in over 30
countries and offering leading support in risk feasibility studies .
About Aon Global Risk Consulting

About Aon Aon plc (NYSE:AON) is a leading global professional services firm providing a broad range of risk, retirement and health solutions. Our 50,000 colleagues in 120 countries empower results for clients by using proprietary data and analytics to deliver insights that reduce volatility and improve performance.
© Aon plc 2017. All rights reserved.The information contained herein and the statements expressed are of a general nature and are not intended to address the circumstances of any particular individual or entity. Although we endeavor to provide accurate and timely information and use sources we consider reliable, there can be no guarantee that such information is accurate as of the date it is received or that it will continue to be accurate in the future. No one should act on such information without appropriate professional advice after a thorough examination of the particular situation.
www.aon.com
GDM04252